Embed Size (px)
Citation preview
1
Wine Economics Research Centre
Working Paper No. 0111
Wine’s Globalization:
New Opportunities, New Challenges
Kym Anderson and Signe Nelgen
June 2011
University of Adelaide
SA 5005 AUSTRALIA
www.adelaide.edu.au/wine-econ
2
WINE ECONOMICS RESEARCH CENTRE
The Wine Economics Research Centre was established in 2010 by the School of
Economics and the Wine 2030 Research Network of the University of Adelaide, having
been previously a program in the University's Centre for International Economic Studies.
The Centre’s purpose is to promote and foster its growing research strength in the area
of wine economics research, and to complement the University's long-established
strength in viticulture and oenology.
The key objectives for the Wine Economics Research Centre are to:
publish wine economics research outputs and disseminate them to academia,
industry and government
contribute to economics journals, wine industry journals and related publications
promote collaboration and sharing of information, statistics and analyses between
industry, government agencies and research institutions
sponsor wine economics seminars, workshops and conferences and contribute to
other grape and wine events
Contact details:
Wine Economics Research Centre
School of Economics
University of Adelaide
SA 5005 AUSTRALIA
Email: [email protected]
Centre publications can be downloaded at: www.adelaide.edu.au/wine-econ/
ISSN 1837-9397
3
WINE ECONOMICS RESEARCH CENTRE
WORKING PAPER NO. 0111
Wine’s Globalization:
New Opportunities, New Challenges
Kym Anderson and Signe Nelgen
Wine Economics Research Centre
School of Economics
University of Adelaide
Adelaide SA 5005
Phone +61 8 8303 4712
[email protected] www.adelaide.edu/au/wine-econ
June 2011
Paper for the 5th Annual Meeting of the American Association of Wine Economists, Bolzano, Italy, 22-
25 June 2011. Thanks are due to Nicki Chandler, Jagath Dissanayake and Jayanthi Thennakoon for
research assistance and to the Grape and Wine Research and Development Corporation for financial
support through GWRDC Project No. UA 08/04. The views expressed are the authors’ alone.
4
Abstract
The second decade of rapid globalization of the wine industry is assessed using a newly-published
statistical compendium of global wine markets. A dozen observations are made from those data offer
insights into key new opportunities and challenges associated with recent globalization forces. A
snapshot of the value, both nationally and globally, of various quality segments of the world’s wine
markets as of 2009 also is examined. That view of market segments is important for developing a
baseline for models used to assess future prospects for different types of grape and wine producers.
These data also provide guidance for prioritizing future research agendas for theorists and cross-
country econometric analysts seeking to explain past patterns and developments, as well as for
simulation modelers seeking to project where global markets might be headed. The paper finishes by
briefly discussing prospects for further developments in wine’s globalization.
Keywords: wine market developments, alcohol taste changes
JEL codes: C81, F14, F15, Q11, Q13
Author contact:
Kym Anderson
School of Economics
University of Adelaide
Adelaide SA 5005
Phone +61 8 8303 4712
Wine’s Globalization:
New Opportunities, New Challenges
Kym Anderson and Signe Nelgen
I. Introduction
A decade ago, a conference was held in Adelaide, Australia to examine the rapid
globalization of the world’s wine markets over the previous decade.1 One clear indicator of
that phenomenon was the growth in the volume of exports as a percentage of world wine
production, which rose from 15 to 25 percent between 1988-90 and 2001. For the big four
European wine exporters (France, Italy, Portugal and Spain) that ratio rose from 20 to 30
percent, which was impressive by historical standards; but for the New World exporters
(North and South America, South Africa, Australia and New Zealand), the ratio rose from
just 3 percent in the late 1980s to 20 percent by 2001. Meanwhile, their share of world wine
production had risen from one-sixth to one-quarter, while the European wine exporters’ share
had fallen from 61 to 54 percent.
It was thus obvious a decade ago that the dramatic entry onto the international stage
by New World producers presented a serious challenge to producers in Europe, and expanded
choice for wine-importing countries. It was also argued then that the rapid expansion in New
World vineyard plantings in the latter 1990s/early 2000s would cause New World regions
also to face challenges once grapes from those new plantings were added to the stocks of
wine available for sale – especially if there was not a reversal in the previous two decades’
decline (from 28 to 21 billion litres) in global wine consumption.
With a second decade of rapid globalization of the industry now behind us, it is an
appropriate time to re-assess developments as participants move forward. This paper seeks to
do so by drawing on a newly-published statistical compendium of global wine markets. In
Section II a dozen observations are made from those data, illustrated with the help of charts,
1 Summaries, including projections to 2005, were subsequently published in Anderson, Norman and Wittwer
(2003), and more detailed analyses of developments in each of the world’s main wine regions up to that time, by
authors from those regions, are available in Anderson (2004).
2
before providing a summary of key new opportunities and challenges associated with the past
decade’s globalization. In Section III we report the value, both nationally and globally, of the
various quality segments of the world’s wine markets as of 2009. This is possible because of
a newly included set of estimates in the compendium, based on a methodology outlined in the
Appendix. That view of market segments is important as a baseline for assessing future
opportunities and challenges for different types of grape and wine producers. It also provides
guidance for prioritizing future research agendas for theorists and cross-country econometric
analysts seeking to explain past patterns and developments, and for simulation modelers
seeking to project where global markets might be headed. The paper finishes by briefly
discussing prospects for further developments in wine’s globalization and some implications
for policy.
II. Observations on wine’s latest globalization phase
The following observations are drawn from a new statistical compendium of the world’s
major wine markets that was recently published online (Anderson and Nelgen 2011). That
volume is a revised, updated and expanded edition of earlier compendia produced at the
University of Adelaide, and now offers five decades of indicators for more than 50 countries
and country groups spanning the globe. We begin with the most obvious indicator of
globalization, namely export developments.
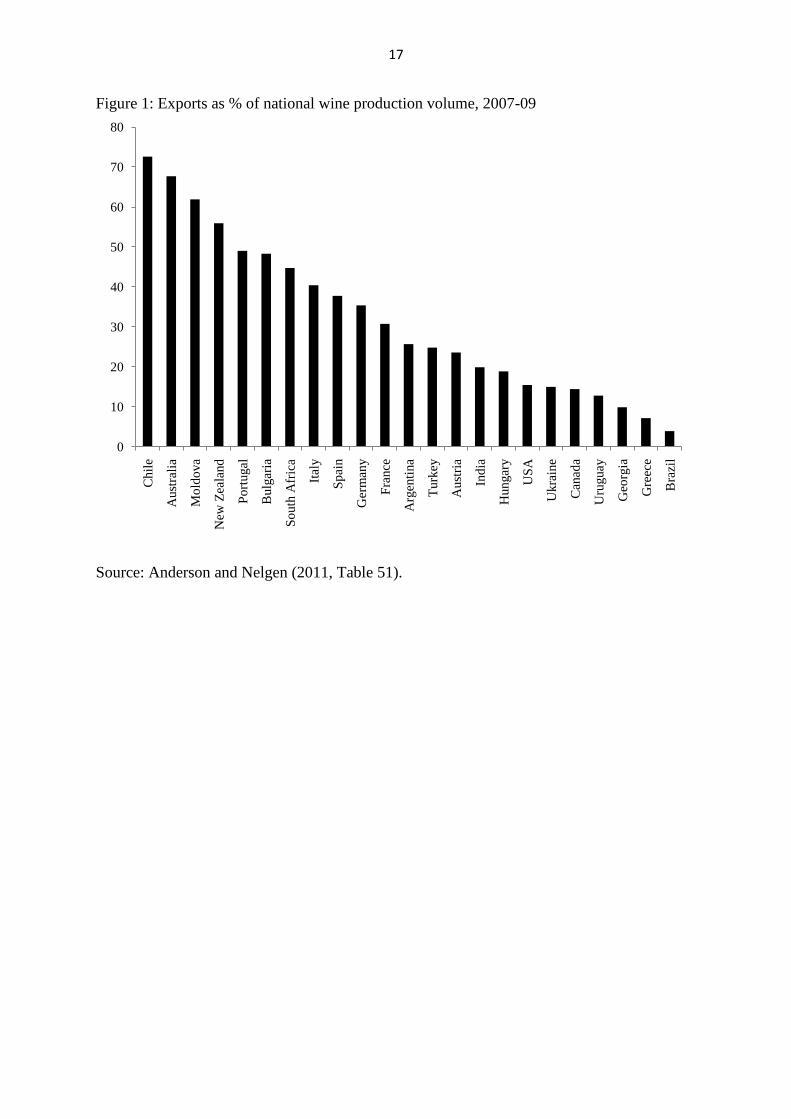
Observation 1. The volume of exports as a percentage of world wine production has
continued to rise, from 25 to 32 percent between 2001 and 2009. For the big four European
wine exporters it rose by one-sixth (from 30 to 35 percent), while for the New World
exporters it doubled (rising from 20 to 40 percent between 2001 and 2007) before falling
back to 37 percent in 2009. For Australia and Chile those shares are now more than two-
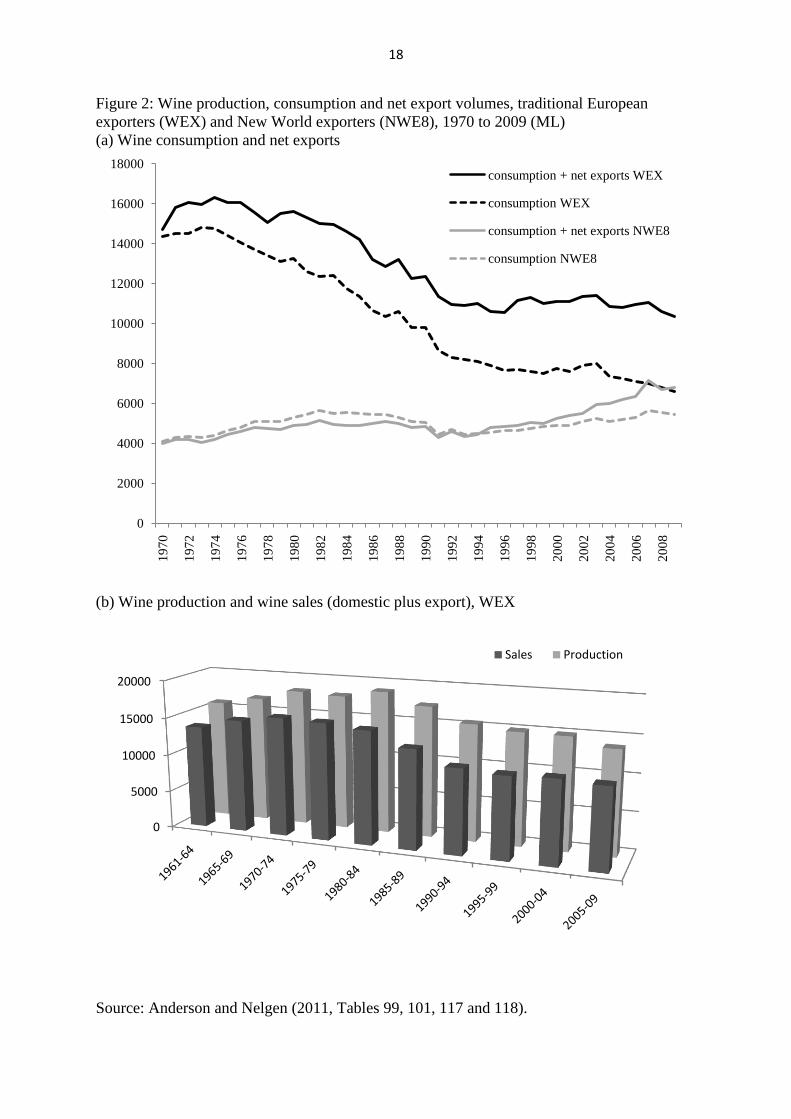
thirds (Figure 1). Thus in both Old and New World wine-exporting countries, marketed
production (proxied as domestic consumption plus net exports) is growing faster or falling
less than domestic consumption (Figure 2(a)). The Old World’s chronic surplus problem has
not diminished, though: its production continues to be about one-third above its sales of
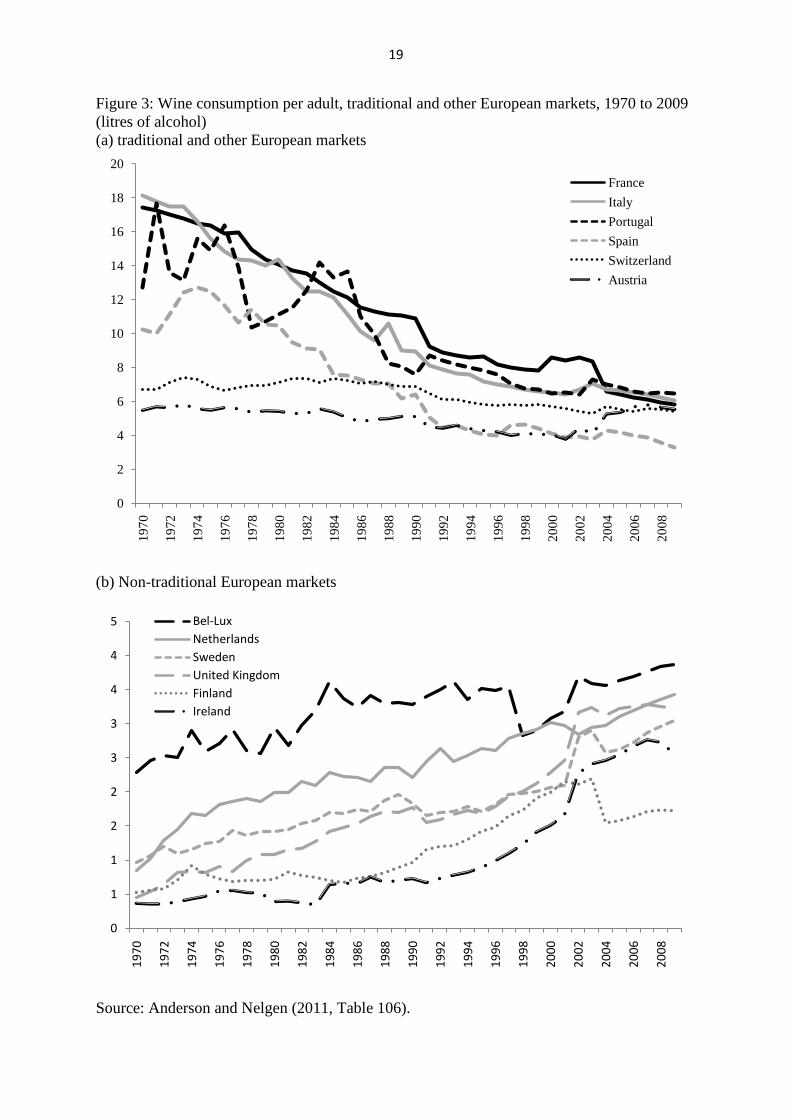
beverage wine (Figure 2(b)). Looking from the viewpoint of importing countries, between
2000 and 2009 the share of wine consumption supplied by imports has risen from 28 to 37
percent globally and from 23 to 34 percent for the European Union. This is partly because,
3
within Europe, the countries where wine consumption is declining (rising) fastest are the
countries that are net exporters (importers) of wine (Figure 3).
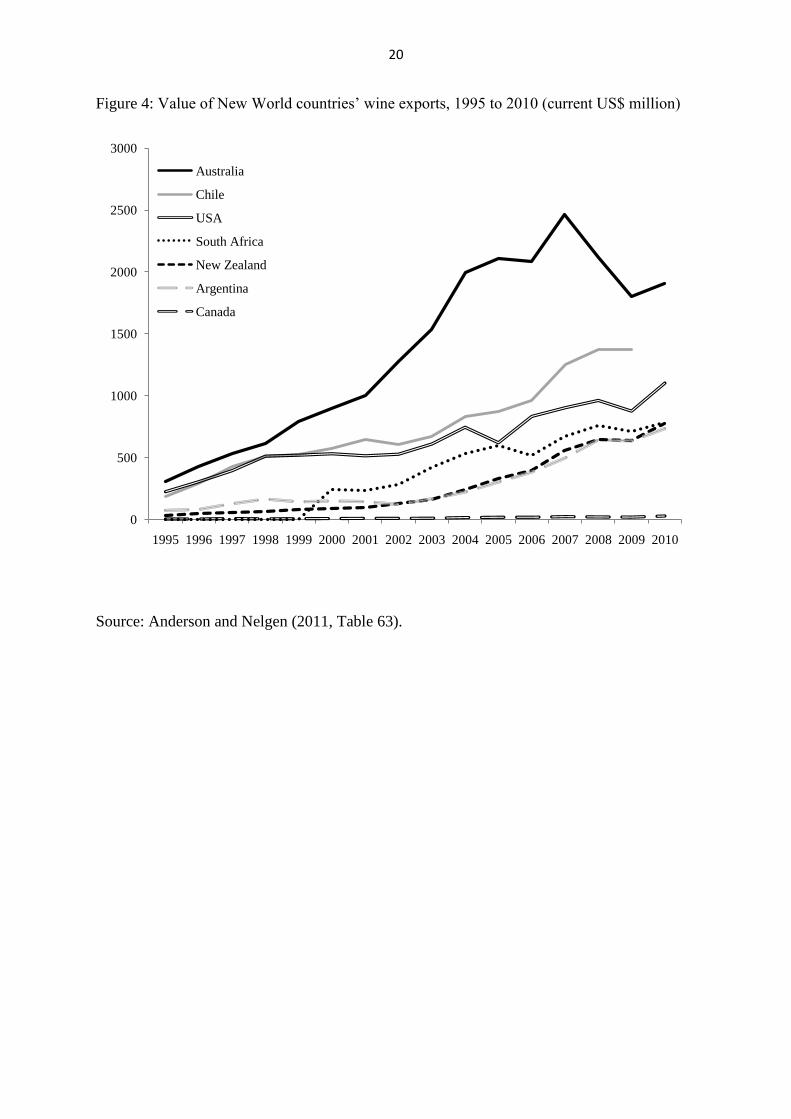
Observation 2. Australia led the export charge for ten or so years from the mid-
1990s, but in more-recent years it has been New Zealand, South Africa and Argentina that
have enjoyed the fastest export growth (Figure 4). That, together with continued high export
growth by Chile and moderate growth by the United States, has ensured the New World
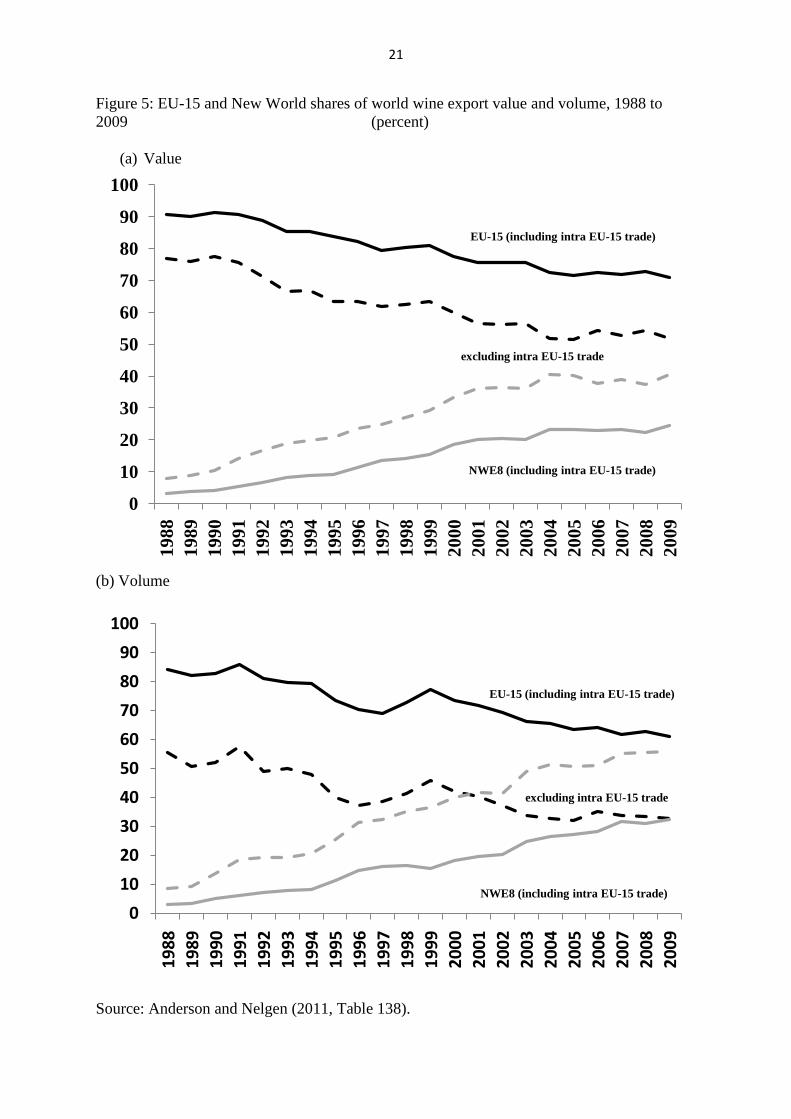
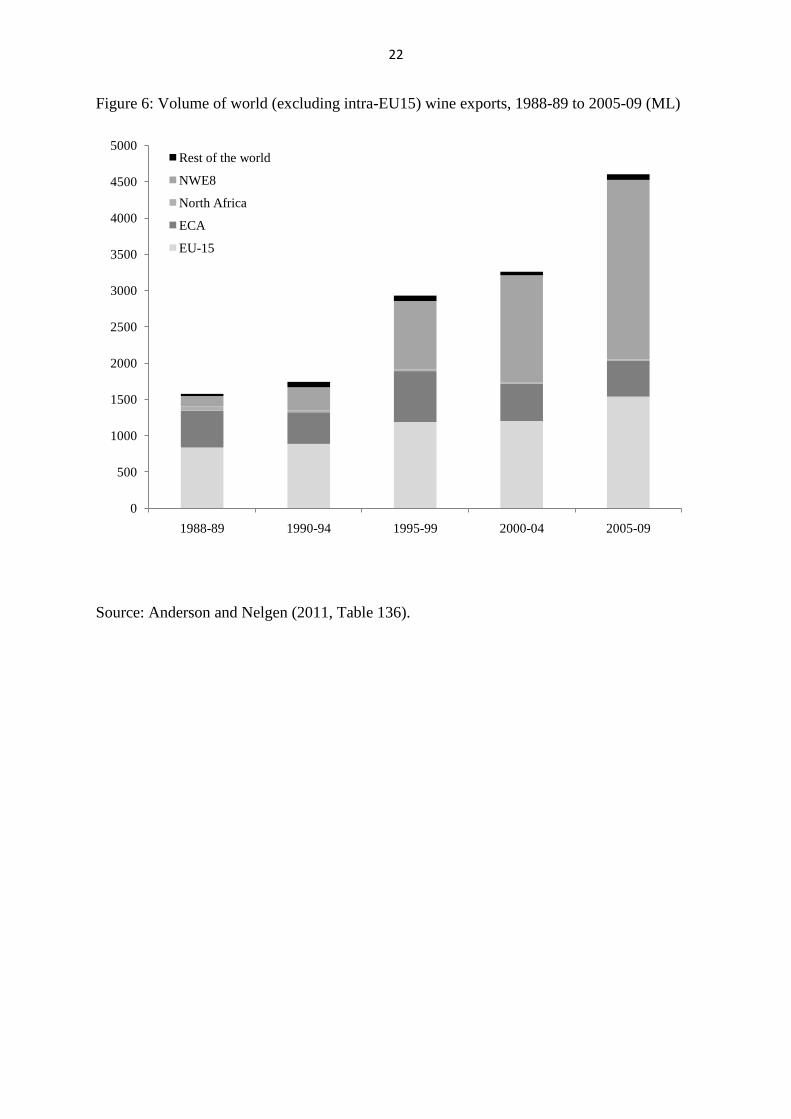
continues to take global market share from the Old World. Indeed, when intra-EU trade is
excluded, the New World exporter group (NWE8, which also includes the United States,
Canada and Uruguay) has almost caught up with the EU-15 in export value terms, and has
surpassed the EU-15 in volume terms (Figures 5 and 6).
These first two observations represent a continuation of trends begun in the 1990s.
But this most-recent decade of rapid globalization of the wine industry has several
characteristics that distinguish it from the 1990s. The next ten observations are among the
more important ones to note.
Observation 3. The rate of export volume growth in the past decade was slower than
in the previous decade. It more than halved for the Old World, dropping from 3.8 percent in
the 1990s to 1.8 percent in 2000-09 period, whereas the New World’s export volume growth
dropped by only two-fifths, from 18 to 11 percent. However, the US$ unit value of wine
exports in the past decade hardly changed for the New World, whereas it grew by 7 percent
per year for the four big European exporters, which meant the value of the latter’s exports
grew almost as fast as for the New World (Anderson and Nelgen 2011, Tables 127 and 132).
Observation 4. Wine exports peaked for Australia in 2007, and growth is expected to
slow in New Zealand too as marketers in both countries struggle to dispose of burgeoning
stocks in the wake of their appreciating currencies and the North Atlantic recession. Local
prices of grapes and especially of vineyard and winery assets have plummeted even more
than unit values of their exports, which fell between 2007 and 2009 alone by one-quarter in
nominal US dollar terms. Australia’s appreciating currency (thanks to its boom in mining
exports to China) also encouraged import growth. That meant its wine self-sufficiency fell
from its peak of 337 percent in 2004 to 236 percent by 2009. By contrast, New Zealand’s
boom, which began several years later than Australia’s, showed no sign of slowing by 2009:
its wine self-sufficiency rose from around 80 percent early in the decade to 240 percent by
2009, and its revealed wine comparative advantage index more than trebled and now exceeds
Australia’s. The comparative advantage index for Chile is similar to New Zealand’s, and both
4
now exceed those for France and Portugal and are now ranked equal third in the world after
Moldova and Georgia (Figure 7).
Observation 5. The sleeping giant of the Southern Hemisphere was abruptly
awakened when Argentina abandoned its peg to the US dollar and devalued by two-thirds at
the end of 2001. The share of Argentina’s production that is exported rose from 4 percent in
2001 to 29 percent by 2008. Initially the quality of those exports was low, but it has been
rising rapidly: the unit value of exports almost trebled between 2003 and 2010, from US$0.88
to $2.67 per litre, and the share of bulk shipments in total wine exports halved, falling from
52 to 26 percent. By contrast, the shares of Australian, New Zealand and United States wine
exports shipped in bulk has roughly quadrupled between 1999 and 2010. New World
exporters as a whole now ship a slightly larger share in bulk than does the EU-15, in contrast
to the turn of the century when the New World’s share was half the Old World’s (Figure 8).
That partly reflects decisions by large firms to bottle cheaper wines at their destination rather
than in a distant country of origin; but it is also a symptom of a rising over-supply situation in
Australia and New Zealand, as are the declines in their unit value of bottled still wine exports
since 2007-08.
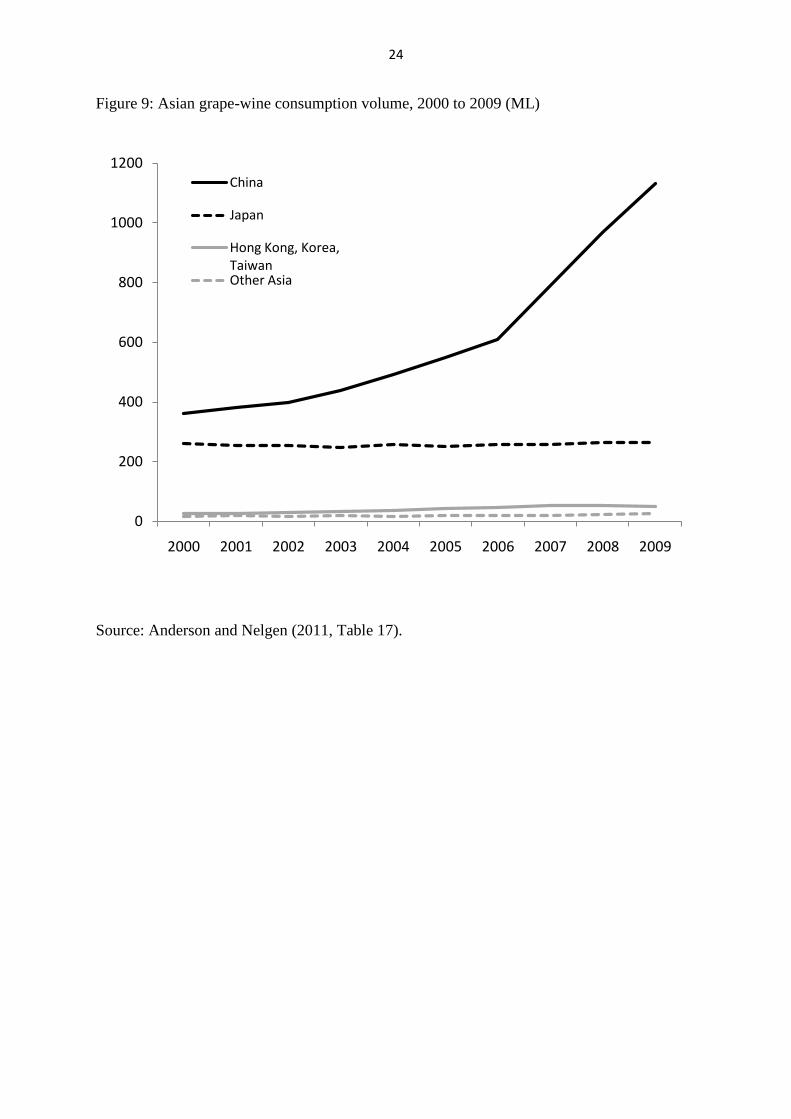
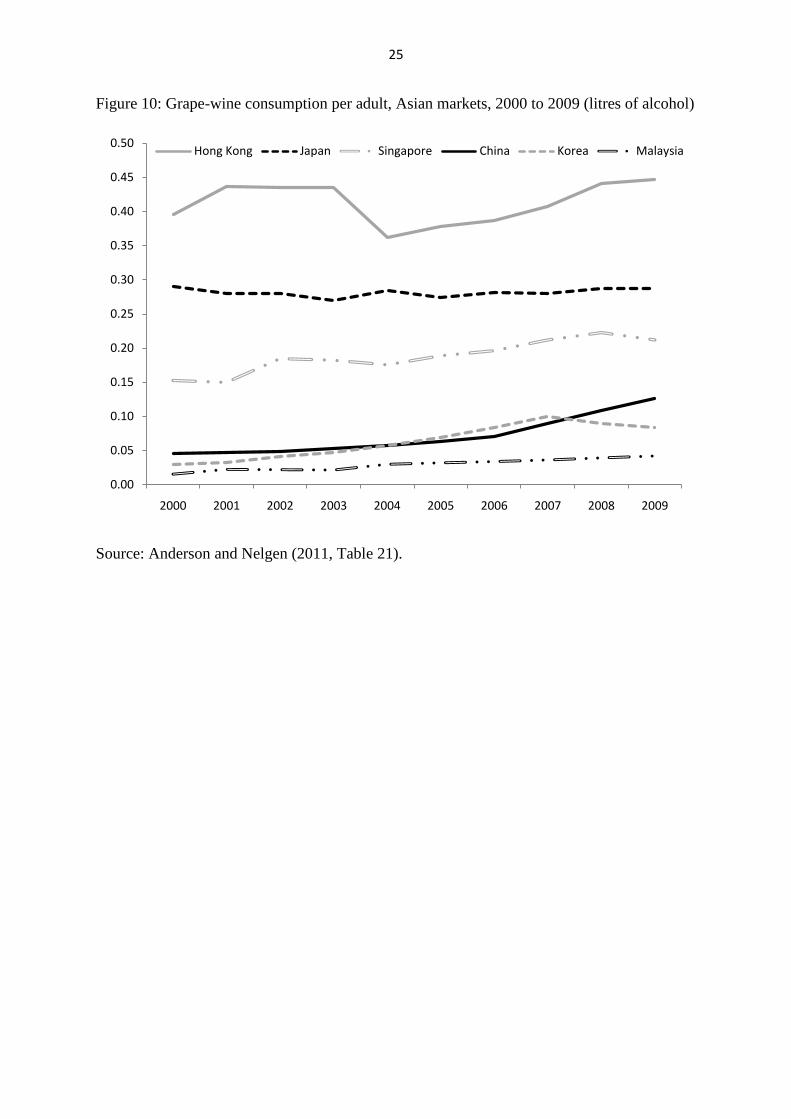
Observation 6. This past decade has seen the wine market grow rapidly in the region
where it had its smallest presence, namely Asia. While wine’s share of recorded alcohol
consumption has not changed much from 18 percent globally, its share in Asia has doubled
over the past decade, albeit to just 3 percent. The growth has been concentrated mostly in
China, where it trebled to 3.7 percent. That resulted in China’s aggregate consumption almost
quadrupling over the decade, so that it now dwarfs consumption in the rest of Asia including
Japan (Figure 9) and, by 2009, almost equalled United Kingdom consumption. On a per adult
basis, wine consumption volume growth has been equally impressive in the much less
populous but more affluent economies of Hong Kong, Korea, Malaysia and Singapore, while
it has been lacklustre in Japan (Figure 10).
Observation 7. Even more striking is the rapid emergence of Asian countries as
importers of super-premium wines. By 2009, seven of the 15 top-ranked countries in terms of
unit value of wine imports were Asian. The growth in their average price of imports has
varied though, being highest for China, Hong Kong and Japan. Particularly notable is the
rapid decline in the share of China’s wine imports that are bulk, from close to 90 percent in
the first half of the decade to less than half that by 2009. As a result, Asian still wine imports
are now very much higher priced than those of traditional importers (Figure 11).
5
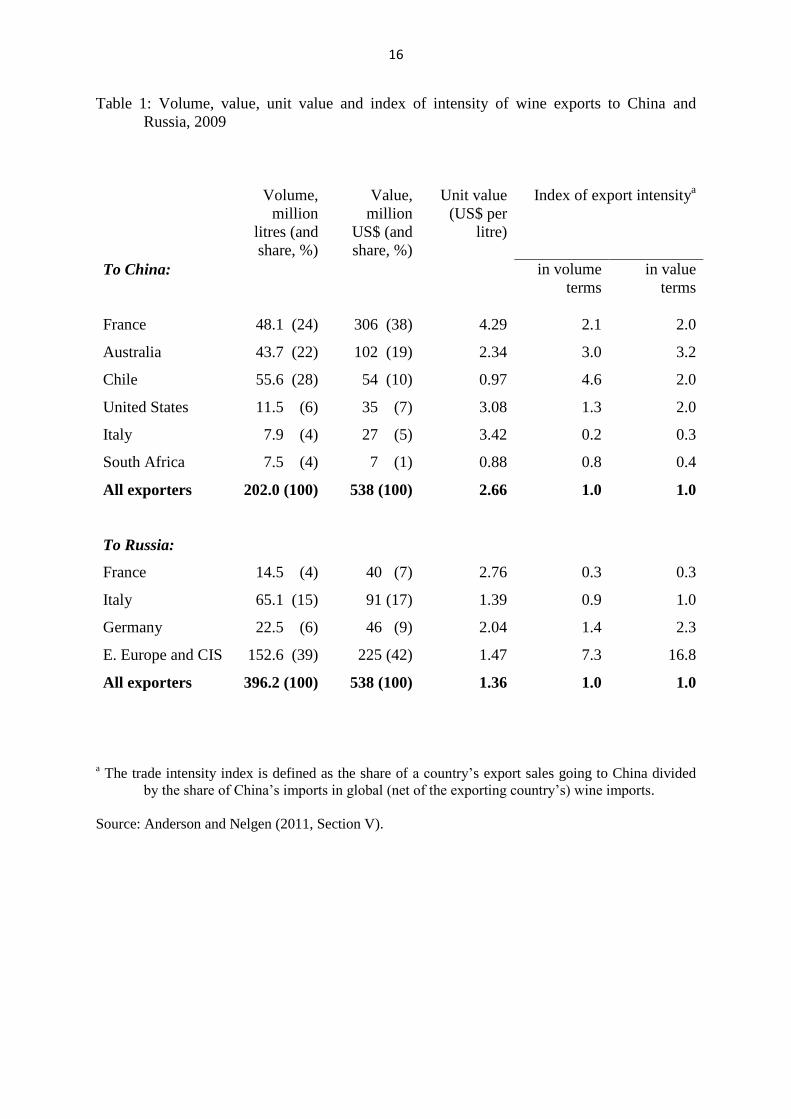
Observation 8. China (and to a far smaller extent India)2 is not only expanding wine
consumption but is also planting more vines and expanding domestic wine production (in part
with the help of imported juice and bulk wine as inputs). Certainly China’s wine self-
sufficiency has fallen, but not hugely, from around 93 percent a decade ago to 85 percent by
2009. Whether the one percentage point difference over the past decade in the annual rates of
growth of China’s wine consumption and production will increase is a moot point, but many
exporting countries are focusing their marketing efforts increasingly on China in the apparent
hope that it will. One sign that has encouraged them is the growth in the quality of China’s
wine imports: their unit value doubled in the second half of the past decade (Figure 11).
Another encouraging sign is the rapid rise in China’s share of global income, which is
expected by many international agencies to more than double over the next two decades. As
of 2009, France held the dominant position as a wine exporter to China (and India), followed
by Australia and Chile. That is especially so in value terms, since the unit value of France’s
exports to China that year was US$4.29 compared with Australia’s $2.34 and Chile’s $0.97.
In value terms Australia has the highest trade intensity index though, defined as the share of
its export sales that are going to China divided by the share of China’s imports in global (net
of the exporting country’s) wine imports (Table 1).
Observation 9. China is not the only former planned economy to see a surge in
interest in wine. Over the past decade the share of wine in Ukraine’s recorded alcohol
consumption has, like Asia’s, doubled, and Russia’s has gone up by a half such that in both
countries wine accounted for one-tenth of their recorded alcohol consumption by 2009.
Domestic wine production also has grown there, but even so net imports accounted for 33
percent of Russian consumption in 2009 compared with only 15 percent in 2000. Meanwhile,
production in the rest of Eastern Europe and the former Soviet Union has declined, so Russia
is buying more from other regions. The unit value of its imports is rising only one-third as
rapidly as that for China though, so France is showing much less interest in the Russian
market. As a result, the value of world wine exports to China was equal to those shipped to
Russia in 2009, having been only one-tenth of Russia’s in 2001 – even if the volume of wine
going to China is only half that going to Russia (Table 1).
Observation 10. Alcohol consumption patterns of traditional wine-exporting
countries and those of neighbouring countries within Europe are converging (Figure 3). The
2 India’s wine production and consumption grew at a faster rate than China’s during the past decade, but its wine
market is still barely 1 percent of China’s (which is why it does not appear in Figure 10). India’s imports have
been growing at more than 25 percent a year over the past decade, but from a low volume and remain hampered
by a 150 percent import duty.
6
former was only 45 percent above the latter in 2009, compared with 220 percent above in
2000. The growth in wine demand in non-traditional wine-consuming countries of Europe
and Asia has contributed to a halting of the rapid decline in wine’s share of recorded alcohol
consumption globally, which had more than halved between the 1960s and 1990s (Figure 12).
Observation 11. Some aspects of the differences between the Old World and the New
World persist. One is the extent of firm concentration. Wine is the least concentrated of the
beverage and tobacco industries, according to Rabobank: the world market share of the three
largest firms in the late 1990s was just 6 percent in the wine industry compared with 35
percent for beer, 42 percent for spirits, and 78 percent for soft drinks (Chart 26 in Anderson
and Norman 2003). Certainly mergers and acquisitions within the global wine industry are
happening continually, and between 2003 and 2009 the shares of global sales held by the
four, and 30, largest firms both rose by almost one-third. Even so, in 2009 the three largest
wine firms held only 7 percent of global sales, and the next five need to be added before the
share rises to one-eighth. That firm concentration is predominantly in the New World, where
the majority of sales are by the four biggest firms. By contrast, in the Old World barely one-
eighth of sales are from the four largest firms.3 Even in this respect, though, there are signs of
change, as more large firms emerge in Europe. Moreover, the large publicly listed firms that
dominate the New World are coming under shareholder pressure to be sold as profitability
falls following rapid expansions there.4
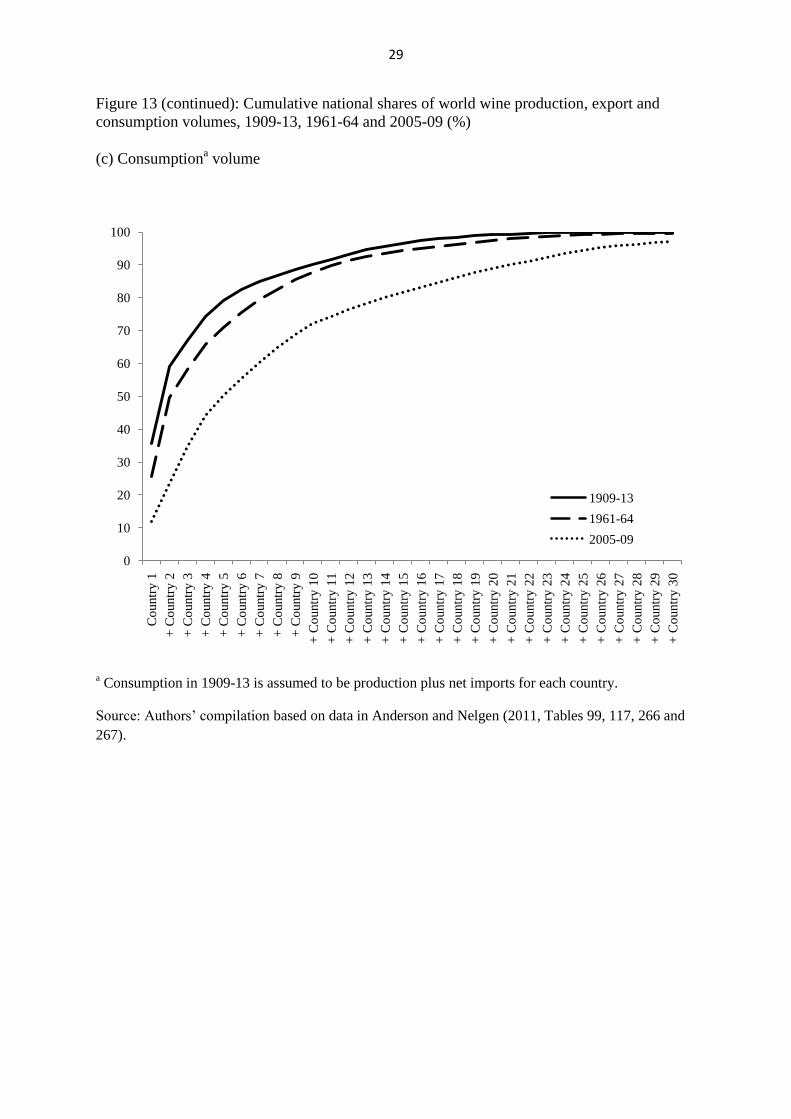
Observation 12. The extent of globalization of the world’s wine markets can be
summarized with two other sets of indicators. One is provided by graphing the national
shares of world production, export and consumption volumes cumulatively. The less-steep
the rise in such a graph and the larger the number of countries required to get near to 100
percent, the more globalized the industry’s production could be considered. Figure 13
indicates the changing situation from 100 years ago (just prior to World War I, after a half-
century of dramatic globalization) to the early 1960s and then to the most recent five years
3 This difference in firm concentration between the Old World and the New World was evident as early as the
19th
century, for a complex set of environmental, technological and institutional reasons (Simpson 2011). 4 Fosters, Australia’s largest beverage company, spun off its wine business in May 2011 under a new name,
Treasury Wine Estates. Fosters had made a series of acquisitions during the first half of the past decade,
including paying US$1.1 billion for Beringer, a Californian label, in 2000 and culminating in the purchase of
Southcorp (owner of Penfolds, Lindemans and Rosemount) in 2005 for A$3.2 billion. Having cost around A$7
billion to put together, a private-equity firm reportedly offered to pay between A$2.3 and 2.7 billion for it in
September 2010. Its valuation on 10 May 2011, the first day of listing as Treasury Wine Estates, was just
A$2.15 billion. In December 2010, Champ, a Sydney-based private-equity firm, took an 80 percent stake in the
Australian and British wine business of New York-based Constellation Brands (which Constellation had paid
around A$1.9 billion for in 2003), in a transaction valued at just A$290 million.
7
for which global data are available. According to that Figure, the industry is certainly more
globalized now than it was at the end of the previous major wave of globalization. The other
indicator is provided by graphing national wine production per adult against national wine
consumption per adult. Figure 14 reveals that this strong relationship has weakened since the
1960s, and that the mean and standard deviation of both variables have shrunk greatly. The
outliers in the right-hand edge of that figure for 1961-64 (starting from the right) are Portugal,
France, Italy, Argentina, Spain and Chile – all of whose production per adult had shrunk
hugely by 2005-09.
Summary of new challenges. In addition to the on-going chronic surplus of wine
produced in the Old World (which has been disposed of mainly though subsidized distillation
into brandy), there are now signs of surpluses in parts of the New World. This is most notable
in Australia, where an appreciating currency and higher pricing of irrigation water have
combined with reduced export demand (recession plus an adverse preference change in
Europe and the United States) to make it difficult for producers to find markets for the
burgeoning supplies that followed Australia’s dramatic expansion of vineyards. Those
surpluses depress prices of all but the highest-quality grapes and wines. That is adding to the
pressure felt by growers and wineries from increasingly dominant supermarkets, which are
squeezing producer profit margins not only on branded wines but also on bulk wines
purchased for own-store labels. Insofar as the supermarket revolution is encouraging
consolidation of large wineries to enable them to better negotiate with retailers, it is
simultaneously strengthening those wineries’ bargaining power over grape growers.
Summary of new opportunities. This past decade has seen a slight reversal in the
long-term decline in wine’s share of global alcohol consumption, and in the more-recent
decline in the world’s total volume of wine consumed. Thanks to the ongoing growth in
demand in non-traditional European wine markets and to the very rapid growth – albeit from
a low base – of grape wine consumption in emerging Asian economies, exporters have a
widening range of countries to look to for market growth. The latter growth has been in
super-premium and iconic red wines initially, which has been a boon to Bordeaux producers,
and in China’s case has involved a rapid decline in the share of China’s wine imports that is
bulk non-premium wine used for blending with domestically produced wine. This change in
China’s imports, like the earlier rapid growth in non-traditional European demand for
commercial-premium bottled wines sold in supermarkets, is a reminder of the diversity of
wine qualities. It suggests the need to disaggregate the data presented above into various
quality segments, to which we now turn.
8
III. How valuable are the various quality segments of the world’s wine markets?
To go beyond the above compilation and estimate a comprehensive dataset that summarizes
global shares by value categories is a non-trivial exercise. However, it is possible if one is
prepared to make several assumptions and pool data from various sources. Anderson and
Nelgen (2011) do so by distinguishing four categories of wines: non-premium, commercial-
premium and super-premium still wines, plus sparkling wines. This is more helpful than
dividing the market into just ‘commodity’ and ‘fine’ wines, given the wide spectrum of
qualities in the marketplace. We have done so with the most-recent data available on a
comparable basis across all key countries, which is 2009. In that year, global wine sales
totalled the equivalent of 30 billion 750ml bottles, and had a wholesale pre-tax production
value of US$98 billion, representing an average price of $3.27 per bottle wholesale pre-tax or
US$5.50 retail including taxes.
We define commercial premium still wines in 2009 to be between US$2.50 and
US$7.50 per litre pre-tax at the national border.5 Still wines below US$2.50 per litre pre-tax
are considered non-premium, as are bulk wines traded internationally, and those above
US$7.50 are classified as super-premium. This classification is used to get shares of the
volume of domestic consumption of the three still wine categories, compressed from
Euromonitor data on volume of sales by retail price range. The price ranges are reduced to
pre-tax wholesale prices by taking account of excise taxes, GST/VAT and import taxes and
assuming the marketing/distribution margins of 25 percent for non-premium wines and 33
percent for other wines. From this base, the volume, value and hence unit value of the other
variables (production, exports and imports) are also calculated for each of the four wine
types, using the methodology described in the Appendix.
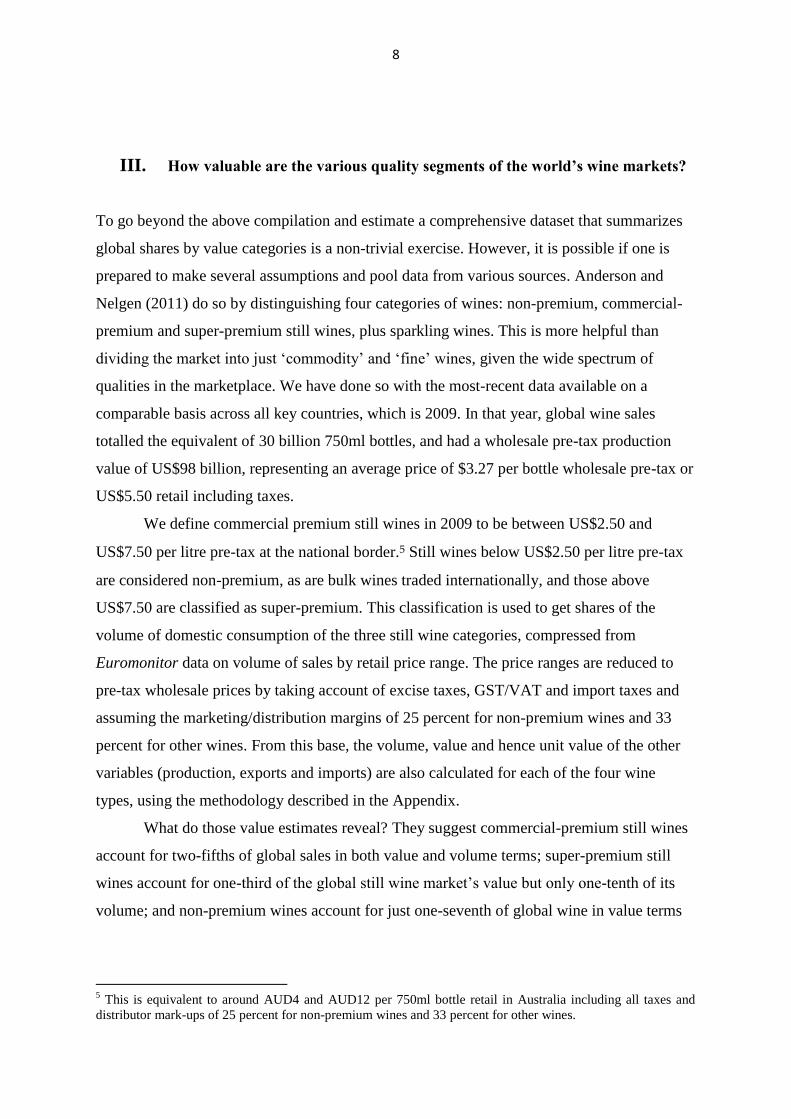
What do those value estimates reveal? They suggest commercial-premium still wines
account for two-fifths of global sales in both value and volume terms; super-premium still
wines account for one-third of the global still wine market’s value but only one-tenth of its
volume; and non-premium wines account for just one-seventh of global wine in value terms
5 This is equivalent to around AUD4 and AUD12 per 750ml bottle retail in Australia including all taxes and
distributor mark-ups of 25 percent for non-premium wines and 33 percent for other wines.
9
but almost half in volume terms. Sparkling wines make up the rest, accounting for 13 percent
by value and half that share by volume (Anderson and Nelgen 2011, Tables 167 and 168).
The more-familiar data are for exports, and all the main players are included in Figure
15(a). Countries are ranked according to their shares of the global value of total (including
sparkling) wines. Looking at the second bar for each country, France is the clear outsider
with a little over 50 percent of the world’s super-premium still wine exports, nearly three
times that of second-ranked Italy at 18 percent. Perhaps more surprising is that New Zealand
is ranked 3rd
in this category with 7 percent, ahead of Australia and Spain (each 3 percent of
world exports of super-premium still wines). South Africa and Argentina trail behind Chile
and the United States – although Argentina’s share has risen somewhat since 2009.
It is Italy that has the number one rank in terms of value of exports of commercial-
premium wines, ahead of France, while Spain is first ranked in non-premium wine exports,
well ahead of Italy and then France. Together these three account for 50 percent of
commercial-premium and non-premium global still wine export value, and 70 percent of
super-premium still wine. The next-ranked commercial premium exporters are Australia,
Chile, the United States and South Africa, and the same ordering applies to non-premium
exports.
Those export shares are not all that closely related to value of global production
shares, because of the large differences across countries in the extent to which national
production is exported and consumption is imported. Most notable is the jump to 1st place for
the United States followed by France and then Italy in the value of super-premium still wine
production. The super-premium shares of Australia, Spain and New Zealand are similar but
well behind Italy’s (Figure 15(b)).
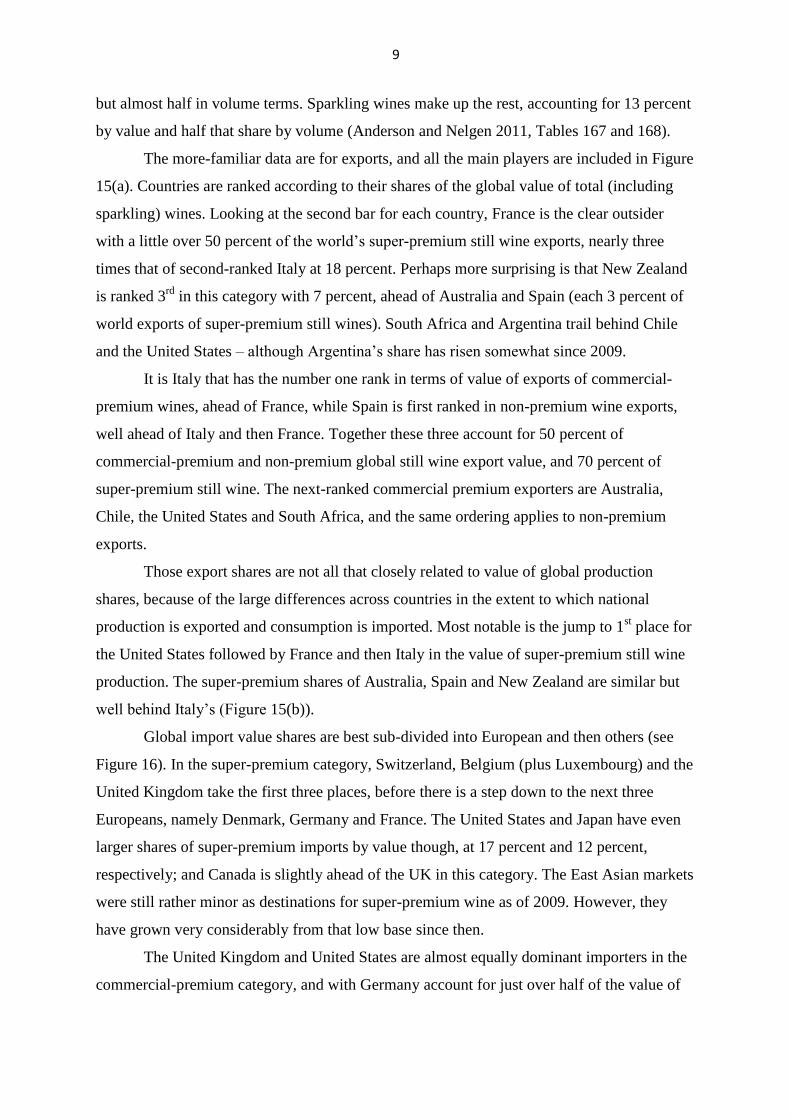
Global import value shares are best sub-divided into European and then others (see
Figure 16). In the super-premium category, Switzerland, Belgium (plus Luxembourg) and the
United Kingdom take the first three places, before there is a step down to the next three
Europeans, namely Denmark, Germany and France. The United States and Japan have even
larger shares of super-premium imports by value though, at 17 percent and 12 percent,
respectively; and Canada is slightly ahead of the UK in this category. The East Asian markets
were still rather minor as destinations for super-premium wine as of 2009. However, they
have grown very considerably from that low base since then.
The United Kingdom and United States are almost equally dominant importers in the
commercial-premium category, and with Germany account for just over half of the value of
10
those global imports. As for non-premium, China is the only significant East Asian importer:
by 2009 it was ranked 11th
.
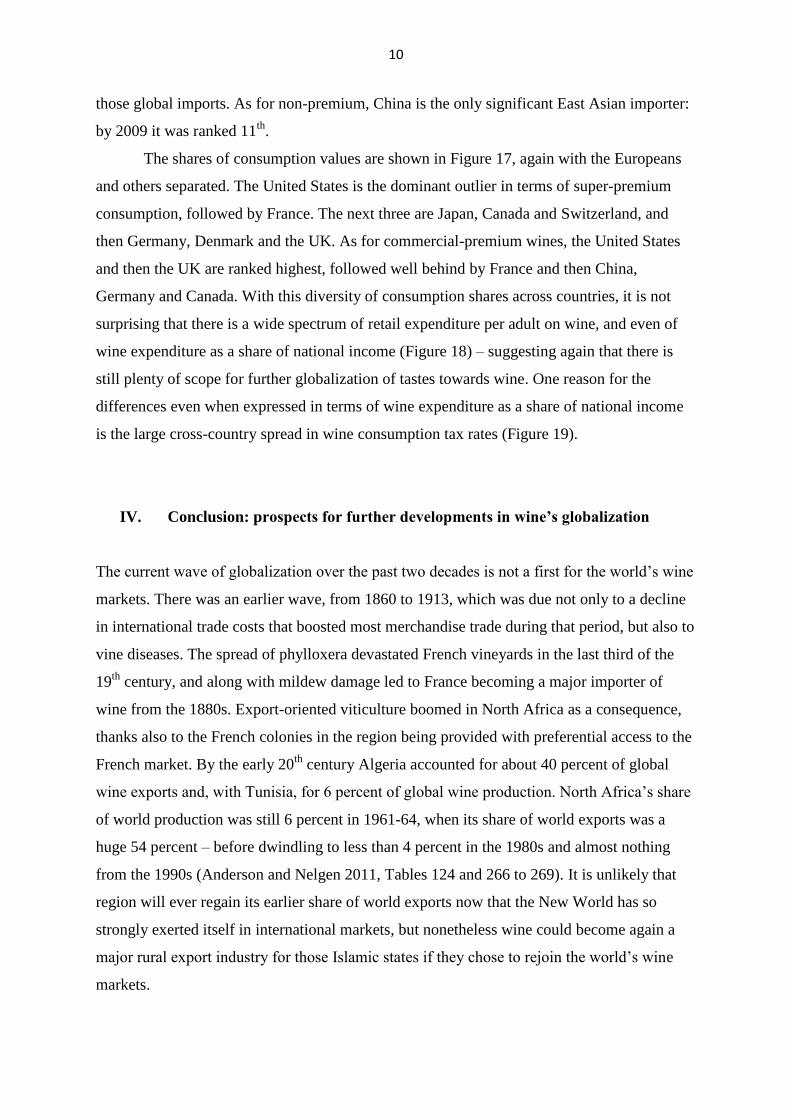
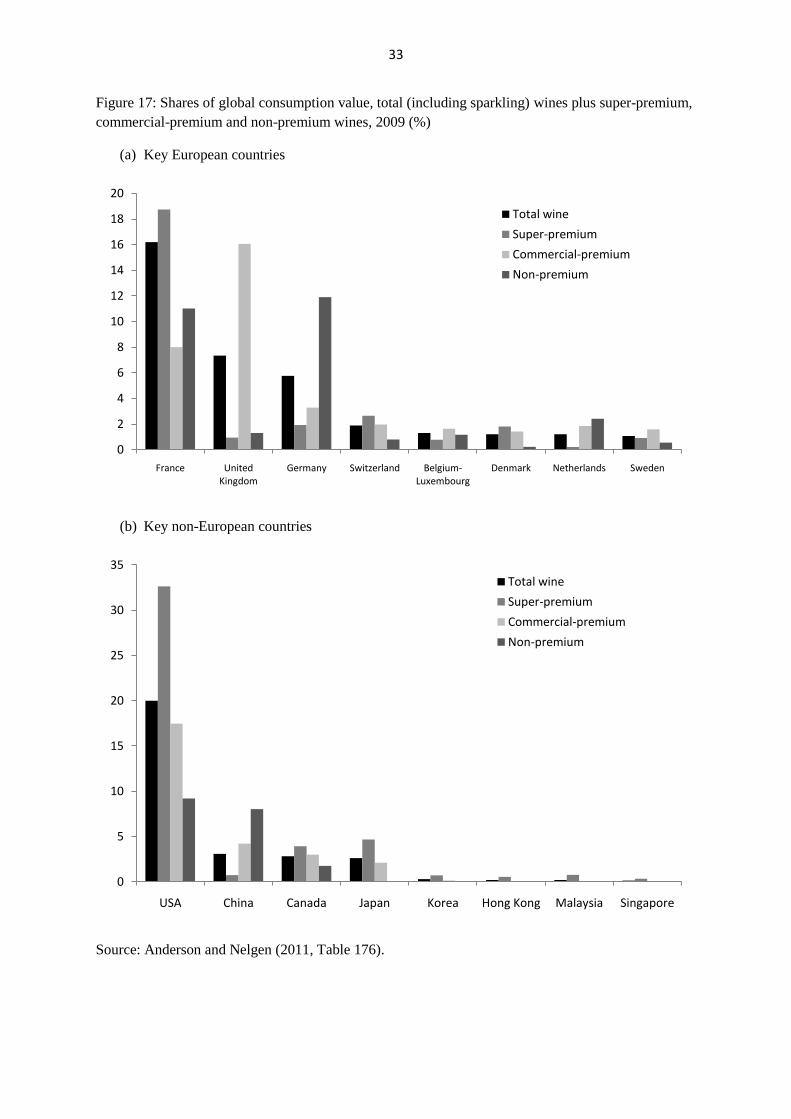
The shares of consumption values are shown in Figure 17, again with the Europeans
and others separated. The United States is the dominant outlier in terms of super-premium
consumption, followed by France. The next three are Japan, Canada and Switzerland, and
then Germany, Denmark and the UK. As for commercial-premium wines, the United States
and then the UK are ranked highest, followed well behind by France and then China,
Germany and Canada. With this diversity of consumption shares across countries, it is not
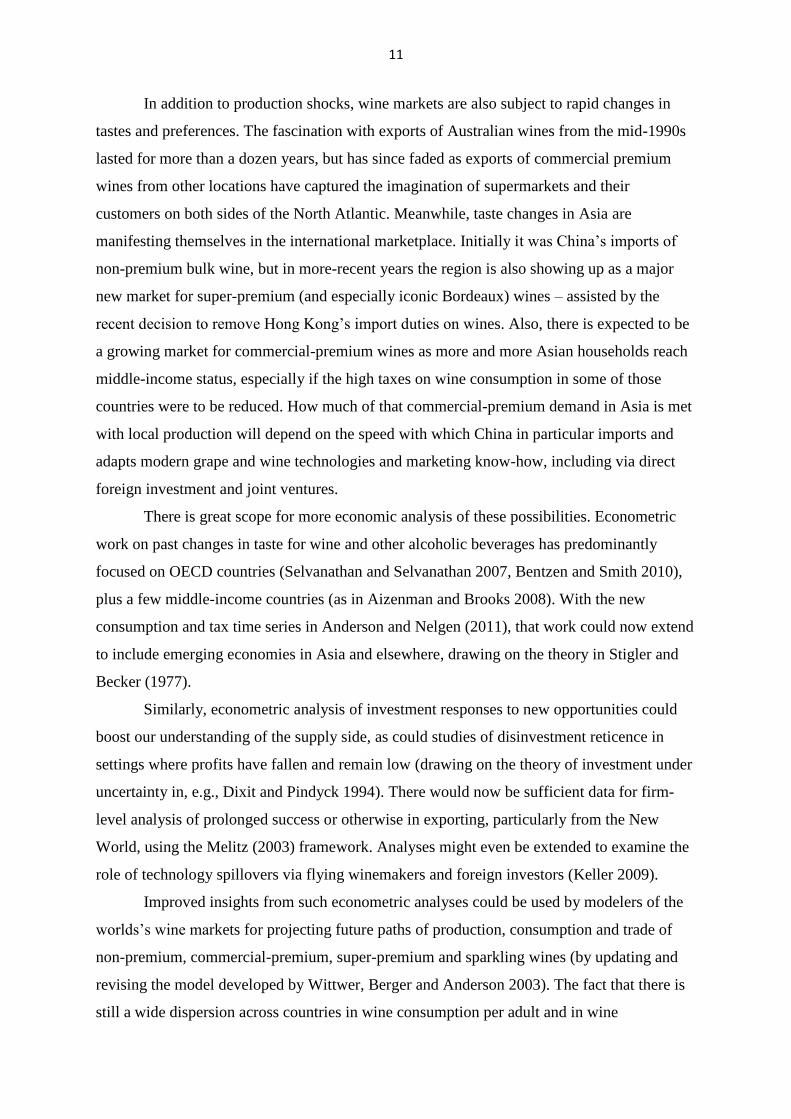
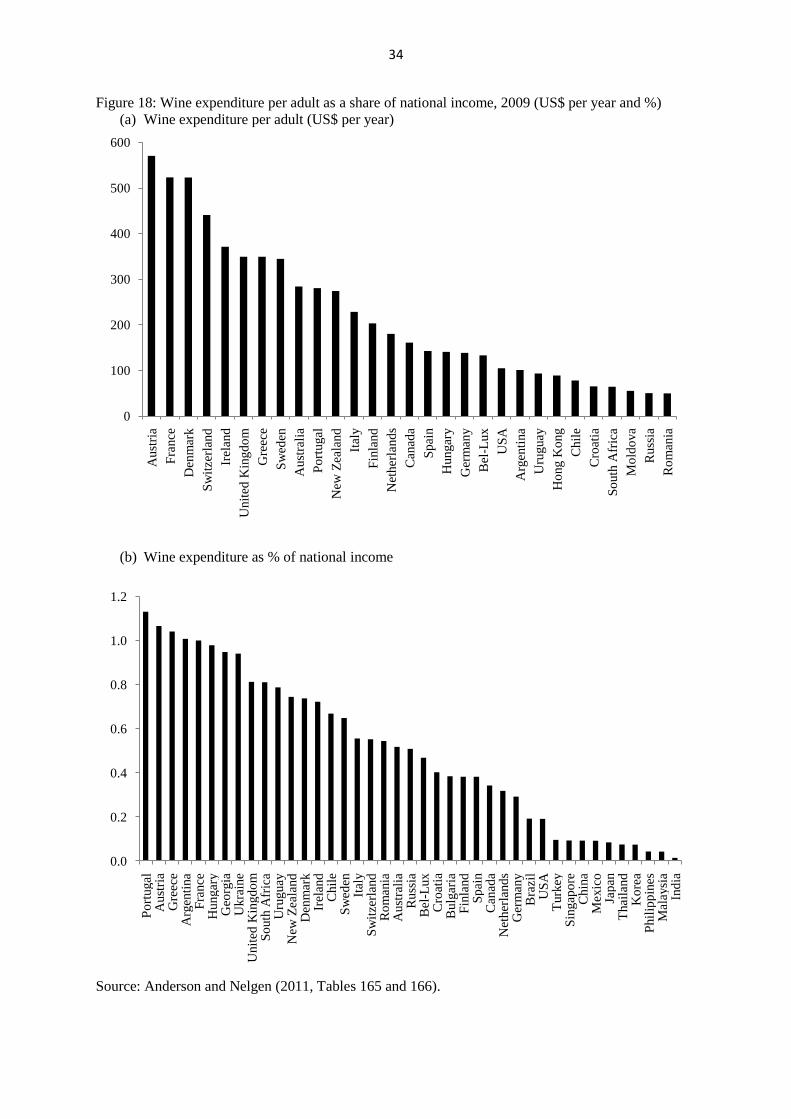
surprising that there is a wide spectrum of retail expenditure per adult on wine, and even of
wine expenditure as a share of national income (Figure 18) – suggesting again that there is
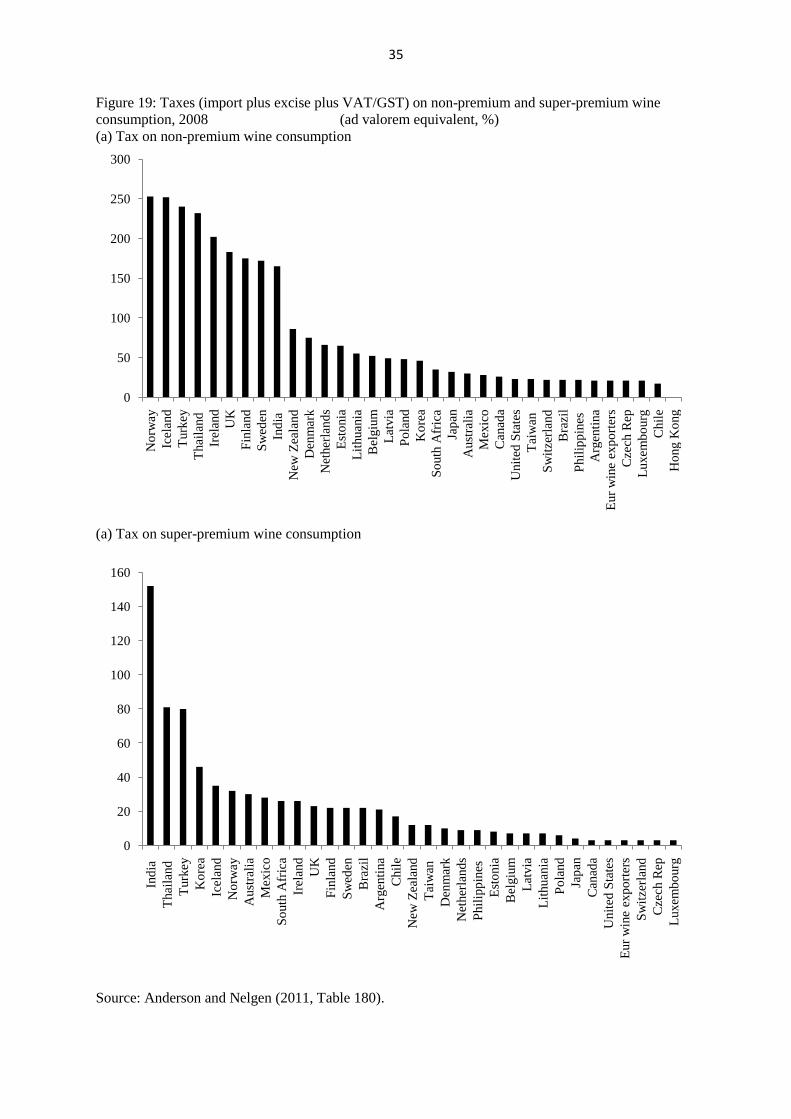
still plenty of scope for further globalization of tastes towards wine. One reason for the
differences even when expressed in terms of wine expenditure as a share of national income
is the large cross-country spread in wine consumption tax rates (Figure 19).
IV. Conclusion: prospects for further developments in wine’s globalization
The current wave of globalization over the past two decades is not a first for the world’s wine
markets. There was an earlier wave, from 1860 to 1913, which was due not only to a decline
in international trade costs that boosted most merchandise trade during that period, but also to
vine diseases. The spread of phylloxera devastated French vineyards in the last third of the
19th
century, and along with mildew damage led to France becoming a major importer of
wine from the 1880s. Export-oriented viticulture boomed in North Africa as a consequence,
thanks also to the French colonies in the region being provided with preferential access to the
French market. By the early 20th
century Algeria accounted for about 40 percent of global
wine exports and, with Tunisia, for 6 percent of global wine production. North Africa’s share
of world production was still 6 percent in 1961-64, when its share of world exports was a
huge 54 percent – before dwindling to less than 4 percent in the 1980s and almost nothing
from the 1990s (Anderson and Nelgen 2011, Tables 124 and 266 to 269). It is unlikely that
region will ever regain its earlier share of world exports now that the New World has so
strongly exerted itself in international markets, but nonetheless wine could become again a
major rural export industry for those Islamic states if they chose to rejoin the world’s wine
markets.
11
In addition to production shocks, wine markets are also subject to rapid changes in
tastes and preferences. The fascination with exports of Australian wines from the mid-1990s
lasted for more than a dozen years, but has since faded as exports of commercial premium
wines from other locations have captured the imagination of supermarkets and their
customers on both sides of the North Atlantic. Meanwhile, taste changes in Asia are
manifesting themselves in the international marketplace. Initially it was China’s imports of
non-premium bulk wine, but in more-recent years the region is also showing up as a major
new market for super-premium (and especially iconic Bordeaux) wines – assisted by the
recent decision to remove Hong Kong’s import duties on wines. Also, there is expected to be
a growing market for commercial-premium wines as more and more Asian households reach
middle-income status, especially if the high taxes on wine consumption in some of those
countries were to be reduced. How much of that commercial-premium demand in Asia is met
with local production will depend on the speed with which China in particular imports and
adapts modern grape and wine technologies and marketing know-how, including via direct
foreign investment and joint ventures.
There is great scope for more economic analysis of these possibilities. Econometric
work on past changes in taste for wine and other alcoholic beverages has predominantly
focused on OECD countries (Selvanathan and Selvanathan 2007, Bentzen and Smith 2010),
plus a few middle-income countries (as in Aizenman and Brooks 2008). With the new
consumption and tax time series in Anderson and Nelgen (2011), that work could now extend
to include emerging economies in Asia and elsewhere, drawing on the theory in Stigler and
Becker (1977).
Similarly, econometric analysis of investment responses to new opportunities could
boost our understanding of the supply side, as could studies of disinvestment reticence in
settings where profits have fallen and remain low (drawing on the theory of investment under
uncertainty in, e.g., Dixit and Pindyck 1994). There would now be sufficient data for firm-
level analysis of prolonged success or otherwise in exporting, particularly from the New
World, using the Melitz (2003) framework. Analyses might even be extended to examine the
role of technology spillovers via flying winemakers and foreign investors (Keller 2009).
Improved insights from such econometric analyses could be used by modelers of the
worlds’s wine markets for projecting future paths of production, consumption and trade of
non-premium, commercial-premium, super-premium and sparkling wines (by updating and
revising the model developed by Wittwer, Berger and Anderson 2003). The fact that there is
still a wide dispersion across countries in wine consumption per adult and in wine
12
consumption taxes, and that both the Old World and the New World are still exporting only
about one-third of their wine production, suggests there is plenty of scope for globalization to
progress further in the future. The continuing falls in international transport and
communication costs, and to the lowering of production cost differences across countries,
will contribute to that and could be taken into account in such model projection work.
References
Aizenman, J. and E. Brooks (2008), ‘Globalization and Taste Convergence: The Cases of
Wine and Beer’, Review of International Economics 16(2): 217-33, May.
Anderson, K. (ed.) (2004), The World’s Wine Markets: Globalization at Work, London:
Edward Elgar.
Anderson, K. (2010), ‘Excise and Import Taxes on Wine vs Beer and Spirits: An
International Comparison’, Economic Papers 29(2): 215-28, June. Also available as
Wine Economics Research Centre Working Paper 0510, March 2010, at
www.adelaide.edu/au/wine-econ.
Anderson, K. and S. Nelgen (2011), Global Wine Markets, 1961 to 2009: A Statistical
Compendium, Adelaide: University of Adelaide Press. Freely available e-book at
www.adelaide.edu.au/press/titles/global-wine
Anderson, K. and D. Norman (2003), Global Wine Production, Consumption and Trade,
1961 to 2001: A Statistical Compendium, Adelaide: Centre for International
Economic Studies.
Anderson, K., D. Norman and G. Wittwer (2003), ‘Globalization of the World’s Wine
Markets’, The World Economy 26(5): 659-87, May.
Bentzen, J. and V. Smith (2010), ‘Developments in the Structure of Alcohol Consumption in
OECD Countries’, Paper presented at the workshop on The World’s Wine Markets by
2030: Terroir, Climate Change, R&D and Globalization, Adelaide, 7-9 February.
Dixit, A.K. and R.S. Pindyck (1994), Investment under Uncertainty, Princeton NJ: Princeton
University Press.
Johnson, H. (1989), The Story of Wine, London: Mitchell Beazley.
Keller, W. (2009), ‘International Trade, Foreign Direct investment, and Technological
Spillovers’, CEPR Discussion Paper 7503, London, October.
13
Melitz, M.J. (2003), ‘The Impact of Trade on Intra-industry Reallocations and Aggregate
Industry Productivity’, Econometrica 71(6): 1692-1725.
Selvanathan, S. and E.A. Selvanathan (2007), ‘Another Look at the Identical Tases
Hypothesis on the Analysis of Cross-Country Alcohol Data’, Empirical Economics
32: 185-215.
Stigler, G.J. and G.S. Becker (1977), ‘De Gustibus non est Disputandum’, American
Economic Review 67(2): 76-90, March.
Wittwer, G., N. Berger and K. Anderson (2003), ‘A Model of the World’s Wine Markets’,
Economic Modelling 20(3): 487-506, May.
14
Appendix: Estimating value shares of national and global wine markets, by quality
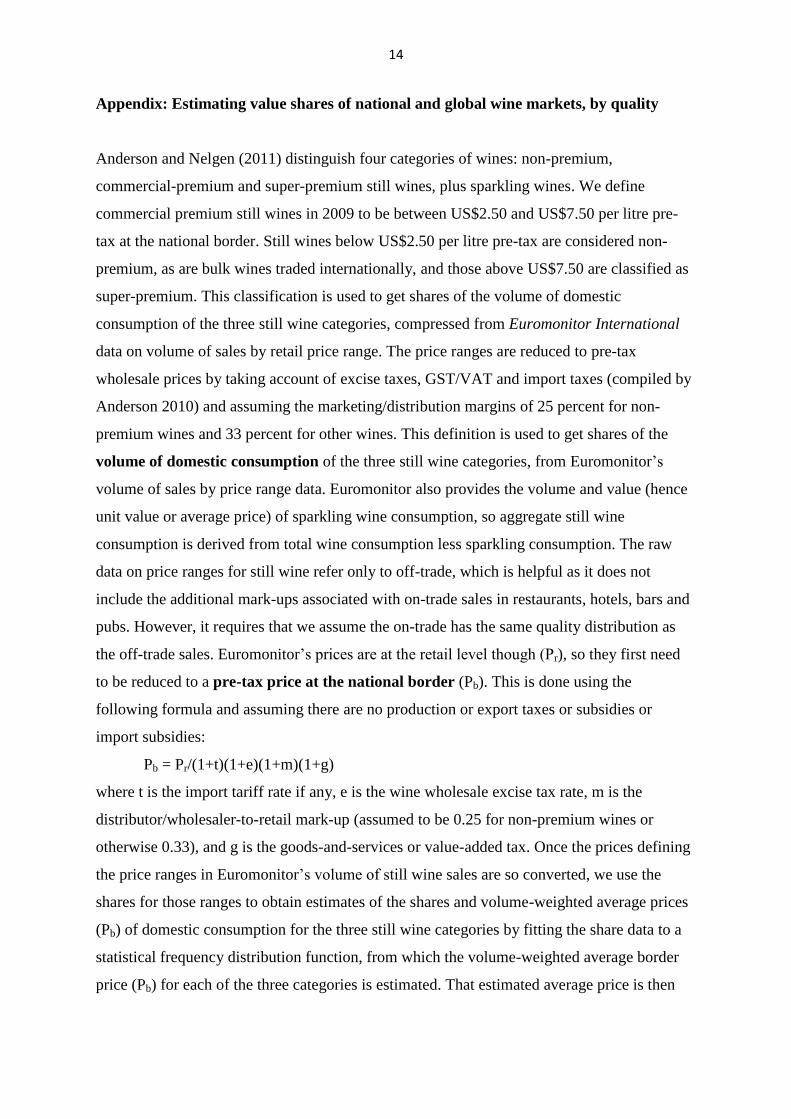
Anderson and Nelgen (2011) distinguish four categories of wines: non-premium,
commercial-premium and super-premium still wines, plus sparkling wines. We define
commercial premium still wines in 2009 to be between US$2.50 and US$7.50 per litre pre-
tax at the national border. Still wines below US$2.50 per litre pre-tax are considered non-
premium, as are bulk wines traded internationally, and those above US$7.50 are classified as
super-premium. This classification is used to get shares of the volume of domestic
consumption of the three still wine categories, compressed from Euromonitor International
data on volume of sales by retail price range. The price ranges are reduced to pre-tax
wholesale prices by taking account of excise taxes, GST/VAT and import taxes (compiled by
Anderson 2010) and assuming the marketing/distribution margins of 25 percent for non-
premium wines and 33 percent for other wines. This definition is used to get shares of the
volume of domestic consumption of the three still wine categories, from Euromonitor’s
volume of sales by price range data. Euromonitor also provides the volume and value (hence
unit value or average price) of sparkling wine consumption, so aggregate still wine
consumption is derived from total wine consumption less sparkling consumption. The raw
data on price ranges for still wine refer only to off-trade, which is helpful as it does not
include the additional mark-ups associated with on-trade sales in restaurants, hotels, bars and
pubs. However, it requires that we assume the on-trade has the same quality distribution as
the off-trade sales. Euromonitor’s prices are at the retail level though (Pr), so they first need
to be reduced to a pre-tax price at the national border (Pb). This is done using the
following formula and assuming there are no production or export taxes or subsidies or
import subsidies:
Pb = Pr/(1+t)(1+e)(1+m)(1+g)
where t is the import tariff rate if any, e is the wine wholesale excise tax rate, m is the
distributor/wholesaler-to-retail mark-up (assumed to be 0.25 for non-premium wines or
otherwise 0.33), and g is the goods-and-services or value-added tax. Once the prices defining
the price ranges in Euromonitor’s volume of still wine sales are so converted, we use the
shares for those ranges to obtain estimates of the shares and volume-weighted average prices
(Pb) of domestic consumption for the three still wine categories by fitting the share data to a
statistical frequency distribution function, from which the volume-weighted average border
price (Pb) for each of the three categories is estimated. That estimated average price is then
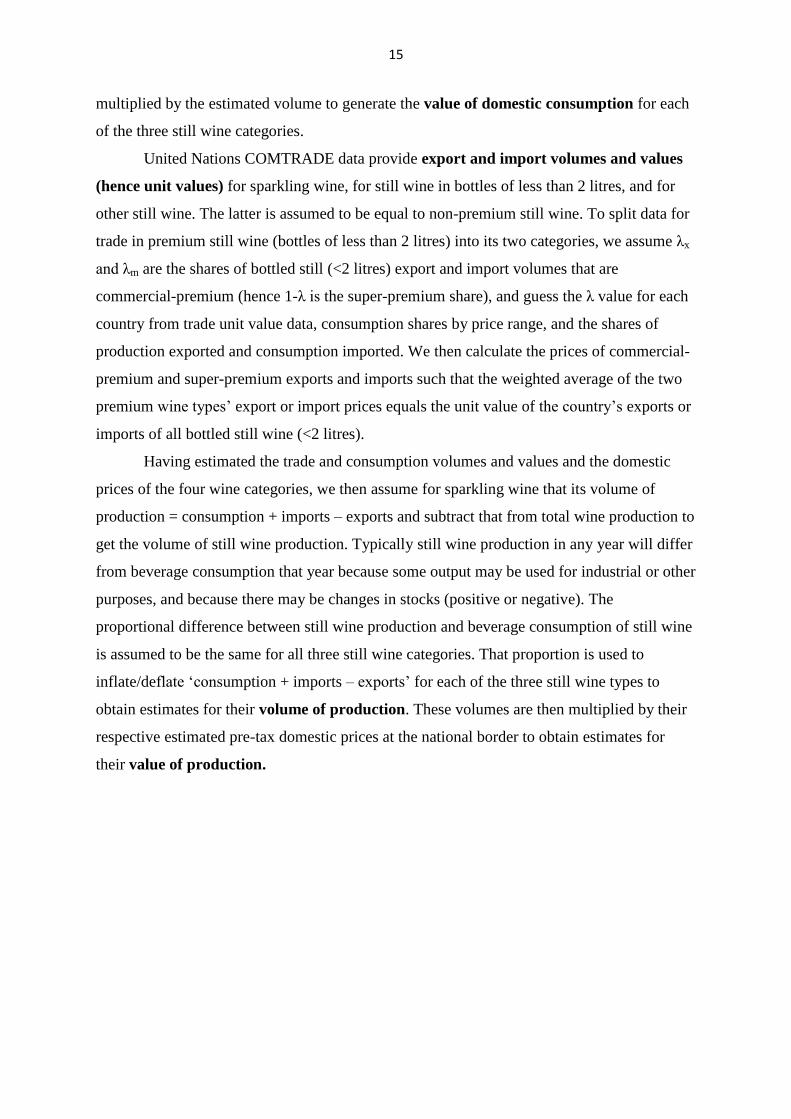
15
multiplied by the estimated volume to generate the value of domestic consumption for each
of the three still wine categories.
United Nations COMTRADE data provide export and import volumes and values
(hence unit values) for sparkling wine, for still wine in bottles of less than 2 litres, and for
other still wine. The latter is assumed to be equal to non-premium still wine. To split data for
trade in premium still wine (bottles of less than 2 litres) into its two categories, we assume λx
and λm are the shares of bottled still (<2 litres) export and import volumes that are
commercial-premium (hence 1-λ is the super-premium share), and guess the λ value for each
country from trade unit value data, consumption shares by price range, and the shares of
production exported and consumption imported. We then calculate the prices of commercial-
premium and super-premium exports and imports such that the weighted average of the two
premium wine types’ export or import prices equals the unit value of the country’s exports or
imports of all bottled still wine (<2 litres).
Having estimated the trade and consumption volumes and values and the domestic
prices of the four wine categories, we then assume for sparkling wine that its volume of
production = consumption + imports – exports and subtract that from total wine production to
get the volume of still wine production. Typically still wine production in any year will differ
from beverage consumption that year because some output may be used for industrial or other
purposes, and because there may be changes in stocks (positive or negative). The
proportional difference between still wine production and beverage consumption of still wine
is assumed to be the same for all three still wine categories. That proportion is used to
inflate/deflate ‘consumption + imports – exports’ for each of the three still wine types to
obtain estimates for their volume of production. These volumes are then multiplied by their
respective estimated pre-tax domestic prices at the national border to obtain estimates for
their value of production.
16
Table 1: Volume, value, unit value and index of intensity of wine exports to China and
Russia, 2009
Volume,
million
litres (and
share, %)
Value,
million
US$ (and
share, %)
Unit value
(US$ per
litre)
Index of export intensitya
To China: in volume
terms
in value
terms
France 48.1 (24) 306 (38) 4.29 2.1 2.0
Australia 43.7 (22) 102 (19) 2.34 3.0 3.2
Chile 55.6 (28) 54 (10) 0.97 4.6 2.0
United States 11.5 (6) 35 (7) 3.08 1.3 2.0
Italy 7.9 (4) 27 (5) 3.42 0.2 0.3
South Africa 7.5 (4) 7 (1) 0.88 0.8 0.4
All exporters 202.0 (100) 538 (100) 2.66 1.0 1.0
To Russia:
France 14.5 (4) 40 (7) 2.76 0.3 0.3
Italy 65.1 (15) 91 (17) 1.39 0.9 1.0
Germany 22.5 (6) 46 (9) 2.04 1.4 2.3
E. Europe and CIS 152.6 (39) 225 (42) 1.47 7.3 16.8
All exporters 396.2 (100) 538 (100) 1.36 1.0 1.0
a The trade intensity index is defined as the share of a country’s export sales going to China divided
by the share of China’s imports in global (net of the exporting country’s) wine imports.
Source: Anderson and Nelgen (2011, Section V).
17
Figure 1: Exports as % of national wine production volume, 2007-09
Source: Anderson and Nelgen (2011, Table 51).
0
10
20
30
40
50
60
70
80
Chil
e
Aust
rali
a
Mo
ldo
va
New
Zea
land
Po
rtugal
Bulg
aria
So
uth
Afr
ica
Ital
y
Sp
ain
Ger
man
y
Fra
nce
Arg
enti
na
Turk
ey
Aust
ria
Ind
ia
Hungar
y
US
A
Ukra
ine
Can
ada
Uru
guay
Geo
rgia
Gre
ece
Bra
zil
18
Figure 2: Wine production, consumption and net export volumes, traditional European
exporters (WEX) and New World exporters (NWE8), 1970 to 2009 (ML)
(a) Wine consumption and net exports
(b) Wine production and wine sales (domestic plus export), WEX
Source: Anderson and Nelgen (2011, Tables 99, 101, 117 and 118).
0
2000
4000
6000
8000
10000
12000
14000
16000
180001
97
0
19
72
19
74
19
76
19
78
19
80
19
82
19
84
19
86
19
88
19
90
19
92
19
94
19
96
19
98
20
00
20
02
20
04
20
06
20
08
consumption + net exports WEX
consumption WEX
consumption + net exports NWE8
consumption NWE8
0
5000
10000
15000
20000
Sales Production
19
Figure 3: Wine consumption per adult, traditional and other European markets, 1970 to 2009
(litres of alcohol)
(a) traditional and other European markets
(b) Non-traditional European markets
Source: Anderson and Nelgen (2011, Table 106).
0
2
4
6
8
10
12
14
16
18
20
19
70
19
72
19
74
19
76
19
78
19
80
19
82
19
84
19
86
19
88
19
90
19
92
19
94
19
96
19
98
20
00
20
02
20
04
20
06
20
08
France
Italy
Portugal
Spain
Switzerland
Austria
0
1
1
2
2
3
3
4
4
5
19
70
19
72
19
74
19
76
19
78
19
80
19
82
19
84
19
86
19
88
19
90
19
92
19
94
19
96
19
98
20
00
20
02
20
04
20
06
20
08
Bel-Lux
Netherlands
Sweden
United Kingdom
Finland
Ireland
20
Figure 4: Value of New World countries’ wine exports, 1995 to 2010 (current US$ million)
Source: Anderson and Nelgen (2011, Table 63).
0
500
1000
1500
2000
2500
3000
1995 1996 1997 1998 1999 2000 2001 2002 2003 2004 2005 2006 2007 2008 2009 2010
Australia
Chile
USA
South Africa
New Zealand
Argentina
Canada
21
Figure 5: EU-15 and New World shares of world wine export value and volume, 1988 to
2009 (percent)
(a) Value
(b) Volume
Source: Anderson and Nelgen (2011, Table 138).
0
10
20
30
40
50
60
70
80
90
1001
98
8
19
89
19
90
19
91
19
92
19
93
19
94
19
95
19
96
19
97
19
98
19
99
20
00
20
01
20
02
20
03
20
04
20
05
20
06
20
07
20
08
20
09
EU-15 (including intra EU-15 trade)
NWE8 (including intra EU-15 trade)
excluding intra EU-15 trade
0
10
20
30
40
50
60
70
80
90
100
1988
1989
1990
1991
1992
1993
1994
1995
1996
1997
1998
1999
2000
2001
2002
2003
2004
2005
2006
2007
2008
2009
EU-15 (including intra EU-15 trade)
NWE8 (including intra EU-15 trade)
excluding intra EU-15 trade
22
Figure 6: Volume of world (excluding intra-EU15) wine exports, 1988-89 to 2005-09 (ML)
Source: Anderson and Nelgen (2011, Table 136).
0
500
1000
1500
2000
2500
3000
3500
4000
4500
5000
1988-89 1990-94 1995-99 2000-04 2005-09
Rest of the world
NWE8
North Africa
ECA
EU-15

23
Figure 8: Bulk wine as % of total wine export volume, 2000 to 2010
Source: Anderson and Nelgen (2011, Table 41).
0
5
10
15
20
25
30
35
40
45
2000 2001 2002 2003 2004 2005 2006 2007 2008 2009 2010
World
EU-15
NWE8
24
Figure 9: Asian grape-wine consumption volume, 2000 to 2009 (ML)
Source: Anderson and Nelgen (2011, Table 17).
0
200
400
600
800
1000
1200
2000 2001 2002 2003 2004 2005 2006 2007 2008 2009
China
Japan
Hong Kong, Korea, TaiwanOther Asia
25
Figure 10: Grape-wine consumption per adult, Asian markets, 2000 to 2009 (litres of alcohol)
Source: Anderson and Nelgen (2011, Table 21).
0.00
0.05
0.10
0.15
0.20
0.25
0.30
0.35
0.40
0.45
0.50
2000 2001 2002 2003 2004 2005 2006 2007 2008 2009
Hong Kong Japan Singapore China Korea Malaysia
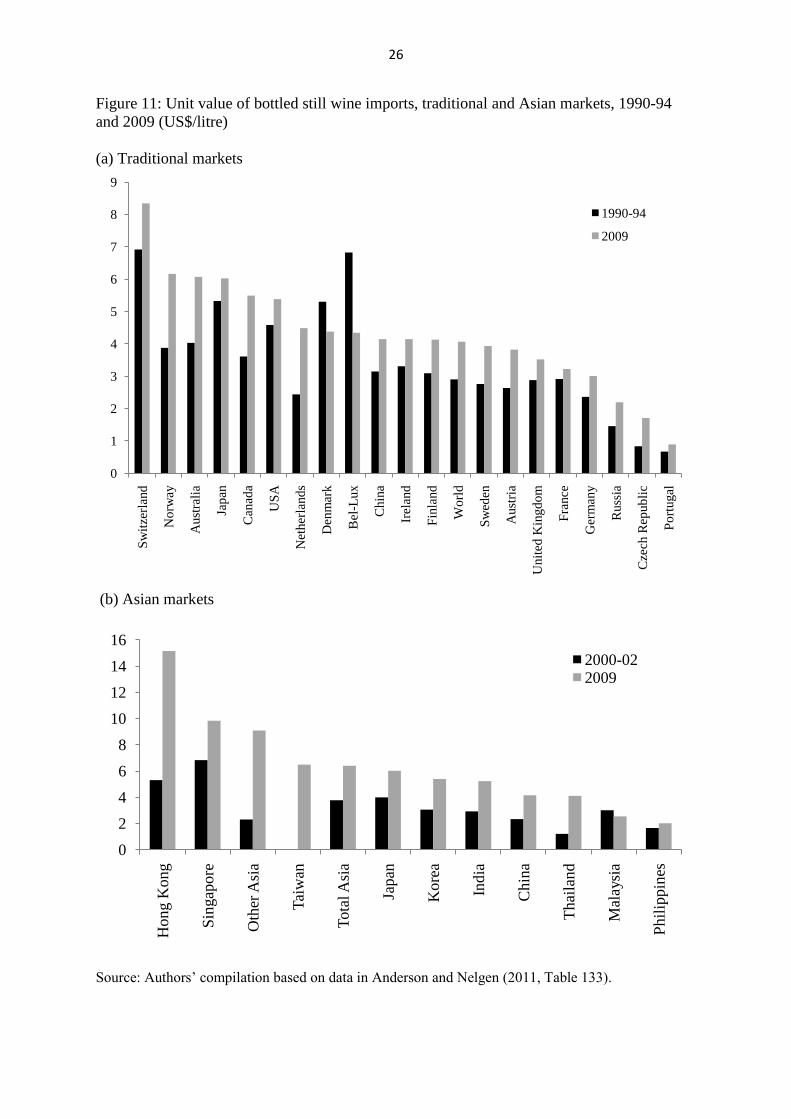
26
Figure 11: Unit value of bottled still wine imports, traditional and Asian markets, 1990-94
and 2009 (US$/litre)
(a) Traditional markets
(b) Asian markets
Source: Authors’ compilation based on data in Anderson and Nelgen (2011, Table 133).
0
1
2
3
4
5
6
7
8
9
Sw
itze
rlan
d
No
rway
Aust
rali
a
Jap
an
Can
ada
US
A
Net
her
land
s
Den
mar
k
Bel
-Lux
Chin
a
Irel
and
Fin
land
Wo
rld
Sw
eden
Aust
ria
Unit
ed K
ingd
om
Fra
nce
Ger
man
y
Russ
ia
Cze
ch R
epub
lic
Po
rtugal
1990-94
2009
0
2
4
6
8
10
12
14
16
Hong K
ong
Sin
gap
ore
Oth
er A
sia
Tai
wan
Tota
l A
sia
Japan
Kore
a
India
Chin
a
Thai
land
Mal
aysi
a
Phil
ippin
es2000-022009
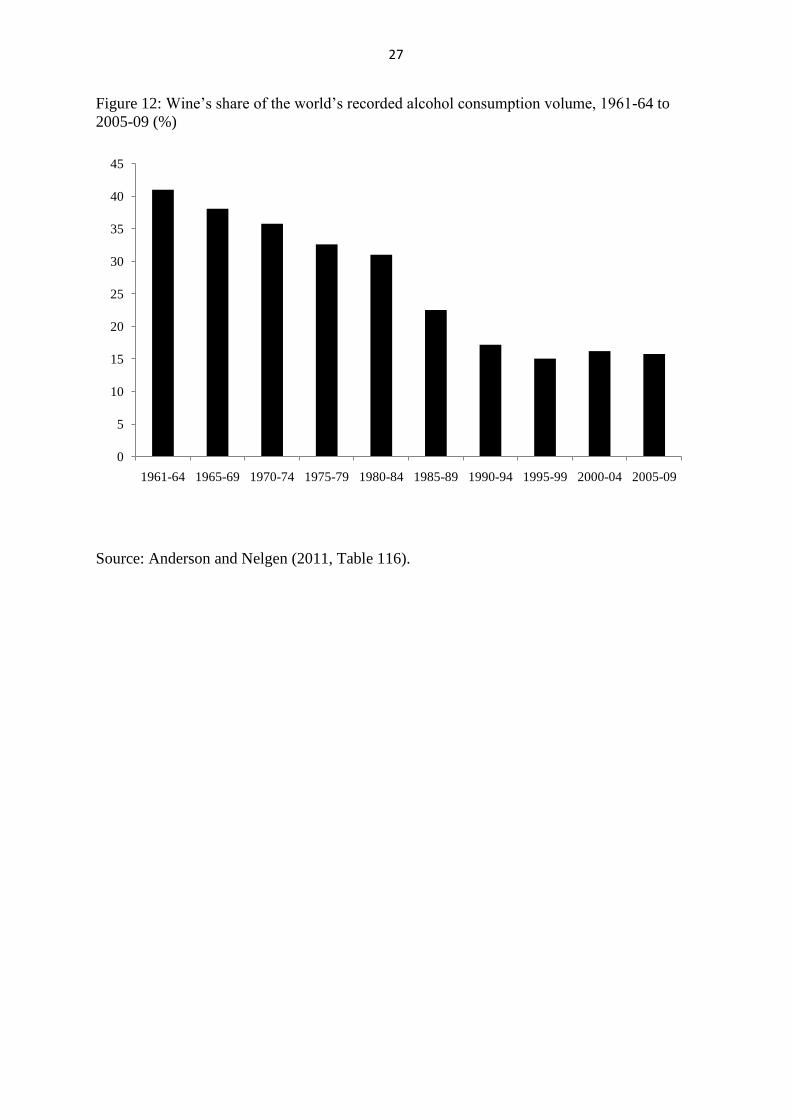
27
Figure 12: Wine’s share of the world’s recorded alcohol consumption volume, 1961-64 to
2005-09 (%)
Source: Anderson and Nelgen (2011, Table 116).
0
5
10
15
20
25
30
35
40
45
1961-64 1965-69 1970-74 1975-79 1980-84 1985-89 1990-94 1995-99 2000-04 2005-09
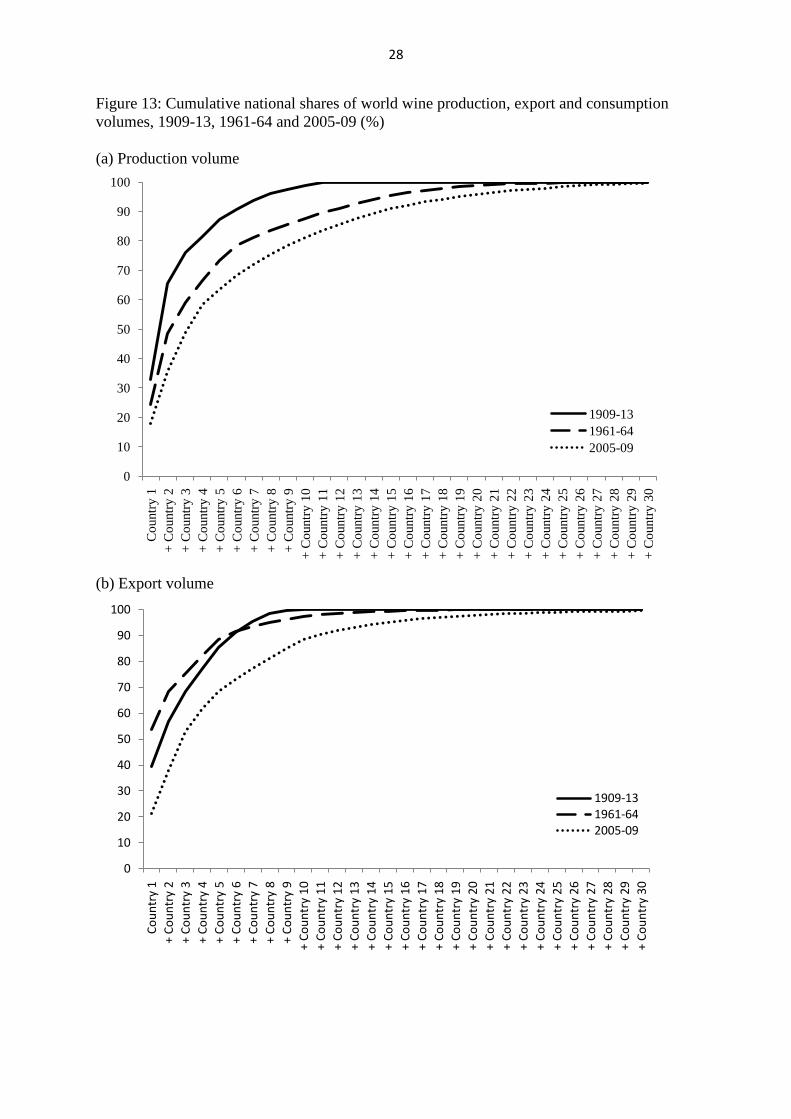
28
Figure 13: Cumulative national shares of world wine production, export and consumption
volumes, 1909-13, 1961-64 and 2005-09 (%)
(a) Production volume
(b) Export volume
0
10
20
30
40
50
60
70
80
90
100
Co
untr
y 1
+ C
ountr
y 2
+ C
ountr
y 3
+ C
ountr
y 4
+ C
ountr
y 5
+ C
ountr
y 6
+ C
ountr
y 7
+ C
ountr
y 8
+ C
ountr
y 9
+ C
ountr
y 1
0
+ C
ountr
y 1
1
+ C
ountr
y 1
2
+ C
ountr
y 1
3
+ C
ountr
y 1
4
+ C
ountr
y 1
5
+ C
ountr
y 1
6
+ C
ountr
y 1
7
+ C
ountr
y 1
8
+ C
ountr
y 1
9
+ C
ountr
y 2
0
+ C
ountr
y 2
1
+ C
ountr
y 2
2
+ C
ountr
y 2
3
+ C
ountr
y 2
4
+ C
ountr
y 2
5
+ C
ountr
y 2
6
+ C
ountr
y 2
7
+ C
ountr
y 2
8
+ C
ountr
y 2
9
+ C
ountr
y 3
0
1909-13
1961-64
2005-09
0
10
20
30
40
50
60
70
80
90
100
Co
un
try
1
+ C
ou
ntr
y 2
+ C
ou
ntr
y 3
+ C
ou
ntr
y 4
+ C
ou
ntr
y 5
+ C
ou
ntr
y 6
+ C
ou
ntr
y 7
+ C
ou
ntr
y 8
+ C
ou
ntr
y 9
+ C
ou
ntr
y 1
0
+ C
ou
ntr
y 1
1
+ C
ou
ntr
y 1
2
+ C
ou
ntr
y 1
3
+ C
ou
ntr
y 1
4
+ C
ou
ntr
y 1
5
+ C
ou
ntr
y 1
6
+ C
ou
ntr
y 1
7
+ C
ou
ntr
y 1
8
+ C
ou
ntr
y 1
9
+ C
ou
ntr
y 2
0
+ C
ou
ntr
y 2
1
+ C
ou
ntr
y 2
2
+ C
ou
ntr
y 2
3
+ C
ou
ntr
y 2
4
+ C
ou
ntr
y 2
5
+ C
ou
ntr
y 2
6
+ C
ou
ntr
y 2
7
+ C
ou
ntr
y 2
8
+ C
ou
ntr
y 2
9
+ C
ou
ntr
y 3
0
1909-131961-642005-09
29
Figure 13 (continued): Cumulative national shares of world wine production, export and
consumption volumes, 1909-13, 1961-64 and 2005-09 (%)
(c) Consumptiona volume
a Consumption in 1909-13 is assumed to be production plus net imports for each country.
Source: Authors’ compilation based on data in Anderson and Nelgen (2011, Tables 99, 117, 266 and
267).
0
10
20
30
40
50
60
70
80
90
100
Co
untr
y 1
+ C
ountr
y 2
+ C
ountr
y 3
+ C
ountr
y 4
+ C
ountr
y 5
+ C
ountr
y 6
+ C
ountr
y 7
+ C
ountr
y 8
+ C
ountr
y 9
+ C
ountr
y 1
0
+ C
ountr
y 1
1
+ C
ountr
y 1
2
+ C
ountr
y 1
3
+ C
ountr
y 1
4
+ C
ountr
y 1
5
+ C
ountr
y 1
6
+ C
ountr
y 1
7
+ C
ountr
y 1
8
+ C
ountr
y 1
9
+ C
ountr
y 2
0
+ C
ountr
y 2
1
+ C
ountr
y 2
2
+ C
ountr
y 2
3
+ C
ountr
y 2
4
+ C
ountr
y 2
5
+ C
ountr
y 2
6
+ C
ountr
y 2
7
+ C
ountr
y 2
8
+ C
ountr
y 2
9
+ C
ountr
y 3
0
1909-13
1961-64
2005-09
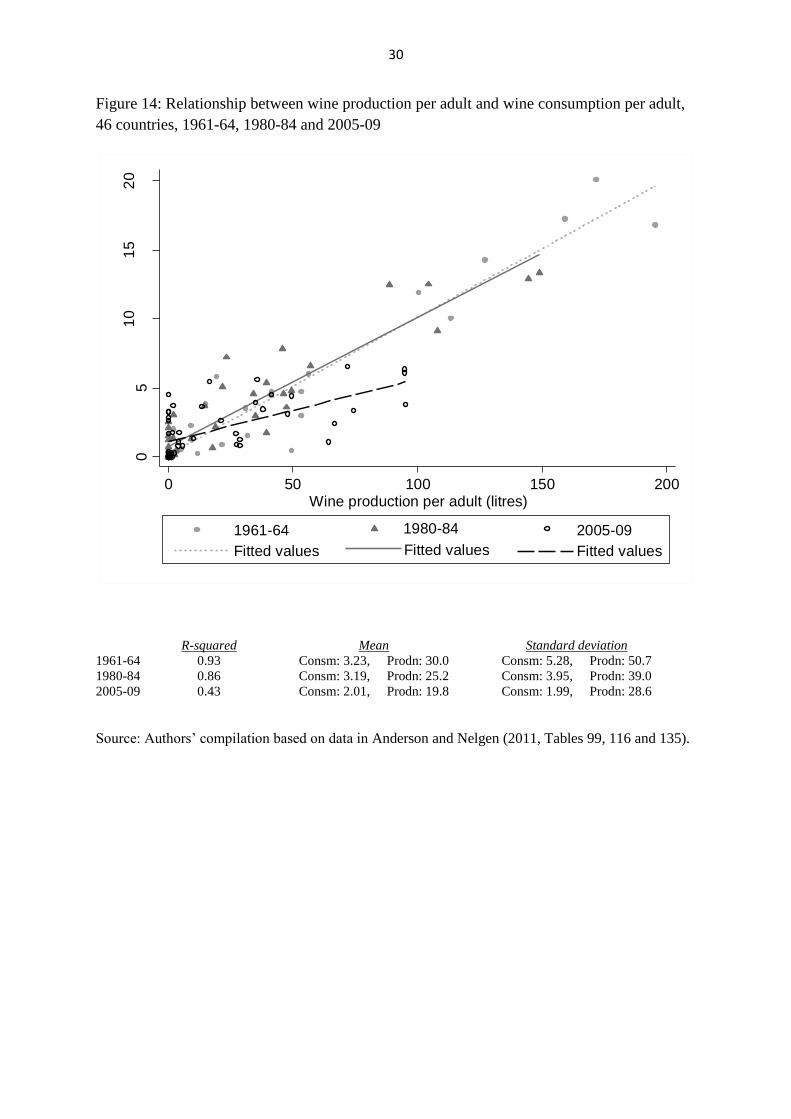
30
Figure 14: Relationship between wine production per adult and wine consumption per adult,
46 countries, 1961-64, 1980-84 and 2005-09
R-squared Mean Standard deviation
1961-64 0.93 Consm: 3.23, Prodn: 30.0 Consm: 5.28, Prodn: 50.7
1980-84 0.86 Consm: 3.19, Prodn: 25.2 Consm: 3.95, Prodn: 39.0
2005-09 0.43 Consm: 2.01, Prodn: 19.8 Consm: 1.99, Prodn: 28.6
Source: Authors’ compilation based on data in Anderson and Nelgen (2011, Tables 99, 116 and 135).
05
10
15
20
Win
e c
on
sum
ptio
n p
er
adu
lt (
litre
s)
0 50 100 150 200Wine production per adult (litres)
1961-64
Fitted values
1980-84
Fitted values
2005-09
Fitted values
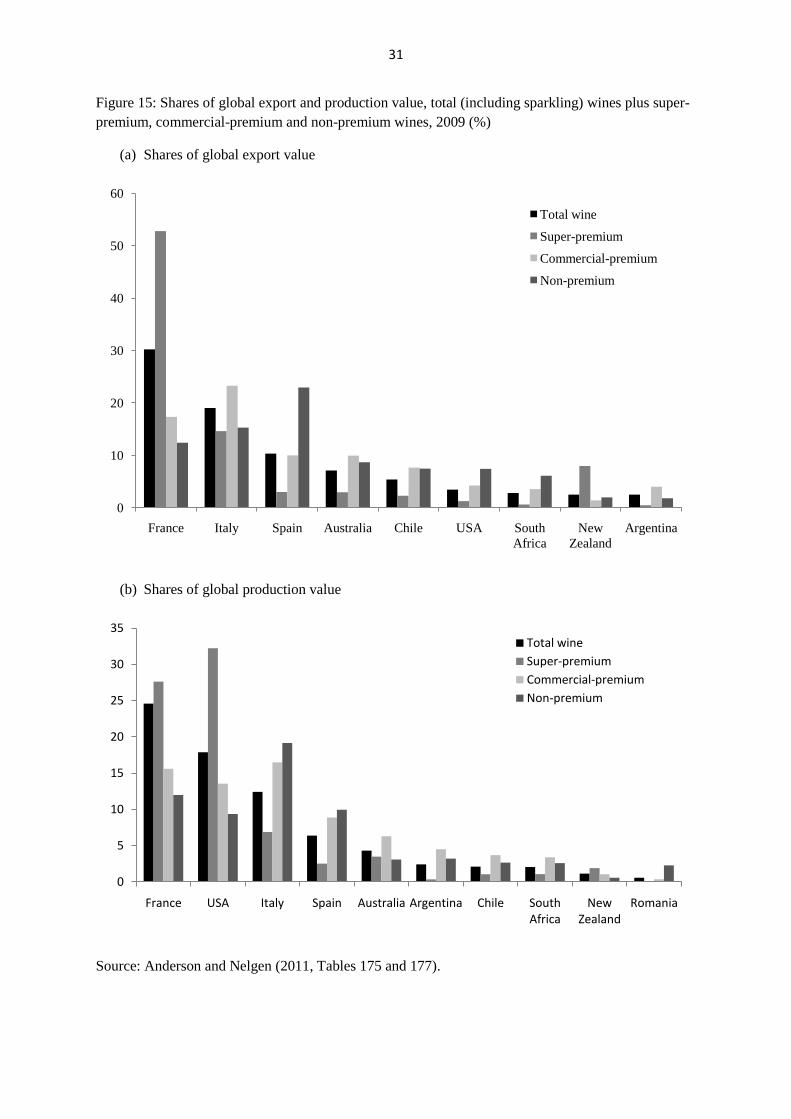
31
Figure 15: Shares of global export and production value, total (including sparkling) wines plus super-
premium, commercial-premium and non-premium wines, 2009 (%)
(a) Shares of global export value
(b) Shares of global production value
Source: Anderson and Nelgen (2011, Tables 175 and 177).
0
10
20
30
40
50
60
France Italy Spain Australia Chile USA South
Africa
New
Zealand
Argentina
Total wine
Super-premium
Commercial-premium
Non-premium
0
5
10
15
20
25
30
35
France USA Italy Spain Australia Argentina Chile South Africa
New Zealand
Romania
Total wine
Super-premium
Commercial-premium
Non-premium
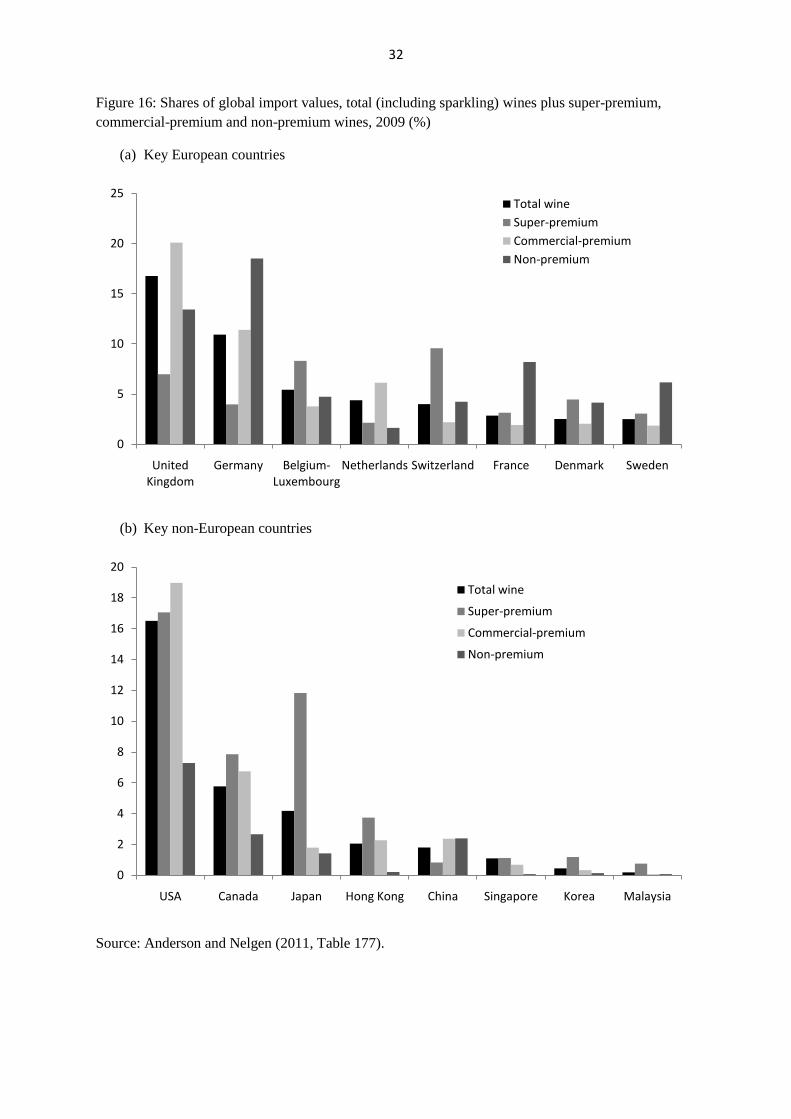
32
Figure 16: Shares of global import values, total (including sparkling) wines plus super-premium,
commercial-premium and non-premium wines, 2009 (%)
(a) Key European countries
(b) Key non-European countries
Source: Anderson and Nelgen (2011, Table 177).
0
5
10
15
20
25
United Kingdom
Germany Belgium-Luxembourg
Netherlands Switzerland France Denmark Sweden
Total wine
Super-premium
Commercial-premium
Non-premium
0
2
4
6
8
10
12
14
16
18
20
USA Canada Japan Hong Kong China Singapore Korea Malaysia
Total wine
Super-premium
Commercial-premium
Non-premium
33
Figure 17: Shares of global consumption value, total (including sparkling) wines plus super-premium,
commercial-premium and non-premium wines, 2009 (%)
(a) Key European countries
(b) Key non-European countries
Source: Anderson and Nelgen (2011, Table 176).
0
2
4
6
8
10
12
14
16
18
20
France United Kingdom
Germany Switzerland Belgium-Luxembourg
Denmark Netherlands Sweden
Total wine
Super-premium
Commercial-premium
Non-premium
0
5
10
15
20
25
30
35
USA China Canada Japan Korea Hong Kong Malaysia Singapore
Total wine
Super-premium
Commercial-premium
Non-premium
34
Figure 18: Wine expenditure per adult as a share of national income, 2009 (US$ per year and %)
(a) Wine expenditure per adult (US$ per year)
(b) Wine expenditure as % of national income
Source: Anderson and Nelgen (2011, Tables 165 and 166).
0
100
200
300
400
500
600A
ust
ria
Fra
nce
Den
mar
k
Sw
itze
rlan
d
Irel
and
Unit
ed K
ingd
om
Gre
ece
Sw
eden
Aust
rali
a
Po
rtugal
New
Zea
land
Ital
y
Fin
land
Net
her
land
s
Can
ada
Sp
ain
Hungar
y
Ger
man
y
Bel
-Lux
US
A
Arg
enti
na
Uru
guay
Ho
ng K
ong
Chil
e
Cro
atia
So
uth
Afr
ica
Mo
ldo
va
Russ
ia
Ro
man
ia
0.0
0.2
0.4
0.6
0.8
1.0
1.2
Po
rtugal
Aust
ria
Gre
ece
Arg
enti
na
Fra
nce
Hungar
yG
eorg
iaU
kra
ine
Unit
ed K
ingd
om
So
uth
Afr
ica
Uru
guay
New
Zea
land
Den
mar
kIr
elan
dC
hil
eS
wed
enIt
aly
Sw
itze
rlan
dR
om
ania
Aust
rali
aR
uss
iaB
el-L
ux
Cro
atia
Bulg
aria
Fin
land
Sp
ain
Can
ada
Net
her
land
sG
erm
any
Bra
zil
US
AT
urk
eyS
ingap
ore
Chin
aM
exic
oJa
pan
Thai
land
Ko
rea
Phil
ipp
ines
Mal
aysi
aIn
dia
35
Figure 19: Taxes (import plus excise plus VAT/GST) on non-premium and super-premium wine
consumption, 2008 (ad valorem equivalent, %)
(a) Tax on non-premium wine consumption
(a) Tax on super-premium wine consumption
Source: Anderson and Nelgen (2011, Table 180).
0
50
100
150
200
250
300N
orw
ay
Icel
and
Turk
ey
Thai
land
Irel
and
UK
Fin
land
Sw
eden
Ind
ia
New
Zea
land
Den
mar
k
Net
her
land
s
Est
onia
Lit
huan
ia
Bel
giu
m
Lat
via
Po
land
Ko
rea
So
uth
Afr
ica
Jap
an
Aust
rali
a
Mex
ico
Can
ada
Unit
ed S
tate
s
Tai
wan
Sw
itze
rlan
d
Bra
zil
Phil
ipp
ines
Arg
enti
na
Eur
win
e ex
po
rter
s
Cze
ch R
ep
Luxem
bo
urg
Chil
e
Ho
ng K
ong
0
20
40
60
80
100
120
140
160
Ind
ia
Thai
land
Turk
ey
Ko
rea
Icel
and
No
rway
Aust
rali
a
Mex
ico
So
uth
Afr
ica
Irel
and
UK
Fin
land
Sw
eden
Bra
zil
Arg
enti
na
Chil
e
New
Zea
land
Tai
wan
Den
mar
k
Net
her
land
s
Phil
ipp
ines
Est
onia
Bel
giu
m
Lat
via
Lit
huan
ia
Po
land
Jap
an
Can
ada
Unit
ed S
tate
s
Eur
win
e ex
po
rter
s
Sw
itze
rlan
d
Cze
ch R
ep
Luxem
bo
urg