Embed Size (px)
Citation preview
i
WINGLET DESIGN AND ANALYSIS FOR LOW ALTITUDE SOLAR POWERED
UAV
A THESIS SUBMITTED TO
THE GRADUATE SCHOOL OF NATURAL AND APPLIED SCIENCES
OF
MIDDLE EAST TECHNICAL UNIVERSITY
BY
ALİ İHSAN GÖLCÜK
IN PARTIAL FULFILLMENT OF THE REQUIREMENTS
FOR
THE DEGREE OF MASTER OF SCIENCE
IN
AEROSPACE ENGINEERING
FEBRUARY 2016

iii
Approval of the thesis:
WINGLET DESIGN AND ANALYSIS FOR LOW ALTITUDE SOLAR
POWERED UAV
Submitted by ALİ İHSAN GÖLCÜK in partial fulfilment of the requirements for the
degree of Master of Science in Aerospace Engineering Department, Middle East
Technical University by,
Prof. Dr. Gülbin Dural Ünver
Dean, Graduate School of Natural and Applied Sciences _____________________
Prof. Dr. Ozan Tekinalp
Head of Department, Aerospace Engineering _____________________
Assoc. Prof. Dr. Dilek Funda Kurtuluş
Supervisor, Aerospace Engineering Dept., METU _____________________
Examining Committee Members
Prof. Dr. Ozan Tekinalp _____________________
Aerospace Engineering Dept., METU
Assoc. Prof. Dilek Funda Kurtuluş _____________________
Aerospace Engineering Dept., METU
Asst. Prof. Dr. Ali Türker Kutay _____________________
Aerospace Engineering Dept., METU
Prof. Dr. Ünver Kaynak _____________________
Mechanical Engineering Dept., TOBB
Asst. Prof. Dr. Gökhan Durmuş _____________________
Aerospace Science Dept., Anadolu University
Date: 04/02/2016

iv
I hereby declare that all information in this document has been obtained and
presented in accordance with academic rules and ethical conduct. I also declare
that, as required by these rules and conduct, I have fully cited and referenced all
material and results that are not original to this work.
Name, Last Name : ALİ İHSAN GÖLCÜK
Signature :
v
ABSTRACT
WINGLET DESIGN AND ANALYSIS FOR LOW ALTITUDE SOLAR
POWERED UAV
Gölcük , Ali İhsan
M. S., Department of Aerospace Engineering
Supervisor: Assoc. Prof. Dr. Dilek Funda Kurtuluş
February 2016, 99 pages
To improve the aerodynamic performance of aircraft, comprehensive studies have
been carried out in different areas such as wing optimization, tail types and fuselage
shape, etc… One of the most important factors affecting the aerodynamic performance
of the aircraft is lift induced drag caused by wingtip vortices. Winglet is a device
referred as a small, vertical and angled extension attached at aircraft wingtip. It is used
to minimize strength of vortices and reduce the lift induced drag.
Various types of winglets have been designed and investigated to enhance
aerodynamic performances of aircraft. This thesis describes winglet design and
analysis performed on rectangular wing of MH 114 airfoil for TÜBİTAK Unmanned
Air Vehicle (UAV). The aim of this study is designing elliptical winglet and
performing Computational Fluid Dynamics (CFD) analysis for different winglet
parameters. The main objective of this study is to compare aerodynamic characteristics
of base wing and wing with winglet and investigate the performance of winglets shape
in terms of different parameters such as cant angle, sweep angle, taper ratio, toe angle
and twist angle.
vi
Winglet drawing is done in CATIA. In design algorithm, firstly, cant angle, sweep
angle and taper ratio parameters are used in a triple combination with each other (27
models). Secondly, toe (6 models) and twist (6 models) parameters are applied to
winglet separately which has the best L/D values in the first 27 models. Totally 39
different winglet models are investigated.
The computational simulation was performed at low subsonic flow speed in ANSYS
using finite volume approach. k-ω SST is used as a turbulence model. To compute the
flow around the model, 3-D unstructured tetrahedral mesh is used. The aerodynamic
characteristics of lift coefficient (CL), drag coefficient (CD) and lift to drag ratio (L/D)
were compared for 39 different winglet models at cruise conditions and zero angle of
attack (AOA). To investigate stall characteristic of clean wing and winglet (has best
L/D ratio), they were compared at different AOA (-5° to 20°). Moreover, viscous and
pressure effects of drag and lift force of clean and the best case configurations are
compared and examined. A further point, at different velocities, clean wing and wing
with winglet were analyzed in order to observe L/D change.
Analysis showed that, elliptical winglet increased L/D value on the order of 8.32%
compared to base wing. Hence, a significant improvement in aerodynamic
performance is obtained for TİHAS.
Keywords: Elliptical winglet, Induced drag, CFD
vii
ÖZ
DÜŞÜK İRTİFA VE GÜNEŞ ENERJİLİ İHA İÇİN UÇ KANATÇIK TASARIMI
Gölcük, Ali İhsan
Yüksek Lisans, Havacılık ve Uzay Mühendisliği Bölümü
Tez Yöneticisi: Doç. Dr. Dilek Funda Kurtuluş
Şubat 2016, 99 sayfa
Hava araçlarının aerodinamik performanslarını artırmak için kanat optimizasyonu,
kuyruk tipi ve gövde şekli gibi farklı alanlarda bir çok çalışma yapılmıştır.
Aerodinamik performansı etkileyen en önemli faktörlerden biri de kanat ucunda oluşan
indüklenmiş girdaplardır. Kanatçık, hava araçlarında kanat uçlarına takılan, küçük,
açısal olarak dikey doğrultuda bükülmüş yapılardır. Kanat uçlarında oluşan girdapların
zayıflatılması ve indüklenmiş sürüklenmenin oluşturduğu etkinin azaltılması için
kullanılmaktadır.
Aerodinamik performansı artırmak amacı ile bir çok kanatçık tasarlanmıştır. Bu
çalışma Tübitak İnsansız Hava Aracı Sistemi (İHA)’nin dikdörtgen kanadı için bir uç
kanatçık tasarım ve analizinden bahsetmektedir. Çalışmanın hedefi, farklı
parametreler kullanarak bir eliptik kanatçık dizaynı oluşturmak ve bu dizaynların
akışkanlar analizini yapmaktır. Ana hedef ise kanatçıksız kanat ile kanatçıklı kanadın
aerodinamik performanslarını karşılaştırmak ve kanatçığın şeklini oluşturan
parametreler, cant açısı, süpürme açısı, daralma oranı, toe açısı ve bükülme açısının
kanatçık performansına etkisini araştırmaktır.
viii
Kanatçık tasarımları CATIA kullanılarak yapılmıştır. İlk olarak cant açısı, daralma
oranı ve sürükleme açısı birbirleri ile 3 farklı kombinasyonda kullanılarak 27 farklı
dizayn oluşturulmuştur. Bu dizanlar içerisinden en iyi L/D değerine sahip tasarım için
toe ve bükülme açıları denenmiştir. Bu analizler içinden de en iyi L/D değerine sahip
tasarım alınmış ve kanatçıksız kanat ile aerodinamik performansları açısından
karşılaştırılmıştır. Toplamda 39 farklı model tasarlanmış ve analizlari yapılmıştır.
Hesaplamalı akışkanlar analizleri ANSYS de yapılmıştır. Türbülans modeli olarak k-
ω SST kullanılmıştır. 39 model için aerodinamik karakteristler, kaldırma katsayısı
(CL), sürükleme katsayısı (CD), ve L/D karşılaştırılmıştır. Sürükleme ve kaldırma
kuvvetini oluşturan viskoz ve basınç sürükleme ve kaldırma kuvvetlerinin kanatçıksız
kanat ve kanatçıklı kanat üzerindeki etkileri karşılaştırılmıştır. Kanatçıkların hava
aracının perdövites hızına etkisini incelemek için farklı açılar için de analizleri
yapılmıştır. Bunun yanında farklı hızlarda da kanat ve kanatçık analizleri de
yapılmıştır.
Analizler sonucunda, kanatçıklı kanadın kanatçıksız kanada göre L/D değerinin %8.32
artttığı gözlemlenmiştir. Sonuç olarak TİHAS için önemli bir performans artışı elde
edilmiştir.
Anahtar Kelimeler: Eliptik Kanatçık, İdüklenmiş sürüklenme

ix
To my mother, father and grandfather…

x
ACKNOWLEDGEMENTS
I would like to thank all of my friends, family and Tübitak Uzay workers for their
support during my time writing this work. I certainly could not have done this without
all of the levels of help from everyone I know.
Specifically, I would like to thank my mother and father for their support and
encouragement for me before and during grad school. I would not be who I am today
without them.
Overall, I would like to thank my advisor Assoc. Prof. Dr. Dilek Funda KURTULUŞ,
for accepting me as a graduate student, certainly the greatest opportunity I have had.
Also, I would like to express my sincere gratitude to my supervisor for her guidance,
advices, motivation, continuous supports and encouragements throughout this study.
Lastly, I would like to thank my friends Okan İSPİR, A. Emre ÖRÜN and Samet
AKÇAY for all of their support and help.
xi
TABLE OF CONTENTS
ABSTRACT ................................................................................................................. v
ÖZ .............................................................................................................................. vii
ACKNOWLEDGEMENTS ......................................................................................... x
TABLE OF CONTENTS ............................................................................................ xi
LIST OF TABLES .................................................................................................... xiii
LIST OF FIGURES .................................................................................................. xiv
LIST OF SYMBOLS .............................................................................................. xviii
LIST OF ABBREVIATIONS ................................................................................... xix
CHAPTERS
1. INTRODUCTION ............................................................................................ 1
Wingtip .......................................................................................................... 4
Winglets .................................................................................................. 5
The Unmanned Air Vehicle ......................................................................... 10
Motivation .................................................................................................... 11
Objectives .................................................................................................... 11
2. LITERATURE SURVEY ............................................................................... 13
Brief History of Wingtips ............................................................................ 13
Studies about Wingtips ................................................................................ 15
3. METHODOLOGY .......................................................................................... 33
Winglet Design ............................................................................................ 33
Airfoil .................................................................................................... 37
Winglet Height and Span ...................................................................... 38
xii
Cant Angle ............................................................................................. 39
Taper Ratio and Sweep Angle ............................................................... 42
Twist and Toe Angle ............................................................................. 43
Numerical Analysis ...................................................................................... 45
Enclosure Volume ................................................................................. 45
Mesh ...................................................................................................... 46
Boundary Layer ............................................................................. 47
Edge Sizing ................................................................................... 49
Face Sizing .................................................................................... 50
Body Sizing ................................................................................... 51
Mesh Metric .................................................................................. 52
Mesh Refinement .......................................................................... 53
CFD ....................................................................................................... 55
4. RESULTS ........................................................................................................ 57
Best Winglet Design Analysis ..................................................................... 57
Comparison of Aerodynamic Forces ........................................................... 60
Flowfield Analysis ....................................................................................... 83
TİHAS Performance Evaluation .................................................................. 90
5. CONCLUSION ............................................................................................... 93
REFERENCES ........................................................................................................... 95
xiii
LIST OF TABLES
TABLES
Table 1.1 TİHAS specifications .................................................................................. 10
Table 3.1 Global mesh settings .................................................................................. 46
Table 3.2 Boundary mesh settings ............................................................................. 48
Table 3.3 Edge sizing settings .................................................................................... 49
Table 3.4 Face sizing ................................................................................................. 50
Table 3.5 Body sizing ................................................................................................. 51
Table 3.6 Skewness Quality table [56] ....................................................................... 52
Table 3.7 Mesh refinement values (clean wing)......................................................... 53
Table 3.8 Fluent Parameters...................................................................................... 55
Table 4.1 Comparison of the best case with other configurations in terms of
aerodynamic properties ............................................................................................. 73

xiv
LIST OF FIGURES
FIGURES
Figure 1.1 Classification of drag force (subsonic flow) .............................................. 1
Figure 1.2 Flow pattern due to pressure difference [1] ............................................... 2
Figure 1.3 Spanwise flow [3] ....................................................................................... 2
Figure 1.4 Vortex sheet [1] .......................................................................................... 3
Figure 1.5 Induced drag [4] ......................................................................................... 3
Figure 1.6 Wingtips [5] ................................................................................................ 4
Figure 1.7 Whitcomb’s winglet design configuration [6] ............................................ 5
Figure 1.8 Whitcomb winglet on DC-10 model during winglet studies in Langey 8-foot
transonic pressure tunnel [7] ....................................................................................... 5
Figure 1.9 Vari-Eze homebuilt aircraft is the first aircraft that fly with winglets [10] 6
Figure 1.10 Learjet 28/29, first jet aircraft that fly with winglet [7] ........................... 6
Figure 1.11Boeing Next-Generation 737 with winglet [11] ........................................ 7
Figure 1.12 Airbus A 350 XWB with circular winglet [12] ......................................... 7
Figure 1.13 Winglets on UAVs ..................................................................................... 8
Figure 1.14 Parameters that constitute winglets shape [16] ....................................... 9
Figure 1.15 TİHAS drawing without winglet ............................................................. 10
Figure 2.1 Somerville biplane with upward curved wingtips [20] ............................. 13
Figure 2.2 Airbus A340-400 with conventional winglet ............................................ 14
Figure 2.3 Winglet 1545 geometry [27] ..................................................................... 15
Figure 2.4 Final split winglet design [28] .................................................................. 16
Figure 2.5 Janus B sailplane [31] .............................................................................. 17
Figure 2.6 Toe and cant changing mechanism [33] ................................................... 18
Figure 2.7 Different wingtips model performed in wind tunnel [34] ......................... 19
Figure 2.8 1/76 and 1/27 KC-135 scale models in wind tunnel [34] ......................... 19
Figure 2.9 Dragon eye configuration with winglets [37] ........................................... 20
Figure 2.10 Different winglet configurations tested in wind tunnel [38] .................. 21
Figure 2.11 Model 55 at Calspan Boeing transonic wind tunnel [39]....................... 21
Figure 2.12 Different winglet designs [40] ................................................................ 22
xv
Figure 2.13 An unsymmetric wing-tip arrangement for a sweptback wing to initiate a
coordinated turn [41] ................................................................................................. 23
Figure 2.14 Winglet with different cant angle [42] ................................................... 24
Figure 2.15 Multiple winglet configurations [43] ..................................................... 25
Figure 2.16 Base wing, whitcomb winglet and blended winglet [16] ........................ 25
Figure 2.17 Base wing and wing with different cant angle [44] ................................ 26
Figure 2.18 Bird feather like winglet in wind tunnel [45] ......................................... 27
Figure 2.19 Bird feather like winglet [45] ................................................................. 28
Figure 2.20 Elliptical winglet in wind tunnel [46] ..................................................... 28
Figure 2.21 Streamline of elliptical winglet [47] ....................................................... 29
Figure 2.22 Blended winglet, wingtip fence, max winglet, spiroid winglet 1 and spiroid
winglet 2 [48] ............................................................................................................. 30
Figure 2.23 Optimized winglet shape in modeFRONTIER [48] ................................ 31
Figure 3.1 Winglet design parameters [16] ............................................................... 33
Figure 3.2 Blended winglet [49] ................................................................................ 34
Figure 3.3 Elliptical winglet [50] .............................................................................. 34
Figure 3.4 Winglet design with two ellipses .............................................................. 35
Figure 3.5 Design flow chart ..................................................................................... 36
Figure 3.6 MH 114 13.02% (mh114-il) airfoil [52]................................................... 37
Figure 3.7 Winglet root and tip airfoil ...................................................................... 37
Figure 3.8 Winglet height and span ........................................................................... 38
Figure 3.9 Winglet guide curves based on cant angles ............................................. 40
Figure 3.10 Winglet cant angles change according to rotation of ellipse ................. 41
Figure 3.11 Taper ratio, λ =0.2 ................................................................................. 42
Figure 3.12 Winglet sweep angle, Λ= 30° ................................................................. 42
Figure 3.13 Twist angle: -5° ...................................................................................... 44
Figure 3.14 Front view of toe in 5° and toe out angle 5° .......................................... 44
Figure 3.15 Top view of toe out 5° and toe in angle 5° ............................................ 44
Figure 3.16 Enclosure volume from CATIA .............................................................. 45
Figure 3.17 Mesh around the airfoil .......................................................................... 48
Figure 3.18 Edge sizing with bias factor ................................................................... 49
Figure 3.19 Face sizing of the wing ........................................................................... 50
xvi
Figure 3.20 Elements grow form the wing surface with 2mm and reach the first
maximum value at first body wall as 50 mm. Then they continue to grow and take the
maximum value at outer wall as 250 mm ................................................................... 51
Figure 3.21 Skewness [56] ......................................................................................... 52
Figure 3.22 Mesh convergence curve ........................................................................ 53
Figure 3.23 Different mesh sizes from course to fine ................................................ 54
Figure 4.1 Side and top view of winglet has the best L/D value. Cant angle 59.4°,
sweep angle 30°, taper ratio 0.2 and toe out angle 3° ............................................... 58
Figure 4.2 Front and isometric view of winglet has the best L/D value. Cant angle
59.4°, sweep angle 30°, taper ratio 0.2 and toe out angle 3° .................................... 59
Figure 4.3 CL Variations according to flow domain adjustment for different mesh
numbers ...................................................................................................................... 61
Figure 4.4 Cant and sweep angle effects on CL at different taper ratios ................... 63
Figure 4.5 Cant and sweep angle effects on cd at different taper ratios .................... 65
Figure 4.6 Cant and sweep angle effects on CL/CD at different taper ratios ........... 67
Figure 4.7 Cant and Sweep Angle Effects on Lift Force at Different Taper Ratios .. 68
Figure 4.8 Cant and Sweep Angle Effects on Drag Force at Different Taper Ratios 69
Figure 4.9 Toe angle effects on winglet having the best L/D among the 27 analysis 71
Figure 4.10 Twist angle effects on winglet having the best L/D among the 27 analysis
.................................................................................................................................... 72
Figure 4.11 CL/CD variations of clean wing and wing with winglet (the best case) at
different AOA (-5° to 20°) .......................................................................................... 74
Figure 4.12 Clean wing & best case CL-α, CD-α and drag polar curves ................... 75
Figure 4.13 Best case drag force components ........................................................... 77
Figure 4.14 Best case lift force components .............................................................. 77
Figure 4.15 Best case winglet drag force components .............................................. 78
Figure 4.16 Best case winglet lift force components ................................................. 78
Figure 4.17 Best case wing drag force components .................................................. 79
Figure 4.18 Best case wing lift force components ..................................................... 79
Figure 4.19 Best case total drag force distribution ................................................... 80
Figure 4.20 Best case total lift force distribution ...................................................... 80
Figure 4.21 Clean wing drag force components ........................................................ 81
xvii
Figure 4.22 Clean wing lift force components ........................................................... 81
Figure 4.23 Clean wing and best case total drag force components ......................... 82
Figure 4.24 Clean wing and best case total lift force components ............................ 82
Figure 4.25 Y+ Distribution on wing with winglet, the best case ............................. 83
Figure 4.26 Pressure contour on wing ...................................................................... 84
Figure 4.27 Pressure contour on the best case .......................................................... 84
Figure 4.28 Tip vortex on the wing ............................................................................ 85
Figure 4.29 Tip vortex on the best case ..................................................................... 85
Figure 4.30 Clean wing vorticity variation at the wake region at planes 0.5m, 1m, 1.5m
and 2m behind the wing ............................................................................................. 87
Figure 4.31 Best case vorticity variation at the wake region at planes 0.5 m, 1 m, 1.5m
and 2m behind the wing ............................................................................................. 87
Figure 4.32 Clean wing vorticity variation at the wake region behind the wing ...... 88
Figure 4.33 Best case vorticity variation on wake region behind the best case ........ 88
Figure 4.34 Clean wing vorticity variation on wingtip xz plane ............................... 89
Figure 4.35 Best case vorticity variation on winglet tip xz plane .............................. 89
Figure 4.36 TİHAS, final version of modified wing with winglet .............................. 90
Figure 4.37 CL, CD and CL/CD behavior of clean wing and the best case in flight
envelope...................................................................................................................... 92
xviii
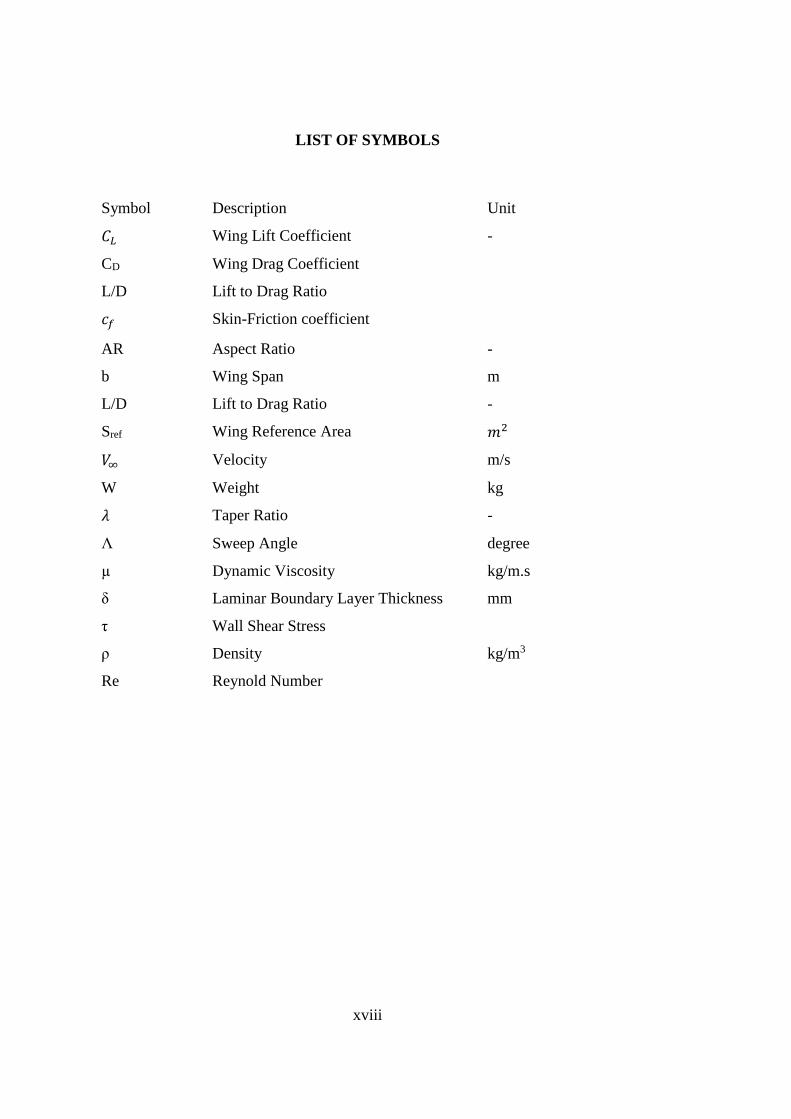
LIST OF SYMBOLS
Symbol Description Unit
𝐶𝐿 Wing Lift Coefficient -
CD Wing Drag Coefficient
L/D Lift to Drag Ratio
𝑐𝑓 Skin-Friction coefficient
AR Aspect Ratio -
b Wing Span m
L/D Lift to Drag Ratio -
Sref Wing Reference Area 𝑚2
𝑉∞ Velocity m/s
W Weight kg
𝜆 Taper Ratio -
Λ Sweep Angle degree
µ Dynamic Viscosity kg/m.s
δ Laminar Boundary Layer Thickness mm
τ Wall Shear Stress
ρ Density kg/m3
Re Reynold Number
xix
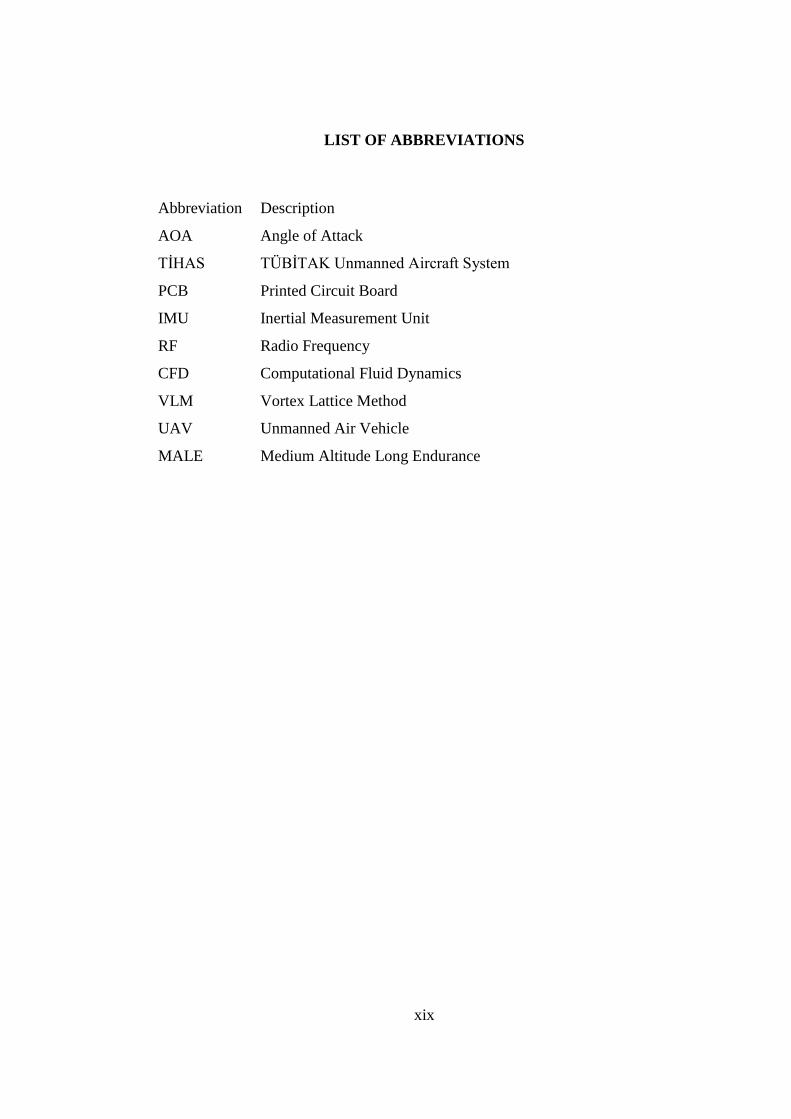
LIST OF ABBREVIATIONS
Abbreviation Description
AOA Angle of Attack
TİHAS TÜBİTAK Unmanned Aircraft System
PCB Printed Circuit Board
IMU Inertial Measurement Unit
RF Radio Frequency
CFD Computational Fluid Dynamics
VLM Vortex Lattice Method
UAV Unmanned Air Vehicle
MALE Medium Altitude Long Endurance
CHAPTER

xx
S
1
CHAPTER 1
INTRODUCTION
1. INTRODUCTION
Since the aviation industry begins, the development has been continuous about
aircrafts. Economics (fuel prices) and environmental concerns are some of the most
important factors force the aviation industry to develop. In this fashion, companies and
universities have done a lot of works at each field such as aerodynamics, structure,
propulsion, and control mechanism in order to enhance aircraft performance. One of
the studies to increase aerodynamic performance of aircrafts is wingtip use because
fuel consumption is related to drag reduction.
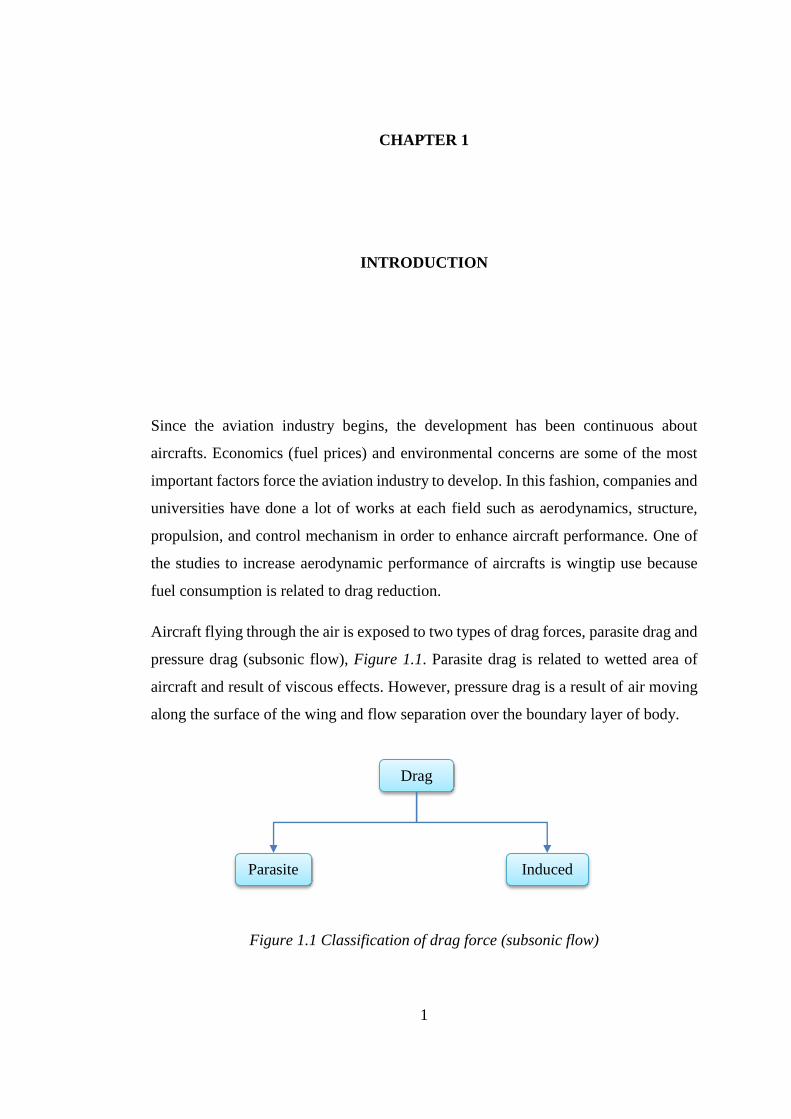
Aircraft flying through the air is exposed to two types of drag forces, parasite drag and
pressure drag (subsonic flow), Figure 1.1. Parasite drag is related to wetted area of
aircraft and result of viscous effects. However, pressure drag is a result of air moving
along the surface of the wing and flow separation over the boundary layer of body.
Figure 1.1 Classification of drag force (subsonic flow)
Drag
Parasite Induced
2
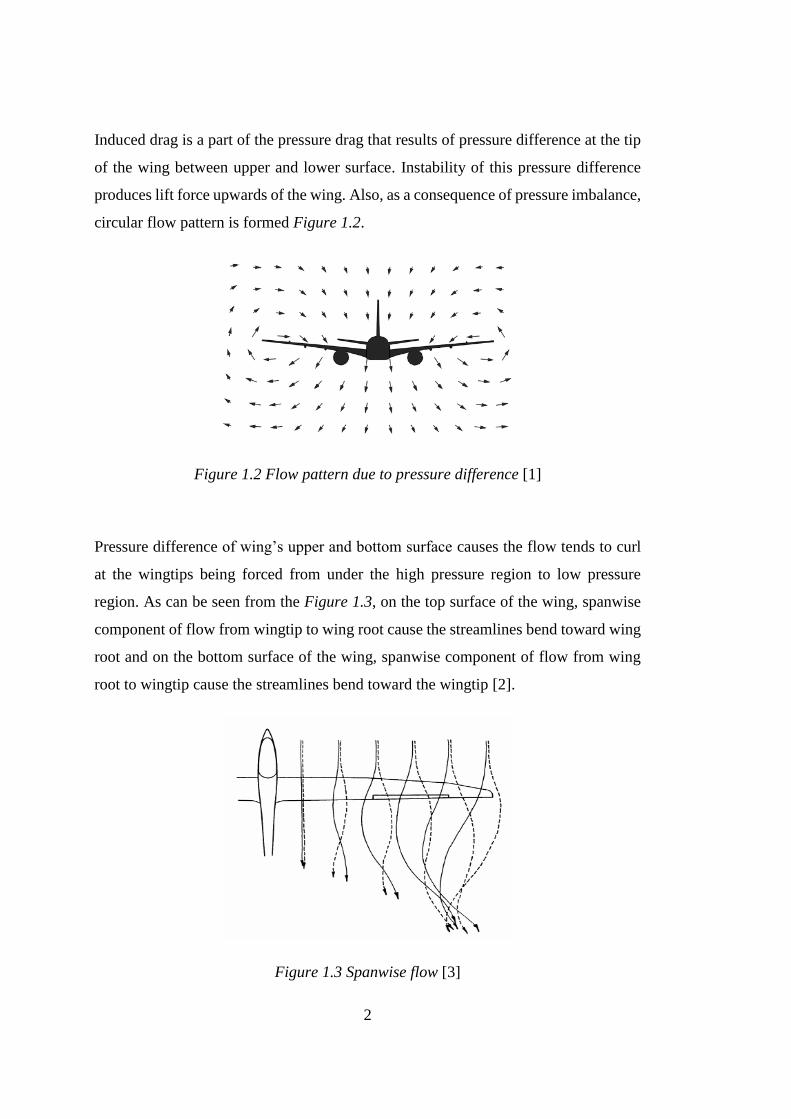
Induced drag is a part of the pressure drag that results of pressure difference at the tip
of the wing between upper and lower surface. Instability of this pressure difference
produces lift force upwards of the wing. Also, as a consequence of pressure imbalance,
circular flow pattern is formed Figure 1.2.
Figure 1.2 Flow pattern due to pressure difference [1]
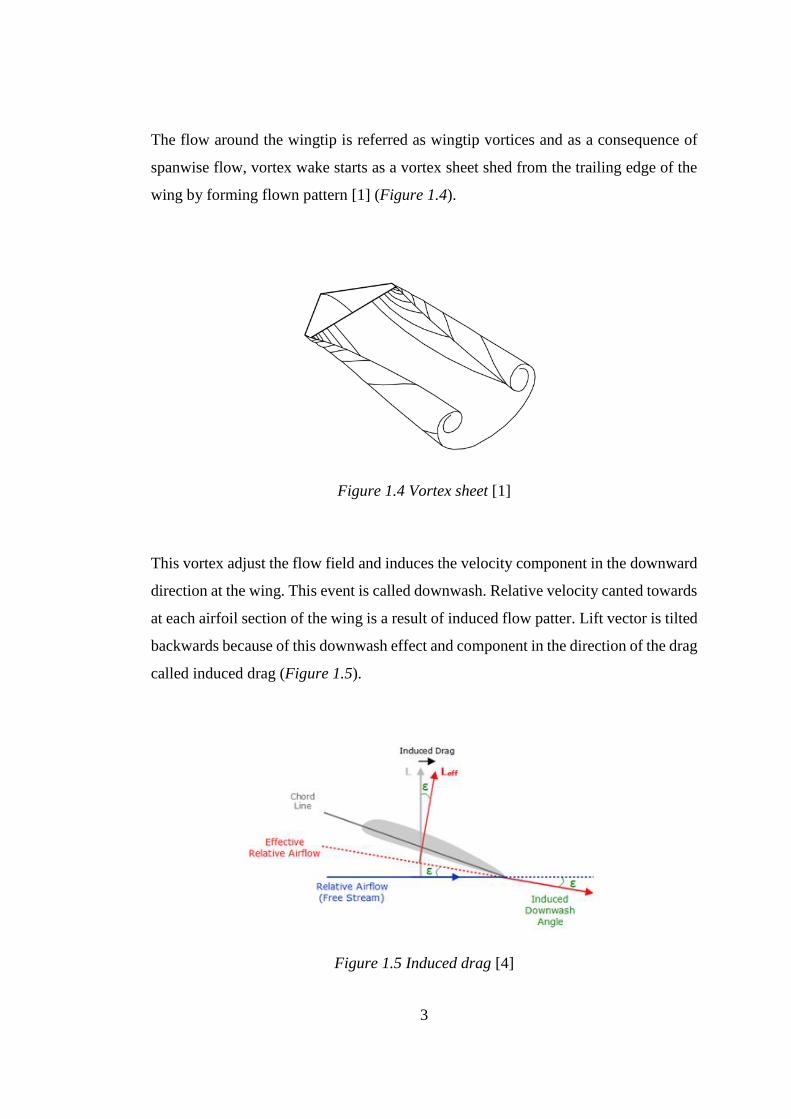
Pressure difference of wing’s upper and bottom surface causes the flow tends to curl
at the wingtips being forced from under the high pressure region to low pressure
region. As can be seen from the Figure 1.3, on the top surface of the wing, spanwise
component of flow from wingtip to wing root cause the streamlines bend toward wing
root and on the bottom surface of the wing, spanwise component of flow from wing
root to wingtip cause the streamlines bend toward the wingtip [2].
Figure 1.3 Spanwise flow [3]
3
The flow around the wingtip is referred as wingtip vortices and as a consequence of
spanwise flow, vortex wake starts as a vortex sheet shed from the trailing edge of the
wing by forming flown pattern [1] (Figure 1.4).
Figure 1.4 Vortex sheet [1]
This vortex adjust the flow field and induces the velocity component in the downward
direction at the wing. This event is called downwash. Relative velocity canted towards
at each airfoil section of the wing is a result of induced flow patter. Lift vector is tilted
backwards because of this downwash effect and component in the direction of the drag
called induced drag (Figure 1.5).
Figure 1.5 Induced drag [4]
4
Wingtip
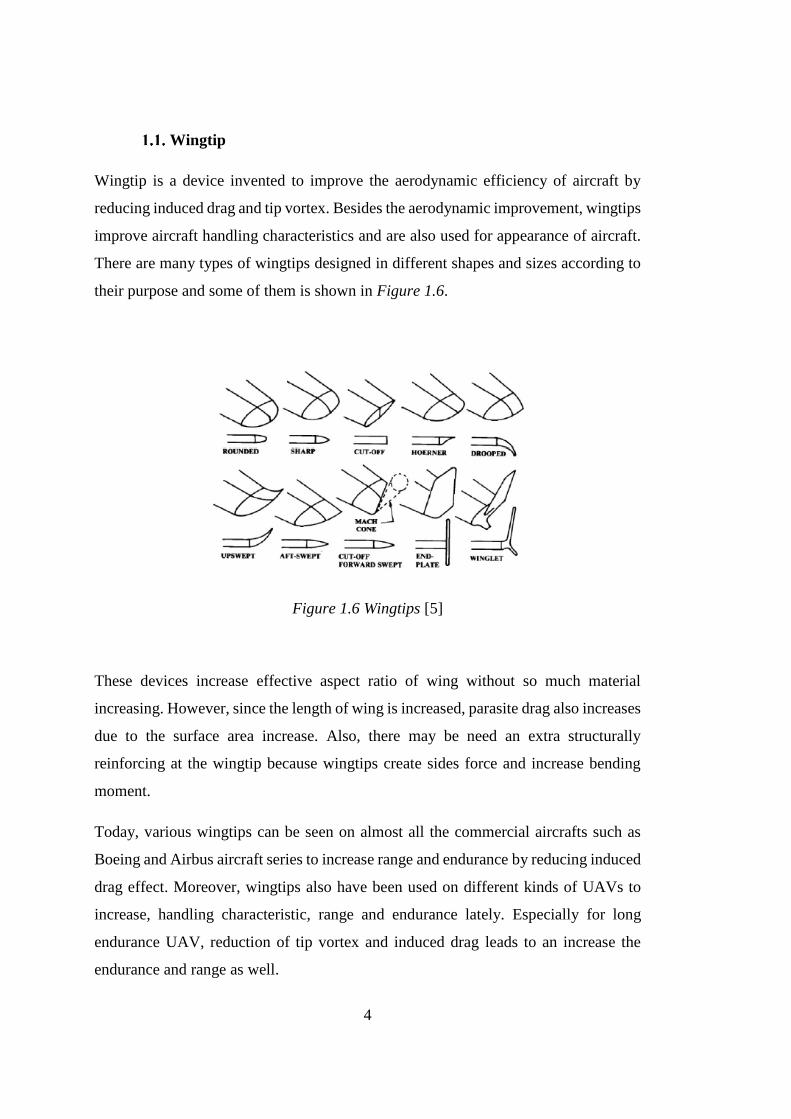
Wingtip is a device invented to improve the aerodynamic efficiency of aircraft by
reducing induced drag and tip vortex. Besides the aerodynamic improvement, wingtips
improve aircraft handling characteristics and are also used for appearance of aircraft.
There are many types of wingtips designed in different shapes and sizes according to
their purpose and some of them is shown in Figure 1.6.
Figure 1.6 Wingtips [5]
These devices increase effective aspect ratio of wing without so much material
increasing. However, since the length of wing is increased, parasite drag also increases
due to the surface area increase. Also, there may be need an extra structurally
reinforcing at the wingtip because wingtips create sides force and increase bending
moment.
Today, various wingtips can be seen on almost all the commercial aircrafts such as
Boeing and Airbus aircraft series to increase range and endurance by reducing induced
drag effect. Moreover, wingtips also have been used on different kinds of UAVs to
increase, handling characteristic, range and endurance lately. Especially for long
endurance UAV, reduction of tip vortex and induced drag leads to an increase the
endurance and range as well.
5
Winglets
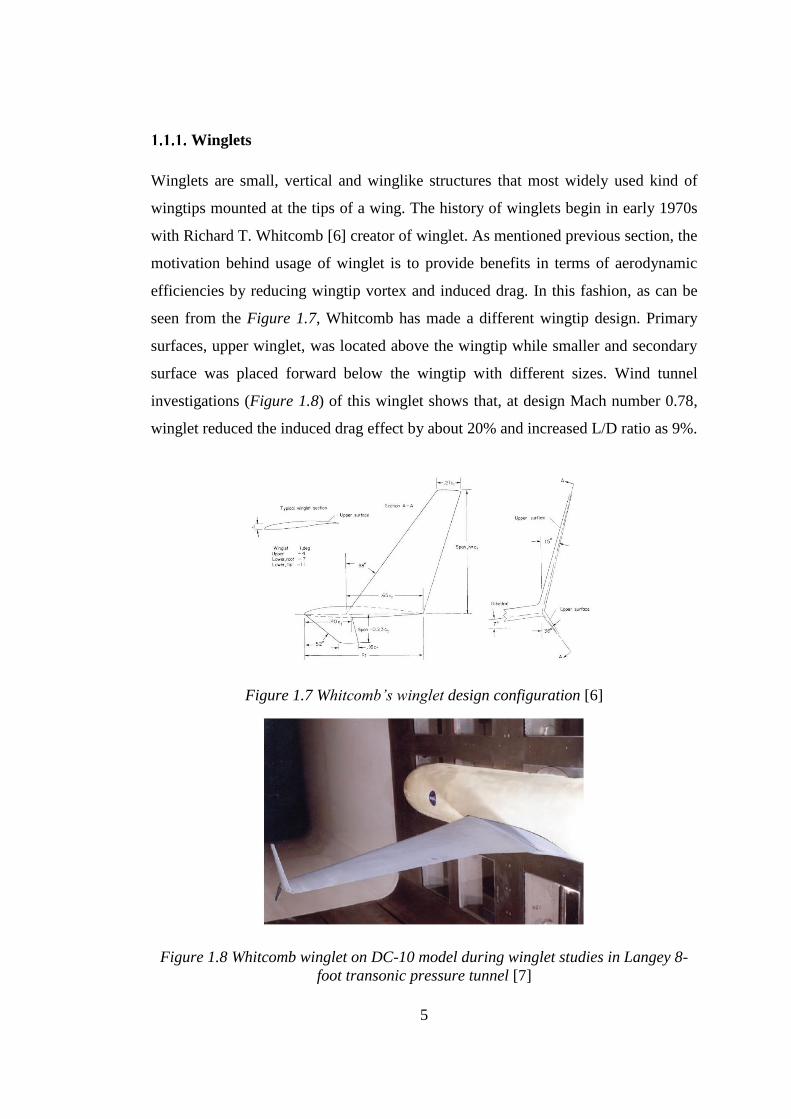
Winglets are small, vertical and winglike structures that most widely used kind of
wingtips mounted at the tips of a wing. The history of winglets begin in early 1970s
with Richard T. Whitcomb [6] creator of winglet. As mentioned previous section, the
motivation behind usage of winglet is to provide benefits in terms of aerodynamic
efficiencies by reducing wingtip vortex and induced drag. In this fashion, as can be
seen from the Figure 1.7, Whitcomb has made a different wingtip design. Primary
surfaces, upper winglet, was located above the wingtip while smaller and secondary
surface was placed forward below the wingtip with different sizes. Wind tunnel
investigations (Figure 1.8) of this winglet shows that, at design Mach number 0.78,
winglet reduced the induced drag effect by about 20% and increased L/D ratio as 9%.
Figure 1.7 Whitcomb’s winglet design configuration [6]
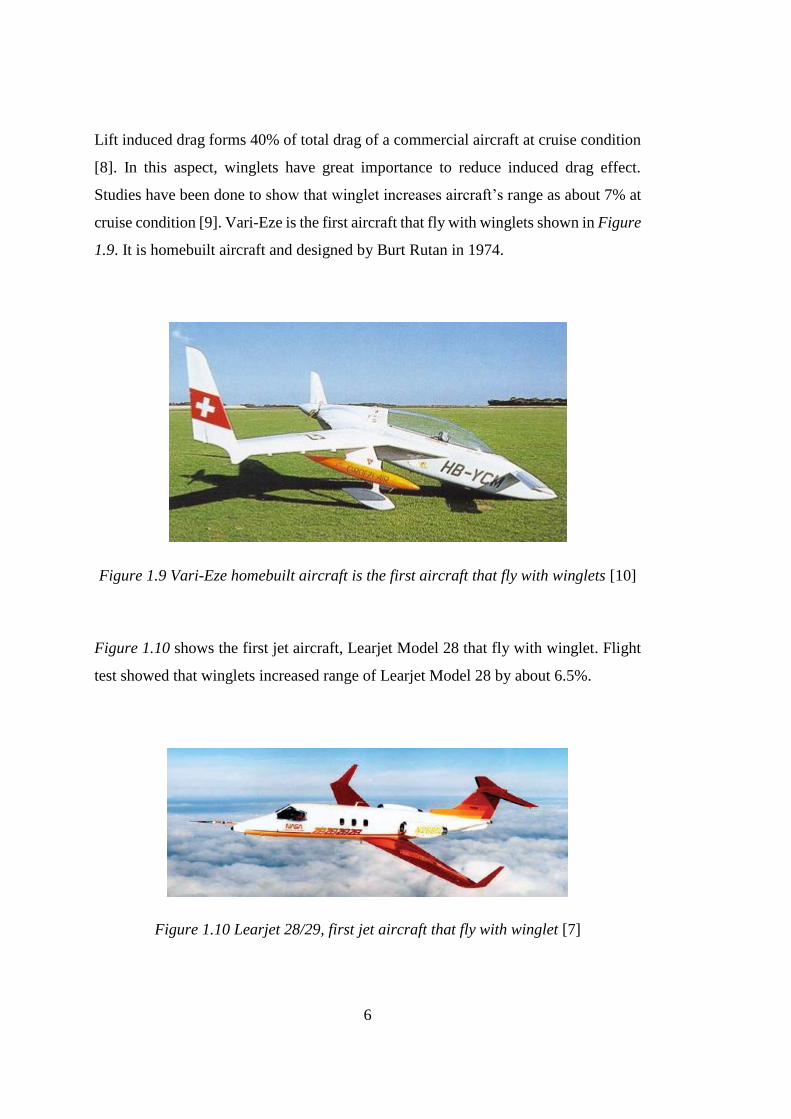
Figure 1.8 Whitcomb winglet on DC-10 model during winglet studies in Langey 8-
foot transonic pressure tunnel [7]
6
Lift induced drag forms 40% of total drag of a commercial aircraft at cruise condition
[8]. In this aspect, winglets have great importance to reduce induced drag effect.
Studies have been done to show that winglet increases aircraft’s range as about 7% at
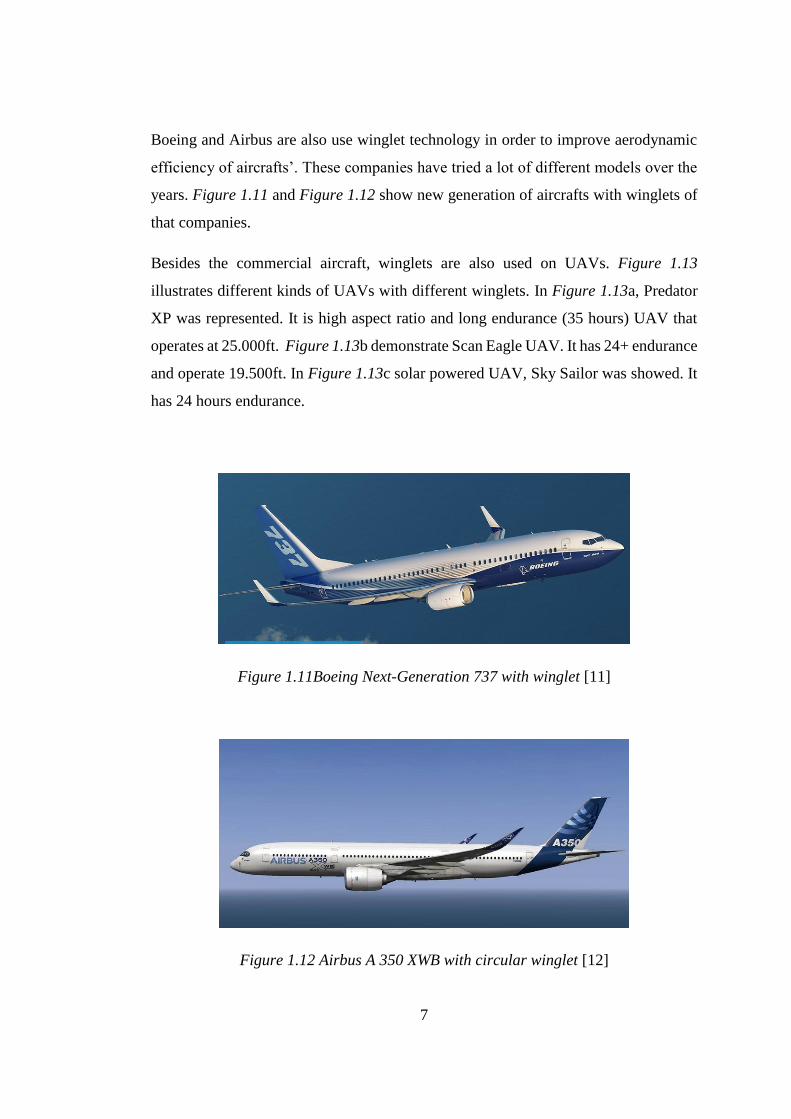
cruise condition [9]. Vari-Eze is the first aircraft that fly with winglets shown in Figure
1.9. It is homebuilt aircraft and designed by Burt Rutan in 1974.
Figure 1.9 Vari-Eze homebuilt aircraft is the first aircraft that fly with winglets [10]
Figure 1.10 shows the first jet aircraft, Learjet Model 28 that fly with winglet. Flight
test showed that winglets increased range of Learjet Model 28 by about 6.5%.
Figure 1.10 Learjet 28/29, first jet aircraft that fly with winglet [7]
7
Boeing and Airbus are also use winglet technology in order to improve aerodynamic
efficiency of aircrafts’. These companies have tried a lot of different models over the
years. Figure 1.11 and Figure 1.12 show new generation of aircrafts with winglets of
that companies.
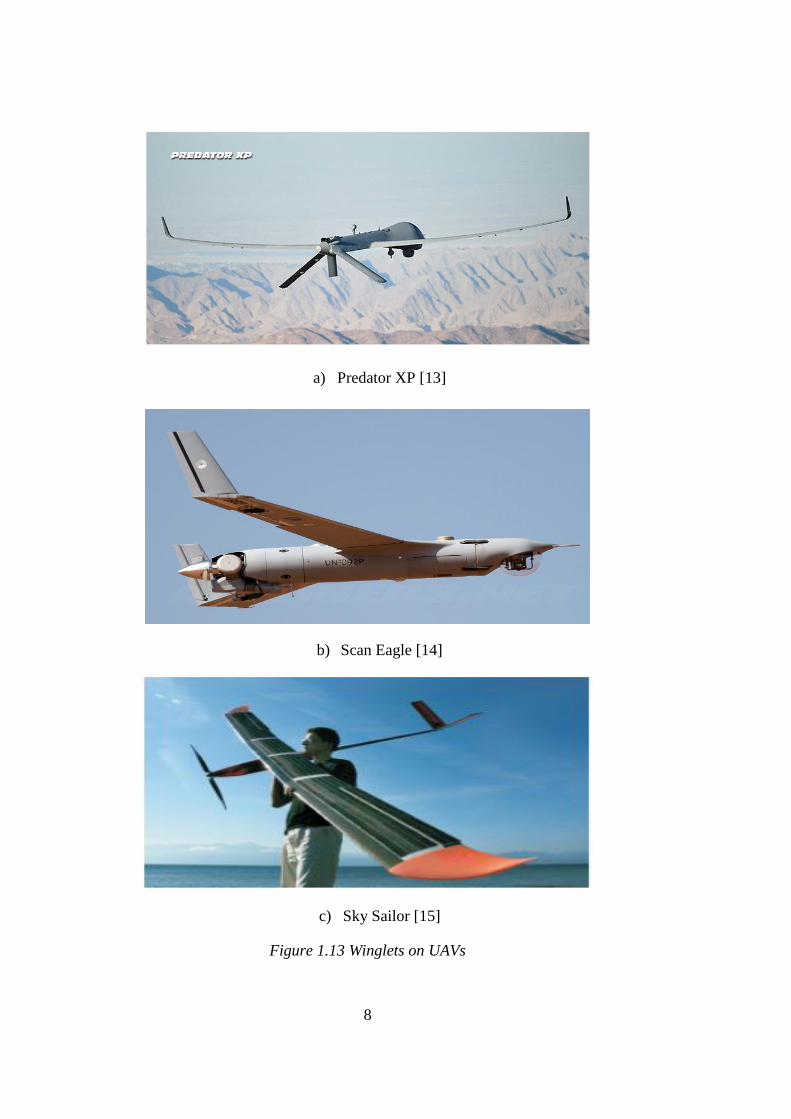
Besides the commercial aircraft, winglets are also used on UAVs. Figure 1.13
illustrates different kinds of UAVs with different winglets. In Figure 1.13a, Predator
XP was represented. It is high aspect ratio and long endurance (35 hours) UAV that
operates at 25.000ft. Figure 1.13b demonstrate Scan Eagle UAV. It has 24+ endurance
and operate 19.500ft. In Figure 1.13c solar powered UAV, Sky Sailor was showed. It
has 24 hours endurance.
Figure 1.11Boeing Next-Generation 737 with winglet [11]
Figure 1.12 Airbus A 350 XWB with circular winglet [12]
8
a) Predator XP [13]
b) Scan Eagle [14]
c) Sky Sailor [15]
Figure 1.13 Winglets on UAVs
9
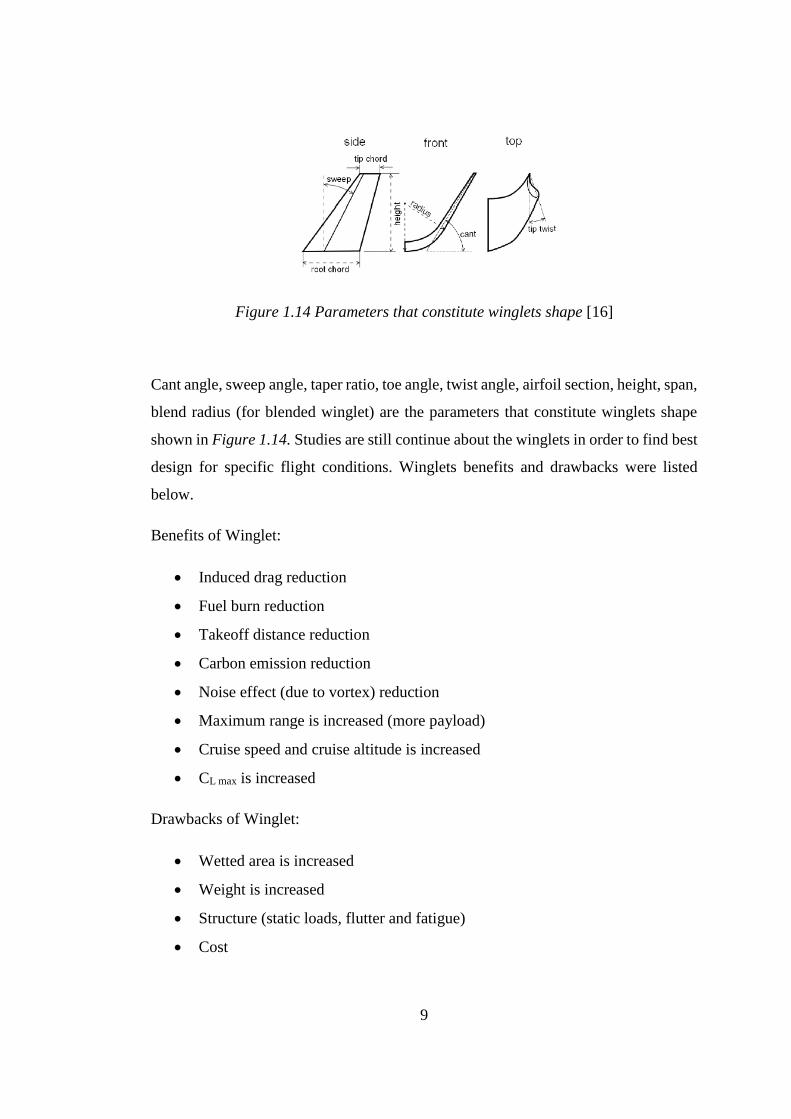
Figure 1.14 Parameters that constitute winglets shape [16]
Cant angle, sweep angle, taper ratio, toe angle, twist angle, airfoil section, height, span,
blend radius (for blended winglet) are the parameters that constitute winglets shape
shown in Figure 1.14. Studies are still continue about the winglets in order to find best
design for specific flight conditions. Winglets benefits and drawbacks were listed
below.
Benefits of Winglet:
Induced drag reduction
Fuel burn reduction
Takeoff distance reduction
Carbon emission reduction
Noise effect (due to vortex) reduction
Maximum range is increased (more payload)
Cruise speed and cruise altitude is increased
CL max is increased
Drawbacks of Winglet:
Wetted area is increased
Weight is increased
Structure (static loads, flutter and fatigue)
Cost
10
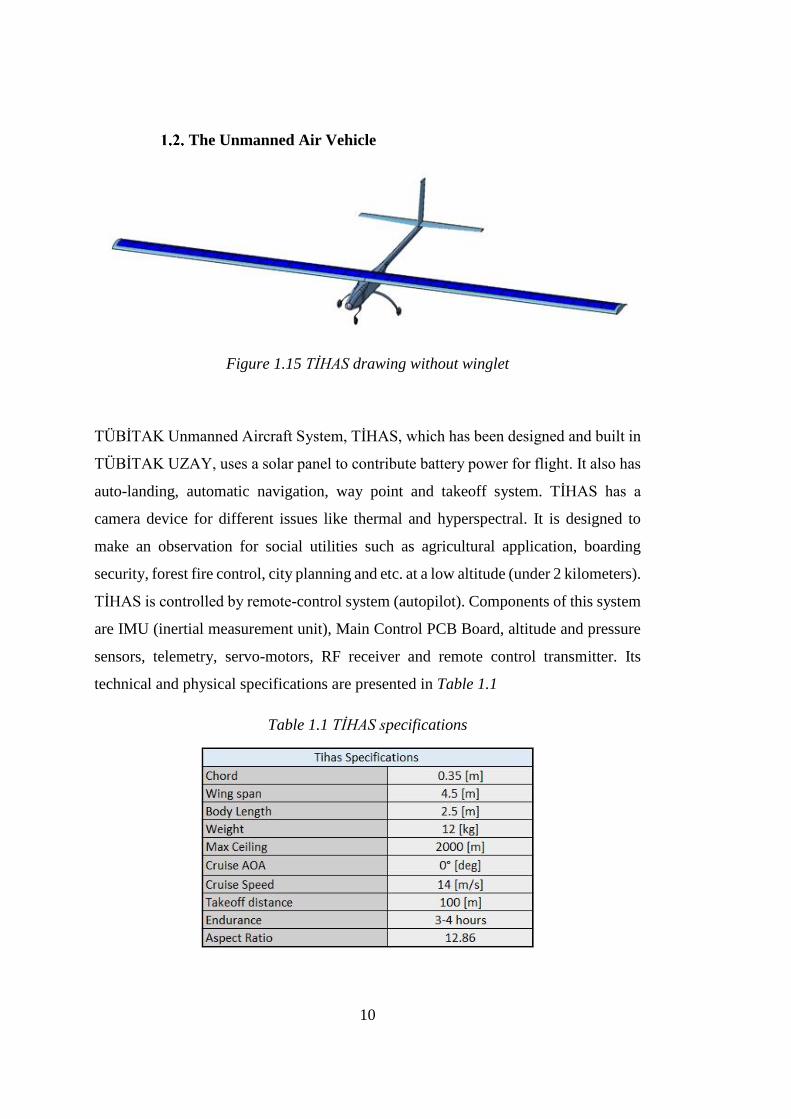
The Unmanned Air Vehicle
Figure 1.15 TİHAS drawing without winglet
TÜBİTAK Unmanned Aircraft System, TİHAS, which has been designed and built in
TÜBİTAK UZAY, uses a solar panel to contribute battery power for flight. It also has
auto-landing, automatic navigation, way point and takeoff system. TİHAS has a
camera device for different issues like thermal and hyperspectral. It is designed to
make an observation for social utilities such as agricultural application, boarding
security, forest fire control, city planning and etc. at a low altitude (under 2 kilometers).
TİHAS is controlled by remote-control system (autopilot). Components of this system
are IMU (inertial measurement unit), Main Control PCB Board, altitude and pressure
sensors, telemetry, servo-motors, RF receiver and remote control transmitter. Its
technical and physical specifications are presented in Table 1.1
Table 1.1 TİHAS specifications
11
Motivation
Winglets are small wing like structures at the wingtip used to enhance aerodynamic
efficiency of aircraft by decreasing the induced drag. Without adding great structural
stress and weight, winglets increase effective aspect ratio of a wing. Motivation of this
research is to explore efficient shapes of winglets by using multiple winglet parameters
for specific conditions of TİHAS. There are many researches about conventional
winglets and some for other types of winglets such as spiroid and blended. However,
there are few researches about elliptical winglets. Besides, while there are many
studies about the aerodynamic effects of winglets on large aircraft, there are little
works about Unmanned Air Vehicles (UAVs). Therefore, using various winglet
parameters, 39 different elliptical winglets were designed and analyzed at Reynolds
number 309507 to increase the aerodynamic efficiency of TİHAS. Aerodynamic
analyses of winglet were performed in ANSYS Fluent by using k-ω turbulence model.
It is important to make this research because there is no plenty of works about low
altitude UAVs about using multiple winglet parameters.
Objectives
This research has two objectives, finding best elliptical winglet design which has
highest L/D value according to design parameters and numerically performing a CFD
analysis on the base wing and wing with elliptical winglet at various AOA and
velocities. Hence, aerodynamic performance of TİHAS is enhanced. In design
approach, cant angle, sweep angle and taper ratio parameters are used in a triple
combination with each other (27 models). Then, toe and twist parameters are applied
to winglet separately which has best L/D values in the first 27 models. The analysis
were performed on rectangular wing of 2.25 m span and 0.350m chord and wing with
elliptical winglet 2.5 m span at low subsonic region. MH 114 airfoil was used both
wing and winglet. Aerodynamic characteristics such as CL, CD, and L/D were obtained
and compared.

12
13
CHAPTER 2
LITERATURE SURVEY
2. LITERATURE SURVEY
Brief History of Wingtips
The idea of using wingtip on aircraft was first put forward by, a British engineer,
Lanchester [17] towards the end of the 1800. According to his idea, using vertical
surfaces located at the wingtips can decrease the induced drag effects. He received the
first patent of this concept named as “wingtip” in 1897 [18]. Then, in 1910 United
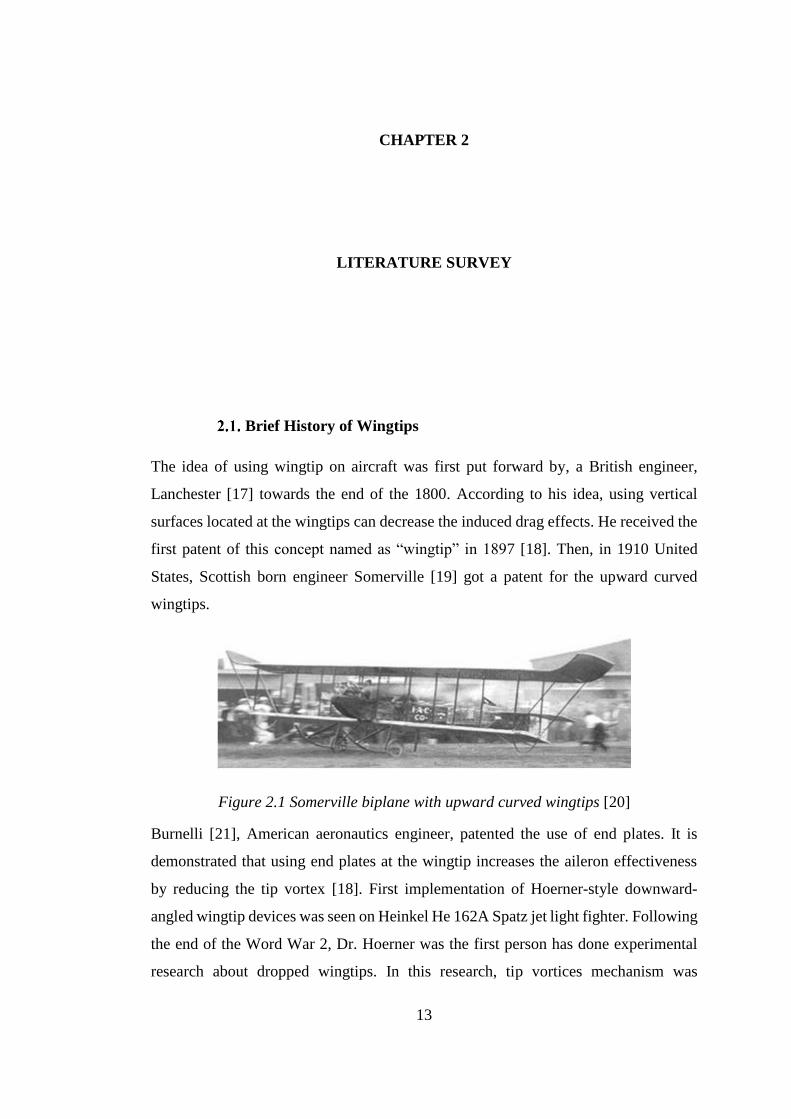
States, Scottish born engineer Somerville [19] got a patent for the upward curved
wingtips.
Figure 2.1 Somerville biplane with upward curved wingtips [20]
Burnelli [21], American aeronautics engineer, patented the use of end plates. It is
demonstrated that using end plates at the wingtip increases the aileron effectiveness
by reducing the tip vortex [18]. First implementation of Hoerner-style downward-
angled wingtip devices was seen on Heinkel He 162A Spatz jet light fighter. Following
the end of the Word War 2, Dr. Hoerner was the first person has done experimental
research about dropped wingtips. In this research, tip vortices mechanism was
14
investigated by doing experiments. Also, different wingtip shapes’ aerodynamic
characteristics (lift to drag ratio) are studied. Dropped wingtips was named as “Horner
tips” because of his honor. In that time, Horner type wingtips were used a lot because
of easy construction to wingtips and not increasing the aircraft manufacturing coast.
After that, in 1970s, Whitcomb [6], an aeronautical engineer at the NASA Langley
Research Centre, made researches about installation of small vertical fins on aircraft’s
wingtips. This small vertical extension is called as “winglet” by Whitcomb. This
winglet designs were tested in 1979-1980 using KC-135 Stratotanker aircraft at
Dryden Flight Research Center. Also, a Lockheed L-1011, McDonnell Douglas DC-
10 and Boeing KC-135A were used for tests. According to wind tunnel test results,
winglet increased the L/D ratio roughly 9% and enhanced the aircraft’s range as 7% at
cruise condition [6], [22]. Then, Peter et al. [23] showed that using single winglet on
biplanes increased the endurance as 13%. Towards the end of 1980s, Peter [24] was
the first person researching and applying winglet to a competition sailplanes and had
successful results [18]. In the early 1990s, Gratzer [25] patented spiroid and blended
winglet. Spiroid winglet improved by Aviation Partners and first seen on a Gulfstream
2. In 1997, Boeing patented the controllable winglet concept [26]. There are also a few
types of wingtips (elliptical, scimitar, raked, wingtip fence etc.) other mentioned above
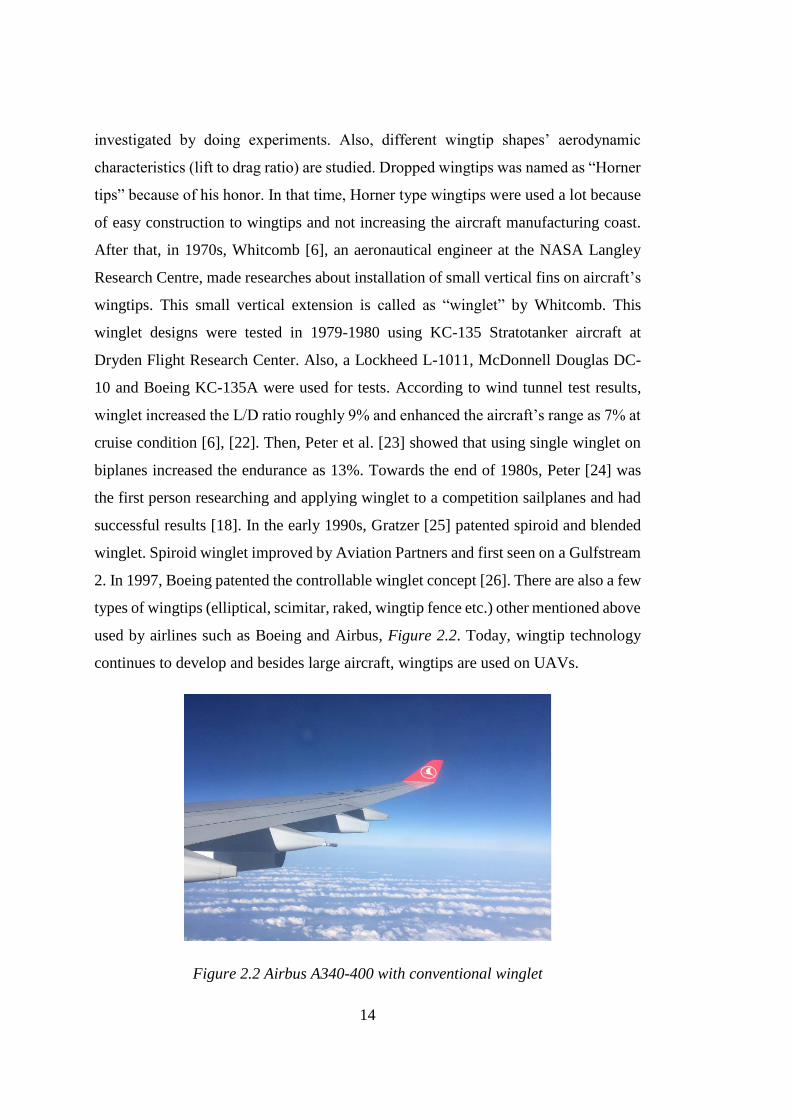
used by airlines such as Boeing and Airbus, Figure 2.2. Today, wingtip technology
continues to develop and besides large aircraft, wingtips are used on UAVs.
Figure 2.2 Airbus A340-400 with conventional winglet
15
Studies about Wingtips
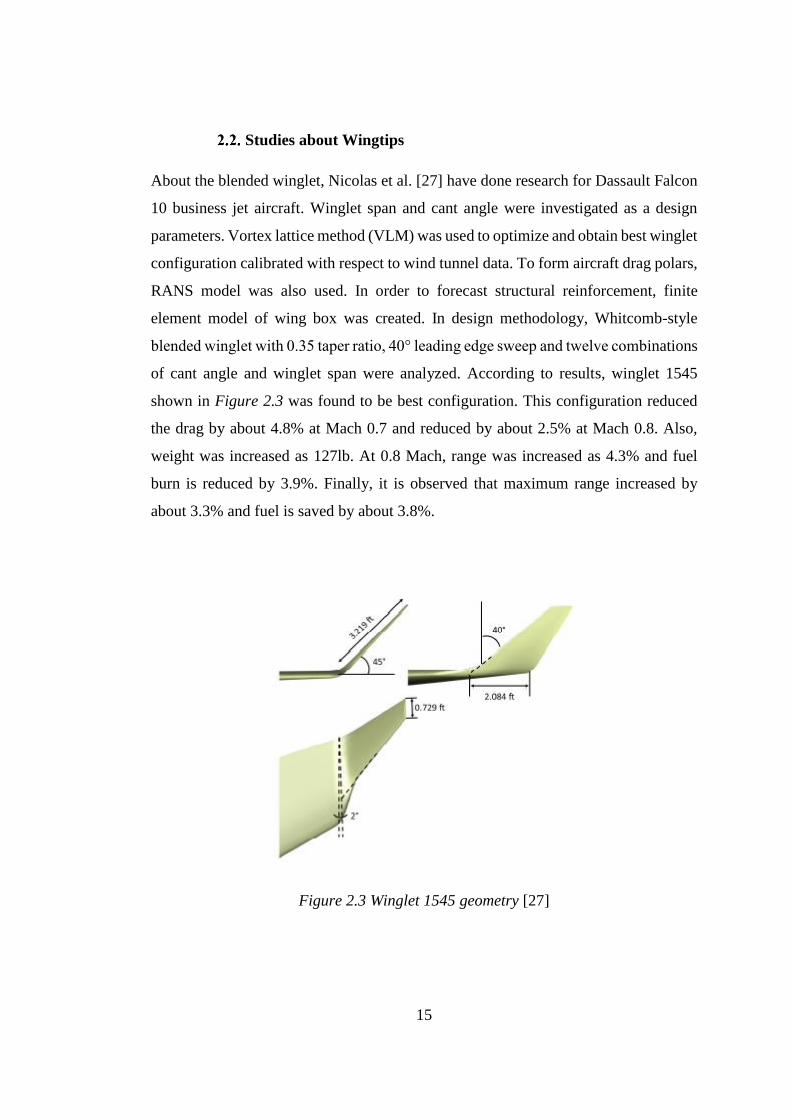
About the blended winglet, Nicolas et al. [27] have done research for Dassault Falcon
10 business jet aircraft. Winglet span and cant angle were investigated as a design
parameters. Vortex lattice method (VLM) was used to optimize and obtain best winglet
configuration calibrated with respect to wind tunnel data. To form aircraft drag polars,
RANS model was also used. In order to forecast structural reinforcement, finite
element model of wing box was created. In design methodology, Whitcomb-style
blended winglet with 0.35 taper ratio, 40° leading edge sweep and twelve combinations
of cant angle and winglet span were analyzed. According to results, winglet 1545
shown in Figure 2.3 was found to be best configuration. This configuration reduced
the drag by about 4.8% at Mach 0.7 and reduced by about 2.5% at Mach 0.8. Also,
weight was increased as 127lb. At 0.8 Mach, range was increased as 4.3% and fuel
burn is reduced by 3.9%. Finally, it is observed that maximum range increased by
about 3.3% and fuel is saved by about 3.8%.
Figure 2.3 Winglet 1545 geometry [27]
16
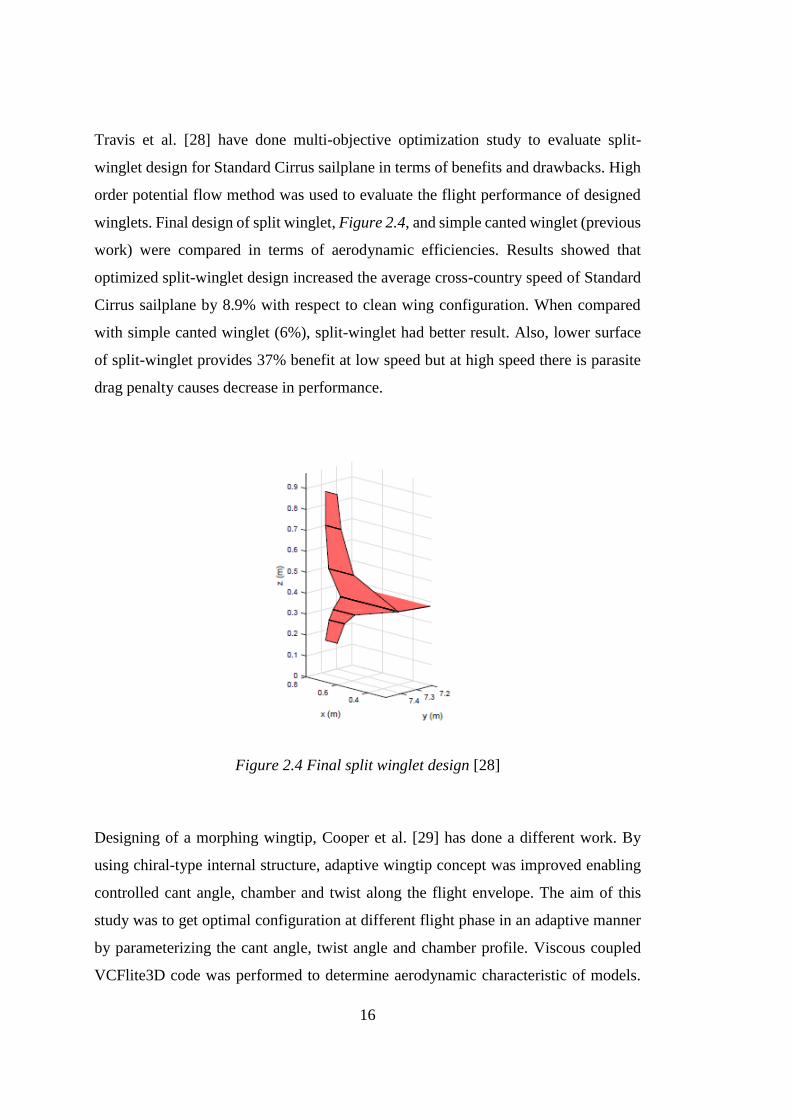
Travis et al. [28] have done multi-objective optimization study to evaluate split-
winglet design for Standard Cirrus sailplane in terms of benefits and drawbacks. High
order potential flow method was used to evaluate the flight performance of designed
winglets. Final design of split winglet, Figure 2.4, and simple canted winglet (previous
work) were compared in terms of aerodynamic efficiencies. Results showed that
optimized split-winglet design increased the average cross-country speed of Standard
Cirrus sailplane by 8.9% with respect to clean wing configuration. When compared
with simple canted winglet (6%), split-winglet had better result. Also, lower surface
of split-winglet provides 37% benefit at low speed but at high speed there is parasite
drag penalty causes decrease in performance.
Figure 2.4 Final split winglet design [28]
Designing of a morphing wingtip, Cooper et al. [29] has done a different work. By
using chiral-type internal structure, adaptive wingtip concept was improved enabling
controlled cant angle, chamber and twist along the flight envelope. The aim of this
study was to get optimal configuration at different flight phase in an adaptive manner
by parameterizing the cant angle, twist angle and chamber profile. Viscous coupled
VCFlite3D code was performed to determine aerodynamic characteristic of models.
17
Also it was studied that how chiral structure ease the required shape adjustment in
terms of cant, twist and chamber. Results showed that, using the morphing wingtip,
2% fuel reduction is provided.
Shahriar et al. [30] have done a numerical optimization study on winglet. They
interested in aero structural optimization of wing with winglets. Winglet up, winglet
down and raked wingtip designs were studied and compared to optimized planar wings
of same span. Boeing 737-900 wing with the RAE 2822 supercritical airfoil was used
as a baseline wing geometry. They concluded that winglet down configuration was the
most competitive design and it had drag improvement approximately 2%. About the
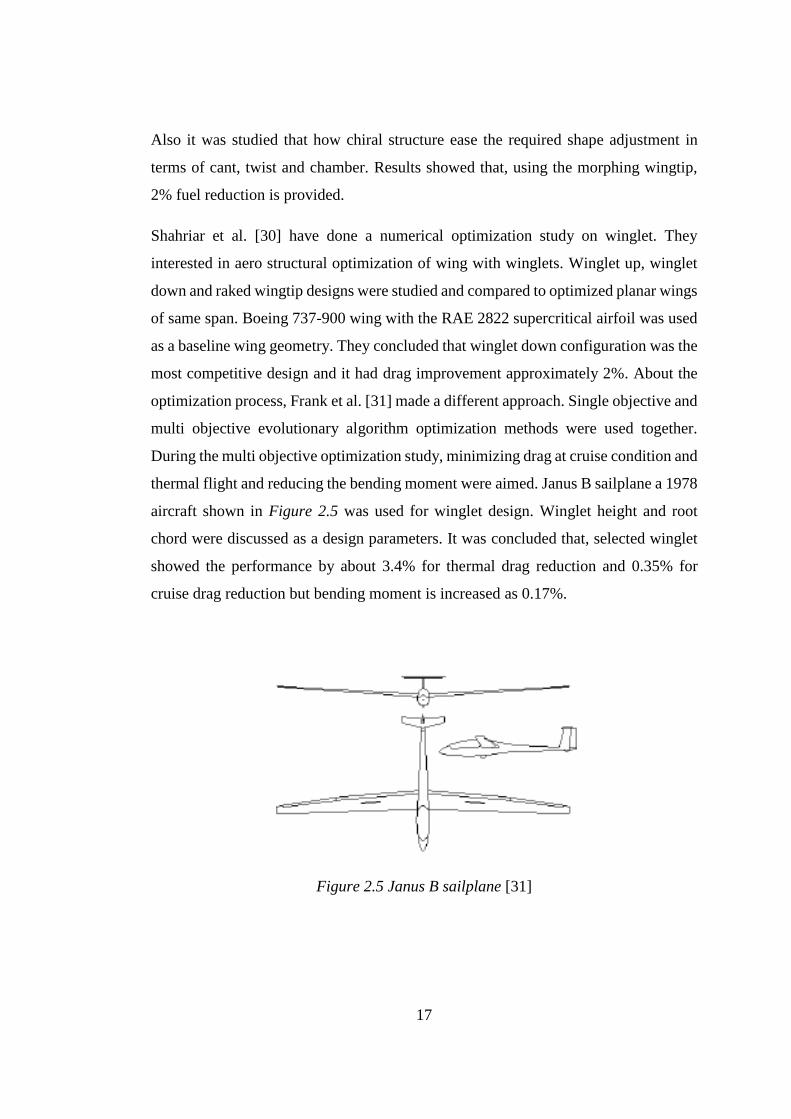
optimization process, Frank et al. [31] made a different approach. Single objective and
multi objective evolutionary algorithm optimization methods were used together.
During the multi objective optimization study, minimizing drag at cruise condition and
thermal flight and reducing the bending moment were aimed. Janus B sailplane a 1978
aircraft shown in Figure 2.5 was used for winglet design. Winglet height and root
chord were discussed as a design parameters. It was concluded that, selected winglet
showed the performance by about 3.4% for thermal drag reduction and 0.35% for
cruise drag reduction but bending moment is increased as 0.17%.
Figure 2.5 Janus B sailplane [31]
18
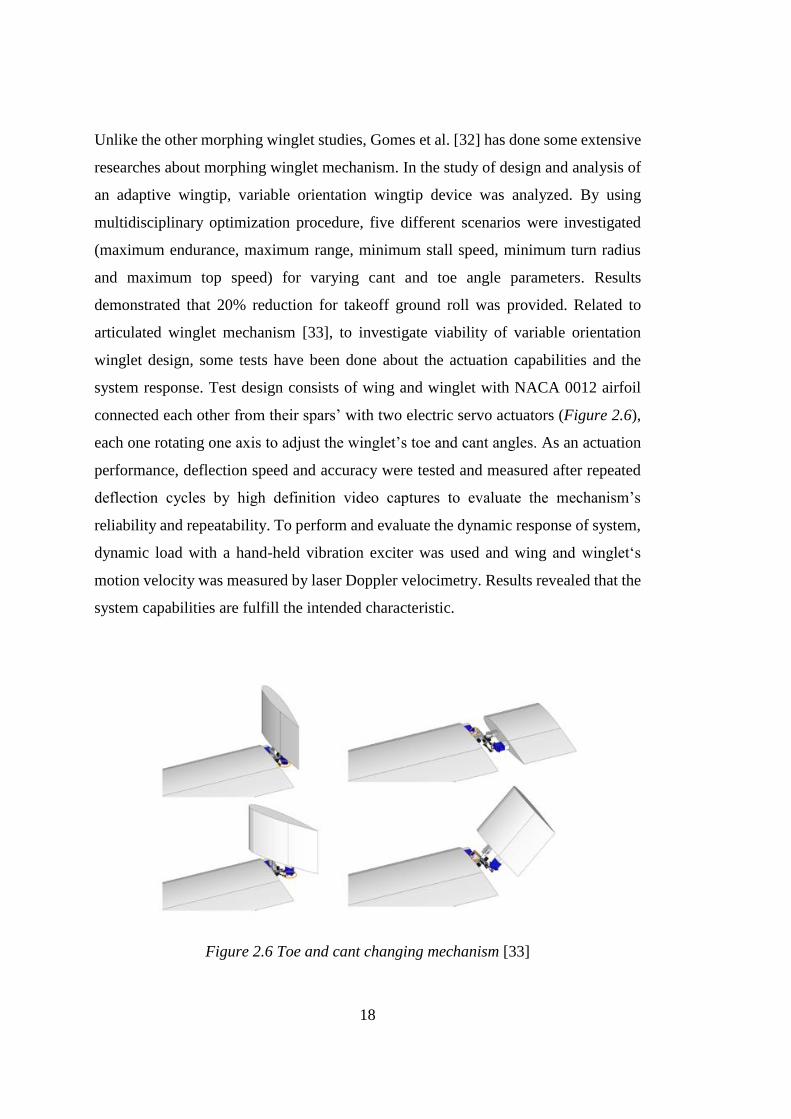
Unlike the other morphing winglet studies, Gomes et al. [32] has done some extensive
researches about morphing winglet mechanism. In the study of design and analysis of
an adaptive wingtip, variable orientation wingtip device was analyzed. By using
multidisciplinary optimization procedure, five different scenarios were investigated
(maximum endurance, maximum range, minimum stall speed, minimum turn radius
and maximum top speed) for varying cant and toe angle parameters. Results
demonstrated that 20% reduction for takeoff ground roll was provided. Related to
articulated winglet mechanism [33], to investigate viability of variable orientation
winglet design, some tests have been done about the actuation capabilities and the
system response. Test design consists of wing and winglet with NACA 0012 airfoil
connected each other from their spars’ with two electric servo actuators (Figure 2.6),
each one rotating one axis to adjust the winglet’s toe and cant angles. As an actuation
performance, deflection speed and accuracy were tested and measured after repeated
deflection cycles by high definition video captures to evaluate the mechanism’s
reliability and repeatability. To perform and evaluate the dynamic response of system,
dynamic load with a hand-held vibration exciter was used and wing and winglet‘s
motion velocity was measured by laser Doppler velocimetry. Results revealed that the
system capabilities are fulfill the intended characteristic.
Figure 2.6 Toe and cant changing mechanism [33]
19
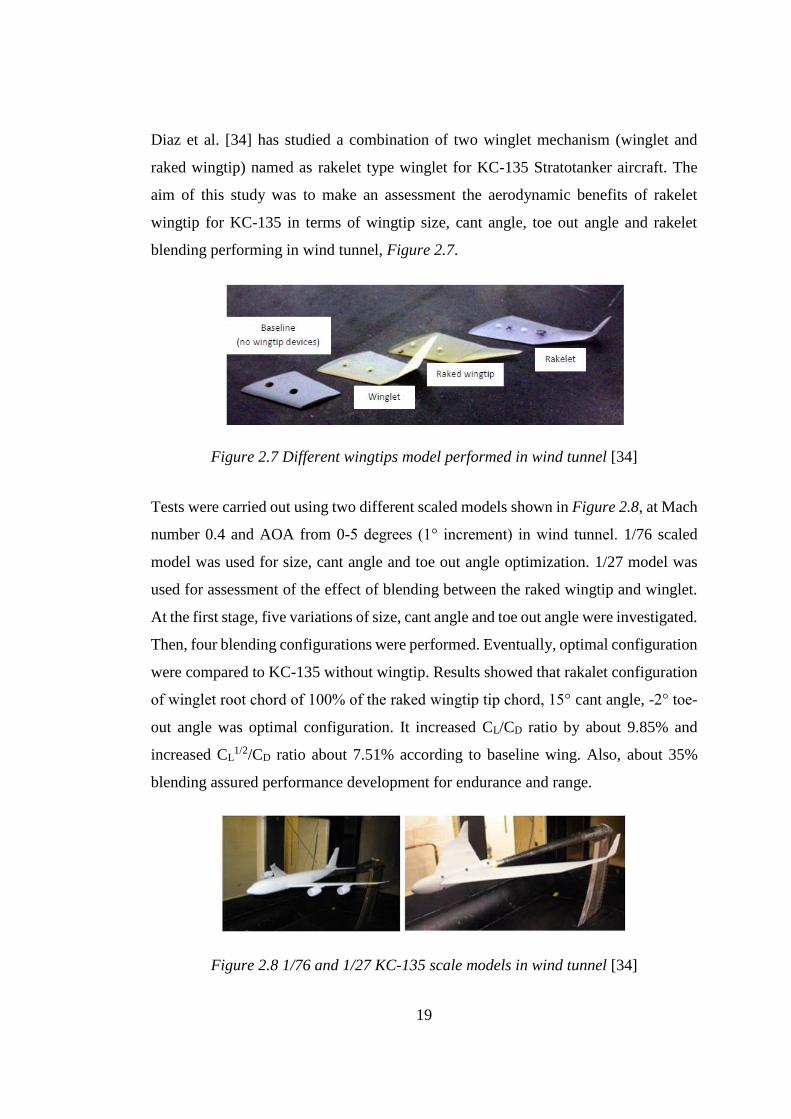
Diaz et al. [34] has studied a combination of two winglet mechanism (winglet and
raked wingtip) named as rakelet type winglet for KC-135 Stratotanker aircraft. The
aim of this study was to make an assessment the aerodynamic benefits of rakelet
wingtip for KC-135 in terms of wingtip size, cant angle, toe out angle and rakelet
blending performing in wind tunnel, Figure 2.7.
Figure 2.7 Different wingtips model performed in wind tunnel [34]
Tests were carried out using two different scaled models shown in Figure 2.8, at Mach
number 0.4 and AOA from 0-5 degrees (1° increment) in wind tunnel. 1/76 scaled
model was used for size, cant angle and toe out angle optimization. 1/27 model was
used for assessment of the effect of blending between the raked wingtip and winglet.
At the first stage, five variations of size, cant angle and toe out angle were investigated.
Then, four blending configurations were performed. Eventually, optimal configuration
were compared to KC-135 without wingtip. Results showed that rakalet configuration
of winglet root chord of 100% of the raked wingtip tip chord, 15° cant angle, -2° toe-
out angle was optimal configuration. It increased CL/CD ratio by about 9.85% and
increased CL1/2/CD ratio about 7.51% according to baseline wing. Also, about 35%
blending assured performance development for endurance and range.
Figure 2.8 1/76 and 1/27 KC-135 scale models in wind tunnel [34]
20
About the comparison of raked wingtip and blended winglet in terms of investigation
of vortices in the wake region, Ryan et al. [35] Hayashibara have done a research. At
0.85 Mach, these two configurations were studied by using Spalart–Allmaras
turbulence model in fluent and results compared to clean wing. Results demonstrated
that wing with raked wingtip had lowest vorticity vector in vortex wake region and
reduced induced drag more than blended winglet. Also, Joram et al. [36] have done a
research about comparison of wingletted wing and C wing with planar wing related to
drag characteristic. Results revealed that wingletted wing has great performance than
C wing.
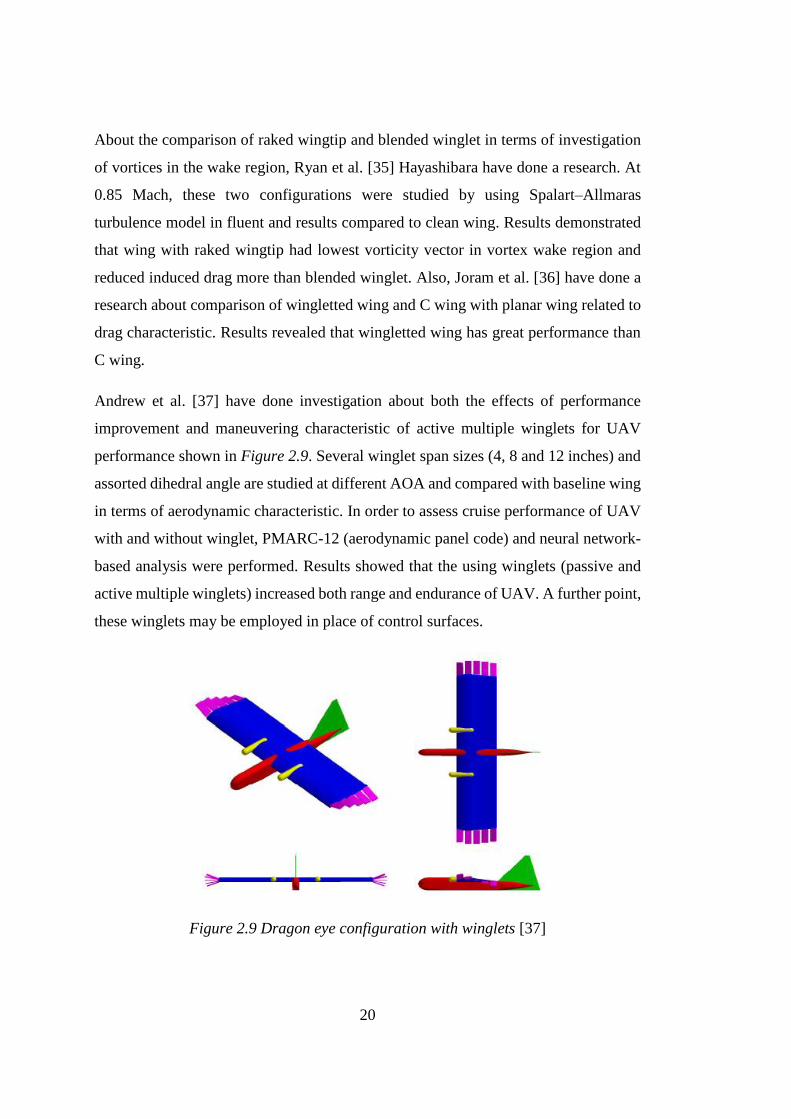
Andrew et al. [37] have done investigation about both the effects of performance
improvement and maneuvering characteristic of active multiple winglets for UAV
performance shown in Figure 2.9. Several winglet span sizes (4, 8 and 12 inches) and
assorted dihedral angle are studied at different AOA and compared with baseline wing
in terms of aerodynamic characteristic. In order to assess cruise performance of UAV
with and without winglet, PMARC-12 (aerodynamic panel code) and neural network-
based analysis were performed. Results showed that the using winglets (passive and
active multiple winglets) increased both range and endurance of UAV. A further point,
these winglets may be employed in place of control surfaces.
Figure 2.9 Dragon eye configuration with winglets [37]
21
David et al. [38] have done different research about winglets. As can be seen from the
Figure 2.10, three different winglet configurations (1 inch up, 3 inches up and 1 inch
down) were studied with and without ground effect (2 inches, 4 inches and 6 inches
height) at various AOA and three different Reynolds number (Re 1:189.310, Re 2:
231.705, Re 3: 299.202) in wind tunnel. Results showed that 3 inches up winglet has
greatest benefit in terms of aerodynamic features. Also 2 inches height showed better
values in terms of ground effect.
Figure 2.10 Different winglet configurations tested in wind tunnel [38]
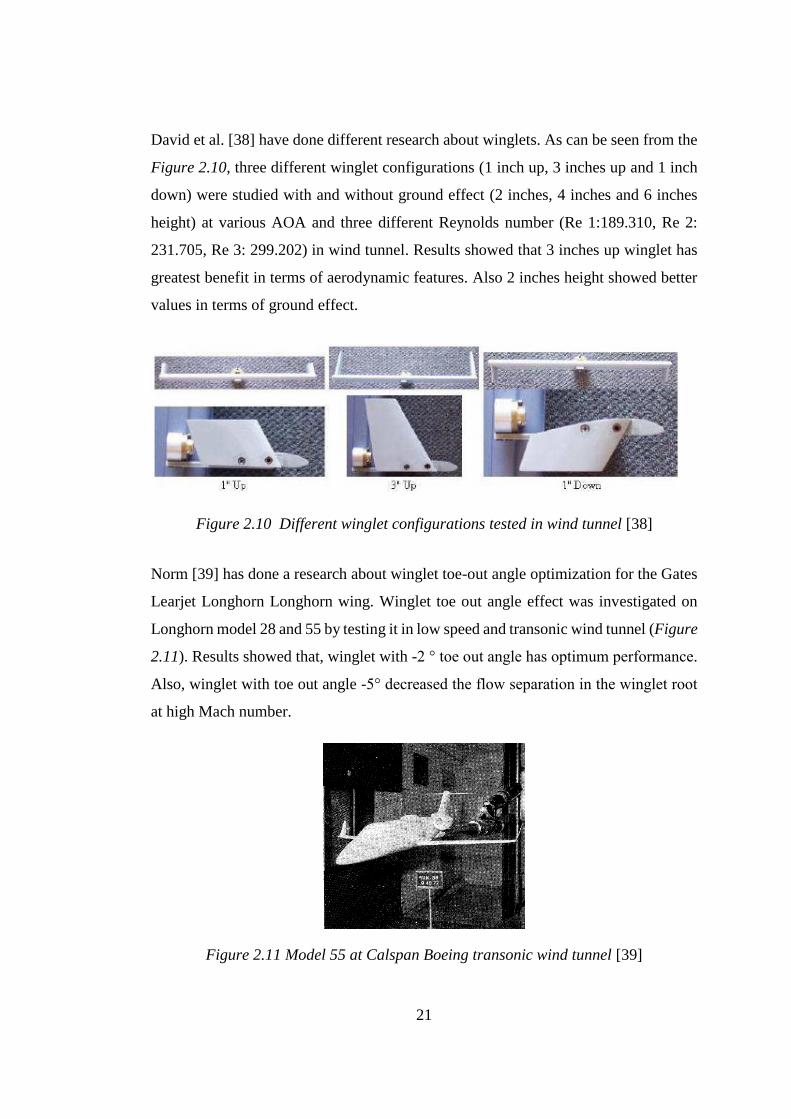
Norm [39] has done a research about winglet toe-out angle optimization for the Gates
Learjet Longhorn Longhorn wing. Winglet toe out angle effect was investigated on
Longhorn model 28 and 55 by testing it in low speed and transonic wind tunnel (Figure
2.11). Results showed that, winglet with -2 ° toe out angle has optimum performance.
Also, winglet with toe out angle -5° decreased the flow separation in the winglet root
at high Mach number.
Figure 2.11 Model 55 at Calspan Boeing transonic wind tunnel [39]
22
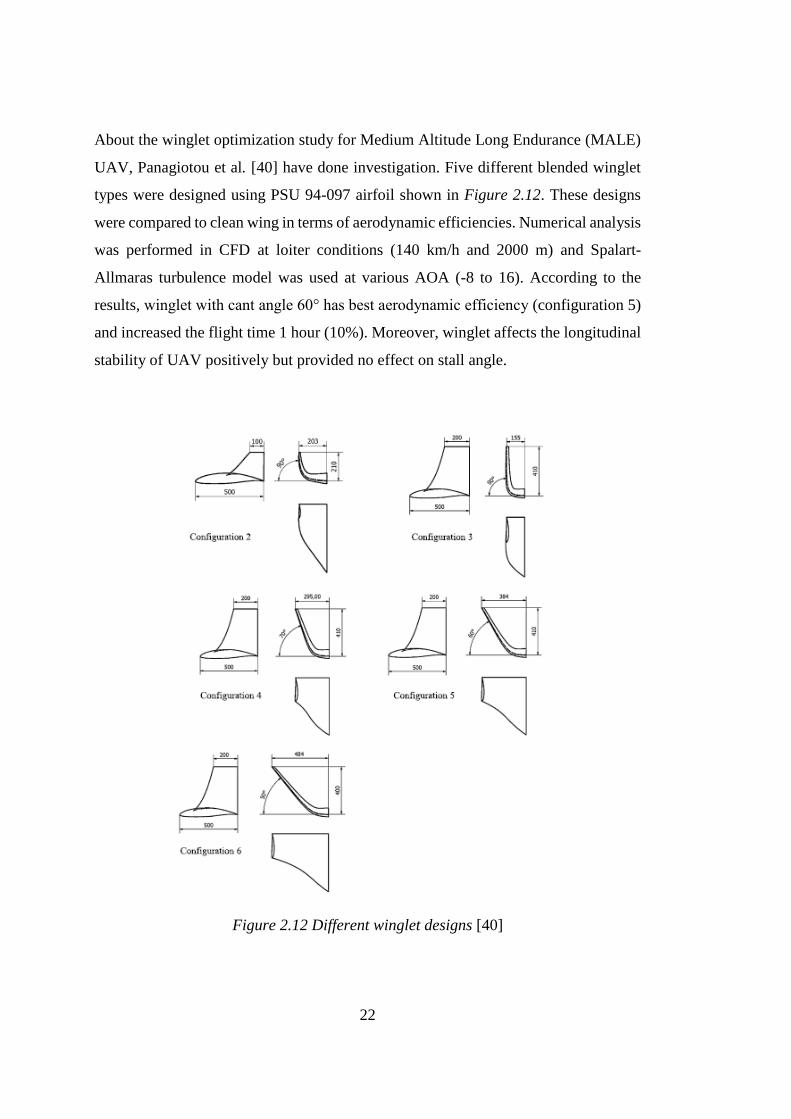
About the winglet optimization study for Medium Altitude Long Endurance (MALE)
UAV, Panagiotou et al. [40] have done investigation. Five different blended winglet
types were designed using PSU 94-097 airfoil shown in Figure 2.12. These designs
were compared to clean wing in terms of aerodynamic efficiencies. Numerical analysis
was performed in CFD at loiter conditions (140 km/h and 2000 m) and Spalart-
Allmaras turbulence model was used at various AOA (-8 to 16). According to the
results, winglet with cant angle 60° has best aerodynamic efficiency (configuration 5)
and increased the flight time 1 hour (10%). Moreover, winglet affects the longitudinal
stability of UAV positively but provided no effect on stall angle.
Figure 2.12 Different winglet designs [40]
23
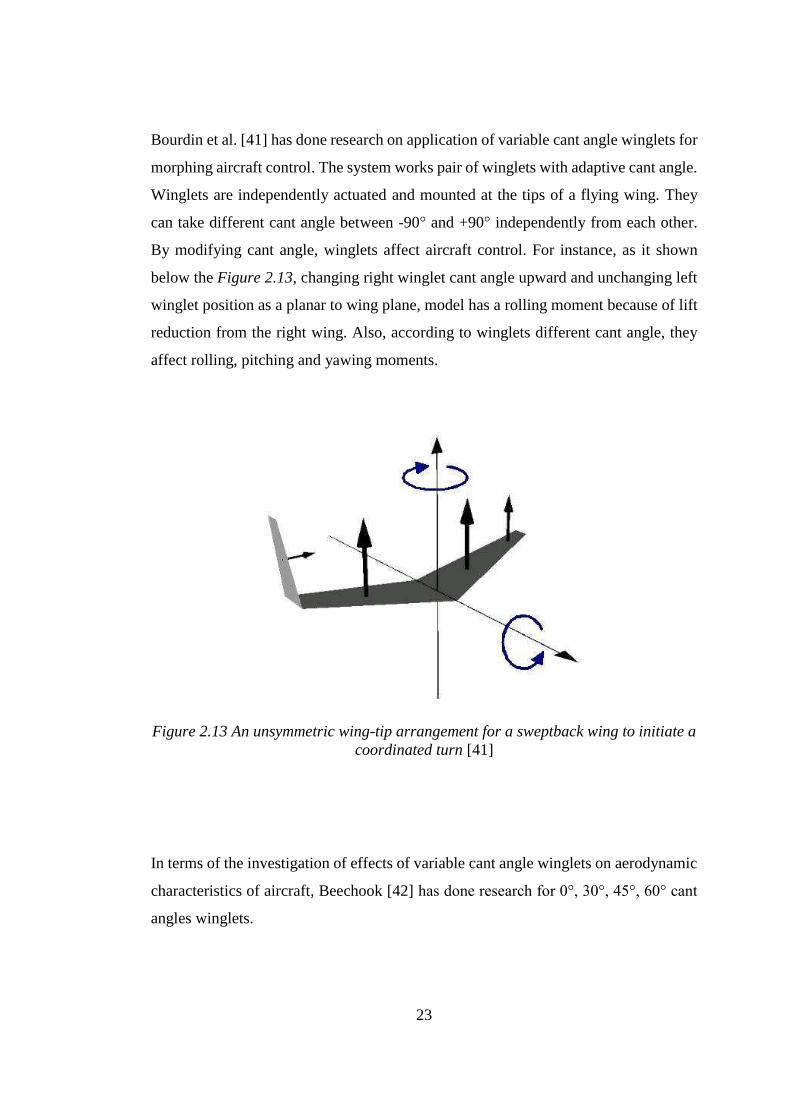
Bourdin et al. [41] has done research on application of variable cant angle winglets for
morphing aircraft control. The system works pair of winglets with adaptive cant angle.
Winglets are independently actuated and mounted at the tips of a flying wing. They
can take different cant angle between -90° and +90° independently from each other.
By modifying cant angle, winglets affect aircraft control. For instance, as it shown
below the Figure 2.13, changing right winglet cant angle upward and unchanging left
winglet position as a planar to wing plane, model has a rolling moment because of lift
reduction from the right wing. Also, according to winglets different cant angle, they
affect rolling, pitching and yawing moments.
Figure 2.13 An unsymmetric wing-tip arrangement for a sweptback wing to initiate a
coordinated turn [41]
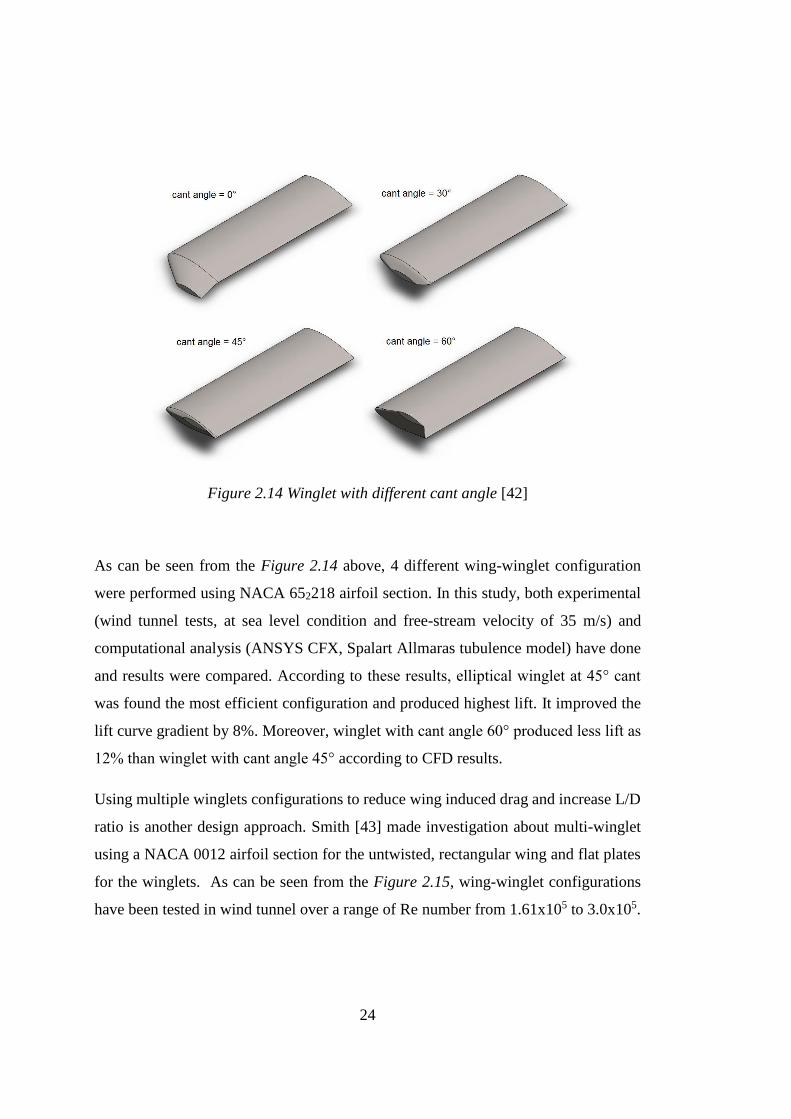
In terms of the investigation of effects of variable cant angle winglets on aerodynamic
characteristics of aircraft, Beechook [42] has done research for 0°, 30°, 45°, 60° cant
angles winglets.
24
Figure 2.14 Winglet with different cant angle [42]
As can be seen from the Figure 2.14 above, 4 different wing-winglet configuration
were performed using NACA 652218 airfoil section. In this study, both experimental
(wind tunnel tests, at sea level condition and free-stream velocity of 35 m/s) and
computational analysis (ANSYS CFX, Spalart Allmaras tubulence model) have done
and results were compared. According to these results, elliptical winglet at 45° cant
was found the most efficient configuration and produced highest lift. It improved the
lift curve gradient by 8%. Moreover, winglet with cant angle 60° produced less lift as
12% than winglet with cant angle 45° according to CFD results.
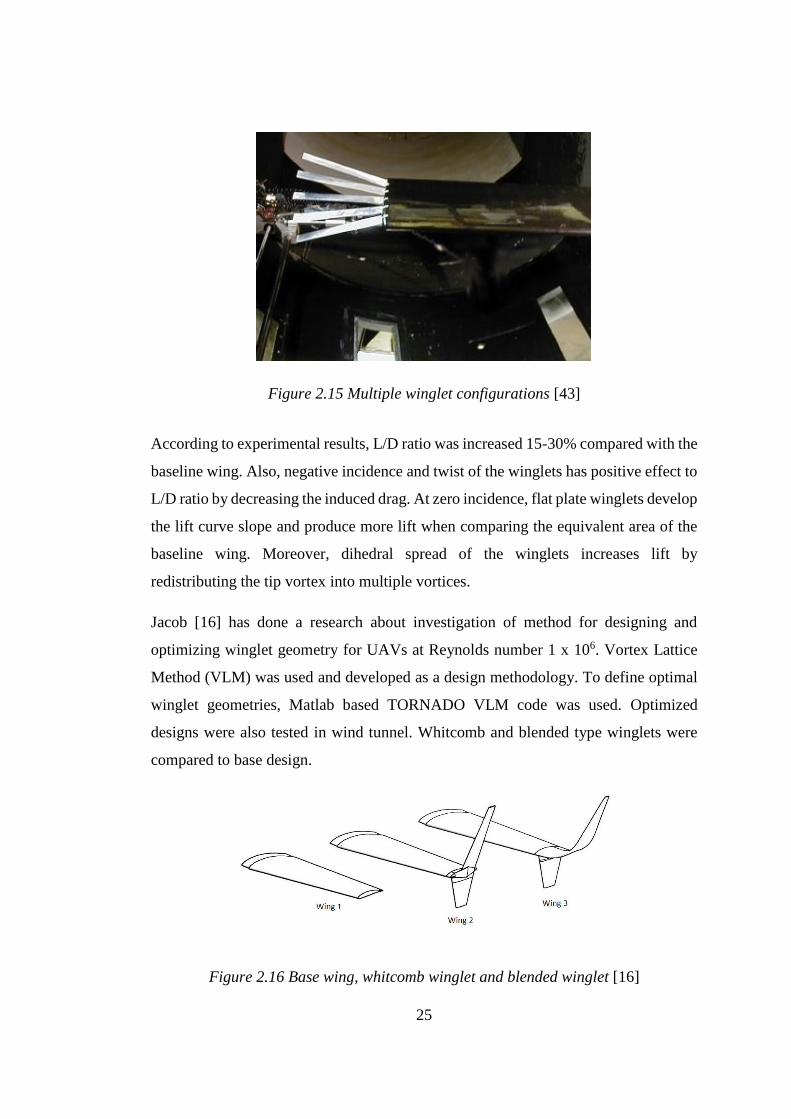
Using multiple winglets configurations to reduce wing induced drag and increase L/D
ratio is another design approach. Smith [43] made investigation about multi-winglet
using a NACA 0012 airfoil section for the untwisted, rectangular wing and flat plates
for the winglets. As can be seen from the Figure 2.15, wing-winglet configurations
have been tested in wind tunnel over a range of Re number from 1.61x10⁵ to 3.0x10⁵.
25
Figure 2.15 Multiple winglet configurations [43]
According to experimental results, L/D ratio was increased 15-30% compared with the
baseline wing. Also, negative incidence and twist of the winglets has positive effect to
L/D ratio by decreasing the induced drag. At zero incidence, flat plate winglets develop
the lift curve slope and produce more lift when comparing the equivalent area of the
baseline wing. Moreover, dihedral spread of the winglets increases lift by
redistributing the tip vortex into multiple vortices.
Jacob [16] has done a research about investigation of method for designing and
optimizing winglet geometry for UAVs at Reynolds number 1 x 10⁶. Vortex Lattice
Method (VLM) was used and developed as a design methodology. To define optimal
winglet geometries, Matlab based TORNADO VLM code was used. Optimized
designs were also tested in wind tunnel. Whitcomb and blended type winglets were
compared to base design.
Figure 2.16 Base wing, whitcomb winglet and blended winglet [16]
26
According to VLM results, blended winglet was found better than Whitcomb winglet.
The maximum value for CL\CD was increased %28 using optimized blended winglets.
As a result of this, endurance is increased 71% and range is increased 28%. However,
root bending moment for the blended winglet is greater than the Whitcomb winglet
about 5%. As can be seen from the Figure 2.16, 3 wing configurations compared about
aerodynamic performance. Wing 1 is base wing, wing 2 is wing with lower winglets
and a straight upper winglet, wing 3 is wing with lower winglets and blended upper
winglets. Based on the results of VLM, wing 1 has (CL\CD)max=23.46, wing 2 has
(CL\CD)max =25.43, and wing 3 has (CL\CD)max =23.00 values. This trend is not changed
according to wind tunnel experiments but results are less than VLM because of the
higher drag coefficients. VLM does not model viscous effect, it can only approximate
surface drag. In terms of aerodynamic performance, wind tunnel results show that,
optimized blended winglet increases the range 31.85% and endurance 38.7%.
Whitcomb winglet increases the range 14.49% and the endurance 18.8%.
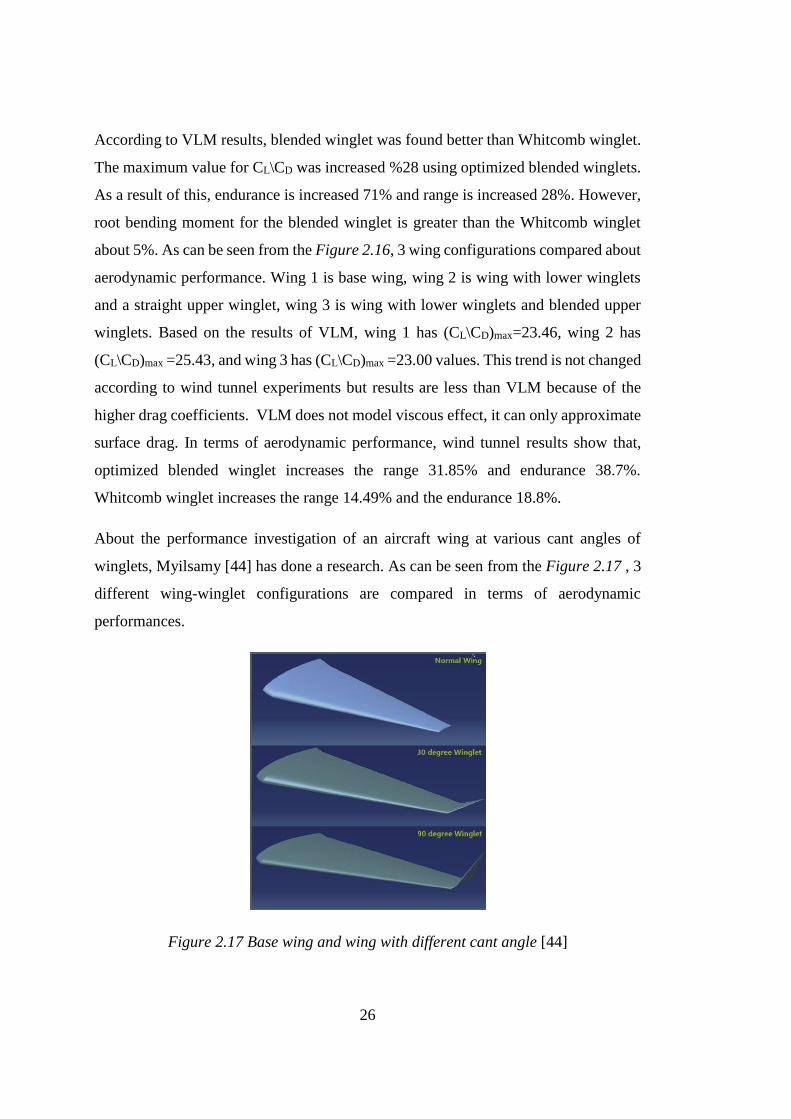
About the performance investigation of an aircraft wing at various cant angles of
winglets, Myilsamy [44] has done a research. As can be seen from the Figure 2.17 , 3
different wing-winglet configurations are compared in terms of aerodynamic
performances.
Figure 2.17 Base wing and wing with different cant angle [44]
27
In design point, just winglet cant angle parameter was used and other parameters are
not mentioned. 0° (base wing), 30° and 90° degree cant angle winglets were performed
by using NACA 4412 airfoil at different angle of attack from -2° to 10°. Unlike
programs used in other studies, AcuSolve CFD program was used for numerical
analysis. 3-D steady state pressure based k-ω turbulence model was chosen for
calculations. According AcuSolve results, winglet has 90° cant angle gave highest lift
coefficient between -2° to 10° AOA. However, aerodynamic performance of winglet
cant angle 30° was better up to 2° AOA because of low drag coefficient. Considering
takeoff and landing performance, it was resulted that low cant angle at low AOA and
high cant angle at high AOA give better results.
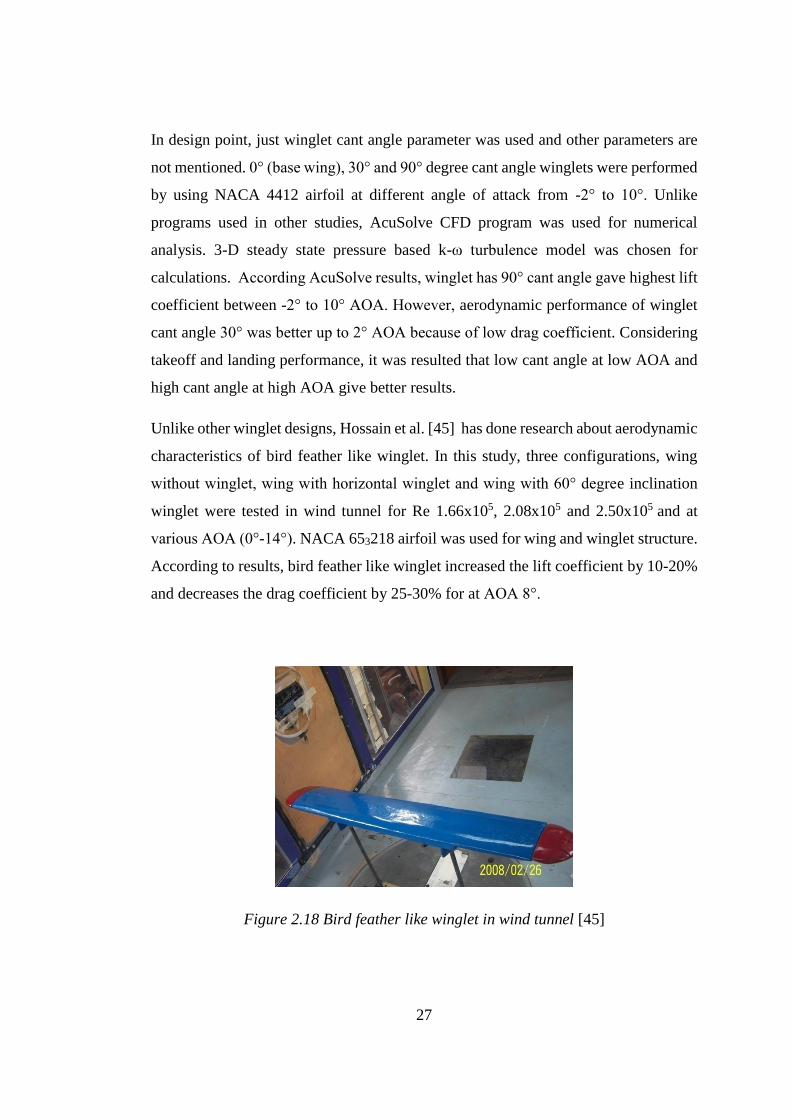
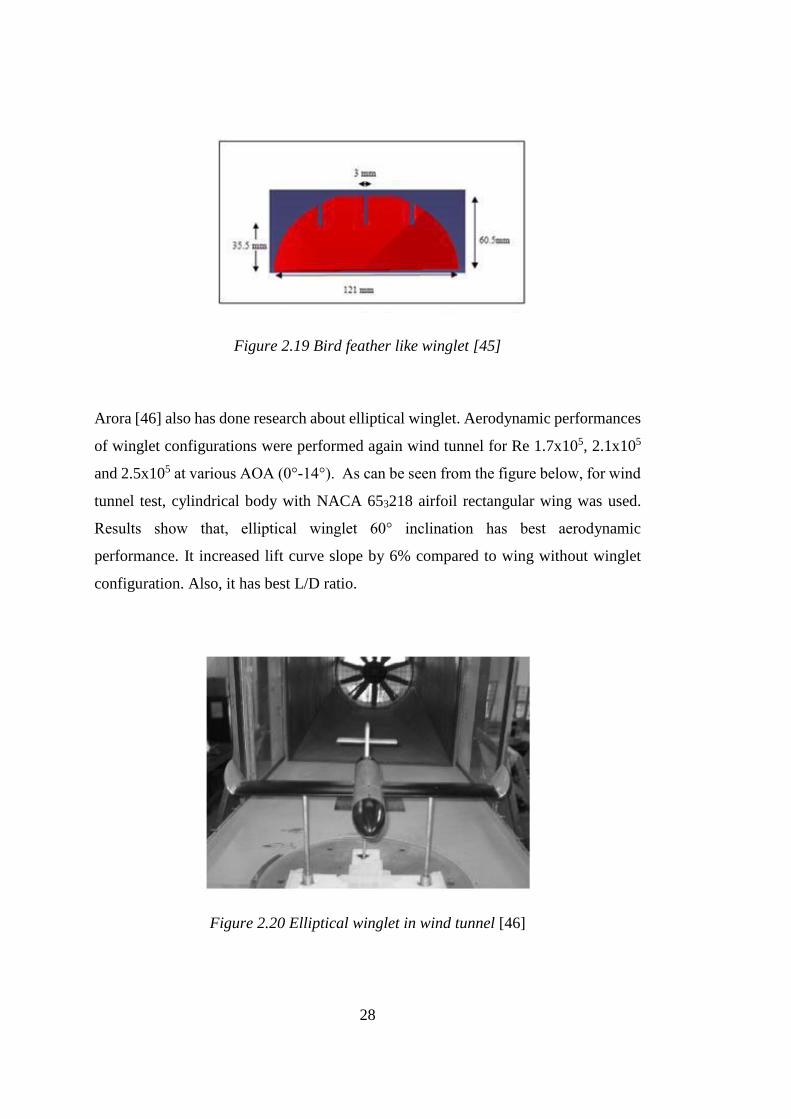
Unlike other winglet designs, Hossain et al. [45] has done research about aerodynamic
characteristics of bird feather like winglet. In this study, three configurations, wing
without winglet, wing with horizontal winglet and wing with 60° degree inclination
winglet were tested in wind tunnel for Re 1.66x10⁵, 2.08x10⁵ and 2.50x10⁵ and at
various AOA (0°-14°). NACA 653218 airfoil was used for wing and winglet structure.
According to results, bird feather like winglet increased the lift coefficient by 10-20%
and decreases the drag coefficient by 25-30% for at AOA 8°.
Figure 2.18 Bird feather like winglet in wind tunnel [45]
28
Figure 2.19 Bird feather like winglet [45]
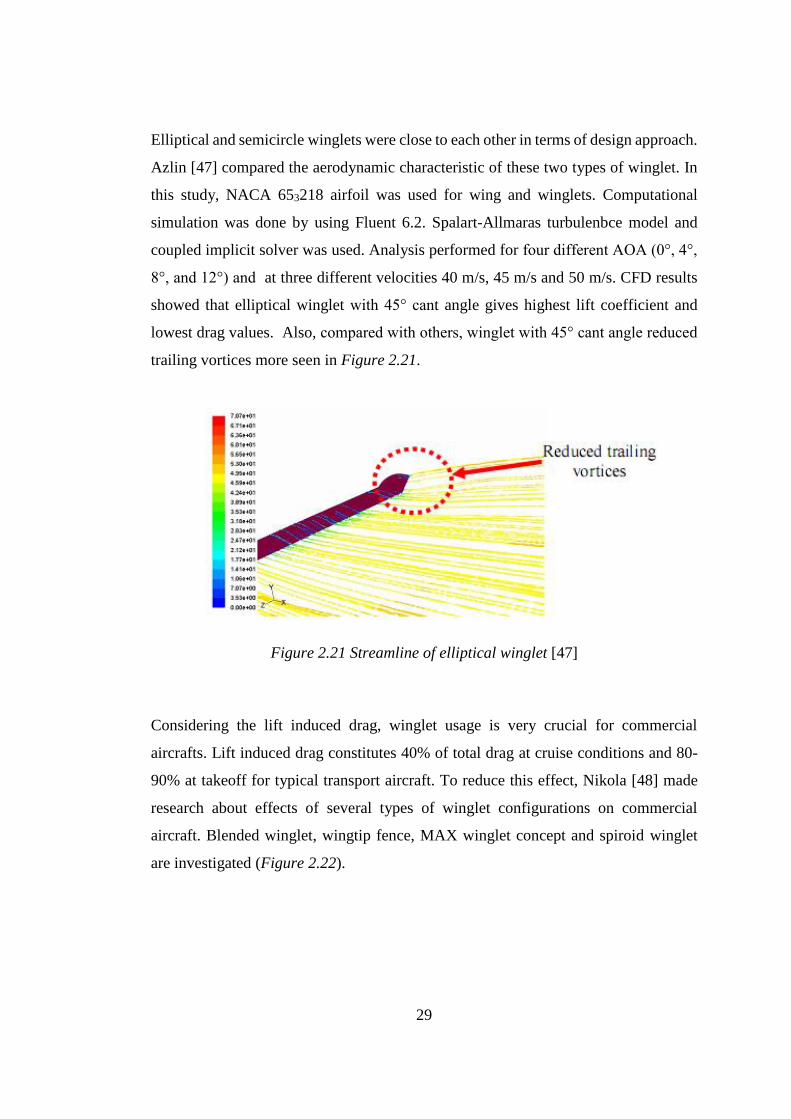
Arora [46] also has done research about elliptical winglet. Aerodynamic performances
of winglet configurations were performed again wind tunnel for Re 1.7x10⁵, 2.1x10⁵
and 2.5x10⁵ at various AOA (0°-14°). As can be seen from the figure below, for wind
tunnel test, cylindrical body with NACA 653218 airfoil rectangular wing was used.
Results show that, elliptical winglet 60° inclination has best aerodynamic
performance. It increased lift curve slope by 6% compared to wing without winglet
configuration. Also, it has best L/D ratio.
Figure 2.20 Elliptical winglet in wind tunnel [46]
29
Elliptical and semicircle winglets were close to each other in terms of design approach.
Azlin [47] compared the aerodynamic characteristic of these two types of winglet. In
this study, NACA 653218 airfoil was used for wing and winglets. Computational
simulation was done by using Fluent 6.2. Spalart-Allmaras turbulenbce model and
coupled implicit solver was used. Analysis performed for four different AOA (0°, 4°,
8°, and 12°) and at three different velocities 40 m/s, 45 m/s and 50 m/s. CFD results
showed that elliptical winglet with 45° cant angle gives highest lift coefficient and
lowest drag values. Also, compared with others, winglet with 45° cant angle reduced
trailing vortices more seen in Figure 2.21.
Figure 2.21 Streamline of elliptical winglet [47]
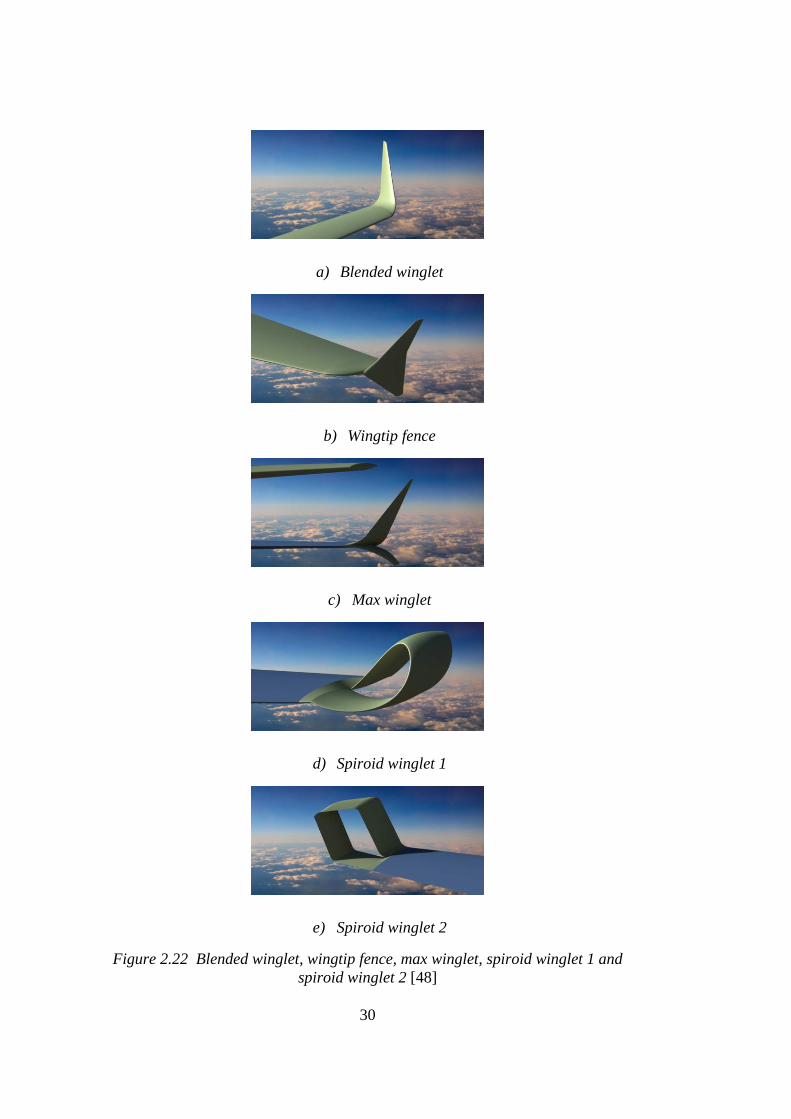
Considering the lift induced drag, winglet usage is very crucial for commercial
aircrafts. Lift induced drag constitutes 40% of total drag at cruise conditions and 80-
90% at takeoff for typical transport aircraft. To reduce this effect, Nikola [48] made
research about effects of several types of winglet configurations on commercial
aircraft. Blended winglet, wingtip fence, MAX winglet concept and spiroid winglet
are investigated (Figure 2.22).
30
a) Blended winglet
b) Wingtip fence
c) Max winglet
d) Spiroid winglet 1
e) Spiroid winglet 2
Figure 2.22 Blended winglet, wingtip fence, max winglet, spiroid winglet 1 and
spiroid winglet 2 [48]
31
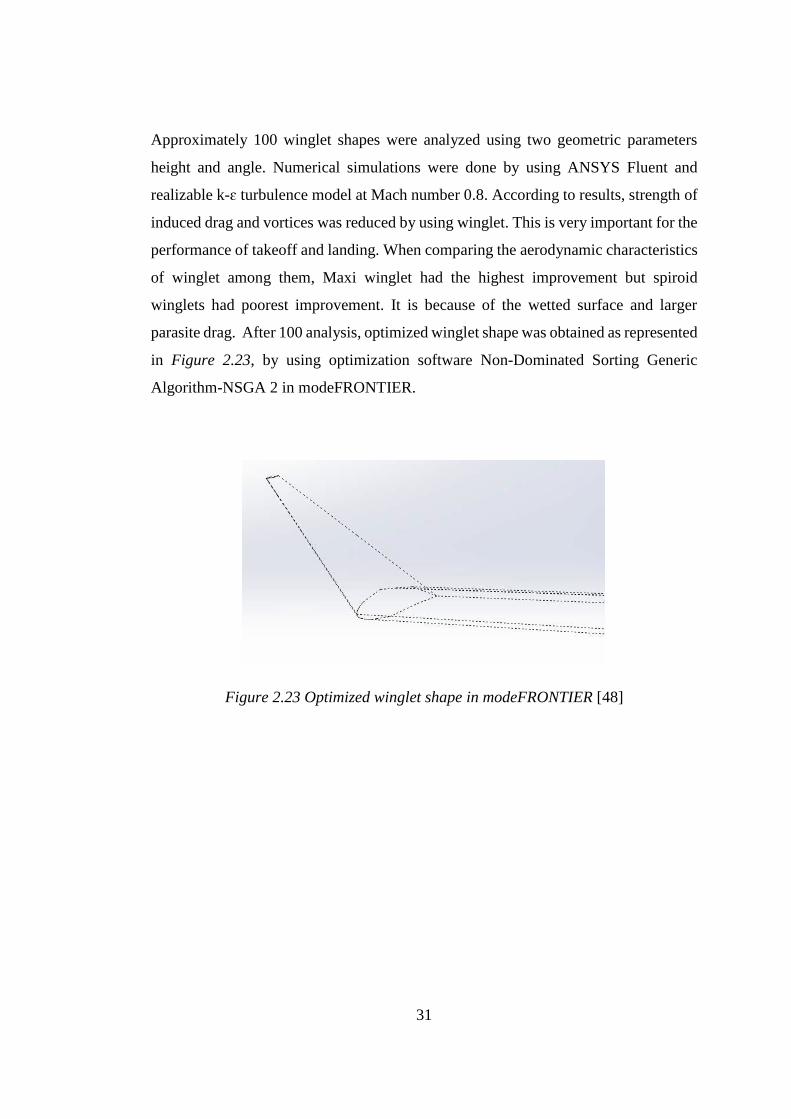
Approximately 100 winglet shapes were analyzed using two geometric parameters
height and angle. Numerical simulations were done by using ANSYS Fluent and
realizable k-ɛ turbulence model at Mach number 0.8. According to results, strength of
induced drag and vortices was reduced by using winglet. This is very important for the
performance of takeoff and landing. When comparing the aerodynamic characteristics
of winglet among them, Maxi winglet had the highest improvement but spiroid
winglets had poorest improvement. It is because of the wetted surface and larger
parasite drag. After 100 analysis, optimized winglet shape was obtained as represented
in Figure 2.23, by using optimization software Non-Dominated Sorting Generic
Algorithm-NSGA 2 in modeFRONTIER.
Figure 2.23 Optimized winglet shape in modeFRONTIER [48]

32
33
CHAPTER 3
METHODOLOGY
3. METHODOLOGY
Winglet Design
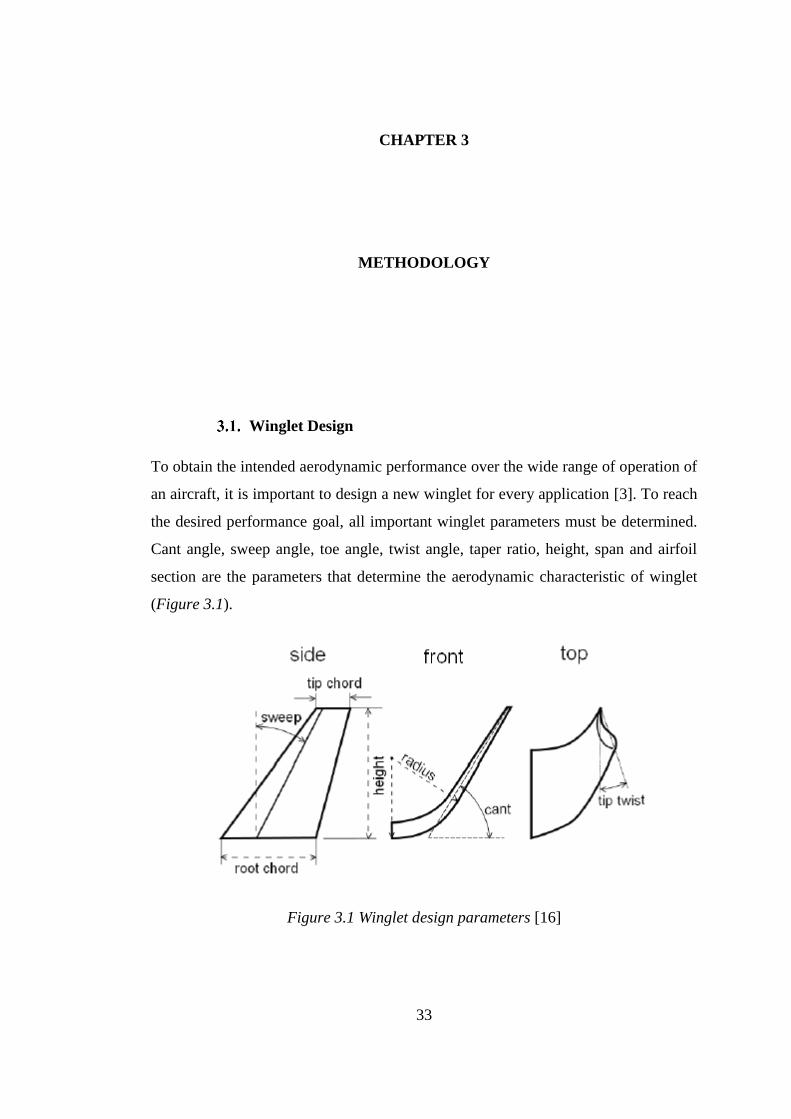
To obtain the intended aerodynamic performance over the wide range of operation of
an aircraft, it is important to design a new winglet for every application [3]. To reach
the desired performance goal, all important winglet parameters must be determined.
Cant angle, sweep angle, toe angle, twist angle, taper ratio, height, span and airfoil
section are the parameters that determine the aerodynamic characteristic of winglet
(Figure 3.1).
Figure 3.1 Winglet design parameters [16]
34
It is very complicated problem to find winglet having the desired performance by using
all parameters. In this aspect, all winglet parameters should be tried in a different
combinations or special optimization tools must be used to get optimum design.
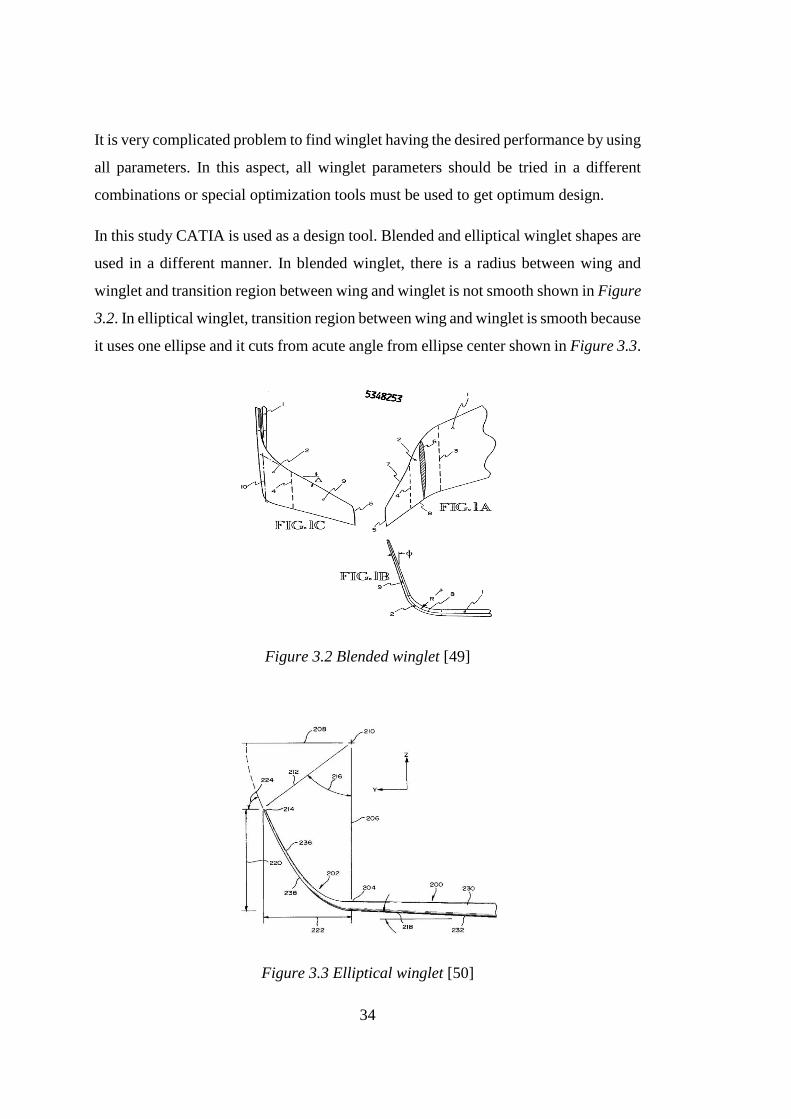
In this study CATIA is used as a design tool. Blended and elliptical winglet shapes are
used in a different manner. In blended winglet, there is a radius between wing and
winglet and transition region between wing and winglet is not smooth shown in Figure
3.2. In elliptical winglet, transition region between wing and winglet is smooth because
it uses one ellipse and it cuts from acute angle from ellipse center shown in Figure 3.3.
Figure 3.2 Blended winglet [49]
Figure 3.3 Elliptical winglet [50]
35
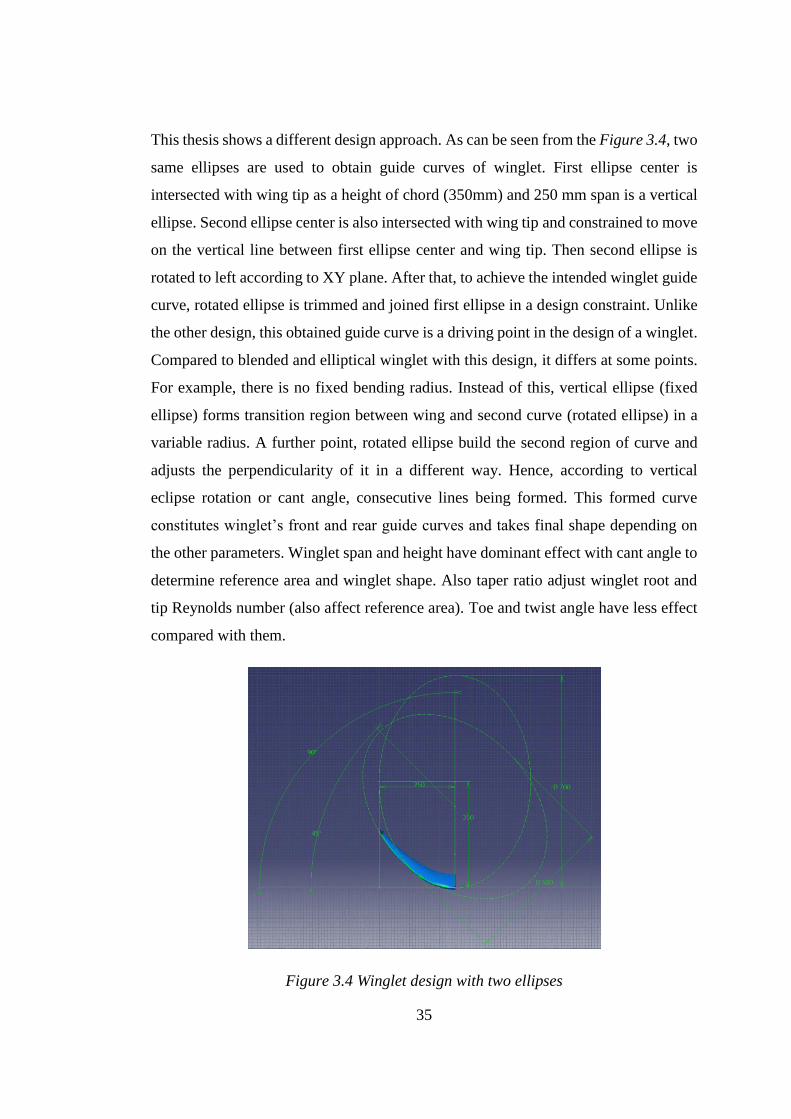
This thesis shows a different design approach. As can be seen from the Figure 3.4, two
same ellipses are used to obtain guide curves of winglet. First ellipse center is
intersected with wing tip as a height of chord (350mm) and 250 mm span is a vertical
ellipse. Second ellipse center is also intersected with wing tip and constrained to move
on the vertical line between first ellipse center and wing tip. Then second ellipse is
rotated to left according to XY plane. After that, to achieve the intended winglet guide
curve, rotated ellipse is trimmed and joined first ellipse in a design constraint. Unlike
the other design, this obtained guide curve is a driving point in the design of a winglet.
Compared to blended and elliptical winglet with this design, it differs at some points.
For example, there is no fixed bending radius. Instead of this, vertical ellipse (fixed
ellipse) forms transition region between wing and second curve (rotated ellipse) in a
variable radius. A further point, rotated ellipse build the second region of curve and
adjusts the perpendicularity of it in a different way. Hence, according to vertical
eclipse rotation or cant angle, consecutive lines being formed. This formed curve
constitutes winglet’s front and rear guide curves and takes final shape depending on
the other parameters. Winglet span and height have dominant effect with cant angle to
determine reference area and winglet shape. Also taper ratio adjust winglet root and
tip Reynolds number (also affect reference area). Toe and twist angle have less effect
compared with them.
Figure 3.4 Winglet design with two ellipses
36
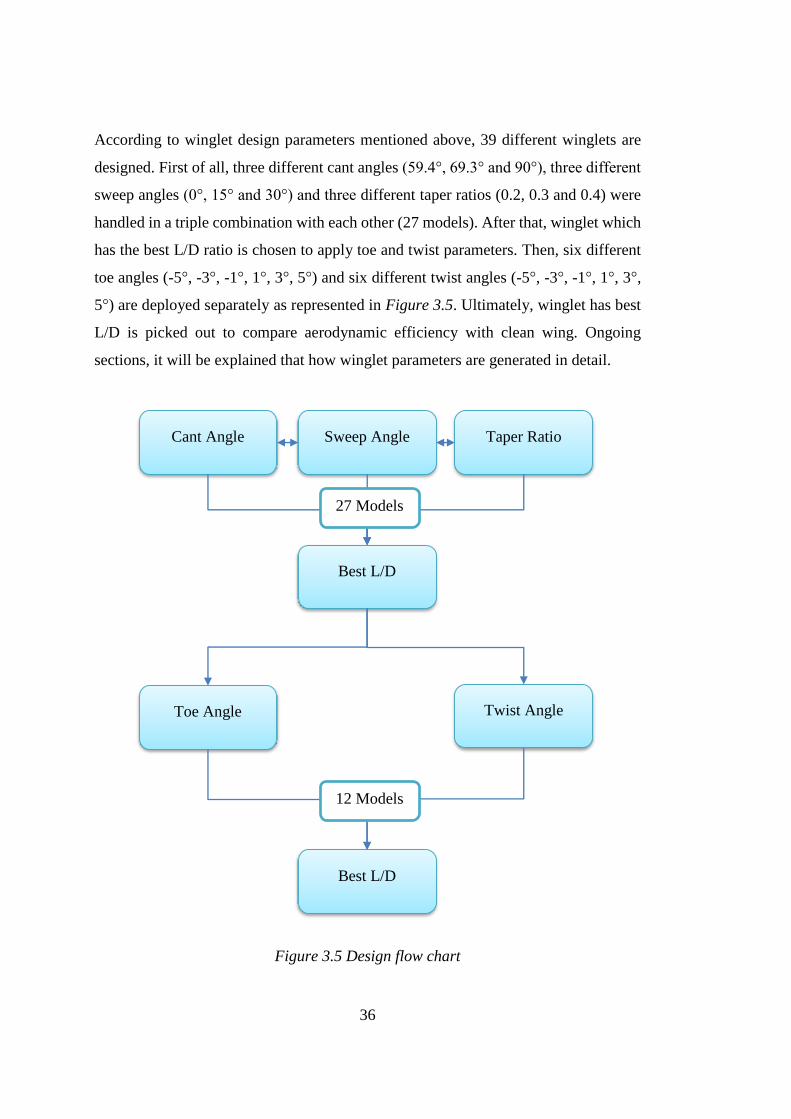
According to winglet design parameters mentioned above, 39 different winglets are
designed. First of all, three different cant angles (59.4°, 69.3° and 90°), three different
sweep angles (0°, 15° and 30°) and three different taper ratios (0.2, 0.3 and 0.4) were
handled in a triple combination with each other (27 models). After that, winglet which
has the best L/D ratio is chosen to apply toe and twist parameters. Then, six different
toe angles (-5°, -3°, -1°, 1°, 3°, 5°) and six different twist angles (-5°, -3°, -1°, 1°, 3°,
5°) are deployed separately as represented in Figure 3.5. Ultimately, winglet has best
L/D is picked out to compare aerodynamic efficiency with clean wing. Ongoing
sections, it will be explained that how winglet parameters are generated in detail.
Figure 3.5 Design flow chart
Cant Angle Sweep Angle Taper Ratio
Best L/D
Toe Angle Twist Angle
Best L/D
27 Models
12 Models
37
Airfoil
Since the winglet does not work as the wing does, airfoil section is one of the most
important part of the winglet design. Because of this, according to aircraft operational
condition, selection of airfoil determines the performance of winglet for different
Reynolds number. Maughmer et al. [51] investigation’s states that winglet airfoil must
work a wide range of Reynold number because winglet’s small chord makes Reynold
number low. As a result of his study, PSU 94-097 airfoil was designed for low
Reynolds number regime (2.4x10⁵ – 1.0x10⁶).
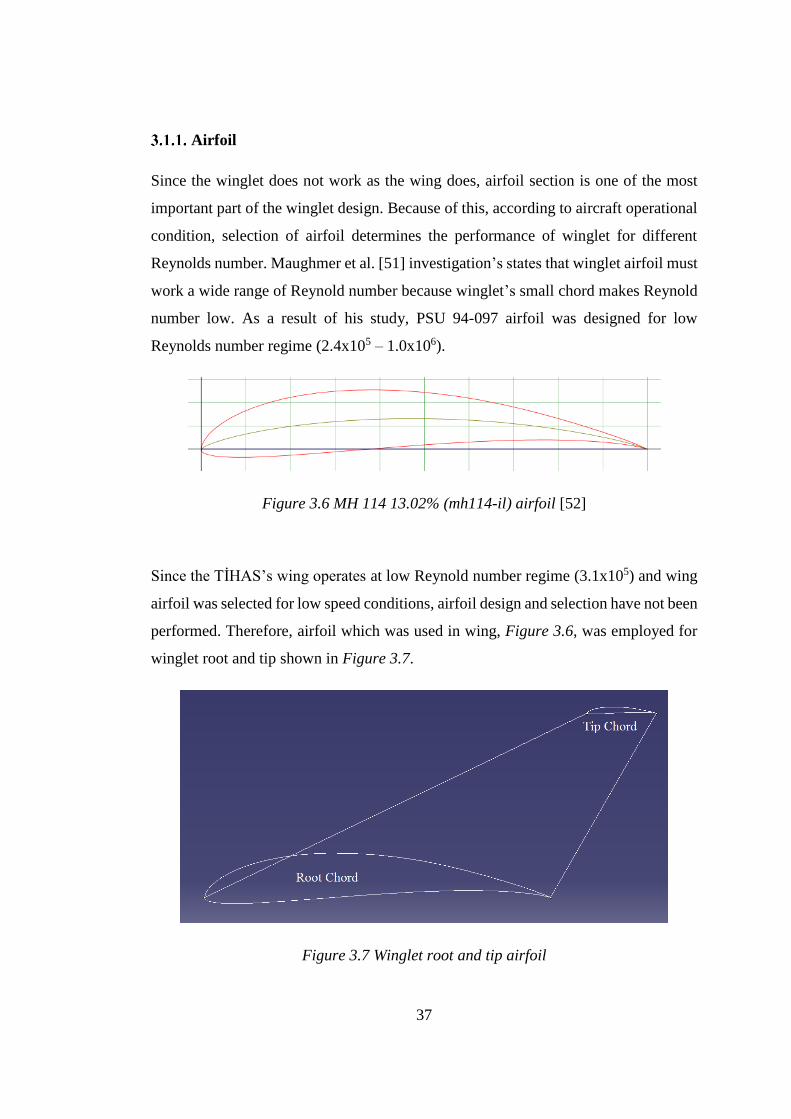
Figure 3.6 MH 114 13.02% (mh114-il) airfoil [52]
Since the TİHAS’s wing operates at low Reynold number regime (3.1x10⁵) and wing
airfoil was selected for low speed conditions, airfoil design and selection have not been
performed. Therefore, airfoil which was used in wing, Figure 3.6, was employed for
winglet root and tip shown in Figure 3.7.
Figure 3.7 Winglet root and tip airfoil
38
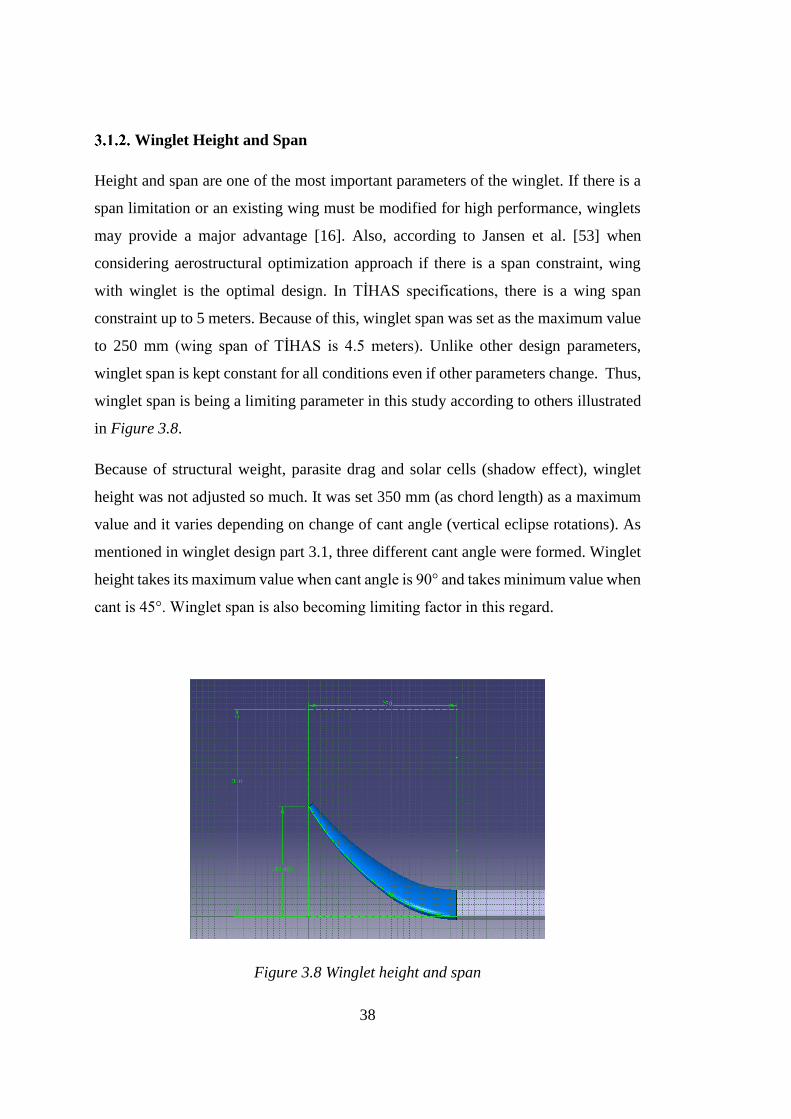
Winglet Height and Span
Height and span are one of the most important parameters of the winglet. If there is a
span limitation or an existing wing must be modified for high performance, winglets
may provide a major advantage [16]. Also, according to Jansen et al. [53] when
considering aerostructural optimization approach if there is a span constraint, wing
with winglet is the optimal design. In TİHAS specifications, there is a wing span
constraint up to 5 meters. Because of this, winglet span was set as the maximum value
to 250 mm (wing span of TİHAS is 4.5 meters). Unlike other design parameters,
winglet span is kept constant for all conditions even if other parameters change. Thus,
winglet span is being a limiting parameter in this study according to others illustrated
in Figure 3.8.
Because of structural weight, parasite drag and solar cells (shadow effect), winglet
height was not adjusted so much. It was set 350 mm (as chord length) as a maximum
value and it varies depending on change of cant angle (vertical eclipse rotations). As
mentioned in winglet design part 3.1, three different cant angle were formed. Winglet
height takes its maximum value when cant angle is 90° and takes minimum value when
cant is 45°. Winglet span is also becoming limiting factor in this regard.
Figure 3.8 Winglet height and span
39
Cant Angle
Cant angle is determinative and the most important winglet parameter to assess about
aerodynamic efficiency of wing and winglet. As Takenaka et al. [54] stressed in his
work, cant angle and span length (explained previous section) have dominant effect
for drag reduction.
In this study, cant angle is decisive parameter that determines the shape of the winglet.
To form winglet cant angle, two similar ellipses is used. First ellipse center is
intersected with wing tip as a 350 mm height and 250 mm span is a vertical ellipse and
it is fixed this point. Second ellipse center is also intersected with wing tip and
constrained to move on the vertical line between first ellipse center and wing tip. Then
second ellipse is rotated to left according to XY plane. After that, to achieve the
intended winglet guide curve, rotated ellipse is trimmed and joined first ellipse in a
design constraint. Thus, smooth junction region between wing and winglet is
constituted. The transition area between wing and winglet is very crucial in terms of
formation of wave drag especially at high cant angles [27]. Therefore, different design
pattern is tried and an elliptical transition region is formed between the wing and
winglet to overcome wave drag effect.
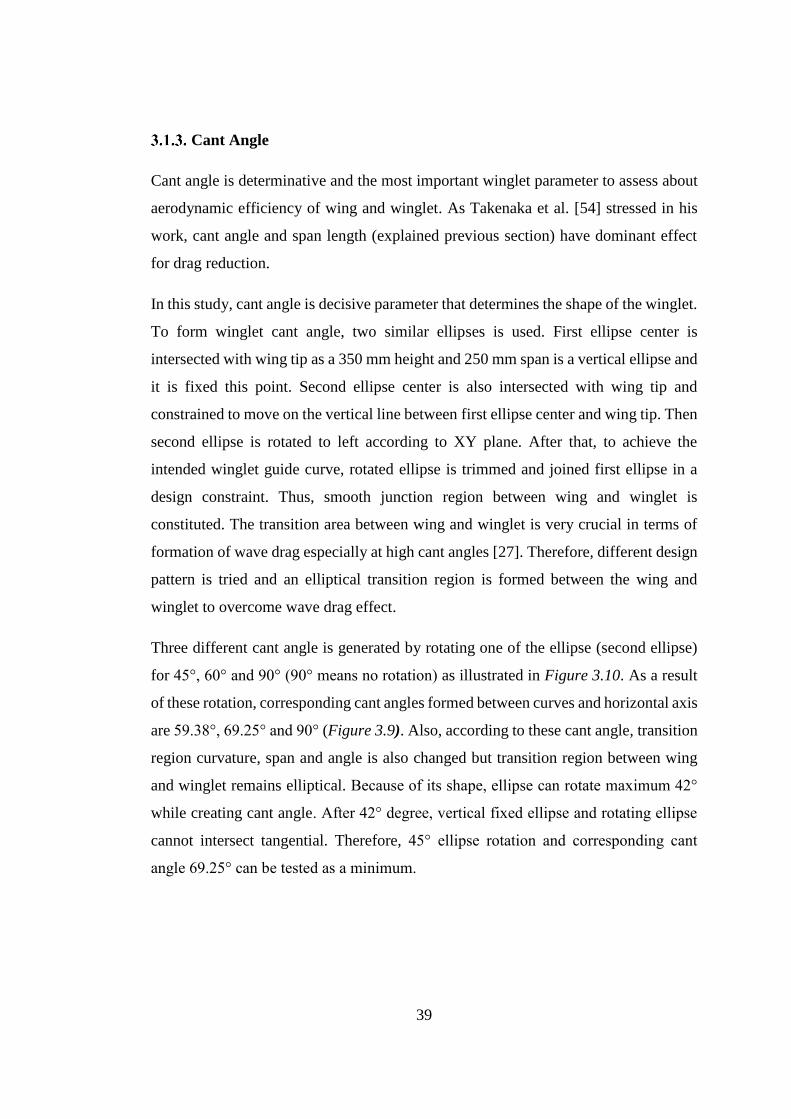
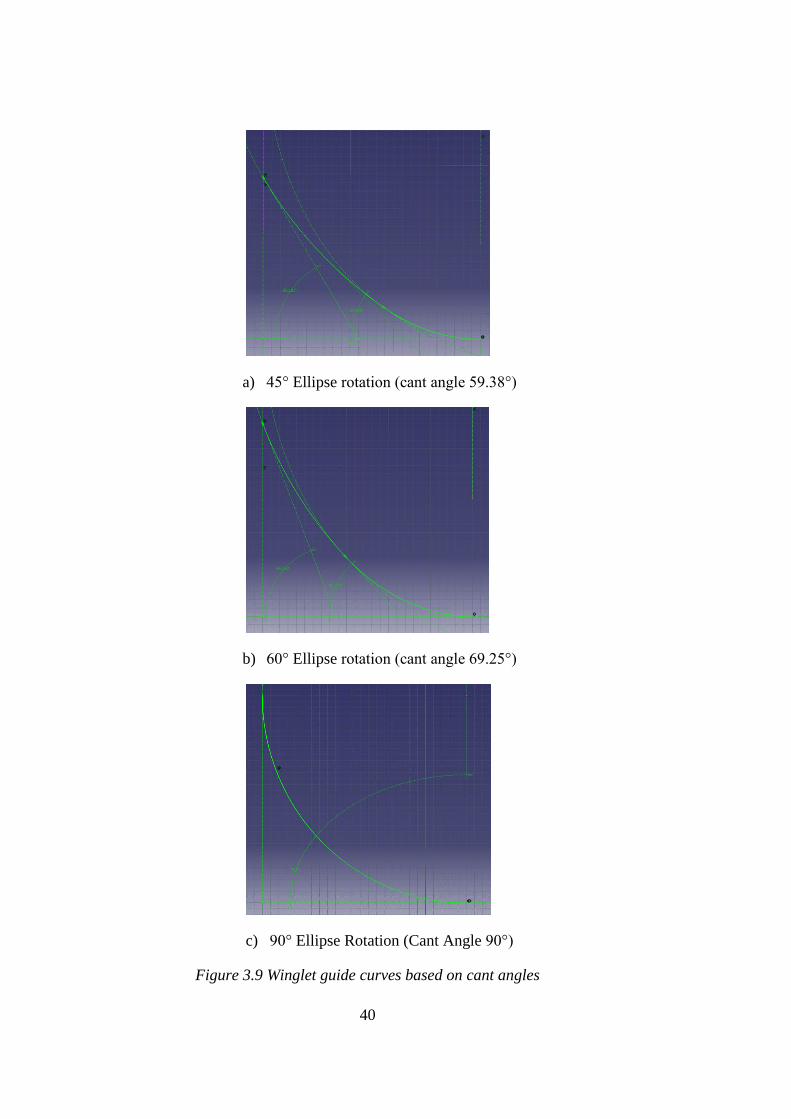
Three different cant angle is generated by rotating one of the ellipse (second ellipse)
for 45°, 60° and 90° (90° means no rotation) as illustrated in Figure 3.10. As a result
of these rotation, corresponding cant angles formed between curves and horizontal axis
are 59.38°, 69.25° and 90° (Figure 3.9). Also, according to these cant angle, transition
region curvature, span and angle is also changed but transition region between wing
and winglet remains elliptical. Because of its shape, ellipse can rotate maximum 42°
while creating cant angle. After 42° degree, vertical fixed ellipse and rotating ellipse
cannot intersect tangential. Therefore, 45° ellipse rotation and corresponding cant
angle 69.25° can be tested as a minimum.
40
a) 45° Ellipse rotation (cant angle 59.38°)
b) 60° Ellipse rotation (cant angle 69.25°)
c) 90° Ellipse Rotation (Cant Angle 90°)
Figure 3.9 Winglet guide curves based on cant angles
41
a) Winglet Cant 59.4° according to second ellipse rotation (45° ellipse rotation)
b) Winglet Cant 69.3° according to second ellipse rotation (60° ellipse rotation)
c) Winglet Cant 90° according to second ellipse rotation (90° ellipse rotation)
Figure 3.10 Winglet cant angles change according to rotation of ellipse
42
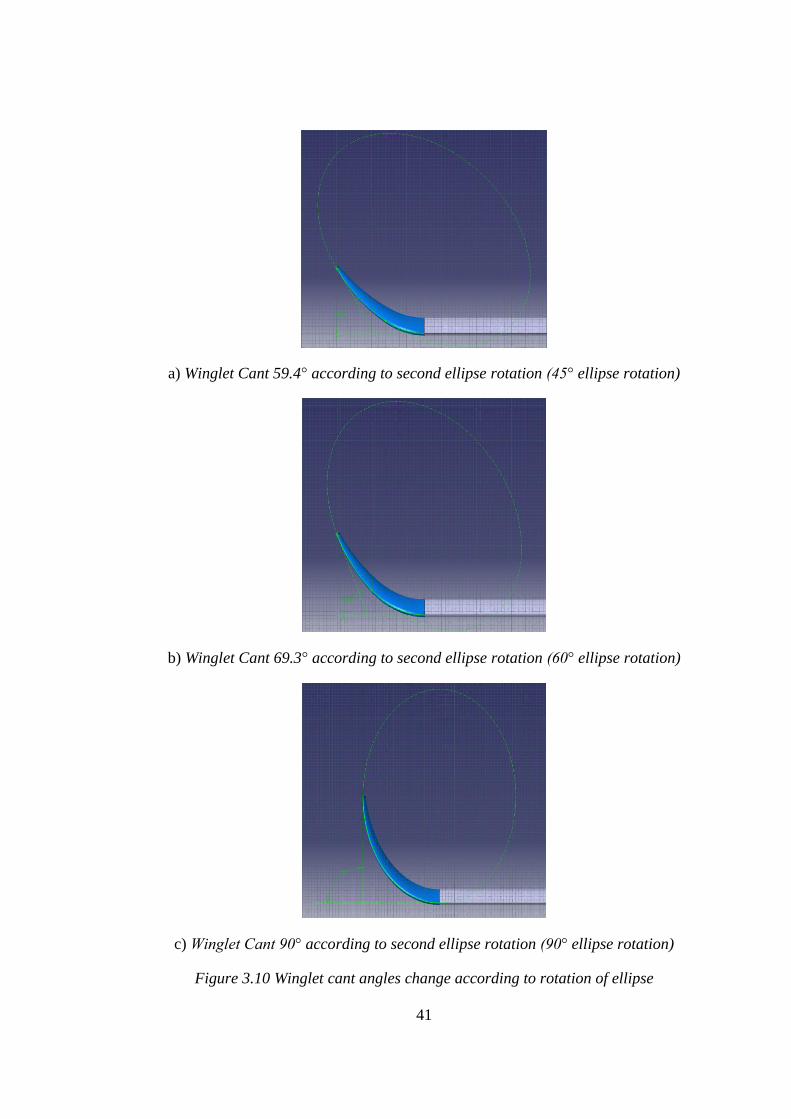
Taper Ratio and Sweep Angle
After determining the winglet guide curves and cant angles, taper ratio and sweep
angle parameters are performed related to them. Three different taper ratios were
utilized (λ= 0.2, 0.3 and 0.4) and winglet tip chord section was tapered according to
trailing edge, as demonstrated in Figure 3.11.
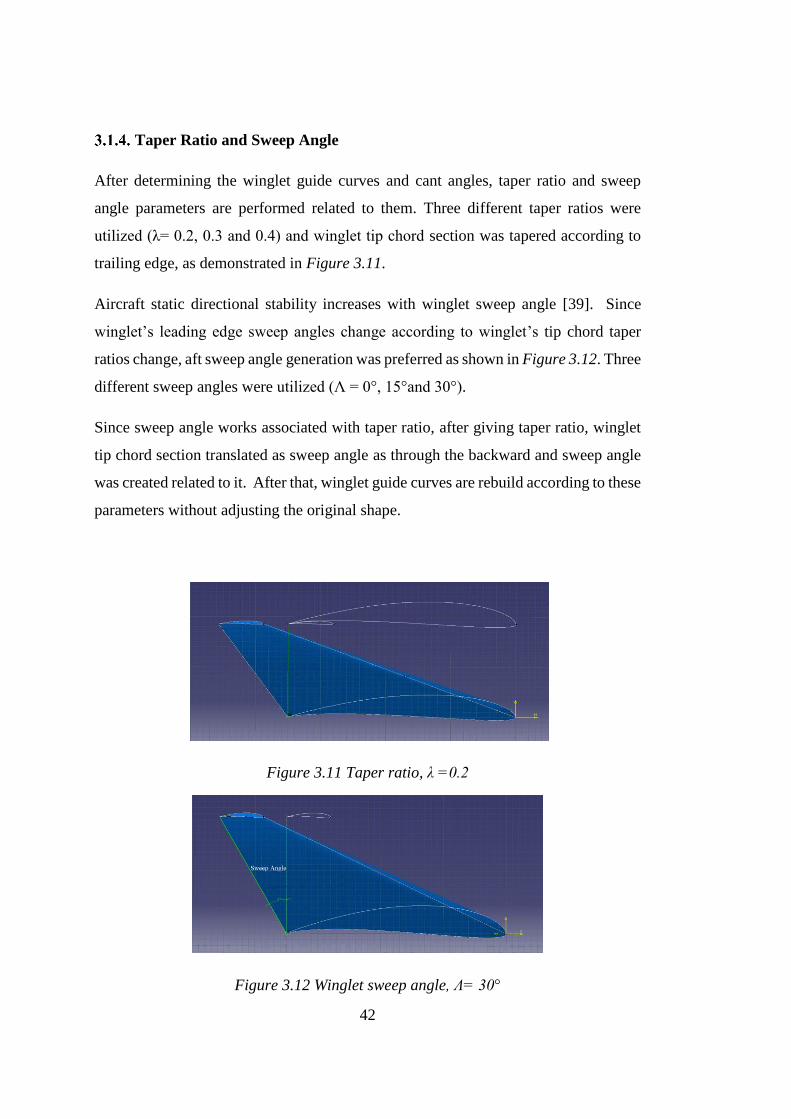
Aircraft static directional stability increases with winglet sweep angle [39]. Since
winglet’s leading edge sweep angles change according to winglet’s tip chord taper
ratios change, aft sweep angle generation was preferred as shown in Figure 3.12. Three
different sweep angles were utilized (Λ = 0°, 15°and 30°).
Since sweep angle works associated with taper ratio, after giving taper ratio, winglet
tip chord section translated as sweep angle as through the backward and sweep angle
was created related to it. After that, winglet guide curves are rebuild according to these
parameters without adjusting the original shape.
Figure 3.11 Taper ratio, λ =0.2
Figure 3.12 Winglet sweep angle, Λ= 30°
43
Twist and Toe Angle
After performing cant angles, sweep angles and taper ratios, twist angles and toe angles
were carried out separately for winglet has best L/D. Twist angle is utilized in order to
provide a uniform load distribution on winglet and toe angle varies according to
different flight conditions to yield effective lift force for a wing in the horizontal
position [16].
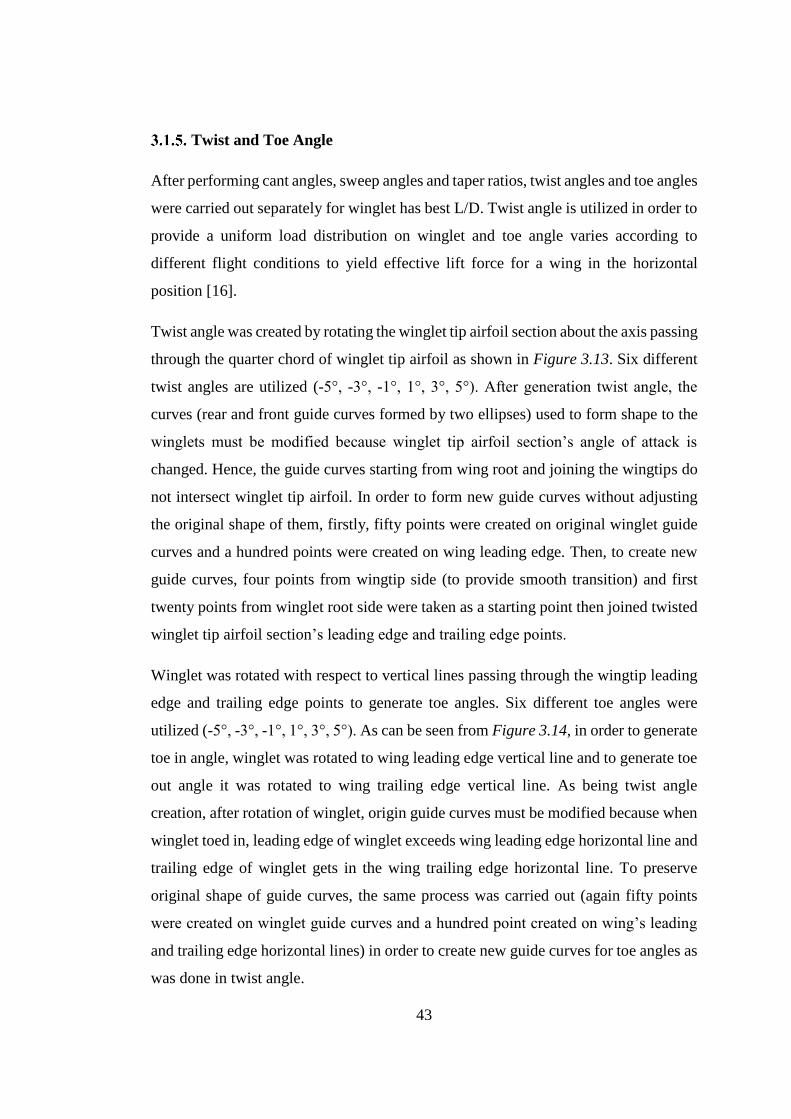
Twist angle was created by rotating the winglet tip airfoil section about the axis passing
through the quarter chord of winglet tip airfoil as shown in Figure 3.13. Six different
twist angles are utilized (-5°, -3°, -1°, 1°, 3°, 5°). After generation twist angle, the
curves (rear and front guide curves formed by two ellipses) used to form shape to the
winglets must be modified because winglet tip airfoil section’s angle of attack is
changed. Hence, the guide curves starting from wing root and joining the wingtips do
not intersect winglet tip airfoil. In order to form new guide curves without adjusting
the original shape of them, firstly, fifty points were created on original winglet guide
curves and a hundred points were created on wing leading edge. Then, to create new
guide curves, four points from wingtip side (to provide smooth transition) and first
twenty points from winglet root side were taken as a starting point then joined twisted
winglet tip airfoil section’s leading edge and trailing edge points.
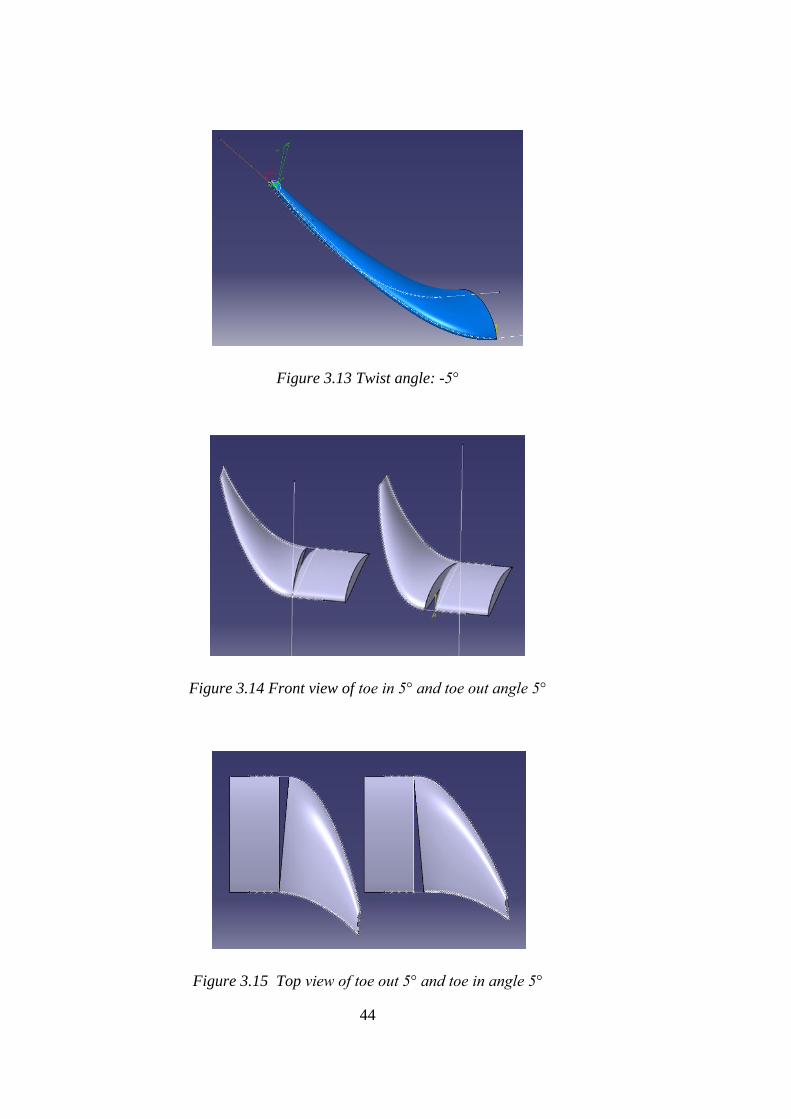
Winglet was rotated with respect to vertical lines passing through the wingtip leading
edge and trailing edge points to generate toe angles. Six different toe angles were
utilized (-5°, -3°, -1°, 1°, 3°, 5°). As can be seen from Figure 3.14, in order to generate
toe in angle, winglet was rotated to wing leading edge vertical line and to generate toe
out angle it was rotated to wing trailing edge vertical line. As being twist angle
creation, after rotation of winglet, origin guide curves must be modified because when
winglet toed in, leading edge of winglet exceeds wing leading edge horizontal line and
trailing edge of winglet gets in the wing trailing edge horizontal line. To preserve
original shape of guide curves, the same process was carried out (again fifty points
were created on winglet guide curves and a hundred point created on wing’s leading
and trailing edge horizontal lines) in order to create new guide curves for toe angles as
was done in twist angle.
44
Figure 3.13 Twist angle: -5°
Figure 3.14 Front view of toe in 5° and toe out angle 5°
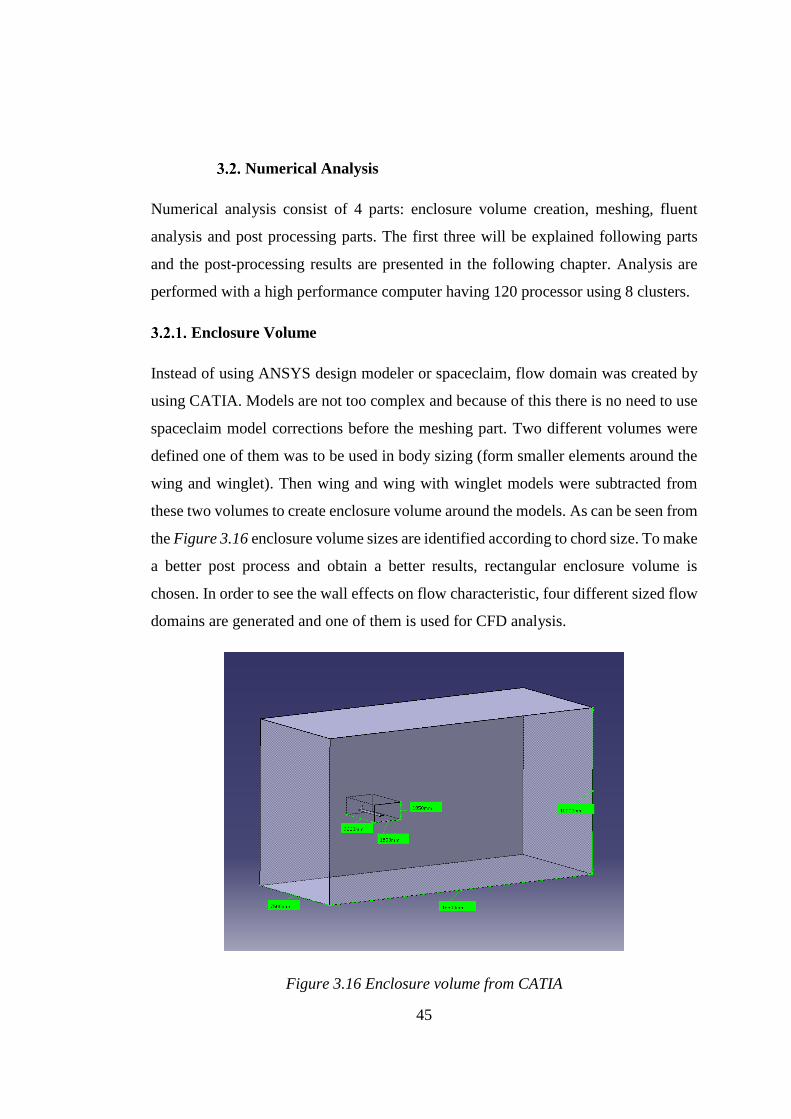
Figure 3.15 Top view of toe out 5° and toe in angle 5°
45
Numerical Analysis
Numerical analysis consist of 4 parts: enclosure volume creation, meshing, fluent
analysis and post processing parts. The first three will be explained following parts
and the post-processing results are presented in the following chapter. Analysis are
performed with a high performance computer having 120 processor using 8 clusters.
Enclosure Volume
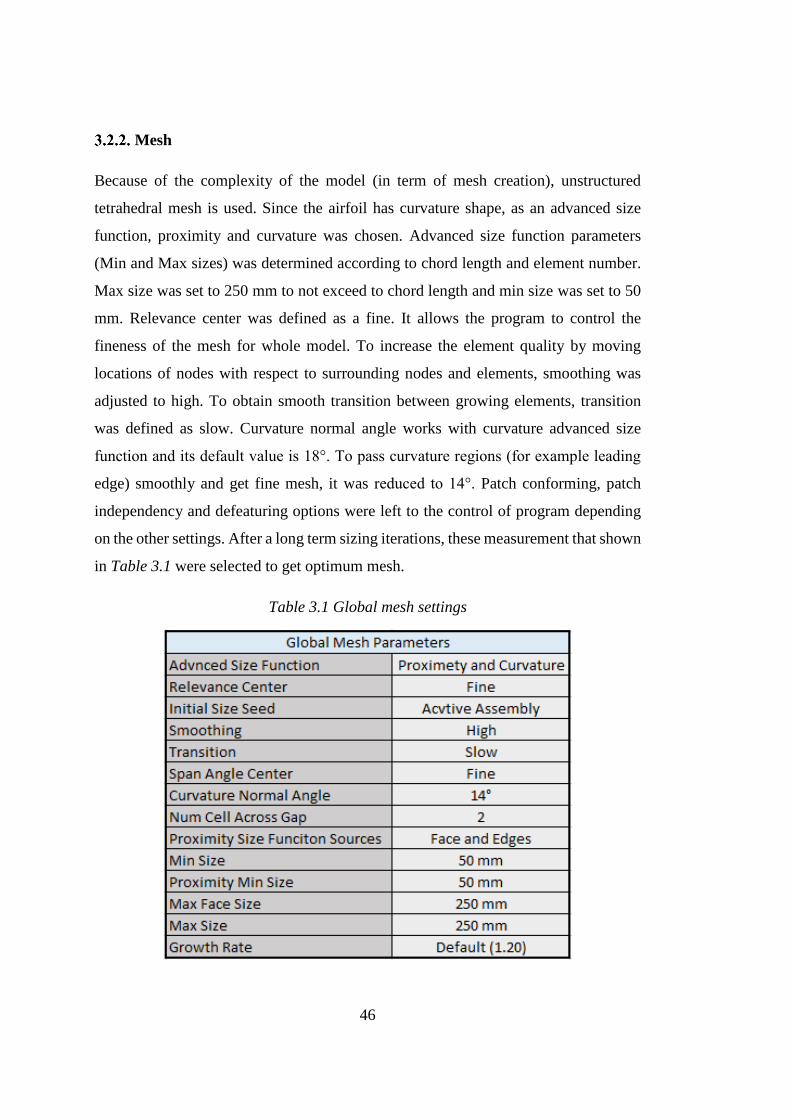
Instead of using ANSYS design modeler or spaceclaim, flow domain was created by
using CATIA. Models are not too complex and because of this there is no need to use
spaceclaim model corrections before the meshing part. Two different volumes were
defined one of them was to be used in body sizing (form smaller elements around the
wing and winglet). Then wing and wing with winglet models were subtracted from
these two volumes to create enclosure volume around the models. As can be seen from
the Figure 3.16 enclosure volume sizes are identified according to chord size. To make
a better post process and obtain a better results, rectangular enclosure volume is
chosen. In order to see the wall effects on flow characteristic, four different sized flow
domains are generated and one of them is used for CFD analysis.
Figure 3.16 Enclosure volume from CATIA
46
Mesh
Because of the complexity of the model (in term of mesh creation), unstructured
tetrahedral mesh is used. Since the airfoil has curvature shape, as an advanced size
function, proximity and curvature was chosen. Advanced size function parameters
(Min and Max sizes) was determined according to chord length and element number.
Max size was set to 250 mm to not exceed to chord length and min size was set to 50
mm. Relevance center was defined as a fine. It allows the program to control the
fineness of the mesh for whole model. To increase the element quality by moving
locations of nodes with respect to surrounding nodes and elements, smoothing was
adjusted to high. To obtain smooth transition between growing elements, transition
was defined as slow. Curvature normal angle works with curvature advanced size
function and its default value is 18°. To pass curvature regions (for example leading
edge) smoothly and get fine mesh, it was reduced to 14°. Patch conforming, patch
independency and defeaturing options were left to the control of program depending
on the other settings. After a long term sizing iterations, these measurement that shown
in Table 3.1 were selected to get optimum mesh.
Table 3.1 Global mesh settings
47
Boundary Layer
Boundary layer creation is one of the most important part of meshing. In order to
observe aerodynamic effects and obtain results accurately, first layer thickness (Y+)
and total thickness (δ) must be calculated. The Schlichting skin-friction formula [55]
was used to forecast the local skin-friction for a turbulent boundary layer. It is valid
for Re < 109.
Y+ calculation:
Reynolds Number Calculation:
𝑅𝑒 =
𝜌 ⋅ 𝑈 ⋅ 𝐿
𝜇 (3.1)
Schlichting skin-friction correlation:
𝐶𝑓 = [2log10(𝑅𝑒𝑥) − 0.65]−2.3 for 𝑅𝑒 < 109 (3.2)
Wall shear stress:
𝜏𝑤 = 𝐶𝑓 ⋅
1
2 𝜌𝑈𝑓𝑟𝑒𝑒𝑠𝑡𝑟𝑒𝑎𝑚
2
(3.3)
Friction velocity:
𝑢∗ = √
𝜏𝜔
𝜌 (3.4)
Wall distance:
𝑦 =
𝑦+𝜇
𝜌𝑢∗ (3.5)
According to equations above, estimated firs layer wall distance is 2.3e-5m.
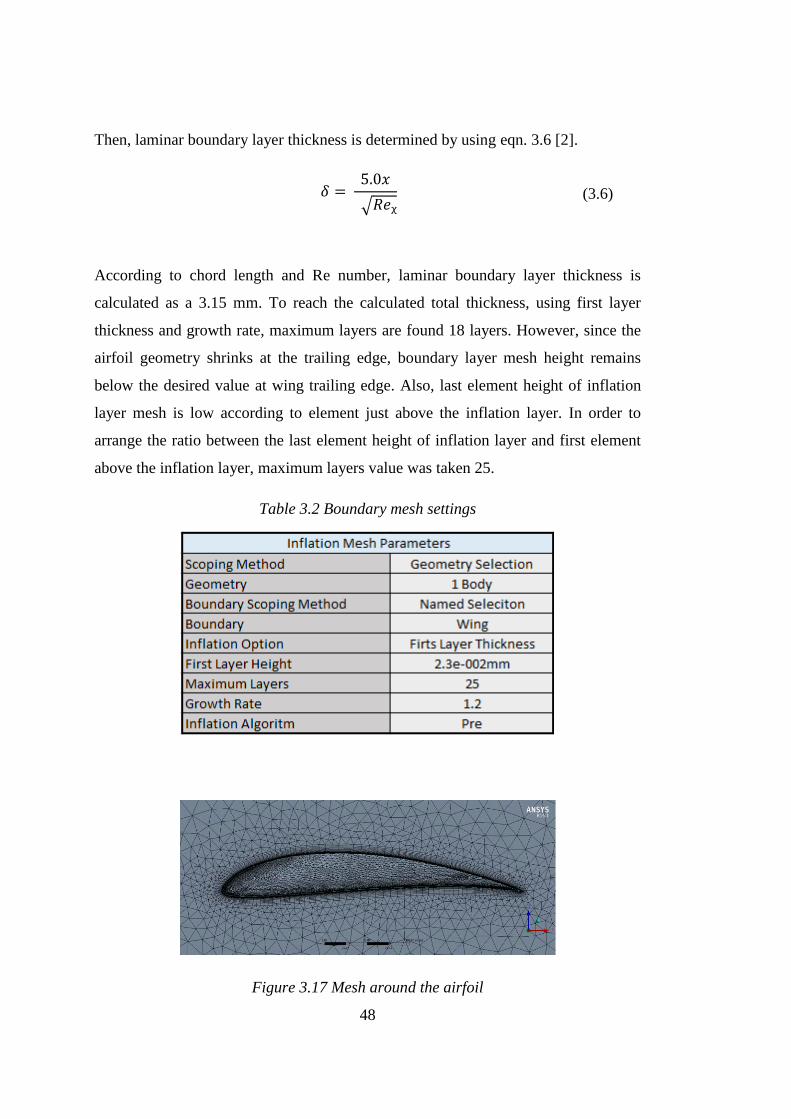
48
Then, laminar boundary layer thickness is determined by using eqn. 3.6 [2].
𝛿 =
5.0𝑥
√𝑅𝑒ᵪ (3.6)
According to chord length and Re number, laminar boundary layer thickness is
calculated as a 3.15 mm. To reach the calculated total thickness, using first layer
thickness and growth rate, maximum layers are found 18 layers. However, since the
airfoil geometry shrinks at the trailing edge, boundary layer mesh height remains
below the desired value at wing trailing edge. Also, last element height of inflation
layer mesh is low according to element just above the inflation layer. In order to
arrange the ratio between the last element height of inflation layer and first element
above the inflation layer, maximum layers value was taken 25.
Table 3.2 Boundary mesh settings
Figure 3.17 Mesh around the airfoil
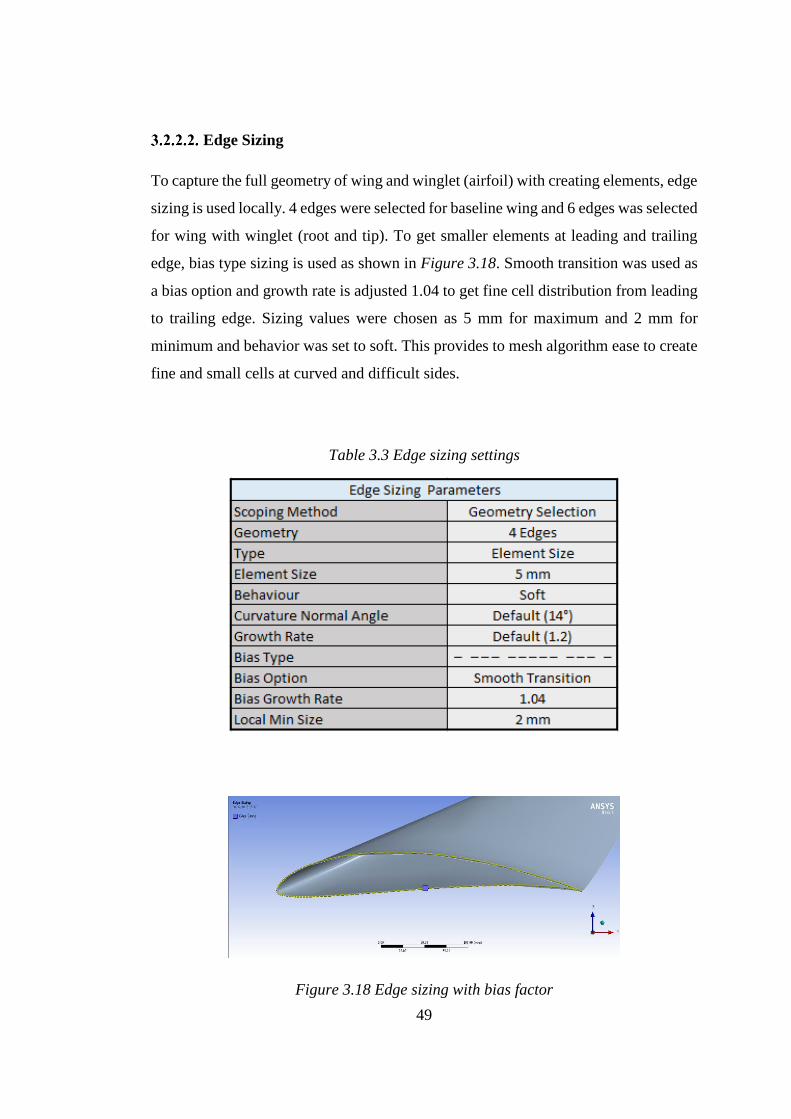
49
Edge Sizing
To capture the full geometry of wing and winglet (airfoil) with creating elements, edge
sizing is used locally. 4 edges were selected for baseline wing and 6 edges was selected
for wing with winglet (root and tip). To get smaller elements at leading and trailing
edge, bias type sizing is used as shown in Figure 3.18. Smooth transition was used as
a bias option and growth rate is adjusted 1.04 to get fine cell distribution from leading
to trailing edge. Sizing values were chosen as 5 mm for maximum and 2 mm for
minimum and behavior was set to soft. This provides to mesh algorithm ease to create
fine and small cells at curved and difficult sides.
Table 3.3 Edge sizing settings
Figure 3.18 Edge sizing with bias factor
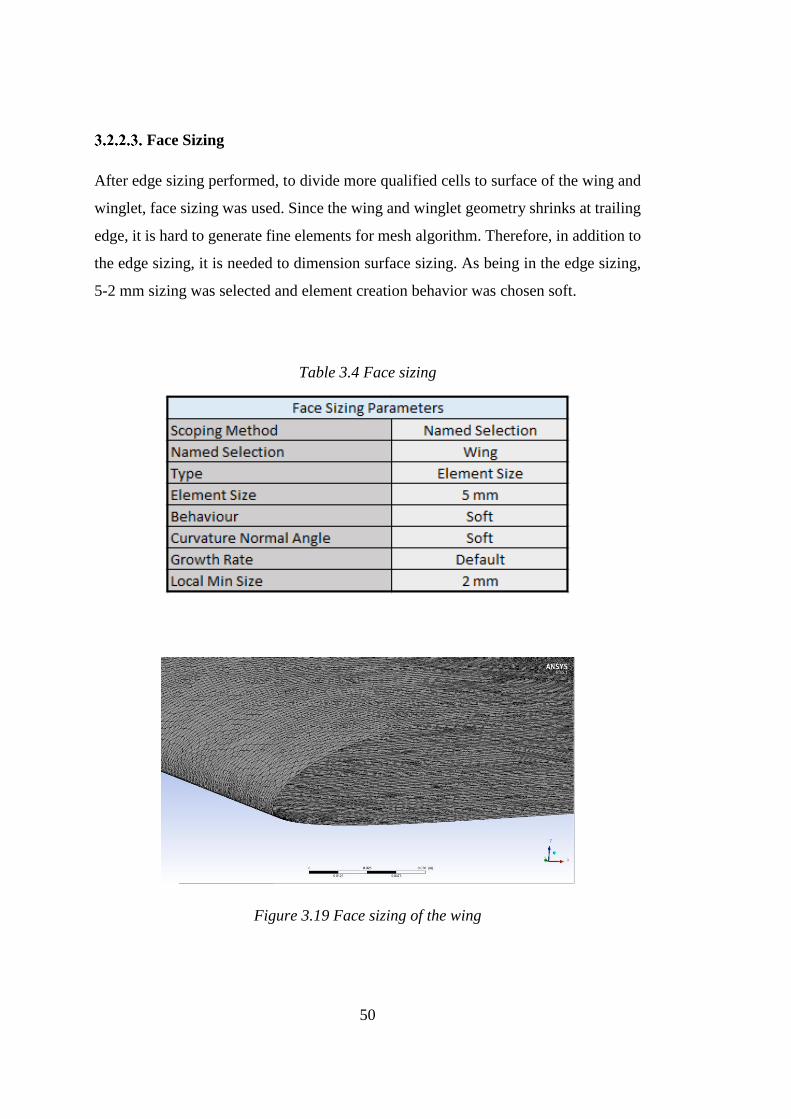
50
Face Sizing
After edge sizing performed, to divide more qualified cells to surface of the wing and
winglet, face sizing was used. Since the wing and winglet geometry shrinks at trailing
edge, it is hard to generate fine elements for mesh algorithm. Therefore, in addition to
the edge sizing, it is needed to dimension surface sizing. As being in the edge sizing,
5-2 mm sizing was selected and element creation behavior was chosen soft.
Table 3.4 Face sizing
Figure 3.19 Face sizing of the wing
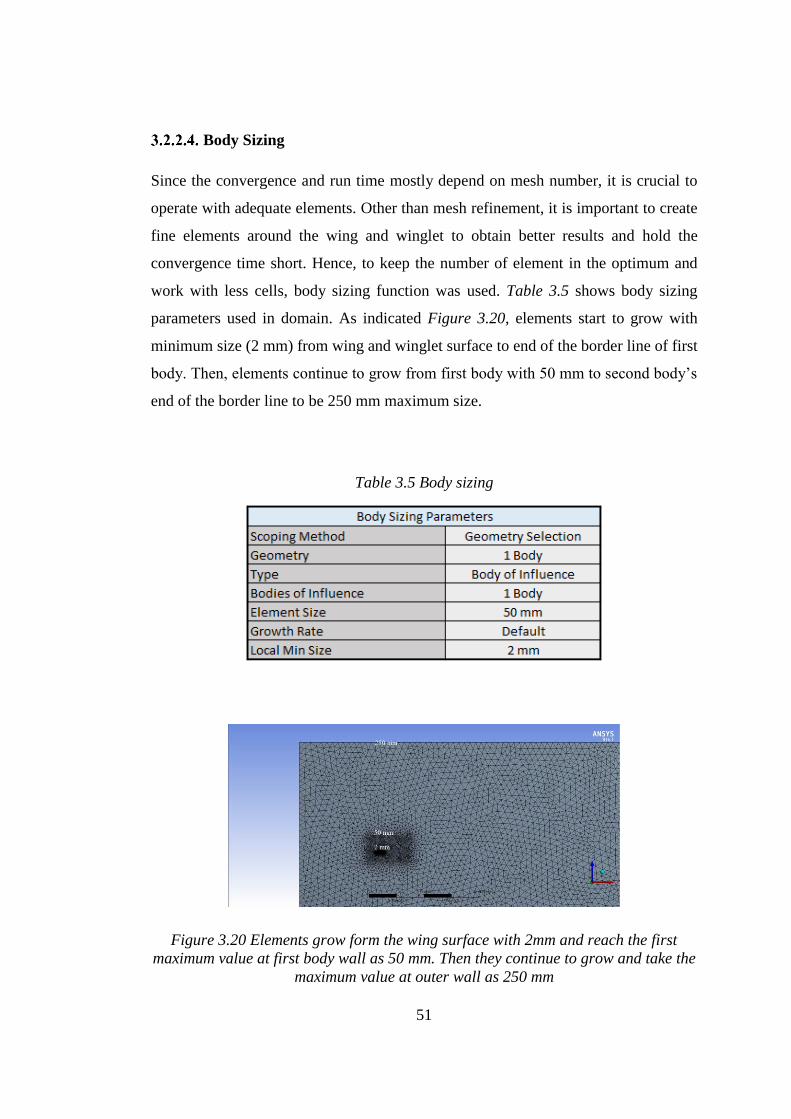
51
Body Sizing
Since the convergence and run time mostly depend on mesh number, it is crucial to
operate with adequate elements. Other than mesh refinement, it is important to create
fine elements around the wing and winglet to obtain better results and hold the
convergence time short. Hence, to keep the number of element in the optimum and
work with less cells, body sizing function was used. Table 3.5 shows body sizing
parameters used in domain. As indicated Figure 3.20, elements start to grow with
minimum size (2 mm) from wing and winglet surface to end of the border line of first
body. Then, elements continue to grow from first body with 50 mm to second body’s
end of the border line to be 250 mm maximum size.
Table 3.5 Body sizing
Figure 3.20 Elements grow form the wing surface with 2mm and reach the first
maximum value at first body wall as 50 mm. Then they continue to grow and take the
maximum value at outer wall as 250 mm
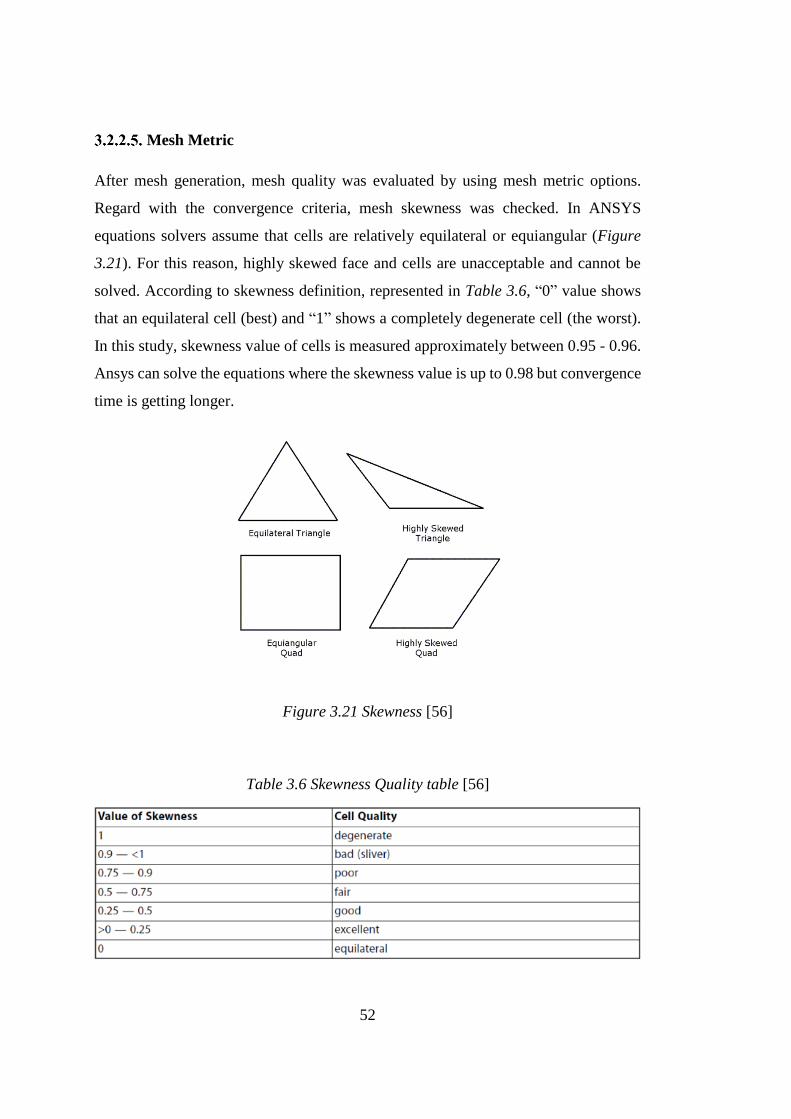
52
Mesh Metric
After mesh generation, mesh quality was evaluated by using mesh metric options.
Regard with the convergence criteria, mesh skewness was checked. In ANSYS
equations solvers assume that cells are relatively equilateral or equiangular (Figure
3.21). For this reason, highly skewed face and cells are unacceptable and cannot be
solved. According to skewness definition, represented in Table 3.6, “0” value shows
that an equilateral cell (best) and “1” shows a completely degenerate cell (the worst).
In this study, skewness value of cells is measured approximately between 0.95 - 0.96.
Ansys can solve the equations where the skewness value is up to 0.98 but convergence
time is getting longer.
Figure 3.21 Skewness [56]
Table 3.6 Skewness Quality table [56]
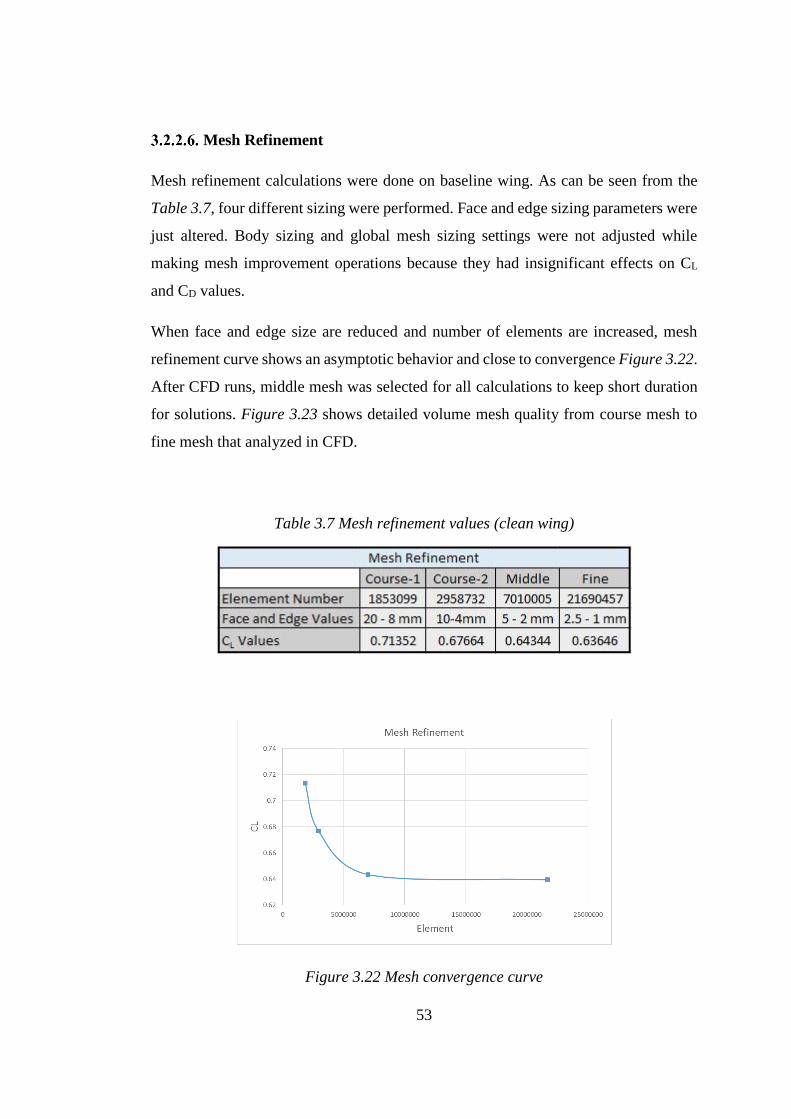
53
Mesh Refinement
Mesh refinement calculations were done on baseline wing. As can be seen from the
Table 3.7, four different sizing were performed. Face and edge sizing parameters were
just altered. Body sizing and global mesh sizing settings were not adjusted while
making mesh improvement operations because they had insignificant effects on CL
and CD values.
When face and edge size are reduced and number of elements are increased, mesh
refinement curve shows an asymptotic behavior and close to convergence Figure 3.22.
After CFD runs, middle mesh was selected for all calculations to keep short duration
for solutions. Figure 3.23 shows detailed volume mesh quality from course mesh to
fine mesh that analyzed in CFD.
Table 3.7 Mesh refinement values (clean wing)
Figure 3.22 Mesh convergence curve
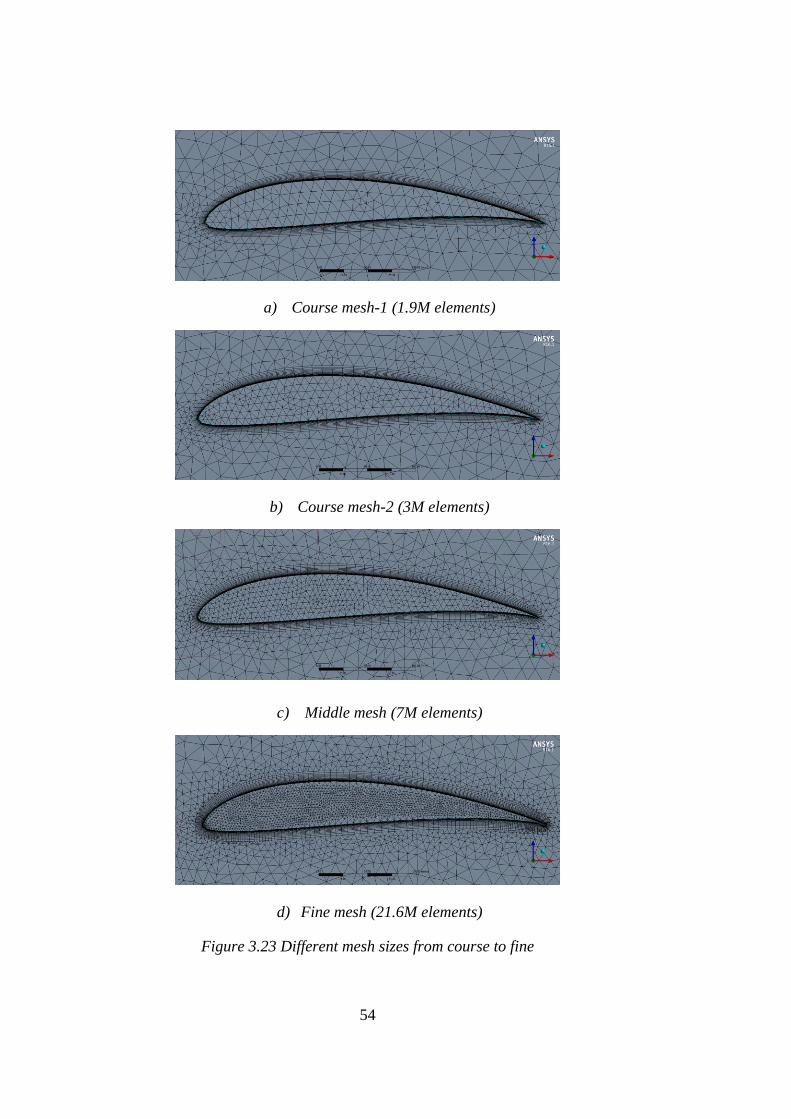
54
a) Course mesh-1 (1.9M elements)
b) Course mesh-2 (3M elements)
c) Middle mesh (7M elements)
d) Fine mesh (21.6M elements)
Figure 3.23 Different mesh sizes from course to fine
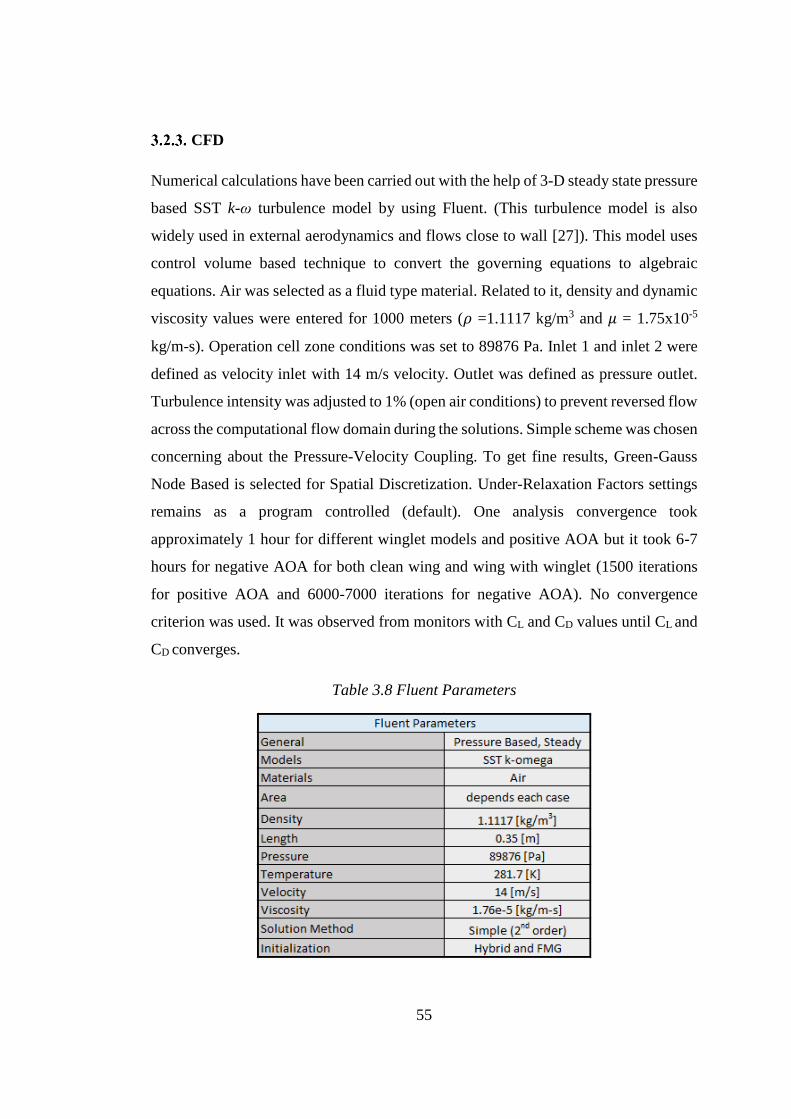
55
CFD
Numerical calculations have been carried out with the help of 3-D steady state pressure
based SST k-ω turbulence model by using Fluent. (This turbulence model is also
widely used in external aerodynamics and flows close to wall [27]). This model uses
control volume based technique to convert the governing equations to algebraic
equations. Air was selected as a fluid type material. Related to it, density and dynamic
viscosity values were entered for 1000 meters (𝜌 =1.1117 kg/m3 and 𝜇 = 1.75x10⁻⁵
kg/m-s). Operation cell zone conditions was set to 89876 Pa. Inlet 1 and inlet 2 were
defined as velocity inlet with 14 m/s velocity. Outlet was defined as pressure outlet.
Turbulence intensity was adjusted to 1% (open air conditions) to prevent reversed flow
across the computational flow domain during the solutions. Simple scheme was chosen
concerning about the Pressure-Velocity Coupling. To get fine results, Green-Gauss
Node Based is selected for Spatial Discretization. Under-Relaxation Factors settings
remains as a program controlled (default). One analysis convergence took
approximately 1 hour for different winglet models and positive AOA but it took 6-7
hours for negative AOA for both clean wing and wing with winglet (1500 iterations
for positive AOA and 6000-7000 iterations for negative AOA). No convergence
criterion was used. It was observed from monitors with CL and CD values until CL and
CD converges.
Table 3.8 Fluent Parameters

56
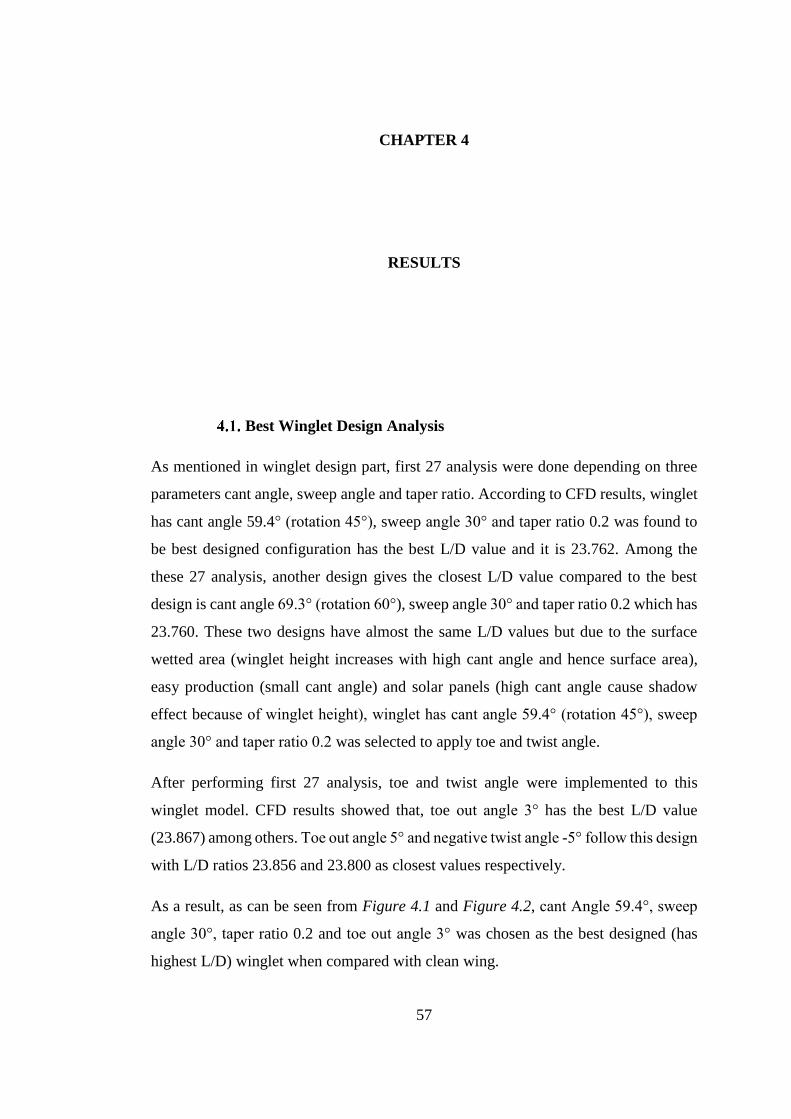
57
CHAPTER 4
RESULTS
4. RESULTS
Best Winglet Design Analysis
As mentioned in winglet design part, first 27 analysis were done depending on three
parameters cant angle, sweep angle and taper ratio. According to CFD results, winglet
has cant angle 59.4° (rotation 45°), sweep angle 30° and taper ratio 0.2 was found to
be best designed configuration has the best L/D value and it is 23.762. Among the
these 27 analysis, another design gives the closest L/D value compared to the best
design is cant angle 69.3° (rotation 60°), sweep angle 30° and taper ratio 0.2 which has
23.760. These two designs have almost the same L/D values but due to the surface
wetted area (winglet height increases with high cant angle and hence surface area),
easy production (small cant angle) and solar panels (high cant angle cause shadow
effect because of winglet height), winglet has cant angle 59.4° (rotation 45°), sweep
angle 30° and taper ratio 0.2 was selected to apply toe and twist angle.
After performing first 27 analysis, toe and twist angle were implemented to this
winglet model. CFD results showed that, toe out angle 3° has the best L/D value
(23.867) among others. Toe out angle 5° and negative twist angle -5° follow this design
with L/D ratios 23.856 and 23.800 as closest values respectively.
As a result, as can be seen from Figure 4.1 and Figure 4.2, cant Angle 59.4°, sweep
angle 30°, taper ratio 0.2 and toe out angle 3° was chosen as the best designed (has
highest L/D) winglet when compared with clean wing.
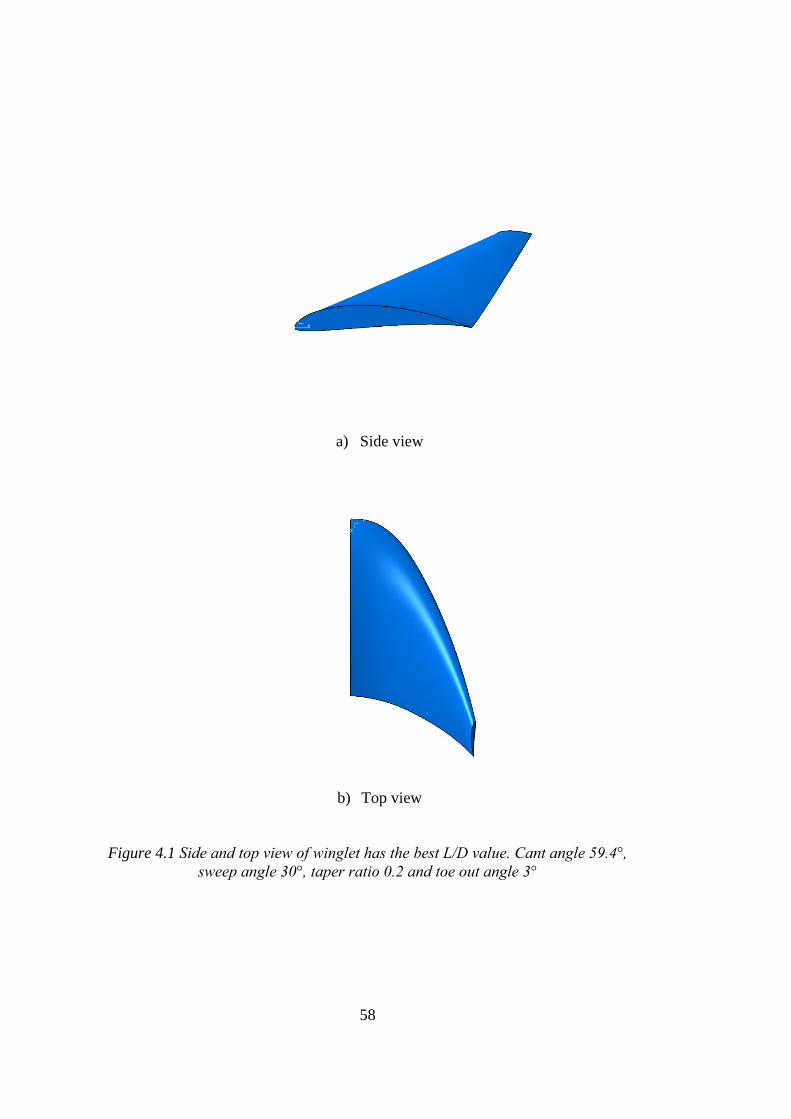
58
a) Side view
b) Top view
Figure 4.1 Side and top view of winglet has the best L/D value. Cant angle 59.4°,
sweep angle 30°, taper ratio 0.2 and toe out angle 3°
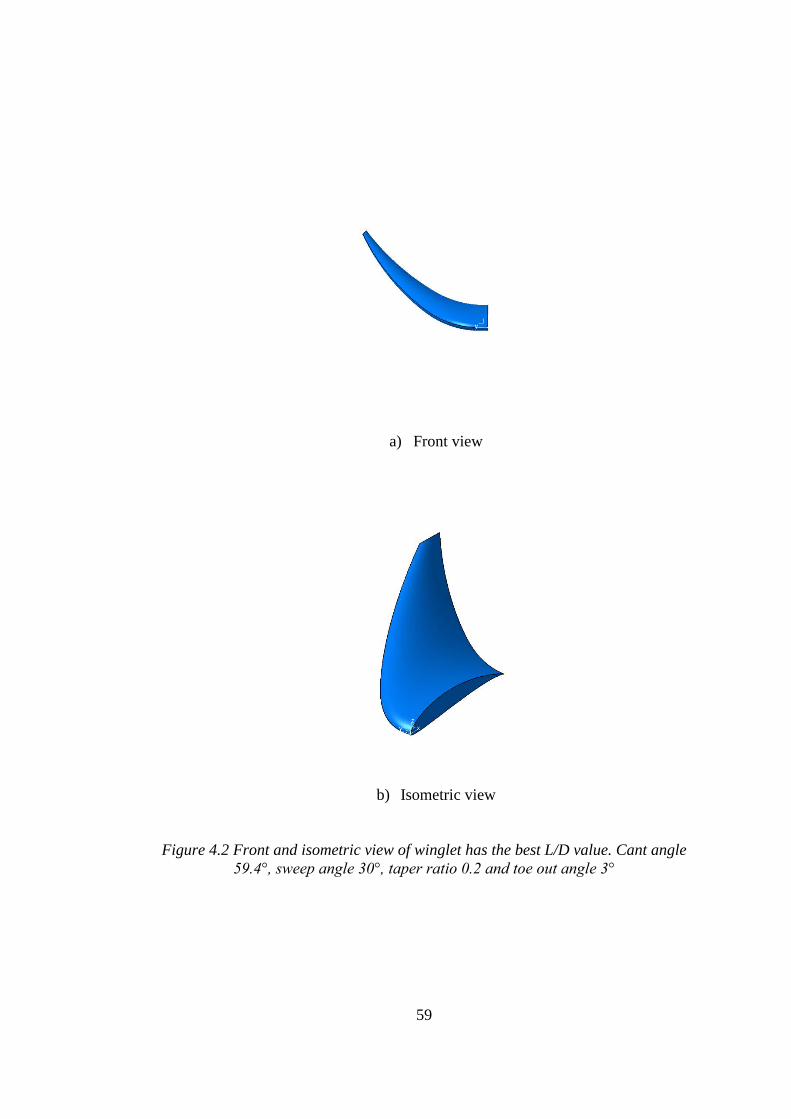
59
a) Front view
b) Isometric view
Figure 4.2 Front and isometric view of winglet has the best L/D value. Cant angle
59.4°, sweep angle 30°, taper ratio 0.2 and toe out angle 3°
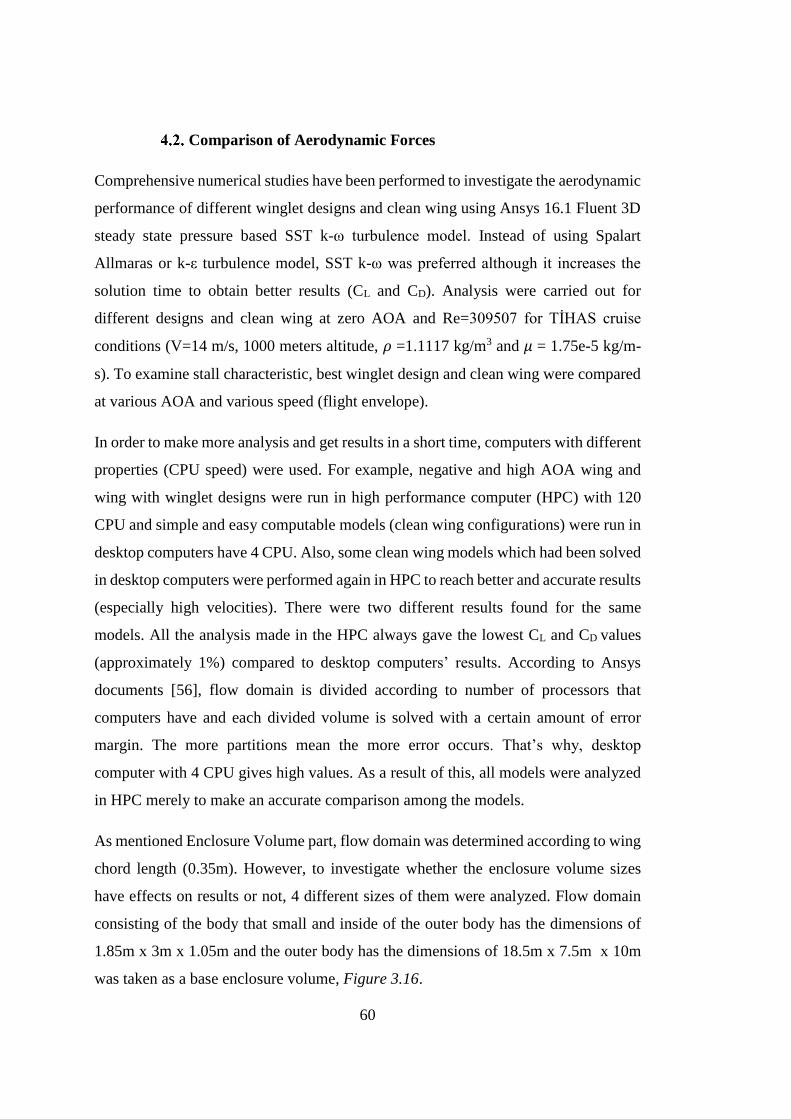
60
Comparison of Aerodynamic Forces
Comprehensive numerical studies have been performed to investigate the aerodynamic
performance of different winglet designs and clean wing using Ansys 16.1 Fluent 3D
steady state pressure based SST k-ω turbulence model. Instead of using Spalart
Allmaras or k-ε turbulence model, SST k-ω was preferred although it increases the
solution time to obtain better results (CL and CD). Analysis were carried out for
different designs and clean wing at zero AOA and Re=309507 for TİHAS cruise
conditions (V=14 m/s, 1000 meters altitude, 𝜌 =1.1117 kg/m3 and 𝜇 = 1.75e-5 kg/m-
s). To examine stall characteristic, best winglet design and clean wing were compared
at various AOA and various speed (flight envelope).
In order to make more analysis and get results in a short time, computers with different
properties (CPU speed) were used. For example, negative and high AOA wing and
wing with winglet designs were run in high performance computer (HPC) with 120
CPU and simple and easy computable models (clean wing configurations) were run in
desktop computers have 4 CPU. Also, some clean wing models which had been solved
in desktop computers were performed again in HPC to reach better and accurate results
(especially high velocities). There were two different results found for the same
models. All the analysis made in the HPC always gave the lowest CL and CD values
(approximately 1%) compared to desktop computers’ results. According to Ansys
documents [56], flow domain is divided according to number of processors that
computers have and each divided volume is solved with a certain amount of error
margin. The more partitions mean the more error occurs. That’s why, desktop
computer with 4 CPU gives high values. As a result of this, all models were analyzed
in HPC merely to make an accurate comparison among the models.
As mentioned Enclosure Volume part, flow domain was determined according to wing
chord length (0.35m). However, to investigate whether the enclosure volume sizes
have effects on results or not, 4 different sizes of them were analyzed. Flow domain
consisting of the body that small and inside of the outer body has the dimensions of
1.85m x 3m x 1.05m and the outer body has the dimensions of 18.5m x 7.5m x 10m
was taken as a base enclosure volume, Figure 3.16.
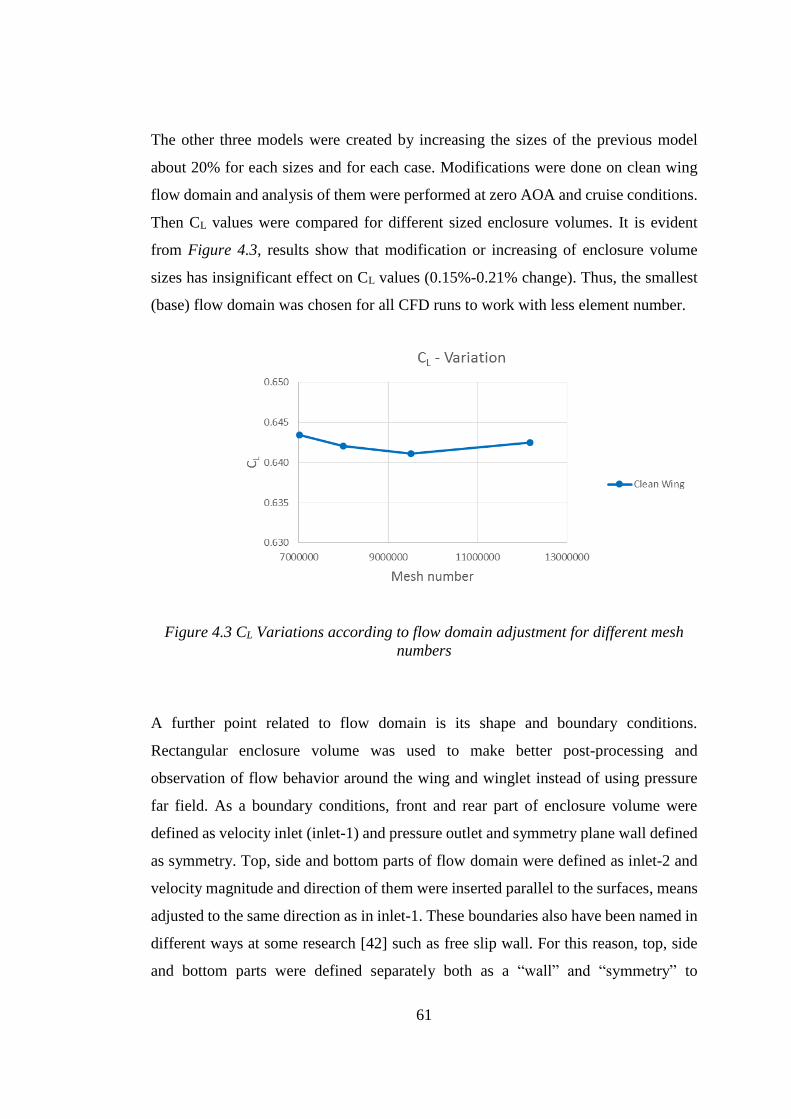
61
The other three models were created by increasing the sizes of the previous model
about 20% for each sizes and for each case. Modifications were done on clean wing
flow domain and analysis of them were performed at zero AOA and cruise conditions.
Then CL values were compared for different sized enclosure volumes. It is evident
from Figure 4.3, results show that modification or increasing of enclosure volume
sizes has insignificant effect on CL values (0.15%-0.21% change). Thus, the smallest
(base) flow domain was chosen for all CFD runs to work with less element number.
Figure 4.3 CL Variations according to flow domain adjustment for different mesh
numbers
A further point related to flow domain is its shape and boundary conditions.
Rectangular enclosure volume was used to make better post-processing and
observation of flow behavior around the wing and winglet instead of using pressure
far field. As a boundary conditions, front and rear part of enclosure volume were
defined as velocity inlet (inlet-1) and pressure outlet and symmetry plane wall defined
as symmetry. Top, side and bottom parts of flow domain were defined as inlet-2 and
velocity magnitude and direction of them were inserted parallel to the surfaces, means
adjusted to the same direction as in inlet-1. These boundaries also have been named in
different ways at some research [42] such as free slip wall. For this reason, top, side
and bottom parts were defined separately both as a “wall” and “symmetry” to
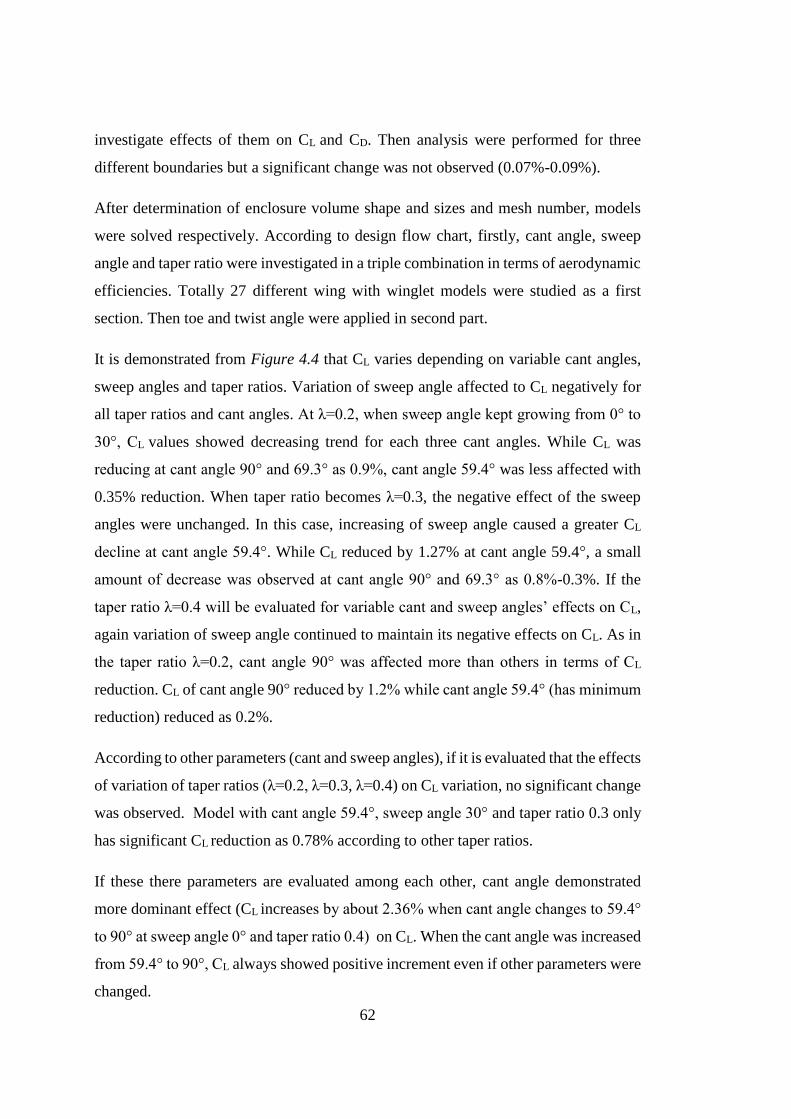
62
investigate effects of them on CL and CD. Then analysis were performed for three
different boundaries but a significant change was not observed (0.07%-0.09%).
After determination of enclosure volume shape and sizes and mesh number, models
were solved respectively. According to design flow chart, firstly, cant angle, sweep
angle and taper ratio were investigated in a triple combination in terms of aerodynamic
efficiencies. Totally 27 different wing with winglet models were studied as a first
section. Then toe and twist angle were applied in second part.
It is demonstrated from Figure 4.4 that CL varies depending on variable cant angles,
sweep angles and taper ratios. Variation of sweep angle affected to CL negatively for
all taper ratios and cant angles. At λ=0.2, when sweep angle kept growing from 0° to
30°, CL values showed decreasing trend for each three cant angles. While CL was
reducing at cant angle 90° and 69.3° as 0.9%, cant angle 59.4° was less affected with
0.35% reduction. When taper ratio becomes λ=0.3, the negative effect of the sweep
angles were unchanged. In this case, increasing of sweep angle caused a greater CL
decline at cant angle 59.4°. While CL reduced by 1.27% at cant angle 59.4°, a small
amount of decrease was observed at cant angle 90° and 69.3° as 0.8%-0.3%. If the
taper ratio λ=0.4 will be evaluated for variable cant and sweep angles’ effects on CL,
again variation of sweep angle continued to maintain its negative effects on CL. As in
the taper ratio λ=0.2, cant angle 90° was affected more than others in terms of CL
reduction. CL of cant angle 90° reduced by 1.2% while cant angle 59.4° (has minimum
reduction) reduced as 0.2%.
According to other parameters (cant and sweep angles), if it is evaluated that the effects
of variation of taper ratios (λ=0.2, λ=0.3, λ=0.4) on CL variation, no significant change
was observed. Model with cant angle 59.4°, sweep angle 30° and taper ratio 0.3 only
has significant CL reduction as 0.78% according to other taper ratios.
If these there parameters are evaluated among each other, cant angle demonstrated
more dominant effect (CL increases by about 2.36% when cant angle changes to 59.4°
to 90° at sweep angle 0° and taper ratio 0.4) on CL. When the cant angle was increased
from 59.4° to 90°, CL always showed positive increment even if other parameters were
changed.
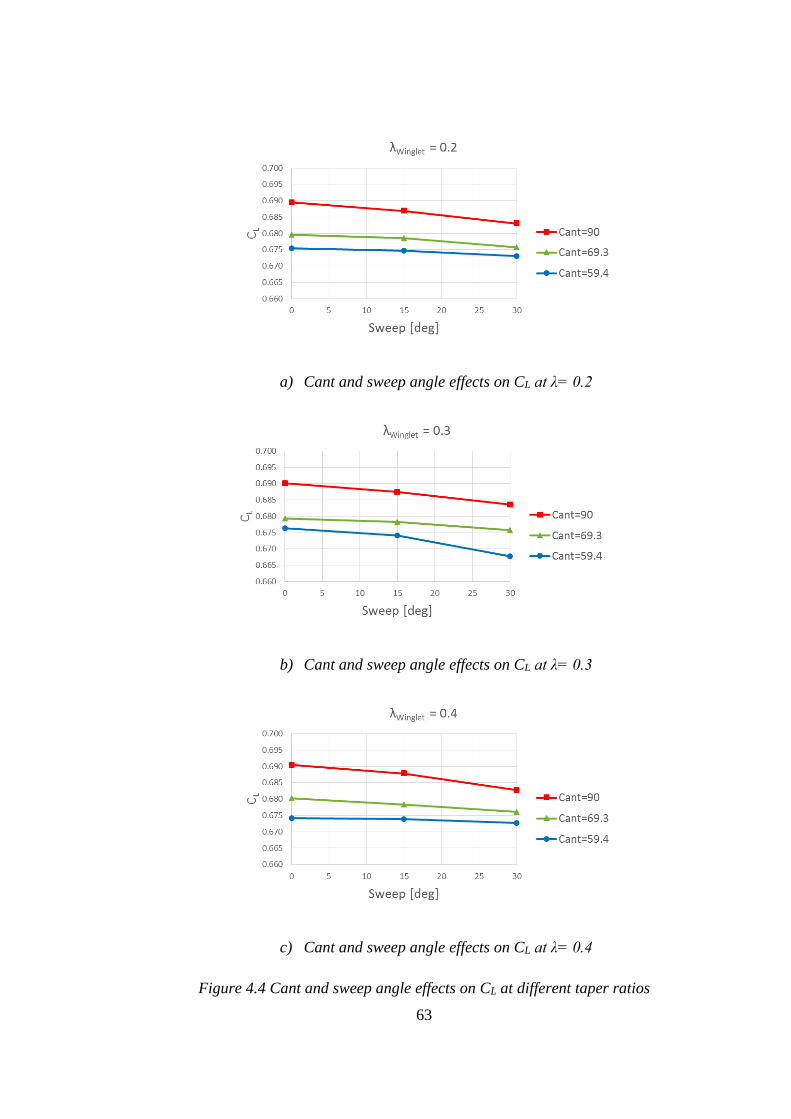
63
a) Cant and sweep angle effects on CL at λ= 0.2
b) Cant and sweep angle effects on CL at λ= 0.3
c) Cant and sweep angle effects on CL at λ= 0.4
Figure 4.4 Cant and sweep angle effects on CL at different taper ratios
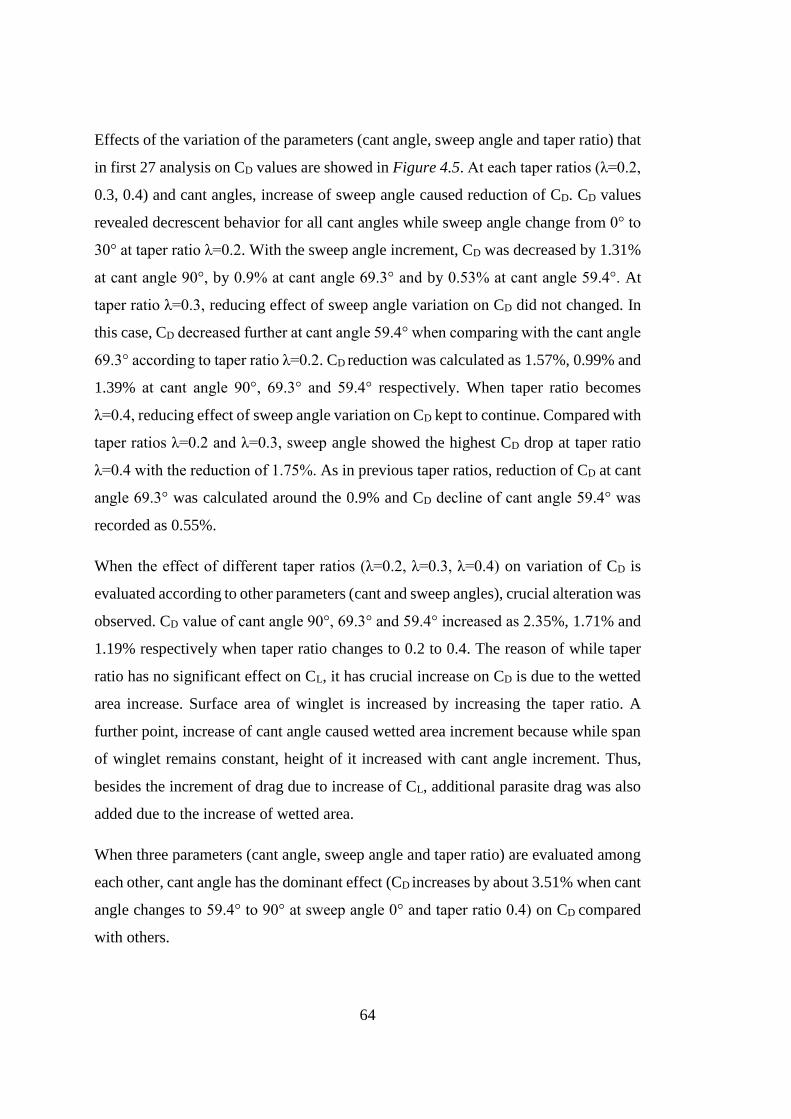
64
Effects of the variation of the parameters (cant angle, sweep angle and taper ratio) that
in first 27 analysis on CD values are showed in Figure 4.5. At each taper ratios (λ=0.2,
0.3, 0.4) and cant angles, increase of sweep angle caused reduction of CD. CD values
revealed decrescent behavior for all cant angles while sweep angle change from 0° to
30° at taper ratio λ=0.2. With the sweep angle increment, CD was decreased by 1.31%
at cant angle 90°, by 0.9% at cant angle 69.3° and by 0.53% at cant angle 59.4°. At
taper ratio λ=0.3, reducing effect of sweep angle variation on CD did not changed. In
this case, CD decreased further at cant angle 59.4° when comparing with the cant angle
69.3° according to taper ratio λ=0.2. CD reduction was calculated as 1.57%, 0.99% and
1.39% at cant angle 90°, 69.3° and 59.4° respectively. When taper ratio becomes
λ=0.4, reducing effect of sweep angle variation on CD kept to continue. Compared with
taper ratios λ=0.2 and λ=0.3, sweep angle showed the highest CD drop at taper ratio
λ=0.4 with the reduction of 1.75%. As in previous taper ratios, reduction of CD at cant
angle 69.3° was calculated around the 0.9% and CD decline of cant angle 59.4° was
recorded as 0.55%.
When the effect of different taper ratios (λ=0.2, λ=0.3, λ=0.4) on variation of CD is
evaluated according to other parameters (cant and sweep angles), crucial alteration was
observed. CD value of cant angle 90°, 69.3° and 59.4° increased as 2.35%, 1.71% and
1.19% respectively when taper ratio changes to 0.2 to 0.4. The reason of while taper
ratio has no significant effect on CL, it has crucial increase on CD is due to the wetted
area increase. Surface area of winglet is increased by increasing the taper ratio. A
further point, increase of cant angle caused wetted area increment because while span
of winglet remains constant, height of it increased with cant angle increment. Thus,
besides the increment of drag due to increase of CL, additional parasite drag was also
added due to the increase of wetted area.
When three parameters (cant angle, sweep angle and taper ratio) are evaluated among
each other, cant angle has the dominant effect (CD increases by about 3.51% when cant
angle changes to 59.4° to 90° at sweep angle 0° and taper ratio 0.4) on CD compared
with others.
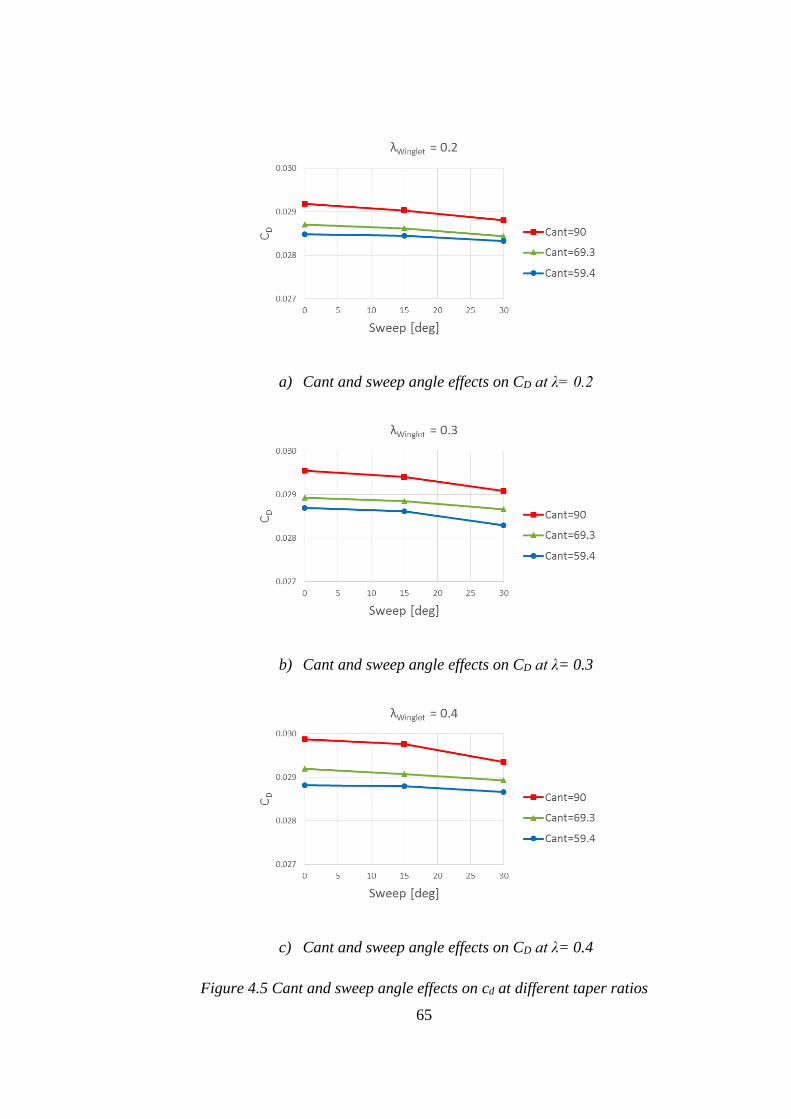
65
a) Cant and sweep angle effects on CD at λ= 0.2
b) Cant and sweep angle effects on CD at λ= 0.3
c) Cant and sweep angle effects on CD at λ= 0.4
Figure 4.5 Cant and sweep angle effects on cd at different taper ratios
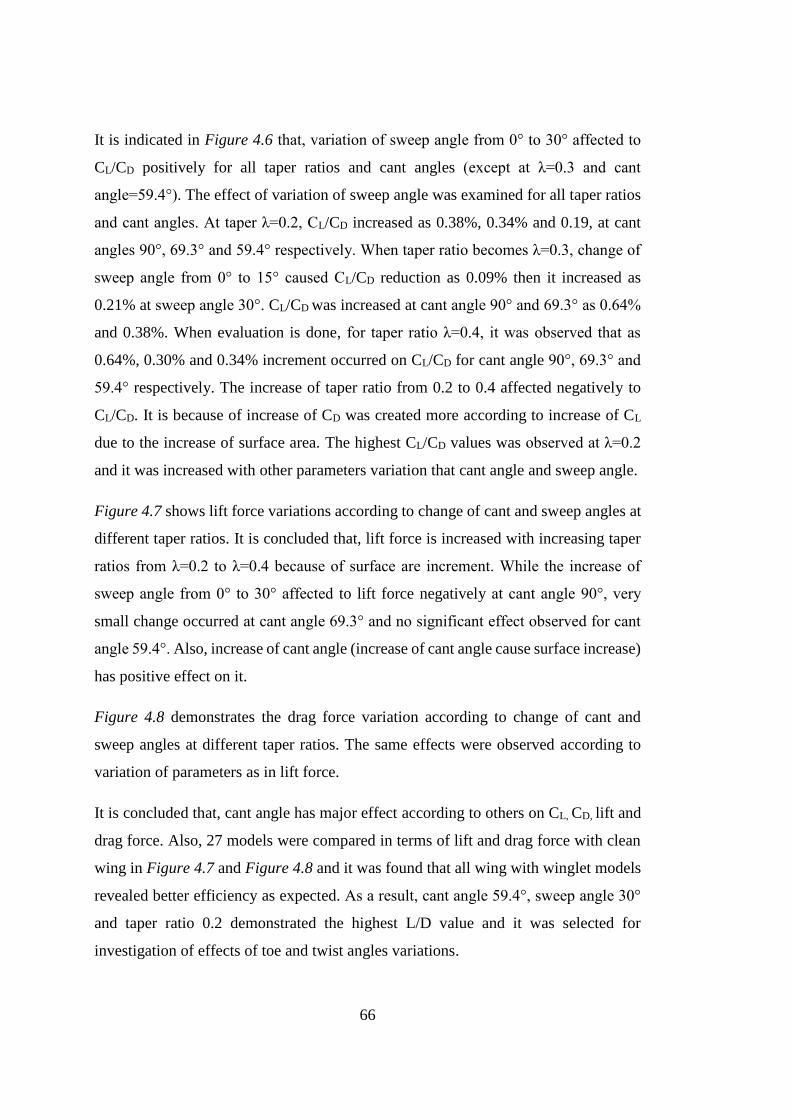
66
It is indicated in Figure 4.6 that, variation of sweep angle from 0° to 30° affected to
CL/CD positively for all taper ratios and cant angles (except at λ=0.3 and cant
angle=59.4°). The effect of variation of sweep angle was examined for all taper ratios
and cant angles. At taper λ=0.2, CL/CD increased as 0.38%, 0.34% and 0.19, at cant
angles 90°, 69.3° and 59.4° respectively. When taper ratio becomes λ=0.3, change of
sweep angle from 0° to 15° caused CL/CD reduction as 0.09% then it increased as
0.21% at sweep angle 30°. CL/CD was increased at cant angle 90° and 69.3° as 0.64%
and 0.38%. When evaluation is done, for taper ratio λ=0.4, it was observed that as
0.64%, 0.30% and 0.34% increment occurred on CL/CD for cant angle 90°, 69.3° and
59.4° respectively. The increase of taper ratio from 0.2 to 0.4 affected negatively to
CL/CD. It is because of increase of CD was created more according to increase of CL
due to the increase of surface area. The highest CL/CD values was observed at λ=0.2
and it was increased with other parameters variation that cant angle and sweep angle.
Figure 4.7 shows lift force variations according to change of cant and sweep angles at
different taper ratios. It is concluded that, lift force is increased with increasing taper
ratios from λ=0.2 to λ=0.4 because of surface are increment. While the increase of
sweep angle from 0° to 30° affected to lift force negatively at cant angle 90°, very
small change occurred at cant angle 69.3° and no significant effect observed for cant
angle 59.4°. Also, increase of cant angle (increase of cant angle cause surface increase)
has positive effect on it.
Figure 4.8 demonstrates the drag force variation according to change of cant and
sweep angles at different taper ratios. The same effects were observed according to
variation of parameters as in lift force.
It is concluded that, cant angle has major effect according to others on CL, CD, lift and
drag force. Also, 27 models were compared in terms of lift and drag force with clean
wing in Figure 4.7 and Figure 4.8 and it was found that all wing with winglet models
revealed better efficiency as expected. As a result, cant angle 59.4°, sweep angle 30°
and taper ratio 0.2 demonstrated the highest L/D value and it was selected for
investigation of effects of toe and twist angles variations.
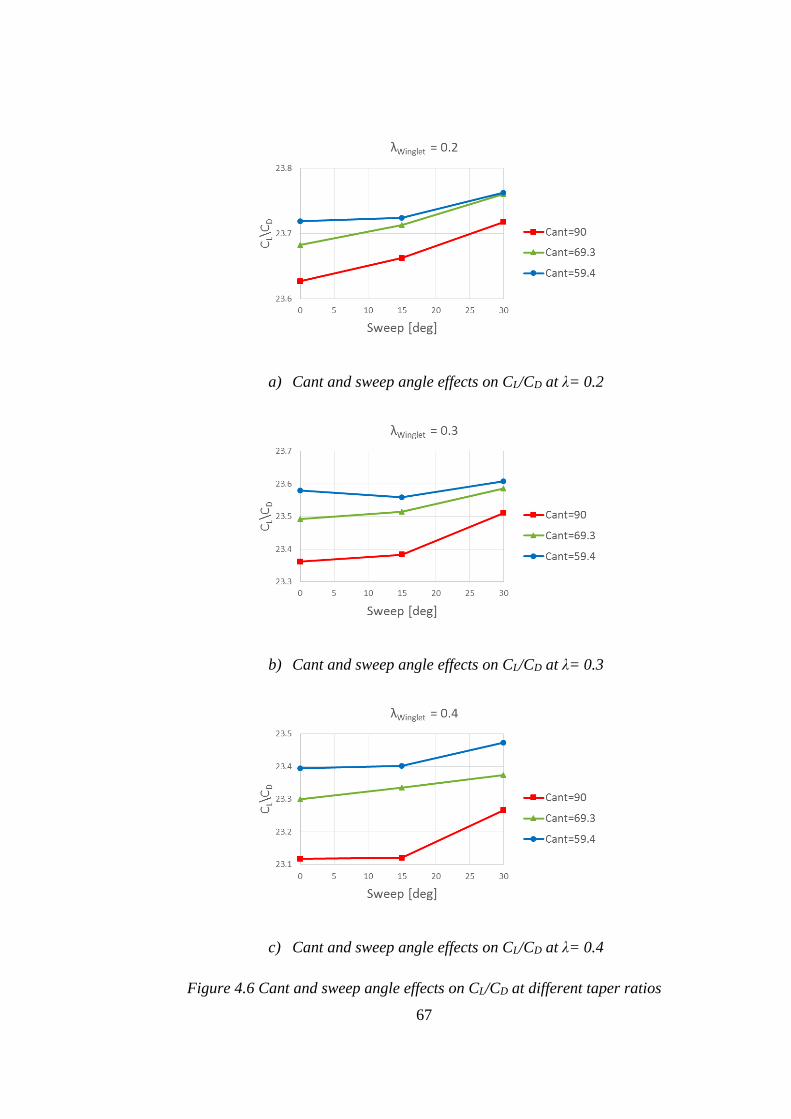
67
a) Cant and sweep angle effects on CL/CD at λ= 0.2
b) Cant and sweep angle effects on CL/CD at λ= 0.3
c) Cant and sweep angle effects on CL/CD at λ= 0.4
Figure 4.6 Cant and sweep angle effects on CL/CD at different taper ratios
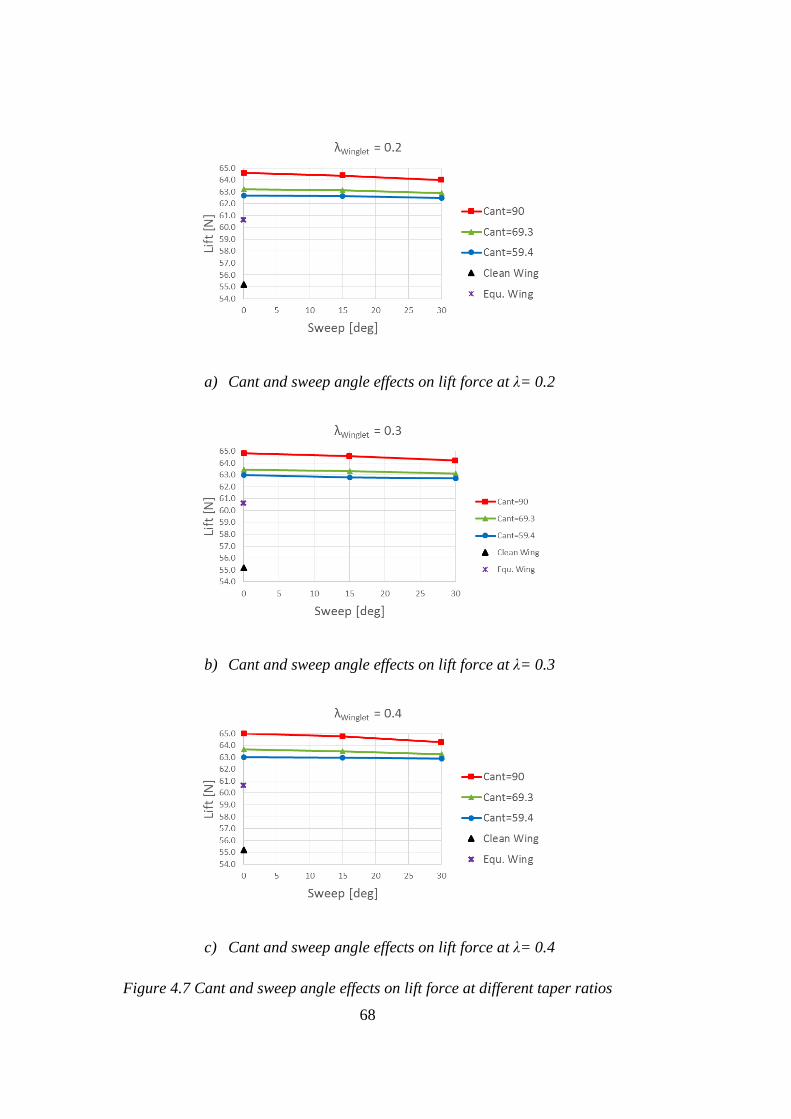
68
a) Cant and sweep angle effects on lift force at λ= 0.2
b) Cant and sweep angle effects on lift force at λ= 0.3
c) Cant and sweep angle effects on lift force at λ= 0.4
Figure 4.7 Cant and sweep angle effects on lift force at different taper ratios
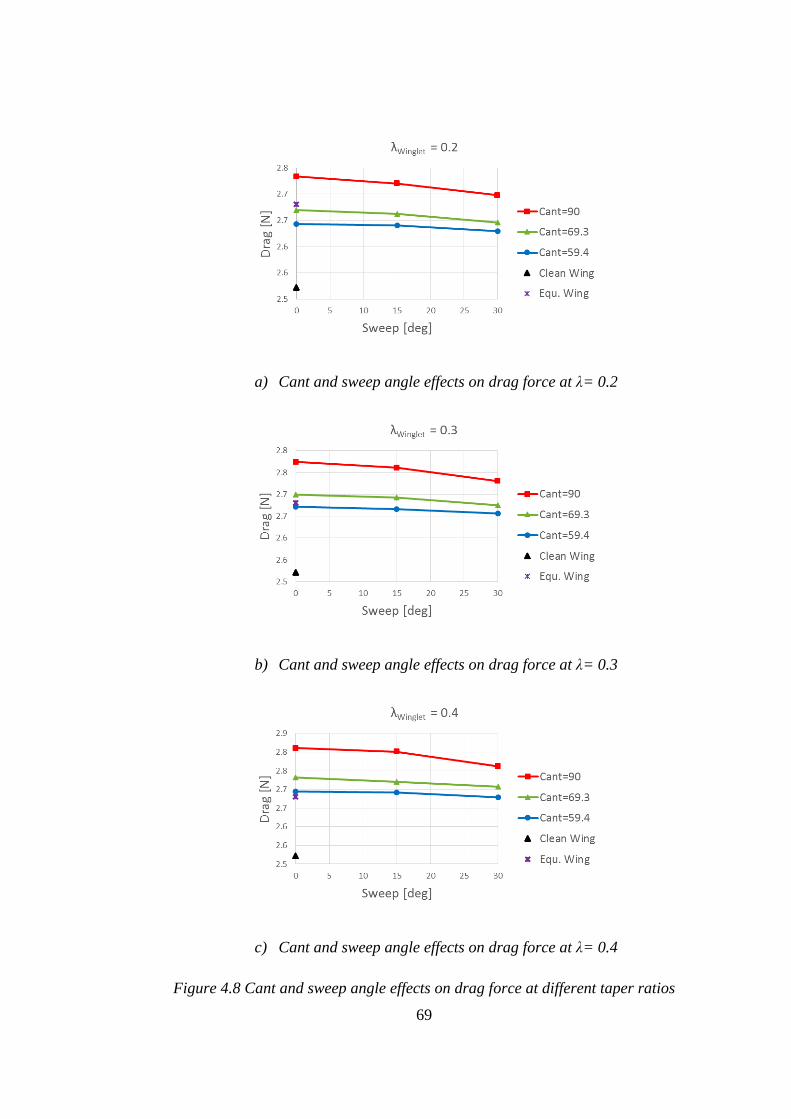
69
a) Cant and sweep angle effects on drag force at λ= 0.2
b) Cant and sweep angle effects on drag force at λ= 0.3
c) Cant and sweep angle effects on drag force at λ= 0.4
Figure 4.8 Cant and sweep angle effects on drag force at different taper ratios
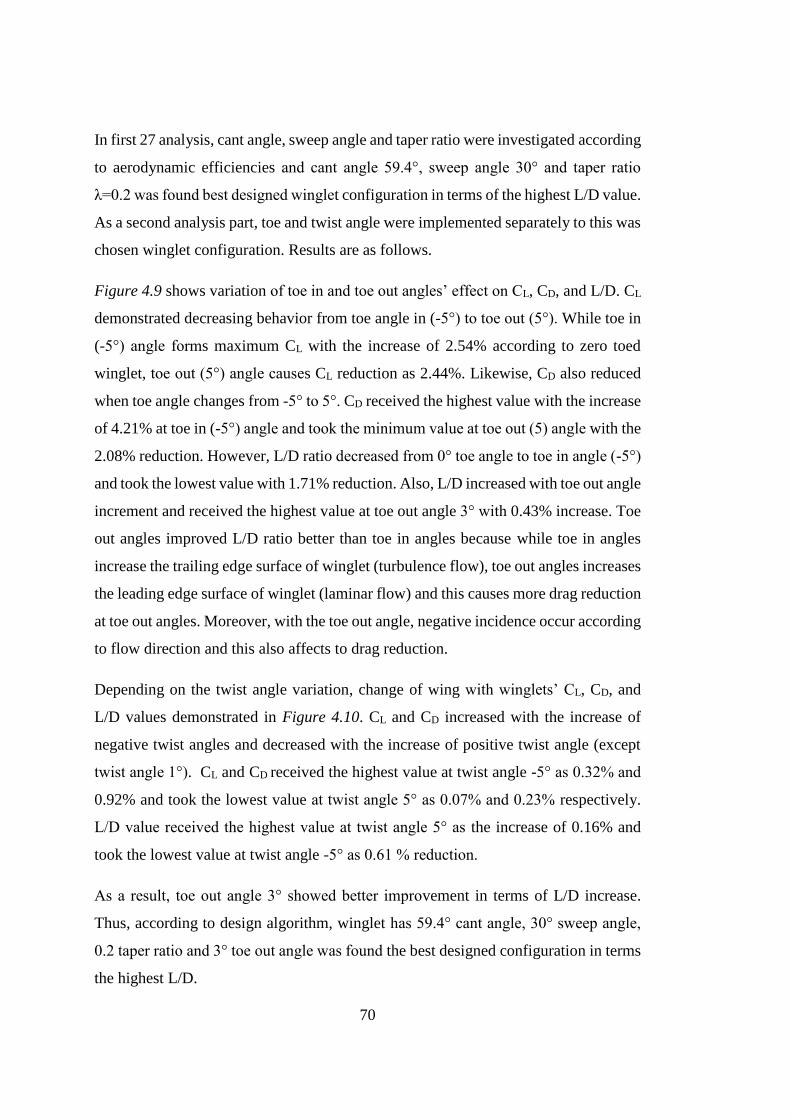
70
In first 27 analysis, cant angle, sweep angle and taper ratio were investigated according
to aerodynamic efficiencies and cant angle 59.4°, sweep angle 30° and taper ratio
λ=0.2 was found best designed winglet configuration in terms of the highest L/D value.
As a second analysis part, toe and twist angle were implemented separately to this was
chosen winglet configuration. Results are as follows.
Figure 4.9 shows variation of toe in and toe out angles’ effect on CL, CD, and L/D. CL
demonstrated decreasing behavior from toe angle in (-5°) to toe out (5°). While toe in
(-5°) angle forms maximum CL with the increase of 2.54% according to zero toed
winglet, toe out (5°) angle causes CL reduction as 2.44%. Likewise, CD also reduced
when toe angle changes from -5° to 5°. CD received the highest value with the increase
of 4.21% at toe in (-5°) angle and took the minimum value at toe out (5) angle with the
2.08% reduction. However, L/D ratio decreased from 0° toe angle to toe in angle (-5°)
and took the lowest value with 1.71% reduction. Also, L/D increased with toe out angle
increment and received the highest value at toe out angle 3° with 0.43% increase. Toe
out angles improved L/D ratio better than toe in angles because while toe in angles
increase the trailing edge surface of winglet (turbulence flow), toe out angles increases
the leading edge surface of winglet (laminar flow) and this causes more drag reduction
at toe out angles. Moreover, with the toe out angle, negative incidence occur according
to flow direction and this also affects to drag reduction.
Depending on the twist angle variation, change of wing with winglets’ CL, CD, and
L/D values demonstrated in Figure 4.10. CL and CD increased with the increase of
negative twist angles and decreased with the increase of positive twist angle (except
twist angle 1°). CL and CD received the highest value at twist angle -5° as 0.32% and
0.92% and took the lowest value at twist angle 5° as 0.07% and 0.23% respectively.
L/D value received the highest value at twist angle 5° as the increase of 0.16% and
took the lowest value at twist angle -5° as 0.61 % reduction.
As a result, toe out angle 3° showed better improvement in terms of L/D increase.
Thus, according to design algorithm, winglet has 59.4° cant angle, 30° sweep angle,
0.2 taper ratio and 3° toe out angle was found the best designed configuration in terms
the highest L/D.
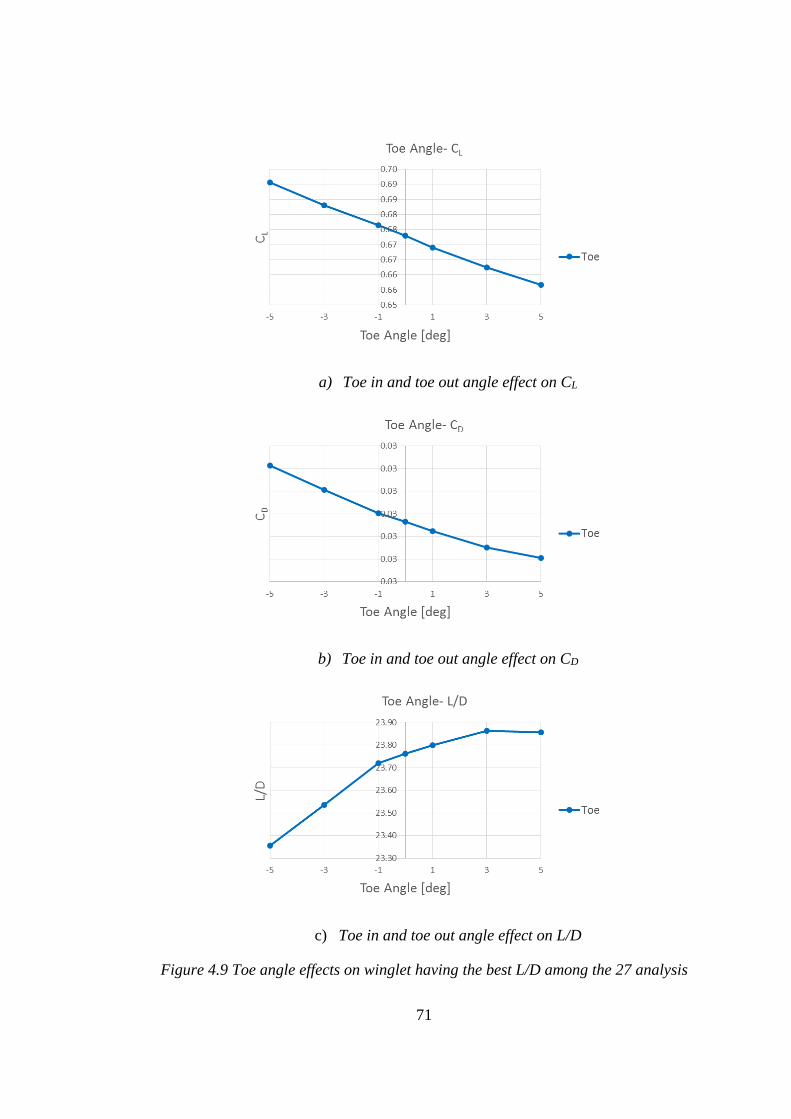
71
a) Toe in and toe out angle effect on CL
b) Toe in and toe out angle effect on CD
c) Toe in and toe out angle effect on L/D
Figure 4.9 Toe angle effects on winglet having the best L/D among the 27 analysis
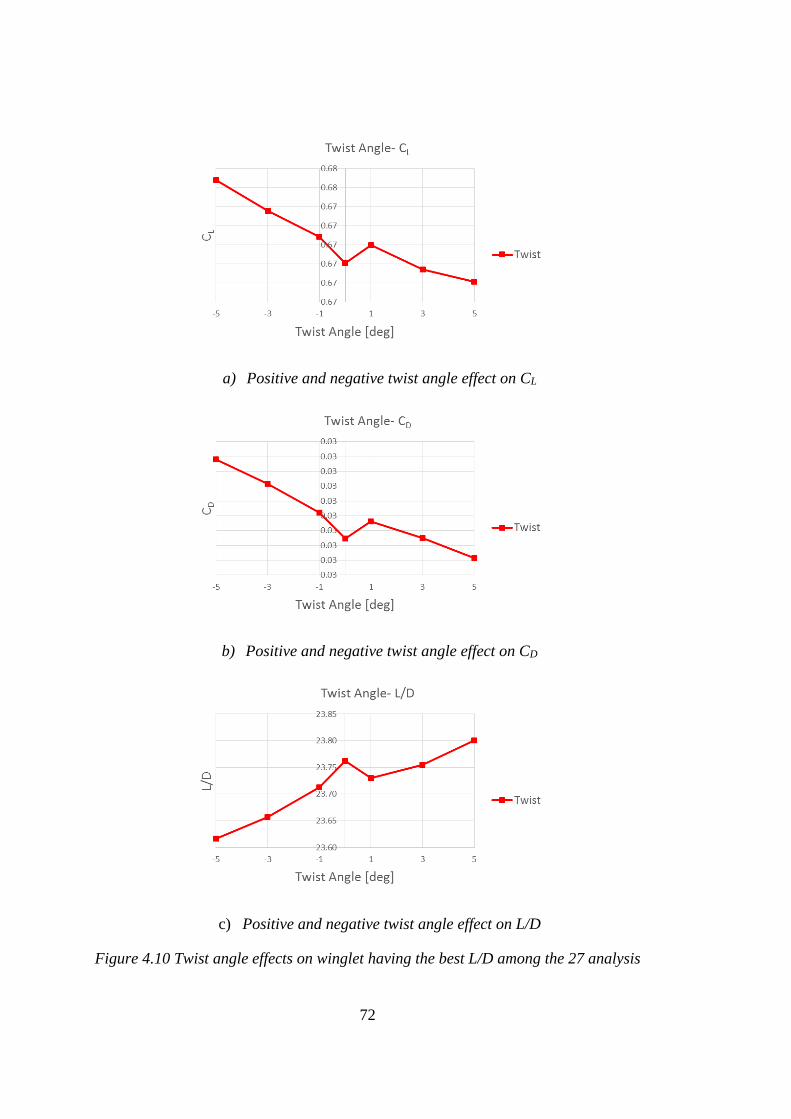
72
a) Positive and negative twist angle effect on CL
b) Positive and negative twist angle effect on CD
c) Positive and negative twist angle effect on L/D
Figure 4.10 Twist angle effects on winglet having the best L/D among the 27 analysis
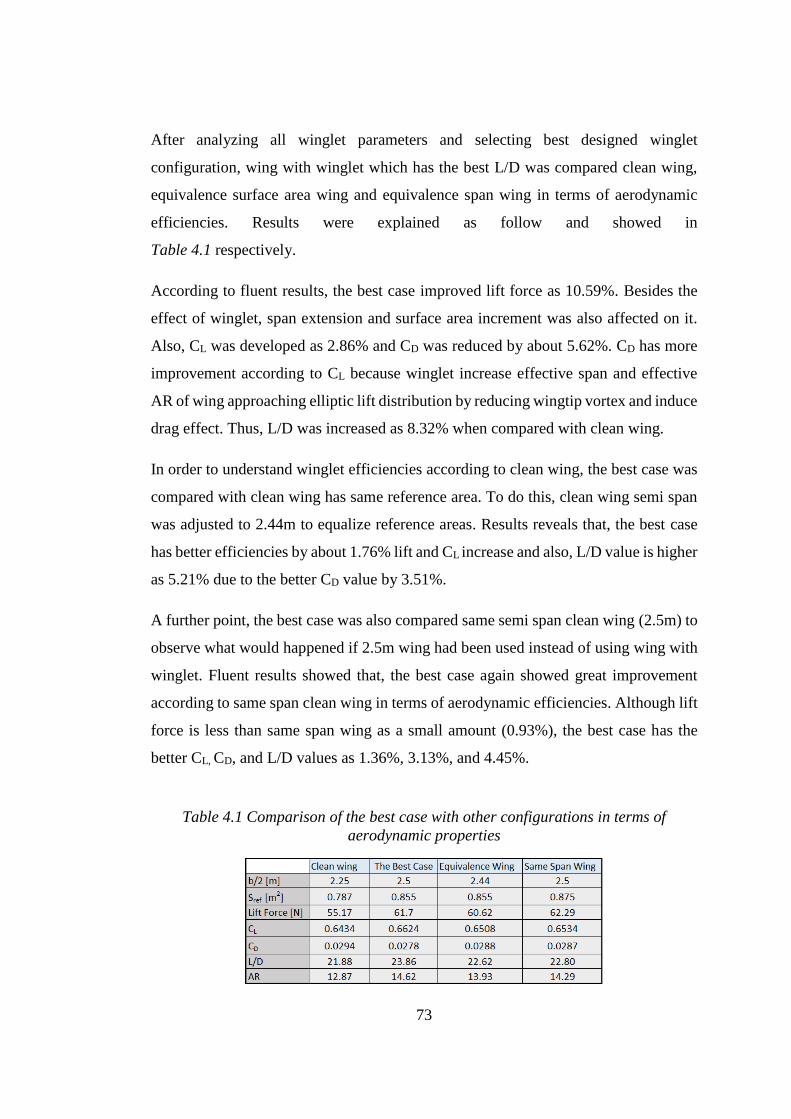
73
After analyzing all winglet parameters and selecting best designed winglet
configuration, wing with winglet which has the best L/D was compared clean wing,
equivalence surface area wing and equivalence span wing in terms of aerodynamic
efficiencies. Results were explained as follow and showed in
Table 4.1 respectively.
According to fluent results, the best case improved lift force as 10.59%. Besides the
effect of winglet, span extension and surface area increment was also affected on it.
Also, CL was developed as 2.86% and CD was reduced by about 5.62%. CD has more
improvement according to CL because winglet increase effective span and effective
AR of wing approaching elliptic lift distribution by reducing wingtip vortex and induce
drag effect. Thus, L/D was increased as 8.32% when compared with clean wing.
In order to understand winglet efficiencies according to clean wing, the best case was
compared with clean wing has same reference area. To do this, clean wing semi span
was adjusted to 2.44m to equalize reference areas. Results reveals that, the best case
has better efficiencies by about 1.76% lift and CL increase and also, L/D value is higher
as 5.21% due to the better CD value by 3.51%.
A further point, the best case was also compared same semi span clean wing (2.5m) to
observe what would happened if 2.5m wing had been used instead of using wing with
winglet. Fluent results showed that, the best case again showed great improvement
according to same span clean wing in terms of aerodynamic efficiencies. Although lift
force is less than same span wing as a small amount (0.93%), the best case has the
better CL, CD, and L/D values as 1.36%, 3.13%, and 4.45%.
Table 4.1 Comparison of the best case with other configurations in terms of
aerodynamic properties
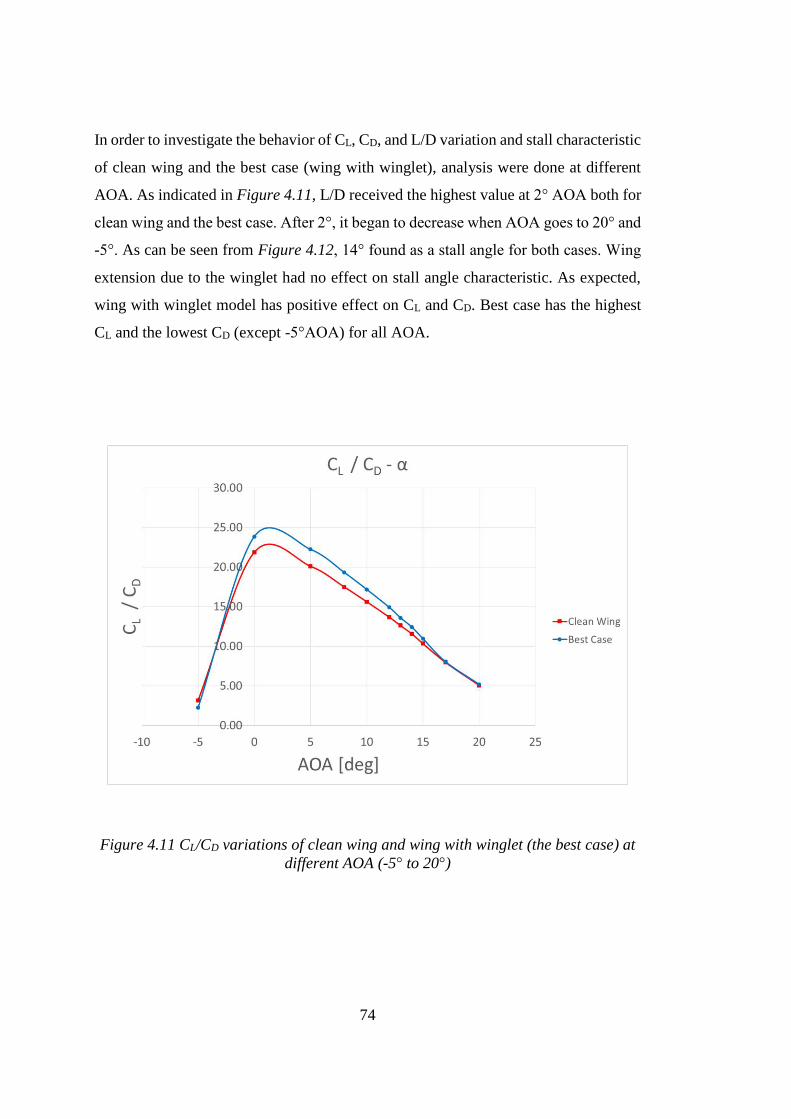
74
In order to investigate the behavior of CL, CD, and L/D variation and stall characteristic
of clean wing and the best case (wing with winglet), analysis were done at different
AOA. As indicated in Figure 4.11, L/D received the highest value at 2° AOA both for
clean wing and the best case. After 2°, it began to decrease when AOA goes to 20° and
-5°. As can be seen from Figure 4.12, 14° found as a stall angle for both cases. Wing
extension due to the winglet had no effect on stall angle characteristic. As expected,
wing with winglet model has positive effect on CL and CD. Best case has the highest
CL and the lowest CD (except -5°AOA) for all AOA.
Figure 4.11 CL/CD variations of clean wing and wing with winglet (the best case) at
different AOA (-5° to 20°)
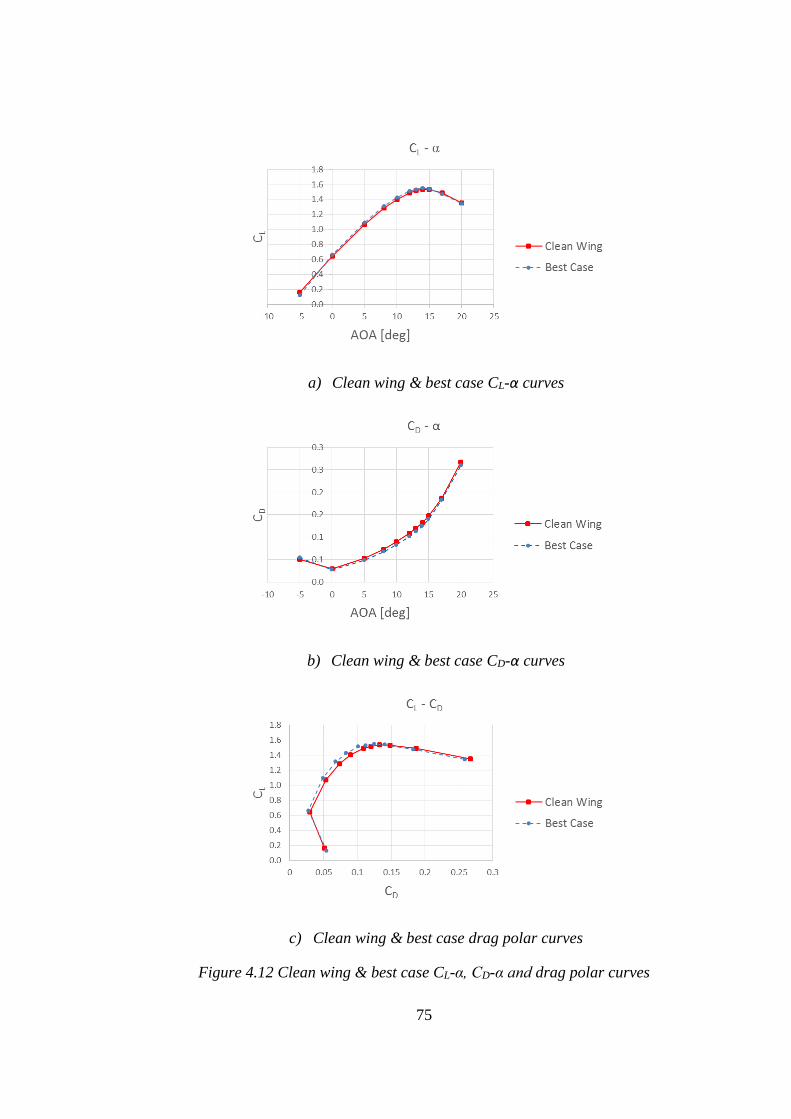
75
a) Clean wing & best case CL-α curves
b) Clean wing & best case CD-α curves
c) Clean wing & best case drag polar curves
Figure 4.12 Clean wing & best case CL-α, CD-α and drag polar curves
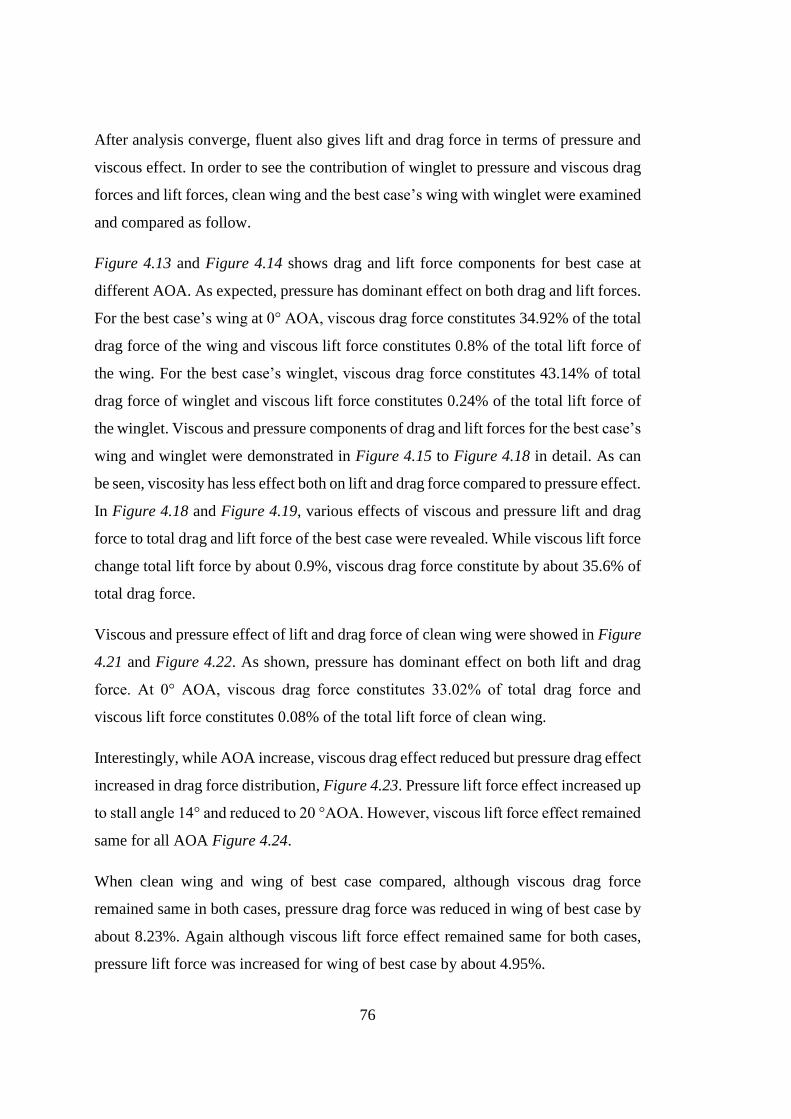
76
After analysis converge, fluent also gives lift and drag force in terms of pressure and
viscous effect. In order to see the contribution of winglet to pressure and viscous drag
forces and lift forces, clean wing and the best case’s wing with winglet were examined
and compared as follow.
Figure 4.13 and Figure 4.14 shows drag and lift force components for best case at
different AOA. As expected, pressure has dominant effect on both drag and lift forces.
For the best case’s wing at 0° AOA, viscous drag force constitutes 34.92% of the total
drag force of the wing and viscous lift force constitutes 0.8% of the total lift force of
the wing. For the best case’s winglet, viscous drag force constitutes 43.14% of total
drag force of winglet and viscous lift force constitutes 0.24% of the total lift force of
the winglet. Viscous and pressure components of drag and lift forces for the best case’s
wing and winglet were demonstrated in Figure 4.15 to Figure 4.18 in detail. As can
be seen, viscosity has less effect both on lift and drag force compared to pressure effect.
In Figure 4.18 and Figure 4.19, various effects of viscous and pressure lift and drag
force to total drag and lift force of the best case were revealed. While viscous lift force
change total lift force by about 0.9%, viscous drag force constitute by about 35.6% of
total drag force.
Viscous and pressure effect of lift and drag force of clean wing were showed in Figure
4.21 and Figure 4.22. As shown, pressure has dominant effect on both lift and drag
force. At 0° AOA, viscous drag force constitutes 33.02% of total drag force and
viscous lift force constitutes 0.08% of the total lift force of clean wing.
Interestingly, while AOA increase, viscous drag effect reduced but pressure drag effect
increased in drag force distribution, Figure 4.23. Pressure lift force effect increased up
to stall angle 14° and reduced to 20 °AOA. However, viscous lift force effect remained
same for all AOA Figure 4.24.
When clean wing and wing of best case compared, although viscous drag force
remained same in both cases, pressure drag force was reduced in wing of best case by
about 8.23%. Again although viscous lift force effect remained same for both cases,
pressure lift force was increased for wing of best case by about 4.95%.
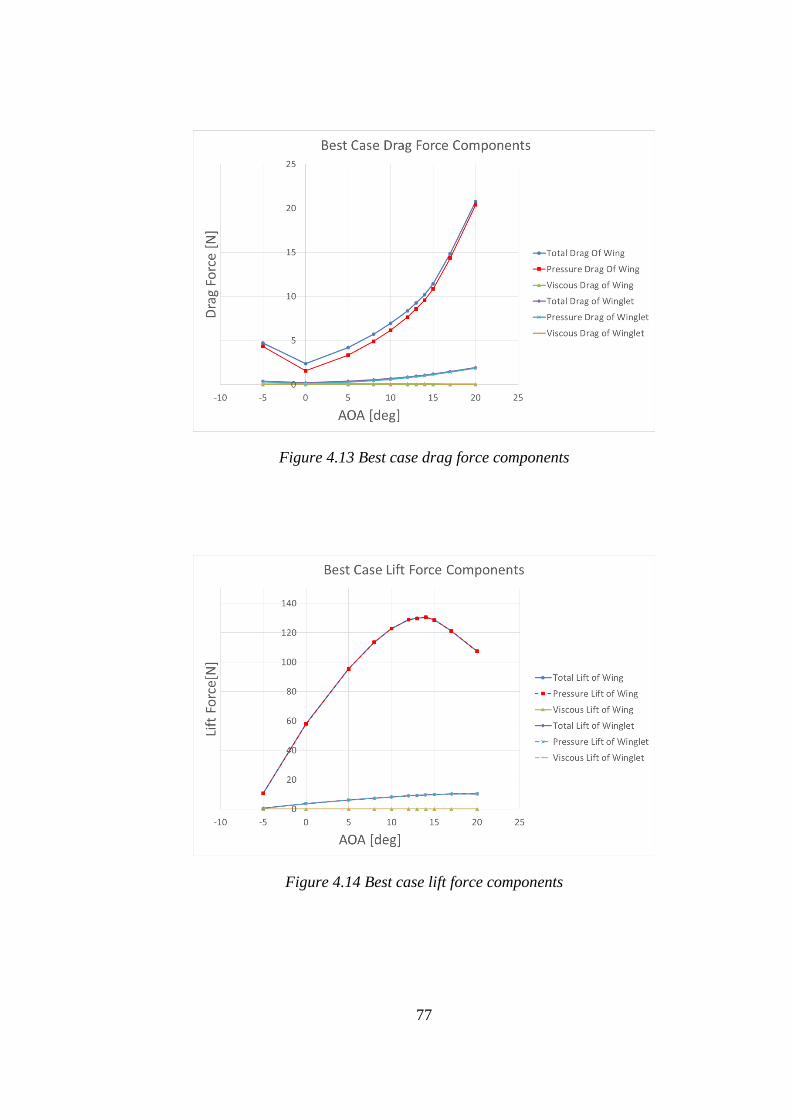
77
Figure 4.13 Best case drag force components
Figure 4.14 Best case lift force components
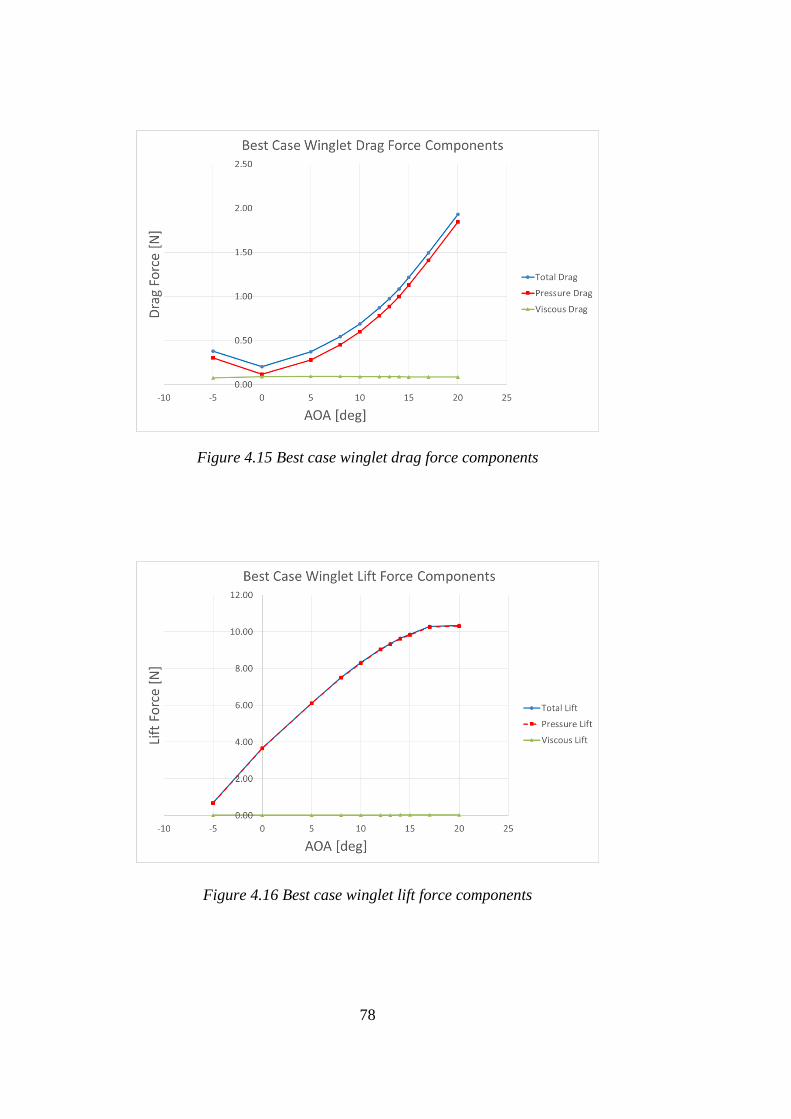
78
Figure 4.15 Best case winglet drag force components
Figure 4.16 Best case winglet lift force components
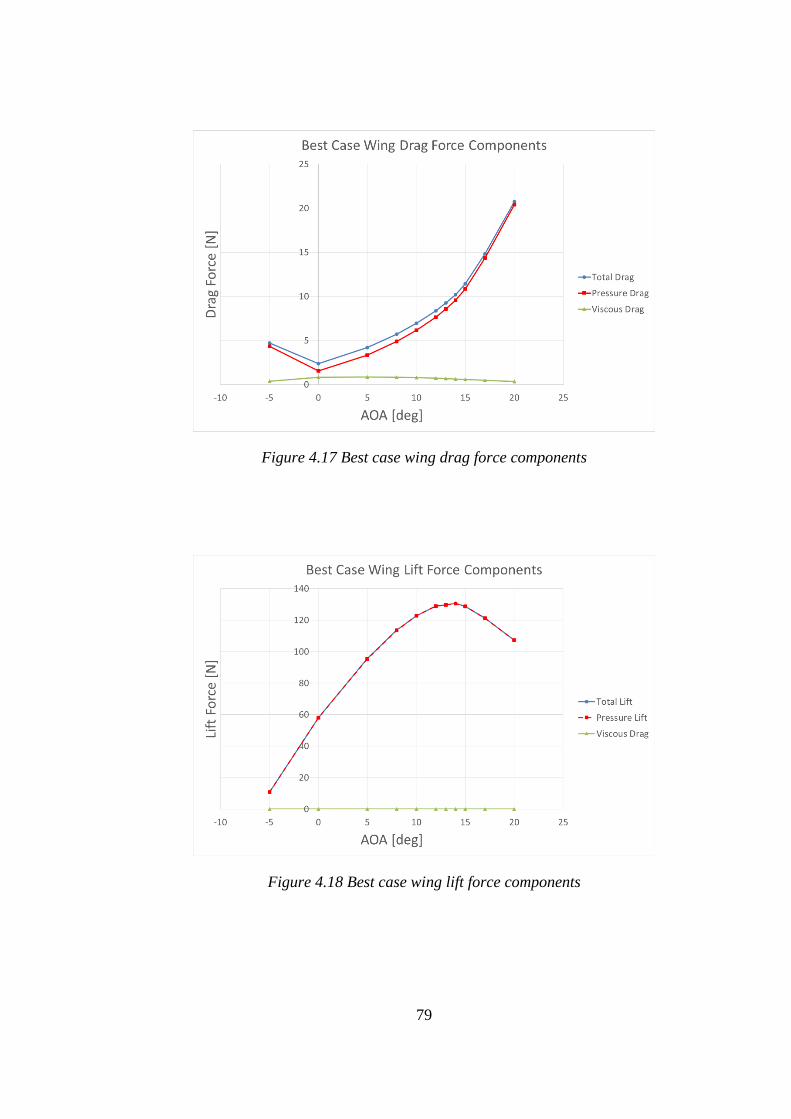
79
Figure 4.17 Best case wing drag force components
Figure 4.18 Best case wing lift force components
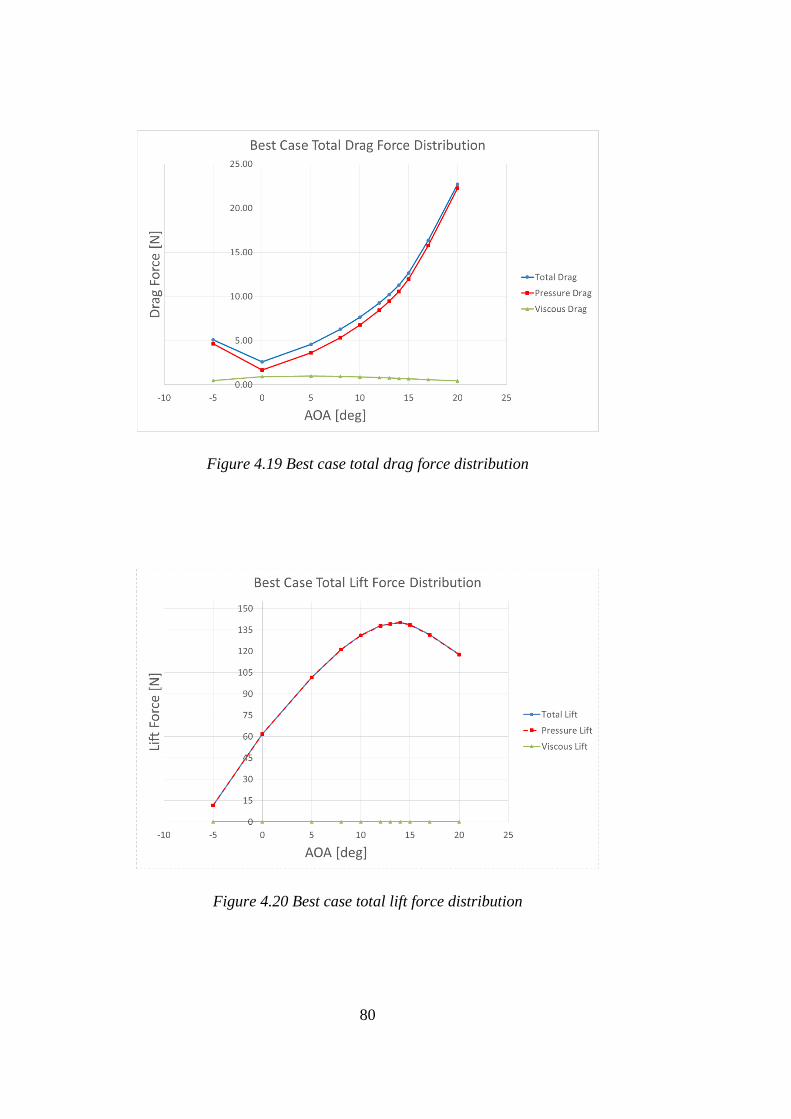
80
Figure 4.19 Best case total drag force distribution
Figure 4.20 Best case total lift force distribution
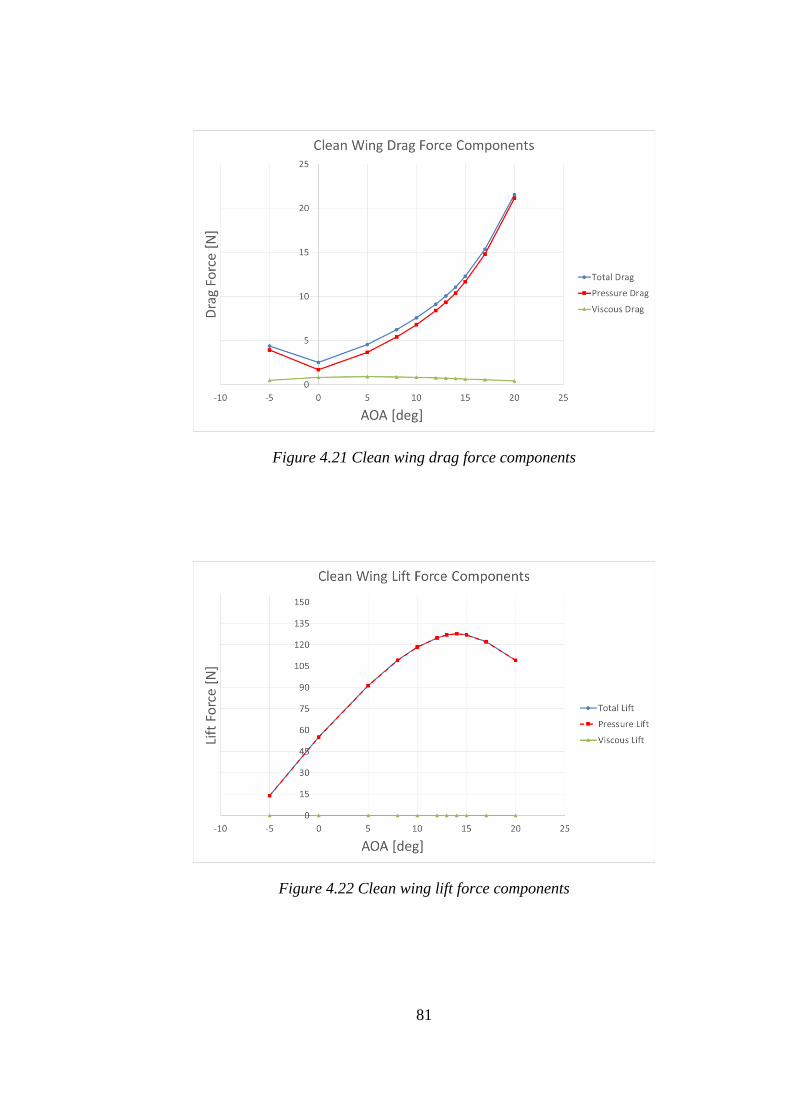
81
Figure 4.21 Clean wing drag force components
Figure 4.22 Clean wing lift force components
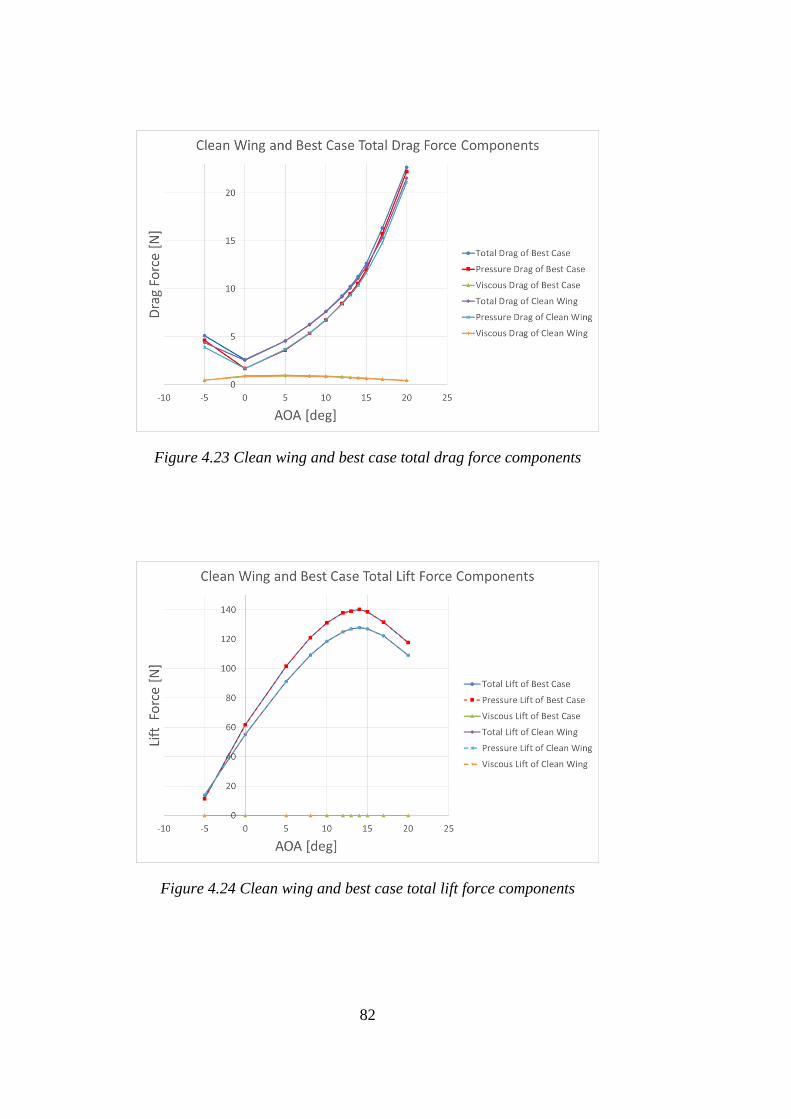
82
Figure 4.23 Clean wing and best case total drag force components
Figure 4.24 Clean wing and best case total lift force components
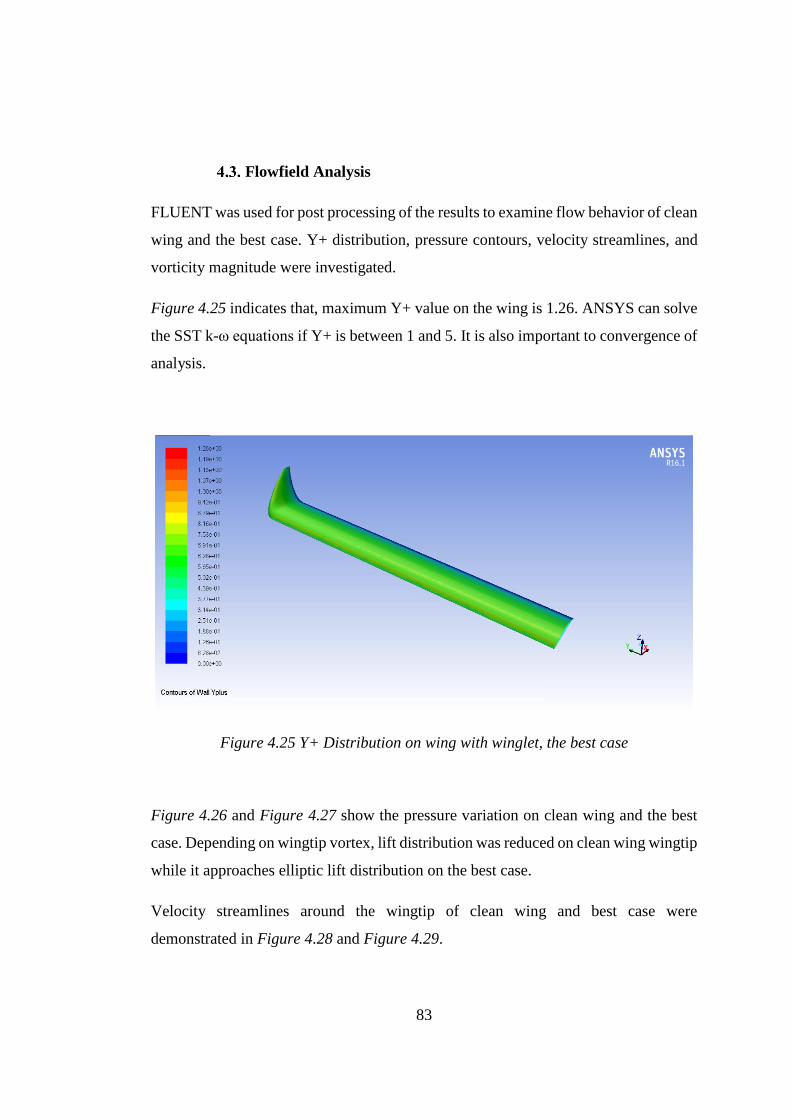
83
Flowfield Analysis
FLUENT was used for post processing of the results to examine flow behavior of clean
wing and the best case. Y+ distribution, pressure contours, velocity streamlines, and
vorticity magnitude were investigated.
Figure 4.25 indicates that, maximum Y+ value on the wing is 1.26. ANSYS can solve
the SST k-ω equations if Y+ is between 1 and 5. It is also important to convergence of
analysis.
Figure 4.25 Y+ Distribution on wing with winglet, the best case
Figure 4.26 and Figure 4.27 show the pressure variation on clean wing and the best
case. Depending on wingtip vortex, lift distribution was reduced on clean wing wingtip
while it approaches elliptic lift distribution on the best case.
Velocity streamlines around the wingtip of clean wing and best case were
demonstrated in Figure 4.28 and Figure 4.29.
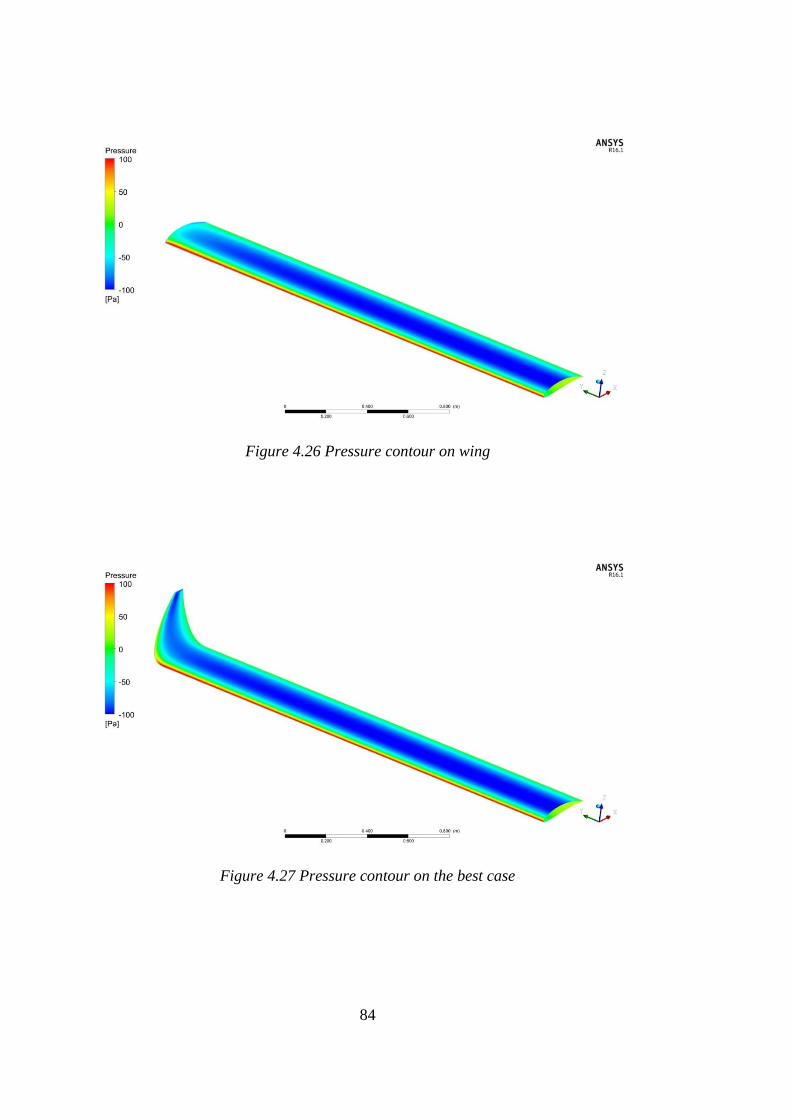
84
Figure 4.26 Pressure contour on wing
Figure 4.27 Pressure contour on the best case
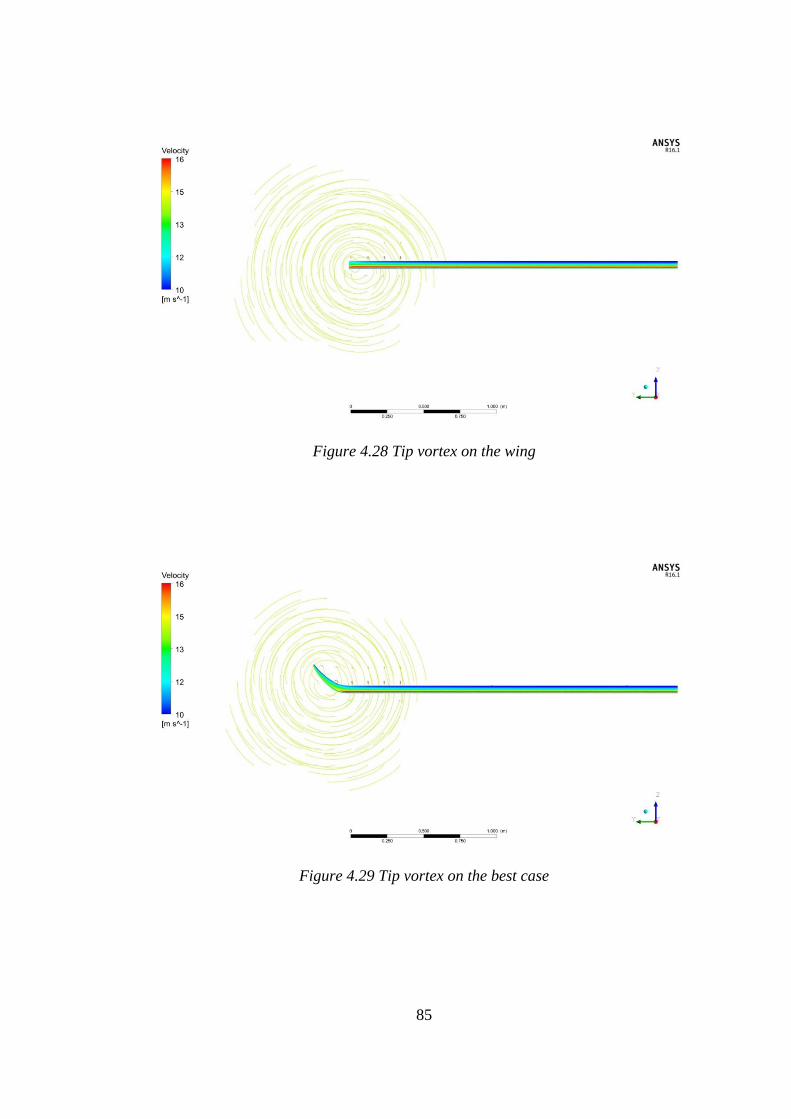
85
Figure 4.28 Tip vortex on the wing
Figure 4.29 Tip vortex on the best case
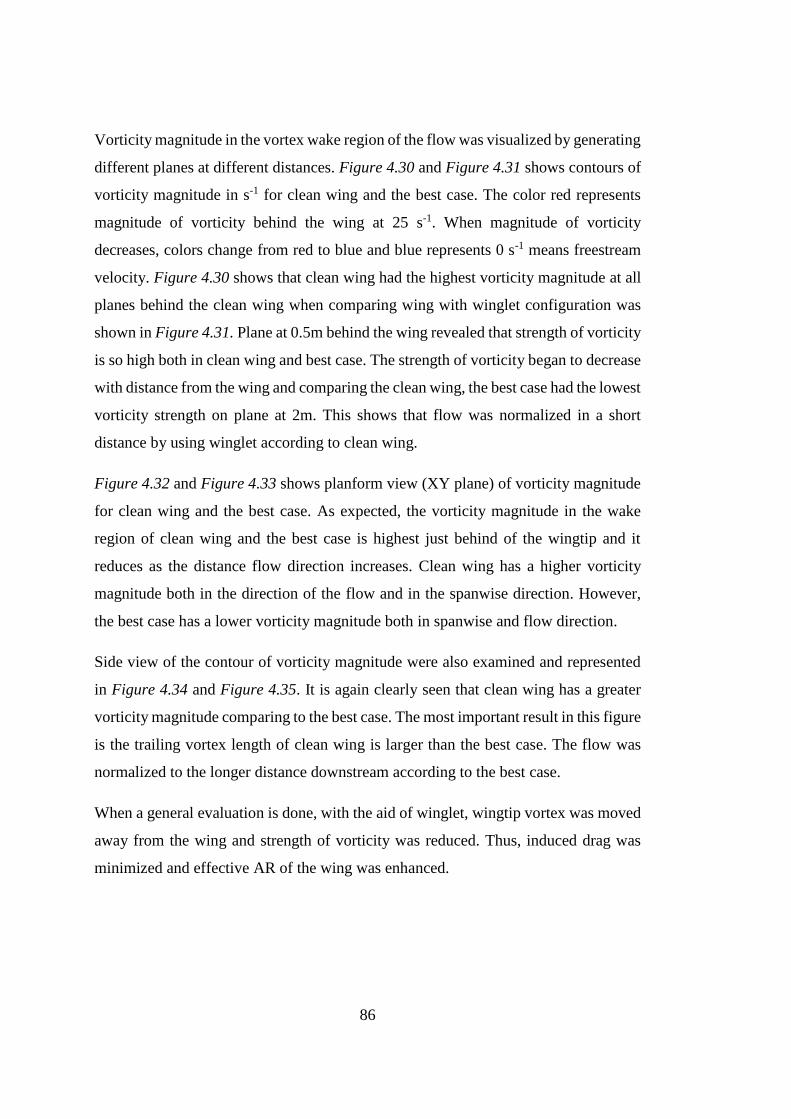
86
Vorticity magnitude in the vortex wake region of the flow was visualized by generating
different planes at different distances. Figure 4.30 and Figure 4.31 shows contours of
vorticity magnitude in s-1 for clean wing and the best case. The color red represents
magnitude of vorticity behind the wing at 25 s-1. When magnitude of vorticity
decreases, colors change from red to blue and blue represents 0 s-1 means freestream
velocity. Figure 4.30 shows that clean wing had the highest vorticity magnitude at all
planes behind the clean wing when comparing wing with winglet configuration was
shown in Figure 4.31. Plane at 0.5m behind the wing revealed that strength of vorticity
is so high both in clean wing and best case. The strength of vorticity began to decrease
with distance from the wing and comparing the clean wing, the best case had the lowest
vorticity strength on plane at 2m. This shows that flow was normalized in a short
distance by using winglet according to clean wing.
Figure 4.32 and Figure 4.33 shows planform view (XY plane) of vorticity magnitude
for clean wing and the best case. As expected, the vorticity magnitude in the wake
region of clean wing and the best case is highest just behind of the wingtip and it
reduces as the distance flow direction increases. Clean wing has a higher vorticity
magnitude both in the direction of the flow and in the spanwise direction. However,
the best case has a lower vorticity magnitude both in spanwise and flow direction.
Side view of the contour of vorticity magnitude were also examined and represented
in Figure 4.34 and Figure 4.35. It is again clearly seen that clean wing has a greater
vorticity magnitude comparing to the best case. The most important result in this figure
is the trailing vortex length of clean wing is larger than the best case. The flow was
normalized to the longer distance downstream according to the best case.
When a general evaluation is done, with the aid of winglet, wingtip vortex was moved
away from the wing and strength of vorticity was reduced. Thus, induced drag was
minimized and effective AR of the wing was enhanced.
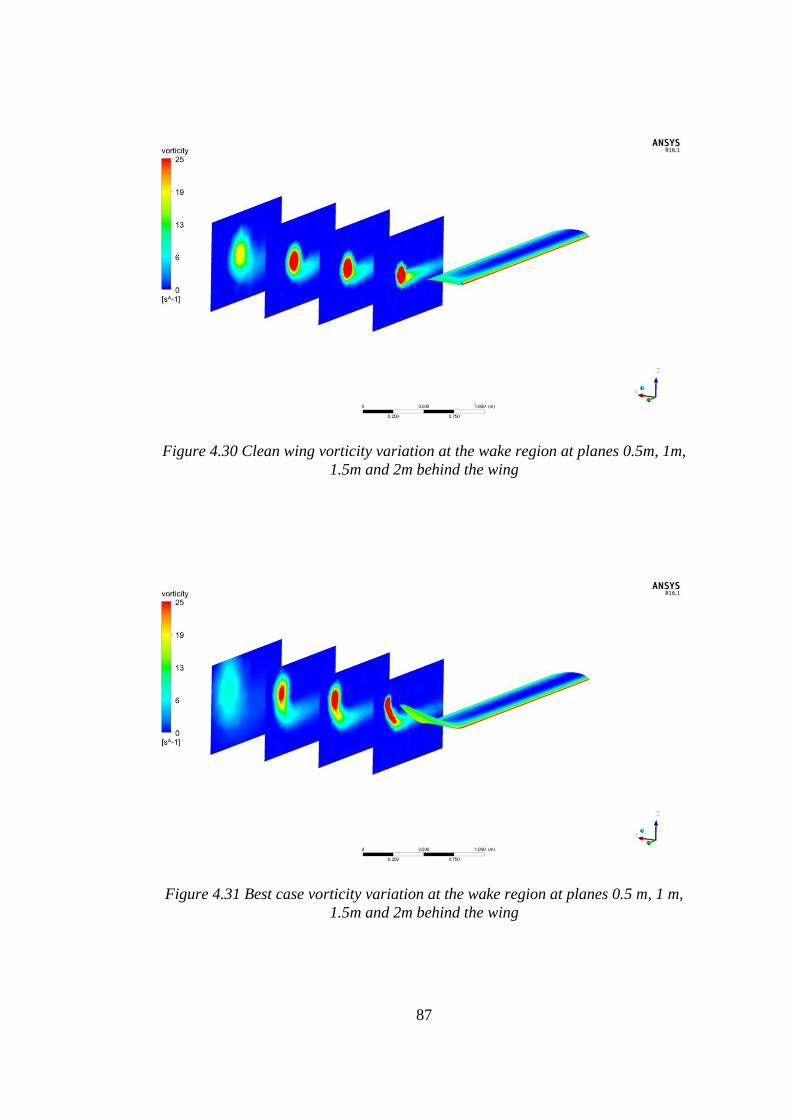
87
Figure 4.30 Clean wing vorticity variation at the wake region at planes 0.5m, 1m,
1.5m and 2m behind the wing
Figure 4.31 Best case vorticity variation at the wake region at planes 0.5 m, 1 m,
1.5m and 2m behind the wing
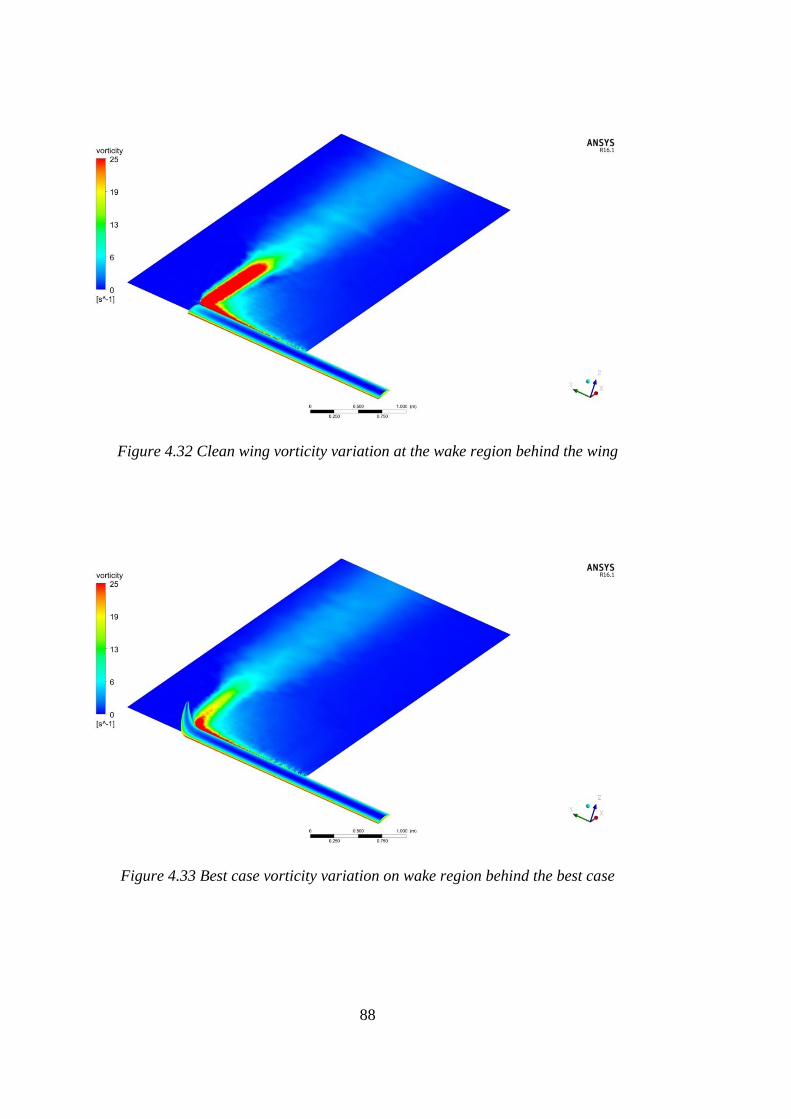
88
Figure 4.32 Clean wing vorticity variation at the wake region behind the wing
Figure 4.33 Best case vorticity variation on wake region behind the best case
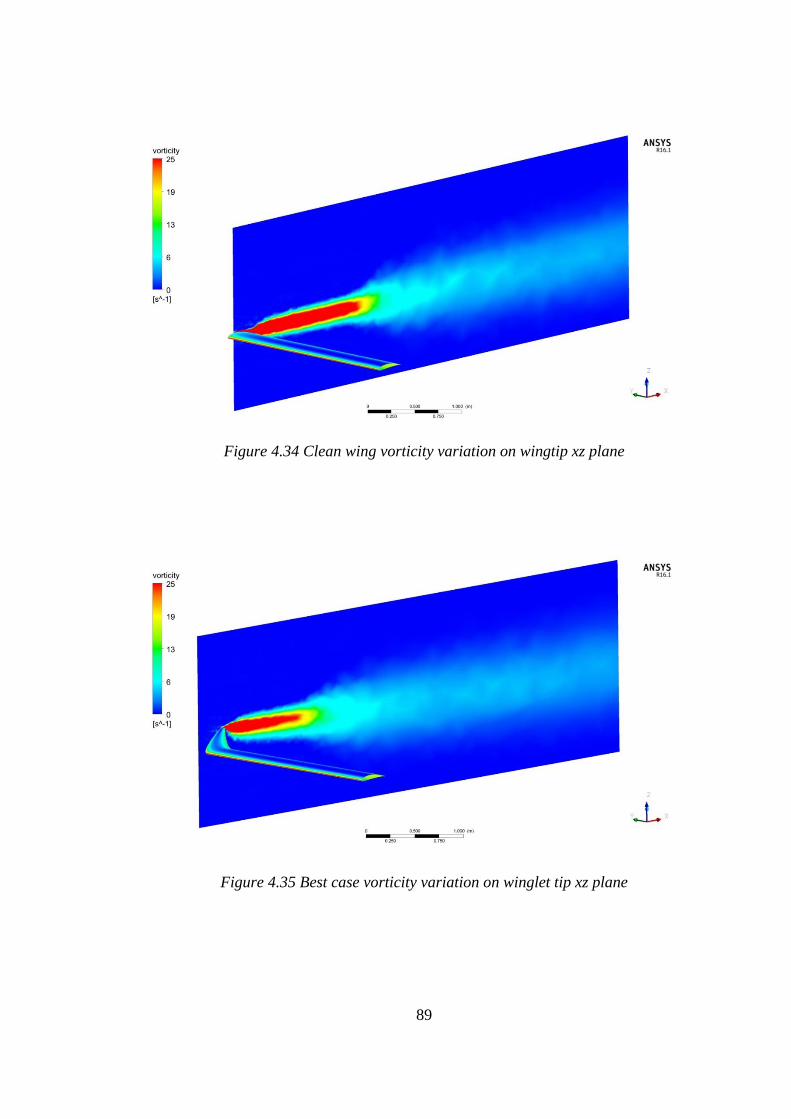
89
Figure 4.34 Clean wing vorticity variation on wingtip xz plane
Figure 4.35 Best case vorticity variation on winglet tip xz plane
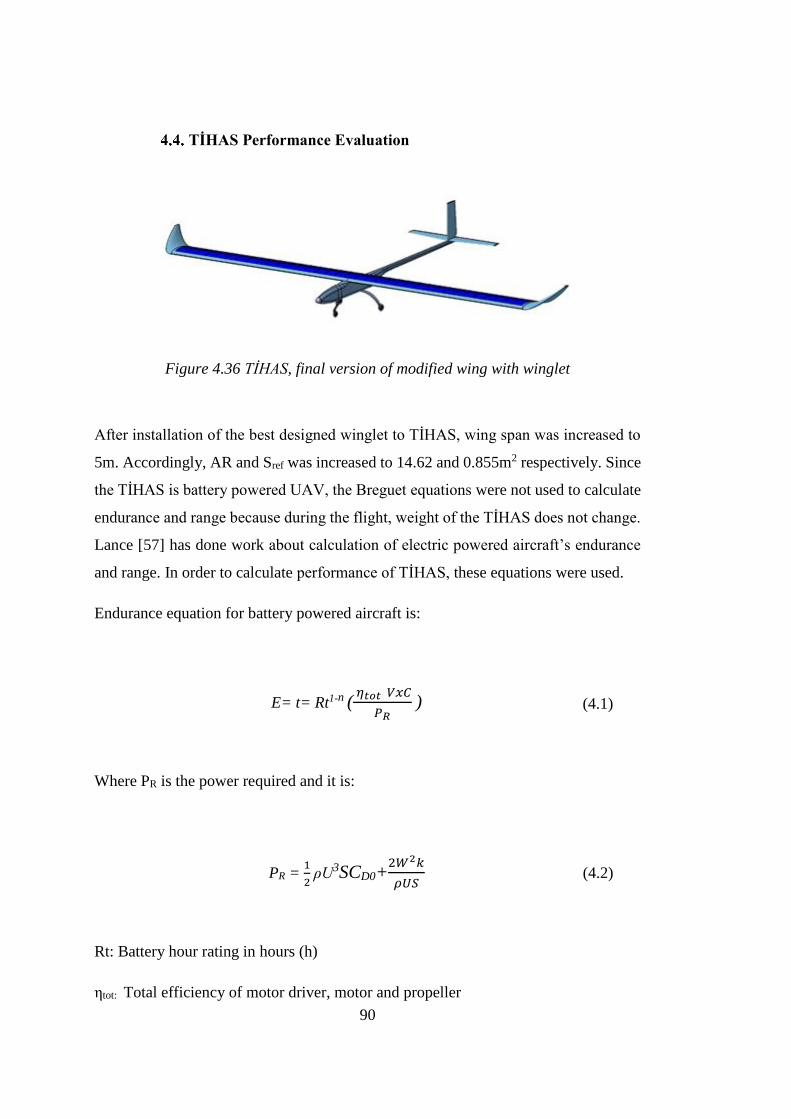
90
TİHAS Performance Evaluation
Figure 4.36 TİHAS, final version of modified wing with winglet
After installation of the best designed winglet to TİHAS, wing span was increased to
5m. Accordingly, AR and Sref was increased to 14.62 and 0.855m2 respectively. Since
the TİHAS is battery powered UAV, the Breguet equations were not used to calculate
endurance and range because during the flight, weight of the TİHAS does not change.
Lance [57] has done work about calculation of electric powered aircraft’s endurance
and range. In order to calculate performance of TİHAS, these equations were used.
Endurance equation for battery powered aircraft is:
E= t= Rt1-n (
𝜂𝑡𝑜𝑡 𝑉𝑥𝐶
𝑃𝑅 ) (4.1)
Where PR is the power required and it is:
PR =
1
2 ρU3SCD0+
2𝑊2𝑘
𝜌𝑈𝑆 (4.2)
Rt: Battery hour rating in hours (h)
ηtot: Total efficiency of motor driver, motor and propeller
91
V: Battery voltage in volts (V)
C: Battery capacity in ampere hours (Ah)
t: Discharge time in hours (h)
n: Battery discharge rate
ρ: Density
S: Reference area
CD0: Zero lift drag
U: Velocity
Performance calculations were performed for cruise conditions and it was assumed
that weight of TİHAS remained 12 kg (unchanged). According to Lance’s formula,
TİHAS endurance was increased as 7.81% according to clean wing with the usage of
winglet.
Range was calculated according to endurance:
R= E x U (4.3)
Then range was also increased as 7.81% comparing to clean wing.
In order to investigate aerodynamic effect of winglet during the flight of TİHAS,
variation of CL, CD and L/D are performed at different velocities (stall velocity 8 m/s
to maximum velocity 22 m/s). Figure 4.37 demonstrates that, in flight envelope, the
TİHAS with wing with winglet has better performance in terms of CL, CD and L/D
values. From stall velocity to maximum velocity, wing with winglet configuration
showed great improvement.
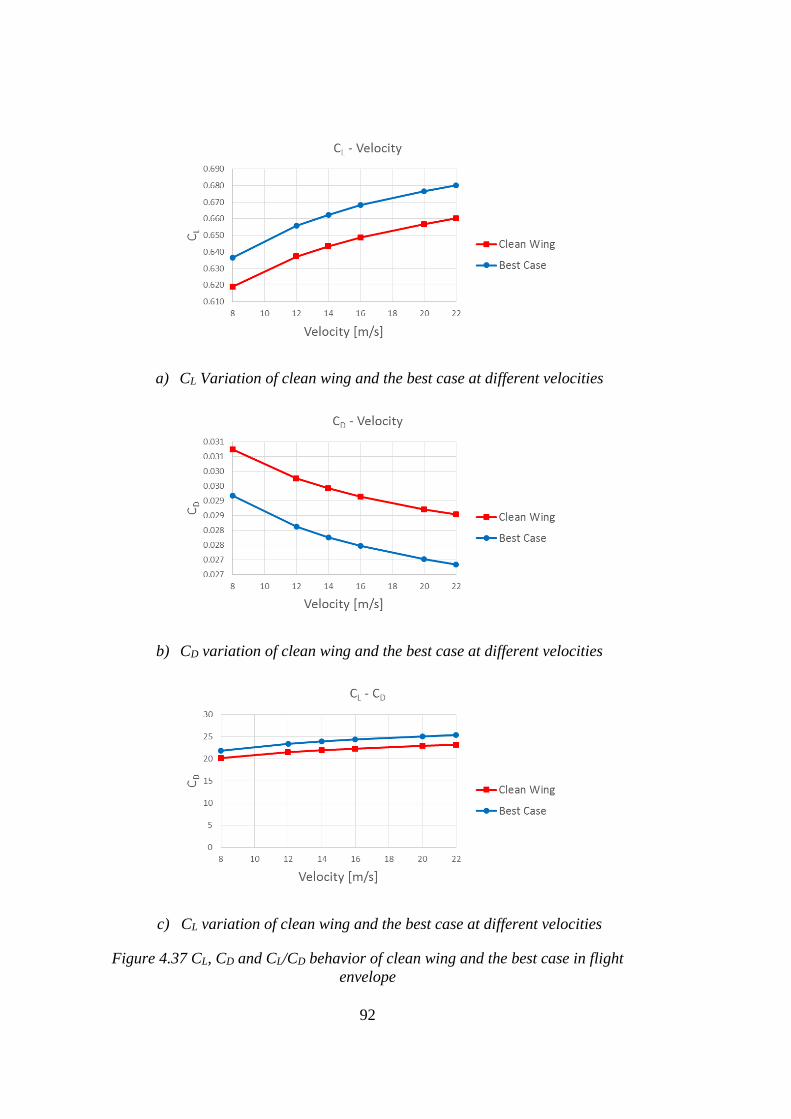
92
a) CL Variation of clean wing and the best case at different velocities
b) CD variation of clean wing and the best case at different velocities
c) CL variation of clean wing and the best case at different velocities
Figure 4.37 CL, CD and CL/CD behavior of clean wing and the best case in flight
envelope
93
CHAPTER 5
CONCLUSION
5. CONCLUSION
A winglet design for TİHAS is presented. Winglet design parameters such as cant
angle, sweep angle, taper ratio, twist angle and toe angle were investigated in an
iterative process. Winglet span kept constant because of the span limitation and
winglet height was limited as chord length, as 0.35m. As an airfoil section for winglet
MH 114 was used. Numerical calculations have been carried out with the help of 3-D
steady state pressure based k-ω SST turbulence model by using ANSYS (16.1), Fluent.
Structural and stability effects of winglet were not performed because these are beyond
the scope of this study.
Design procedure consists of two parts. First, cant angle (90°, 69.3° and 59.4°), sweep
angle (0°, 15° and 30°) and taper ratio (0.2, 0.3 and 0.4) are performed in a triple
combination. 27 different winglet models are analyzed and winglet which has the best
L/D was selected. Cant angle 59.4°, sweep angle 30° and taper ratio 0.2 showed better
performance by having highest L/D ratio about 7.93% higher than the clean wing
configuration. This best is chosen to go further in the analysis to investigate the effect
of toe and twist angles. Toe angle (-5°, -3°, -1°, 1°, 3°, 5°) and twist angle (-5°, -3°, -
1°, 1°, 3°, 5°) were applied to the best winglet design selected in the first part. Analysis
demonstrated that winglet with toe angle 3° (toe out angle) has highest L/D ratio and
it increased the L/D ratio of the wing which was selected from the first part as best
case by an amount of 0.43%. As a final design, winglet has cant angle of 59.4°, sweep
angle of 30°, taper ratio of 0.2 and toe angle of 3°. The wing with best designed winglet
is improved of 8.32% in L/D ratio compared to clean wing configuration.
94
Cant angle demonstrated more dominant effect on both CL and CD variation compared
with other parameters. When three parameters (cant angle, sweep angle and taper ratio)
are evaluated among each other, taper ratio has the major effect on L/D compared with
others (CL/CD increases by about 2.15% when taper ratio changes to 0.4 to 0.2 at sweep
angle 0° and cant angle 90°). It is concluded from the analysis and comparison of the
winglet design parameters, taper ratio has a crucial effect on the aerodynamic
efficiencies of winglet compared to other parameters in terms of L/D variation (aim of
study).
Viscous and pressure components of drag and lift forces for the best case and clean
wing were also studied. When clean wing and wing of best case were compared,
viscous drag force remained same in both cases but pressure drag force is 8.23% lower
in the best case. Again, viscous lift force effect remained same for both cases but
pressure lift force is 4.95% higher in the best case configuration. This prove that,
winglet implementation causes a drag reduction and a lift increase for a wing
configuration.
TİHAS performance calculation were done and according to Lance’s formula, TİHAS
endurance and range were increased as 7.81% comparing to the clean wing.
As a result, according to identified design algorithm, a winglet which has the highest
L/D value was designed and effects of parameters were examined on winglet’s
performance. As a consequence, TİHAS aerodynamic performance was increased.
95
REFERENCES
D. McLean, “Wingtip Devices: What They Do and How They Do It” presented at
the Boeing Performance and Flight Operations Engineering Conference, 2005
John D. Anderson, JR., Fundamentals of Aerodynamics, 5th ed. Mc Graw Hill
Companies.2011.
M. D. Maughmer, The Design of Winglets for Low-Speed Aircraft,2006
A. C. Kermode, Mechanics of Flight, 9th ed. Longman Scientific & Technical,
England, 1972.
D. P. Raymer, Aircraft Design: A Conceptual Approach, 5th ed. AIAA Education
Series, July, 2012.
R. T. Whitcomb, a Design Approach and Selected Wind-Tunnel Result at High
Subsonic Speed for Wing-Tip Mounted Winglets, NASA TN D-8260, July, 1976.
J. R. Chambers, Concept to Reality: Contributions of the NASA Langley Research
Center to U.S: Civil Aircraft of the 1990s, NASA, SP-2003-4529
I. Kroo, “Drag Due to Lift: Concepts for Prediction and Reduction,” Annual
Review of Fluid Mechanics, Vol.33, No. 1, 2001, pp. 587-617.
R. Babigian and S. Hayashibara, Computational Study of the Vortex Wake
Generated by a Three-Dimensional Wing with Dihedral, Taper, and Sweep, 27th
AIAA Applied Aerodynamics Conference, 22-25 June, 2009.
“No Title.” [Online]. Available:
http://www.aviastar.org/air/usa/rutan, 26 December, 2015
“No Title.” [Online]. Available:
http://www.boeing.com/commercial/737ng/, 26 December, 2015
“No Title.” [Online]. Available:
http://www.a350xwb.com/photo-gallery, 26 December, 2015
“No Title.” [Online]. Available:
http://www.ga-asi.comaircraft-platforms, 26 December, 2015
96
“No Title.” [Online]. Available:
http://www.airliners.netphotoNetherlands---ArmyBoeing-X-200-
ScanEagle2580441L, 10 June, 2015
A. Noth, Design of Solar Powered Airplanes for Continuous Flight, September,
2008.
J. Weierman, and J. D. Jacob, Winglet Design and Optimization for UAVs, 28th
AIAA Applied Aerodynamics Conference, 28 June-1 July, 2010.
F. W. Lanchester, Aerodynamics, Bradbury, Agnew, & Co. LD, London, UK,
1907.
K. Miles, Winglet Design for the Pipistrel Taurus Electro G2 and Twin-Taurus
G4 with Performance Comparison Made Using Flight-Path Optimization,
December, 2012.
W. E. Somerville, Coal City, IL, U.S. Patent for “A Flying-Machine,” Docket No.
1154214, patented 21 September, 1915.
“No Title.” [Online]. Available:
http://www.ilavhalloffame.org/members_10.htm
V. J. Burnelli, New York, NY, U.S. Patent for “Airfoil Control Means,” Docket
No. 1774474, patented 26 August, 1930.
R. T. Whitcomb, “Methods for Reducing Aerodynamic Drag,” NASA
Conference Publication 2211, Proceedings of Dryden Symposium, Edwards,
California, 16 September 1981.
P. D. Gall, and H. C. Smith, Aerodynamic Characteristics of Biplanes with
Winglets, Journal of Aircraft, vol. 24, no 8., pp. 518-522., August, 1987.
P. C., Masak, “Winglet Design for Sailplanes,” Free Flight, pp, 6-8, April/May
1992.
L. B., Gratzer, “Blended Winglet,” ed: Google Patents, 1994.
M. K. V. Sankrithi, and B. J., Frommer, “Controllable Winglets”, United State
Patent Document, Patent No. US2008/0308683, 2008.
N. R. El Haddad, and L. Gonzalez, Aerodynamic Design of a Winglet for the
Dassault Falcon 10, AIAA Aerospace Science Meeting, San Diego, California,
USA, January, 2016.
97
T. Krebs, and G. Bramesfeld, An Optimization Approach to Split-Winglet Design
for Sailplanes, AIAA Aerospace Science Meeting, San Diego, California, USA,
January, 2016.
J. E. Cooper, I. Chekkal, R. C. M. Cheung, N. J. Allen, S. Lawson, A. J. Peace,
R. Cook, P. Standen, S. D. Hancock, and G. M. Carossa, Design of a Morphing
Wingtip, Journal of Aircraft, vol. 52, no.5, September-October, 2015
S. Khosravi, and D. W. Zingg, A Numerical Optimization Study On Winglets,
15th AIAA/ISSMO Multidisciplinary Analysis and Optimization Conference,
AIAA Aviation, 2014.
F. Kody, G. Bramesfeld, and S. Schmitz, Winglet Design for Sailplanes Using a
Multi-Objective Evolutionary Algorithm, 51st AIAA Aerospace Science Meeting
Including the New Horizons Forum and Aerospace Exposition, 7-10 January,
2013.
L. Falcao, A. A. Gomes, and A. Suleman, Design and Analysis of an Adaptive
Wingtip, 52th AIAA/ASME/ASCE/AHS/ASC Structures, Structural Dynamics,
and Materials Conferences, 4-7 April, 2011.
A. A. Gomes, L. Falcao, and A. Suleman, Study of an Articulated Winglet
Mechanism, 4th AIAA/ASME/ASCE/AHS/ASC Structures, Structural Dynamics,
and Materials Conferences, April 8-11, 2013.
M. R. A Diaz. T. R. Yechout, and E. M. Bryant, ‘The Raket’- A Wingtip
Modification Approach to Improve Endurance, Range and Fuel Savings, 50th
AIAA Aerospace Science Meeting Including the New Horizons Forum and
Aerospace Exposition, 9-12 January, 2012.
R. Babigian, and S. Hayashibara, Computational Study of the Vortex Wake
Generated by a Three-Dimensional Wing with Dihedral, Taper and Sweep, 27th
AIAA Applied Aerodynamics Conference, 22-25 June, 2009.
J. G. Verstraeten, and R. Slingerland, Drag Characteristics for Optimally Span-
Loaded Planar, Wingletted, and C Wings, Journal of Aircraft, vol.46, no.3, May-
June, 2009.
A. Shelton, A. Tomar, JVR Prasad, M. J. Smith, N. Komerath, Active Multiple
Winglets for Improved UAV Performance, 22nd Applied Aerodynamics
Conference and Exhibit, 16-19 August, 2004.
98
D. J. Ogurek, and J. Ashworth, Experimental Investigation of Various Winglet
Designs for a Wing in Ground Effect,22nd Applied Aerodynamics Conference and
Exhibit, 16-19 August, 2004.
N. Conley, Winglet Toe-Out Angle Optimization for the Gates Learjet Longhorn
Wing, Journal of Aircraft, vol.17, no.12, Article no. 79-1831R, December, 1980.
P. Panagiotou, P. Kaparos, and K. Yakinthos, Winglet Design and Optimization
for MALE UAV Using CFD, Aerospace Science and Technology, 19 September,
2014.
P. Bourdin, A. Gatto, and M. I. Friswell, The Application of Variable Cant Angle
Winglets for Morphing Aircraft Control, 24th Applied Aerodynamics Conference,
5-8 June, 2006.
A. Beechook, J. Wang, Aerodynamic Analysis of Variable Cant Angle Winglets
for Improved Aircraft Performance, Proceedings of the 19th International
Conference on Automation & Computating, Brunel University, London, UK, 13-
14 September, 2013.
M. J. Smith, N. Komerath, R. Ames, O. Wong, and J. Pearson, Performance
Analysis of a Wing with Multiple Winglets, AIAA-2407, 2001.
M. Dinesh, T. Yokesh, and P.S. Premkumar, Performance Investigation of an
Aircraft Wing at Various Cant Angles of Winglets using CFD Simulation, Altair
Technology Conference, 2015.
A. Hossain, A. Rahman, J. Hossen, P. Iqbal, N. Shaari, and G. K. Sivaraj, Drag
Reduction in a Wing Model Using a Bird Feather Like Winglet, JJMIE, vol. 5,
no.3, June, 2011.
P. R. Arora, A. Hossain, P. Edi, A. A. Jaafar, T. S. Younnis, and M. Saleem, Drag
Reduction in Aircraft Model Using Elliptical Winglet, March, 2014.
M. A. Azlin, C. F. Mat Taib, S. Kasolang, and F. H. Muhammad, CFD Analysis
of Winglets at Low Subsonic Flow, Proceeding of the World Congress on
Engineering, vol.1, 6-8 July, 2011.
N. N. Gavrilovic, B. P. Rasuo, G. S. Dulikravich, and V. B. Parezanovic,
Commercial Aircraft Performance Improvement Using Winglets, FME
Transactions, vol.43, no.1, 2015.
L. B. Gratzer, Blended Winglet, Google Patents, US 5348253 A, 1993.

99
F. F. Felker, Aircraft with Elliptical Winglets, Google Patents, US 6484968 B2,
2000.
M. D. Maughmer, T. S. Swan, and W. M. Willits, The design and Testing of a
Winglet Airfoil for Low-Speed Aircraf, 19th AIAA Applied Aerodynmaics
Conference, 11-14 June, 2001.
“No Title.” [Online]. Available:
http://www.airfoiltools.com/airfoil/details?airfoil=mh114-il
P. W. Jansen, R. E. Perez, and J. R. R. A.,Martins, Aerostructural Optimization
of Nonplanar Lifting Surfaces, Journal of Aircraft, vol. 47, no. 5, 2010, pp. 1490-
1504.
K. Takenaka, K. Hatanaka, W. Yamazaki, and K. Nakahashi, Multidisciplinary,
Design Exploration for a Winglet, Journal of Aircraft, vol. 45, no. 5, September-
October 2008.
“No Title.” [Online]. Available:
http:/www.cfd-online.com/Wiki/Y_plus_wall_distance_estimation
A. Inc., “ANSYS FLUENT 16.0 Theory Guide.”
L. W. Traub, Range and Endurance Estimates for Battery-Powered Aircraft,
Journal of Aircraft, vol. 48, no. 2, pp. 703-707, March-April 2011