Embed Size (px)
Citation preview
WINNERS IN THE AGE OF THE TITANS
TABLE OF CONTENTS
PREFACE 3
NOTES TO THE READER 4
EXECUTIVE SUMMARY 5
I. THE STATE OF THE BANKING INDUSTRY 6 Business Confidence Improved Substantially 6 Growth and Consolidation Reappeared on the Agenda 8 Investment Banking Outperformed Other Segments 10 Strong Performance Existed Across Countries 13
II. THE PATH TO VALUE CREATION 16 Stock Market Stars 16 Profitability and Growth Stars 17 Selected Success Stories 19
III. RANKINGS OF TOP PERFORMERS 23 Large-Cap Companies 23 Mid-Cap Companies 24 Segment Ranking 25 Country Ranking 26
APPENDIX: SAMPLE AND METHODOLOGY 27 Sample and Data 27 Definitions and Methodology 27
BCG Page 2
WINNERS IN THE AGE OF THE TITANS
PREFACE Banking is changing rapidly as the industry consolidates and financial markets become more global and competitive. We believe that financial executives should focus rigorously on creating value—improving profitability and growth—if their companies are to benefit from the industry’s rapid con-centration. Building competitive advantage and creating superior value must be management’s primary goals. Since its founding more than 40 years ago, The Boston Consulting Group (BCG) has analyzed the drivers of value creation for clients across industries. In recent years, we have published annual stud-ies that analyze the world’s top-performing companies in order to build an understanding of leading players. Winners in the Age of the Titans: Creating Value in Banking 2004, our second annual study of global banks, analyzes shareholder value creation in banking, including universal banks and spe-cialist financial-services companies. For details of this report’s approach, please see the Appendix, which examines our sample and meth-odology.
Walter Sinn Ranu Dayal David Pitman
Gerold Grasshoff Thomas Herbeck
BCG Page 3
WINNERS IN THE AGE OF THE TITANS
NOTES TO THE READER About the Authors Walter Sinn is a vice president and director in the Frankfurt office of The Boston Consulting Group. Ranu Dayal is a vice president and director in the firm’s New York office. David Pitman is a vice president and director in BCG’s Sydney office. Gerold Grasshoff is a manager in the firm’s Berlin office. Thomas Herbeck is a manager in BCG’s Frankfurt office. Acknowledgments We’d like to thank several people—including many from the Financial Services and Corporate Fi-nance and Strategy practice areas—who were involved in preparing this report. In particular, the au-thors would like to thank Robert Lauter. For Further Information For further information on the report and to learn more about BCG’s value-management capabilities in financial services, please contact: Europe Americas Asia-Pacific Walter Sinn Ranu Dayal David Pitman Vice President and Director Vice President and Director Vice President and Director BCG Frankfurt BCG New York BCG Sydney +49 69 9150 2188 +1 212 446 2986 +61 2 9323 5661 [email protected] [email protected] [email protected] Related Studies Investment Banking and Capital Markets, Fourth Quarter 2003 Edition, BCG Report March 2004 The Path to Value Creation: Global Corporate Banking 2003, BCG Report November 2003 Back to Fundamentals, BCG Value Creators Report 2003 Succeed in Uncertain Times: A Global Study of How Today’s Top Corporations Can Generate Value Tomorrow, BCG Value Creators Report 2002 Breakups Are Not the Only Solution, BCG Conglomerates Report 2002 Dealing with Investors’ Expectations: A Global Study of Company Valuations and Their Strategic Implications, BCG Value Creators Report 2001 Disclaimer The Boston Consulting Group is a general management consulting firm that is a global leader in business strategy. Founded in 1963, the firm now operates 60 offices in 37 countries. Although BCG has a substantial financial-services consulting business, this report, which we now publish annually, is not intended to provide investment advice to any party. Any investment decision should be made only after independent review and analysis. For further information, please visit our Web site at www.bcg.com. If you have questions or comments about Winners in the Age of the Titans: Creating Value in Banking 2004, please contact us at [email protected].
BCG Page 4

WINNERS IN THE AGE OF THE TITANS
EXECUTIVE SUMMARY Market values for banks recently rose to high levels, exceeding the peaks of 2000 and 2001. To reach these unprecedented valuations, the banking industry clearly outperformed the overall market during the five year period between 1999 and 2003. Banks showed their strongest per-formance yet in 2003, when their total shareholder return (TSR) was 45 percent—substantially above shareholder returns for the overall market. A stock market appreciation of more than $1.3 trillion in banks’ total market capitalization was backed by improved fundamental performance. But market expectations for banks’ future performance increased even faster. In fact, changing market expectations drove volatility in bank valuations.
Banks Performed Strongly in 2003
TSR1999–2003
37.8%
1.5%6.4%
44.8%2003
Banking All industries
Banks Performed Strongly in 2003
TSR1999–2003
37.8%
1.5%6.4%
44.8%2003
Banking All industriesBanking All industries
2003 2002 2003
Banks’ Profitability Increased in 2003
Average after-tax ROE
1999-2003
15.1% 13.0% 14.4%
2002 20032003 2002 2003
Banks’ Profitability Increased in 2003
Average after-tax ROE
1999-2003
15.1% 13.0% 14.4%
2002 2003
Higher profitability and growth improved fundamental values. An in-crease in average return on equity after tax (ROE) from 13 percent to 14.4 percent from 2002 to 2003, together with a doubling of the organic growth rate to almost 7 percent, drove fundamental values in banking in absolute terms to unprecedented levels. Companies with extraordinary profitability can be found in nearly every country; only two countries, Germany and Japan, experienced a significant profitability squeeze, with banks there operating on average with negative ROE in 2003.
Growth and consolidation were high on the agenda as more competi-tors used the growth lever and as a few U.S.-dominated global banking titans emerged. The five largest banks raised their market cap by 18 per-cent per year between 1999 and 2003, increasing their share in worldwide banking from 13 percent to more than 16 percent by the end of 2003. With the megamergers of Bank of America/FleetBoston and JP Morgan Chase/Bank One, two new banking titans are joining the still-exclusive company of Citigroup and HSBC, with market caps of more than $120 bil-lion and an average size of more than $180 billion. By their presence alone, these giants will have significant impact on future consolidation worldwide.
The Concentration of Market Capitalization Increased
16%17%13%
1998 2002 2003
Five largest companies’ share of total banking market capitalization
Dec. 31, 1998
The Concentration of Market Capitalization Increased
16%17%13%
1998 2002 2003
Five largest companies’ share of total banking market capitalization
Dec. 31, 1998
Investment Banking Was the Top-Performing Business
1999-2003 2003 20032002
13.0%
53.4%43%
35%
51%40%
Total shareholder return
Expectation premium
Investment bankingBanking
Investment Banking Was the Top-Performing Business
1999-2003 2003 20032002
13.0%
53.4%43%
35%
51%40%
Total shareholder return
Expectation premium
Investment bankingBankingBanking
Investment banking outperformed other segments. With an average an-nual shareholder return of 13 percent between 1999 and 2003—and one of 53 percent in 2003—investment banking was the best-performing banking business. Three main drivers underpinned this excellent performance: suc-cessful cost-cutting programs, strong fixed-income activity, and expecta-tions for the recovery of equity and advisory businesses. U.S. and U.K. banks dominate the performance rankings. True com-pany performance is measured by risk-adjusted relative total shareholder return (RRTSR), i.e. by adjusting TSR for risk and for the varying impact of domestic markets. Lehman Brothers, HSBC, and Citigroup led the rank-ings during the five year period. Fundamentals drove stock market per-formance. Top performers combined above-average profitability of 18 per-cent with strong annual organic growth rates of 14 percent.
The Top Five Companies (1999 – 2003)
11.7%
10.1%
10.1%
8.6%
8.5%
Ranking by RRTSR
Lehman BrothersHSBC Holding
Citigroup
Bank of Nova ScotiaBarclays
The Top Five Companies (1999 – 2003)
11.7%
10.1%
10.1%
8.6%
8.5%
Ranking by RRTSR
Lehman BrothersHSBC Holding
Citigroup
Bank of Nova ScotiaBarclays
BCG Page 5

WINNERS IN THE AGE OF THE TITANS
I. THE STATE OF THE BANKING INDUSTRY Business Confidence Improved Substantially At the beginning of 2003, there was considerable caution about the state of the world economy and even fear of deflation. In the second half of 2003, fiscal and monetary stimuli in many parts of the world contributed to a clear pickup in economic activity and a marked improvement in business con-fidence. Banks performed exceptionally well in 2003. The banking sector greatly benefited from the recov-ering economy. In fact, the total market capitalization of the global banking industry during 2003 in-creased by 42 percent to $4.5 tril-lion, exceeding the previous all-time high of $4.2 trillion in January 2001. In terms of returns to share-holders (taking capital gains and dividends into account), banking stocks significantly outperformed the markets: they appreciated by 44.8 percent compared with the av-erage industry return of 37.8 per-cent. (See Exhibit 1.)
Exhibit 1. Banks Performed Exceptionally Well in 2003
Total market capitalization ($trillions) Total shareholder return (%)(1)
+0.3% -9.1% -11.3% +42.2%+16.5%
3.383.94 3.95
3.593.18
4.53
1999 2000 2001 2002 2003
BanksAll industries
1998 1999 2000 2001 2002 2003
32.5
5.1
-12.9
15.4
-15.3 -16.2-10.9
-16.8
44.837.8
EOY
+6.0% +1.5%+6.4%
(1) Includes capital gains and dividends.Sources: T.F. Datastream; BCG analysis.
Over the past five years, banking outperformed the overall market. Like many industries, bank-ing’s impressive one-year perform-ance in 2003 is partly explained by a lackluster 2002. Nevertheless, the underlying strength of banking is demonstrated by the fact that be-tween 1999 and 2003, the industry generated a total shareholder return (TSR) of approximately 6.4 per-cent—four times better than the global average and exceeded only by oil and gas, engineering and ma-chinery, and chemicals, which are less vulnerable to short-term movements in the economy. (See Exhibit 2.)
Exhibit 2. Banking Stocks Outperformed the Average of All Industries Over Five Years
Total shareholder return, 2003(1)
Total shareholder return, 1999–2003(1)
1.5%
0.6%-0.2%
2.3%
0.8%1.5%
11.4%
-5.6%1.8%
3.4%6.8%
2.0%6.4%
6.9%-4.4%
37.8%
20.7%
29.8%31.9%
32.6%33.7%35.4%
35.4%36.0%
39.5%40.5%
42.6%44.8%
56.3%66.2%
Oil and gas
ChemicalsAutomotive
Transportation
Electricity
Utilities
Retail
PharmaceuticalsInsurance
Media and entertainment
Telecommunications
Information technology
World
Engineering and machinery
Banking
(1) Includes capital gains and dividends.Note: All data were calculated after conversion to U.S.$.Sources: T.F. Datastream; BCG analysis.
Stock market appreciation in 2003 was backed by improved fundamentals—but market expec-tations rose even faster. Market capitalization is composed of a fundamental value and an expecta-tion premium. In fact, the $1.3 trillion increase in banking market cap in 2003 was driven equally by
BCG Page 6
WINNERS IN THE AGE OF THE TITANS
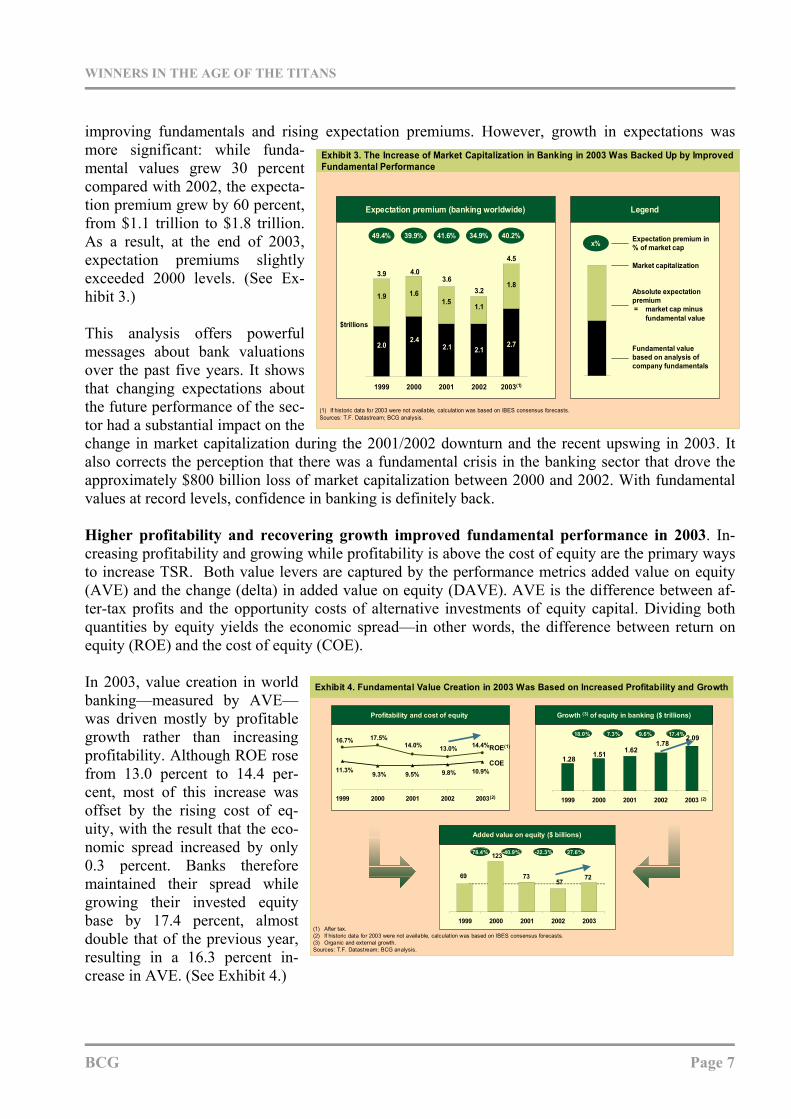
improving fundamentals and rising expectation premiums. However, growth in expectations was more significant: while funda-mental values grew 30 percent compared with 2002, the expecta-tion premium grew by 60 percent, from $1.1 trillion to $1.8 trillion. As a result, at the end of 2003, expectation premiums slightly exceeded 2000 levels. (See Ex-hibit 3.)
This analysis offers powerful messages about bank valuations over the past five years. It shows that changing expectations about the future performance of the sec-tor had a substantial impact on the change in market capitalization during the 2001/2002 downturn and the recent upswing in 2003. It also corrects the perception that there was a fundamental crisis in the banking sector that drove the approximately $800 billion loss of market capitalization between 2000 and 2002. With fundamental values at record levels, confidence in banking is definitely back.
Exhibit 3. The Increase of Market Capitalization in Banking in 2003 Was Backed Up by Improved Fundamental Performance
Legend
x%
Market capitalization
Absolute expectation premium = market cap minus
fundamental value
Fundamental value based on analysis of company fundamentals
Expectation premium in % of market cap
Expectation premium (banking worldwide)
1999 2000 2001 2002 2003(1)
40.2%34.9%41.6%39.9%49.4%
$trillions
1.9 1.61.5 1.1
1.8
2.02.4
2.1 2.12.7
3.9 4.03.6
3.2
4.5
(1) If historic data for 2003 were not available, calculation was based on IBES consensus forecasts.Sources: T.F. Datastream; BCG analysis.
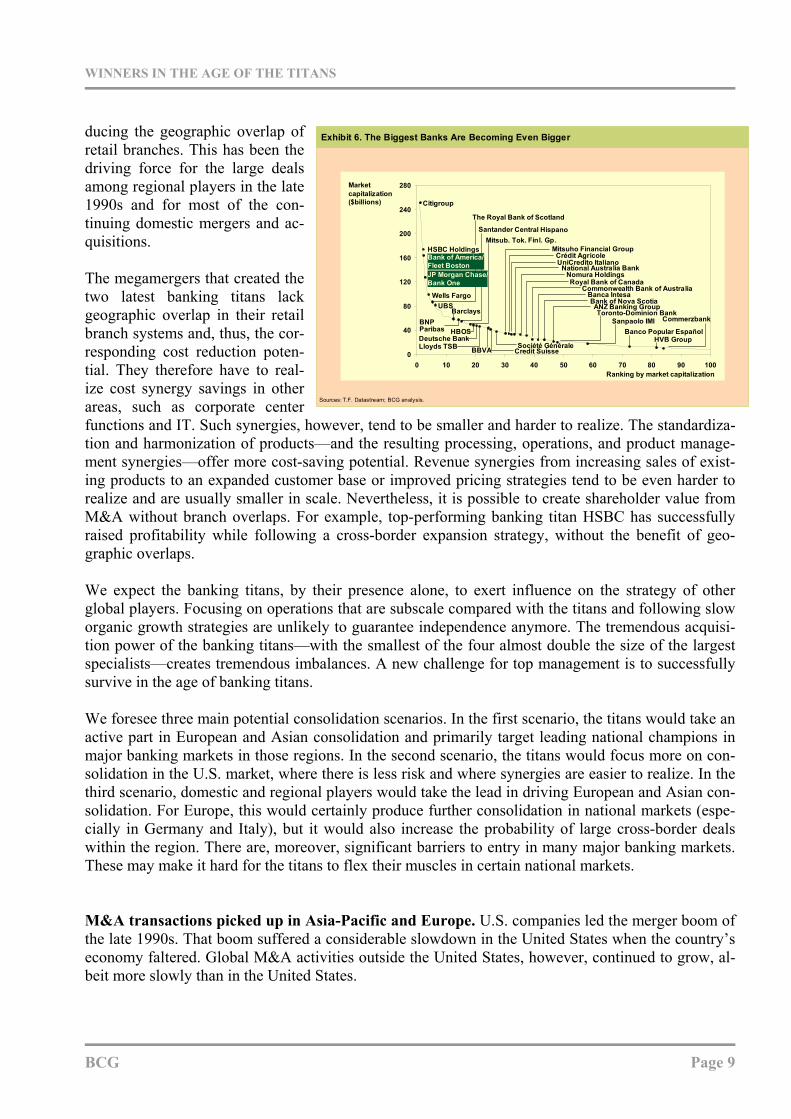
Higher profitability and recovering growth improved fundamental performance in 2003. In-creasing profitability and growing while profitability is above the cost of equity are the primary ways to increase TSR. Both value levers are captured by the performance metrics added value on equity (AVE) and the change (delta) in added value on equity (DAVE). AVE is the difference between af-ter-tax profits and the opportunity costs of alternative investments of equity capital. Dividing both quantities by equity yields the economic spread—in other words, the difference between return on equity (ROE) and the cost of equity (COE). In 2003, value creation in world banking—measured by AVE—was driven mostly by profitable growth rather than increasing profitability. Although ROE rose from 13.0 percent to 14.4 per-cent, most of this increase was offset by the rising cost of eq-uity, with the result that the eco-nomic spread increased by only 0.3 percent. Banks therefore maintained their spread while growing their invested equity base by 17.4 percent, almost double that of the previous year, resulting in a 16.3 percent in-crease in AVE. (See Exhibit 4.)
Exhibit 4. Fundamental Value Creation in 2003 Was Based on Increased Profitability and Growth
Added value on equity ($ billions)
Profitability and cost of equity Growth (3) of equity in banking ($ trillions)
14.4%13.0%14.0%17.5%16.7%
10.9%9.8%9.5%9.3%11.3%
1999 2000 2001 2002 2003 1999 2000 2001 2002 2003
ROE(1)
COE
(2) (2)
57
123
7369 72
1999 2000 2001 2002 2003
78.4% -40.9% -22.3% 27.6%
(1) After tax.(2) If historic data for 2003 were not available, calculation was based on IBES consensus forecasts.(3) Organic and external growth.Sources: T.F. Datastream; BCG analysis.
1.28 1.51 1.621.78
2.0918.0% 7.3% 9.6% 17.4%
BCG Page 7

WINNERS IN THE AGE OF THE TITANS
Solid underlying growth in profitably invested equity drove the rebound in market capitalization. This growth has led to renewed confidence in the sector reflected in a large increase in the expecta-tion premium. The challenge in the future will be to justify growing expectations with strong funda-mental performance.
• Increasing confidence in banking reinforced improved fundamentals. • Continued strong performance is necessary to justify growing expectations.
Growth and Consolidation Reappeared on the Agenda Accelerating growth is at the top of the CEO agenda. Stock markets reward change, which is gen-erated either by an increase in ROE or by profitable growth. The lever with the greatest impact on value creation is organic growth. Adjusting overall equity growth rates for mergers and acquisitions and the impact of currency fluctuation shows organic growth rates of 6.7 percent in 2003, almost double the 3.5 percent organic growth rate in 2002. (See Exhibit 4.) However, these figures are still far below the 2000 organic growth rate of 18 percent and do not match the average annual organic growth rate of 9 percent between 1999 and 2003. Developing new products and services only after developing a deep understanding of customers and clients is vital to improving growth as the industry consolidates rapidly. Market capitalization is increasingly concentrated. The share of global banking’s market value, represented by the five biggest banks, has increased from 12.9 percent to 16.1 percent in the past five years. The top five banks by market value in 2003 have ex-panded their market cap, on aver-age, by 17.9 percent per year over the past five years—more than twice as fast as their mid-cap competitors. (See Exhibit 5.) In the small-cap segment, apprecia-tion was still better. This increase can be attributed partly to small banks being perceived as takeover targets, which adds a premium to their value.
Exhibit 5. The Concentration of Market Capitalization in the Banking Industry Is Increasing
Concentration of market capitalization
0%
20%
40%
60%
80%
100%
0% 20% 40% 60% 80% 100%
% of total market capitalization
% of total listed companies
Dec.2003
Dec. 1998
Share of five biggest companies
12.9% 16.1%
Dec. 311998
100%
Dec. 312003
100%
Growth of average market cap, 1999–2003
Mergers and acquisitions drive the market capitalization increase of five biggest companies
Biggest at Dec. 31, 2003
1-5 21–50 51-100 >100…
17.9%
6.2% 5.2%8.5%
Sources: T.F. Datastream; BCG analysis.
6-20
7.4%
New banking titans are changing the consolidation game. The continued consolidation of the larg-est banks is creating a new era: the age of the banking titans. With the megamergers of Bank of America/FleetBoston and JP Morgan Chase/Bank One added to established giants Citigroup and HSBC, there are now four banking titans, each with market caps of more than $120 billion and an average size of $180 billion. (See Exhibit 6.) To create value from mergers and acquisitions, it is imperative to realize the necessary cost and reve-nue synergies. The primary sources for value creation have traditionally been cost synergies from re-
BCG Page 8
WINNERS IN THE AGE OF THE TITANS
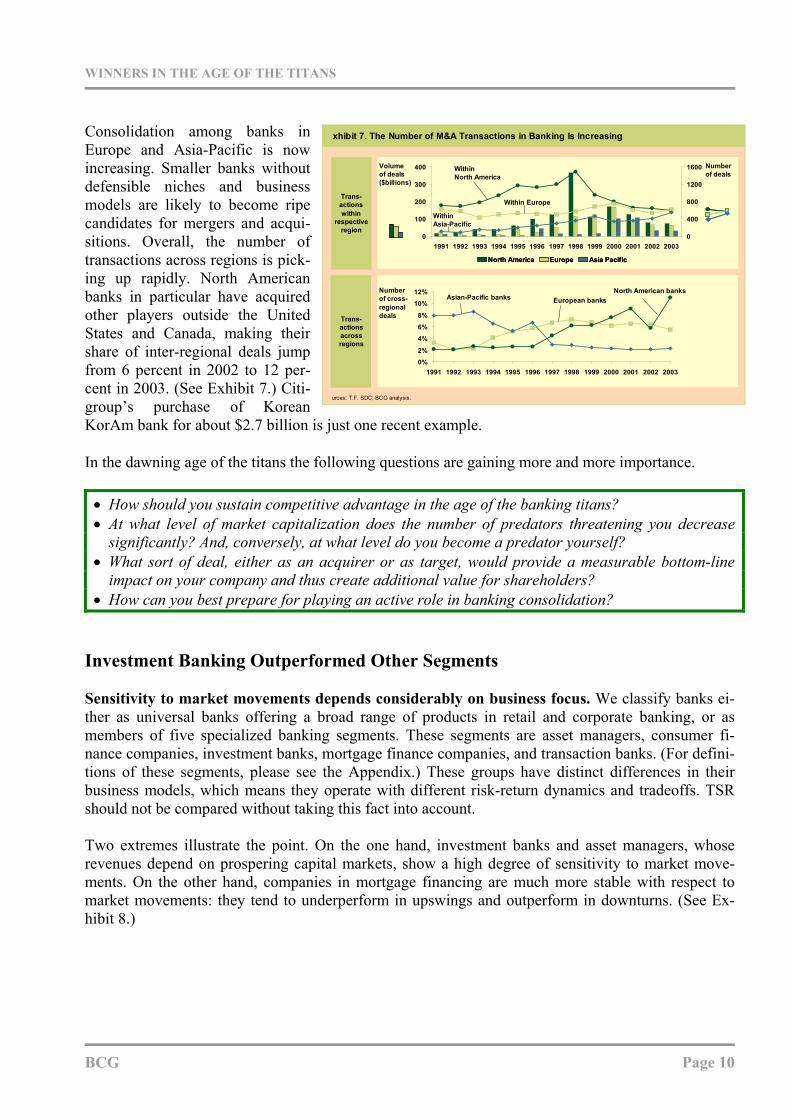
ducing the geographic overlap of retail branches. This has been the driving force for the large deals among regional players in the late 1990s and for most of the con-tinuing domestic mergers and ac-quisitions.
The megamergers that created the two latest banking titans lack geographic overlap in their retail branch systems and, thus, the cor-responding cost reduction poten-tial. They therefore have to real-ize cost synergy savings in other areas, such as corporate center functions and IT. Such synergies, however, tend to be smaller and harder to realize. The standardiza-tion and harmonization of products—and the resulting processing, operations, and product manage-ment synergies—offer more cost-saving potential. Revenue synergies from increasing sales of exist-ing products to an expanded customer base or improved pricing strategies tend to be even harder to realize and are usually smaller in scale. Nevertheless, it is possible to create shareholder value from M&A without branch overlaps. For example, top-performing banking titan HSBC has successfully raised profitability while following a cross-border expansion strategy, without the benefit of geo-graphic overlaps.
Exhibit 6. The Biggest Banks Are Becoming Even Bigger
0
40
80
120
160
200
240
280
0 10 20 30 40 50 60 70 80 90 100
Citigroup
Wells Fargo
The Royal Bank of Scotland
UBSBarclays
BNPParibas
Santander Central HispanoMitsub. Tok. Finl. Gp.
Deutsche Bank
National Australia Bank
Société Générale
UniCredito Italiano
Royal Bank of CanadaNomura Holdings
Commonwealth Bank of Australia
Mitsuho Financial Group
Banca IntesaANZ Banking GroupToronto-Dominion Bank
Sanpaolo IMIBanco Popular Español
HVB Group
Market capitalization($billions)
Ranking by market capitalization
Commerzbank
Crédit Agricole
Credit SuisseBBVA
Sources: T.F. Datastream; BCG analysis.
Bank of America/Fleet BostonJP Morgan Chase/Bank One
Bank of Nova Scotia
HSBC Holdings
HBOS
Lloyds TSB
We expect the banking titans, by their presence alone, to exert influence on the strategy of other global players. Focusing on operations that are subscale compared with the titans and following slow organic growth strategies are unlikely to guarantee independence anymore. The tremendous acquisi-tion power of the banking titans—with the smallest of the four almost double the size of the largest specialists—creates tremendous imbalances. A new challenge for top management is to successfully survive in the age of banking titans. We foresee three main potential consolidation scenarios. In the first scenario, the titans would take an active part in European and Asian consolidation and primarily target leading national champions in major banking markets in those regions. In the second scenario, the titans would focus more on con-solidation in the U.S. market, where there is less risk and where synergies are easier to realize. In the third scenario, domestic and regional players would take the lead in driving European and Asian con-solidation. For Europe, this would certainly produce further consolidation in national markets (espe-cially in Germany and Italy), but it would also increase the probability of large cross-border deals within the region. There are, moreover, significant barriers to entry in many major banking markets. These may make it hard for the titans to flex their muscles in certain national markets. M&A transactions picked up in Asia-Pacific and Europe. U.S. companies led the merger boom of the late 1990s. That boom suffered a considerable slowdown in the United States when the country’s economy faltered. Global M&A activities outside the United States, however, continued to grow, al-beit more slowly than in the United States.
BCG Page 9
WINNERS IN THE AGE OF THE TITANS
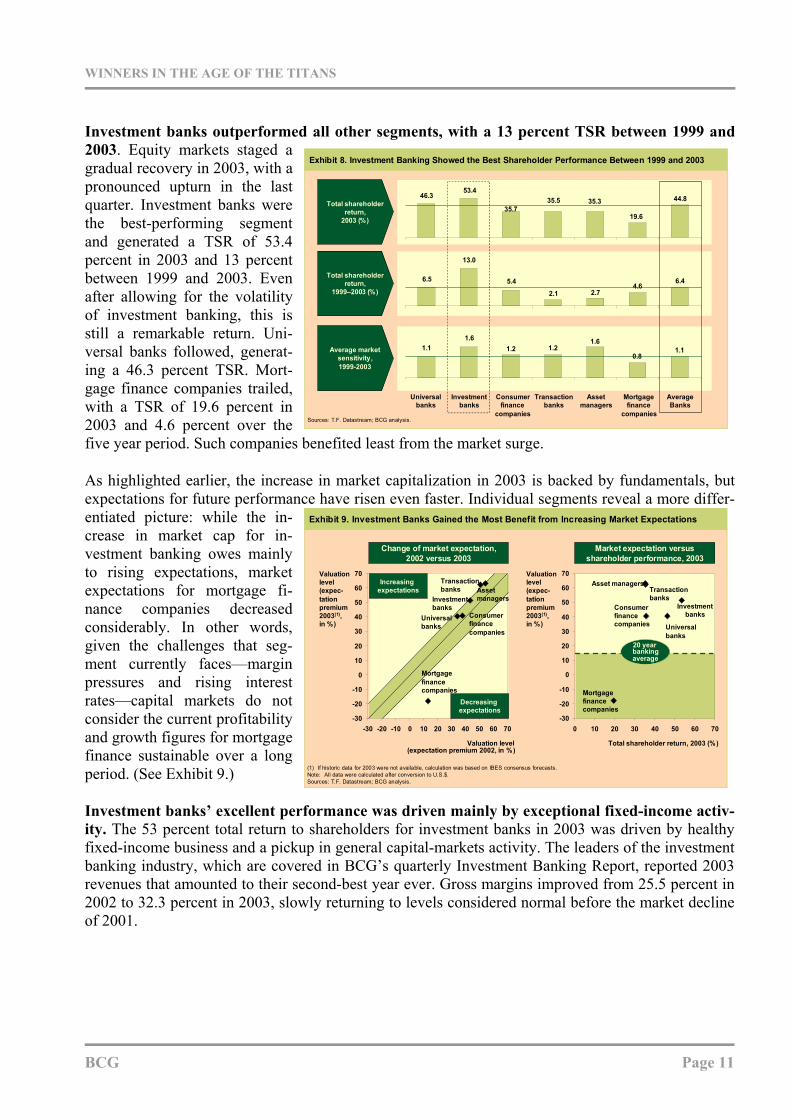
Consolidation among banks in Europe and Asia-Pacific is now increasing. Smaller banks without defensible niches and business models are likely to become ripe candidates for mergers and acqui-sitions. Overall, the number of transactions across regions is pick-ing up rapidly. North American banks in particular have acquired other players outside the United States and Canada, making their share of inter-regional deals jump from 6 percent in 2002 to 12 per-cent in 2003. (See Exhibit 7.) Citi-group’s purchase of Korean KorAm bank for about $2.7 billion is just one recent example.
E
So
E
So
xhibit 7. The Number of M&A Transactions in Banking Is Increasing
0
100
200
300
400
1991 1992 1993 1994 1995 1996 1997 1998 1999 2000 2001 2002 20030
400
800
1200
1600
Trans-actionswithin
respectiveregion
Volume of deals($billions)
Numberof deals
North America Europe Asia Pacific
WithinNorth America
Within Europe
WithinAsia-Pacific
0%2%
4%6%8%
10%12%
1991 1992 1993 1994 1995 1996 1997 1998 1999 2000 2001 2002 2003
Trans-actionsacrossregions
Numberof cross-regionaldeals
European banksNorth American banks
Asian-Pacific banks
urces: T.F. SDC; BCG analysis.
xhibit 7. The Number of M&A Transactions in Banking Is Increasing
0
100
200
300
400
1991 1992 1993 1994 1995 1996 1997 1998 1999 2000 2001 2002 20030
400
800
1200
1600
Trans-actionswithin
respectiveregion
Volume of deals($billions)
Numberof deals
North America Europe Asia PacificNorth America Europe Asia Pacific
WithinNorth America
Within Europe
WithinAsia-Pacific
0%2%
4%6%8%
10%12%
1991 1992 1993 1994 1995 1996 1997 1998 1999 2000 2001 2002 2003
Trans-actionsacrossregions
Numberof cross-regionaldeals
European banksNorth American banks
Asian-Pacific banks
urces: T.F. SDC; BCG analysis.
In the dawning age of the titans the following questions are gaining more and more importance.
• How should you sustain competitive advantage in the age of the banking titans? • At what level of market capitalization does the number of predators threatening you decrease
significantly? And, conversely, at what level do you become a predator yourself? • What sort of deal, either as an acquirer or as target, would provide a measurable bottom-line
impact on your company and thus create additional value for shareholders? • How can you best prepare for playing an active role in banking consolidation?
Investment Banking Outperformed Other Segments Sensitivity to market movements depends considerably on business focus. We classify banks ei-ther as universal banks offering a broad range of products in retail and corporate banking, or as members of five specialized banking segments. These segments are asset managers, consumer fi-nance companies, investment banks, mortgage finance companies, and transaction banks. (For defini-tions of these segments, please see the Appendix.) These groups have distinct differences in their business models, which means they operate with different risk-return dynamics and tradeoffs. TSR should not be compared without taking this fact into account. Two extremes illustrate the point. On the one hand, investment banks and asset managers, whose revenues depend on prospering capital markets, show a high degree of sensitivity to market move-ments. On the other hand, companies in mortgage financing are much more stable with respect to market movements: they tend to underperform in upswings and outperform in downturns. (See Ex-hibit 8.)
BCG Page 10
WINNERS IN THE AGE OF THE TITANS
Investment banks outperformed all other segments, with a 13 percent TSR between 1999 and 2003. Equity markets staged a gradual recovery in 2003, with a pronounced upturn in the last quarter. Investment banks were the best-performing segment and generated a TSR of 53.4 percent in 2003 and 13 percent between 1999 and 2003. Even after allowing for the volatility of investment banking, this is still a remarkable return. Uni-versal banks followed, generat-ing a 46.3 percent TSR. Mort-gage finance companies trailed, with a TSR of 19.6 percent in 2003 and 4.6 percent over the five year period. Such companies benefited least from the market surge.
Exhibit 8. Investment Banking Showed the Best Shareholder Performance Between 1999 and 2003
Total shareholder return,
2003 (%)
Total shareholder return,
1999–2003 (%)6.4
4.62.72.1
5.46.5
13.0
Average market sensitivity,1999-2003
1.10.8
1.61.21.21.1
1.6
Investmentbanks
Universalbanks
Consumerfinance
companies
Transactionbanks
Assetmanagers
Mortgagefinance
companies
AverageBanks
Sources: T.F. Datastream; BCG analysis.
44.8
19.6
35.335.535.7
46.353.4
As highlighted earlier, the increase in market capitalization in 2003 is backed by fundamentals, but expectations for future performance have risen even faster. Individual segments reveal a more differ-entiated picture: while the in-crease in market cap for in-vestment banking owes mainly to rising expectations, market expectations for mortgage fi-nance companies decreased considerably. In other words, given the challenges that seg-ment currently faces—margin pressures and rising interest rates—capital markets do not consider the current profitability and growth figures for mortgage finance sustainable over a long period. (See Exhibit 9.)
-30
-20
-10
0
10
20
30
40
50
60
70
0 10 20 30 40 50 60 70
Exhibit 9. Investment Banks Gained the Most Benefit from Increasing Market Expectations
Market expectation versus shareholder performance, 2003
Total shareholder return, 2003 (%)
Valuationlevel (expec-tationpremium 2003(1),in %)
Transactionbanks
Asset managers
Consumerfinance companies Universal
banks
Investmentbanks
20 year bankingaverage
Mortgage finance companies
-30
-20
-10
0
10
20
30
40
50
60
70
-30 -20 -10 0 10 20 30 40 50 60 70
Valuationlevel (expec-tationpremium 2003(1),in %)
Valuation level(expectation premium 2002, in %)
Change of market expectation, 2002 versus 2003
Increasing expectations
Decreasing expectations
Transaction banks
Investment banks
Consumerfinancecompanies
Universalbanks
Assetmanagers
(1) If historic data for 2003 were not available, calculation was based on IBES consensus forecasts.Note: All data were calculated after conversion to U.S.$.Sources: T.F. Datastream; BCG analysis.
Mortgage financecompanies
-30
-20
-10
0
10
20
30
40
50
60
70
0 10 20 30 40 50 60 70
Exhibit 9. Investment Banks Gained the Most Benefit from Increasing Market Expectations
Market expectation versus shareholder performance, 2003
Total shareholder return, 2003 (%)
Valuationlevel (expec-tationpremium 2003(1),in %)
Transactionbanks
Asset managers
Consumerfinance companies Universal
banks
Investmentbanks
20 year bankingaverage
Mortgage finance companies
-30
-20
-10
0
10
20
30
40
50
60
70
-30 -20 -10 0 10 20 30 40 50 60 70
Valuationlevel (expec-tationpremium 2003(1),in %)
Valuation level(expectation premium 2002, in %)
Change of market expectation, 2002 versus 2003
Increasing expectations
Decreasing expectations
Transaction banks
Investment banks
Consumerfinancecompanies
Universalbanks
Assetmanagers
(1) If historic data for 2003 were not available, calculation was based on IBES consensus forecasts.Note: All data were calculated after conversion to U.S.$.Sources: T.F. Datastream; BCG analysis.
Mortgage financecompanies
Investment banks’ excellent performance was driven mainly by exceptional fixed-income activ-ity. The 53 percent total return to shareholders for investment banks in 2003 was driven by healthy fixed-income business and a pickup in general capital-markets activity. The leaders of the investment banking industry, which are covered in BCG’s quarterly Investment Banking Report, reported 2003 revenues that amounted to their second-best year ever. Gross margins improved from 25.5 percent in 2002 to 32.3 percent in 2003, slowly returning to levels considered normal before the market decline of 2001.
BCG Page 11

WINNERS IN THE AGE OF THE TITANS
A closer look reveals that there are three drivers of investment banking’s improved performance:
1. Successful Cost-Cutting Programs. Widespread cost cutting in the past three years contrib-uted to the bottom line. From April 2001 to February 2003, about 80,400 securities employees (nearly 10 percent of the industry) lost their jobs. For instance, Merrill Lynch, which at the end of 2000 employed 72,000 people, cut its staff to 48,100 and reduced bonuses. Further-more, investment banks reduced communications and technology costs, as well as advertis-ing, travel, and office expenses.
2. Strong Fixed-Income Activity. Falling interest rates, widening credit spreads, and the prospect
of an economic recovery boosted fixed-income revenues and profits. Out of the total $49 bil-lion of profits earned in 2003, trading in debt-related products accounted for $31 billion.
3. Expectations on Equity and Advisory. Equity trading and M&A advisory remained stable dur-
ing the first three quarters of 2003 but surged in the fourth quarter, with a positive outlook for 2004 driving up expectations of future performance of investment banks. While the return of confidence in the stock market may herald a further upswing in the equities and advisory businesses, significant improvements are needed to compensate for a potential decline in fixed-income activity. Note that corporate finance revenues have to increase by more than 50 percent in order to make up for a 20 percent decline in fixed-income trading revenues.
Lehman Brothers stands out among the investment banks that performed exceedingly well. Its recent success is based on forward-looking management, a winning mix of businesses, and tight control of costs. The firm’s strong fixed-income franchise, in particular, has helped it prosper over the past 12 to 18 months, as debt markets have thrived in the continued low interest-rate environment. Lehman’s seasoned management also used the firm’s strong currency—its stock market value—to buy Neuber-ger Berman, an established asset manager, thereby broadening its mix of businesses. Lehman’s strategy allowed it to increase after-tax profit by 45 percent, to almost $1.7 billion. It has outperformed the national stock market for five years in a row, putting an average 29 percent in an-nual returns into the pockets of shareholders and making Lehman the top-performing company among the 100 largest banks worldwide.
• Remember that the higher returns of most specialists are usually paid by higher risk. • Be aware of the very different segment-specific market expectations. • Learn from investment banks: their highly responsive senior managers show that quick and radi-
cal cost alignment in a market downturn pays off.
BCG Page 12
WINNERS IN THE AGE OF THE TITANS
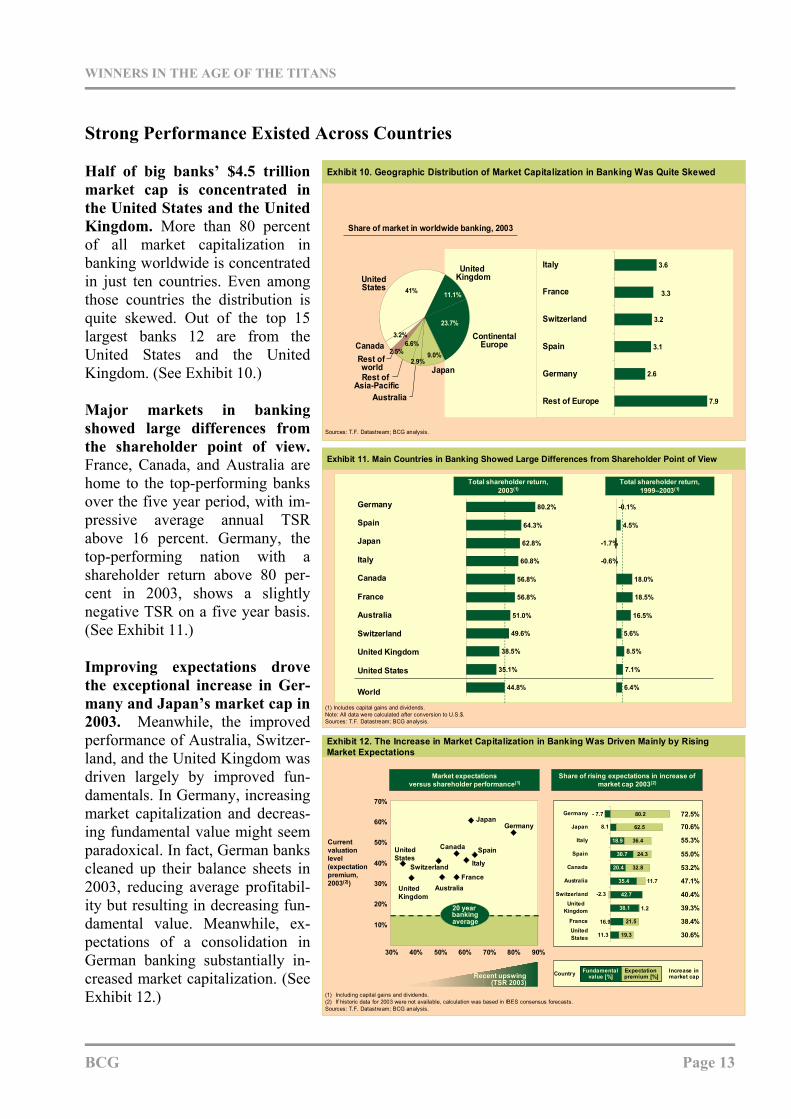
Strong Performance Existed Across Countries Half of big banks’ $4.5 trillion market cap is concentrated in the United States and the United Kingdom. More than 80 percent of all market capitalization in banking worldwide is concentrated in just ten countries. Even among those countries the distribution is quite skewed. Out of the top 15 largest banks 12 are from the United States and the United Kingdom. (See Exhibit 10.)
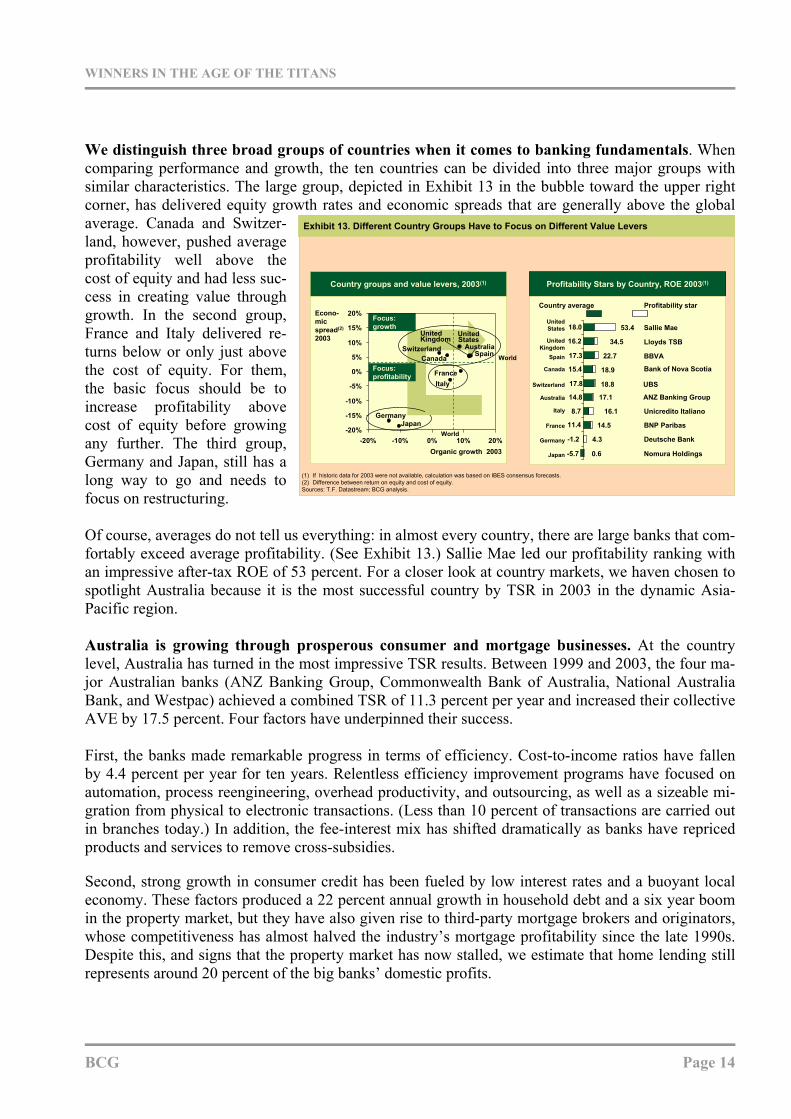
Major markets in banking showed large differences from the shareholder point of view. France, Canada, and Australia are home to the top-performing banks over the five year period, with im-pressive average annual TSR above 16 percent. Germany, the top-performing nation with a shareholder return above 80 per-cent in 2003, shows a slightly negative TSR on a five year basis. (See Exhibit 11.)
11.1%
23.7%
9.0%2.9%
6.6%2.5%
3.2%
41%
Australia
United Kingdom
ContinentalEurope
Japan Rest of
Asia-Pacific
Rest of world
Canada
UnitedStates
Exhibit 10. Geographic Distribution of Market Capitalization in Banking Was Quite Skewed
Sources: T.F. Datastream; BCG analysis.
7.9
2.6
3.1
3.2
3.3
3.6Italy
France
Switzerland
Spain
Germany
Rest of Europe
Share of market in worldwide banking, 2003
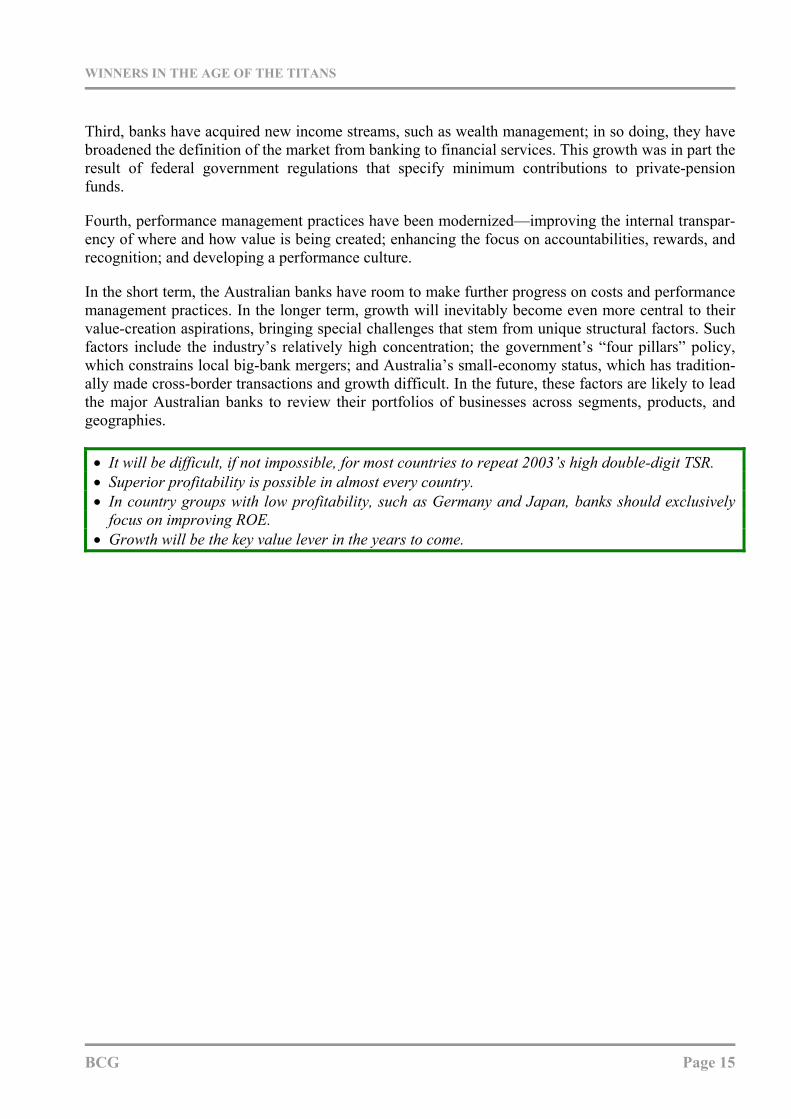
Improving expectations drove the exceptional increase in Ger-many and Japan’s market cap in 2003. Meanwhile, the improved performance of Australia, Switzer-land, and the United Kingdom was driven largely by improved fun-damentals. In Germany, increasing market capitalization and decreas-ing fundamental value might seem paradoxical. In fact, German banks cleaned up their balance sheets in 2003, reducing average profitabil-ity but resulting in decreasing fun-damental value. Meanwhile, ex-pectations of a consolidation in German banking substantially in-creased market capitalization. (See Exhibit 12.)
Exhibit 11. Main Countries in Banking Showed Large Differences from Shareholder Point of View
Total shareholder return, 2003(1)
Total shareholder return, 1999–2003(1)
6.4%
7.1%
8.5%
5.6%
16.5%
18.5%
18.0%
-0.6%
-1.7%
4.5%
-0.1%
44.8%
35.1%
38.5%
49.6%
51.0%
56.8%
56.8%
60.8%
62.8%
64.3%
80.2%
United Kingdom
Canada
Italy
France
United States
Australia
Switzerland
Germany
World
Spain
Japan
(1) Includes capital gains and dividends.Note: All data were calculated after conversion to U.S.$.Sources: T.F. Datastream; BCG analysis.
Exhibit 12. The Increase in Market Capitalization in Banking Was Driven Mainly by Rising Market Expectations
(1) Including capital gains and dividends.(2) If historic data for 2003 were not available, calculation was based in IBES consensus forecasts.Sources: T.F. Datastream; BCG analysis.
Current valuation level (expectationpremium, 2003(2))
Market expectations versus shareholder performance(1)
20%
30%
40%
United States
Switzerland Italy
70%
Spain
France
30% 40% 60% 70% 80% 90%
Australia
Germany60%
10%
Recent upswing(TSR 2003)
50%
50%
Canada
Japan
Share of rising expectations in increase of market cap 2003(2)
Country Increase in market cap
Fundamental value [%]
Expectation premium [%]
70.6%
55.3%
55.0%
53.2%
47.1%
40.4%
39.3%
38.4%
30.6%
72.5%
35.4
20.4
30.7
18.9
8.1
11.3
16.9
38.1
- 7.7
42.7
1.2
19.3
21.5
-2.3
11.7
32.8
24.3
36.4
62.5
80.2
UnitedStates
France
UnitedKingdom
Switzerland
Australia
Canada
Spain
Italy
Japan
Germany
United Kingdom
20 year bankingaverage
Exhibit 12. The Increase in Market Capitalization in Banking Was Driven Mainly by Rising Market Expectations
(1) Including capital gains and dividends.(2) If historic data for 2003 were not available, calculation was based in IBES consensus forecasts.Sources: T.F. Datastream; BCG analysis.
Current valuation level (expectationpremium, 2003(2))
Market expectations versus shareholder performance(1)
20%
30%
40%
United States
Switzerland Italy
70%
Spain
France
30% 40% 60% 70% 80% 90%
Australia
Germany60%
10%
Recent upswing(TSR 2003)
50%
50%
Canada
Japan
Share of rising expectations in increase of market cap 2003(2)
Country Increase in market cap
Fundamental value [%]
Expectation premium [%]
Fundamental value [%]
Expectation premium [%]
70.6%
55.3%
55.0%
53.2%
47.1%
40.4%
39.3%
38.4%
30.6%
72.5%
35.4
20.4
30.7
18.9
8.1
11.3
16.9
38.1
- 7.7
42.7
1.2
19.3
21.5
-2.3
11.7
32.8
24.3
36.4
62.5
80.2
UnitedStates
France
UnitedKingdom
Switzerland
Australia
Canada
Spain
Italy
Japan
Germany
United Kingdom
20 year bankingaverage
BCG Page 13
WINNERS IN THE AGE OF THE TITANS
We distinguish three broad groups of countries when it comes to banking fundamentals. When comparing performance and growth, the ten countries can be divided into three major groups with similar characteristics. The large group, depicted in Exhibit 13 in the bubble toward the upper right corner, has delivered equity growth rates and economic spreads that are generally above the global average. Canada and Switzer-land, however, pushed average profitability well above the cost of equity and had less suc-cess in creating value through growth. In the second group, France and Italy delivered re-turns below or only just above the cost of equity. For them, the basic focus should be to increase profitability above cost of equity before growing any further. The third group, Germany and Japan, still has a long way to go and needs to focus on restructuring.
Exhibit 13. Different Country Groups Have to Focus on Different Value Levers
(1) If historic data for 2003 were not available, calculation was based on IBES consensus forecasts.(2) Difference between return on equity and cost of equity.Sources: T.F. Datastream; BCG analysis.
Country groups and value levers, 2003(1)
Organic growth 2003
Econo-micspread(2)
2003
Focus: profitability
Focus: growth
World
World
Profitability Stars by Country, ROE 2003(1)
14.8
-5.7
-1.2
11.4
8.7
17.8
15.4
17.3
16.2
18.0
United Kingdom
United States
Spain
Canada
Switzerland
Italy
Sallie Mae
Lloyds TSB
Deutsche Bank
BBVA
Country average Profitability star
Australia
France
Germany
BNP Paribas
4.3
0.6
14.5
22.7
34.5
53.4
Japan Nomura Holdings
Unicredito Italiano
Bank of Nova Scotia
ANZ Banking Group
UBS18.8
18.9
16.1
17.1
-20%
-15%
-10%
-5%
0%
5%
10%
15%
20%
-20% -10% 0% 10% 20%
GermanyJapan
UnitedStates
Australia
UnitedKingdom
FranceItaly
CanadaSwitzerland Spain
Of course, averages do not tell us everything: in almost every country, there are large banks that com-fortably exceed average profitability. (See Exhibit 13.) Sallie Mae led our profitability ranking with an impressive after-tax ROE of 53 percent. For a closer look at country markets, we haven chosen to spotlight Australia because it is the most successful country by TSR in 2003 in the dynamic Asia-Pacific region. Australia is growing through prosperous consumer and mortgage businesses. At the country level, Australia has turned in the most impressive TSR results. Between 1999 and 2003, the four ma-jor Australian banks (ANZ Banking Group, Commonwealth Bank of Australia, National Australia Bank, and Westpac) achieved a combined TSR of 11.3 percent per year and increased their collective AVE by 17.5 percent. Four factors have underpinned their success. First, the banks made remarkable progress in terms of efficiency. Cost-to-income ratios have fallen by 4.4 percent per year for ten years. Relentless efficiency improvement programs have focused on automation, process reengineering, overhead productivity, and outsourcing, as well as a sizeable mi-gration from physical to electronic transactions. (Less than 10 percent of transactions are carried out in branches today.) In addition, the fee-interest mix has shifted dramatically as banks have repriced products and services to remove cross-subsidies.
Second, strong growth in consumer credit has been fueled by low interest rates and a buoyant local economy. These factors produced a 22 percent annual growth in household debt and a six year boom in the property market, but they have also given rise to third-party mortgage brokers and originators, whose competitiveness has almost halved the industry’s mortgage profitability since the late 1990s. Despite this, and signs that the property market has now stalled, we estimate that home lending still represents around 20 percent of the big banks’ domestic profits.
BCG Page 14
WINNERS IN THE AGE OF THE TITANS
Third, banks have acquired new income streams, such as wealth management; in so doing, they have broadened the definition of the market from banking to financial services. This growth was in part the result of federal government regulations that specify minimum contributions to private-pension funds.
Fourth, performance management practices have been modernized—improving the internal transpar-ency of where and how value is being created; enhancing the focus on accountabilities, rewards, and recognition; and developing a performance culture.
In the short term, the Australian banks have room to make further progress on costs and performance management practices. In the longer term, growth will inevitably become even more central to their value-creation aspirations, bringing special challenges that stem from unique structural factors. Such factors include the industry’s relatively high concentration; the government’s “four pillars” policy, which constrains local big-bank mergers; and Australia’s small-economy status, which has tradition-ally made cross-border transactions and growth difficult. In the future, these factors are likely to lead the major Australian banks to review their portfolios of businesses across segments, products, and geographies.
• It will be difficult, if not impossible, for most countries to repeat 2003’s high double-digit TSR. • Superior profitability is possible in almost every country. • In country groups with low profitability, such as Germany and Japan, banks should exclusively
focus on improving ROE. • Growth will be the key value lever in the years to come.
BCG Page 15
WINNERS IN THE AGE OF THE TITANS
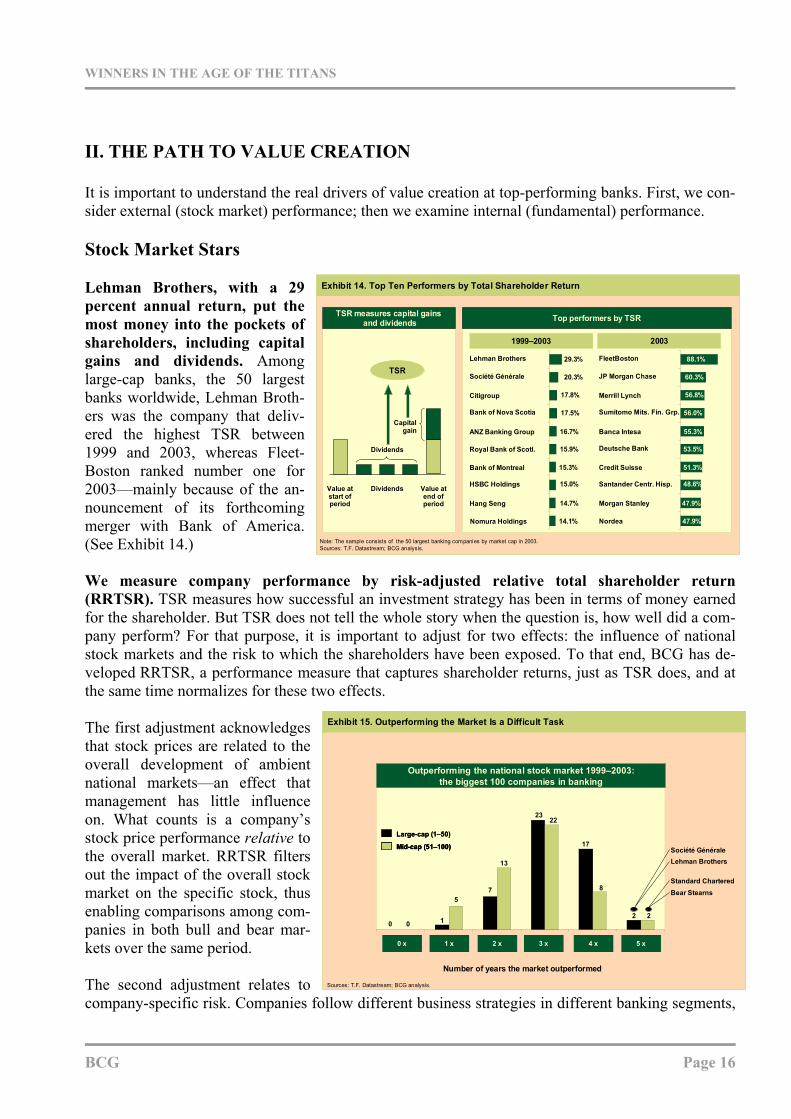
II. THE PATH TO VALUE CREATION It is important to understand the real drivers of value creation at top-performing banks. First, we con-sider external (stock market) performance; then we examine internal (fundamental) performance. Stock Market Stars Lehman Brothers, with a 29 percent annual return, put the most money into the pockets of shareholders, including capital gains and dividends. Among large-cap banks, the 50 largest banks worldwide, Lehman Broth-ers was the company that deliv-ered the highest TSR between 1999 and 2003, whereas Fleet-Boston ranked number one for 2003—mainly because of the an-nouncement of its forthcoming merger with Bank of America. (See Exhibit 14.)
Société Générale
Citigroup
Bank of Nova Scotia
ANZ Banking Group
Royal Bank of Scotl.
Bank of Montreal
HSBC Holdings
Hang Seng
1999–2003
Lehman Brothers
Nomura Holdings
Dividends Value atend ofperiod
Value atstart ofperiod
Capitalgain
Exhibit 14. Top Ten Performers by Total Shareholder Return
TSR measures capital gainsand dividends
JP Morgan Chase
Merrill Lynch
Sumitomo Mits. Fin. Grp.
Banca Intesa
Deutsche Bank
Credit Suisse
Santander Centr. Hisp.
Morgan Stanley
2003
FleetBoston
Top performers by TSR
Dividends
TSR
Note: The sample consists of the 50 largest banking companies by market cap in 2003.Sources: T.F. Datastream; BCG analysis.
88.1%
60.3%
56.8%
56.0%
55.3%
53.5%
51.3%
48.6%
47.9%
47.9%
29.3%
20.3%
17.8%
17.5%
16.7%
15.9%
15.3%
15.0%
14.7%
14.1% Nordea
We measure company performance by risk-adjusted relative total shareholder return (RRTSR). TSR measures how successful an investment strategy has been in terms of money earned for the shareholder. But TSR does not tell the whole story when the question is, how well did a com-pany perform? For that purpose, it is important to adjust for two effects: the influence of national stock markets and the risk to which the shareholders have been exposed. To that end, BCG has de-veloped RRTSR, a performance measure that captures shareholder returns, just as TSR does, and at the same time normalizes for these two effects. The first adjustment acknowledges that stock prices are related to the overall development of ambient national markets—an effect that management has little influence on. What counts is a company’s stock price performance relative to the overall market. RRTSR filters out the impact of the overall stock market on the specific stock, thus enabling comparisons among com-panies in both bull and bear mar-kets over the same period.
The second adjustment relates to company-specific risk. Companies follow different business strategies in different banking segments,
Exhibit 15. Outperforming the Market Is a Difficult Task
0 x 1 x 2 x 3 x 4 x 5 x
00 1
57
13
2322
17
8
2 2
Large-cap (1–50)
Mid-cap (51–100)
0 x 1 x 2 x 3 x 4 x 5 x
Number of years the market outperformed
Outperforming the national stock market 1999–2003:the biggest 100 companies in banking
Lehman BrothersSociété Générale
Bear StearnsStandard Chartered
Sources: T.F. Datastream; BCG analysis.
Exhibit 15. Outperforming the Market Is a Difficult Task
0 x 1 x 2 x 3 x 4 x 5 x
00 1
57
13
2322
17
8
2 2
Large-cap (1–50)
Mid-cap (51–100)
Large-cap (1–50)
Mid-cap (51–100)Mid-cap (51–100)
0 x 1 x 2 x 3 x 4 x 5 x
Number of years the market outperformed
Outperforming the national stock market 1999–2003:the biggest 100 companies in banking
Lehman BrothersSociété Générale
Bear StearnsStandard Chartered
Sources: T.F. Datastream; BCG analysis.
BCG Page 16
WINNERS IN THE AGE OF THE TITANS
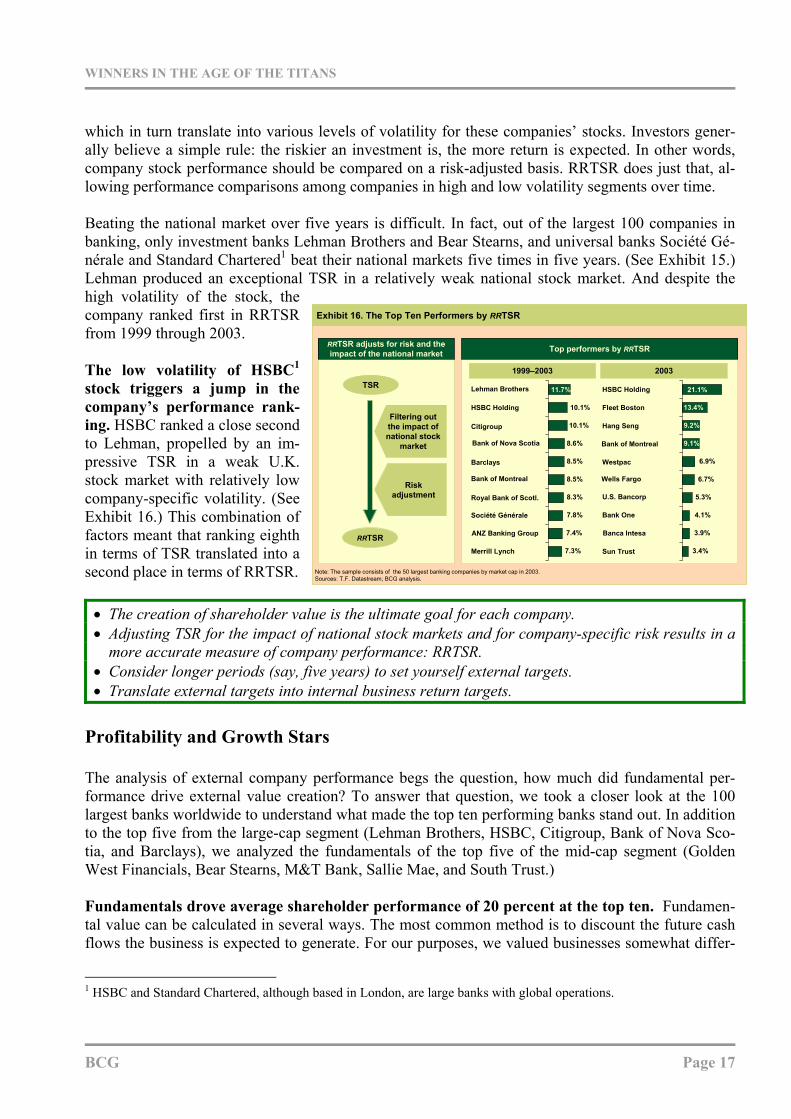
which in turn translate into various levels of volatility for these companies’ stocks. Investors gener-ally believe a simple rule: the riskier an investment is, the more return is expected. In other words, company stock performance should be compared on a risk-adjusted basis. RRTSR does just that, al-lowing performance comparisons among companies in high and low volatility segments over time. Beating the national market over five years is difficult. In fact, out of the largest 100 companies in banking, only investment banks Lehman Brothers and Bear Stearns, and universal banks Société Gé-nérale and Standard Chartered1 beat their national markets five times in five years. (See Exhibit 15.) Lehman produced an exceptional TSR in a relatively weak national stock market. And despite the high volatility of the stock, the company ranked first in RRTSR from 1999 through 2003.
Merrill Lynch
Citigroup
Société Générale
HSBC Holding
1999–2003
ANZ Banking Group
Exhibit 16. The Top Ten Performers by RRTSR
RRTSR adjusts for risk and the impact of the national market
2003
Top performers by RRTSR
TSR
RRTSR
Filtering out the impact of national stock
market
Riskadjustment
Fleet Boston
Hang Seng
Bank of Montreal
Bank One
Westpac
Wells Fargo
U.S. Bancorp
Sun Trust
HSBC Holding
Banca Intesa
Note: The sample consists of the 50 largest banking companies by market cap in 2003.Sources: T.F. Datastream; BCG analysis.
Lehman Brothers
Bank of Nova Scotia
Barclays
Bank of Montreal
Royal Bank of Scotl.
21.1%
13.4%
9.2%
9.1%
6.9%
6.7%
5.3%
4.1%
3.9%
3.4%
11.7%
10.1%
10.1%
8.6%
8.5%
8.5%
8.3%
7.8%
7.4%
7.3%Merrill Lynch
Citigroup
Société Générale
HSBC Holding
1999–2003
ANZ Banking Group
Exhibit 16. The Top Ten Performers by RRTSR
RRTSR adjusts for risk and the impact of the national market
2003
Top performers by RRTSR
TSR
RRTSR
Filtering out the impact of national stock
market
Riskadjustment
Fleet Boston
Hang Seng
Bank of Montreal
Bank One
Westpac
Wells Fargo
U.S. Bancorp
Sun Trust
HSBC Holding
Banca Intesa
Note: The sample consists of the 50 largest banking companies by market cap in 2003.Sources: T.F. Datastream; BCG analysis.
Lehman Brothers
Bank of Nova Scotia
Barclays
Bank of Montreal
Royal Bank of Scotl.
21.1%
13.4%
9.2%
9.1%
6.9%
6.7%
5.3%
4.1%
3.9%
3.4%
11.7%
10.1%
10.1%
8.6%
8.5%
8.5%
8.3%
7.8%
7.4%
7.3%
The low volatility of HSBC1 stock triggers a jump in the company’s performance rank-ing. HSBC ranked a close second to Lehman, propelled by an im-pressive TSR in a weak U.K. stock market with relatively low company-specific volatility. (See Exhibit 16.) This combination of factors meant that ranking eighth in terms of TSR translated into a second place in terms of RRTSR.
• The creation of shareholder value is the ultimate goal for each company. • Adjusting TSR for the impact of national stock markets and for company-specific risk results in a
more accurate measure of company performance: RRTSR. • Consider longer periods (say, five years) to set yourself external targets. • Translate external targets into internal business return targets.
Profitability and Growth Stars The analysis of external company performance begs the question, how much did fundamental per-formance drive external value creation? To answer that question, we took a closer look at the 100 largest banks worldwide to understand what made the top ten performing banks stand out. In addition to the top five from the large-cap segment (Lehman Brothers, HSBC, Citigroup, Bank of Nova Sco-tia, and Barclays), we analyzed the fundamentals of the top five of the mid-cap segment (Golden West Financials, Bear Stearns, M&T Bank, Sallie Mae, and South Trust.) Fundamentals drove average shareholder performance of 20 percent at the top ten. Fundamen-tal value can be calculated in several ways. The most common method is to discount the future cash flows the business is expected to generate. For our purposes, we valued businesses somewhat differ-
BCG Page 17
1 HSBC and Standard Chartered, although based in London, are large banks with global operations.
WINNERS IN THE AGE OF THE TITANS
ently leading to the same results: we took the book value of equity invested in the business and added the present value of the sum of future AVE. The internal measure corresponding to TSR is total business return (TBR). It is calculated in roughly the same way as TSR—except that instead of using market capi-talization, TBR uses fundamen-tal value based on AVE. TBR enables companies to assess the value creation of individual business units in a manner con-sistent with the shareholder per-spective and therefore enables value-based portfolio manage-ment. Transparency over where and how value is created inter-nally is critical as management seeks to allocate scarce re-sources—for example, people and equity—to their best avail-able use, continually balancing between profitability and growth.
((((
Exhibit 17. Top Ten Banks Show Strong Shareholder Performance Driven Fundamentals
Fundamental performance(1) , 1999–2003(2)
1) Percentage change in fundamental value, including free cash flows to shareholders (TBR).2) If historic data for 2003 were not available, calculation is based on IBES consensus forecasts.
Note: The sample consists of the 100 largest banks; top ten and bottom ten RRTSR performers from large- and mid-cap size groups.Sources: T.F. Datastream; BCG analysis.
Average total shareholder return, 1999–2003
19,9%
9.1%
-6.7%
Top tenAveragecompanies
Bottom ten
25.2%
16.0%
-7,6%
Top tenAveragecompanies
Bottom ten
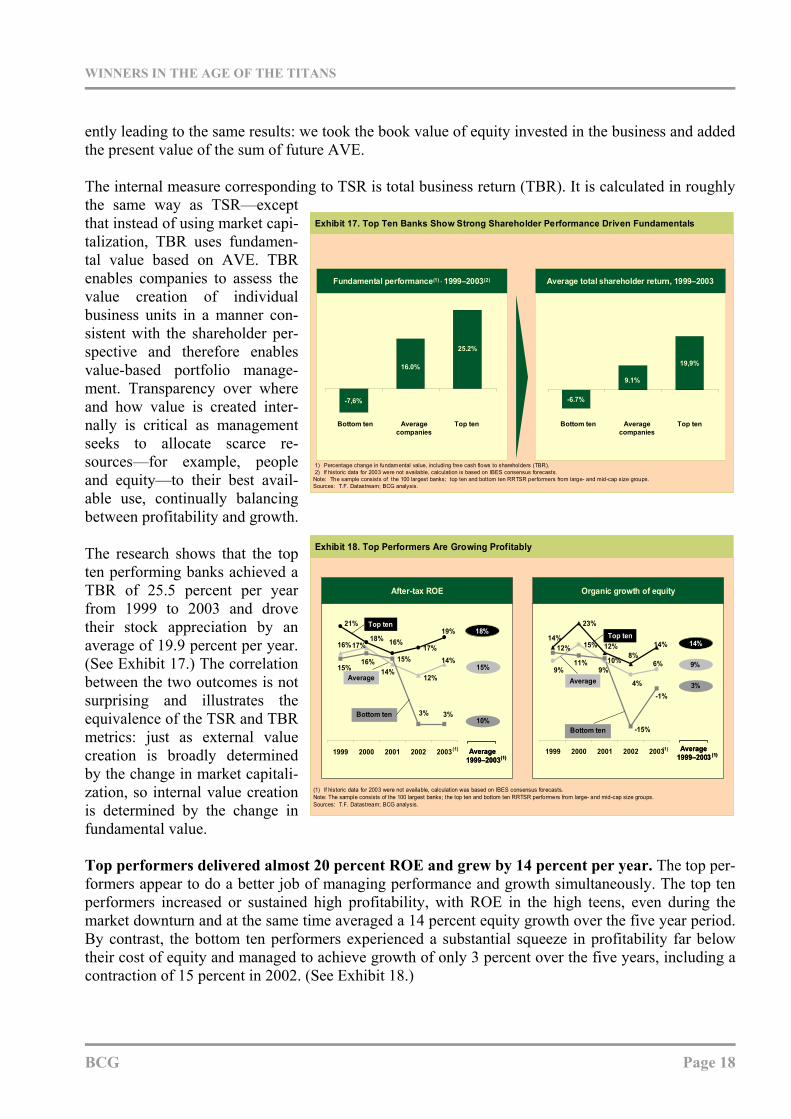
The research shows that the top ten performing banks achieved a TBR of 25.5 percent per year from 1999 to 2003 and drove their stock appreciation by an average of 19.9 percent per year. (See Exhibit 17.) The correlation between the two outcomes is not surprising and illustrates the equivalence of the TSR and TBR metrics: just as external value creation is broadly determined by the change in market capitali-zation, so internal value creation is determined by the change in fundamental value.
Exhibit 18. Top Performers Are Growing Profitably
After-tax ROE Organic growth of equity
17%15%
19%16%
21%
18%
14%
12%14%
16%17%
3%3%
16%15%
1999 2000 2001 2002 2003
18%
15%
15%8%
12%
23%
14%14%
4%
6%9%9%
11% 10%
-15%
-1%
12%
1999 2000 2001 2002 2003
9%
3%
Top tenTop ten
Average1999–2003(1)
(1)
Bottom ten10%
14%
Average
Average1999–2003 (1)
(1)
(1) If historic data for 2003 were not available, calculation was based on IBES consensus forecasts.Note: The sample consists of the 100 largest banks; the top ten and bottom ten RRTSR performers from large- and mid-cap size groups.Sources: T.F. Datastream; BCG analysis.
Average
Bottom ten
Exhibit 18. Top Performers Are Growing Profitably
After-tax ROE Organic growth of equity
17%15%
19%16%
21%
18%
14%
12%14%
16%17%
3%3%
16%15%
1999 2000 2001 2002 2003
18%
15%
15%8%
12%
23%
14%14%
4%
6%9%9%
11% 10%
-15%
-1%
12%
1999 2000 2001 2002 2003
9%
3%
Top tenTop ten
Average1999–2003(1)Average
1999–2003(1)(1)
Bottom ten10%
14%
Average
Average1999–2003 (1)Average
1999–2003 (1)(1)
(1) If historic data for 2003 were not available, calculation was based on IBES consensus forecasts.Note: The sample consists of the 100 largest banks; the top ten and bottom ten RRTSR performers from large- and mid-cap size groups.Sources: T.F. Datastream; BCG analysis.
Average
Bottom ten
Top performers delivered almost 20 percent ROE and grew by 14 percent per year. The top per-formers appear to do a better job of managing performance and growth simultaneously. The top ten performers increased or sustained high profitability, with ROE in the high teens, even during the market downturn and at the same time averaged a 14 percent equity growth over the five year period. By contrast, the bottom ten performers experienced a substantial squeeze in profitability far below their cost of equity and managed to achieve growth of only 3 percent over the five years, including a contraction of 15 percent in 2002. (See Exhibit 18.)
BCG Page 18
WINNERS IN THE AGE OF THE TITANS
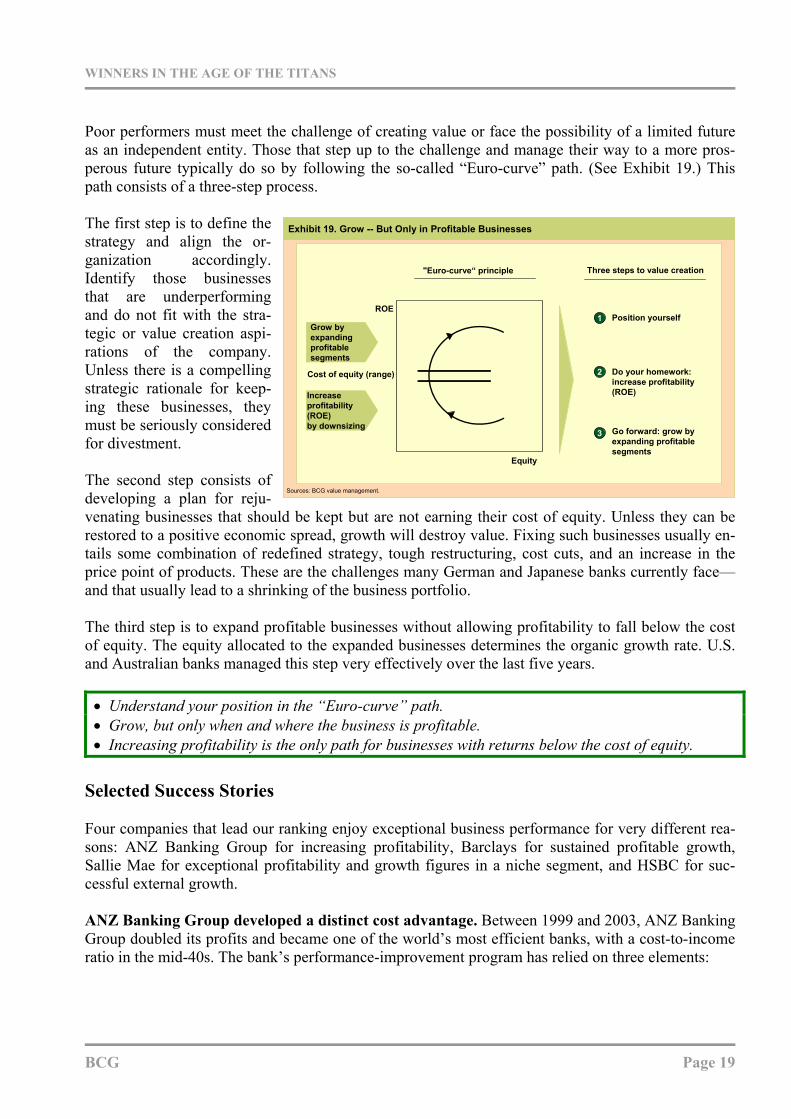
Poor performers must meet the challenge of creating value or face the possibility of a limited future as an independent entity. Those that step up to the challenge and manage their way to a more pros-perous future typically do so by following the so-called “Euro-curve” path. (See Exhibit 19.) This path consists of a three-step process. The first step is to define the strategy and align the or-ganization accordingly. Identify those businesses that are underperforming and do not fit with the stra-tegic or value creation aspi-rations of the company. Unless there is a compelling strategic rationale for keep-ing these businesses, they must be seriously considered for divestment.
The second step consists of developing a plan for reju-venating businesses that should be kept but are not earning their cost of equity. Unless they can be restored to a positive economic spread, growth will destroy value. Fixing such businesses usually en-tails some combination of redefined strategy, tough restructuring, cost cuts, and an increase in the price point of products. These are the challenges many German and Japanese banks currently face—and that usually lead to a shrinking of the business portfolio.
Exhibit 19. Grow -- But Only in Profitable Businesses
Increase profitability (ROE)by downsizing
ROE
Cost of equity (range)
Three steps to value creation
Do your homework: increase profitability (ROE)
Position yourself
2
1Grow by expanding profitable segments
Equity
Go forward: grow by expanding profitable segments
3
Sources: BCG value management.
"Euro-curve“ principle
The third step is to expand profitable businesses without allowing profitability to fall below the cost of equity. The equity allocated to the expanded businesses determines the organic growth rate. U.S. and Australian banks managed this step very effectively over the last five years.
• Understand your position in the “Euro-curve” path. • Grow, but only when and where the business is profitable. • Increasing profitability is the only path for businesses with returns below the cost of equity.
Selected Success Stories Four companies that lead our ranking enjoy exceptional business performance for very different rea-sons: ANZ Banking Group for increasing profitability, Barclays for sustained profitable growth, Sallie Mae for exceptional profitability and growth figures in a niche segment, and HSBC for suc-cessful external growth. ANZ Banking Group developed a distinct cost advantage. Between 1999 and 2003, ANZ Banking Group doubled its profits and became one of the world’s most efficient banks, with a cost-to-income ratio in the mid-40s. The bank’s performance-improvement program has relied on three elements:
BCG Page 19
WINNERS IN THE AGE OF THE TITANS
1. The bank introduced a simplified, disaggregated structure that provided strong, clear lines of accountability and autonomy for its 16 major businesses, each of which provided internal and external reports.
2. The CEO and centrally driven governance pushed this performance improvement by focusing
on efficiency and accountability. This approach has involved strict, top-down target setting; allocation of all central costs to business units, with tight service-level agreements; a compensation system that motivates performance with a steep variable-reward curve; tough quarterly reviews of each business unit, led by the CEO and CFO; and individual performance contracts.
3. To direct efficiency programs, management has invested in developing a detailed
understanding of the cost structure of the bank, based on very simple goals for both revenue growth and cost reduction.
The outcome of this program has been that even though the bank is smaller than its national competi-tors, it now has a distinct cost advantage, which it has used to become more competitive on price and to return greater profits to shareholders. As a result, ANZ has achieved a 45 percent cost-to-income ratio and has delivered ROEs of more than 20 percent, making it the most profitable of Australia’s major banks.
• Develop a clear vision for improving your cost-to-income ratio. • Require senior management to make uncompromising commitments to meeting targets. • Adopt a “never spend an additional dollar” philosophy. • Ensure clear accountability, substantial rewards for performance, and strong sanctions for miss-
ing targets. • Maintain a strong belief that there is always more to do.
Barclays delivered sustainable growth. Barclays highlights the opportunities for growth. It now ranks third among the dominant British banking institutions and twelfth internationally by market capitalization. Having a highly diversified business model (the group's main activities concentrate on personal financial services, credit cards, private clients, business banking, and investment banking), Barclays’ management understood how to generate double-digit growth in almost every field. A closer look at the credit card business helps explain Barclay’s success. In 2003, Barclays recruited a record 1.5 million new customers to reach 10.6 million Barclaycard holders in the United Kingdom. Aggressive marketing strategies such as “matching rivals’ cheapest interest rates” and cobranding contributed to this increase. Additionally, strong consumer spending, combined with risk-pricing ex-pertise, led to annual profits of £68 per cardholder (versus £63 in 2002). Barclays is now trying to duplicate this achievement in its international credit-card franchise: Barclaycard International just turned profitable for the first time. Several factors have contributed to Barclays' success: its credit-card business, its business-banking franchise, and effective cost-reduction efforts. In addition, its investment-banking business, Barclays Capital, which specializes in fixed-income business, has done especially well during years of declin-ing interest rates. On the retail side, Barclays is now working to integrate its retail product lines (cur-rent accounts, investments, loans, credit cards, mortgages, insurance, pensions, and student and travel
BCG Page 20
WINNERS IN THE AGE OF THE TITANS
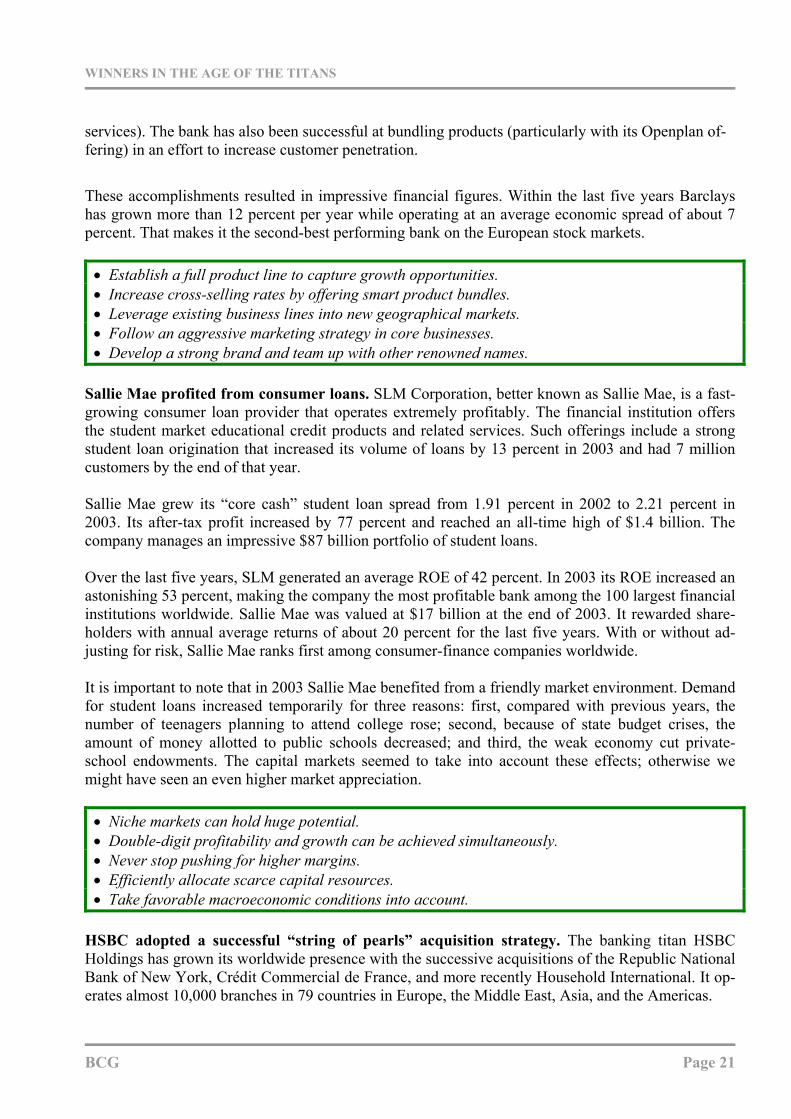
services). The bank has also been successful at bundling products (particularly with its Openplan of-fering) in an effort to increase customer penetration. These accomplishments resulted in impressive financial figures. Within the last five years Barclays has grown more than 12 percent per year while operating at an average economic spread of about 7 percent. That makes it the second-best performing bank on the European stock markets.
• Establish a full product line to capture growth opportunities. • Increase cross-selling rates by offering smart product bundles. • Leverage existing business lines into new geographical markets. • Follow an aggressive marketing strategy in core businesses. • Develop a strong brand and team up with other renowned names.
Sallie Mae profited from consumer loans. SLM Corporation, better known as Sallie Mae, is a fast-growing consumer loan provider that operates extremely profitably. The financial institution offers the student market educational credit products and related services. Such offerings include a strong student loan origination that increased its volume of loans by 13 percent in 2003 and had 7 million customers by the end of that year. Sallie Mae grew its “core cash” student loan spread from 1.91 percent in 2002 to 2.21 percent in 2003. Its after-tax profit increased by 77 percent and reached an all-time high of $1.4 billion. The company manages an impressive $87 billion portfolio of student loans. Over the last five years, SLM generated an average ROE of 42 percent. In 2003 its ROE increased an astonishing 53 percent, making the company the most profitable bank among the 100 largest financial institutions worldwide. Sallie Mae was valued at $17 billion at the end of 2003. It rewarded share-holders with annual average returns of about 20 percent for the last five years. With or without ad-justing for risk, Sallie Mae ranks first among consumer-finance companies worldwide. It is important to note that in 2003 Sallie Mae benefited from a friendly market environment. Demand for student loans increased temporarily for three reasons: first, compared with previous years, the number of teenagers planning to attend college rose; second, because of state budget crises, the amount of money allotted to public schools decreased; and third, the weak economy cut private-school endowments. The capital markets seemed to take into account these effects; otherwise we might have seen an even higher market appreciation.
• Niche markets can hold huge potential. • Double-digit profitability and growth can be achieved simultaneously. • Never stop pushing for higher margins. • Efficiently allocate scarce capital resources. • Take favorable macroeconomic conditions into account.
HSBC adopted a successful “string of pearls” acquisition strategy. The banking titan HSBC Holdings has grown its worldwide presence with the successive acquisitions of the Republic National Bank of New York, Crédit Commercial de France, and more recently Household International. It op-erates almost 10,000 branches in 79 countries in Europe, the Middle East, Asia, and the Americas.
BCG Page 21
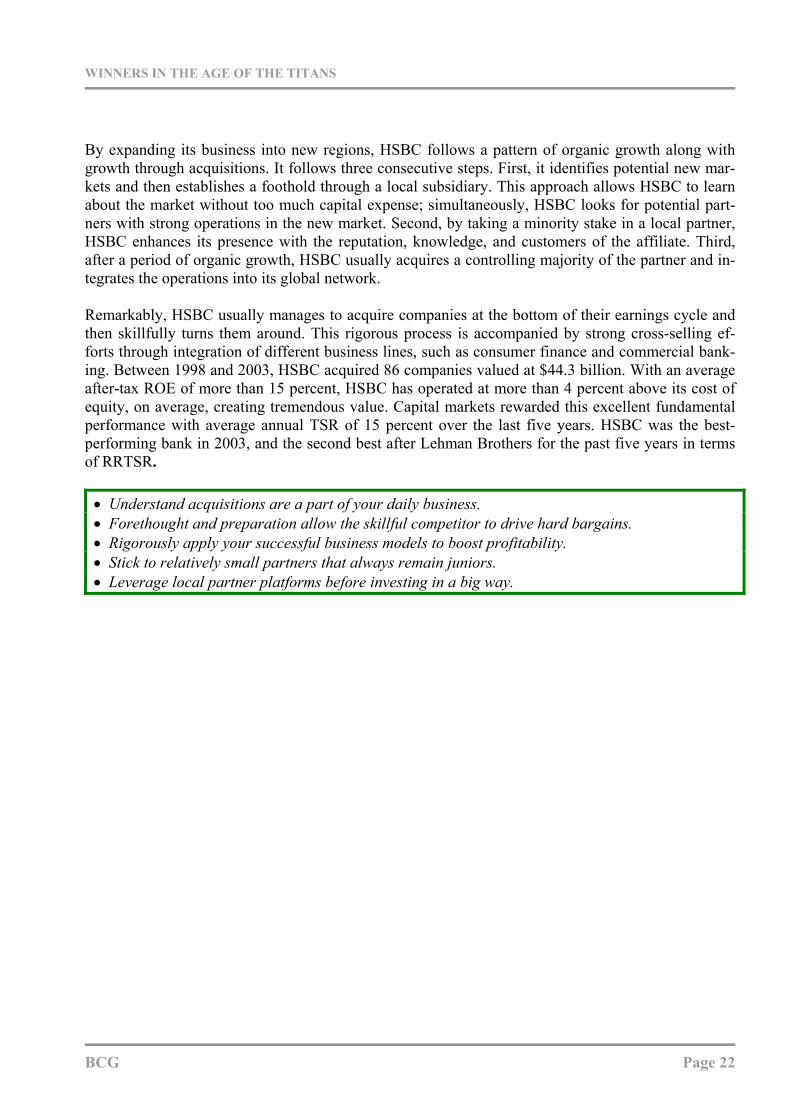
WINNERS IN THE AGE OF THE TITANS
By expanding its business into new regions, HSBC follows a pattern of organic growth along with growth through acquisitions. It follows three consecutive steps. First, it identifies potential new mar-kets and then establishes a foothold through a local subsidiary. This approach allows HSBC to learn about the market without too much capital expense; simultaneously, HSBC looks for potential part-ners with strong operations in the new market. Second, by taking a minority stake in a local partner, HSBC enhances its presence with the reputation, knowledge, and customers of the affiliate. Third, after a period of organic growth, HSBC usually acquires a controlling majority of the partner and in-tegrates the operations into its global network. Remarkably, HSBC usually manages to acquire companies at the bottom of their earnings cycle and then skillfully turns them around. This rigorous process is accompanied by strong cross-selling ef-forts through integration of different business lines, such as consumer finance and commercial bank-ing. Between 1998 and 2003, HSBC acquired 86 companies valued at $44.3 billion. With an average after-tax ROE of more than 15 percent, HSBC has operated at more than 4 percent above its cost of equity, on average, creating tremendous value. Capital markets rewarded this excellent fundamental performance with average annual TSR of 15 percent over the last five years. HSBC was the best-performing bank in 2003, and the second best after Lehman Brothers for the past five years in terms of RRTSR.
• Understand acquisitions are a part of your daily business. • Forethought and preparation allow the skillful competitor to drive hard bargains. • Rigorously apply your successful business models to boost profitability. • Stick to relatively small partners that always remain juniors. • Leverage local partner platforms before investing in a big way.
BCG Page 22

WINNERS IN THE AGE OF THE TITANS
III. RANKINGS OF TOP PERFORMERS Large-Cap Companies
TSR Risk Market Rank
1 12 Lehman Brothers USA IB 21.0 11.7% ++++ + -- 29.3% 12 1 HSBC Holdings GBR UB 172.7 10.1% +++ ++ -- 15.0% 83 14 Citigroup USA UB 250.4 10.1% ++++ ++ -- 17.8% 34 21 Bank of Nova Scotia CAN UB 25.8 8.6% ++++ +++ ++ 17.5% 45 28 Barclays GBR UB 58.3 8.5% +++ ++ -- 13.2% 136 4 Bank of Montreal CAN UB 20.7 8.5% ++++ +++ + 15.3% 77 40 The Royal Bank of Scotland GBR UB 87.0 8.3% ++++ ++ - 15.9% 68 35 Société Générale FRA UB 38.6 7.8% ++++ ++ - 20.3% 29 22 ANZ Banking Group AUS UB 24.0 7.4% ++++ +++ ++ 16.7% 510 20 Merrill Lynch USA IB 55.3 7.3% +++ + -- 13.4% 1111 43 Royal Bank of Canada CAN UB 31.4 6.9% +++ +++ ++ 13.3% 1212 30 Morgan Stanley USA IB 62.7 6.8% +++ + --- 12.0% 1713 27 UBS CHE UB 81.0 6.0% ++ ++ -- 6.3% 2614 11 ABN AMRO NLD UB 38.9 5.3% ++ + --- 5.1% 2815 39 Deutsche Bank DEU UB 48.4 5.2% ++ + -- 8.1% 2416 37 MBNA USA CF 31.8 5.2% ++ ++ -- 9.9% 2217 26 American Express USA CF 62.0 5.1% ++ ++ -- 8.0% 2518 31 Nomura Holdings JPN IB 33.5 5.1% +++ -- - 14.1% 1019 3 Hang Seng HKG UB 25.1 4.9% +++ +++ + 14.7% 920 19 Bank of America USA UB 119.5 4.8% +++ ++ -- 10.0% 2121 5 Westpac AUS UB 21.7 4.7% +++ +++ ++ 12.7% 1622 23 BNP Paribas FRA UB 56.9 4.5% +++ ++ - 10.8% 1823 29 Dexia BEL UB 20.1 4.4% + + --- 1.5% 3624 6 Wells Fargo USA UB 99.6 4.2% +++ ++ - 10.6% 1925 32 Washington Mutual USA MF 36.1 4.0% +++ ++ - 12.8% 1526 33 Commonwealth Bank of Australia AUS UB 28.0 3.6% +++ +++ ++ 10.2% 2027 45 Santander Central Hispano ESP UB 56.5 3.1% + ++ -- 4.5% 3028 25 Credit Suisse CHE UB 43.6 2.5% - + -- -0.3% 4029 2 FleetBoston USA UB 46.0 2.3% + + -- 3.4% 3130 41 Toronto-Dominion Bank CAN UB 21.9 2.3% +++ ++ ++ 13.1% 1431 49 Fifth Third Bancorp USA UB 33.6 1.9% ++ ++ - 6.1% 2732 44 National Australia Bank AUS UB 33.9 1.5% ++ ++ ++ 8.7% 2333 17 Nordea SWE UB 21.9 1.4% + ++ - 4.6% 2934 13 JPMorgan Chase USA UB 74.8 1.0% - + -- -1.6% 4435 38 HBOS GBR UB 49.9 0.5% + ++ - 1.2% 3836 8 Bank One USA UB 51.0 0.1% + ++ - 0.7% 3937 7 U.S. Bancorp USA UB 57.4 0.1% + ++ - 2.3% 3338 50 BBVA ESP UB 44.1 0.1% - ++ -- -1.7% 4539 15 National City USA UB 20.6 -0.1% + ++ - 2.9% 3240 18 UniCredito Italiano ITA UB 34.0 -0.1% - ++ -- -0.7% 4241 24 The Bank of New York USA TB 24.1 -0.2% - + -- -2.0% 4642 10 SunTrust USA UB 20.1 -0.9% + ++ - 1.3% 3743 47 BB&T USA UB 21.1 -1.0% + ++ - 2.1% 3544 34 Fannie Mae USA MF 72.9 -1.2% + ++ - 2.1% 3445 16 Wachovia USA UB 61.9 -1.5% - ++ - -1.4% 4346 48 Fortis BEL UB 26.0 -2.1% --- ++ --- -11.9% 4947 9 Banca Intesa ITA UB 25.8 -2.3% -- + -- -8.0% 4848 42 Lloyds TSB GBR UB 44.8 -3.0% -- ++ -- -6.9% 4749 46 Freddie Mac USA MF 40.5 -3.2% - ++ - -0.6% 4150 36 Sumitomo Mitsui Financial Group JPN UB 30.9 -4.1% --- -- - -12.6% 50
2003
Company Performance 1999–2003RRTSR rank
1999-2003
RRTSR p.a.Name Coun-
trySeg-ment
M' cap '03 ($b)
TSR p.a.
From('98-'02)
To('99-'03) Delta Company From
('98-'02)To
('99-'03) Delta Company
34 15 19 Deutsche Bank 26 49 -23 Freddie Mac45 29 16 FleetBoston 9 31 -22 Fifth Third Bancorp25 10 15 Merrill Lynch 24 40 -16 UniCredito Italiano19 5 14 Barclays 17 32 -15 National Australia Bank36 23 13 Dexia 11 26 -15 Commonwealth Bank of Australia
Biggest jump downBiggest jump up
RRTSR: Risk-adjusted relative total shareholder return TSR: Total shareholder return ---- (++++) strongly negative (positive)Risk: Volatility of returns ---- (++++) very high (low) Market: Stock specific impact by overall market ---- (++++) strongly negative (positive)
AM Asset manager MF Mortgage finance CF Consumer finance TB Transaction bank IB Investment bank UB Universal bank
BCG Page 23
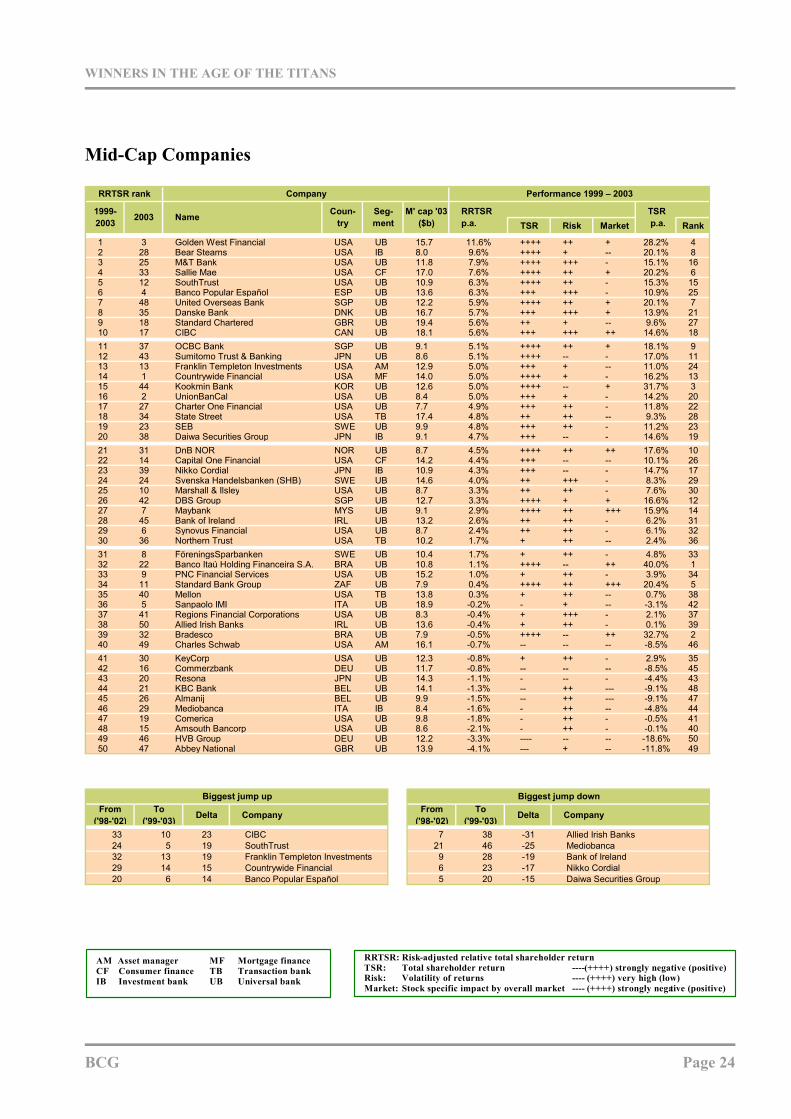
WINNERS IN THE AGE OF THE TITANS
Mid-Cap Companies
TSR Risk Market Rank
1 3 Golden West Financial USA UB 15.7 11.6% ++++ ++ + 28.2% 42 28 Bear Stearns USA IB 8.0 9.6% ++++ + -- 20.1% 83 25 M&T Bank USA UB 11.8 7.9% ++++ +++ - 15.1% 164 33 Sallie Mae USA CF 17.0 7.6% ++++ ++ + 20.2% 65 12 SouthTrust USA UB 10.9 6.3% ++++ ++ - 15.3% 156 4 Banco Popular Español ESP UB 13.6 6.3% +++ +++ - 10.9% 257 48 United Overseas Bank SGP UB 12.2 5.9% ++++ ++ + 20.1% 78 35 Danske Bank DNK UB 16.7 5.7% +++ +++ + 13.9% 219 18 Standard Chartered GBR UB 19.4 5.6% ++ + -- 9.6% 2710 17 CIBC CAN UB 18.1 5.6% +++ +++ ++ 14.6% 1811 37 OCBC Bank SGP UB 9.1 5.1% ++++ ++ + 18.1% 912 43 Sumitomo Trust & Banking JPN UB 8.6 5.1% ++++ -- - 17.0% 1113 13 Franklin Templeton Investments USA AM 12.9 5.0% +++ + -- 11.0% 2414 1 Countrywide Financial USA MF 14.0 5.0% ++++ + - 16.2% 1315 44 Kookmin Bank KOR UB 12.6 5.0% ++++ -- + 31.7% 316 2 UnionBanCal USA UB 8.4 5.0% +++ + - 14.2% 2017 27 Charter One Financial USA UB 7.7 4.9% +++ ++ - 11.8% 2218 34 State Street USA TB 17.4 4.8% ++ ++ -- 9.3% 2819 23 SEB SWE UB 9.9 4.8% +++ ++ - 11.2% 2320 38 Daiwa Securities Group JPN IB 9.1 4.7% +++ -- - 14.6% 1921 31 DnB NOR NOR UB 8.7 4.5% ++++ ++ ++ 17.6% 1022 14 Capital One Financial USA CF 14.2 4.4% +++ -- -- 10.1% 2623 39 Nikko Cordial JPN IB 10.9 4.3% +++ -- - 14.7% 1724 24 Svenska Handelsbanken (SHB) SWE UB 14.6 4.0% ++ +++ - 8.3% 2925 10 Marshall & Ilsley USA UB 8.7 3.3% ++ ++ - 7.6% 3026 42 DBS Group SGP UB 12.7 3.3% ++++ + + 16.6% 1227 7 Maybank MYS UB 9.1 2.9% ++++ ++ +++ 15.9% 1428 45 Bank of Ireland IRL UB 13.2 2.6% ++ ++ - 6.2% 3129 6 Synovus Financial USA UB 8.7 2.4% ++ ++ - 6.1% 3230 36 Northern Trust USA TB 10.2 1.7% + ++ -- 2.4% 3631 8 FöreningsSparbanken SWE UB 10.4 1.7% + ++ - 4.8% 3332 22 Banco Itaú Holding Financeira S.A. BRA UB 10.8 1.1% ++++ -- ++ 40.0% 133 9 PNC Financial Services USA UB 15.2 1.0% + ++ - 3.9% 3434 11 Standard Bank Group ZAF UB 7.9 0.4% ++++ ++ +++ 20.4% 535 40 Mellon USA TB 13.8 0.3% + ++ -- 0.7% 3836 5 Sanpaolo IMI ITA UB 18.9 -0.2% - + -- -3.1% 4237 41 Regions Financial Corporations USA UB 8.3 -0.4% + +++ - 2.1% 3738 50 Allied Irish Banks IRL UB 13.6 -0.4% + ++ - 0.1% 3939 32 Bradesco BRA UB 7.9 -0.5% ++++ -- ++ 32.7% 240 49 Charles Schwab USA AM 16.1 -0.7% -- -- -- -8.5% 4641 30 KeyCorp USA UB 12.3 -0.8% + ++ - 2.9% 3542 16 Commerzbank DEU UB 11.7 -0.8% -- -- -- -8.5% 4543 20 Resona JPN UB 14.3 -1.1% - -- - -4.4% 4344 21 KBC Bank BEL UB 14.1 -1.3% -- ++ --- -9.1% 4845 26 Almanij BEL UB 9.9 -1.5% -- ++ --- -9.1% 4746 29 Mediobanca ITA IB 8.4 -1.6% - ++ -- -4.8% 4447 19 Comerica USA UB 9.8 -1.8% - ++ - -0.5% 4148 15 Amsouth Bancorp USA UB 8.6 -2.1% - ++ - -0.1% 4049 46 HVB Group DEU UB 12.2 -3.3% ---- -- -- -18.6% 5050 47 Abbey National GBR UB 13.9 -4.1% --- + -- -11.8% 49
2003
Company Performance 1999 – 2003RRTSR rank
1999-2003
M' cap '03 ($b)
RRTSR p.a.Name Coun-
trySeg-ment
TSR p.a.
From('98-'02)
To('99-'03) Delta Company From
('98-'02)To
('99-'03) Delta Company
33 10 23 CIBC 7 38 -31 Allied Irish Banks24 5 19 SouthTrust 21 46 -25 Mediobanca32 13 19 Franklin Templeton Investments 9 28 -19 Bank of Ireland29 14 15 Countrywide Financial 6 23 -17 Nikko Cordial20 6 14 Banco Popular Español 5 20 -15 Daiwa Securities Group
Biggest jump up Biggest jump down
RRTSR: Risk-adjusted relative total shareholder return TSR: Total shareholder return ---- (++++) strongly negative (positive)Risk: Volatility of returns ---- (++++) very high (low) Market: Stock specific impact by overall market ---- (++++) strongly negative (positive)
AM Asset manager MF Mortgage finance CF Consumer finance TB Transaction bank IB Investment bank UB Universal bank
BCG Page 24

WINNERS IN THE AGE OF THE TITANS
Segment Ranking
Company
2 5.0% T. Rowe Price USA 5.9 23 1.0% Banca Fideuram ITA 5.8 44 0.9% Investors Group CAN 6.3 35 -0.7% Charles Schwab USA 16.1 5
1 7.6% Sallie Mae USA 17.0 12 5.2% MBNA USA 31.8 43 5.1% American Express USA 62.0 54 4.9% AIFUL JPN 6.9 25 4.4% Capital One Financial USA 14.2 3
1 11.7% Lehman Brothers USA 21.0 12 7.3% Merrill Lynch USA 55.3 43 6.8% Morgan Stanley USA 62.7 54 5.1% Nomura Holdings JPN 33.5 35 4.3% Nikko Cordial JPN 10.9 2
1 13.6% Housing Development Finance Corporation IND 3.5 12 5.0% Countrywide Financial USA 14.0 23 4.0% Washington Mutual USA 36.1 34 -1.2% Fannie Mae USA 72.9 45 -3.2% Freddie Mac USA 40.5 5
1 11.4% Investors Financial Services USA 2.5 12 4.8% State Street USA 17.4 23 1.7% Northern Trust USA 10.2 34 0.3% Mellon USA 13.8 45 -0.2% The Bank of New York USA 24.1 5
1 10.1% HSBC Holdings GBR 172.7 42 10.1% Citigroup USA 250.4 23 8.5% Barclays GBR 58.3 64 8.3% The Royal Bank of Scotland GBR 87.0 35 7.8% Société Générale FRA 38.6 16 6.9% Royal Bank of Canada CAN 31.4 57 6.0% UBS CHE 81.0 128 5.3% ABN AMRO NLD 38.9 149 5.2% Deutsche Bank DEU 48.4 1110 4.8% Bank of America USA 119.5 911 4.5% BNP Paribas FRA 56.9 712 4.2% Wells Fargo USA 99.6 813 3.1% Santander Central Hispano ESP 56.5 1514 2.5% Credit Suisse CHE 43.6 2015 2.3% FleetBoston USA 46.0 1616 1.9% Fifth Third Bancorp USA 33.6 1317 1.5% National Australia Bank AUS 33.9 1018 1.0% JPMorgan Chase USA 74.8 2319 0.5% HBOS GBR 49.9 1820 0.1% Bank One USA 51.0 1921 0.1% U.S. Bancorp USA 57.4 1722 0.1% BBVA ESP 44.1 2423 -0.1% UniCredito Italiano ITA 34.0 2124 -1.5% Wachovia USA 61.9 2225 -3.0% Lloyds TSB GBR 44.8 25
Universal banks
Consumer finance
companies
Mortgage finance
companies
Transaction banks
Investment banks
Performance '99-'03
Asset managers
RRTSR rank RRTSR Name Country M' cap '03 ($b)
1 5.0% Franklin Templeton Investments USA 12.9 1
Segment TSR rank 99-03
We have listed the five biggest banks by market capi-talization for each segment. Although for the universalbanks we have listed the 25 biggest institutions.
RRTSR: Risk-adjusted relative total shareholder return TSR: Total shareholder return
BCG Page 25
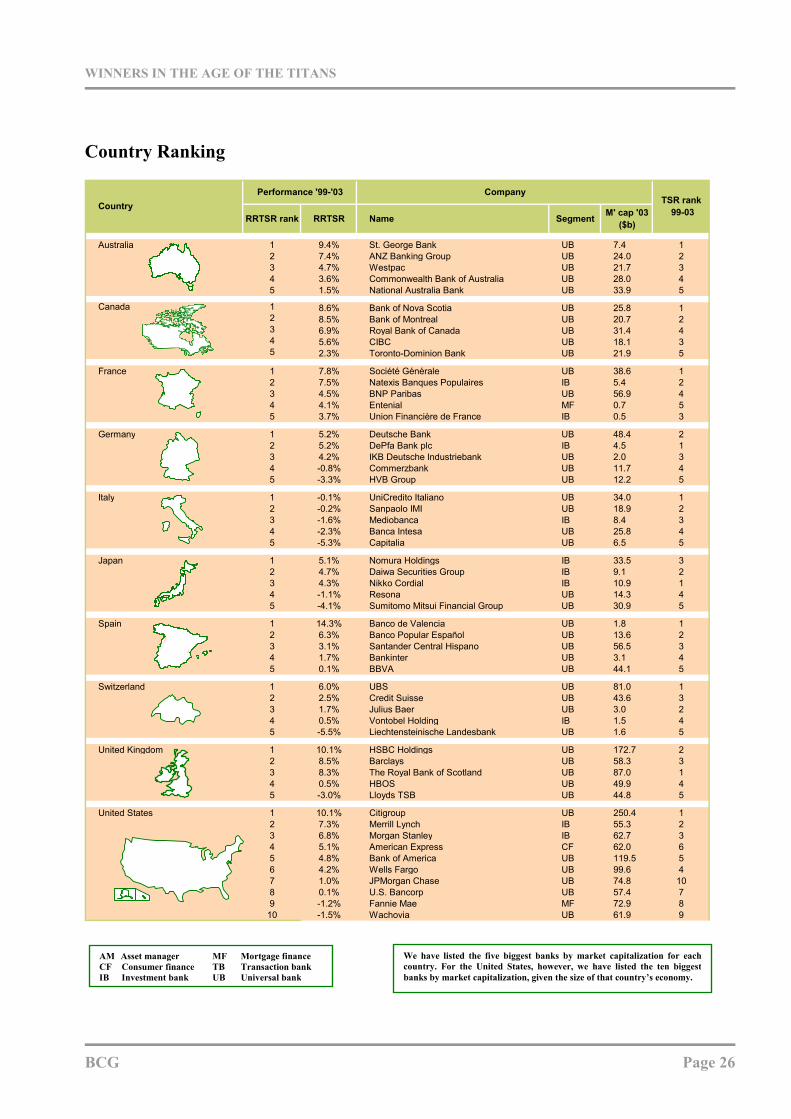
WINNERS IN THE AGE OF THE TITANS
Country Ranking
RRTSR rank RRTSR Name Segment M' cap '03 ($b)
Australia 1 9.4% St. George Bank UB 7.4 12 7.4% ANZ Banking Group UB 24.0 23 4.7% Westpac UB 21.7 34 3.6% Commonwealth Bank of Australia UB 28.0 45 1.5% National Australia Bank UB 33.9 5
Canada 1 8.6% Bank of Nova Scotia UB 25.8 12 8.5% Bank of Montreal UB 20.7 23 6.9% Royal Bank of Canada UB 31.4 44 5.6% CIBC UB 18.1 35 2.3% Toronto-Dominion Bank UB 21.9 5
France 1 7.8% Société Générale UB 38.6 12 7.5% Natexis Banques Populaires IB 5.4 23 4.5% BNP Paribas UB 56.9 44 4.1% Entenial MF 0.7 55 3.7% Union Financière de France IB 0.5 3
Germany 1 5.2% Deutsche Bank UB 48.4 22 5.2% DePfa Bank plc IB 4.5 13 4.2% IKB Deutsche Industriebank UB 2.0 34 -0.8% Commerzbank UB 11.7 45 -3.3% HVB Group UB 12.2 5
Italy 1 -0.1% UniCredito Italiano UB 34.0 12 -0.2% Sanpaolo IMI UB 18.9 23 -1.6% Mediobanca IB 8.4 34 -2.3% Banca Intesa UB 25.8 45 -5.3% Capitalia UB 6.5 5
Japan 1 5.1% Nomura Holdings IB 33.5 32 4.7% Daiwa Securities Group IB 9.1 23 4.3% Nikko Cordial IB 10.9 14 -1.1% Resona UB 14.3 45 -4.1% Sumitomo Mitsui Financial Group UB 30.9 5
Spain 1 14.3% Banco de Valencia UB 1.8 12 6.3% Banco Popular Español UB 13.6 23 3.1% Santander Central Hispano UB 56.5 34 1.7% Bankinter UB 3.1 45 0.1% BBVA UB 44.1 5
Switzerland 1 6.0% UBS UB 81.0 12 2.5% Credit Suisse UB 43.6 33 1.7% Julius Baer UB 3.0 24 0.5% Vontobel Holding IB 1.5 45 -5.5% Liechtensteinische Landesbank UB 1.6 5
United Kingdom 1 10.1% HSBC Holdings UB 172.7 22 8.5% Barclays UB 58.3 33 8.3% The Royal Bank of Scotland UB 87.0 14 0.5% HBOS UB 49.9 45 -3.0% Lloyds TSB UB 44.8 5
United States 1 10.1% Citigroup UB 250.4 12 7.3% Merrill Lynch IB 55.3 23 6.8% Morgan Stanley IB 62.7 34 5.1% American Express CF 62.0 65 4.8% Bank of America UB 119.5 56 4.2% Wells Fargo UB 99.6 47 1.0% JPMorgan Chase UB 74.8 108 0.1% U.S. Bancorp UB 57.4 79 -1.2% Fannie Mae MF 72.9 8
10 -1.5% Wachovia UB 61.9 9
CountryPerformance '99-'03
TSR rank 99-03
Company
We have listed the five biggest banks by market capitalization for eachcountry. For the United States, however, we have listed the ten biggestbanks by market capitalization, given the size of that country’s economy.
B
AM Asset manager MF Mortgage finance CF Consumer finance TB Transaction bank IB Investment bank UB Universal bank
CG Page 26
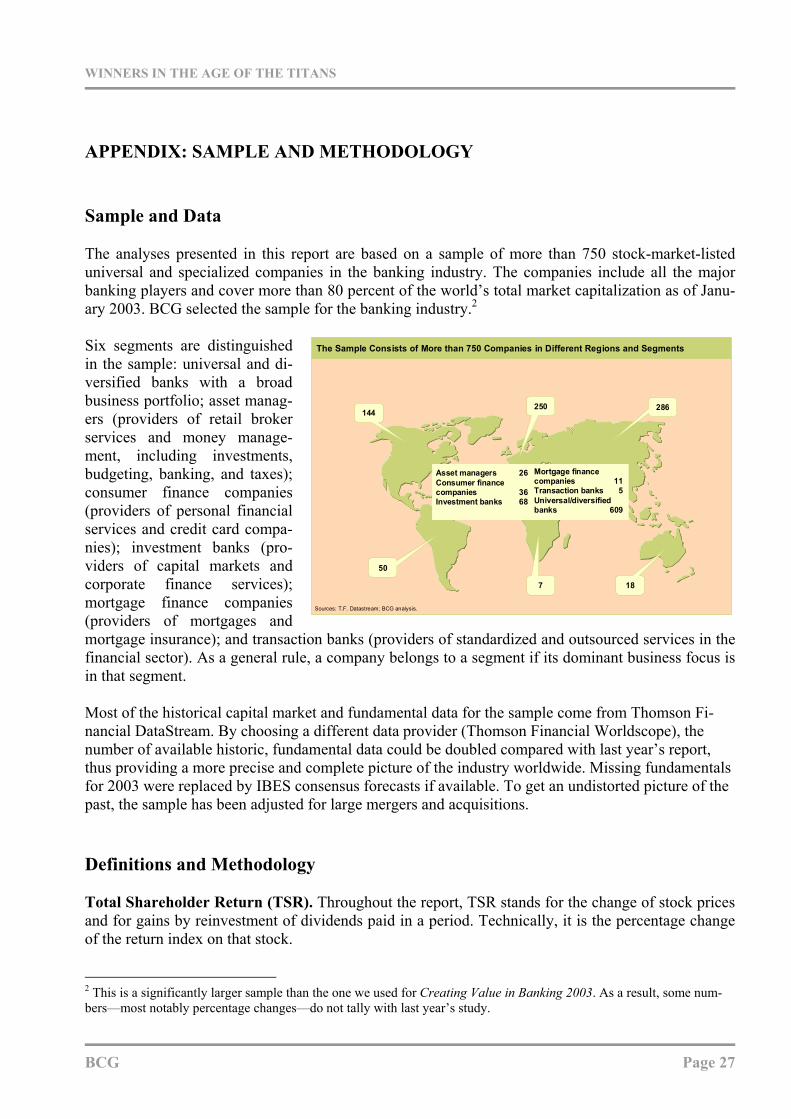
WINNERS IN THE AGE OF THE TITANS
APPENDIX: SAMPLE AND METHODOLOGY Sample and Data The analyses presented in this report are based on a sample of more than 750 stock-market-listed universal and specialized companies in the banking industry. The companies include all the major banking players and cover more than 80 percent of the world’s total market capitalization as of Janu-ary 2003. BCG selected the sample for the banking industry.2 Six segments are distinguished in the sample: universal and di-versified banks with a broad business portfolio; asset manag-ers (providers of retail broker services and money manage-ment, including investments, budgeting, banking, and taxes); consumer finance companies (providers of personal financial services and credit card compa-nies); investment banks (pro-viders of capital markets and corporate finance services); mortgage finance companies (providers of mortgages and mortgage insurance); and transaction banks (providers of standardized and outsourced services in the financial sector). As a general rule, a company belongs to a segment if its dominant business focus is in that segment.
The Sample Consists of More than 750 Companies in Different Regions and Segments
144
Asset managers 26Consumer finance companies 36Investment banks 68
286250
187
50
Mortgage finance companies 11 Transaction banks 5Universal/diversified banks 609
Sources: T.F. Datastream; BCG analysis.
The Sample Consists of More than 750 Companies in Different Regions and Segments
144
Asset managers 26Consumer finance companies 36Investment banks 68
286250
187
50
Mortgage finance companies 11 Transaction banks 5Universal/diversified banks 609
Sources: T.F. Datastream; BCG analysis.
Most of the historical capital market and fundamental data for the sample come from Thomson Fi-nancial DataStream. By choosing a different data provider (Thomson Financial Worldscope), the number of available historic, fundamental data could be doubled compared with last year’s report, thus providing a more precise and complete picture of the industry worldwide. Missing fundamentals for 2003 were replaced by IBES consensus forecasts if available. To get an undistorted picture of the past, the sample has been adjusted for large mergers and acquisitions.
Definitions and Methodology Total Shareholder Return (TSR). Throughout the report, TSR stands for the change of stock prices and for gains by reinvestment of dividends paid in a period. Technically, it is the percentage change of the return index on that stock.
BCG Page 27
2 This is a significantly larger sample than the one we used for Creating Value in Banking 2003. As a result, some num-bers—most notably percentage changes—do not tally with last year’s study.
WINNERS IN THE AGE OF THE TITANS
Risk-Adjusted Relative Total Shareholder Return (RRTSR). RRTSR is a performance metric de-veloped by BCG for measuring the true capital-market performance of a company. Just like TSR, RRTSR measures shareholder returns as capital gains and dividends, but it adds two additional ele-ments to TSR. First, RRTSR adjusts for the impact of the overall national stock market on the specific stock of the company. This feature is especially important in international performance evaluation. It allows, for example, comparing stocks in a bull market with stocks in a bear market. Therefore, RRTSR will be higher the smaller the impact of a positive overall market development is—either because the overall market performance is small or because the correlation of the stock with the market is small. Second, it is worth recalling that in several BCG studies, the performance measure relative total shareholder return (RTSR) has been successfully used to take the impact of different national markets into account. The new measure RRTSR takes the concept of RTSR one step further by additionally adjusting for risk. To be more precise, RRTSR calibrates for different stock-price volatilities to ac-count for higher expected stock returns from stocks with greater risks; this allows, for example, com-paring the returns of a company focusing on mortgage finance (with on average lower risk) with the returns of an investment bank (with typically higher average risk). Therefore, for any TSR of a spe-cific stock, the RRTSR of the stock will be higher the lower the risk of the stock is. The formal definition of RRTSR for a stock in a local market M at risk level σ is as follows: A N
)N;M(ERAP)N;A(ERAP)N;M,A(RRTSR σ⋅ρ−σ=σ with
)A(SRNfr)N;A(RAP)N;A(ERAP ⋅σ=−σ=σ
where is the excess of the risk-adjusted performance ( ) of the Modigliani–Modigliani model over the risk-free rate is the correlation between the returns of stock A and its ambient
domestic market M, and SR is the Sharpe Ratio of the stock or the market. The concept calibrates different risk levels at the uniform risk level
ERAP RAP
fr , ρ
Nσ . Although this allows us to express RRTSR in
meaningful units of returns, the ranking itself does not depend on the absolute level set for Nσ .
Fundamental Value and Expectation Premium. In some analyses, the total market capitalization of a stock is divided into two parts: fundamental value and expectation premium. To compute fun-damental values, standard cash-flow projections based on companies’ current profitability and his-torical growth rates are used. The profitability is assumed to “fade” to COE over time because of competitive pressures and other factors. In addition, it is assumed that growth also fades to the long-term economic growth rate. These industry forces push profitability and equity growth to long-term levels irrespective of the starting levels being above the long-term levels (indicating fading of a supe-rior performance) or below (indicating a recovery). The fade rates are held constant over time and are empirically derived from an optimization procedure fitting the values from the valuation model to the empirically observed market capitalization. The absolute expectation premium is defined as the dif-ference between market capitalization and the fundamental value, whereas expectation premium is simply the share of the absolute expectation premium on the total market capitalization. Thus, expec-tation premiums might very well be negative.
BCG Page 28

WINNERS IN THE AGE OF THE TITANS
BCG Page 29
Total Business Return (TBR). TBR is calculated as change in fundamental value over two years plus free cash flow to shareholders. It therefore measures on a percentage basis value creation by a company using fundamental data only. Added Value on Equity (AVE) and Delta Added Value on Equity (DAVE). AVE measures the economic income of a bank. AVE is calculated by multiply-ing the spread of ROE over COE with the amount of equity capital of the bank. AVE there-fore measures (in absolute units) what has been earned in excess of the opportunity cost of equity capital. The difference between the AVEs of two suc-cessive years is DAVE. Since a change in profitability and a change in the amount of equity capital have an impact on DAVE, this performance metric integrates profitability and growth simultaneously.
SS
DAVE Integrates Profitability and Growth
+Increase in profitability Profitable growth
Return2Return1
Cost ofcapital
Equity1,2
Return1,2
Cost ofcapital
Equity1
Return2Return1
Cost ofcapital
Equity1Equity2 Equity2
1 2 1 2
ource: BCG value management.
Added Value on Equity1 (AVE1)
DAVE = AVE2 – AVE1
DAVE Integrates Profitability and Growth
+Increase in profitability Profitable growth
Return2Return1
Cost ofcapital
Equity1,2
Return1,2
Cost ofcapital
Equity1
Return2Return1
Cost ofcapital
Equity1Equity2 Equity2
1 2 1 2
ource: BCG value management.
Added Value on Equity1 (AVE1)
DAVE = AVE2 – AVE1
Added Value on Equity1 (AVE1)
DAVE = AVE2 – AVE1
Return on Equity (ROE). ROE is defined as after-tax profits divided by end-of-year equity capital. Cost of Equity (COE). Company-specific COE is computed for every year based on the capital asset pricing model (CAPM), with ambient total national markets as reference markets. Betas are calcu-lated over two years, on a weekly basis.