Embed Size (px)
Citation preview
Copyright© 2015 by NCS Pearson, Inc. Adapted by permission. European adaptation copyright © 2016 Pearson Education Ltd. or its affiliate(s). All rights reserved. Pearson, the PSI logo, PsychCorp, Wechsler, Wechsler Intelligence Scale for Children, and WISC are trademarks in the U.S. and/or other countries of Pearson Education, Inc., or its affiliate(s). [ 1.3 / RE1 / QG1 ]
WISC-V UK Interpretive Considerations for Sarah Sample (03/11/2016) Interpretive considerations provide additional information to assist you, the examiner, in interpreting Sarah's performance. This section should not be provided to the parent or recipient of the report. Please review these interpretive considerations before reading the report, as they may suggest that you make changes to the report settings in Q-global. If you make changes to the report settings, you can re-run the report without being charged. This file contains two full reports: first, the interpretive report, and second, the parent report. Be sure to separate these reports before providing them to the appropriate recipients. Recommendation Considerations Items listed in the 'Recommendations' section at the end of the report are meant to be an aid to you as a clinician, not a substitute for individualised recommendations that should be provided by a professional who is familiar with the examinee. Please read through the automatically generated recommendations carefully and edit them according to the examinee's individual strengths and needs. The recommendation section entitled 'Recommendations for Verbal Comprehension Skills' was included in the report because the examinee's verbal skills were an area of strength relative to her overall ability level. The recommendation section entitled 'Recommendations for Visual Spatial Skills' was included in the report because the examinee's visual spatial skills were an area of strength relative to other areas of cognitive functioning. The recommendation section entitled 'Recommendations for Fluid Reasoning Skills' was included in the report because fluid reasoning skills were an area of weakness relative to other areas of cognitive ability. The recommendation section entitled 'Recommendations for Working Memory Skills' was included in the report because the examinee's WMI fell below a standard score of 90. The recommendation section entitled 'Recommendations for Processing Speed' was included in the report because the examinee's PSI fell below a standard score of 90. End of Interpretive Considerations
SAMPLE R
EPORT

Copyright© 2015 by NCS Pearson, Inc. Adapted by permission. European adaptation copyright © 2016 Pearson Education Ltd. or its affiliate(s). All rights reserved. Pearson, the PSI logo, PsychCorp, Wechsler, Wechsler Intelligence Scale for Children, and WISC are trademarks in the U.S. and/or other countries of Pearson Education, Inc., or its affiliate(s). This report contains copyrighted material and trade secrets. The qualified licensee may excerpt portions of this output report, limited to the minimum text necessary to accurately describe their significant core conclusions, for incorporation into a written evaluation of the examinee, in accordance with their profession's citation standards, if any. No adaptations, translations, modifications, or special versions may be made of this report without prior written permission from Pearson. [ 1.3 / RE1 / QG1 ]
WISC®-VUK
Wechsler Intelligence Scale for Children®-Fifth Edition: United Kingdom
Interpretive Report Examinee Name Sarah Sample Date of Report 06/12/2016
Examinee ID 54321 School Year Year 4
Date of Birth 24/11/2008 Primary Language English
Gender Female Handedness Right
Race/Ethnicity White Examiner Name Sample Examiner
Date of Testing 03/11/2016 Age at Testing 7 years 11 months Retest? No
Comments:
SAMPLE R
EPORT
WISC®-VUK Interpretive Report ID: 54321 03/11/2016, Page 2 Sarah Sample
ABOUT WISC-V UK SCORES
Sarah was administered 16 subtests from the Wechsler Intelligence Scale for Children - Fifth UK Edition (WISC-VUK). The WISC-V is an individually administered, comprehensive clinical instrument for assessing the intelligence of children aged 6:0-16:11. The primary and secondary subtests are on a scaled score metric with a mean of 10 and a standard deviation (SD) of 3. These subtest scores range from 1 to 19, with scores between 8 and 12 typically considered average. The primary subtest scores contribute to the primary index scores, which represent intellectual functioning in five cognitive areas: Verbal Comprehension Index (VCI), Visual Spatial Index (VSI), Fluid Reasoning Index (FRI), Working Memory Index (WMI), and the Processing Speed Index (PSI). This assessment also produces a Full Scale IQ (FSIQ) composite score that represents general intellectual ability. The primary index scores and the FSIQ are on a standard score metric with a mean of 100 and an SD of 15. The primary index scores range from 45 to 155; the FSIQ ranges from 40 to 160. For both the primary index scores and the FSIQ, scores ranging from 90 to 109 are typically considered average. Ancillary index scores are also provided. The ancillary index scores represent cognitive abilities using different primary and secondary subtest groupings than do the primary index scores. The ancillary index scores are also on a standard score metric with a mean of 100 and an SD of 15. The Quantitative Reasoning Index (QRI) and Auditory Working Memory Index (AWMI) scores have a range of 45-155. The remaining three ancillary index scores have a range of 40-160: Nonverbal Index (NVI), General Ability Index (GAI), and the Cognitive Proficiency Index (CPI). Scores ranging from 90 to 109 are typically considered average. A percentile rank (PR) is provided for each reported composite and subtest score to show Sarah's standing relative to other same-age children in the WISC-V normative sample. If the percentile rank for her Verbal Comprehension Index score is 77, for example, it means that she performed as well as or better than approximately 77% of children her age. This appears in the report as PR = 77. The scores obtained on the WISC-V reflect Sarah's true abilities combined with some degree of measurement error. Her true score is more accurately represented by a confidence interval (CI), which is a range of scores within which her true score is likely to fall. Composite scores are reported with 95% confidence intervals to ensure greater accuracy when interpreting test scores. For each composite score reported for Sarah, there is a 95% certainty that her true score falls within the listed range. It is common for children to exhibit score differences across areas of performance. Comparing the score differences in relation to three separate benchmarks may yield a richer portrait of a child's strengths and weaknesses. The three types of score difference comparisons presented in this report use interpretive statements that describe what can be generically understood as strengths or weaknesses. Because many score comparisons are possible within the WISC-V, attention to exactly what the scores are compared to is necessary to understand Sarah's performance. The first type of comparison may be used to detect a normative strength or weakness, which occurs if a composite or subtest score differs from what is typical in the normative sample. For the purposes of this report, scores that fall above or below the Average qualitative descriptor range suggest either a normative strength or a normative weakness. The report will include phrases such as 'very high for her age' or 'lower than most children her age' when this occurs. The second type of comparison may be used to examine score differences from an intrapersonal
SAMPLE R
EPORT
WISC®-VUK Interpretive Report ID: 54321 03/11/2016, Page 3 Sarah Sample
perspective. For this comparison, a score is described as a strength or weakness if a primary index or subtest score differs from an indicator of overall performance (i.e., the mean of the primary index scores, the mean of the FSIQ subtest scores, the mean of the primary subtest scores, or the mean of the FSIQ subtest scores). Statistically significant differences are described with phrases such as 'personal strength' or 'personal weakness' or as one of the child's 'strongest or weakest areas of performance'. The third type of comparison may be used to examine scores for a relative strength or weakness, which occurs if a composite or subtest score differs in relation to another score of the same type (e.g., scaled, standard). When a scaled or standard score is compared with another scaled or standard score, the phrases 'relative strength' and 'relative weakness' are used to describe statistically significant differences when comparing performance on one score in relation to another. If the difference between two scores is statistically significant, it is listed in the report with a base rate to aid in interpretation. The statistical significance and base rate results provide different information. A statistically significant difference suggests that the result is reliable and would likely be observed again if the assessment were repeated (i.e., the difference is not due to measurement error). The base rate (BR) provides a basis for estimating how common or rare a particular score difference was among other children of similar ability in the WISC-V normative sample. For example, a base rate of <=15% is reported if the score for the the Verbal Comprehension Index is 11.80 points higher than the mean primary index score (MIS). This appears on the report as VCI > MIS, BR = <=15%. This means that <=15% of children of similar ability level in the WISC-V normative sample obtained a difference of this magnitude or greater between those two scores. In many cases, a statistically significant difference may be accompanied by a base rate of greater than 15%, which indicates that the difference, while reliable and not due to measurement error, is relatively common among children. This result does not necessarily reduce the importance of the difference, but does indicate a difference that large or larger is relatively common. It is possible for intellectual abilities to change over the course of childhood. Additionally, a child's scores on the WISC-V can be influenced by motivation, attention, interests, and opportunities for learning. All scores may be slightly higher or lower if Sarah were tested again on a different day. It is therefore important to view these test scores as a snapshot of Sarah's current level of intellectual functioning. When these scores are used as part of a comprehensive evaluation, they contribute to an understanding of her current strengths and any needs that can be addressed. INTERPRETATION OF WISC-V UK RESULTS FSIQ
The FSIQ is derived from seven subtests and summarises ability across a diverse set of cognitive functions. This score is typically considered the most representative indicator of general intellectual functioning. Subtests are drawn from five areas of cognitive ability: verbal comprehension, visual spatial, fluid reasoning, working memory, and processing speed. Sarah's FSIQ score is in the Average range when compared to other children her age (FSIQ = 100, PR = 50, CI = 94-106). Although the WISC-V measures various aspects of ability, a child's scores on this test can also be influenced by many factors that are not captured in this report. When interpreting this report, consider additional sources of information that may not be reflected in the scores on this assessment. While the FSIQ provides a broad
SAMPLE R
EPORT
WISC®-VUK Interpretive Report ID: 54321 03/11/2016, Page 4 Sarah Sample
representation of cognitive ability, describing Sarah's domain-specific performance allows for a more thorough understanding of her functioning in distinct areas. Some children perform at approximately the same level in all of these areas, but many others display areas of cognitive strengths and weaknesses. Verbal Comprehension
The Verbal Comprehension Index (VCI) measured Sarah's ability to access and apply acquired word knowledge. Specifically, this score reflects her ability to verbalise meaningful concepts, think about verbal information, and express herself using words. Overall, Sarah's performance on the VCI was above average for her age and emerged as a relative strength for Sarah (VCI = 111, PR = 77, High Average range, CI = 102-118; VCI > MIS, BR = <=15%). High scores in this area indicate a well-developed verbal reasoning system with strong word knowledge acquisition, effective information retrieval, good ability to reason and solve verbal problems, and effective communication of knowledge. Additionally, her performance on verbal comprehension tasks was particularly strong when compared to her performance on tasks that involved using logic to solve problems (VCI > FRI, BR = 16.6%). Her pattern of performance implies a strength in crystallised abilities relative to fluid reasoning abilities. Moreover, her performance on verbal comprehension tasks was stronger than her performance on tasks requiring her to mentally manipulate information and work quickly and efficiently (VCI > WMI, BR = 6.5%; VCI > PSI, BR = 5.5%). Although her working memory capacity is a personal weakness, it does not appear to be interfering with her verbal comprehension. Sarah's processing speed was a relative weakness when compared to verbal comprehension, but does not appear to be interfering with her capacity to perform complex verbal tasks. With regard to individual subtests within the VCI, Similarities (SI) required Sarah to describe a similarity between two words that represent a common object or concept and Vocabulary (VC) required her to name depicted objects and/or define words that were read aloud. She performed comparably across both subtests, suggesting that her abstract reasoning skills and word knowledge are similarly developed at this time (SI = 13; VC = 11). Her performance on Similarities was somewhat advanced for her age and was one of her highest scores (SI = 13; SI > MSS-P, BR = <=10%). This suggests that her verbal concept formation and abstract reasoning skills are areas of strength when compared to her overall level of ability. This represents a strength that can be built upon in her future development. In addition to the two subtests that contribute to the VCI, two other verbal comprehension subtests were administered to gain a more detailed understanding of Sarah's verbal comprehension abilities. For Information (IN), she answered questions about a broad range of general-knowledge topics. Her performance was average for her age, suggesting age-appropriate ability to acquire, remember, and retrieve knowledge about the world around her (IN = 10). On Comprehension (CO), a subtest requiring her to answer questions based on her understanding of general principles and social situations, Sarah's performance was strong for her age. This suggests advanced understanding of practical knowledge and ability to verbalise meaningful concepts (CO = 14). Visual Spatial
The Visual Spatial Index (VSI) measured Sarah's ability to evaluate visual details and understand visual spatial relationships in order to construct geometric designs from a model. This skill requires visual spatial reasoning, integration and synthesis of part-whole relationships, attentiveness to visual detail, and visual-motor integration. During this evaluation, visual spatial processing was one of Sarah's strengths,
SAMPLE R
EPORT
WISC®-VUK Interpretive Report ID: 54321 03/11/2016, Page 5 Sarah Sample
with performance that was somewhat advanced for her age (VSI = 117, PR = 87, High Average range, CI = 107-124; VSI > MIS, BR = <=5%). High scores in this area indicate a well-developed capacity to apply spatial reasoning and analyse visual details. Sarah quickly and accurately put together geometric designs using a model. This reflects her ability to understand and apply visual-perceptual and visual spatial information. Her performance in this area was particularly strong in relation to her performance on fluid reasoning tasks (VSI > FRI, BR = 7.9%). Because her visual spatial skills currently appear stronger than her fluid reasoning skills, she may work easily with purely visual information, but have greater difficulty applying complex reasoning to visual stimuli. Her visual spatial performance was also particularly strong when compared to her performance on working memory tasks and tests of processing speed (VSI > WMI, BR = 2.7%; VSI > PSI, BR = 2.1%). It appears that she can solve complex visual spatial problems, despite relative working memory and processing speed weaknesses. Her relative visual spatial strength, as compared to working memory, indicate that although she shows skill when processing visual information, she may experience difficulty making distinctions between the visual information that she previously viewed and the visual information that she is currently viewing. The VSI is derived from two subtests. During Block Design (BD), Sarah viewed a model and/or picture and used two-coloured blocks to re-create the design. Visual Puzzles (VP) required her to view a completed puzzle and select three response options that together would reconstruct the puzzle. She performed comparably across both subtests, suggesting that her visual-spatial reasoning ability is equally well developed, whether solving problems that involve a motor response and reuse the same stimulus repeatedly while receiving concrete visual feedback about accuracy, or solving problems with unique stimuli that must be solved mentally and do not involve feedback about accuracy (BD = 13; VP = 13). In addition to the BD score, the Block Design No Time Bonus score (BDn) was calculated. BDn is based on the child's performance on Block Design (BD) without including bonus points for rapid completion of items. The score's reduced emphasis on speed may be useful when a child's limitations, problem-solving strategies, or personality characteristics are believed to affect performance on timed tasks, as this score does not award extra points for working quickly. Sarah's BD score is significantly higher than her BDn score (BDn = 1), suggesting that speed did not attenuate Block Design performance (BR = 0.0%). The Block Design Partial score (BDp) was also calculated, which awards points for the number of blocks correctly placed when the time runs out, even if the child has not finished the entire design. This score reduces the emphasis on speed and attention to detail, providing an estimate of performance in children who are impulsive or who misperceive the design. Sarah's BD score is significantly higher than her BDp score (BDp = 1), indicating that response speed and attention to detail did not disrupt her performance on Block Design. Fluid Reasoning
The Fluid Reasoning Index (FRI) measured Sarah's ability to detect the underlying conceptual relationship among visual objects and use reasoning to identify and apply rules. Identification and application of conceptual relationships in the FRI requires inductive and quantitative reasoning, broad visual intelligence, simultaneous processing, and abstract thinking. Overall, Sarah's performance on the FRI was typical for her age (FRI = 97, PR = 42, Average range, CI = 90-104). Sarah's overall performance on the FRI was stronger than performance on tasks that measured processing speed (FRI > PSI, BR = 21.5%). It appears that she is well able to solve complex problems despite having difficulty on other tasks. While Sarah's fluid reasoning performance during this assessment appeared stronger than some cognitive abilities, it was also weaker than others. Her current performance evidenced difficulty
SAMPLE R
EPORT
WISC®-VUK Interpretive Report ID: 54321 03/11/2016, Page 6 Sarah Sample
with fluid reasoning tasks in relation to her performance on language-based and visual spatial tasks (FRI < VCI, BR = 16.6%; FRI < VSI, BR = 7.9%). This pattern of strengths and weaknesses suggests that she may currently experience relative difficulty applying logical reasoning skills to visual information, but she may have relatively strong ability to verbalise meaningful concepts. Her crystallised abilities are a strength compared to her fluid reasoning abilities. The FRI is derived from two subtests: Matrix Reasoning (MR) and Figure Weights (FW). Matrix Reasoning required Sarah to view an incomplete matrix or series and select the response option that completed the matrix or series. On Figure Weights, she viewed a scale with a missing weight(s) and identified the response option that would keep the scale balanced. She performed comparably across both subtests, suggesting that her perceptual organisation and quantitative reasoning skills are similarly developed at this time (MR = 9; FW = 10). In addition to the two subtests that contribute to the FRI, two additional fluid reasoning subtests were administered to gain a more detailed understanding of Sarah's fluid reasoning skills. For Picture Concepts (PC), she was asked to view two or three rows of pictures and select one picture from each row to form a group with a common characteristic. Her performance was high average for her age, suggesting above average categorical reasoning skills (PC = 12). On Arithmetic (AR), a timed subtest requiring her to mentally solve maths problems, Sarah's performance was similar to other children her age. This suggests age-appropriate numerical reasoning and applied computational ability (AR = 9). Working Memory
The Working Memory Index (WMI) measured Sarah's ability to register, maintain, and manipulate visual and auditory information in conscious awareness, which requires attention and concentration, as well as visual and auditory discrimination. Sarah's performance on the WMI was slightly below other children her age (WMI = 88, PR = 21, Low Average range, CI = 81-98). Low WMI scores may occur for many reasons including distractibility, visual or auditory discrimination problems, difficulty actively maintaining information in conscious awareness, low storage capacity, difficulty manipulating information in working memory, or generally poor cognitive functioning. Sarah showed some difficulty recalling and sequencing series of pictures and lists of numbers. Her performance on these tasks was a relative weakness when compared to her performance on language-based and visual spatial tasks (WMI < VCI, BR = 6.5%; WMI < VSI, BR = 2.7%). Within the WMI, Picture Span (PS) required Sarah to memorise one or more pictures presented on a stimulus page and then identify the correct pictures (in sequential order, if possible) from options on a response page. On Digit Span (DS), she listened to sequences of numbers read aloud and recalled them in the same order, reverse order, and ascending order. She performed similarly across these two subtests, suggesting that her visual and auditory working memory are similarly developed or that she verbally mediated the visual information on Picture Span (PS = 8; DS = 8). The Digit Span Forward (DSf) scaled process score is derived from the total raw score for the Digit Span Forward task. On this task, Sarah was required to repeat numbers verbatim, with the number of digits in each sequence increasing as the task progressed. This task required working memory when the number of digits exceeded her ability to repeat the digits without the aid of rehearsal. This task represents basic capacity in the phonological loop. Her performance on DSf was above average compared to other children her age (DSf = 12). On the Digit Span Forward task, Sarah's Longest Digit Span Forward score was recorded (LDSf = 2). This raw score reflects the maximum span length recalled on DSf and offers unique information about
SAMPLE R
EPORT
WISC®-VUK Interpretive Report ID: 54321 03/11/2016, Page 7 Sarah Sample
performance on this task. Examine the consistency of recall across trials or items with the same number of digits, to determine if Sarah exhibited variable performance. When performance is variable, this score may provide further insight regarding her performance. The Digit Span Backward (DSb) scaled process score is derived from the total raw score for the Digit Span Backward task. This task invoked working memory because Sarah was required to repeat the digits in a reverse sequence than was originally presented, requiring her to mentally manipulate the information before responding. Her performance on DSb was typical compared to other children her age (DSb = 9). On the Digit Span Backward task, Sarah's Longest Digit Span Backward score was recorded (LDSb = 2). The Digit Span Sequencing (DSs) scaled process score is derived from the total raw score for the Digit Span Sequencing task. This task required Sarah to sequence digits according to value, invoking quantitative knowledge in addition to working memory. The increased demands for mental manipulation of information on the Digit Span Sequencing task places additional demands on working memory, as well as attention. Her performance on DSs was slightly low compared to other children her age (DSs = 6). On the Digit Span Sequencing task, Sarah's Longest Digit Span Sequence score was recorded (LDSs = 3). The Longest Picture Span Stimulus (LPSs) and Longest Picture Span Response (LPSr) raw process scores may help to further evaluate performance on the Picture Span subtest. These scores reflect the number of stimulus and response pictures, respectively, that appear on the last item with a perfect score. Given the variation in the length of response choices across items (i.e., number of responses may decrease when the stimulus span increases), LPSr should be interpreted in relation to LPSs. Sarah's performance pattern on LPSs and LPSr are worth noting. Her Longest Picture Span Stimulus score was (LPSs = 1) and her Longest Picture Span Response score was (LPSr = 2). In addition to the two subtests that contribute to the WMI, Letter-Number Sequencing (LN) was administered to gain a more detailed understanding of Sarah's working memory proficiency. On this subtest, she was read sequences of numbers and letters, and was then asked to recall the numbers in ascending order and then the letters in alphabetical order. Her performance was slightly below other children her age, suggesting somewhat weak sequential processing, mental manipulation, and attention (LN = 7). Sarah's Longest Letter-Number Sequence score was recorded (LLNs = 2). Processing Speed
The Processing Speed Index (PSI) measured Sarah's speed and accuracy of visual identification, decision making, and decision implementation. Performance on the PSI is related to visual scanning, visual discrimination, short-term visual memory, visuomotor coordination, and concentration. The PSI assessed her ability to rapidly identify, register, and implement decisions about visual stimuli. Her overall processing speed performance was slightly low for her age and was an area of relative weakness compared to her overall ability (PSI = 83, PR = 13, Low Average range, CI = 76-94; PSI < MIS, BR = <=10%). Low PSI scores may occur for many reasons including visual discrimination problems, distractibility, slowed decision making, motor difficulties, or generally slow cognitive speed. Her performance on processing speed tasks was weaker than her performance on language-based tasks and visual spatial tasks (PSI < VCI, BR = 5.5%; PSI < VSI, BR = 2.1%). Additionally, her performance on processing speed tasks was a weakness relative to her performance on tasks requiring her to use logic-based reasoning (PSI < FRI, BR = 21.5%). The PSI is derived from two timed subtests.Symbol Search required Sarah to scan a group of symbols and indicate if the target symbol was present. On Coding, she used a key to copy symbols that corresponded with simple geometric shapes. Performance across these tasks was similar, suggesting that
SAMPLE R
EPORT
WISC®-VUK Interpretive Report ID: 54321 03/11/2016, Page 8 Sarah Sample
Sarah's associative memory,graphomotor speed, and visual scanning ability are similarly developed (SS = 8; CD = 6). Her score on Coding was slightly below other children her age and was one of her weakest areas of performance (CD = 6; CD < MSS-P, BR = <=10%). This suggests that her short-term visual memory, psychomotor speed, and attention may currently be areas of weakness when compared to her overall level of ability. This may be an area for further development. Relative to her same-age peers, the number of rotation errors Sarah made on Coding is more than expected. When copying symbols using a key, she rotated some of her drawings at least 90 degrees. Further evaluation may provide more information regarding her mental rotation processes. On Symbol Search, Sarah made more set errors than expected when compared to her same-age peers. Specifically, she marked the incorrect response choice containing characteristics similar to that of the target. An unusual number of set errors may indicate impulsivity, lapses in attention, or visual perception issues. In addition to the subtests that contribute to the PSI, Sarah was administered Cancellation (CA), another processing speed subtest, to gain a more detailed understanding of her processing speed ability. On this timed subtest, she scanned two arrangements of objects (one random, one structured) and marked target objects. Cancellation measures speed, scanning ability, and visual discrimination. Her performance was typical compared to other children her age (CA = 8). ANCILLARY INDEX SCORES In addition to the index scores described above, Sarah was administered subtests contributing to several ancillary index scores. Ancillary index scores do not replace the FSIQ and primary index scores, but are meant to provide additional information about Sarah's cognitive profile. Quantitative Reasoning
Figure Weights and Arithmetic comprise the Quantitative Reasoning Index (QRI), which measures quantitative reasoning skills. Quantitative reasoning is closely related to general intelligence and can indicate a child's capacity to perform mental maths operations and comprehend abstract relationships. Sarah's overall index score was similar to other children her age (QRI = 97, PR = 42, Average range, CI = 90-104). Assessment of Sarah's performance on the QRI may help to predict her reading and maths achievement scores, creative potential, standardised test performance, and future academic success. Auditory Working Memory
The Auditory Working Memory Index (AWMI) is derived from the sum of scaled scores for the Digit Span and Letter-Number Sequencing subtests. These subtests required Sarah to listen to numbers and letters presented verbally, then recall or sequence them aloud. This index score measured her ability to register, maintain, and manipulate verbally presented information. Her overall auditory working memory performance was slightly low for her age (AWMI = 87, PR = 19, Low Average range, CI = 80-97). Low scores in this area may occur for a number of reasons including auditory processing difficulties, inattention, distractibility, low auditory working memory storage or manipulation, or poor working memory ability. Sarah performed similarly across the two subtests that contribute to the AWMI, suggesting that her auditory working memory is similarly developed for tasks having both single- and dual-stimulus demands (DS = 8; LN = 7).
SAMPLE R
EPORT
WISC®-VUK Interpretive Report ID: 54321 03/11/2016, Page 9 Sarah Sample
Nonverbal
The Nonverbal Index (NVI) is derived from six subtests that do not require verbal responses. This index score can provide a measure of general intellectual functioning that minimises expressive language demands for children with special circumstances or clinical needs. Subtests that contribute to the NVI are drawn from four of the five primary cognitive domains (i.e., Visual Spatial, Fluid Reasoning, Working Memory, and Processing Speed). Sarah's performance on the NVI fell in the Average range when compared to other children her age (NVI = 98, PR = 45, CI = 92-104). Assessment of Sarah's performance on the NVI may help to estimate her overall nonverbal cognitive ability. General Ability
Sarah was administered the five subtests comprising the General Ability Index (GAI), an ancillary index score that provides an estimate of general intelligence that is less impacted by working memory and processing speed, relative to the FSIQ. The GAI consists of subtests from the verbal comprehension, visual spatial, and fluid reasoning domains. Overall, this index score was similar to other children her age (GAI = 108, PR = 70, Average range, CI = 101-114). The GAI does not replace the FSIQ as the best estimate of overall ability. It should be interpreted along with the FSIQ and all of the primary index scores. Sarah's GAI score was significantly higher than her FSIQ score (GAI > FSIQ, BR = 3.4%). The significant difference between her GAI and FSIQ scores indicates that the effects of cognitive proficiency, as measured by working memory and processing speed, may have led to a lower overall FSIQ score. This estimate of her overall intellectual ability was lowered by the inclusion of working memory and processing speed subtests. This result supports that her working memory and processing speed skills are areas of specific weakness. Cognitive Proficiency
Sarah was also administered subtests that contribute to the Cognitive Proficiency Index (CPI). These four subtests are drawn from the working memory and processing speed domains. Her index score suggests that she demonstrates somewhat lower than average efficiency when processing cognitive information in the service of learning, problem solving, and higher-order reasoning (CPI = 82, PR = 12, Low Average range, CI = 76-91). Low CPI scores may occur for many reasons, including visual or auditory processing deficits, inattention, distractibility, visuomotor difficulties, limited working memory storage or mental manipulation capacity, or generally low cognitive ability. The CPI is most informative when interpreted as part of a comprehensive evaluation, together with its counterpart, the GAI. The practitioner may consider evaluating the GAI-CPI pairwise comparison, as this may provide additional interpretive information regarding the possible impact of cognitive processing on her ability. Sarah's performance on subtests contributing to the GAI was significantly stronger than her overall level of cognitive proficiency (GAI > CPI, BR = 1.7%). The significant difference between her GAI and CPI scores suggests that higher-order cognitive abilities may be a strength compared to abilities that facilitate cognitive processing efficiency. This result indicates that the effects of cognitive proficiency, as measured by working memory and processing speed, may have led to a higher general ability score. Thus, any cognitive efficiency limitations may not have reduced her general reasoning ability. Relative weaknesses in mental control and speed of visual scanning may sometimes create challenges as Sarah engages in more complex cognitive processes, such as learning new material or applying logical thinking skills.
SAMPLE R
EPORT
WISC®-VUK Interpretive Report ID: 54321 03/11/2016, Page 10 Sarah Sample
SUMMARY Sarah is a 7-year-old girl. The WISC-V was used to assess Sarah's performance across five areas of cognitive ability. When interpreting her scores, it is important to view the results as a snapshot of her current intellectual functioning. As measured by the WISC-V, her overall FSIQ score fell in the Average range when compared to other children her age (FSIQ = 100). The language skills assessed appear to be one of Sarah's strongest areas of functioning. She showed above average performance on the Verbal Comprehension Index (VCI = 111). Performance on verbal comprehension tasks was particularly strong compared to her performance on fluid reasoning (FRI = 97) and working memory (WMI = 88) tasks. She worked easily with primarily visual information and the VSI demonstrates another area of strength relative to her overall ability (VSI = 117). When compared to her fluid reasoning (FRI = 97) and working memory (WMI = 88) performance, visual spatial skills emerged as a particular strength. On the PSI, she worked somewhat slowly on the processing speed tasks, which was one of her weakest performance areas during this assessment (PSI = 83). Processing speed was an area of personal weakness when compared to her logical reasoning (FRI = 97) skills. Ancillary index scores revealed additional information about Sarah's cognitive abilities using unique subtest groupings to better interpret clinical needs. Her capacity to perform mental maths operations and understand quantitative relationships, as measured by the Quantitative Reasoning Index (QRI), fell in the Average range (QRI = 97). The Auditory Working Memory Index (AWMI) measured her ability to register, maintain, and manipulate information that was presented orally. Her index score was Low Average for her age (AWMI = 87). On the Nonverbal Index (NVI), a measure of general intellectual ability that minimises expressive language demands, her performance was Average for her age (NVI = 98). She scored in the Average range on the General Ability Index (GAI), which provides an estimate of general intellectual ability that is less reliant on working memory and processing speed relative to the FSIQ (GAI = 108). Performance on the Cognitive Proficiency Index (CPI), which captures the efficiency with which she processes information, was comparatively low, falling in the Low Average range (CPI = 82). Potential areas for intervention are described in the following section. RECOMMENDATIONS Recommendations for Verbal Comprehension Skills Sarah's overall performance on the VCI fell in the High Average range and was an area of strength when compared to her overall ability level. Verbal skills are an important component of academic success because classroom instruction involves listening comprehension, verbal reasoning, and oral communication. It is therefore important to continue to build Sarah's verbal skills by providing ongoing enrichment opportunities. Strategies to build verbal skills include shared reading activities, such as dialogic reading. This strategy allows adults to ask the child specific questions that encourage interest, comprehension, and critical thinking. Vocabulary can be enriched by exposing Sarah to novel situations and encouraging her to ask the names of unknown objects. Adults can keep a list of words that Sarah learns and periodically review it with her. Researching and exploring new concepts can help her to further expand her vocabulary. Adults may also wish to encourage Sarah to engage in elaborative
SAMPLE R
EPORT
WISC®-VUK Interpretive Report ID: 54321 03/11/2016, Page 11 Sarah Sample
conversation by creating an open, positive environment for communication. Further, adults may wish to give her positive feedback when she participates in conversation. Positive feedback can include reciprocal conversation, asking Sarah to elaborate on her thoughts, and complimenting her contributions to the conversation. Sarah's verbal performance was particularly strong when compared to her fluid reasoning performance. This suggests that she has a relative strength in explaining concepts aloud, but may have more difficulty applying logical thinking to visual information. It may be beneficial for Sarah to talk herself through problems rather than attempting to solve them in her head. For example, when Sarah must choose the missing piece in a visual pattern, it may be helpful if she learns how to solve the problem verbally, by saying aloud, 'Red goes with blue up here, so red goes with blue down here.' Verbal performance was also a relative strength compared to Sarah's performance on working memory tasks. It may be useful for her to leverage her verbal skills when attempting to memorise information. For example, when she is looking at pictures, it may be helpful for her to describe them aloud so that she can better remember them. Recommendations for Visual Spatial Skills Sarah's visual spatial skills fell in the High Average range and were an area of personal strength. Visual spatial ability involves skills such as understanding things by looking at them and picturing how details fit together to create a bigger picture. These skills are important to academic success because they may help the child understand how individual parts are related to complex 'whole'. They may also assist in the acquisition of early reading skills. As such, it is important to support Sarah's visual spatial strengths by providing activities that reinforce these skills. For example, she can be encouraged to engage in visual spatial tasks that she enjoys, such as putting together puzzles, creating maps, drawing, or playing with construction-type toys. Activities that allow her to build creative structures might be especially enjoyable. Many educational digital games are available that may also enrich her visual spatial abilities. When new information is presented in the classroom, Sarah may benefit if visual aids supplement verbally presented content. For example, she will learn best if teachers present lessons using the whiteboard, overhead projector, and/or computer screen. Providing opportunities for visually based learning may help Sarah understand and remember new ideas. As strategies are used to augment Sarah's learning, it is important that they are monitored for effectiveness and are modified according to her needs. Visual spatial performance emerged as a particular strength when compared to fluid reasoning performance. Children with this pattern of functioning may show relatively strong accuracy when identifying important patterns and details in visual information, but they may have relative difficulty understanding how to use that information in complex problem solving. It may be helpful to build on Sarah's visual spatial strengths by teaching her to put visual spatial information into words, so that she can think about it in multiple ways. For example, when putting together pieces of a puzzle, she can be taught to verbalise what she is doing, e.g., 'The top curve goes with the top curve' and 'The yellow line goes with the yellow line.' When identifying the missing pieces of visual patterns, she could be taught to verbalise what she sees, such as 'Big circle, little circle, big circle. The little circle must come next.' These simple strategies may help her utilise her visual spatial skills to complete more complex tasks.
SAMPLE R
EPORT
WISC®-VUK Interpretive Report ID: 54321 03/11/2016, Page 12 Sarah Sample
Recommendations for Fluid Reasoning Skills Sarah exhibited Average performance on the FRI. While fluid reasoning skills were average compared to others her age, they were a relative weakness compared to other areas of cognitive functioning. Children who have relative difficulty with fluid reasoning tasks may have difficulty solving problems, applying logical reasoning, and understanding complicated concepts. Sarah may benefit from structure and practise when approaching tasks that are challenging to her. With regard to specific fluid reasoning interventions, she can be asked to identify patterns or to look at a series and identify what comes next. Encourage her to think of multiple ways to group objects and then explain her rationale to adults. Performing age-appropriate science experiments may also be helpful in building logical thinking skills. For example, adults can help her form a hypothesis and then perform a simple experiment, using measurement techniques to determine whether or not her hypothesis was correct. Asking questions about stories can further build fluid reasoning skills. For example, when reading a book or watching a film, Sarah can be asked to identify the main idea of the story. Further, she could be encouraged to answer open-ended questions such as, 'What do you think would happen if...' and then think logically about her responses. Reinforcing her ideas with positive feedback may encourage her to grow in this area. Recommendations for Working Memory Skills Sarah's working memory scores fell in the Low Average range. With working memory skills lower than many children her age, she may have difficulty concentrating and attending to information that is presented to her. This may impact her school performance. Relatively weak working memory skills can lead to reading comprehension problems as text becomes more complex in future school years. Several recommendations are made based upon her performance pattern. Digital interventions may be helpful in building her capacity to exert mental control, ignore distraction, and manipulate information in her mind. Other strategies that may be useful in increasing working memory include teaching Sarah to chunk information and connect new information to concepts that she already knows. As part of a comprehensive intervention plan, literacy goals such as identifying the main idea of stories can be identified. It is important to reinforce Sarah's progress during these interventions. Goals should be small and measurable, and should steadily increase in complexity as her skills grow stronger. Recommendations for Processing Speed Overall, Sarah's processing speed scores are an area of relative weakness, indicating that this is a potential area for intervention. Children with relatively low processing speed may work more slowly than same-age peers, which can make it difficult for them to keep up with classroom activities. It is important to identify the factors contributing to Sarah's performance in this area; while some children simply work at a slow pace, others are slowed down by perfectionism, problems with visual processing, inattention, or fine-motor coordination difficulties. In addition to interventions aimed at these underlying areas, processing speed skills may be improved through practise. Interventions can focus on building Sarah's speed on simple timed tasks. For example, she can play card-sorting games in which she quickly sorts cards according to increasingly complex rules. Fluency in academic skills can also be increased through similar practise. Speeded flash card drills, such as those that ask the student to quickly solve simple maths problems, may help develop automaticity that can free up cognitive resources in the
SAMPLE R
EPORT
WISC®-VUK Interpretive Report ID: 54321 03/11/2016, Page 13 Sarah Sample
service of more complex academic tasks. Digital interventions may also be helpful in building her speed on simple tasks. During the initial stages of these interventions, Sarah can be rewarded for working quickly rather than accurately, as perfectionism can sometimes interfere with speed. As her performance improves, both accuracy and speed can be rewarded. Thank you for the opportunity to assess Sarah. Please contact me with any questions you have about these results. This report is only valid if signed by a qualified professional:
Sample Examiner Date
SAMPLE R
EPORT
WISC®-VUK Interpretive Report ID: 54321 03/11/2016, Page 14 Sarah Sample
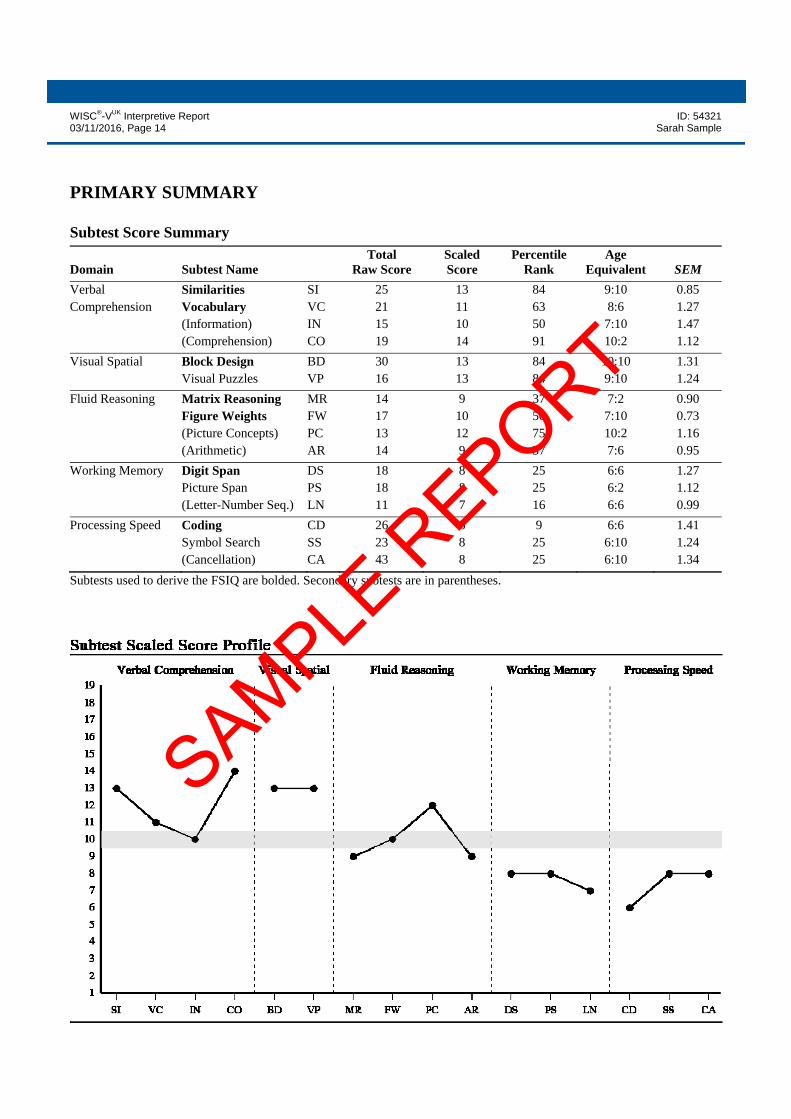
PRIMARY SUMMARY Subtest Score Summary
Domain Subtest Name Total
Raw Score Scaled Score
Percentile Rank
Age Equivalent SEM
Verbal Similarities SI 25 13 84 9:10 0.85 Comprehension Vocabulary VC 21 11 63 8:6 1.27
(Information) IN 15 10 50 7:10 1.47 (Comprehension) CO 19 14 91 10:2 1.12
Visual Spatial Block Design BD 30 13 84 10:10 1.31 Visual Puzzles VP 16 13 84 9:10 1.24
Fluid Reasoning Matrix Reasoning MR 14 9 37 7:2 0.90 Figure Weights FW 17 10 50 7:10 0.73 (Picture Concepts) PC 13 12 75 10:2 1.16 (Arithmetic) AR 14 9 37 7:6 0.95
Working Memory Digit Span DS 18 8 25 6:6 1.27 Picture Span PS 18 8 25 6:2 1.12 (Letter-Number Seq.) LN 11 7 16 6:6 0.99
Processing Speed Coding CD 26 6 9 6:6 1.41 Symbol Search SS 23 8 25 6:10 1.24 (Cancellation) CA 43 8 25 6:10 1.34
Subtests used to derive the FSIQ are bolded. Secondary subtests are in parentheses.
SAMPLE R
EPORT
WISC®-VUK Interpretive Report ID: 54321 03/11/2016, Page 15 Sarah Sample
PRIMARY SUMMARY (CONTINUED)
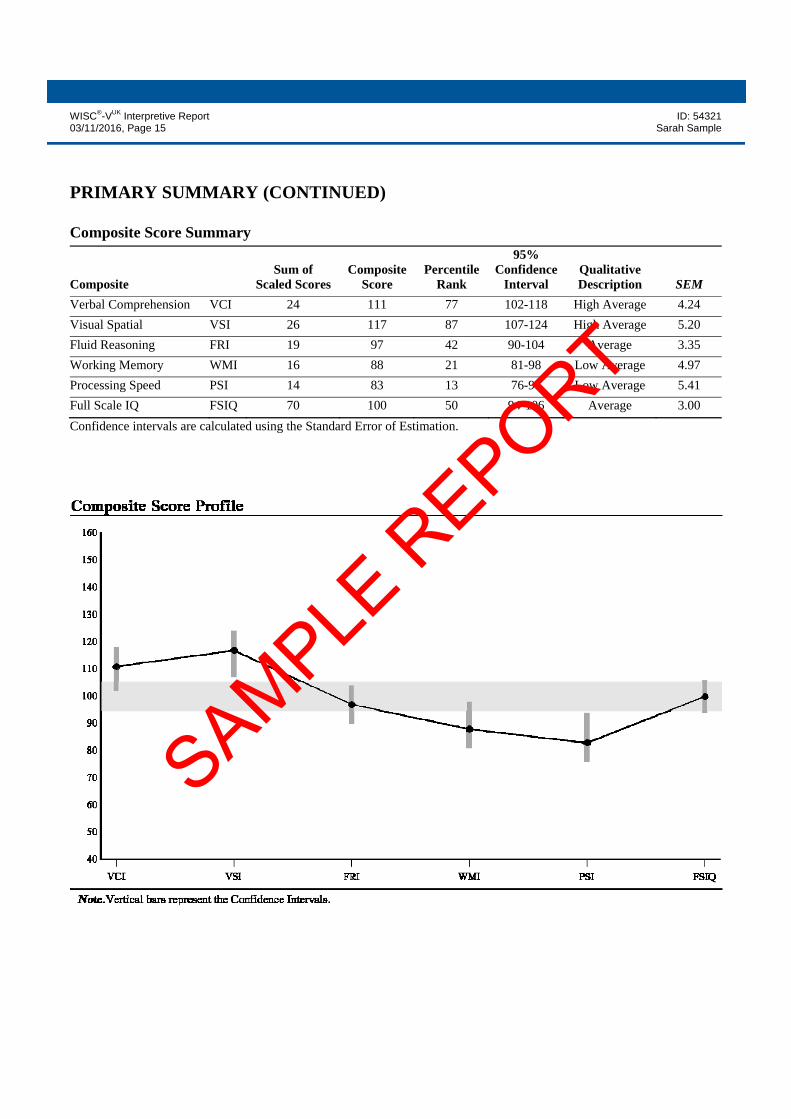
Composite Score Summary
Composite Sum of
Scaled Scores Composite
Score Percentile
Rank
95% Confidence
Interval Qualitative Description SEM
Verbal Comprehension VCI 24 111 77 102-118 High Average 4.24
Visual Spatial VSI 26 117 87 107-124 High Average 5.20
Fluid Reasoning FRI 19 97 42 90-104 Average 3.35
Working Memory WMI 16 88 21 81-98 Low Average 4.97
Processing Speed PSI 14 83 13 76-94 Low Average 5.41
Full Scale IQ FSIQ 70 100 50 94-106 Average 3.00
Confidence intervals are calculated using the Standard Error of Estimation.
SAMPLE R
EPORT
WISC®-VUK Interpretive Report ID: 54321 03/11/2016, Page 16 Sarah Sample
PRIMARY ANALYSIS
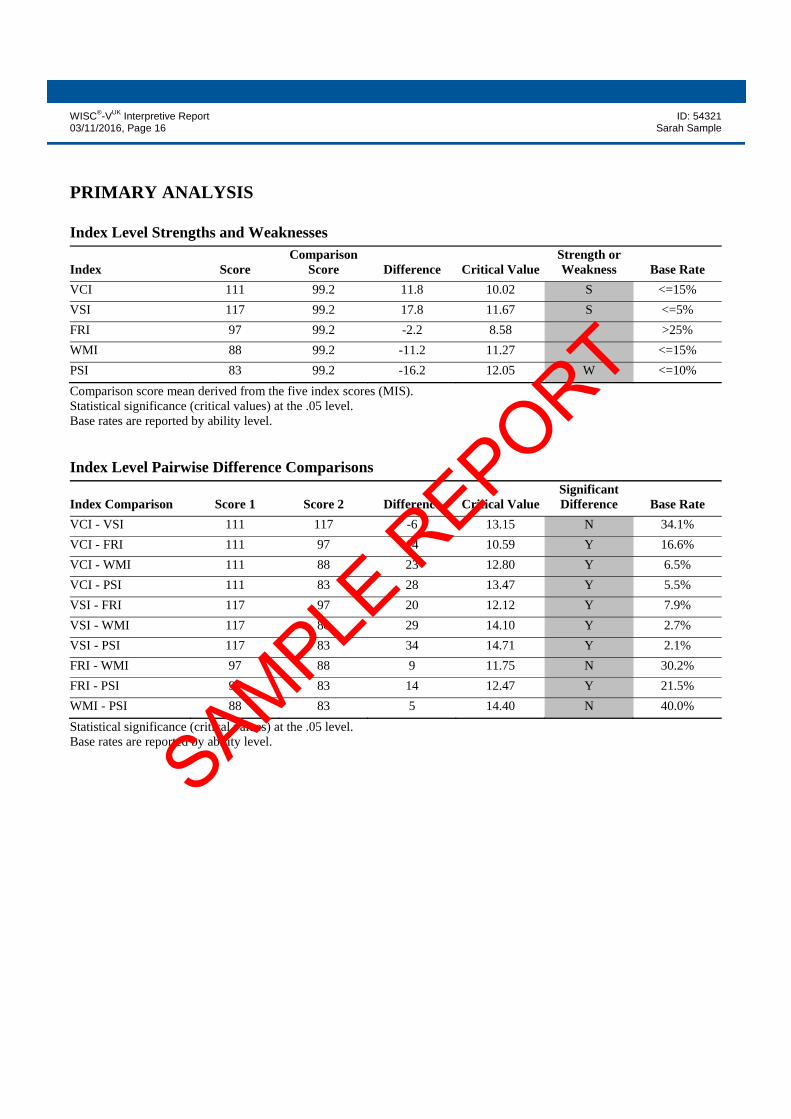
Index Level Strengths and Weaknesses
Index Score Comparison
Score Difference Critical ValueStrength or Weakness Base Rate
VCI 111 99.2 11.8 10.02 S <=15%
VSI 117 99.2 17.8 11.67 S <=5%
FRI 97 99.2 -2.2 8.58 >25%
WMI 88 99.2 -11.2 11.27 <=15%
PSI 83 99.2 -16.2 12.05 W <=10%
Comparison score mean derived from the five index scores (MIS). Statistical significance (critical values) at the .05 level. Base rates are reported by ability level. Index Level Pairwise Difference Comparisons
Index Comparison Score 1 Score 2 Difference Critical ValueSignificant Difference Base Rate
VCI - VSI 111 117 -6 13.15 N 34.1%
VCI - FRI 111 97 14 10.59 Y 16.6%
VCI - WMI 111 88 23 12.80 Y 6.5%
VCI - PSI 111 83 28 13.47 Y 5.5%
VSI - FRI 117 97 20 12.12 Y 7.9%
VSI - WMI 117 88 29 14.10 Y 2.7%
VSI - PSI 117 83 34 14.71 Y 2.1%
FRI - WMI 97 88 9 11.75 N 30.2%
FRI - PSI 97 83 14 12.47 Y 21.5%
WMI - PSI 88 83 5 14.40 N 40.0%
Statistical significance (critical values) at the .05 level. Base rates are reported by ability level.
SAMPLE R
EPORT
WISC®-VUK Interpretive Report ID: 54321 03/11/2016, Page 17 Sarah Sample
PRIMARY ANALYSIS (CONTINUED)
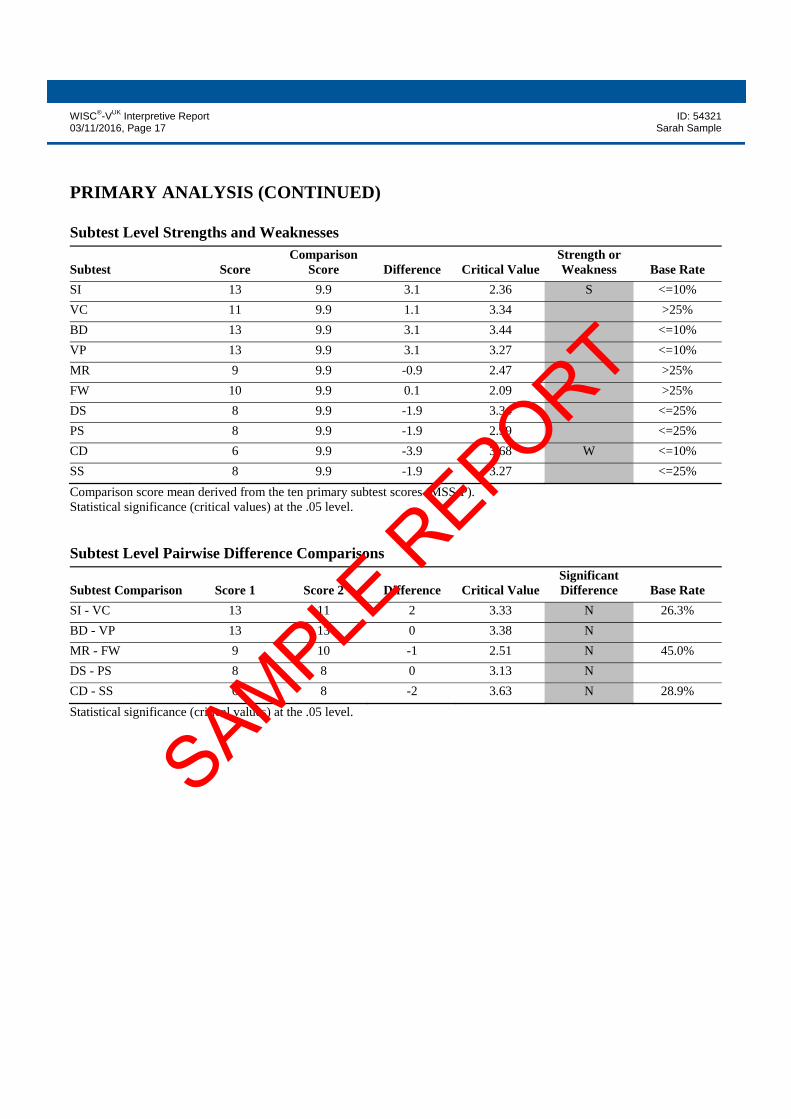
Subtest Level Strengths and Weaknesses
Subtest Score Comparison
Score Difference Critical ValueStrength or Weakness Base Rate
SI 13 9.9 3.1 2.36 S <=10%
VC 11 9.9 1.1 3.34 >25%
BD 13 9.9 3.1 3.44 <=10%
VP 13 9.9 3.1 3.27 <=10%
MR 9 9.9 -0.9 2.47 >25%
FW 10 9.9 0.1 2.09 >25%
DS 8 9.9 -1.9 3.34 <=25%
PS 8 9.9 -1.9 2.99 <=25%
CD 6 9.9 -3.9 3.68 W <=10%
SS 8 9.9 -1.9 3.27 <=25%
Comparison score mean derived from the ten primary subtest scores (MSS-P). Statistical significance (critical values) at the .05 level. Subtest Level Pairwise Difference Comparisons
Subtest Comparison Score 1 Score 2 Difference Critical ValueSignificant Difference Base Rate
SI - VC 13 11 2 3.33 N 26.3%
BD - VP 13 13 0 3.38 N
MR - FW 9 10 -1 2.51 N 45.0%
DS - PS 8 8 0 3.13 N
CD - SS 6 8 -2 3.63 N 28.9%
Statistical significance (critical values) at the .05 level.
SAMPLE R
EPORT
WISC®-VUK Interpretive Report ID: 54321 03/11/2016, Page 18 Sarah Sample
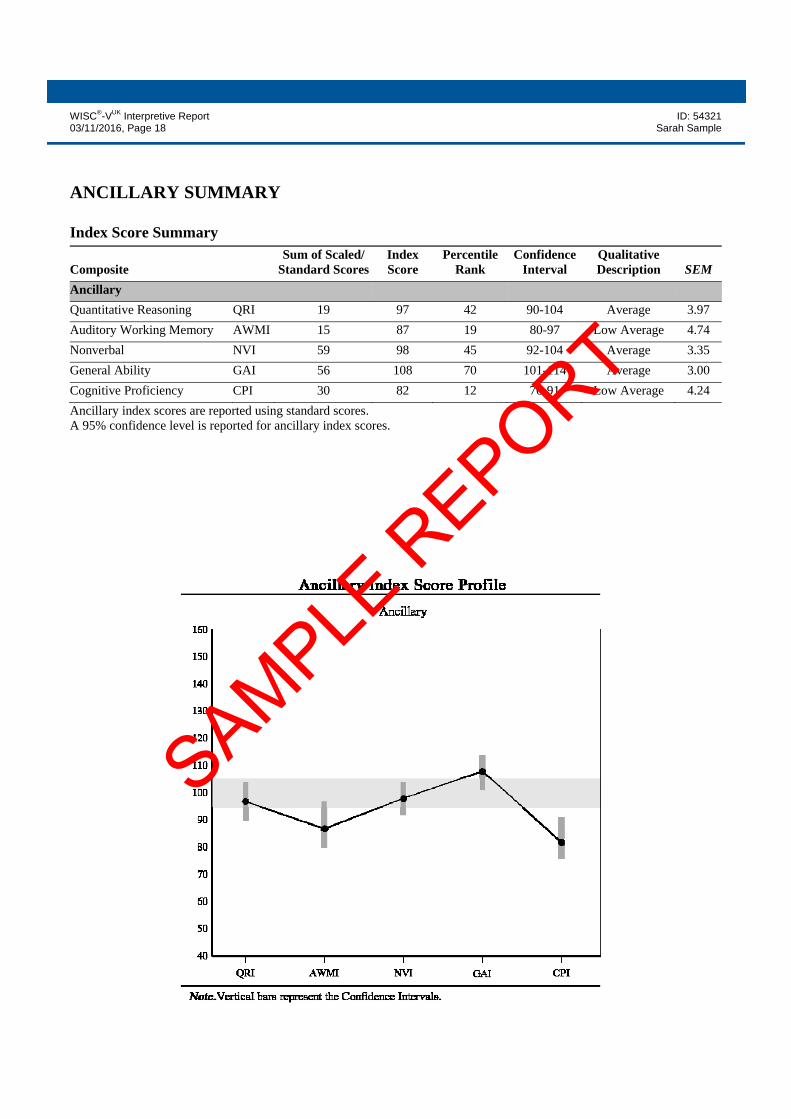
ANCILLARY SUMMARY
Index Score Summary
Composite Sum of Scaled/
Standard ScoresIndex Score
Percentile Rank
Confidence Interval
Qualitative Description SEM
Ancillary
Quantitative Reasoning QRI 19 97 42 90-104 Average 3.97
Auditory Working Memory AWMI 15 87 19 80-97 Low Average 4.74
Nonverbal NVI 59 98 45 92-104 Average 3.35
General Ability GAI 56 108 70 101-114 Average 3.00
Cognitive Proficiency CPI 30 82 12 76-91 Low Average 4.24
Ancillary index scores are reported using standard scores. A 95% confidence level is reported for ancillary index scores.
SAMPLE R
EPORT
WISC®-VUK Interpretive Report ID: 54321 03/11/2016, Page 19 Sarah Sample
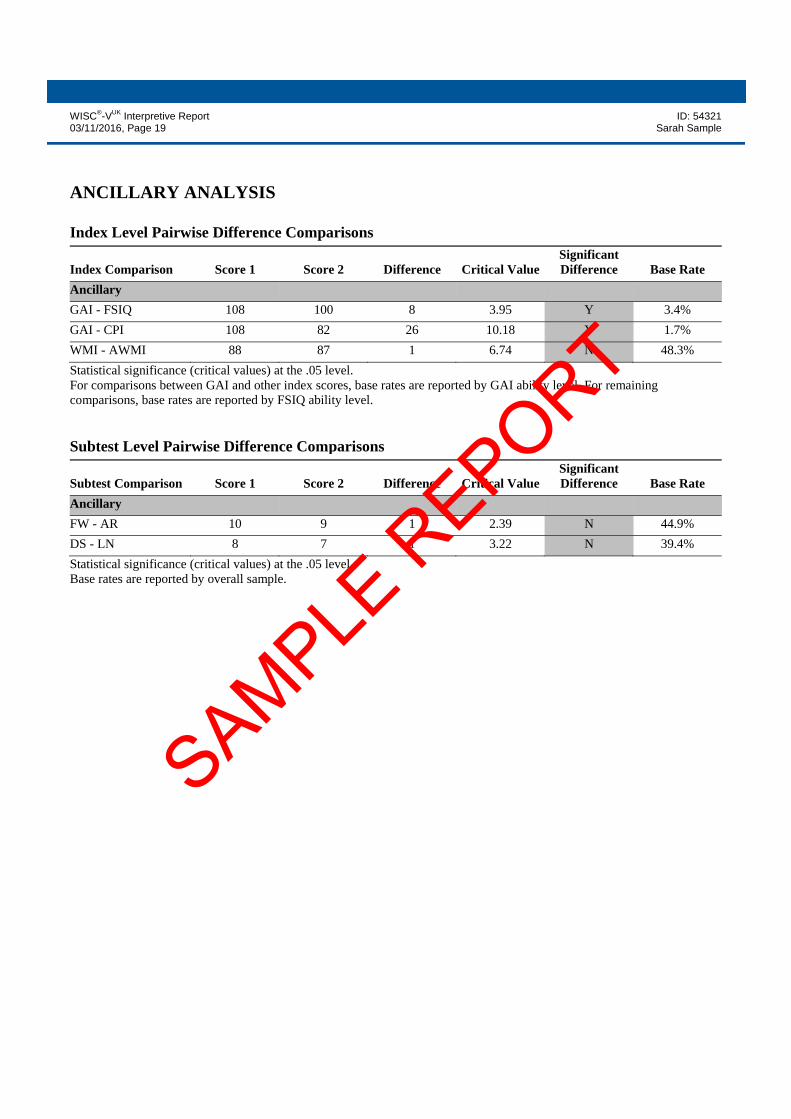
ANCILLARY ANALYSIS
Index Level Pairwise Difference Comparisons
Index Comparison Score 1 Score 2 Difference Critical ValueSignificant Difference Base Rate
Ancillary
GAI - FSIQ 108 100 8 3.95 Y 3.4%
GAI - CPI 108 82 26 10.18 Y 1.7%
WMI - AWMI 88 87 1 6.74 N 48.3%
Statistical significance (critical values) at the .05 level. For comparisons between GAI and other index scores, base rates are reported by GAI ability level. For remaining comparisons, base rates are reported by FSIQ ability level. Subtest Level Pairwise Difference Comparisons
Subtest Comparison Score 1 Score 2 Difference Critical ValueSignificant Difference Base Rate
Ancillary
FW - AR 10 9 1 2.39 N 44.9%
DS - LN 8 7 1 3.22 N 39.4%
Statistical significance (critical values) at the .05 level. Base rates are reported by overall sample.
SAMPLE R
EPORT
WISC®-VUK Interpretive Report ID: 54321 03/11/2016, Page 20 Sarah Sample
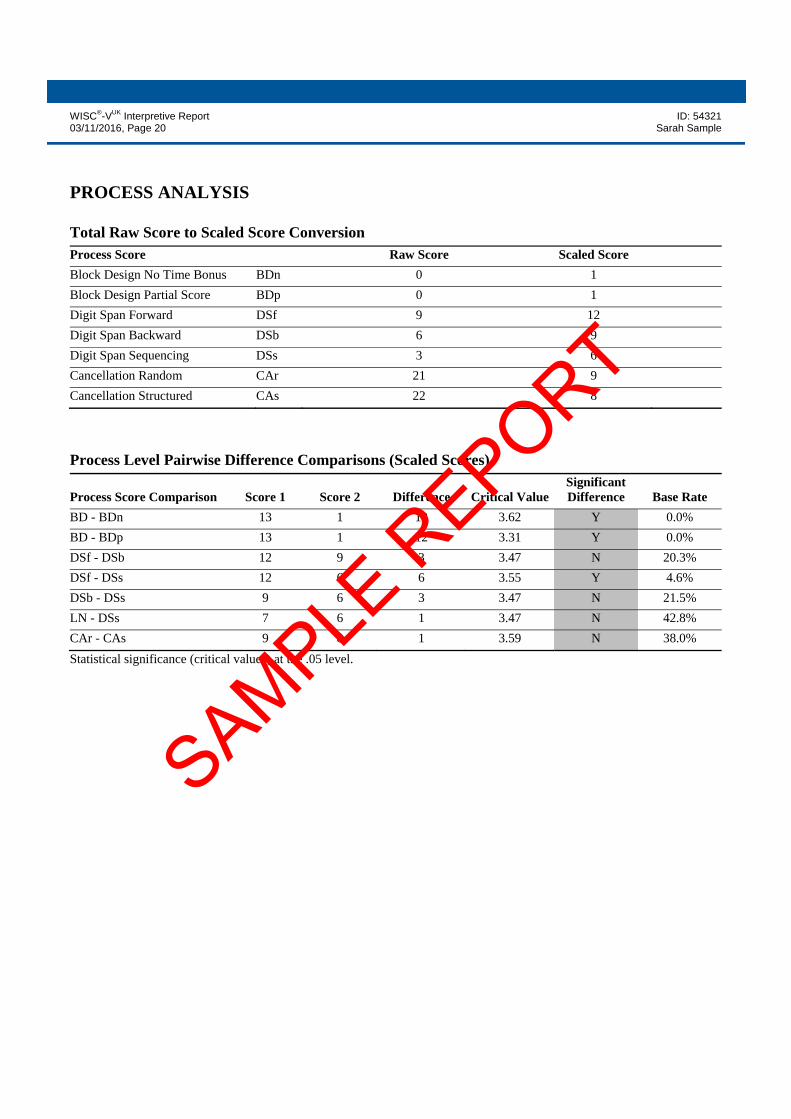
PROCESS ANALYSIS
Total Raw Score to Scaled Score ConversionProcess Score Raw Score Scaled Score
Block Design No Time Bonus BDn 0 1
Block Design Partial Score BDp 0 1
Digit Span Forward DSf 9 12
Digit Span Backward DSb 6 9
Digit Span Sequencing DSs 3 6
Cancellation Random CAr 21 9
Cancellation Structured CAs 22 8
Process Level Pairwise Difference Comparisons (Scaled Scores)
Process Score Comparison Score 1 Score 2 Difference Critical ValueSignificant Difference Base Rate
BD - BDn 13 1 12 3.62 Y 0.0%
BD - BDp 13 1 12 3.31 Y 0.0%
DSf - DSb 12 9 3 3.47 N 20.3%
DSf - DSs 12 6 6 3.55 Y 4.6%
DSb - DSs 9 6 3 3.47 N 21.5%
LN - DSs 7 6 1 3.47 N 42.8%
CAr - CAs 9 8 1 3.59 N 38.0%
Statistical significance (critical values) at the .05 level.
SAMPLE R
EPORT
WISC®-VUK Interpretive Report ID: 54321 03/11/2016, Page 21 Sarah Sample
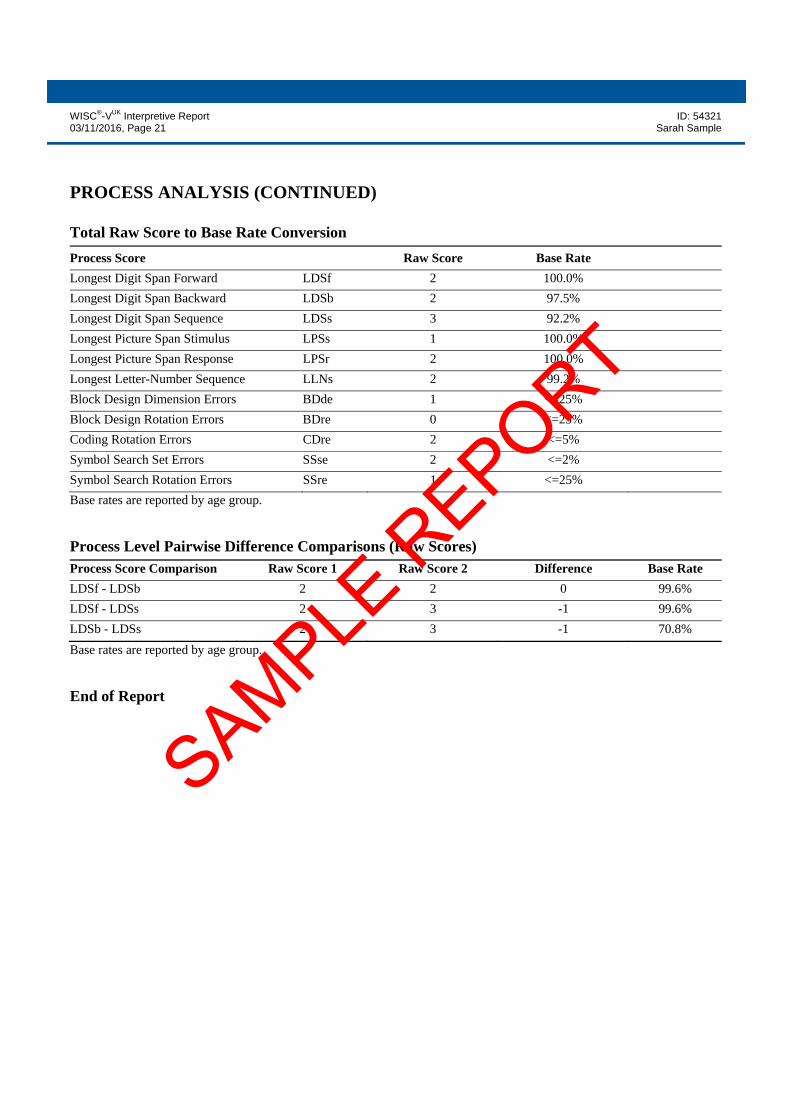
PROCESS ANALYSIS (CONTINUED)
Total Raw Score to Base Rate Conversion
Process Score Raw Score Base Rate
Longest Digit Span Forward LDSf 2 100.0%
Longest Digit Span Backward LDSb 2 97.5%
Longest Digit Span Sequence LDSs 3 92.2%
Longest Picture Span Stimulus LPSs 1 100.0%
Longest Picture Span Response LPSr 2 100.0%
Longest Letter-Number Sequence LLNs 2 99.2%
Block Design Dimension Errors BDde 1 <=25%
Block Design Rotation Errors BDre 0 <=25%
Coding Rotation Errors CDre 2 <=5%
Symbol Search Set Errors SSse 2 <=2%
Symbol Search Rotation Errors SSre 1 <=25%
Base rates are reported by age group. Process Level Pairwise Difference Comparisons (Raw Scores)
Process Score Comparison Raw Score 1 Raw Score 2 Difference Base Rate
LDSf - LDSb 2 2 0 99.6%
LDSf - LDSs 2 3 -1 99.6%
LDSb - LDSs 2 3 -1 70.8%
Base rates are reported by age group. End of Report
SAMPLE R
EPORT
Copyright© 2015 by NCS Pearson, Inc. Adapted by permission. European adaptation copyright © 2016 Pearson Education Ltd. or its affiliate(s). All rights reserved. Pearson, the PSI logo, PsychCorp, Wechsler, Wechsler Intelligence Scale for Children, and WISC are trademarks in the U.S. and/or other countries of Pearson Education, Inc., or its affiliate(s). This report contains copyrighted material and trade secrets. The qualified licensee may excerpt portions of this output report, limited to the minimum text necessary to accurately describe their significant core conclusions, for incorporation into a written evaluation of the examinee, in accordance with their profession's citation standards, if any. No adaptations, translations, modifications, or special versions may be made of this report without prior written permission from Pearson. [ 1.3 / RE1 / QG1 ]
WISC®-VUK
Wechsler Intelligence Scale for Children®-Fifth Edition: United Kingdom
Parent Summary Report Examinee Name Sarah Sample Date of Report 06/12/2016
Examinee ID 54321 School Year Year 4
Date of Birth 24/11/2008 Primary Language English
Gender Female Handedness Right
Race/Ethnicity White Examiner Name Sample Examiner
Date of Testing 03/11/2016 Age at Testing 7 years 11 months Retest? No
SAMPLE R
EPORT
WISC®-VUK Parent Summary Report ID: 54321 03/11/2016, Page 2 Sarah Sample
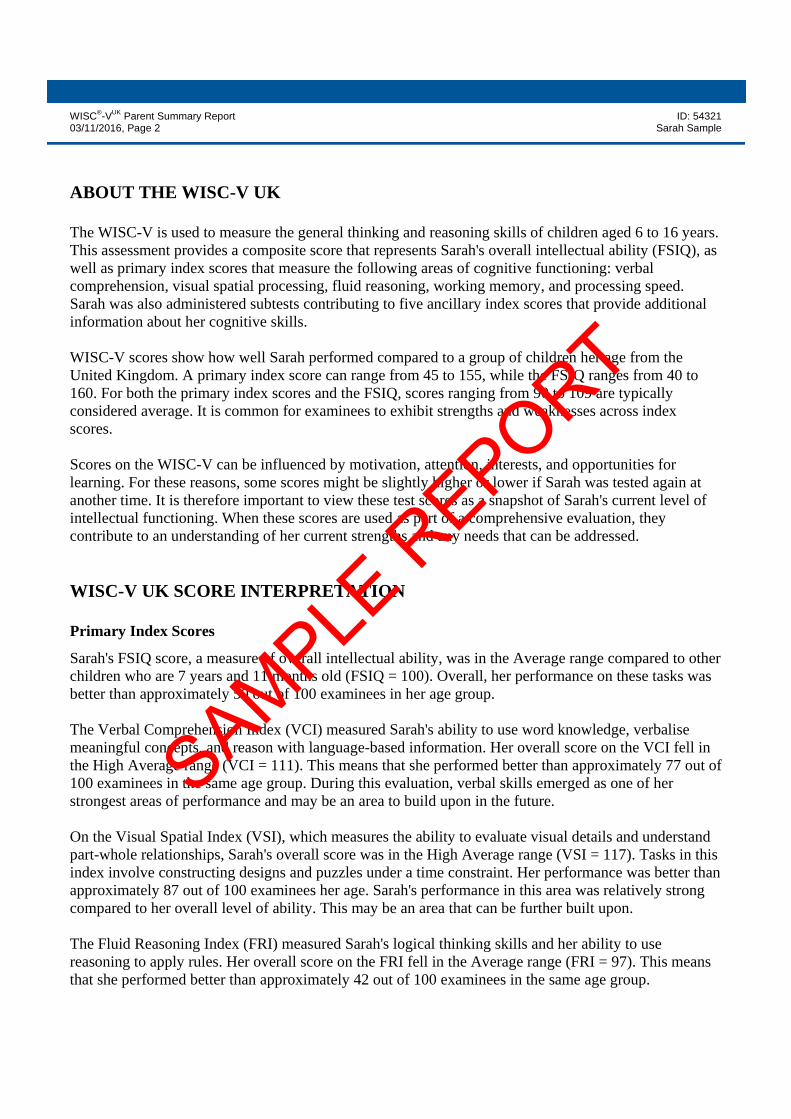
ABOUT THE WISC-V UK The WISC-V is used to measure the general thinking and reasoning skills of children aged 6 to 16 years. This assessment provides a composite score that represents Sarah's overall intellectual ability (FSIQ), as well as primary index scores that measure the following areas of cognitive functioning: verbal comprehension, visual spatial processing, fluid reasoning, working memory, and processing speed. Sarah was also administered subtests contributing to five ancillary index scores that provide additional information about her cognitive skills. WISC-V scores show how well Sarah performed compared to a group of children her age from the United Kingdom. A primary index score can range from 45 to 155, while the FSIQ ranges from 40 to 160. For both the primary index scores and the FSIQ, scores ranging from 90 to 109 are typically considered average. It is common for examinees to exhibit strengths and weaknesses across index scores. Scores on the WISC-V can be influenced by motivation, attention, interests, and opportunities for learning. For these reasons, some scores might be slightly higher or lower if Sarah was tested again at another time. It is therefore important to view these test scores as a snapshot of Sarah's current level of intellectual functioning. When these scores are used as part of a comprehensive evaluation, they contribute to an understanding of her current strengths and any needs that can be addressed. WISC-V UK SCORE INTERPRETATION Primary Index Scores
Sarah's FSIQ score, a measure of overall intellectual ability, was in the Average range compared to other children who are 7 years and 11 months old (FSIQ = 100). Overall, her performance on these tasks was better than approximately 50 out of 100 examinees in her age group. The Verbal Comprehension Index (VCI) measured Sarah's ability to use word knowledge, verbalise meaningful concepts, and reason with language-based information. Her overall score on the VCI fell in the High Average range (VCI = 111). This means that she performed better than approximately 77 out of 100 examinees in the same age group. During this evaluation, verbal skills emerged as one of her strongest areas of performance and may be an area to build upon in the future. On the Visual Spatial Index (VSI), which measures the ability to evaluate visual details and understand part-whole relationships, Sarah's overall score was in the High Average range (VSI = 117). Tasks in this index involve constructing designs and puzzles under a time constraint. Her performance was better than approximately 87 out of 100 examinees her age. Sarah's performance in this area was relatively strong compared to her overall level of ability. This may be an area that can be further built upon. The Fluid Reasoning Index (FRI) measured Sarah's logical thinking skills and her ability to use reasoning to apply rules. Her overall score on the FRI fell in the Average range (FRI = 97). This means that she performed better than approximately 42 out of 100 examinees in the same age group.
SAMPLE R
EPORT
WISC®-VUK Parent Summary Report ID: 54321 03/11/2016, Page 3 Sarah Sample
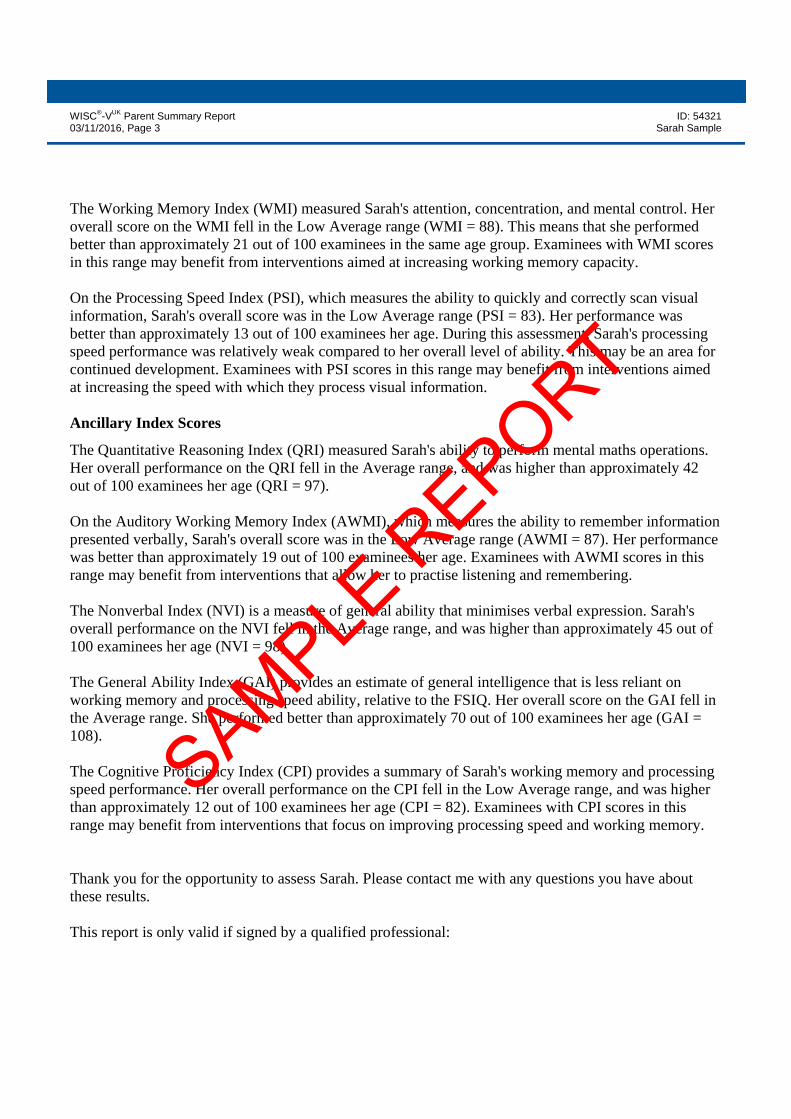
The Working Memory Index (WMI) measured Sarah's attention, concentration, and mental control. Her overall score on the WMI fell in the Low Average range (WMI = 88). This means that she performed better than approximately 21 out of 100 examinees in the same age group. Examinees with WMI scores in this range may benefit from interventions aimed at increasing working memory capacity. On the Processing Speed Index (PSI), which measures the ability to quickly and correctly scan visual information, Sarah's overall score was in the Low Average range (PSI = 83). Her performance was better than approximately 13 out of 100 examinees her age. During this assessment, Sarah's processing speed performance was relatively weak compared to her overall level of ability. This may be an area for continued development. Examinees with PSI scores in this range may benefit from interventions aimed at increasing the speed with which they process visual information. Ancillary Index Scores
The Quantitative Reasoning Index (QRI) measured Sarah's ability to perform mental maths operations. Her overall performance on the QRI fell in the Average range, and was higher than approximately 42 out of 100 examinees her age (QRI = 97). On the Auditory Working Memory Index (AWMI), which measures the ability to remember information presented verbally, Sarah's overall score was in the Low Average range (AWMI = 87). Her performance was better than approximately 19 out of 100 examinees her age. Examinees with AWMI scores in this range may benefit from interventions that allow her to practise listening and remembering. The Nonverbal Index (NVI) is a measure of general ability that minimises verbal expression. Sarah's overall performance on the NVI fell in the Average range, and was higher than approximately 45 out of 100 examinees her age (NVI = 98). The General Ability Index (GAI) provides an estimate of general intelligence that is less reliant on working memory and processing speed ability, relative to the FSIQ. Her overall score on the GAI fell in the Average range. She performed better than approximately 70 out of 100 examinees her age (GAI = 108). The Cognitive Proficiency Index (CPI) provides a summary of Sarah's working memory and processing speed performance. Her overall performance on the CPI fell in the Low Average range, and was higher than approximately 12 out of 100 examinees her age (CPI = 82). Examinees with CPI scores in this range may benefit from interventions that focus on improving processing speed and working memory. Thank you for the opportunity to assess Sarah. Please contact me with any questions you have about these results. This report is only valid if signed by a qualified professional:
SAMPLE R
EPORT

WISC®-VUK Parent Summary Report ID: 54321 03/11/2016, Page 4 Sarah Sample
Sample Examiner Date
SAMPLE R
EPORT
WISC®-VUK Parent Summary Report ID: 54321 03/11/2016, Page 5 Sarah Sample
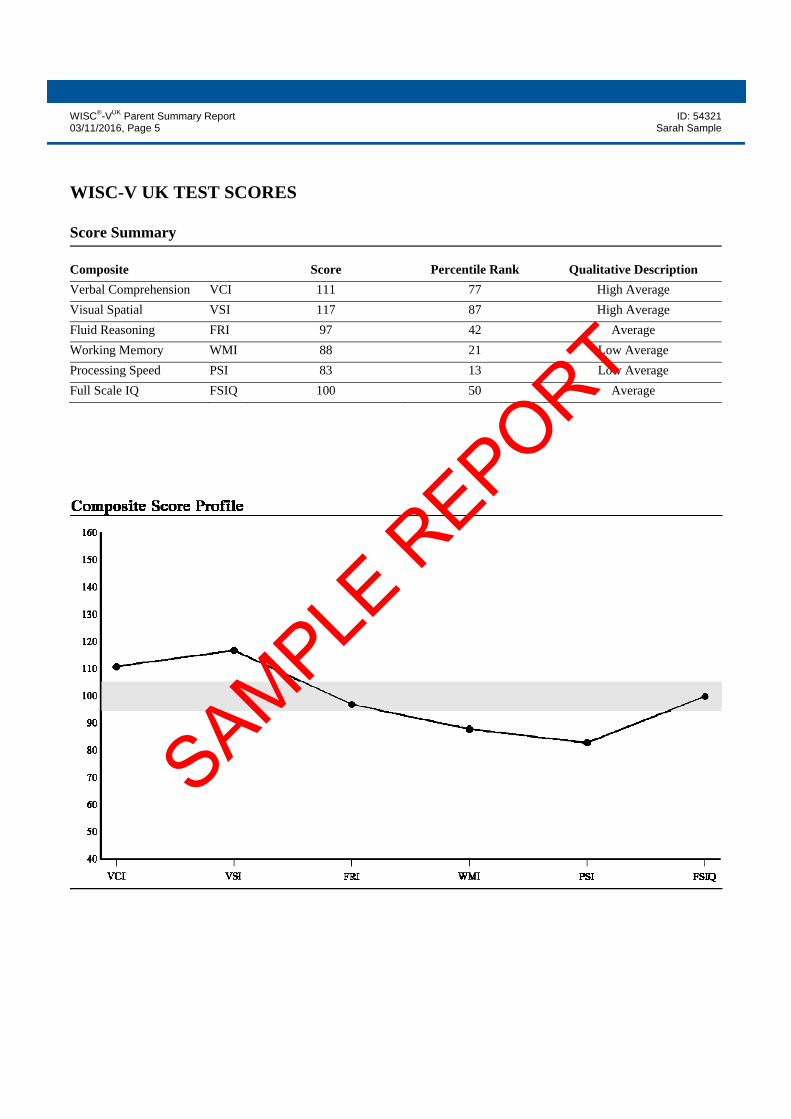
WISC-V UK TEST SCORES Score Summary
Composite
Score Percentile Rank Qualitative Description
Verbal Comprehension VCI 111 77 High Average
Visual Spatial VSI 117 87 High Average
Fluid Reasoning FRI 97 42 Average
Working Memory WMI 88 21 Low Average
Processing Speed PSI 83 13 Low Average
Full Scale IQ FSIQ 100 50 Average
SAMPLE R
EPORT
WISC®-VUK Parent Summary Report ID: 54321 03/11/2016, Page 6 Sarah Sample
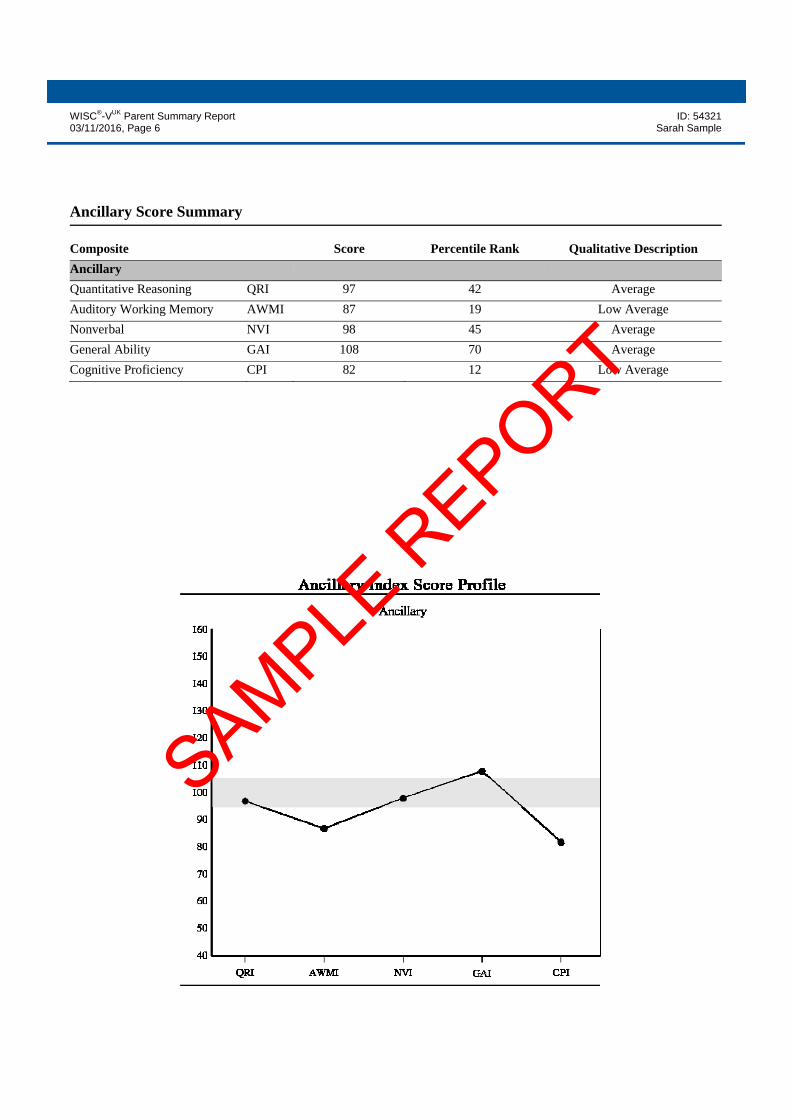
Ancillary Score Summary
Composite
Score Percentile Rank Qualitative Description
Ancillary
Quantitative Reasoning QRI 97 42 Average
Auditory Working Memory AWMI 87 19 Low Average
Nonverbal NVI 98 45 Average
General Ability GAI 108 70 Average
Cognitive Proficiency CPI 82 12 Low Average
SAMPLE R
EPORT