Embed Size (px)
Citation preview
WLAN PERFORMANCE ANALYSIS FOR INDOOR
ENVIRONMENTS
Bachelor Thesis
Supervisor: Prof. Dr.-Ing. Markus Rupp
Assistants: Dipl.-Ing. Philipp Svoboda
M.Sc. Çise Mıdoğlu
SCIENCE AND TELECOMMUNICATION TECHNOLOGIES
ENGINEERING
By
BARTOLOME OLIVER ARBONA
Wien, July 2015
Bartolome Oliver Page 2 of 57 Student ID: 1429560 WLAN Performance Analysis for Indoor Environments
Abstract
Studies report that in the next years there will be a high increase in the number of
mobile devices, the overall data traffic generated by mobile devices, and a migration from
larger cells towards Wireless Local Area Networks (WLAN) and smaller cells (picocells and
femtocells). There is also a large amount of data that is estimated to be offloaded to Wi-Fi
and small cells.
Due to this estimated growth in the mobile data traffic over wireless environment; several
companies are investing and focusing resources in improving their services mainly related
with WLAN’s. The concerns of the industry are focused on examining the performance of
WLAN’s, especially indoors, and finding ways to understand more about actual User
Experience (UX) in real scenarios. These ambitions require the combination of theory with
practice.
This thesis is mainly focused on supporting these performance estimations. Trying to help on
this purpose, a Graphical User Interface (GUI) is developed for simulating and analysing
certain metrics of WLAN´s in indoor environments, such as coverage and data rate. The tool
not only combines several different advanced concepts relating to indoor propagation,
penetration loss, layout modelling, interference modelling, and different WLAN standards;
but presents them in a simple and easy-to-understand interface to the final user. The
performance metrics are represented quantitatively and as accurately as possible.
When the tool is run with appropriate input values, it is able to provide results such as the
Signal Strength, Signal to Noise Ratio (SNR), Signal to Interference Ratio (SIR) and maximum
achievable Data Rate; this allows the service providers to estimate the maximum
performance of their own systems and also to validate theoretical results by simulation.
This tool is the first approach to a much more complex problem that is to fully model and
simulate a full WLAN system; that is why its scalability allows future improvements.

Bartolome Oliver Page 3 of 57 Student ID: 1429560 WLAN Performance Analysis for Indoor Environments
To all who believed in me

Bartolome Oliver Page 4 of 57 Student ID: 1429560 WLAN Performance Analysis for Indoor Environments
Acknowledgements
I would like to express my deep gratitude for the support offered by my supervisors
Çise Mıdoğlu and Philipp Svoboda for the efforts and the help provided during the entire
project.
Also to my colleagues of the Department Alicia and Triffon, with those I have shared a lot of
hours in the lab and always have been a support for me when it was really needed.
My sincere thanks to my family and close friends, which are always there for me.
Tomeu Oliver, July 2015
Bartolome Oliver Page 5 of 57 Student ID: 1429560 WLAN Performance Analysis for Indoor Environments
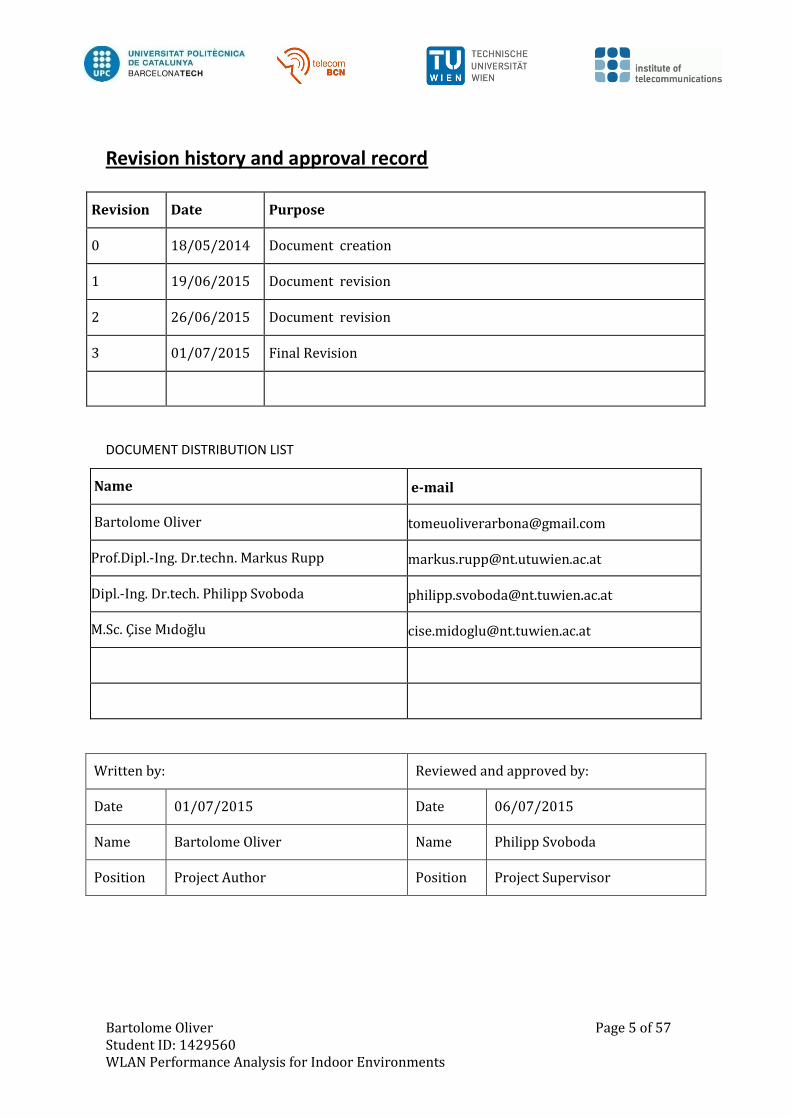
Revision history and approval record
Revision Date Purpose
0 18/05/2014 Document creation
1 19/06/2015 Document revision
2 26/06/2015 Document revision
3 01/07/2015 Final Revision
DOCUMENT DISTRIBUTION LIST
Name e-mail
Bartolome Oliver [email protected]
Prof.Dipl.-Ing. Dr.techn. Markus Rupp [email protected]
Dipl.-Ing. Dr.tech. Philipp Svoboda [email protected]
M.Sc. Çise Mıdoğlu [email protected]
Written by: Reviewed and approved by:
Date 01/07/2015 Date 06/07/2015
Name Bartolome Oliver Name Philipp Svoboda
Position Project Author Position Project Supervisor

Bartolome Oliver Page 6 of 57 Student ID: 1429560 WLAN Performance Analysis for Indoor Environments
Table of contents
Abstract ........................................................................................................................................................ 2
Dedication ................................................................................................................................................... 3
Acknowledgements .................................................................................................................................. 4
Revision history and approval record .............................................................................................. 5
Table of contents ...................................................................................................................................... 6
List of Figures ............................................................................................................................................. 8
List of Tables ............................................................................................................................................ 10
List of Abbreviations ............................................................................................................................. 11
1. Introduction ..................................................................................................................................... 13
1.1. Statement of Purpose ......................................................................................................................... 13
1.2. Requirements and Specifications .................................................................................................. 13
1.3. Methods and Procedures .................................................................................................................. 15
1.4. Work Plan ................................................................................................................................................ 15
1.5. Milestones ............................................................................................................................................... 20
1.6. Deviations and Incidents .................................................................................................................. 20
1.7. Gantt Diagram ....................................................................................................................................... 21
1.8. Motivation ............................................................................................................................................... 22
2. State of the art ................................................................................................................................ 24
2.1. IEEE 802.11 Standard Family ......................................................................................................... 24
2.2. Frequency Bands .................................................................................................................................. 28
2.3. Indoor Propagation Models ............................................................................................................. 31
2.4. Penetration Losses .............................................................................................................................. 34
2.5. Floorplan Generation ......................................................................................................................... 35
3. Project development: ................................................................................................................... 36
3.1. Graphical User Interface (GUI) ....................................................................................................... 36
3.2. Flat Layout Model ................................................................................................................................ 37
3.3. Penetration Losses and Frequency............................................................................................... 39
3.4. Propagation Model .............................................................................................................................. 40
3.5. Interferences .......................................................................................................................................... 42
3.6. Calculations ............................................................................................................................................ 44
3.7. Other Considerations ......................................................................................................................... 47

Bartolome Oliver Page 7 of 57 Student ID: 1429560 WLAN Performance Analysis for Indoor Environments
4. Results: .............................................................................................................................................. 49
4.1. Signal Strength (dBm) ........................................................................................................................ 49
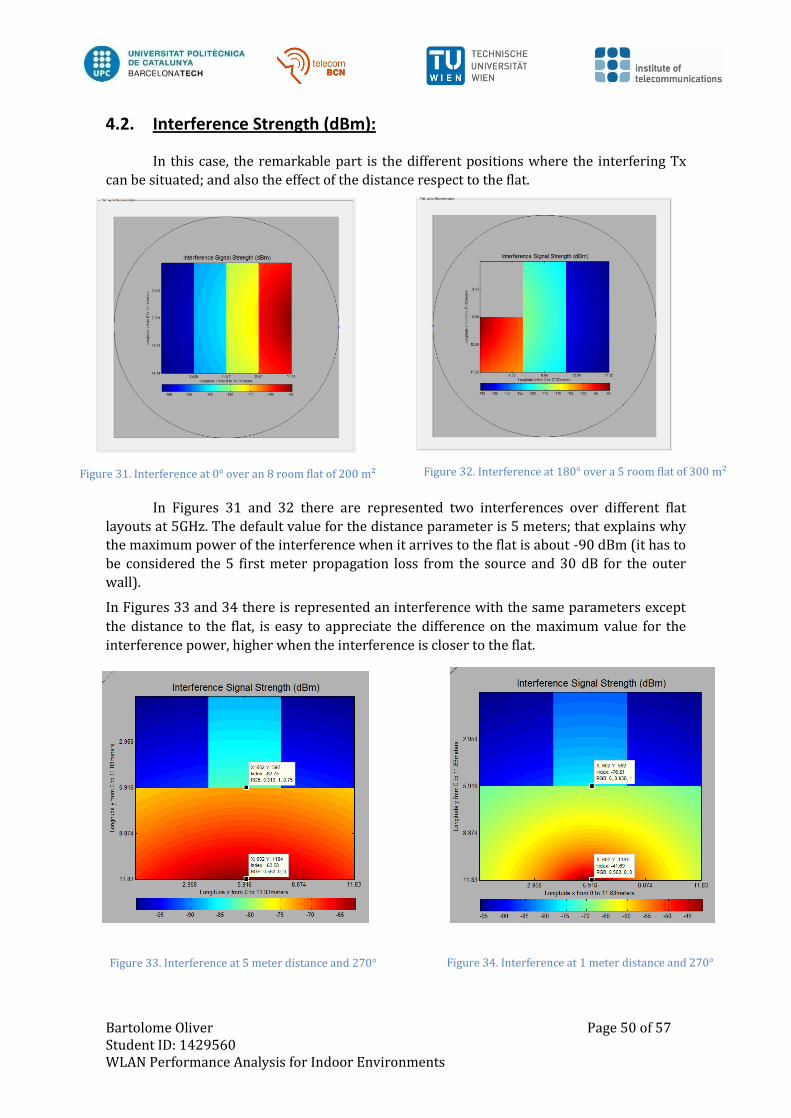
4.2. Interference Strength (dBm) ........................................................................................................... 50
4.3. SIR (dB) .................................................................................................................................................... 51
4.4. SNR (dB) .................................................................................................................................................. 52
4.5. Data Rate (Mbps) ................................................................................................................................. 53
5. Conclusions and future development ..................................................................................... 55
Bibliography ............................................................................................................................................. 56
Bartolome Oliver Page 8 of 57 Student ID: 1429560 WLAN Performance Analysis for Indoor Environments
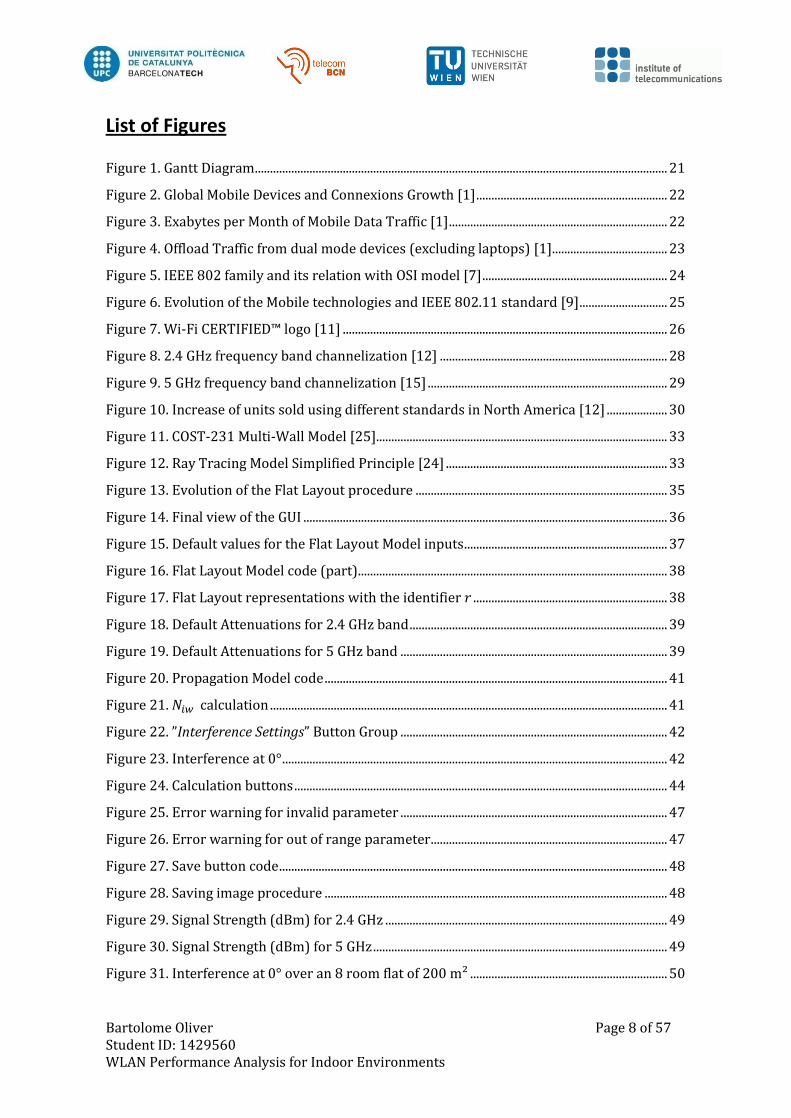
List of Figures
Figure 1. Gantt Diagram ........................................................................................................................................ 21
Figure 2. Global Mobile Devices and Connexions Growth [1] ............................................................... 22
Figure 3. Exabytes per Month of Mobile Data Traffic [1] ........................................................................ 22
Figure 4. Offload Traffic from dual mode devices (excluding laptops) [1] ...................................... 23
Figure 5. IEEE 802 family and its relation with OSI model [7] ............................................................. 24
Figure 6. Evolution of the Mobile technologies and IEEE 802.11 standard [9] ............................. 25
Figure 7. Wi-Fi CERTIFIED™ logo [11] ........................................................................................................... 26
Figure 8. 2.4 GHz frequency band channelization [12] ........................................................................... 28
Figure 9. 5 GHz frequency band channelization [15] ............................................................................... 29
Figure 10. Increase of units sold using different standards in North America [12] .................... 30
Figure 11. COST-231 Multi-Wall Model [25]................................................................................................ 33
Figure 12. Ray Tracing Model Simplified Principle [24] ......................................................................... 33
Figure 13. Evolution of the Flat Layout procedure ................................................................................... 35
Figure 14. Final view of the GUI ........................................................................................................................ 36
Figure 15. Default values for the Flat Layout Model inputs ................................................................... 37
Figure 16. Flat Layout Model code (part) ...................................................................................................... 38
Figure 17. Flat Layout representations with the identifier ................................................................ 38
Figure 18. Default Attenuations for 2.4 GHz band ..................................................................................... 39
Figure 19. Default Attenuations for 5 GHz band ........................................................................................ 39
Figure 20. Propagation Model code ................................................................................................................. 41
Figure 21. calculation ................................................................................................................................... 41
Figure 22. ”Interference Settings” Button Group ........................................................................................ 42
Figure 23. Interference at 0° ............................................................................................................................... 42
Figure 24. Calculation buttons ........................................................................................................................... 44
Figure 25. Error warning for invalid parameter ........................................................................................ 47
Figure 26. Error warning for out of range parameter .............................................................................. 47
Figure 27. Save button code ................................................................................................................................ 48
Figure 28. Saving image procedure ................................................................................................................. 48
Figure 29. Signal Strength (dBm) for 2.4 GHz ............................................................................................. 49
Figure 30. Signal Strength (dBm) for 5 GHz ................................................................................................. 49
Figure 31. Interference at 0° over an 8 room flat of 200 m² ................................................................. 50

Bartolome Oliver Page 9 of 57 Student ID: 1429560 WLAN Performance Analysis for Indoor Environments
Figure 32. Interference at 180° over a 5 room flat of 300 m² ............................................................... 50
Figure 33. Interference at 5 meter distance and 270° ............................................................................. 50
Figure 34. Interference at 1 meter distance and 270 ............................................................................... 50
Figure 35. SIR considering an interference at 180 ° ................................................................................. 51
Figure 36. SNR considering the ISM band noise ......................................................................................... 52
Figure 37. Data Rate over 2.4 GHz band ........................................................................................................ 53
Figure 38. Data Rate over 5 GHz band ............................................................................................................ 54
Bartolome Oliver Page 10 of 57 Student ID: 1429560 WLAN Performance Analysis for Indoor Environments
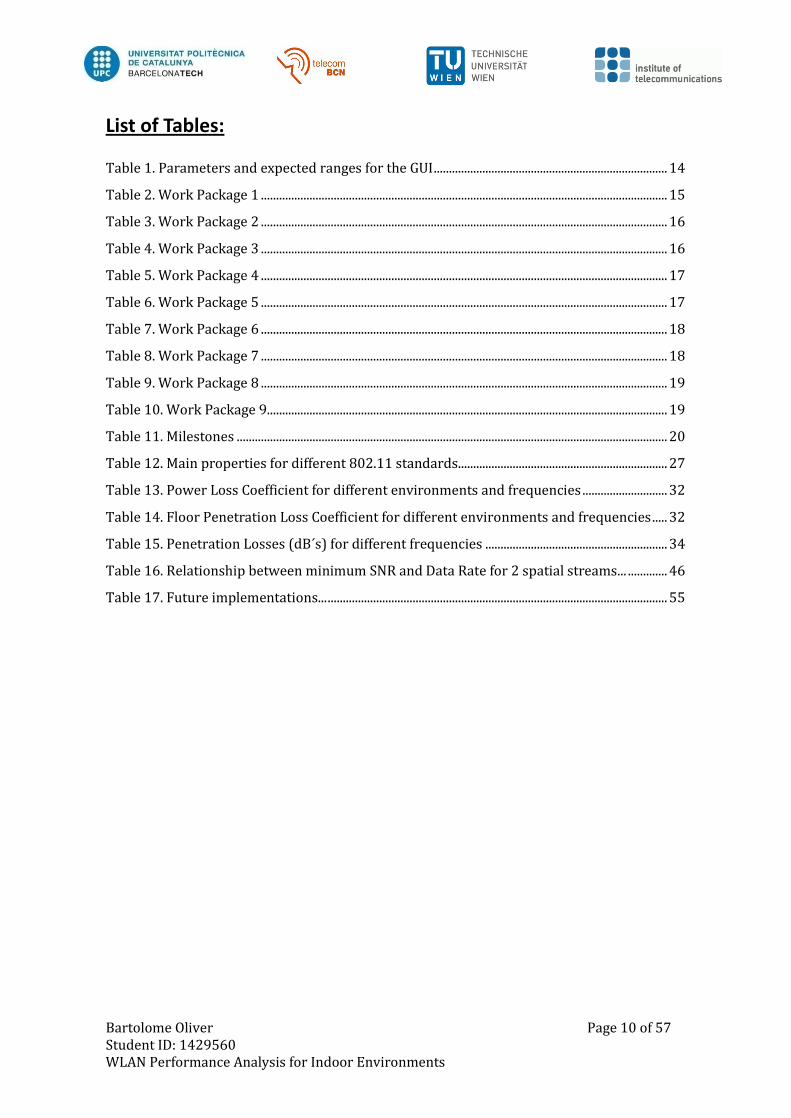
List of Tables:
Table 1. Parameters and expected ranges for the GUI ............................................................................. 14
Table 2. Work Package 1 ...................................................................................................................................... 15
Table 3. Work Package 2 ...................................................................................................................................... 16
Table 4. Work Package 3 ...................................................................................................................................... 16
Table 5. Work Package 4 ...................................................................................................................................... 17
Table 6. Work Package 5 ...................................................................................................................................... 17
Table 7. Work Package 6 ...................................................................................................................................... 18
Table 8. Work Package 7 ...................................................................................................................................... 18
Table 9. Work Package 8 ...................................................................................................................................... 19
Table 10. Work Package 9.................................................................................................................................... 19
Table 11. Milestones .............................................................................................................................................. 20
Table 12. Main properties for different 802.11 standards..................................................................... 27
Table 13. Power Loss Coefficient for different environments and frequencies ............................ 32
Table 14. Floor Penetration Loss Coefficient for different environments and frequencies ..... 32
Table 15. Penetration Losses (dB´s) for different frequencies ............................................................ 34
Table 16. Relationship between minimum SNR and Data Rate for 2 spatial streams... ............. 46
Table 17. Future implementations... ................................................................................................................ 55

Bartolome Oliver Page 11 of 57 Student ID: 1429560 WLAN Performance Analysis for Indoor Environments
List of Abbreviations
ANNS Artificial Neural Networks
BW Bandwidth
CAGR Compound Annual Growth Rate
CCK Complementary Code Keying
COST Cooperation in Science and Technology
CSMA/CA Carrier Sense Multiple Access with Collision Avoidance
DL Downlink
DSSS Direct Sequence Spread Spectrum
EIRP Equivalent Isotropically Radiated Power
FCC Federal Communications Commission
FDTD Finite Difference Time-Domain
FHSS Frequency Hopping Spread Spectrum
GI Guard Interval
GO Geometrical Optics
GUI Graphical User Interface
HEW High Efficiency WLAN
IAM Image Approach Image
IBM International Business Machines
IEEE Institute of Electrical and Electronic Engineers
IoT Internet of Things
ISM Industrial, Scientific and Medical
ISO International Organization of Standardization
ITU International Telecommunication Union
LAN Local Area Network
LTE Long Term Evolution
LTE-LAA Long Term Evolution – License Assisted Access
LTE-LWA Long Term Evolution Wi-Fi Aggregation
MAC Media Access Control
MIMO Multiple Input Multiple Output
MU-MIMO Multi User Multiple Input Multiple Output
MWM Multi Wall Model
Bartolome Oliver Page 12 of 57 Student ID: 1429560 WLAN Performance Analysis for Indoor Environments
OFDM Orthogonal Frequency Division Multiplexing
OSI Open Systems Interconnexion
PC Personal Computer
PHY Physical Layer
QoE Quality of Experience
RLM Ray Launching Model
RSSI Received Signal Strength Indicator
Rx Receiver
SIN Signal to Interference Ratio
SINR Signal to Interference and Noise Ratio
SNR Signal to Noise Ratio
Tx Transmitter
UL Uplink
UX User Experience
WECA Wireless Ethernet Compatibility Alliance
WLAN Wireless Local Area Network
Bartolome Oliver Page 13 of 57 Student ID: 1429560 WLAN Performance Analysis for Indoor Environments
1. Introduction
1.1. Statement of Purpose
The main objective of this thesis is to carry out a study of the performance of
Wireless Local Area Network (WLAN) networks in indoor environments.
For this purpose, a Graphical User Interface (GUI) in MATLAB has been developed in order to
analyse different metrics for a WLAN network in a residential apartment. The objective of
this GUI is to permit the “average non-expert user” to understand in an interactive and easy
way, different performance metrics of the network than can be analysed.
This GUI is not intended to provide an intensive analysis of all the metrics, properties or
characteristics of a given WLAN; the objective is to facilitate the understanding of the basic
metrics and make an accurate analysis in a short computation time.
Thus, the theoretical research that has been carried out somewhat praxis-oriented, and
focuses on implementing the GUI in the more efficient way but at the same time with the
simplest appearance possible.
1.2. Requirements and specifications
In order to be useful for the on-going project and accurate enough our GUI has some
requirements regarding the presentation of certain performance.
The GUI has to provide correctly and in a reasonable computational time different colormaps
of Signal Strength, Interference Strength, SIR, SNR and Available Data Rate, for one or two
AP’s (one as the main source and the other one as an interferer) located in different
positions; depending on the input values introduced by the user.
Also the GUI has to be designed in a way that permits a non-expert user to get familiar with it
(i.e. must have an intuitive interface) but at the same time be robust enough to achieve the
calculations with the required precision.
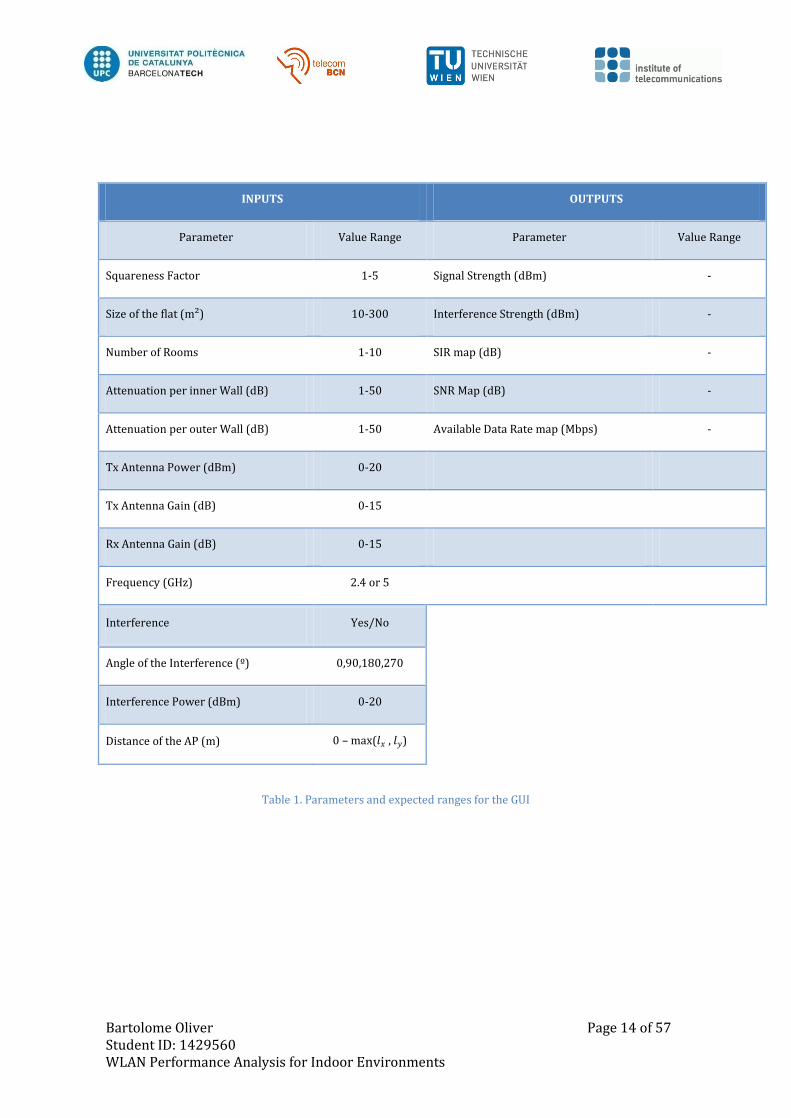
Table 1 shows the margins of the values expected as input and output, for the desired
performance of the GUI.
Bartolome Oliver Page 14 of 57 Student ID: 1429560 WLAN Performance Analysis for Indoor Environments
Table 1. Parameters and expected ranges for the GUI
INPUTS OUTPUTS
Parameter Value Range Parameter Value Range
Squareness Factor 1-5 Signal Strength (dBm) -
Size of the flat (m²) 10-300 Interference Strength (dBm) -
Number of Rooms 1-10 SIR map (dB) -
Attenuation per inner Wall (dB) 1-50 SNR Map (dB) -
Attenuation per outer Wall (dB) 1-50 Available Data Rate map (Mbps) -
Tx Antenna Power (dBm) 0-20
Tx Antenna Gain (dB) 0-15
Rx Antenna Gain (dB) 0-15
Frequency (GHz) 2.4 or 5
Interference Yes/No
Angle of the Interference (º) 0,90,180,270
Interference Power (dBm) 0-20
Distance of the AP (m) 0 – max( , )

Bartolome Oliver Page 15 of 57 Student ID: 1429560 WLAN Performance Analysis for Indoor Environments
1.3. Methods and Procedures
This bachelor project is supporting an on-going project carried out by researchers
from the Mobile Communications Group at the Institute of Telecommunications (TU Wien) in
cooperation with an industrial partner, which is a prominent network operator worldwide.
The main objective is not only to support this on-going project, but also to serve as a starting
point for further research in the direction of WLAN performance evaluation and has been
done under the auspices of the Institute of Telecommunications.
A minor part of the code used in this GUI has been provided by the department, the rest of
the GUI has been created designed and developed completely by the student.
1.4. Work Plan
In order to facilitate the realization of the project and to measure the progression, the
complete workload is separated in nine different work packages (WP1 to WP9).
Project: WLAN Performance Analysis for Indoor Environments WP ref: WP1
Major constituent: Software Development Sheet 1 of 9
Short description:
GUI – Part 1
First version of the GUI, should represent all functionality
Planned start date: 02.03.2015
Planned end date: 20.03.2015
Start event: 02.03.2015
End event: 27.03.2015
Internal task T1:
Understand existing code
Internal task T2:
Familiarize with GUIDE
Internal task T3:
Activate components in code
Deliverables:
Weekly Report 1
(MATLAB code),
Weekly Report 2
Dates:
27.03.2015
Table 2. Work Package 1
Bartolome Oliver Page 16 of 57 Student ID: 1429560 WLAN Performance Analysis for Indoor Environments
Project: WLAN Performance Analysis for Indoor Environments WP ref: WP2
Major constituent: Research Sheet 2 of 9
Short description:
IEEE802.11 standard family
Consider the following for each standard:
- Data rate in function of the signal strength
- Range
- Overhead signalling
- Channel width
Planned start date: 23.03.2015
Planned end date: 27.03.2015
Start event: 30.03.2015
End event: 10.04.2015
Internal task T1:
IEEE 802.11 b/g/n
Internal task T2:
IEEE 802.11 ac
Internal Task T3:
IEEE 802.11 ax
Deliverables:
Weekly
Report 3
(Theoretical
study)
Dates:
10.04.2015
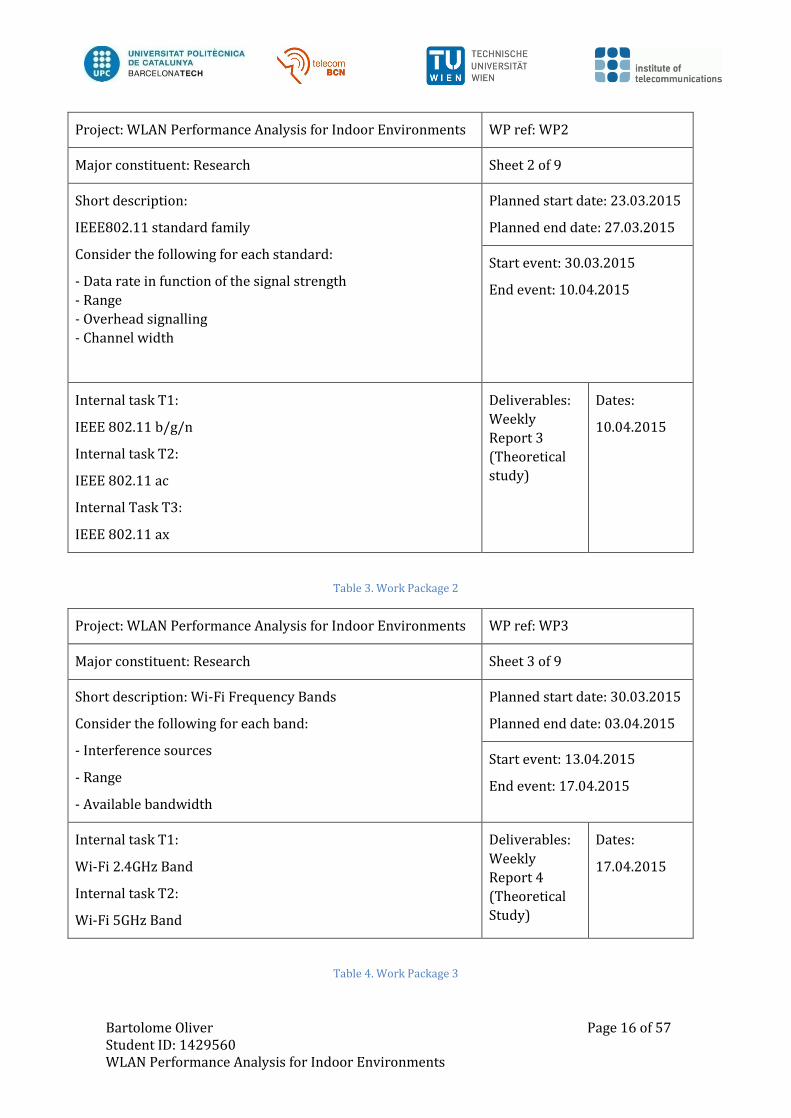
Table 3. Work Package 2
Project: WLAN Performance Analysis for Indoor Environments WP ref: WP3
Major constituent: Research Sheet 3 of 9
Short description: Wi-Fi Frequency Bands
Consider the following for each band:
- Interference sources
- Range
- Available bandwidth
Planned start date: 30.03.2015
Planned end date: 03.04.2015
Start event: 13.04.2015
End event: 17.04.2015
Internal task T1:
Wi-Fi 2.4GHz Band
Internal task T2:
Wi-Fi 5GHz Band
Deliverables:
Weekly
Report 4
(Theoretical
Study)
Dates:
17.04.2015
Table 4. Work Package 3
Bartolome Oliver Page 17 of 57 Student ID: 1429560 WLAN Performance Analysis for Indoor Environments
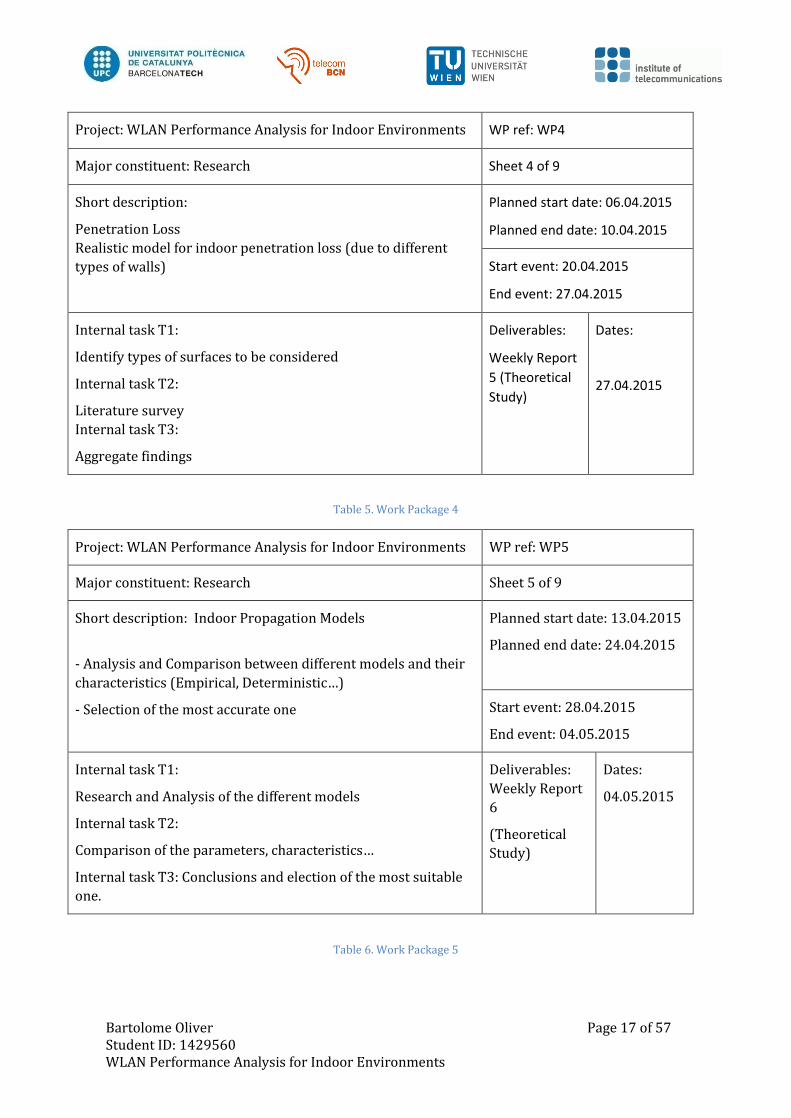
Project: WLAN Performance Analysis for Indoor Environments WP ref: WP4
Major constituent: Research Sheet 4 of 9
Short description:
Penetration Loss
Realistic model for indoor penetration loss (due to different
types of walls)
Planned start date: 06.04.2015
Planned end date: 10.04.2015
Start event: 20.04.2015
End event: 27.04.2015
Internal task T1:
Identify types of surfaces to be considered
Internal task T2:
Literature survey
Internal task T3:
Aggregate findings
Deliverables:
Weekly Report
5 (Theoretical
Study)
Dates:
27.04.2015
Table 5. Work Package 4
Project: WLAN Performance Analysis for Indoor Environments WP ref: WP5
Major constituent: Research Sheet 5 of 9
Short description: Indoor Propagation Models
- Analysis and Comparison between different models and their
characteristics (Empirical, Deterministic…)
- Selection of the most accurate one
Planned start date: 13.04.2015
Planned end date: 24.04.2015
Start event: 28.04.2015
End event: 04.05.2015
Internal task T1:
Research and Analysis of the different models
Internal task T2:
Comparison of the parameters, characteristics…
Internal task T3: Conclusions and election of the most suitable
one.
Deliverables:
Weekly Report
6
(Theoretical
Study)
Dates:
04.05.2015
Table 6. Work Package 5
Bartolome Oliver Page 18 of 57 Student ID: 1429560 WLAN Performance Analysis for Indoor Environments
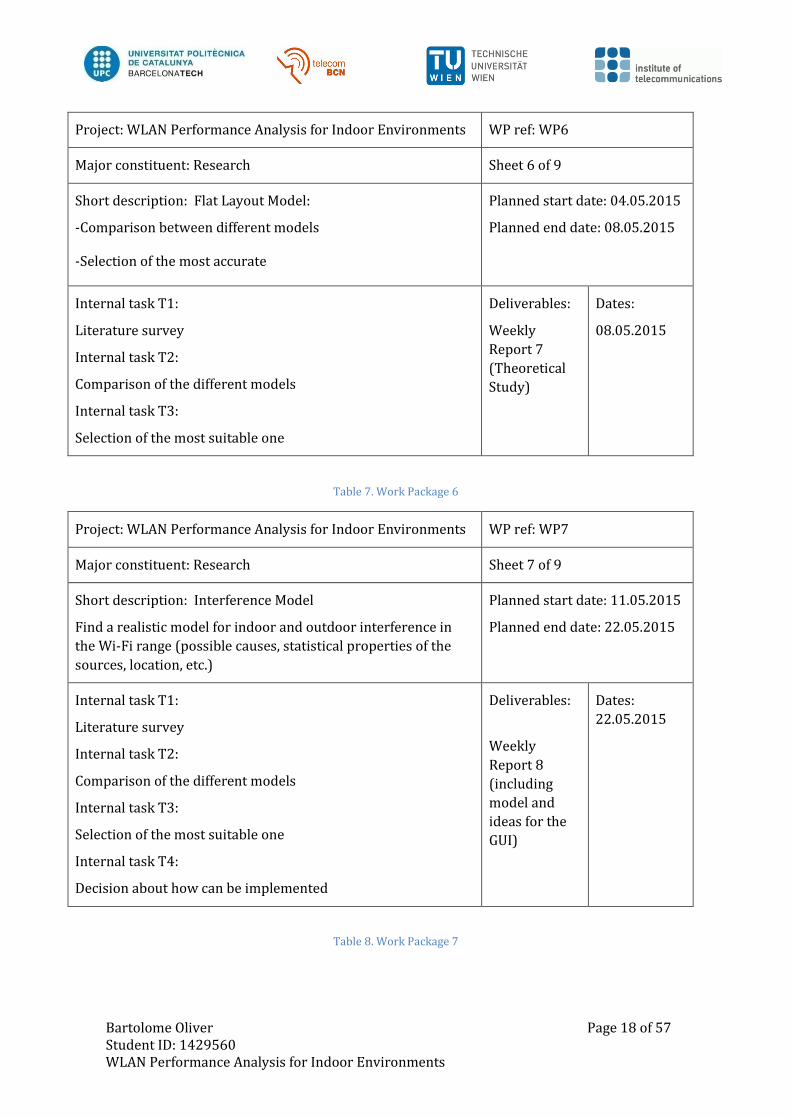
Project: WLAN Performance Analysis for Indoor Environments WP ref: WP6
Major constituent: Research Sheet 6 of 9
Short description: Flat Layout Model:
-Comparison between different models
-Selection of the most accurate
Planned start date: 04.05.2015
Planned end date: 08.05.2015
Internal task T1:
Literature survey
Internal task T2:
Comparison of the different models
Internal task T3:
Selection of the most suitable one
Deliverables:
Weekly
Report 7
(Theoretical
Study)
Dates:
08.05.2015
Table 7. Work Package 6
Project: WLAN Performance Analysis for Indoor Environments WP ref: WP7
Major constituent: Research Sheet 7 of 9
Short description: Interference Model
Find a realistic model for indoor and outdoor interference in
the Wi-Fi range (possible causes, statistical properties of the
sources, location, etc.)
Planned start date: 11.05.2015
Planned end date: 22.05.2015
Internal task T1:
Literature survey
Internal task T2:
Comparison of the different models
Internal task T3:
Selection of the most suitable one
Internal task T4:
Decision about how can be implemented
Deliverables:
Weekly
Report 8
(including
model and
ideas for the
GUI)
Dates:
22.05.2015
Table 8. Work Package 7
Bartolome Oliver Page 19 of 57 Student ID: 1429560 WLAN Performance Analysis for Indoor Environments
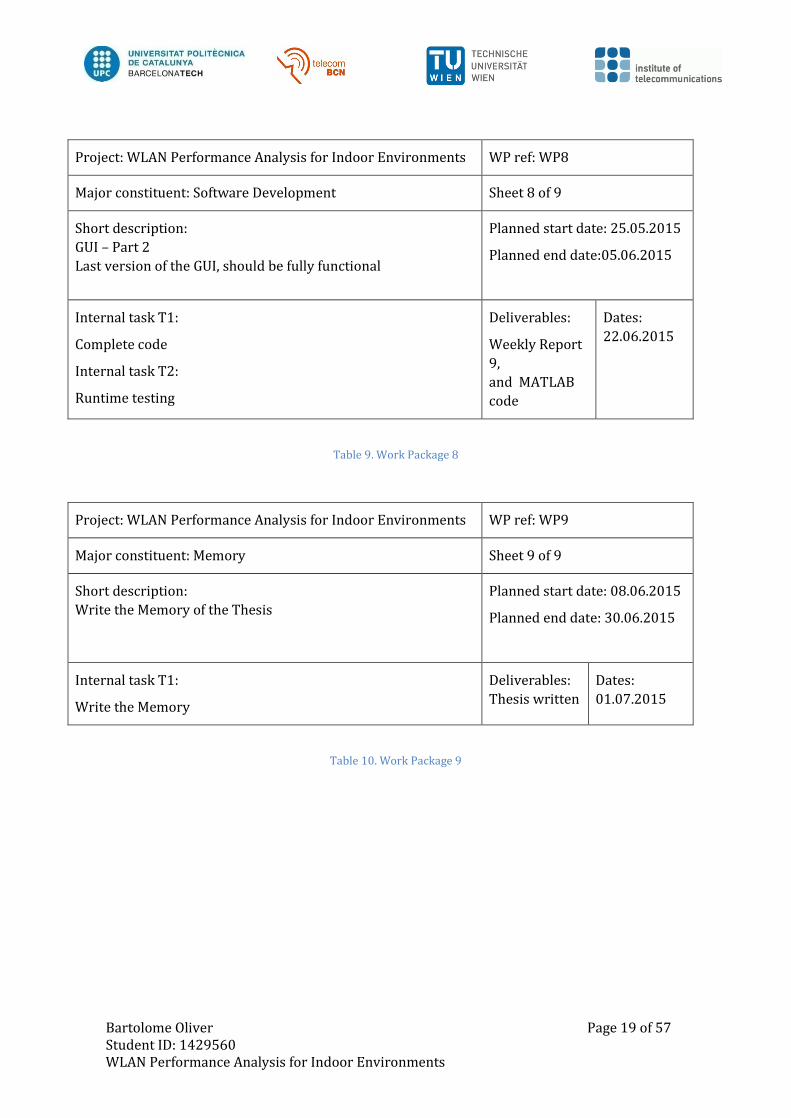
Project: WLAN Performance Analysis for Indoor Environments WP ref: WP8
Major constituent: Software Development Sheet 8 of 9
Short description:
GUI – Part 2
Last version of the GUI, should be fully functional
Planned start date: 25.05.2015
Planned end date:05.06.2015
Internal task T1:
Complete code
Internal task T2:
Runtime testing
Deliverables:
Weekly Report
9,
and MATLAB
code
Dates:
22.06.2015
Table 9. Work Package 8
Project: WLAN Performance Analysis for Indoor Environments WP ref: WP9
Major constituent: Memory Sheet 9 of 9
Short description:
Write the Memory of the Thesis
Planned start date: 08.06.2015
Planned end date: 30.06.2015
Internal task T1:
Write the Memory
Deliverables:
Thesis written
Dates:
01.07.2015
Table 10. Work Package 9
Bartolome Oliver Page 20 of 57 Student ID: 1429560 WLAN Performance Analysis for Indoor Environments
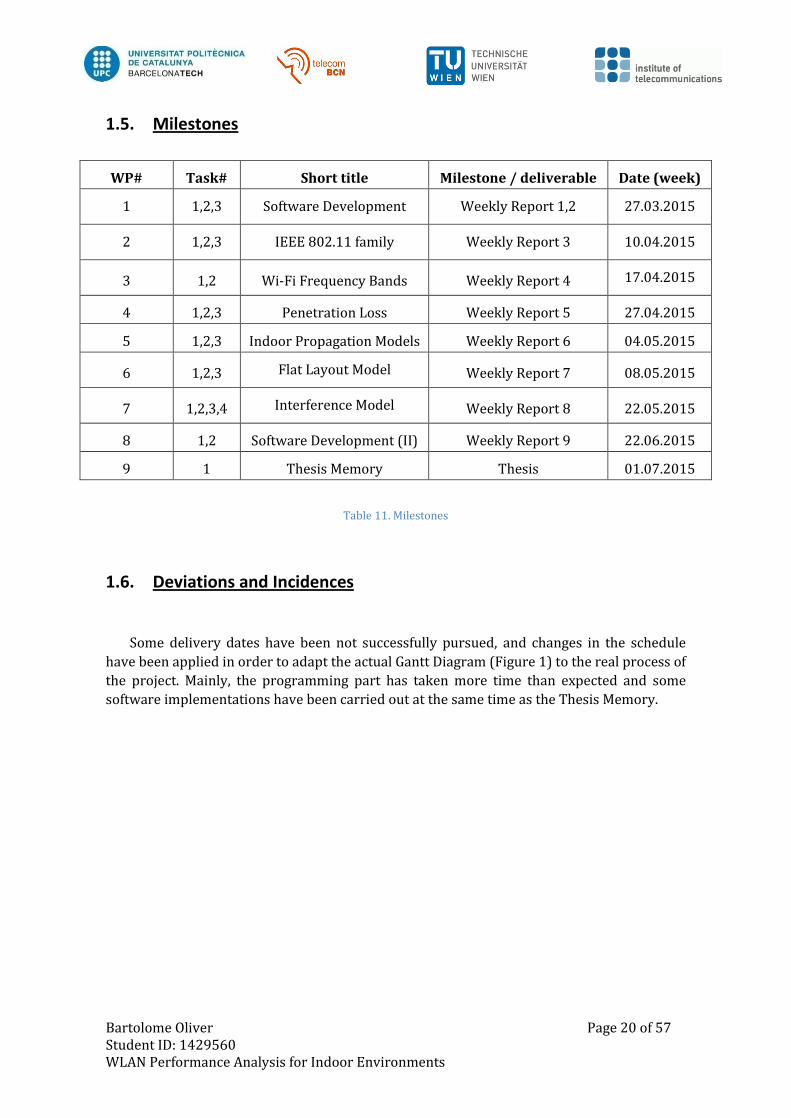
1.5. Milestones
WP# Task# Short title Milestone / deliverable Date (week)
1 1,2,3 Software Development Weekly Report 1,2 27.03.2015
2 1,2,3 IEEE 802.11 family Weekly Report 3 10.04.2015
3 1,2 Wi-Fi Frequency Bands Weekly Report 4 17.04.2015
4 1,2,3 Penetration Loss Weekly Report 5 27.04.2015
5 1,2,3 Indoor Propagation Models Weekly Report 6 04.05.2015
6 1,2,3 Flat Layout Model Weekly Report 7 08.05.2015
7 1,2,3,4 Interference Model Weekly Report 8 22.05.2015
8 1,2 Software Development (II) Weekly Report 9 22.06.2015
9 1 Thesis Memory Thesis 01.07.2015
Table 11. Milestones
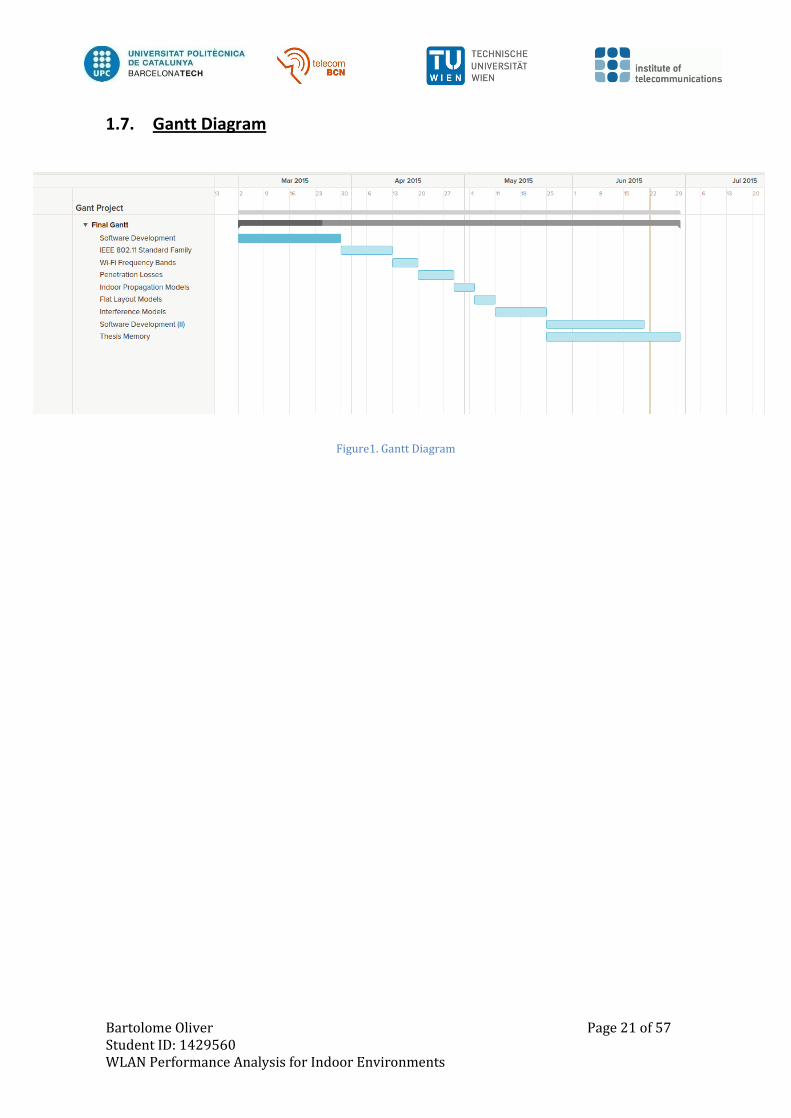
1.6. Deviations and Incidences
Some delivery dates have been not successfully pursued, and changes in the schedule
have been applied in order to adapt the actual Gantt Diagram (Figure 1) to the real process of
the project. Mainly, the programming part has taken more time than expected and some
software implementations have been carried out at the same time as the Thesis Memory.
Bartolome Oliver Page 21 of 57 Student ID: 1429560 WLAN Performance Analysis for Indoor Environments
1.7. Gantt Diagram
Figure1. Gantt Diagram
Bartolome Oliver Page 22 of 57 Student ID: 1429560 WLAN Performance Analysis for Indoor Environments
1.8. Motivation
The general motivation for carrying out this project is the important role that the
wireless networks (especially the WLAN and femtocells) will play during the next years.
Revising the Cisco Visual Networking Index (Cisco VNI) 2015 [1], there are some interesting
statistics about the Mobile network in 2014 that shed light on the importance that the mobile
networks have nowadays, and will have in the future:
Global mobile data traffic grew 69, from 1.5 Exabytes per month to 2.5.
In 2014, mobile data traffic was approximately 30 times the size of the entire global
Internet in 200
Mobile network (cellular) connection speeds grew 20 per cent in 2014.
There were 189 million laptops on the mobile network in 2014, and each laptop
generated 3.2 times more traffic than the average smartphone.
Globally, 46 per cent of total mobile data traffic was offloaded onto the fixed network
through Wi-Fi or femtocell in 2014.
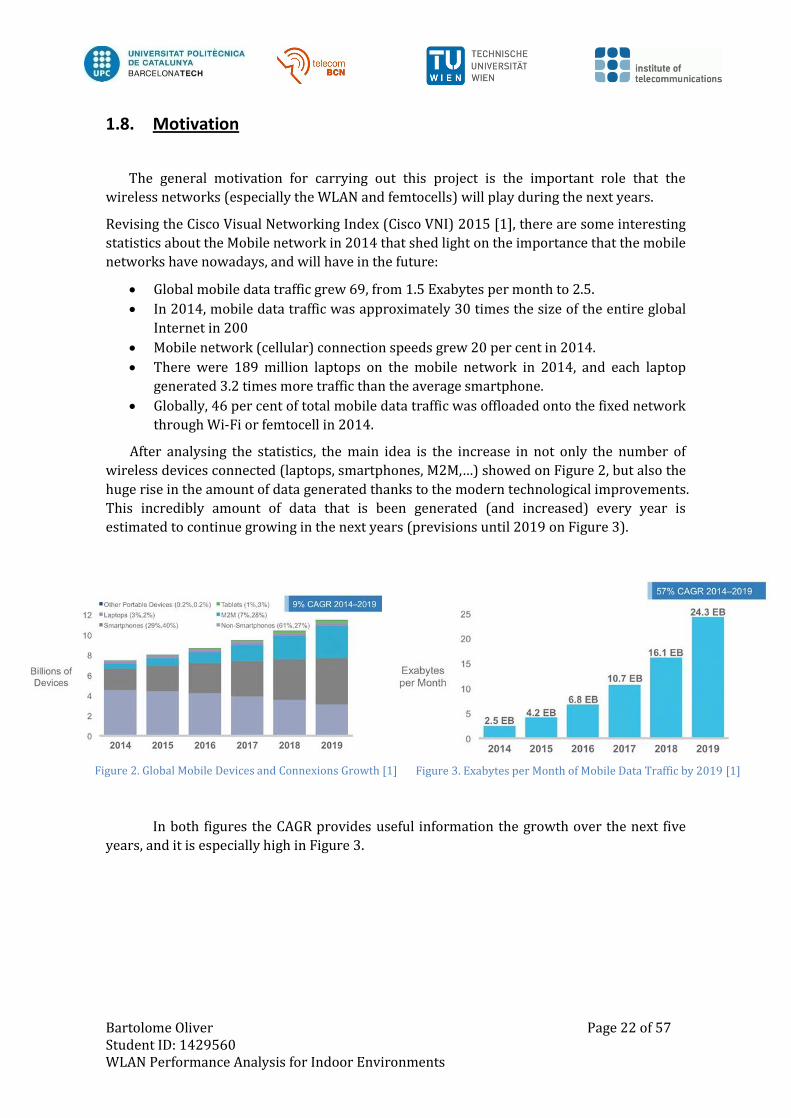
After analysing the statistics, the main idea is the increase in not only the number of
wireless devices connected (laptops, smartphones, M2M,…) showed on Figure 2, but also the
huge rise in the amount of data generated thanks to the modern technological improvements.
This incredibly amount of data that is been generated (and increased) every year is
estimated to continue growing in the next years (previsions until 2019 on Figure 3).
In both figures the CAGR provides useful information the growth over the next five
years, and it is especially high in Figure 3.
Figure 2. Global Mobile Devices and Connexions Growth [1] Figure 3. Exabytes per Month of Mobile Data Traffic by 2019 [1]

Bartolome Oliver Page 23 of 57 Student ID: 1429560 WLAN Performance Analysis for Indoor Environments
But the part of this phenomenon where this project is more focused on is the amount
of data that will be specifically offloaded over the Wi-Fi networks. As an extension of Figure
2, the estimations in green of Figure 3 allow us to compare the Cellular Traffic with the
Offloaded over Wi-Fi and small cells:
The idea is to show not only the increase in the percentage of the Offload Traffic over
Wireless but also the high increase in the absolute values of Exabytes per Month, growing
from 1 Exabyte per month to approximately 25. Using this results it is impossible not to
admit the importance that the Mobile world, and specifically for us, the Wi-Fi related part
will have in the next years.
Due to these high expectations from wireless systems, the industry is focused on examining
the performance of WLAN and finding ways to understand more about actual UX in real
scenarios. These ambitions require the combination of theory with practice.
Trying to help on this purpose, the specific aim of this thesis is to provide a simulator able to
present the performance of WLAN´s in indoor environments, which is usually the bottle neck
of the full communication systems, with metrics such as maximum signal strength and
maximum achievable data rate.
This tool is intended to present these metrics with respect to user input regarding the
characteristics of the flat, the frequency band of operation and interference source(s).
Using this tool, researchers, companies and even individuals can carry out QoE analysis for a
certain WLAN. Companies can further use this data, in combination with actual
measurements and experiments, to improve the service they provide their customers over
WLAN.
Figure 4. Offload traffic from dual mode devices (excluding laptops)[1]
Bartolome Oliver Page 24 of 57 Student ID: 1429560 WLAN Performance Analysis for Indoor Environments
2. State of the art:
2.1. IEEE 802.11 Standard family
Introduction
The origins of most of the technology that nowadays we use started in the 19th
century, when the studies of scientists/engineers focused on the electrical field such as Ohm,
Faraday and Maxwell were applied to practical use in the telegraph [2], the first modern way
of communications.
Despite the fast improvements in this century, was in the 20th century when the great
progress was achieved; the discovers of people such as Bell, Edison, Lord Kelvin or Tesla
made electricity turned from a scientific curiosity into an essential tool for modern life,
inventions such as the radio communication systems, became a driving force of the Second
Industrial Revolution [3].
Continuing with this evolution, in the 21th century the development of Ethernet at Xerox Park
in 1973-1975 [4]or the first mobile phone (Motorola) in 1973 [5] showed how fast the
technology was improving, and the development of LAN started. Although the first WLAN
experiment using infrared links creating a local network in a factory was carried out by IBM
in 1979, this technology was not ready; and the LAN explosion began mainly thanks to the
important emergence of the PC’s around 1983.
In 1980 in order to create standards to integrate different technologies and make them
work together, the IEEE started working in the 802 family standards (at the same time that
the ISO carried out the OSI model) predicting that this first explosion of the technology could
last the next decades. There is also important mention that the FCC deregulated the band of
2.4-2.5 GHz giving chance to develop in this band in 1985. [6]
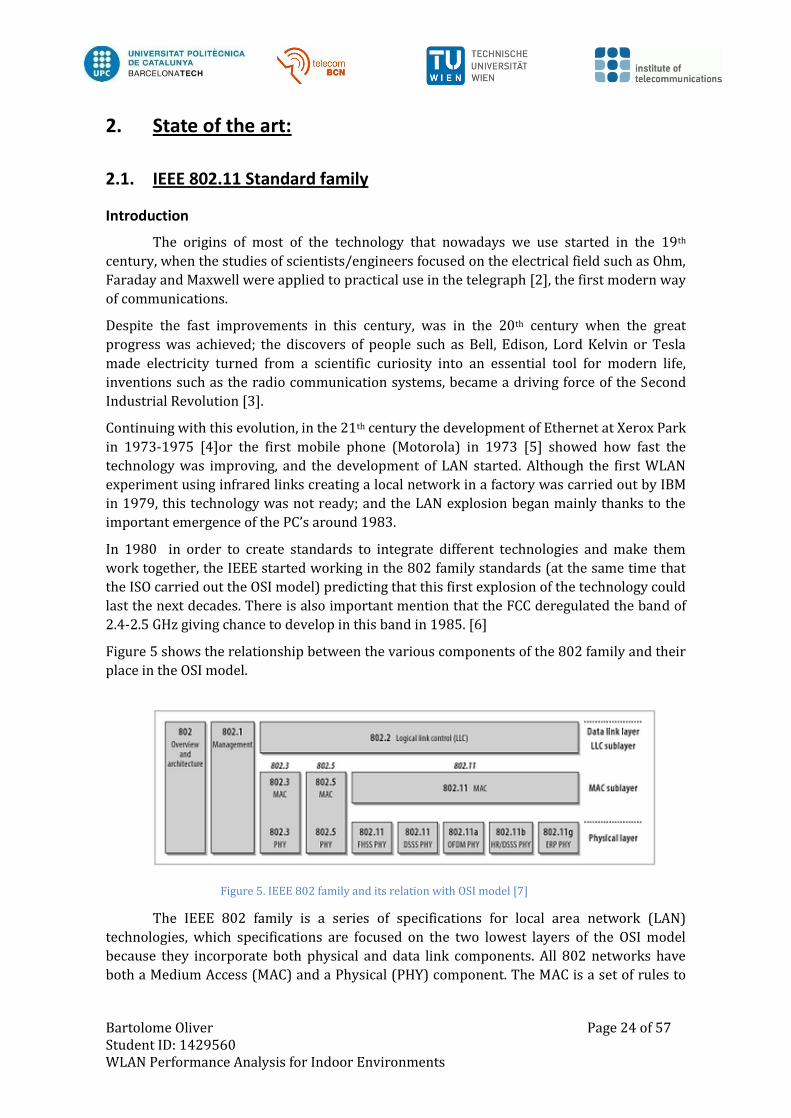
Figure 5 shows the relationship between the various components of the 802 family and their
place in the OSI model.
The IEEE 802 family is a series of specifications for local area network (LAN)
technologies, which specifications are focused on the two lowest layers of the OSI model
because they incorporate both physical and data link components. All 802 networks have
both a Medium Access (MAC) and a Physical (PHY) component. The MAC is a set of rules to
Figure 5. IEEE 802 family and its relation with OSI model [7]
Bartolome Oliver Page 25 of 57 Student ID: 1429560 WLAN Performance Analysis for Indoor Environments
determine how to access the medium and send data, but the details of transmission and
reception are left to the PHY. [7]
In 1997 after almost twenty years of development of wired LAN networks, the IEEE faced up
a new challenge predicting the incredible use of laptops, and after the smartphones. In that
moment, the IEEE 802.11 standard was born, aiming to provide a reliable, fast, inexpensive,
robust wireless solution that could grow into a standard with widespread acceptance, using
the regulated ISM band from 2.4-2.5 GHz [6]; it wanted to appear identically to wired LANs
and improve the performance in many ways [8]:
Mobility
Ease and speed of deployment
Flexibility
Cost
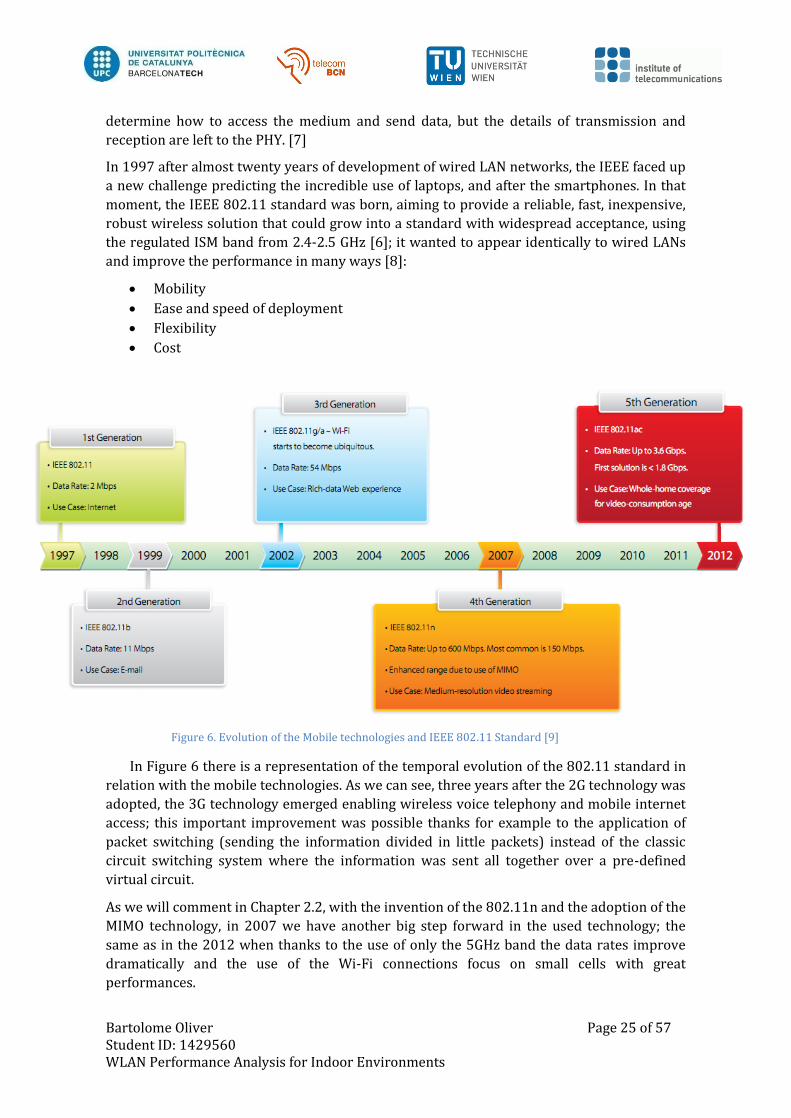
In Figure 6 there is a representation of the temporal evolution of the 802.11 standard in
relation with the mobile technologies. As we can see, three years after the 2G technology was
adopted, the 3G technology emerged enabling wireless voice telephony and mobile internet
access; this important improvement was possible thanks for example to the application of
packet switching (sending the information divided in little packets) instead of the classic
circuit switching system where the information was sent all together over a pre-defined
virtual circuit.
As we will comment in Chapter 2.2, with the invention of the 802.11n and the adoption of the
MIMO technology, in 2007 we have another big step forward in the used technology; the
same as in the 2012 when thanks to the use of only the 5GHz band the data rates improve
dramatically and the use of the Wi-Fi connections focus on small cells with great
performances.
Figure 6. Evolution of the Mobile technologies and IEEE 802.11 Standard [9]
Bartolome Oliver Page 26 of 57 Student ID: 1429560 WLAN Performance Analysis for Indoor Environments
History and evolution
In 1997 with the initial protocol 802.11 only one MAC sublayer and three PHY layers (IR, FHSS and DSSS) on both 1 and 2 Mbps on the ISM band [8] were available. Two years later the 802.11b was already prepared permitting speeds of 5.5 and 11 Mbps using also DSSS for interference mitigation. At that moment, companies started to use wireless networks as a standard part of operating, due to the reasonably-priced, ready to install 802.11b networks, and their data throughput that met the meager needs of the market at the time (11 Mbps by specification). Consequently that is how 802.11b ultimately dominated the business market for wireless, intra-office and intra-plant wireless data communications [6]. The creation of the Wi-Fi Alliance (WECA originally until 2002) enabled widespread adoption of Wi-Fi worldwide [6]. It appeared due to the interoperability that Early 802.11 products suffered [10] and their objective as a non-profit organization is not only to certify all 802.11-based products for interoperability (providing them with the logo showed in Figure 7) but also to promote the Wi-Fi technology as their Vision say: “Connecting everyone and everything, everywhere” Wi-Fi Alliance Vision [11].
The Wi-Fi Alliance creation along with the regulation of the 5 GHz band in some countries helped the 802.11a to born at the same time. Due to the new possibilities that this frequency band offered (explained in detail in the 2.3 Frequency Bands part) this new standard offered speeds until 54 Mbps using the new OFDM technique. When they discovered how beneficial could be to apply OFDM to the ISM band, in 2003 the 802.11g was ratified (using the CCK technique to ensure 802.11b compatibility). But recognizing the user’s need of BW and the evolution of 3G mobile generation to 4G by the appearance of smartphones, the 802.11n was launched in 2007 introducing the innovative MIMO and Channel Bonding techniques (for increasing bandwidths available and so data rates until 600 Mbps) at the same time that enabled backwards compatibilities with old standards. Years later, extending the interface concepts of the 802.11n it is launched the 802.11ac for the 5 GHz band, increasing the bandwidths and data rates available and improving the MIMO techniques to MU- MIMO; also the beamforming was introduced. Finally the future points to 802.11ax (HEW) among others as objective for year 2020, an extension of the 802.11ac improving x4 the speed thanks for example to wider channels and could permit stream even 8K videos. In Table 1 we can compare properties of the different 802.11 standards family.
Figure 7. Wi-Fi CERTIFIED™ logo [11]
Bartolome Oliver Page 27 of 57 Student ID: 1429560 WLAN Performance Analysis for Indoor Environments
IEEE 802.11 802.11b 802.11g 802.11n 802.11ac IEEE 802.11ax
Max Data Rate
for one stream
(Channel BW,
GI)
11 Mbps 54 Mbps
72.2 Mbps
(20 MHz, 400ns)
150 Mbps
(40 MHz, 400ns)
96.3 Mbps
(20 MHz, 400ns),
200 Mbps
(40 MHz, 400ns)
433.3 Mbps
(80 MHz, 400ns),
866.7 Mbps
(160 MHz, 400ns)
376.2 Mbps
(20 MHz, 400ns),
781.3 Mbps
(40 MHz, 400ns)
1.69 Gbps
(80 MHz, 400ns),
3.4 Gbps
(160 MHz, 400ns)
Frequency 2.4 GHz 2.4 GHz 2.4 , 5 GHZ 5 GHZ 5 GHz
MAC Protocol CSMA/CA CSMA/CA CSMA/CA CSMA/CA *
PHY Protocol DSSS OFDM/DSSS OFDM OFDM *
Channel Width 22 MHz 22 MHz 20 , 40 MHz 20, 40 , 80 , 160 MHz *
Modulation
(better
available)
DQPSK/DBPSK 64 QAM 64 QAM 256 QAM *
MIMO - - 4 x 4 8 x 8 (UL),
4 x 4 (DL, MU-MIMO) *
Table 12. Main properties for different 802.11 standards
*: some of the 802.11ax properties are not specified yet
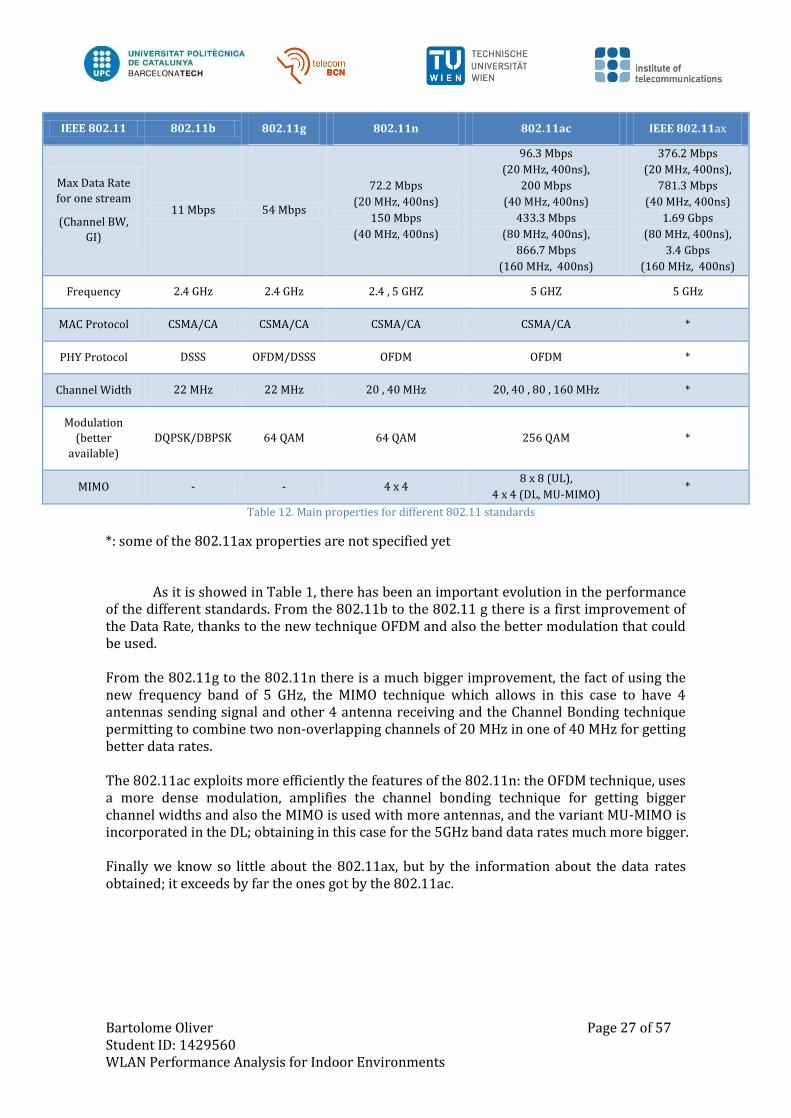
As it is showed in Table 1, there has been an important evolution in the performance
of the different standards. From the 802.11b to the 802.11 g there is a first improvement of the Data Rate, thanks to the new technique OFDM and also the better modulation that could be used. From the 802.11g to the 802.11n there is a much bigger improvement, the fact of using the new frequency band of 5 GHz, the MIMO technique which allows in this case to have 4 antennas sending signal and other 4 antenna receiving and the Channel Bonding technique permitting to combine two non-overlapping channels of 20 MHz in one of 40 MHz for getting better data rates. The 802.11ac exploits more efficiently the features of the 802.11n: the OFDM technique, uses a more dense modulation, amplifies the channel bonding technique for getting bigger channel widths and also the MIMO is used with more antennas, and the variant MU-MIMO is incorporated in the DL; obtaining in this case for the 5GHz band data rates much more bigger. Finally we know so little about the 802.11ax, but by the information about the data rates obtained; it exceeds by far the ones got by the 802.11ac.
Bartolome Oliver Page 28 of 57 Student ID: 1429560 WLAN Performance Analysis for Indoor Environments
2.2. Frequency Bands
By law, the relation between the standard 802.11 and the frequency bands is direct,
without a deregulated frequency band there is no possibility to create a standard working on
these frequencies.
That is why in 1985, the FCC deregulated the spectrum from 2.4 GHz – 2.5 GHz for the ISM
communities [6]. Almost fifteen years later the first version of 802.11 was working on that
band, the same happened with the 5 GHz band some years later, and actually the majority of
the versions of the standard 802 are working on these two bands.
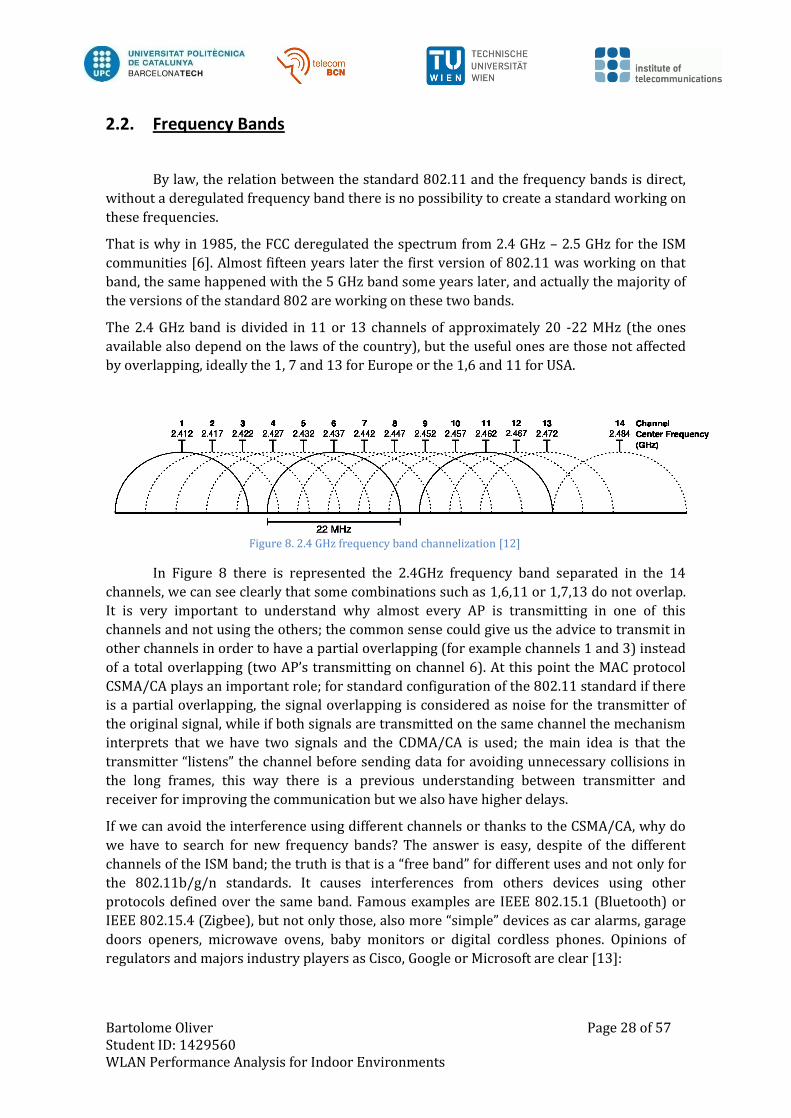
The 2.4 GHz band is divided in 11 or 13 channels of approximately 20 -22 MHz (the ones
available also depend on the laws of the country), but the useful ones are those not affected
by overlapping, ideally the 1, 7 and 13 for Europe or the 1,6 and 11 for USA.
In Figure 8 there is represented the 2.4GHz frequency band separated in the 14
channels, we can see clearly that some combinations such as 1,6,11 or 1,7,13 do not overlap.
It is very important to understand why almost every AP is transmitting in one of this
channels and not using the others; the common sense could give us the advice to transmit in
other channels in order to have a partial overlapping (for example channels 1 and 3) instead
of a total overlapping (two AP’s transmitting on channel 6). At this point the MAC protocol
CSMA/CA plays an important role; for standard configuration of the 802.11 standard if there
is a partial overlapping, the signal overlapping is considered as noise for the transmitter of
the original signal, while if both signals are transmitted on the same channel the mechanism
interprets that we have two signals and the CDMA/CA is used; the main idea is that the
transmitter “listens” the channel before sending data for avoiding unnecessary collisions in
the long frames, this way there is a previous understanding between transmitter and
receiver for improving the communication but we also have higher delays.
If we can avoid the interference using different channels or thanks to the CSMA/CA, why do
we have to search for new frequency bands? The answer is easy, despite of the different
channels of the ISM band; the truth is that is a “free band” for different uses and not only for
the 802.11b/g/n standards. It causes interferences from others devices using other
protocols defined over the same band. Famous examples are IEEE 802.15.1 (Bluetooth) or
IEEE 802.15.4 (Zigbee), but not only those, also more “simple” devices as car alarms, garage
doors openers, microwave ovens, baby monitors or digital cordless phones. Opinions of
regulators and majors industry players as Cisco, Google or Microsoft are clear [13]:
Figure 8. 2.4 GHz frequency band channelization [12]
Bartolome Oliver Page 29 of 57 Student ID: 1429560 WLAN Performance Analysis for Indoor Environments
“Capacity constraints are already being felt in the 2.4GHz band”.
Comments of Cisco Systems, Inc., ET Docket No.13-49 (28 May 20013)
“2.4 GHz unlicensed spectrum “has become saturated” during certain times of day in heavily
trafficked areas such as city centre, apartment buildings and public events …”
Comments of Google, Inc. and Microsoft Corporation, ET Docket No. 13-49(May, 2013)
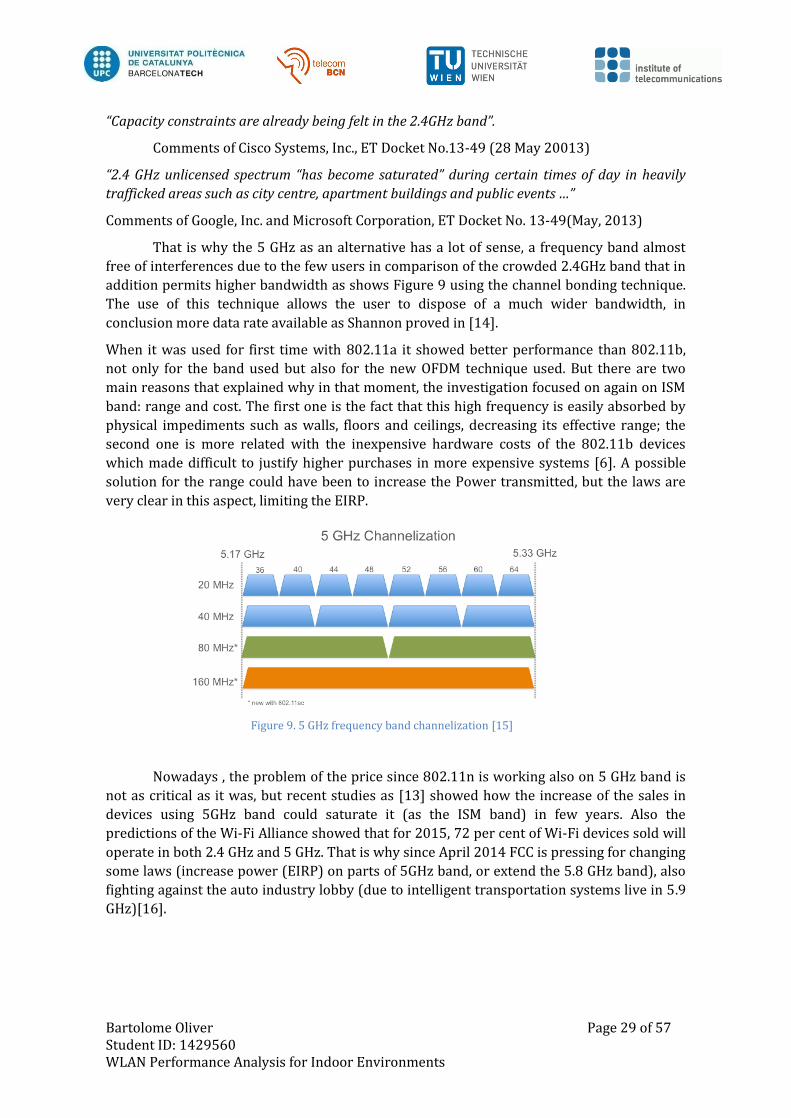
That is why the 5 GHz as an alternative has a lot of sense, a frequency band almost
free of interferences due to the few users in comparison of the crowded 2.4GHz band that in
addition permits higher bandwidth as shows Figure 9 using the channel bonding technique.
The use of this technique allows the user to dispose of a much wider bandwidth, in
conclusion more data rate available as Shannon proved in [14].
When it was used for first time with 802.11a it showed better performance than 802.11b,
not only for the band used but also for the new OFDM technique used. But there are two
main reasons that explained why in that moment, the investigation focused on again on ISM
band: range and cost. The first one is the fact that this high frequency is easily absorbed by
physical impediments such as walls, floors and ceilings, decreasing its effective range; the
second one is more related with the inexpensive hardware costs of the 802.11b devices
which made difficult to justify higher purchases in more expensive systems [6]. A possible
solution for the range could have been to increase the Power transmitted, but the laws are
very clear in this aspect, limiting the EIRP.
Nowadays , the problem of the price since 802.11n is working also on 5 GHz band is
not as critical as it was, but recent studies as [13] showed how the increase of the sales in
devices using 5GHz band could saturate it (as the ISM band) in few years. Also the
predictions of the Wi-Fi Alliance showed that for 2015, 72 per cent of Wi-Fi devices sold will
operate in both 2.4 GHz and 5 GHz. That is why since April 2014 FCC is pressing for changing
some laws (increase power (EIRP) on parts of 5GHz band, or extend the 5.8 GHz band), also
fighting against the auto industry lobby (due to intelligent transportation systems live in 5.9
GHz)[16].
Figure 9. 5 GHz frequency band channelization [15]
Bartolome Oliver Page 30 of 57 Student ID: 1429560 WLAN Performance Analysis for Indoor Environments
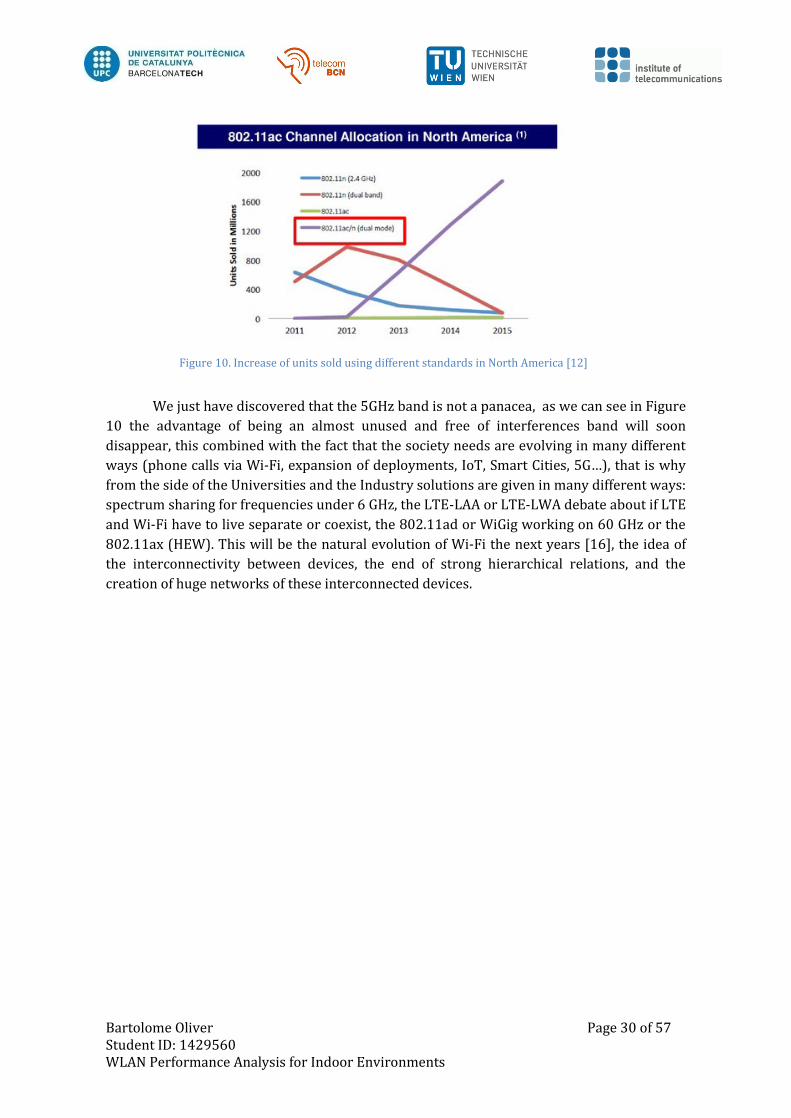
We just have discovered that the 5GHz band is not a panacea, as we can see in Figure
10 the advantage of being an almost unused and free of interferences band will soon
disappear, this combined with the fact that the society needs are evolving in many different
ways (phone calls via Wi-Fi, expansion of deployments, IoT, Smart Cities, 5G…), that is why
from the side of the Universities and the Industry solutions are given in many different ways:
spectrum sharing for frequencies under 6 GHz, the LTE-LAA or LTE-LWA debate about if LTE
and Wi-Fi have to live separate or coexist, the 802.11ad or WiGig working on 60 GHz or the
802.11ax (HEW). This will be the natural evolution of Wi-Fi the next years [16], the idea of
the interconnectivity between devices, the end of strong hierarchical relations, and the
creation of huge networks of these interconnected devices.
Figure 10. Increase of units sold using different standards in North America [12]
Bartolome Oliver Page 31 of 57 Student ID: 1429560 WLAN Performance Analysis for Indoor Environments
2.3. Indoor Propagation Models
Ideally for getting the optimal propagation model we should solve the Maxwell
equations (FDTD models) based on the information provided by the shape of the objects
present in the room/building. As this method would be computationally complex (almost
impossible), the deterministic models (based on Geometrical Optics) can be an alternative.
These models use the optical geometry and try to simulate the environment, based on the
information provided about the objects, the focus direction, the illumination…
Although the results obtained due to use these deterministic models are used to be
satisfactory, the amount of data required which means a high time cost does not compensate
us.
That is the reason why the empirical models (COST, ITU…) are a possible alternative. These
models are based in measures previously done and try to generate a pattern that can be
useful to fully define the event. However, these models are not complex enough to predict
instantaneous changes or specific signal variations, for this reason we would need the
deterministic models. The positive part is that the complexity required is much more
reduced, and number of input parameters is small compared with the previous model; that is
why the computational cost is in consequence also reduced [17].
In our study, focusing on indoor propagation models, we have analysed several different
Empirical models: The Free Space-Path Loss [18], the ITU-R P.1238-7 [19] and the different
models provided by the COST Project [20], which are the Linear Attenuation Model (LAM),
One-Slope Model (1SM) and the Multi-Wall Model (MWM). Others more complex models
such as the Multi-Wall Multi-Floor model or the Motley-Keenan model were out of our
purpose for their complexity and trade-off precision-computational cost could not be as good
as with the models provided here. Even though there are more empirical models that could
be useful apart of these as in [21] or [22], we have focused on the “classical ones”.
The more interesting ones are the ITU-R P.1238-7 and the MWM, the rest are too simple: the
Free-Space Path Loss is the basic structure for modelling the wireless system and the LAM or
the 1SM just simply add one additional parameter for modelling the others losses, which is
not enough complex for obtaining accurate results. The others, as mentioned, are outside our
study.
Some studies as [23] show a similar performance between the ITU-R P.1238-7 and the COST-
231 MWC for different scenarios, that is why for simplicity and computational time we have
chosen a modified version of the ITU model, due to we are interested in flat layout models
representing only one floor (considering only the losses due to walls and not to floors). That
is why we will focus on these two models in this Project.
The ITU-R P.1238 [19] models the Loss using as a parameters the frequency ( ), the distance
( ), the distance power loss coefficient ( ) and the penetration Loss factor ( ) which
depends on the frequency and the number of floors between the transmitter and receiver ( ).
There is important to mention that these parameters have been empirically found and also
Bartolome Oliver Page 32 of 57 Student ID: 1429560 WLAN Performance Analysis for Indoor Environments
say that must be greater than 1 meter for the validity of this model as we can see again in
[19].
Values used for this model are:
For our work bands (2.4 GHz and 5 GHz) we have this parameters based on various
measurement results found in [19]:
Power Loss Coefficient N:
Frequency (GHz) Residential Office
2.4 28 30
5 28 -30* 31
Table 13. Power Loss Coefficient for different environments and frequencies
*: depending on the materials used in the walls (concrete or wooden)
Floor penetration loss factors, (dB) with being the number of floors penetrated, for
indoor transmission loss calculation ( ≥ 1):
Frequency (GHz) Residential Office
2.4 5-10* 14
5 7-13* 16
Table 14. Floor Penetration Loss Factor for different environments and frequencies
*: depending on the materials used in the walls (5 or 7 for each wooden Wall, 10 or 13 for
each concrete wall)
The COST-231 Multi-Wall Model (MWM) [20], as it is showed in and
gives the path loss as the free space loss ( ) added with losses introduced
by the walls and floors penetrated by the direct path between the transmitter and the
receiver. This model considers different types of walls ( ) depending on their losses ( ,
penetration losses) but always the same type of floors (
). It has been observed
that the total floor loss is a non-linear function of the number of penetrated floors and it is
also mentioned in [24]. This is compensated by adding an empirical parameter b (usually
around 0.5). Also we have n as a power decay index and as a Loss constant. The multi-
wall model (MWM) can then be expressed in form:
Bartolome Oliver Page 33 of 57 Student ID: 1429560 WLAN Performance Analysis for Indoor Environments
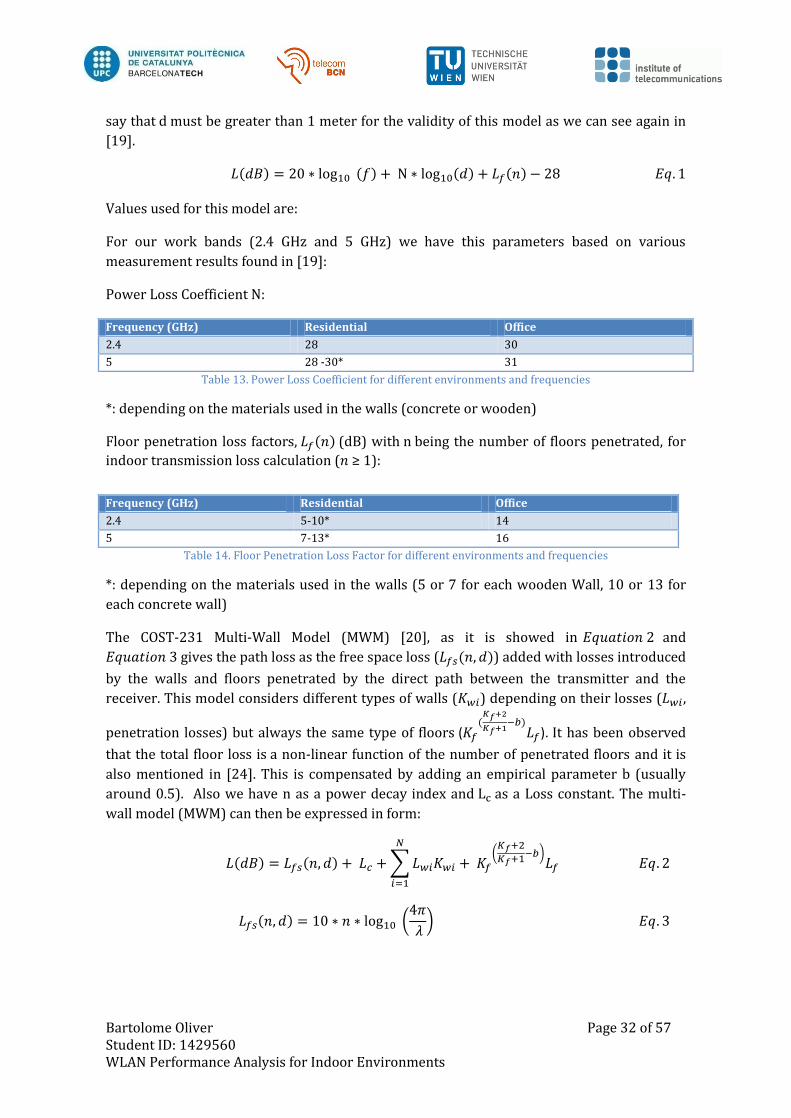
As it is shown in Figure 11, the MWM model considers the main propagation path
between transmitter (Tx) and receiver (Rx) and uses the number of walls penetrated for this
only path (in this case 3)in the calculations; the same would be done for the number of floors.
The only difference is that there can be different type of walls (mean with different losses)
but for the floors there has to be always the same losses. The model explained in [24]
extends this MWM model.
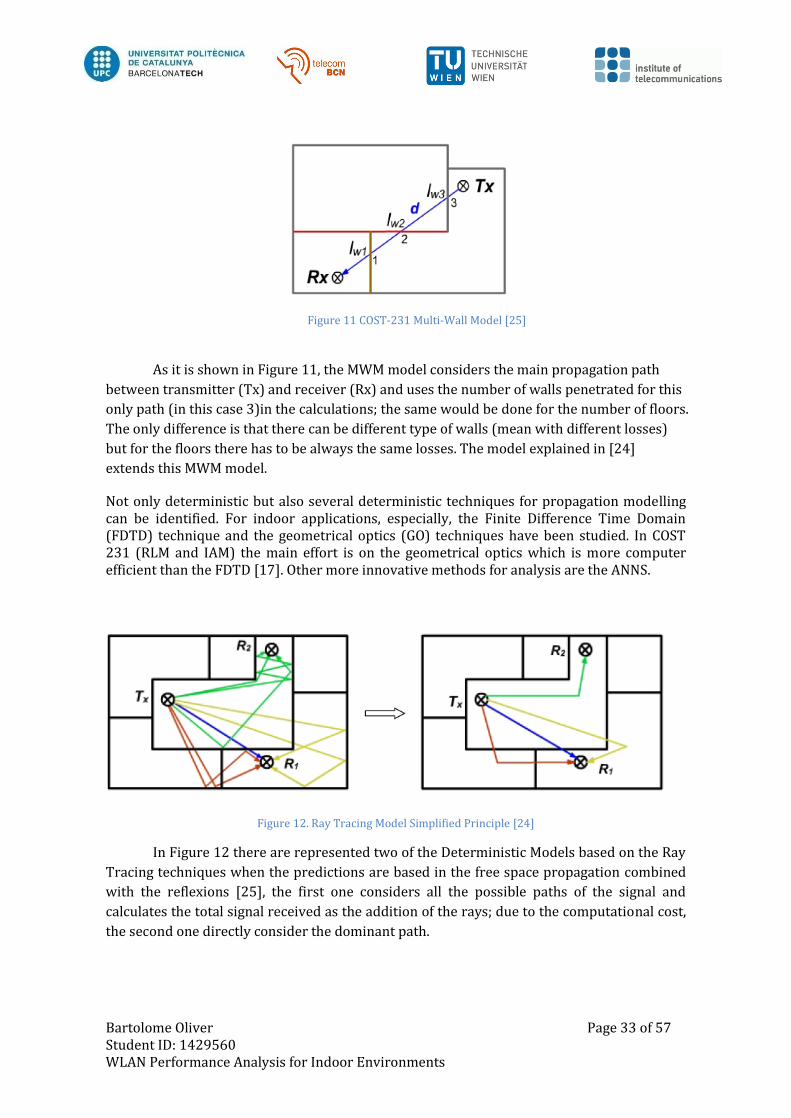
Not only deterministic but also several deterministic techniques for propagation modelling can be identified. For indoor applications, especially, the Finite Difference Time Domain (FDTD) technique and the geometrical optics (GO) techniques have been studied. In COST 231 (RLM and IAM) the main effort is on the geometrical optics which is more computer efficient than the FDTD [17]. Other more innovative methods for analysis are the ANNS.
Figure 12. Ray Tracing Model Simplified Principle [24]
In Figure 12 there are represented two of the Deterministic Models based on the Ray
Tracing techniques when the predictions are based in the free space propagation combined
with the reflexions [25], the first one considers all the possible paths of the signal and
calculates the total signal received as the addition of the rays; due to the computational cost,
the second one directly consider the dominant path.
Figure 11 COST-231 Multi-Wall Model [25]
Bartolome Oliver Page 34 of 57 Student ID: 1429560 WLAN Performance Analysis for Indoor Environments
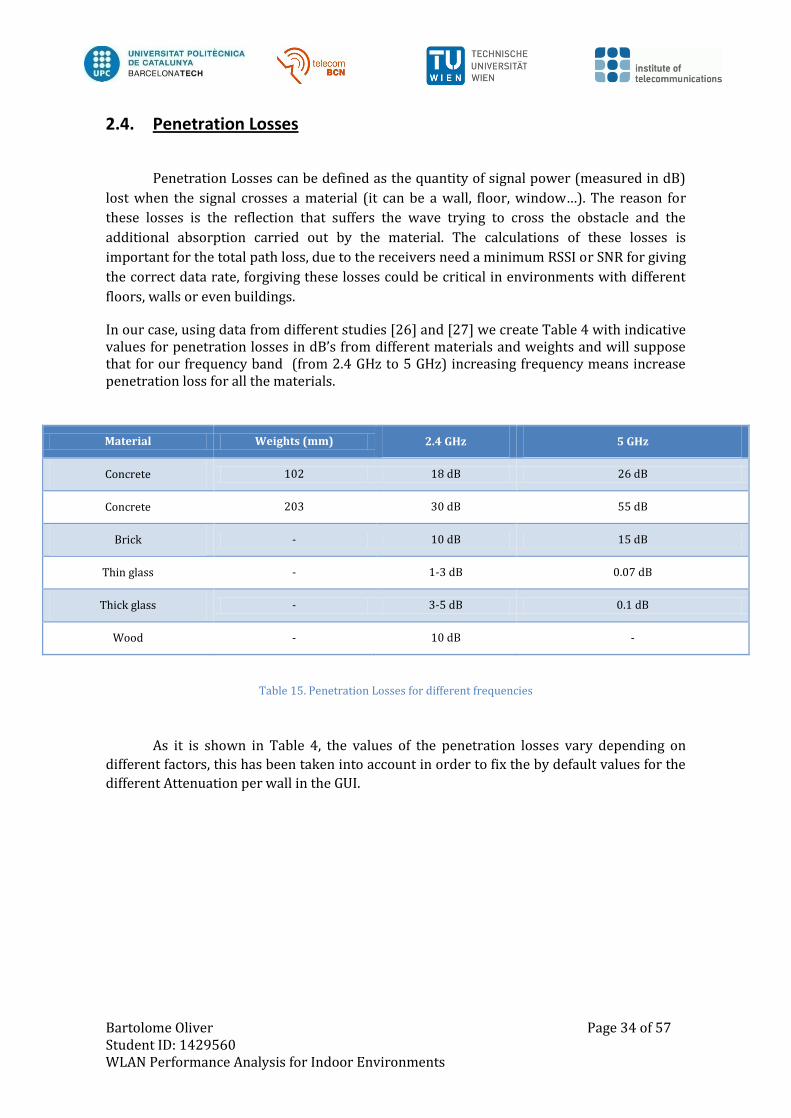
2.4. Penetration Losses
Penetration Losses can be defined as the quantity of signal power (measured in dB)
lost when the signal crosses a material (it can be a wall, floor, window…). The reason for
these losses is the reflection that suffers the wave trying to cross the obstacle and the
additional absorption carried out by the material. The calculations of these losses is
important for the total path loss, due to the receivers need a minimum RSSI or SNR for giving
the correct data rate, forgiving these losses could be critical in environments with different
floors, walls or even buildings.
In our case, using data from different studies [26] and [27] we create Table 4 with indicative values for penetration losses in dB’s from different materials and weights and will suppose that for our frequency band (from 2.4 GHz to 5 GHz) increasing frequency means increase penetration loss for all the materials.
Material Weights (mm) 2.4 GHz 5 GHz
Concrete 102 18 dB 26 dB
Concrete 203 30 dB 55 dB
Brick - 10 dB 15 dB
Thin glass - 1-3 dB 0.07 dB
Thick glass - 3-5 dB 0.1 dB
Wood - 10 dB -
Table 15. Penetration Losses for different frequencies
As it is shown in Table 4, the values of the penetration losses vary depending on
different factors, this has been taken into account in order to fix the by default values for the
different Attenuation per wall in the GUI.
Bartolome Oliver Page 35 of 57 Student ID: 1429560 WLAN Performance Analysis for Indoor Environments
2.5. Floorplan Generation
Some of the actual approaches to the realistic generation of floor plans for residential
buildings are tree maps algorithms [28] or Bayesian networks using real world data [29].
The idea behind these procedures is to find automated ways of generate layouts for real-time
applications in the most optimized way, asking the user or client just a few generic basic
parameters as inputs, and obtain easily the desired layout.
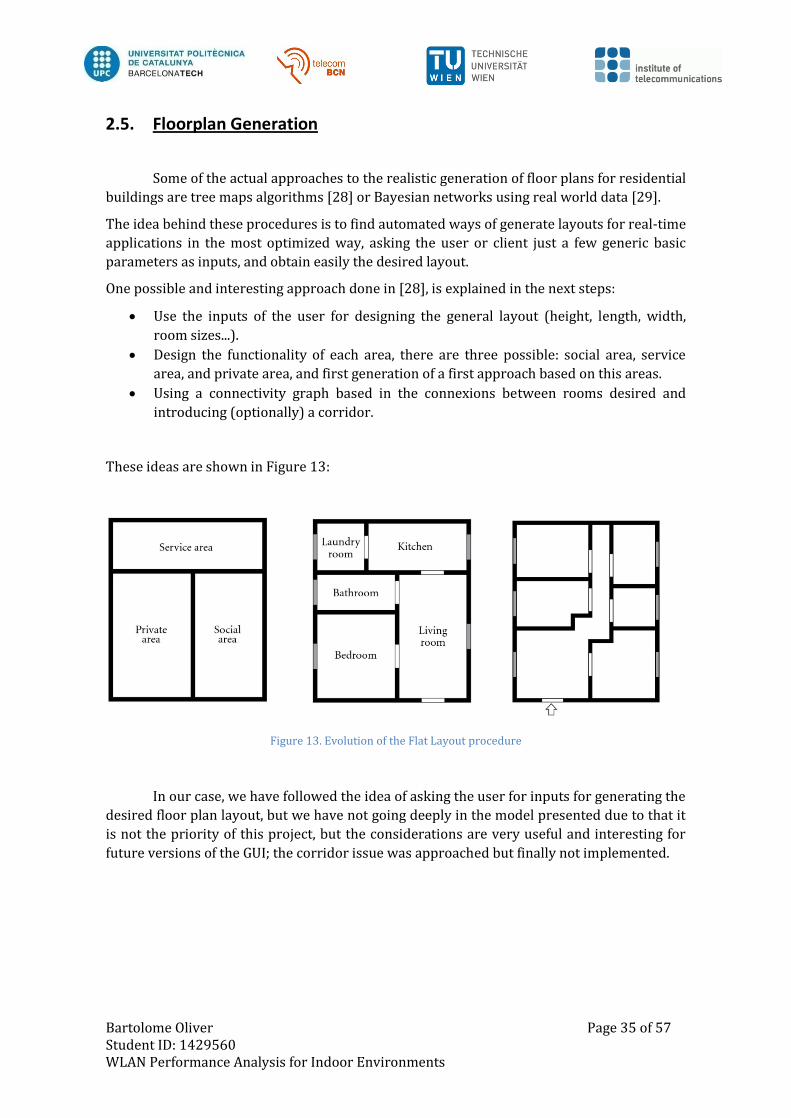
One possible and interesting approach done in [28], is explained in the next steps:
Use the inputs of the user for designing the general layout (height, length, width,
room sizes...).
Design the functionality of each area, there are three possible: social area, service
area, and private area, and first generation of a first approach based on this areas.
Using a connectivity graph based in the connexions between rooms desired and
introducing (optionally) a corridor.
These ideas are shown in Figure 13:
Figure 13. Evolution of the Flat Layout procedure
In our case, we have followed the idea of asking the user for inputs for generating the
desired floor plan layout, but we have not going deeply in the model presented due to that it
is not the priority of this project, but the considerations are very useful and interesting for
future versions of the GUI; the corridor issue was approached but finally not implemented.
Bartolome Oliver Page 36 of 57 Student ID: 1429560 WLAN Performance Analysis for Indoor Environments
3. Project Development:
In this chapter it will be explained how the theory detailed in Chapter 2 has been
used in the creation of the GUI using the GUIDE [30] tool of MATLAB.
3.1. Graphical User Interface (GUI)
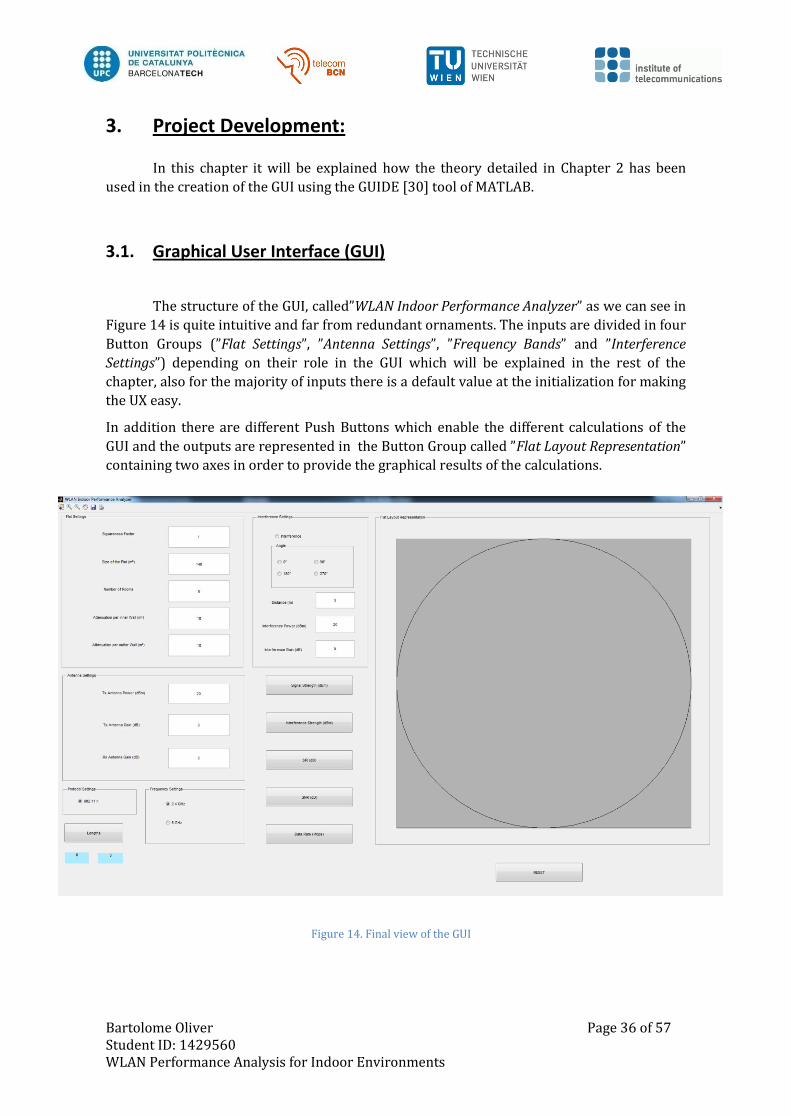
The structure of the GUI, called”WLAN Indoor Performance Analyzer” as we can see in
Figure 14 is quite intuitive and far from redundant ornaments. The inputs are divided in four
Button Groups (”Flat Settings”, ”Antenna Settings”, ”Frequency Bands” and ”Interference
Settings”) depending on their role in the GUI which will be explained in the rest of the
chapter, also for the majority of inputs there is a default value at the initialization for making
the UX easy.
In addition there are different Push Buttons which enable the different calculations of the
GUI and the outputs are represented in the Button Group called ”Flat Layout Representation”
containing two axes in order to provide the graphical results of the calculations.
Figure 14. Final view of the GUI
Bartolome Oliver Page 37 of 57 Student ID: 1429560 WLAN Performance Analysis for Indoor Environments
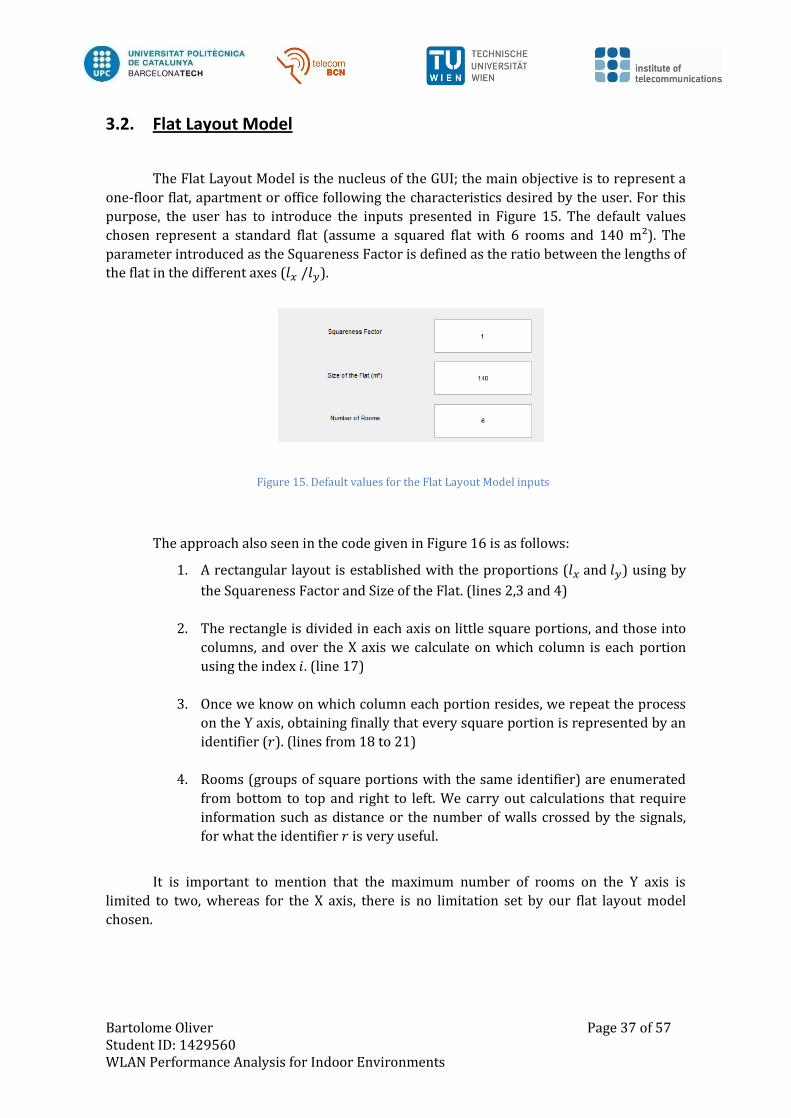
3.2. Flat Layout Model
The Flat Layout Model is the nucleus of the GUI; the main objective is to represent a
one-floor flat, apartment or office following the characteristics desired by the user. For this
purpose, the user has to introduce the inputs presented in Figure 15. The default values
chosen represent a standard flat (assume a squared flat with 6 rooms and 140 m²). The
parameter introduced as the Squareness Factor is defined as the ratio between the lengths of
the flat in the different axes ( ).
The approach also seen in the code given in Figure 16 is as follows:
1. A rectangular layout is established with the proportions ( and ) using by
the Squareness Factor and Size of the Flat. (lines 2,3 and 4)
2. The rectangle is divided in each axis on little square portions, and those into
columns, and over the X axis we calculate on which column is each portion
using the index . (line 17)
3. Once we know on which column each portion resides, we repeat the process
on the Y axis, obtaining finally that every square portion is represented by an
identifier ( ). (lines from 18 to 21)
4. Rooms (groups of square portions with the same identifier) are enumerated
from bottom to top and right to left. We carry out calculations that require
information such as distance or the number of walls crossed by the signals,
for what the identifier is very useful.
It is important to mention that the maximum number of rooms on the Y axis is
limited to two, whereas for the X axis, there is no limitation set by our flat layout model
chosen.
Figure 15. Default values for the Flat Layout Model inputs
Bartolome Oliver Page 38 of 57 Student ID: 1429560 WLAN Performance Analysis for Indoor Environments
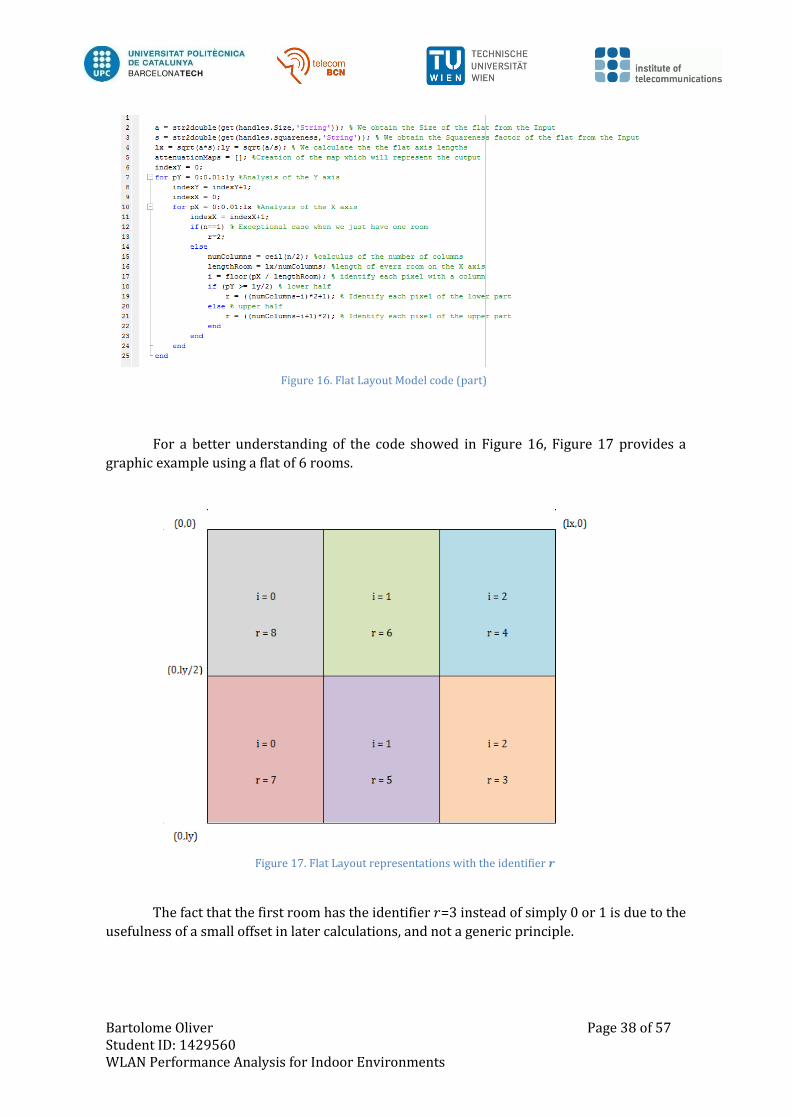
For a better understanding of the code showed in Figure 16, Figure 17 provides a
graphic example using a flat of 6 rooms.
The fact that the first room has the identifier =3 instead of simply 0 or 1 is due to the
usefulness of a small offset in later calculations, and not a generic principle.
Figure 17. Flat Layout representations with the identifier
Figure 16. Flat Layout Model code (part)
Bartolome Oliver Page 39 of 57 Student ID: 1429560 WLAN Performance Analysis for Indoor Environments
3.3. Penetration Losses and Frequency
Another important area of research is the role played by the different walls that the
flat can have, in our case we have differentiated between the indoor and the outdoor walls.
The reasoning is that is realistic that the walls covering the flat from the outside to be wider
or fabricated with different materials more protective than the ones only separating rooms.
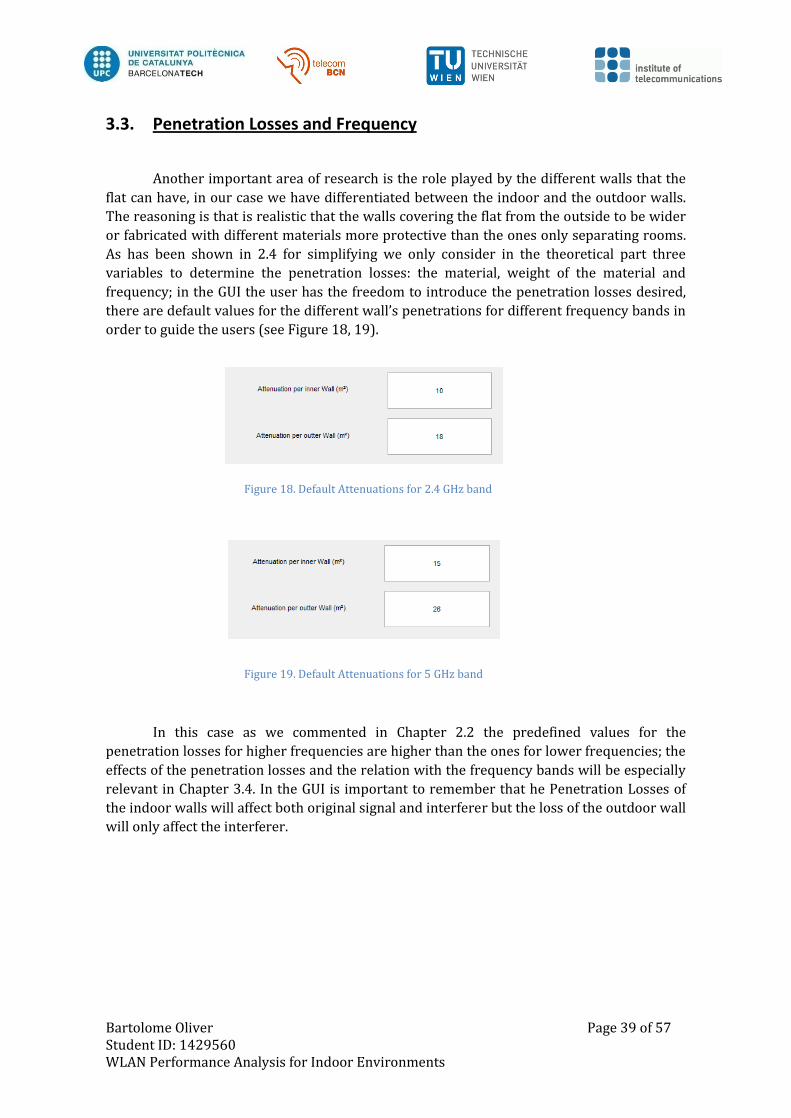
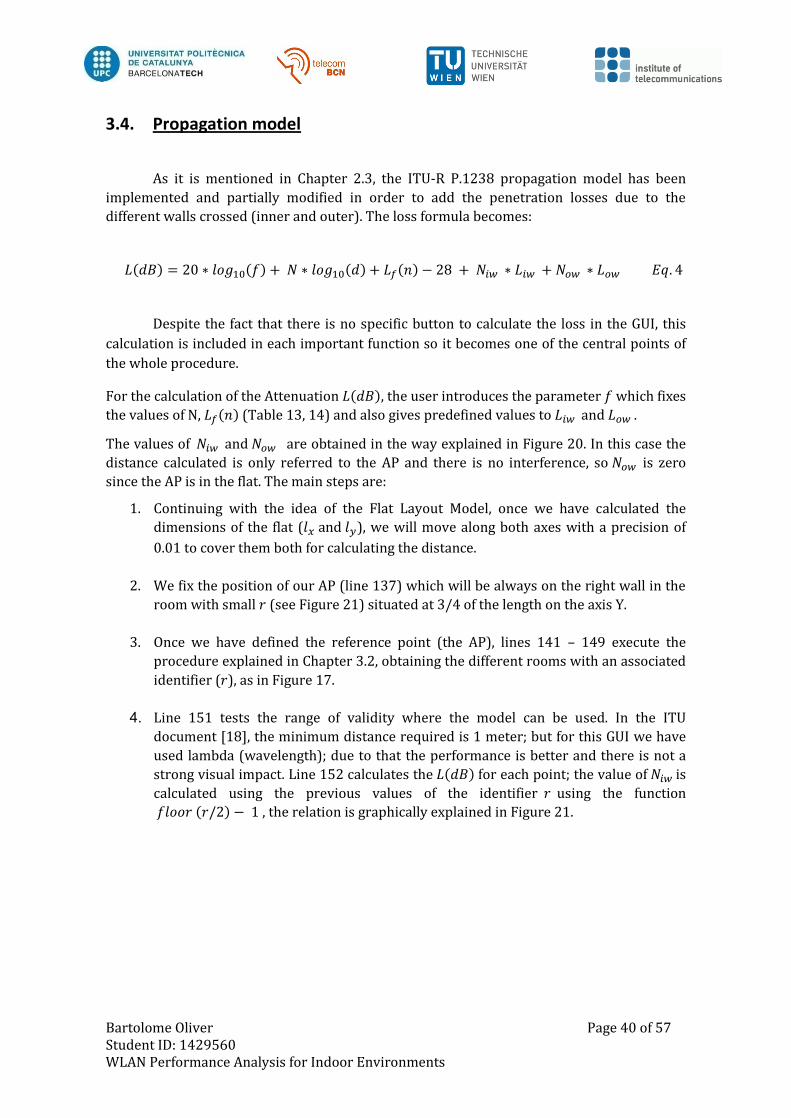
As has been shown in 2.4 for simplifying we only consider in the theoretical part three
variables to determine the penetration losses: the material, weight of the material and
frequency; in the GUI the user has the freedom to introduce the penetration losses desired,
there are default values for the different wall’s penetrations for different frequency bands in
order to guide the users (see Figure 18, 19).
In this case as we commented in Chapter 2.2 the predefined values for the
penetration losses for higher frequencies are higher than the ones for lower frequencies; the
effects of the penetration losses and the relation with the frequency bands will be especially
relevant in Chapter 3.4. In the GUI is important to remember that he Penetration Losses of
the indoor walls will affect both original signal and interferer but the loss of the outdoor wall
will only affect the interferer.
Figure 18. Default Attenuations for 2.4 GHz band
Figure 19. Default Attenuations for 5 GHz band
Bartolome Oliver Page 40 of 57 Student ID: 1429560 WLAN Performance Analysis for Indoor Environments
3.4. Propagation model
As it is mentioned in Chapter 2.3, the ITU-R P.1238 propagation model has been
implemented and partially modified in order to add the penetration losses due to the
different walls crossed (inner and outer). The loss formula becomes:
Despite the fact that there is no specific button to calculate the loss in the GUI, this
calculation is included in each important function so it becomes one of the central points of
the whole procedure.
For the calculation of the Attenuation , the user introduces the parameter which fixes
the values of , (Table 13, 14) and also gives predefined values to and .
The values of and are obtained in the way explained in Figure 20. In this case the
distance calculated is only referred to the AP and there is no interference, so is zero
since the AP is in the flat. The main steps are:
1. Continuing with the idea of the Flat Layout Model, once we have calculated the
dimensions of the flat ( and ), we will move along both axes with a precision of
0.01 to cover them both for calculating the distance.
2. We fix the position of our AP (line 137) which will be always on the right wall in the
room with small (see Figure 21) situated at 3/4 of the length on the axis Y.
3. Once we have defined the reference point (the AP), lines 141 – 149 execute the
procedure explained in Chapter 3.2, obtaining the different rooms with an associated
identifier ( ), as in Figure 17.
4. Line 151 tests the range of validity where the model can be used. In the ITU
document [18], the minimum distance required is 1 meter; but for this GUI we have
used lambda (wavelength); due to that the performance is better and there is not a
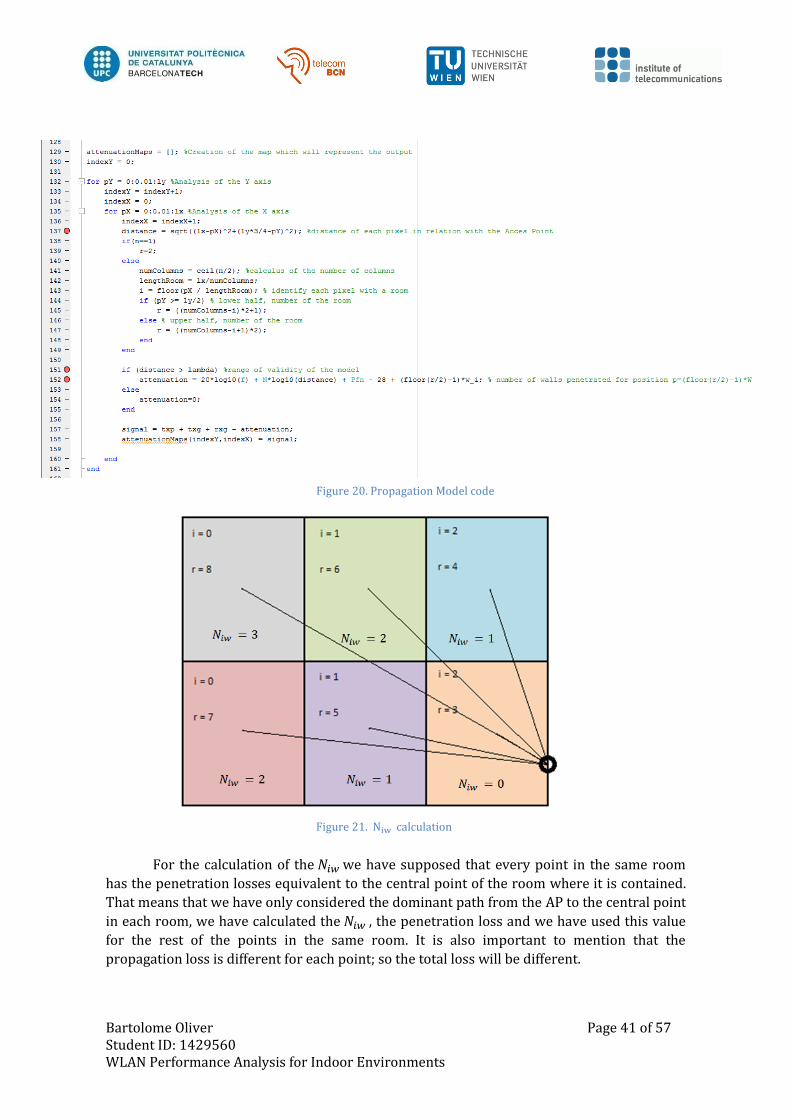
strong visual impact. Line 152 calculates the for each point; the value of is
calculated using the previous values of the identifier using the function
, the relation is graphically explained in Figure 21.
Bartolome Oliver Page 41 of 57 Student ID: 1429560 WLAN Performance Analysis for Indoor Environments
For the calculation of the we have supposed that every point in the same room
has the penetration losses equivalent to the central point of the room where it is contained.
That means that we have only considered the dominant path from the AP to the central point
in each room, we have calculated the , the penetration loss and we have used this value
for the rest of the points in the same room. It is also important to mention that the
propagation loss is different for each point; so the total loss will be different.
Figure 20. Propagation Model code
Figure 21. calculation
Bartolome Oliver Page 42 of 57 Student ID: 1429560 WLAN Performance Analysis for Indoor Environments
3.5. Interference
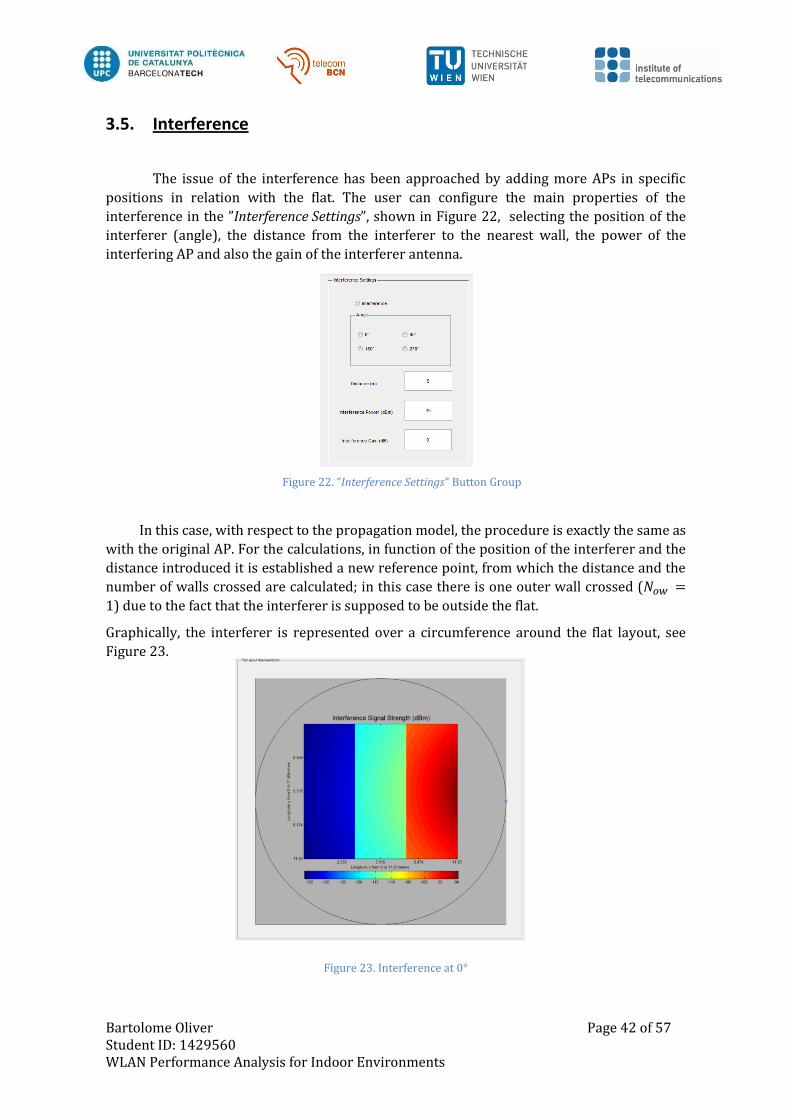
The issue of the interference has been approached by adding more APs in specific
positions in relation with the flat. The user can configure the main properties of the
interference in the ”Interference Settings”, shown in Figure 22, selecting the position of the
interferer (angle), the distance from the interferer to the nearest wall, the power of the
interfering AP and also the gain of the interferer antenna.
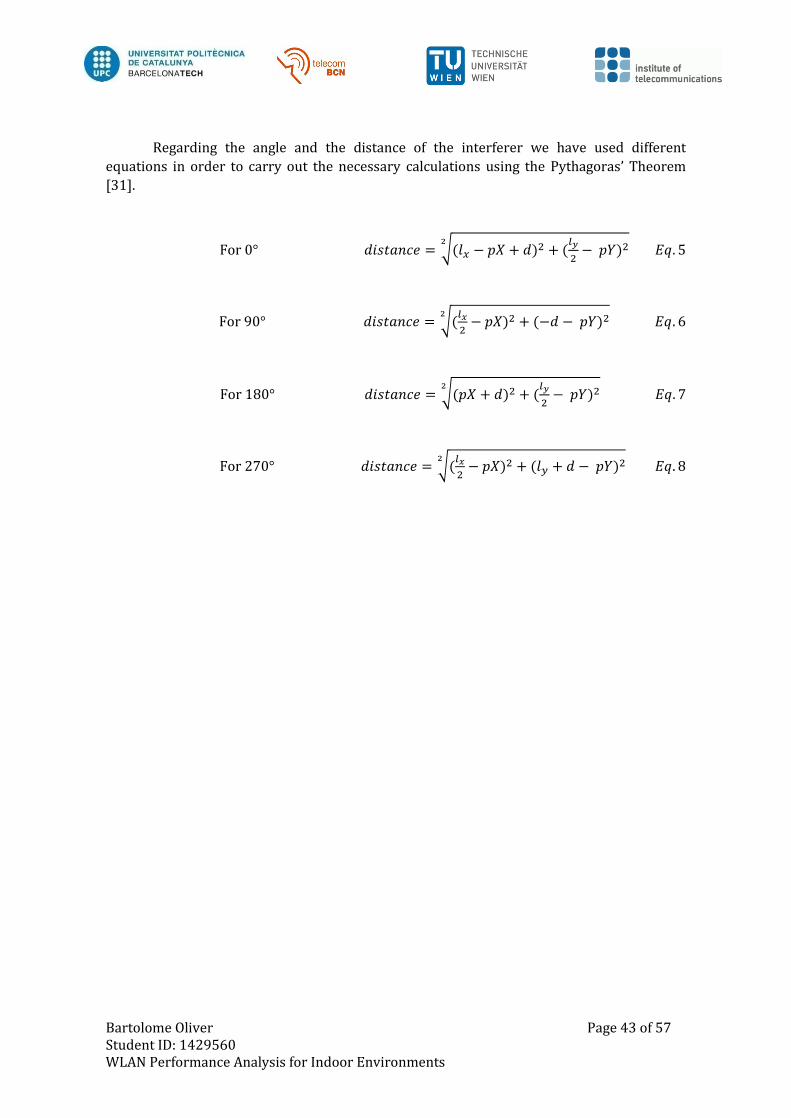
In this case, with respect to the propagation model, the procedure is exactly the same as
with the original AP. For the calculations, in function of the position of the interferer and the
distance introduced it is established a new reference point, from which the distance and the
number of walls crossed are calculated; in this case there is one outer wall crossed (
) due to the fact that the interferer is supposed to be outside the flat.
Graphically, the interferer is represented over a circumference around the flat layout, see
Figure 23.
Figure 23. Interference at 0°
Figure 22. ”Interference Settings” Button Group
Bartolome Oliver Page 43 of 57 Student ID: 1429560 WLAN Performance Analysis for Indoor Environments
Regarding the angle and the distance of the interferer we have used different
equations in order to carry out the necessary calculations using the Pythagoras’ Theorem
[31].
For 0°
For 90°
For 180°
For 270°
Bartolome Oliver Page 44 of 57 Student ID: 1429560 WLAN Performance Analysis for Indoor Environments
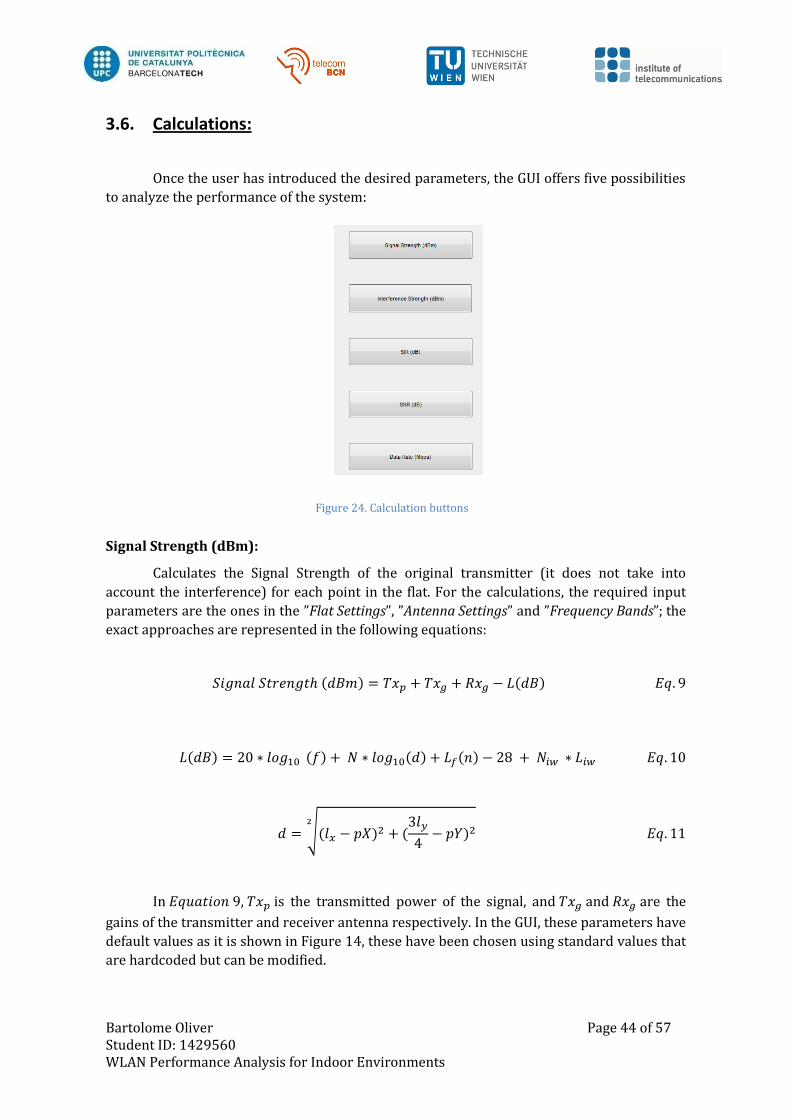
3.6. Calculations:
Once the user has introduced the desired parameters, the GUI offers five possibilities
to analyze the performance of the system:
Signal Strength (dBm):
Calculates the Signal Strength of the original transmitter (it does not take into
account the interference) for each point in the flat. For the calculations, the required input
parameters are the ones in the ”Flat Settings”, ”Antenna Settings” and ”Frequency Bands”; the
exact approaches are represented in the following equations:
In , is the transmitted power of the signal, and and are the
gains of the transmitter and receiver antenna respectively. In the GUI, these parameters have
default values as it is shown in Figure 14, these have been chosen using standard values that
are hardcoded but can be modified.
Figure 24. Calculation buttons
Bartolome Oliver Page 45 of 57 Student ID: 1429560 WLAN Performance Analysis for Indoor Environments
In and are the lengths of the flat over each axis and the indexes
and denote the position of the point considered in X and Y coordinates which are
incremented at each iteration; in our case the accuracy is 0.01.
Interference Strength (dBm):
Calculates the Signal Strength of the interfering transmitter (it does not take into
account the original transmitter) for each point in the flat. For the calculations, the required
input parameters are the ones in the Interference Settings button group; the exact
approaches are represented in the following equations:
In represents the transmitted power of the interference and the
gain of the interferer antenna. In this case for the distance ( ) we use one of the equations
(5-8) depending on the position of the interferer.
SIR (dB):
Calculates the ratio between the Signal Strength and the Interference Strength, the
higher the value of the SIR better is the environment for the communication.
Where is the received power from the transmitter and is the power received
from the interference.
In the GUI, the calculation is done in the following way:
Bartolome Oliver Page 46 of 57 Student ID: 1429560 WLAN Performance Analysis for Indoor Environments
SNR (dB):
Calculates the ratio between the Signal Strength and the Noise, the higher the value of
the SNR, the better the channel conditions are. In our GUI, we consider a value of -85 dBm, a
standard accepted value for the ISM band, as noise.
In the GUI, the calculation is done in the following way:
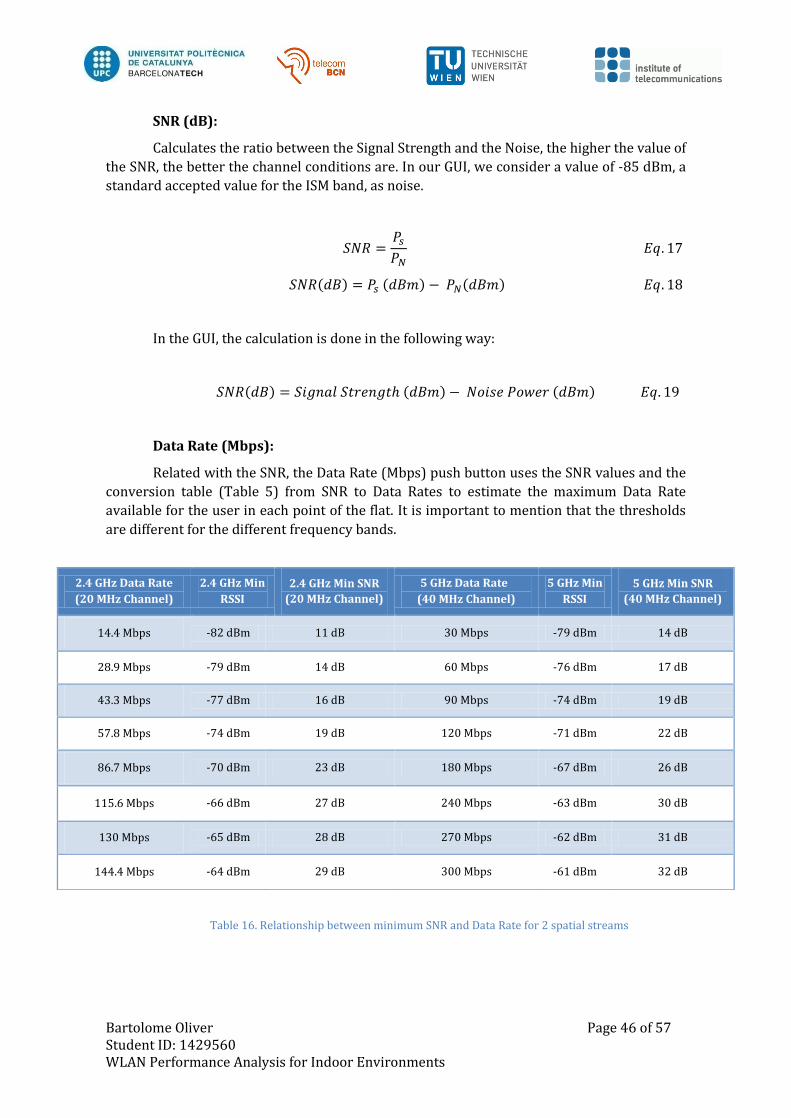
Data Rate (Mbps):
Related with the SNR, the Data Rate (Mbps) push button uses the SNR values and the
conversion table (Table 5) from SNR to Data Rates to estimate the maximum Data Rate
available for the user in each point of the flat. It is important to mention that the thresholds
are different for the different frequency bands.
Table 16. Relationship between minimum SNR and Data Rate for 2 spatial streams
2.4 GHz Data Rate
(20 MHz Channel)
2.4 GHz Min
RSSI
2.4 GHz Min SNR
(20 MHz Channel)
5 GHz Data Rate
(40 MHz Channel)
5 GHz Min
RSSI
5 GHz Min SNR
(40 MHz Channel)
14.4 Mbps -82 dBm 11 dB 30 Mbps -79 dBm 14 dB
28.9 Mbps -79 dBm 14 dB 60 Mbps -76 dBm 17 dB
43.3 Mbps -77 dBm 16 dB 90 Mbps -74 dBm 19 dB
57.8 Mbps -74 dBm 19 dB 120 Mbps -71 dBm 22 dB
86.7 Mbps -70 dBm 23 dB 180 Mbps -67 dBm 26 dB
115.6 Mbps -66 dBm 27 dB 240 Mbps -63 dBm 30 dB
130 Mbps -65 dBm 28 dB 270 Mbps -62 dBm 31 dB
144.4 Mbps -64 dBm 29 dB 300 Mbps -61 dBm 32 dB
Bartolome Oliver Page 47 of 57 Student ID: 1429560 WLAN Performance Analysis for Indoor Environments
3.7. Other considerations
The GUI also has certain features that are not essential to the functionality but
improve the UX:
Reset Push Button
Error Warnings
Save Button
Reset Push Button
A Reset Push Button has been designed in order to establish the initial parameters
shown in Figure 14 of the GUI again, avoiding having to close and open again the GUI for
carrying out new simulations. Pushing the Reset button means setting all fields to their
initial state.
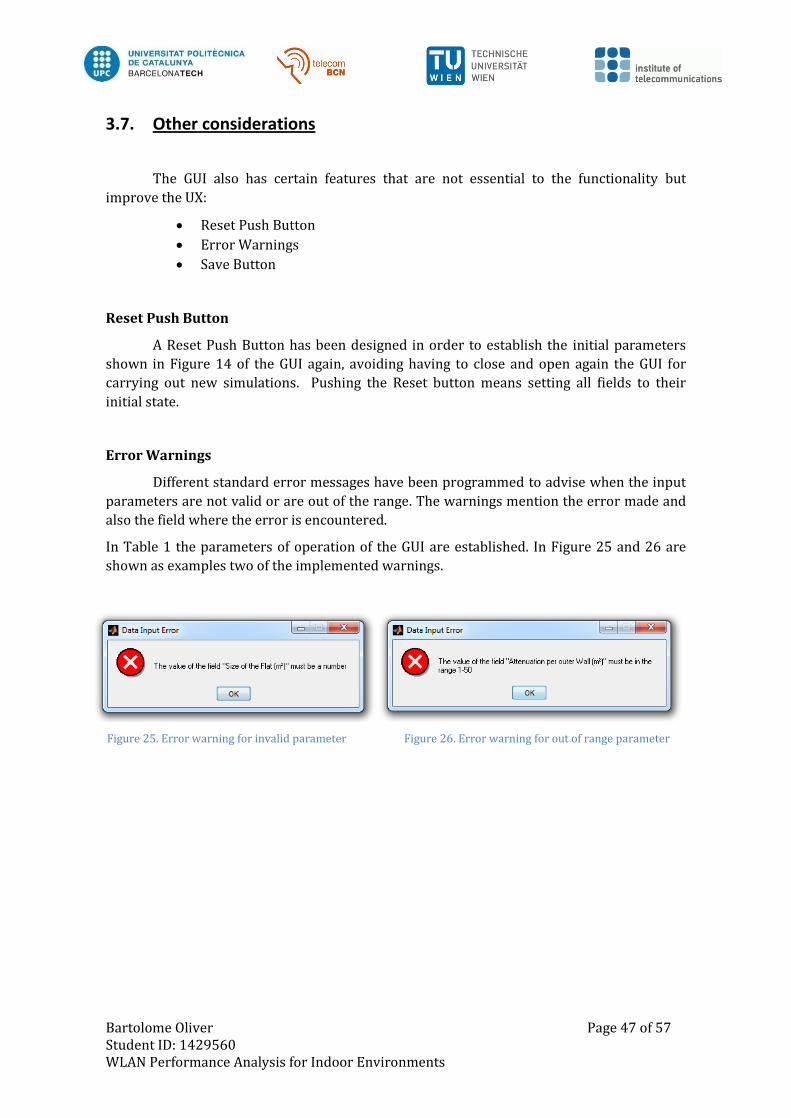
Error Warnings
Different standard error messages have been programmed to advise when the input
parameters are not valid or are out of the range. The warnings mention the error made and
also the field where the error is encountered.
In Table 1 the parameters of operation of the GUI are established. In Figure 25 and 26 are
shown as examples two of the implemented warnings.
Figure 25. Error warning for invalid parameter Figure 26. Error warning for out of range parameter
Bartolome Oliver Page 48 of 57 Student ID: 1429560 WLAN Performance Analysis for Indoor Environments
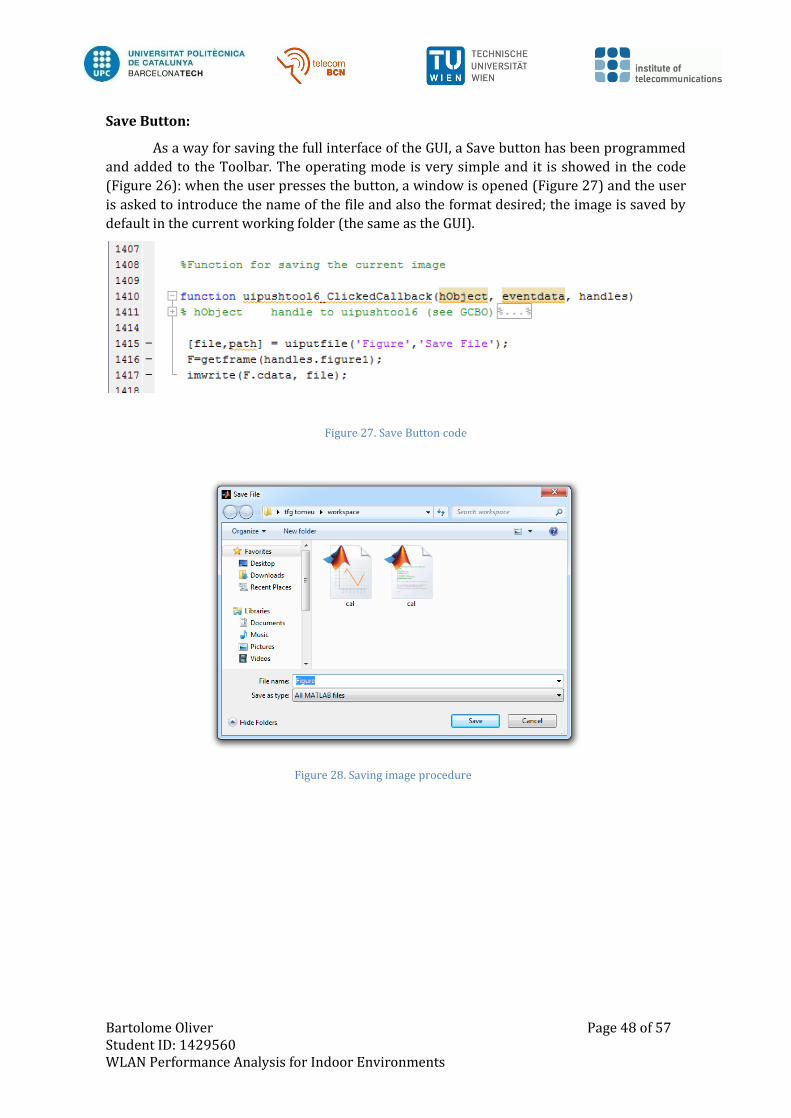
Save Button:
As a way for saving the full interface of the GUI, a Save button has been programmed
and added to the Toolbar. The operating mode is very simple and it is showed in the code
(Figure 26): when the user presses the button, a window is opened (Figure 27) and the user
is asked to introduce the name of the file and also the format desired; the image is saved by
default in the current working folder (the same as the GUI).
Figure 27. Save Button code
Figure 28. Saving image procedure
Bartolome Oliver Page 49 of 57 Student ID: 1429560 WLAN Performance Analysis for Indoor Environments
4. Results
Once the GUI is finished, we can observe the calculations for different input
parameters, the possible calculations are the ones in Figure 14 and previously mentioned.
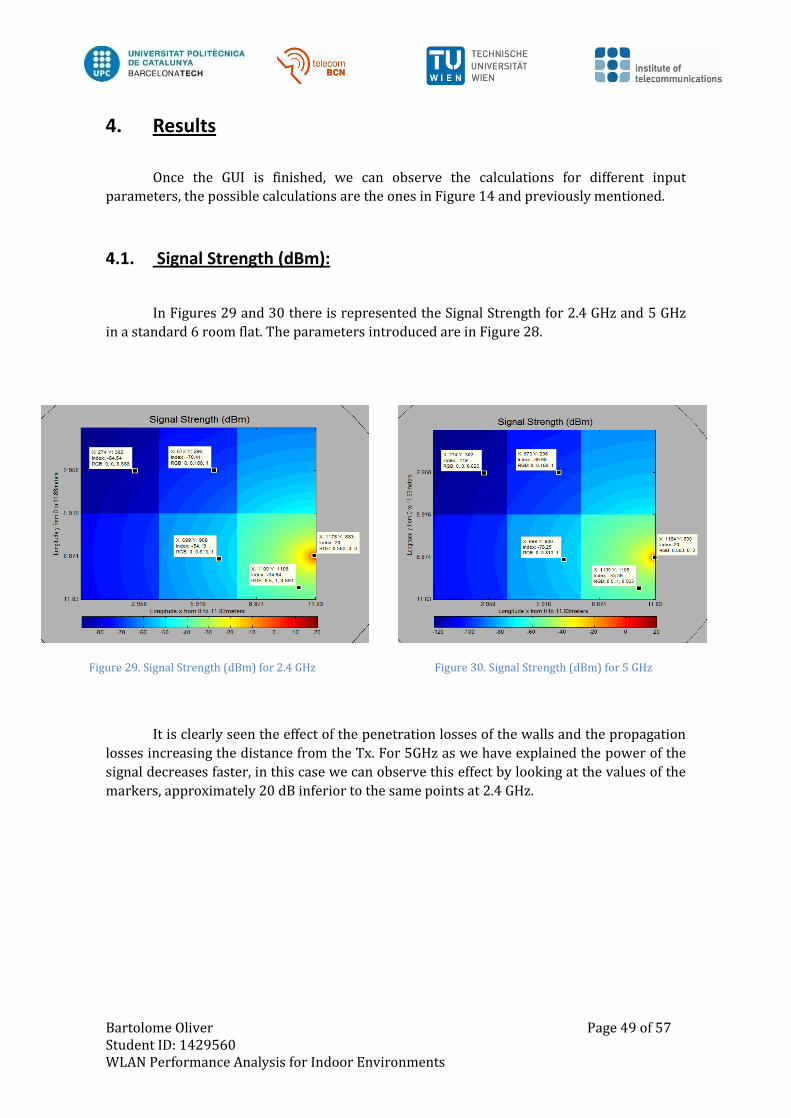
4.1. Signal Strength (dBm):
In Figures 29 and 30 there is represented the Signal Strength for 2.4 GHz and 5 GHz
in a standard 6 room flat. The parameters introduced are in Figure 28.
It is clearly seen the effect of the penetration losses of the walls and the propagation
losses increasing the distance from the Tx. For 5GHz as we have explained the power of the
signal decreases faster, in this case we can observe this effect by looking at the values of the
markers, approximately 20 dB inferior to the same points at 2.4 GHz.
Figure 29. Signal Strength (dBm) for 2.4 GHz
Figure 30. Signal Strength (dBm) for 5 GHz
Bartolome Oliver Page 50 of 57 Student ID: 1429560 WLAN Performance Analysis for Indoor Environments
4.2. Interference Strength (dBm):
In this case, the remarkable part is the different positions where the interfering Tx
can be situated; and also the effect of the distance respect to the flat.
In Figures 31 and 32 there are represented two interferences over different flat
layouts at 5GHz. The default value for the distance parameter is 5 meters; that explains why
the maximum power of the interference when it arrives to the flat is about -90 dBm (it has to
be considered the 5 first meter propagation loss from the source and 30 dB for the outer
wall).
In Figures 33 and 34 there is represented an interference with the same parameters except
the distance to the flat, is easy to appreciate the difference on the maximum value for the
interference power, higher when the interference is closer to the flat.
Figure 31. Interference at 0° over an 8 room flat of 200 m²
Figure 32. Interference at 180° over a 5 room flat of 300 m²
Figure 33. Interference at 5 meter distance and 270°
Figure 34. Interference at 1 meter distance and 270°
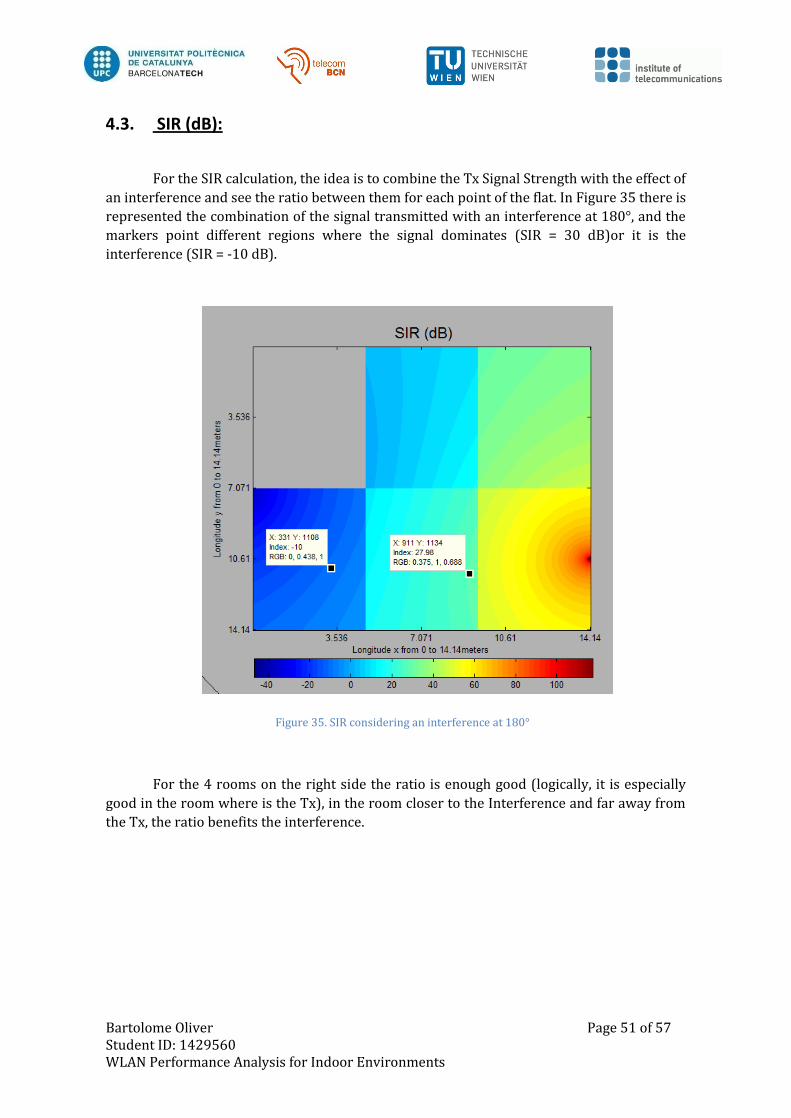
Bartolome Oliver Page 51 of 57 Student ID: 1429560 WLAN Performance Analysis for Indoor Environments
4.3. SIR (dB):
For the SIR calculation, the idea is to combine the Tx Signal Strength with the effect of
an interference and see the ratio between them for each point of the flat. In Figure 35 there is
represented the combination of the signal transmitted with an interference at 180°, and the
markers point different regions where the signal dominates (SIR = 30 dB)or it is the
interference (SIR = -10 dB).
For the 4 rooms on the right side the ratio is enough good (logically, it is especially
good in the room where is the Tx), in the room closer to the Interference and far away from
the Tx, the ratio benefits the interference.
Figure 35. SIR considering an interference at 180°
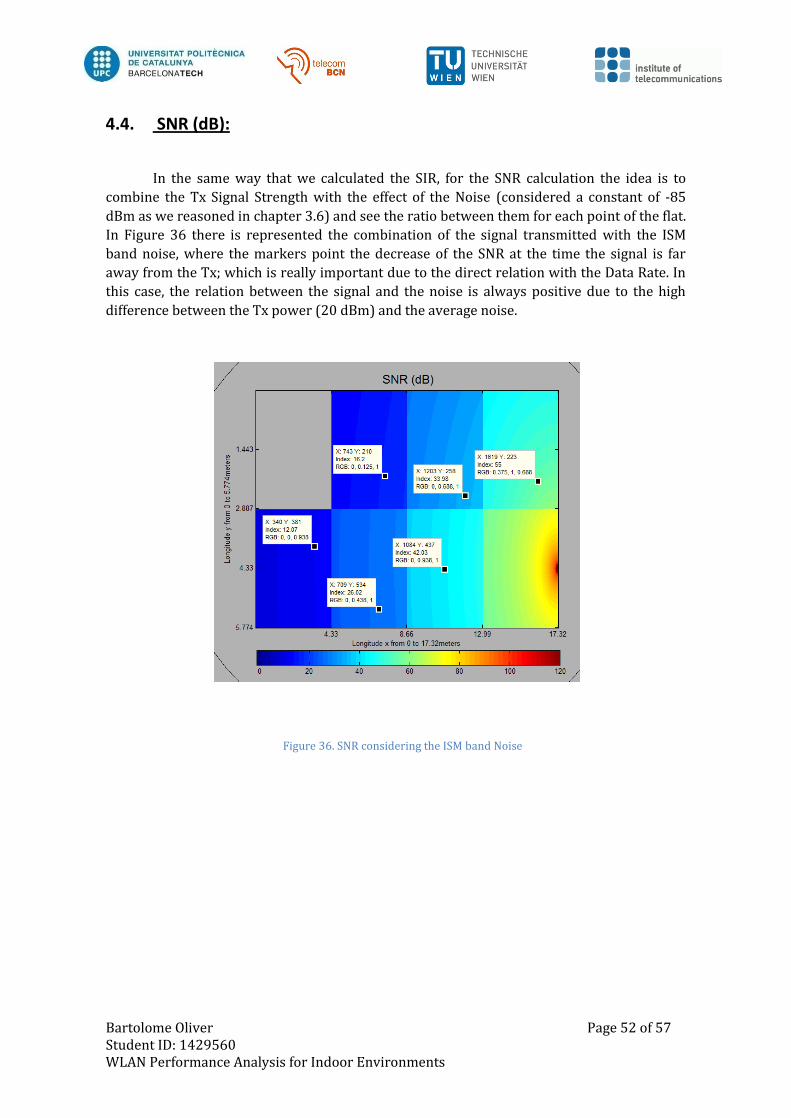
Bartolome Oliver Page 52 of 57 Student ID: 1429560 WLAN Performance Analysis for Indoor Environments
4.4. SNR (dB):
In the same way that we calculated the SIR, for the SNR calculation the idea is to
combine the Tx Signal Strength with the effect of the Noise (considered a constant of -85
dBm as we reasoned in chapter 3.6) and see the ratio between them for each point of the flat.
In Figure 36 there is represented the combination of the signal transmitted with the ISM
band noise, where the markers point the decrease of the SNR at the time the signal is far
away from the Tx; which is really important due to the direct relation with the Data Rate. In
this case, the relation between the signal and the noise is always positive due to the high
difference between the Tx power (20 dBm) and the average noise.
Figure 36. SNR considering the ISM band Noise
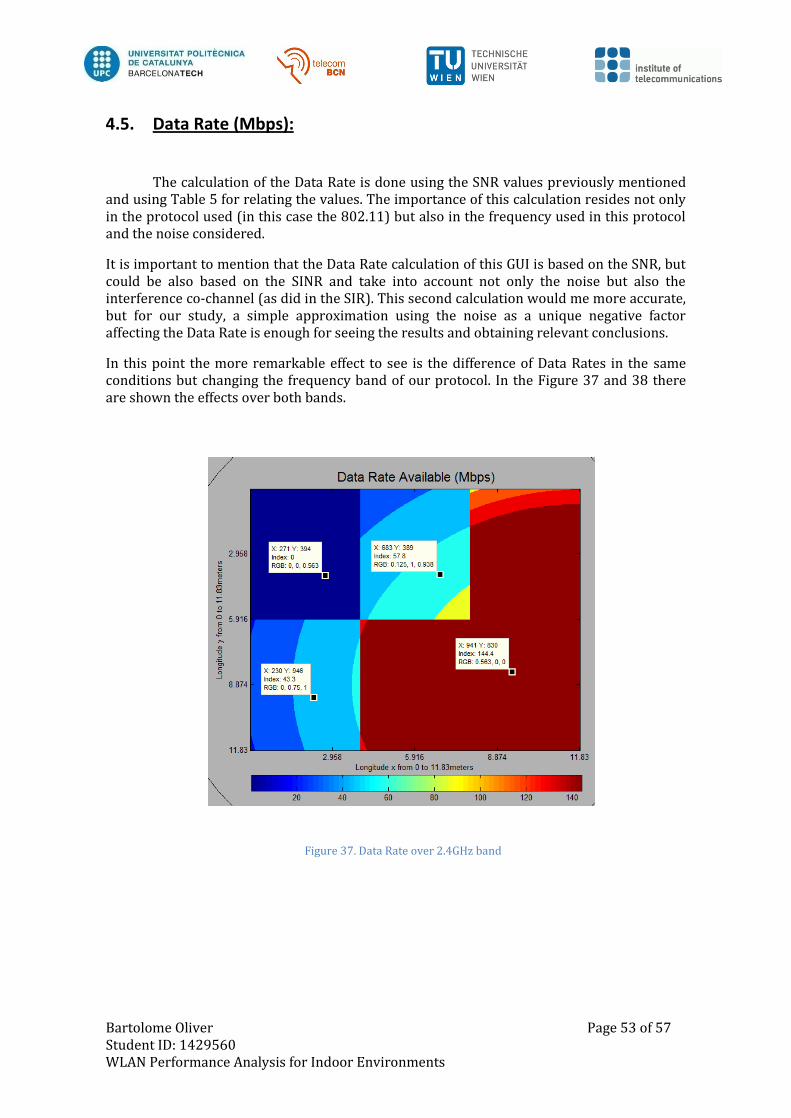
Bartolome Oliver Page 53 of 57 Student ID: 1429560 WLAN Performance Analysis for Indoor Environments
4.5. Data Rate (Mbps):
The calculation of the Data Rate is done using the SNR values previously mentioned and using Table 5 for relating the values. The importance of this calculation resides not only in the protocol used (in this case the 802.11) but also in the frequency used in this protocol and the noise considered.
It is important to mention that the Data Rate calculation of this GUI is based on the SNR, but could be also based on the SINR and take into account not only the noise but also the interference co-channel (as did in the SIR). This second calculation would me more accurate, but for our study, a simple approximation using the noise as a unique negative factor affecting the Data Rate is enough for seeing the results and obtaining relevant conclusions.
In this point the more remarkable effect to see is the difference of Data Rates in the same conditions but changing the frequency band of our protocol. In the Figure 37 and 38 there are shown the effects over both bands.
Figure 37. Data Rate over 2.4GHz band
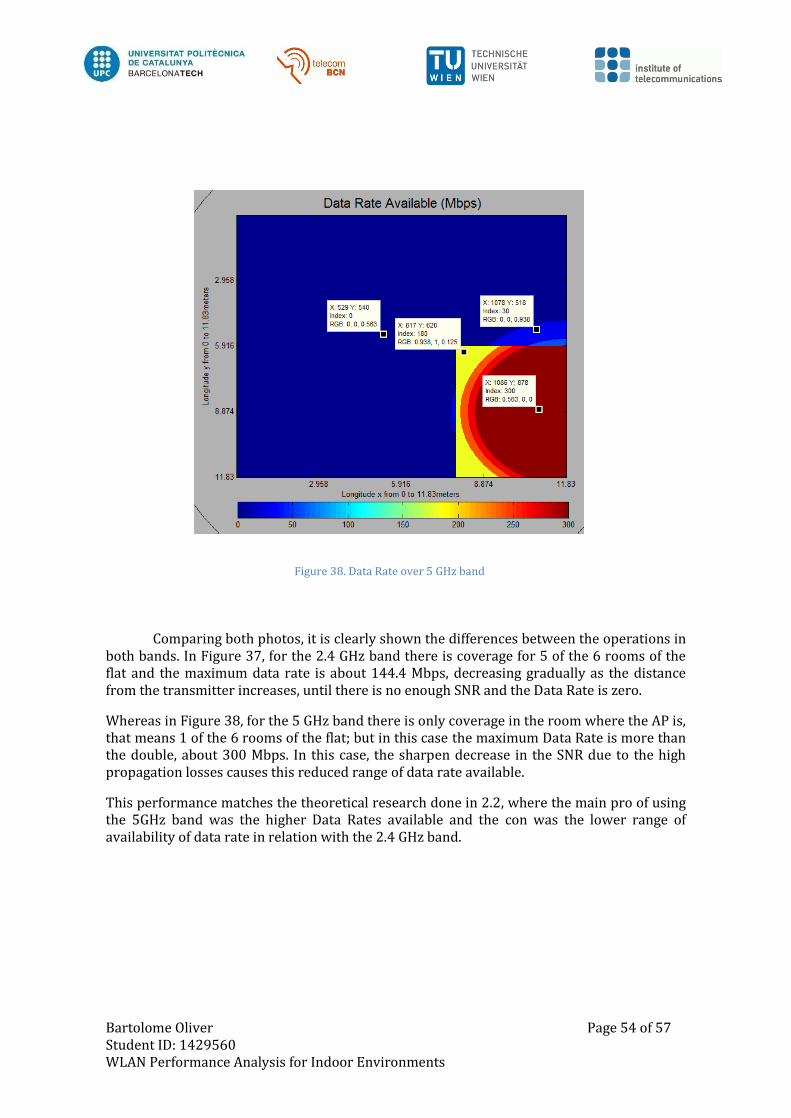
Bartolome Oliver Page 54 of 57 Student ID: 1429560 WLAN Performance Analysis for Indoor Environments
Comparing both photos, it is clearly shown the differences between the operations in both bands. In Figure 37, for the 2.4 GHz band there is coverage for 5 of the 6 rooms of the flat and the maximum data rate is about 144.4 Mbps, decreasing gradually as the distance from the transmitter increases, until there is no enough SNR and the Data Rate is zero.
Whereas in Figure 38, for the 5 GHz band there is only coverage in the room where the AP is, that means 1 of the 6 rooms of the flat; but in this case the maximum Data Rate is more than the double, about 300 Mbps. In this case, the sharpen decrease in the SNR due to the high propagation losses causes this reduced range of data rate available.
This performance matches the theoretical research done in 2.2, where the main pro of using the 5GHz band was the higher Data Rates available and the con was the lower range of availability of data rate in relation with the 2.4 GHz band.
Figure 38. Data Rate over 5 GHz band
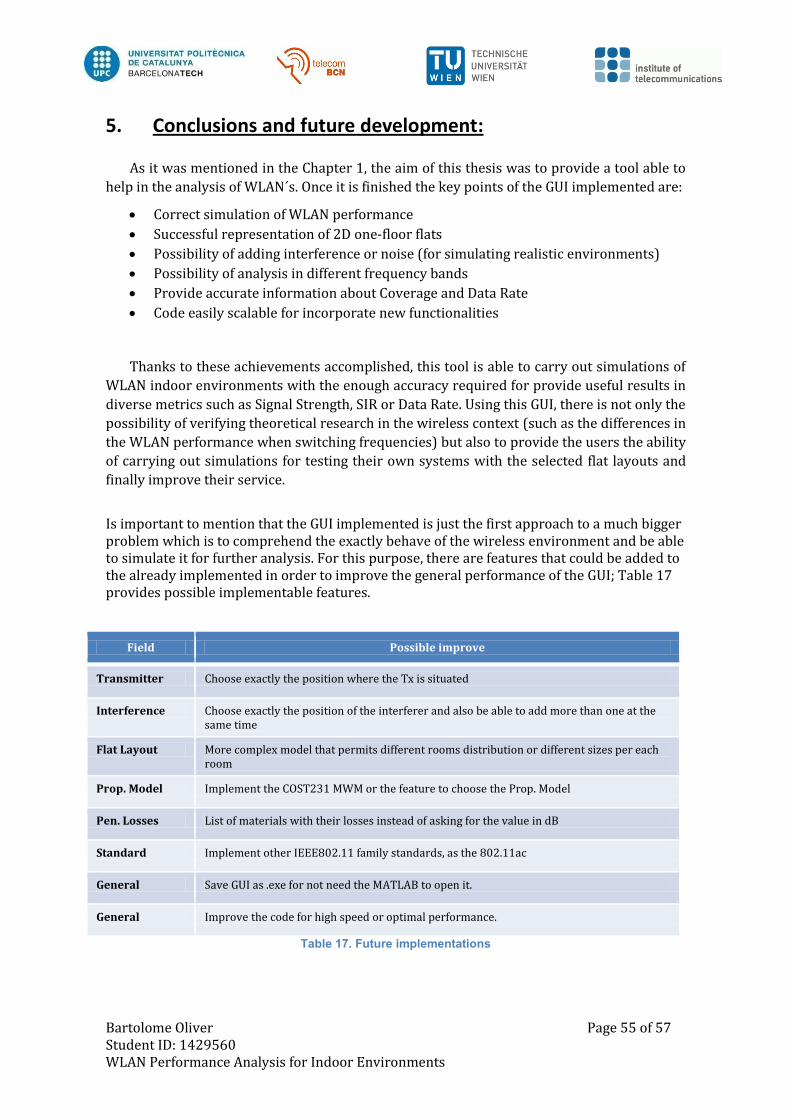
Bartolome Oliver Page 55 of 57 Student ID: 1429560 WLAN Performance Analysis for Indoor Environments
5. Conclusions and future development:
As it was mentioned in the Chapter 1, the aim of this thesis was to provide a tool able to
help in the analysis of WLAN´s. Once it is finished the key points of the GUI implemented are:
Correct simulation of WLAN performance
Successful representation of 2D one-floor flats
Possibility of adding interference or noise (for simulating realistic environments)
Possibility of analysis in different frequency bands
Provide accurate information about Coverage and Data Rate
Code easily scalable for incorporate new functionalities
Thanks to these achievements accomplished, this tool is able to carry out simulations of
WLAN indoor environments with the enough accuracy required for provide useful results in
diverse metrics such as Signal Strength, SIR or Data Rate. Using this GUI, there is not only the
possibility of verifying theoretical research in the wireless context (such as the differences in
the WLAN performance when switching frequencies) but also to provide the users the ability
of carrying out simulations for testing their own systems with the selected flat layouts and
finally improve their service.
Is important to mention that the GUI implemented is just the first approach to a much bigger problem which is to comprehend the exactly behave of the wireless environment and be able to simulate it for further analysis. For this purpose, there are features that could be added to the already implemented in order to improve the general performance of the GUI; Table 17 provides possible implementable features.
Field Possible improve
Transmitter Choose exactly the position where the Tx is situated
Interference Choose exactly the position of the interferer and also be able to add more than one at the same time
Flat Layout More complex model that permits different rooms distribution or different sizes per each room
Prop. Model Implement the COST231 MWM or the feature to choose the Prop. Model
Pen. Losses List of materials with their losses instead of asking for the value in dB
Standard Implement other IEEE802.11 family standards, as the 802.11ac
General Save GUI as .exe for not need the MATLAB to open it.
General Improve the code for high speed or optimal performance.
Table 17. Future implementations
Bartolome Oliver Page 56 of 57 Student ID: 1429560 WLAN Performance Analysis for Indoor Environments
Bibliography:
[1] "Cisco Visual Networking Index: Global Mobile Data Traffic Forecast Update 2014–2019 White Paper". Cisco Systems, 2015 [Online] Available: http://www.cisco.com/c/en/us/solutions/collateral/service-provider/visual-networking-index-vni/white_paper_c11-520862.html [Accessed: 29 June 2015].
[2] "Electrical Engineering". Wikipedia, 2015. [Online] Available: https://en.wikipedia.org/wiki/Electrical_engineering#History. [Accessed: 23 June 2015].
[3] "Electricity". Wikipedia, 2015. [Online] Available: https://en.wikipedia.org/wiki/Electricity. [Accessed: 22 June 2015].
[4] "Local Area Network". Wikipedia, 2015. [Online] Available: https://en.wikipedia.org/wiki/Local_area_network. [Accessed: 23 June 2015].
[5] "Motorola DynaTAC". Wikipedia, 2015. [Online] Available: https://en.wikipedia.org/wiki/Motorola_DynaTAC. [Accessed: 23 June 2015].
[6] Justin Berg, The IEEE 802.11 Standardization – Its History, Specifications, Implementations, and Future;
Technical Report GMU-TCOM-TR-8, George Mason University.
[7] M. Gast. 802.11 Wireless Networks: The Definitive Guide, 2nd Edition, USA: O'Reilly, 2005.
[8] Bob O’Hara and Al Petrick, IEEE 802.11 Handbook – A Designer’s Companion, IEEE Press, 1999.
[9] Julio Cesar Eade. "El nuevo estándar IEEE 802.11ac, WiFi 5G ya está aquí". moviless, 2012. [Online] Available: http://www.moviless.com/2012/01/el-nuevo-estandar-ieee-802-11ac-wifi-5g-ya-esta-aqui/ [Accessed: 20 June 2015].
[10] "Wi-Fi Alliance". Wikipedia, 2015. [Online] Available: https://en.wikipedia.org/wiki/Wi-Fi_Alliance. [Accessed: 20 June 2015].
[11] "Wi-Fi Alliance". Wi-Fi Alliance®, 2015. [Online] Available: http://www.wi-fi.org/who-we-are/our-brands [Accessed: 20 June 2015].
[12] "List of WLAN channels". Wikipedia, 2015. [Online] Available: https://en.wikipedia.org/wiki/ List_of_WLAN_channels. [Accessed: 20 June 2015].
[13] "Globalstar Value Proposition". Globalstar Spectrum Holdings - Investor Relations Solutions, 2014. [Online] Available:"http://phx.corporateir.net/External.File?item=UGFyZW50SUQ9MjU0MzI3fENoaWxkSUQ9LTF8VHlwZT0z&t=1". [Accessed: 19 June 2015].
[14] "Shannon–Hartley theorem". Wikipedia, 2015. [Online]Available:https://en.wikipedia.org/wiki/Shannon-Hartley_theorem. [Accessed: 20 June 2015].
[15] P. Estrada. "4 THINGS YOU NEED TO KNOW ABOUT 802.11AC". Cisco Systems, 2013. [Online] Available: https://meraki.cisco.com/blog/2013/08/4-things-you-need-to-know-about-802-11ac/. [Accessed: 15 June 2015]
[16] C. Gabriel. "Towards 2020: Emerging Opportunities for Wi-Fi Services". Maravedis-Rethink, 2015. [Online] Available: http://www.wballiance.com/wba/wp-content/uploads/downloads/2015/05/wba-interim-report.pdf. [Accessed: 15 June 2015].
[17] M. Ballester Lidón. "Aplicación del modelo de propagación Multi-Wall para la estimación de cobertura de femtoceldas LTE en interiores". BSc. thesis, Escuela Técnica Superior de Ingenieros de Telecomunicación, Universitat Politècnica de València, España.
[18] "Friis transmission equation". Wikipedia, 2015. [Online] Available: https://en.wikipedia.org/wiki/ Friis_transmission_equation. [Accessed: 20 June 2015].
[19] Recommendation ITU-R P.1238-7 (02/2012) “Propagation data and prediction methods for the planning of indoor radiocommunication systems and radio local area networks in the frequency range 900 MHz to 100 GHz P Series Radiowave propagation”.
[20] European Commission, Cost Action 231, Digital Mobile Radio towards Future Generation Systems, Final Report, EUR 18957, Luxembourg, 1999.
[21] Y. F. Solahuddin and R. Mardeni, "Indoor empirical path loss prediction model for 2.4 GHz 802.11n network," in IEEE Int. Conf. on Control System, Computing and Engineering (ICCSCE), 2011
[22] R. Ezzine et al, "A new generic model for signal propagation in Wi-Fi and Wimax environments", in Wireless Days, 2008 WD'08. 2008
Bartolome Oliver Page 57 of 57 Student ID: 1429560 WLAN Performance Analysis for Indoor Environments
[23] Al-Hareth Zyoud et al. “Comparison of Empirical Indoor Propagation Models for 4G Wireless Networks at 2.6 GHz”, International Conference on Control, Engineering & Information Technology (CEIT'13) Proceedings Engineering & Technology - Vol.3, pp. 7-11, 2013 Copyright – IPCO.
[24] Matthias Lott and Ingo Forkel,” A Multi-Wall-and-Floor Model for Indoor Radio Propagation” , IEEE VTS 53rd Vehicular Technology Conference, Spring, 2001, May 6 - 9, 2001, Rhodes, Greece
[25] D. Escudero Brocal. "IMPLEMENTACIÓN EN MATLAB DE UNA HERRAMIENTA DE PLANIFICACIÓN WI-FI PARA ENTORNOS DE INTERIOR". BSc thesis, Universidad de Granada, España, 2013/2014.
[26] Jianhan Liu et al. “Discussion on Penetration Loss.” Document IEEE 802.11-13/1376r2, November 2013.
[27] Kejun Zhao et al., “Multi-wall penetration Loss model for HEW system level simulation.” Document IEEE 12-14/1590r0, December 2014.
[28] Fernando Marson and Soraia Raupp Musse, “Automatic Real-Time Generation of Floor Plans Based on Squarified Treemaps Algorithm,” International Journal of Computer Games Technology, vol. 2010, Article ID 624817, 10 pages, 2010. doi:10.1155/2010/624817
[29] Paul Merrell et al., “Computer-generated residential building layouts”, ACM Transactions on Graphics (TOG), v.29 n.6, December 2010.
[30] "GUI Building Basics". The MathWorks, 2015 [Online] Available http://de.mathworks.com/help/matlab/gui-building-basics.html [Accessed: 15 March 2015].
[31] "Pythagorean theorem". Wikipedia, 2015. [Online] Available: https://en.wikipedia.org/wiki/ Pythagorean_theorem . [Accessed: 20 June 2015].