Embed Size (px)
Citation preview
WOLF STUDIES ON KANUTI NATIONAL WILDLIFE REFUGE,
ALASKA
Merry Maxwell Kanuti National Wildlife Refuge U.S. Fish and Wildlife Service
Fairbanks, Alaska
2005
1

CONTENTS
ABSTRACT ..................................................................................................................................... 3
INTRODUCTION ............................................................................................................................ 3
STUDY AREA ................................................................................................................................ 4
METHODS ............................... ; ...................................................................................................... 4
Study design and purpose .................................................................................................... 4
Overview of collaring efforts on the Refuge ........................................................................ 5
Capture and tracking methods 1998-2001 ........................................................................... 5
RESULTS ........................................................................................................................................ 6
Population estimates ............................................................................................................ 6
Summary ofNumber, Size, Home Range and Distribution of Packs .................................. 6
Productivity .......................................................................................................................... 7
Wolf:Moose Ratios .............................................................................................................. ?
DISCUSSION ........................................................................................................ ; ......................... 7
Territory size and wolf densities .......................................................................................... ?
Wolf:Moose Ratios ............................................................................................... : .............. 8
Productivity ....................................................................................................... ~ ... : .............. 9
MANAGEMENT IMPLICATIONS ................................................................................................ 9
ACKNOWLEDGMENTS ............................. < ............................................................... • ................. 1 0
LITERATURE CITED .................................................................................................................. 1 0
TABLES ......................................................................................................................................... 12
FIGURES ...................................................................................................................... ' .... ; ............ 15
ABSTRACT
2
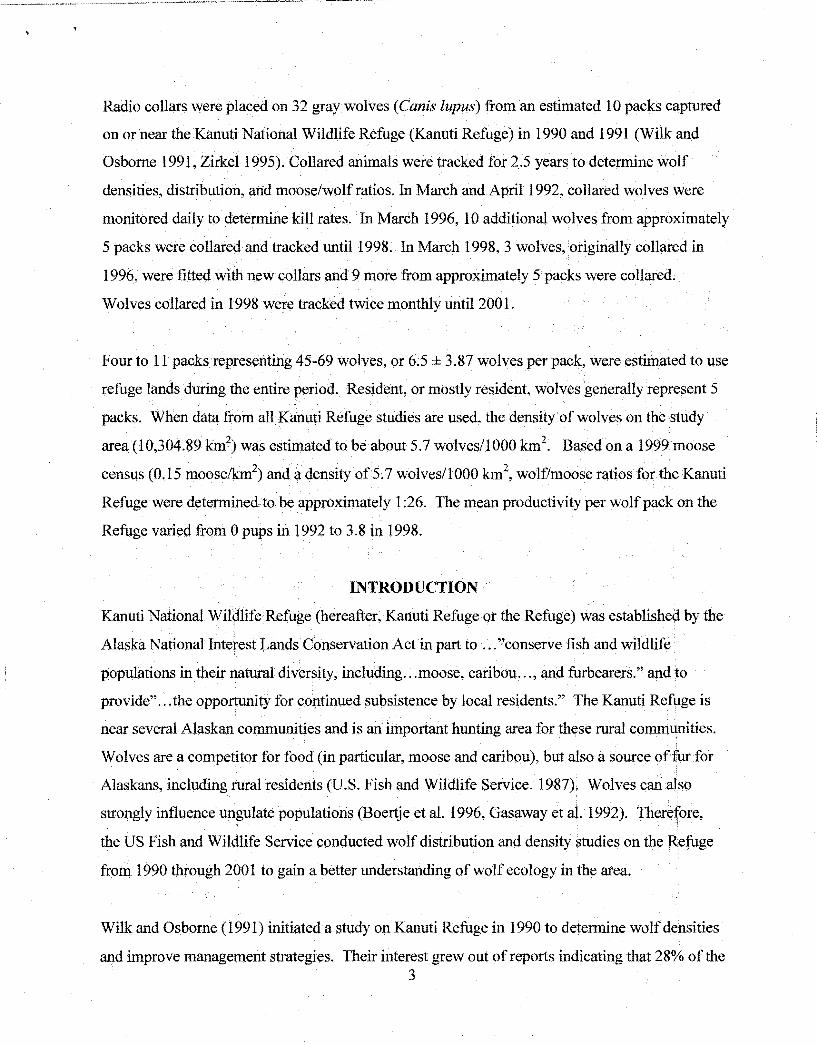
Radio collars were placed on 32 gray wolves (Canis lupus) from an estimated 10 packs captured
on or near the Kanuti National Wildlife Refuge (Kanuti Refuge) in 1990 and 1991 (Wilk and
Osborne 1991, Zirkell995). Collared animals were tracked for 2.5 years to determine wolf
densities, distribution, arid moose/wolfratios.ln March and April1992, collared wolves were
monitored daily to determine kill rates. In March 1996, 10 additional wolves from approximately
5 packs were collared and tracked until 1998. ln March 1998, 3 wolves, originally collared in
1996, were fitted with new collars and 9 more from approximately 5 packs were collared.
Wolves collared in 1998 were tracked twice monthly until 2001.
Four to 11 packs representing 45-69 wolves, or 6;5 ± 3.87 wolves per pack, were estimated to use
refuge lands during the entire period, Resident, or mostly resident, wolves generally represent 5
packs. When data from all Kanuti Refuge studies are used, the density. of wolves on the study
area(l0,304.89km2) was estimatedto be about 5.7 wolves/1000 km2
• Based on a 1999 moose
census (0.15 moose/km2) and a density of 5. 7 wolves/1000 km2
, wolf/moose ratios for the Kanuti
Refuge were determined to be approximately 1 :26. The mean productivity per wolf pack on the
Refuge varied from 0 pups in 1992 to 3.8 in 1998.
INTRODUCTION
Kanuti National Wildlife·Refuge(hereafter, Kanuti Refuge or the Refuge) was established by the
Alaska Nationallnte:rest Lands Conservation Act in part to ... "conserve fish and wildlife
populations in their natural diversity, including ... moose, caribou.,., and furbearers." and to
provide" ... the opportunity for continued subsistence by local residents." The Kanuti Refuge is
near several Alaskan communities and is an important hunting area for these rural communities.
Wolves are a competitor for food (in particular, moose and caribou), but also a source offur for
Alaskans, including rural residents (U.S. Fish and Wildlife Service. 1987). Wolves can also
strongly influence ungulate populations (Boertje et al. 1996, Gasaway et al. 1992). Therefore,
the US Fish and Wildlife Service conducted wolf distribution and density studies on the Refuge
from 1990 through 2001 to gain a better understanding of wolf ecology in the area.
Wilk and Osborne (1991) initiated a study on Kanuti Refuge in 1990 to determine wolf densities
and improve management strategies. Their interest grew out of reports indicating that 28% of the 3
' I
_j
wolves taken from Game Management Unit (GMU) 24 (Fig. 1) during 1985-90 were harvested
from the Kanuti Refuge, and 63% ofthose wolves were taken using aircraft (Wilk and Osborne
1991 ). When same day airborne wolf hunting ended during the winter of 1991-1992 because of
changes in regulatory interpretation and application, wolf harvest rates on Kanuti Refuge
declined dramatically (Zirkle 1995). Following the 1990 study, wolf density estimates for Kanuti
Refuge and surrounding areas were estimated to be as highas 10-15 wolves/1000 km2 (Wilk and
Osborne 1991, A. Greenblatt, pers. comm.). It was also thoughtthat approximately 31-36% of
Kanuti Refuge's population of wolves were harvested from 1989-1998 and 86% percent of those
animals were taken with the assistance of aircraft (Wilk and Osborne 1991 ). In addition, Wilk
and Osborne (1991) reported that the harvest had a disproportionately high female component.
Wilk and Osborne (1991) and Zirkle (1995) contain the complete results ofthese two earlier
studies. The following report presents data on territory boundaries, pack size, moose:wolf ratios,
densities, and productivity of wolves that occur on and around Kanuti Refuge, including data
from the earlier studies, and later work we conducted from 1998-2001.
STUDY AREA
We conducted our study on and around the Kanuti National Wildlife Refuge (6,625 km2) in
north-central Alaska. The Refuge is located in the northeast portion of GMU24, (Fig. 2),
approximately 209 km north of Fairbanks, Alaska, and straddles the Arctic Circle. Vegetation in
the area is typical of the northern boreal forest (Ricketts et a1 1999), and the Refuge encompasses
a basin of rolling hills, wetlands, ponds, and streams created by the Koyukuk and Kanuti rivers.
METHODS
Study Design and Purpose
Kanuti Refuge initiated a wolf-collaring project in 1990 to develop information on the Refuge
wolf population after "land and shoot'' hunting measures ceased. Between 1990 and 2001 the
number of animals collared fluctuated somewhat, but the Refuge kept up to 22 radio-collars on
wolves, annually, in an effort to determine population parameters (Zirkle A. 1995). From 1998 --
2001, the Refuge narrowed its focus and used collared wolves to determine territory boundaries,
pack size, moose: wolf ratios, densities, document dispersal events, and monitor productivity.
4
Overview of collaring efforts on the Refuge
Initially, 15 wolves from approximately 5 packs were collared and tracked for 9 months via
fixed-wing aircraft (Wilk and Osborne 1991). The Refugefollowed these animals until1992 and
determined their kill-rates during daily tracking flights (Zirkle 1995). In 1992, we collared 17
additional wolves, and the Refuge continued to monitor aH of the wolves that still carried
functioning collars. In 1996, 10 more wolves from approximately 5 packs were collared in
response to public predator/prey concerns, and these animals were tracked until 1998 (Zirkle A.
1995). In March 1998, 9 additional wolves were collared and 3 of the previously collared wolves
were re-collared {Maxwell 1998). All remaining wolves with functioning collars were radio
tracked until 2001.
Capture and tracking methods 1998-2001
In March 1998, Kanuti Refuge and ADF&G established a cooperative agreement to locate,
tranquilize, and radio collar up to 15 wolves on refuge and adjacent lands. Methods recorded
here are specific to the 1998 collaring project, but in general arethe same as used in the earlier
wolf collaring efforts (Wilk and Osborne 1991, Zirkle 1995), We located wolves using two
fixed-wing aircraft (Piper Super Cub~), and used a Robinson R-22 helicopter from which to dart
animals. We preferentially targeted alpha wolves. Immobilizing daqs delivered 654 milligrams
ofTelazol, hydrostatic water and propylene glycol (to prevent freezing). Afterimmobilization,
we landed and fitted animals with radio-collars equipped with mortality sensors (Telonics, Mesa,
AZ), and collected body measurements (girth and length), hair and blood samples and
determined the approximate age, condition, and weight of each wolf. We relocated collared
wolves 24 hours after capture, and then at regular intervals (weather permitting) throughout the
study period using fixed-wing aircraft and Telonics or Advanc.ed Telemetry System receivers.
We recorded Global Position System (GPS) locations for each collared animal during the
relocation flights, and made notations regarding other observations.
Beginning in 1998, we used fixed-wing aircraft to track and observe collared wolves twice
monthly, weather permitting, for approximately the next 24 months, or until an animal died,
dispersed from the area, or the collar failed. Failure to hear a signal after repeated flights
indicated the wolf had dispersed from the study area, the transmitter failed, the wolfhad been 5
killed, or the collar malfunctioned. When an animal left the Refuge, we tracked it beyond the
Refuge's boundaries if possible; dispersing animals were also tracked by private pilots or partner
agencies. When collared wolves died and could be located, we used a helicopter to access the
area where the wolf died, recovered the animal, and performed a necropsy. However, in some
cases, only the collars were recovered. Locations, behavior, habitat, pack size and animal age
(adult versus pup) were recorded for each animal located during tracking flights. Additional
information was recorded on kills. We made no attempt to map kernel home ranges because of
data limitations (Worton 1995). Instead, we used Minimum Convex Polygons (MCP) to estimate
territory size (Hooge and Eichenlaub 1997) and to establish how wolves used the Refuge over the
1 0-year monitoring interval.
RESULTS
Population Estimates
Approximately 43 wolves used lands on and around the Refuge (6.0 wolves/1000 km2) from
1998 through 2001 (Table 1). When data from the entire monitoring period (1991-2001) is used,
we estimate the wolf density on Kanuti Refuge, and adjacent areas (1 0,304.89 km2) to be about
5.7 wolves/1000 km2 (Table 2).
Summary of Number, Size, Home Range and Distribution of Packs
Because packs form and die out over time, the number of packs using Kanuti Refuge varied over
the course of our study. During the 1 0 years of radio tracking, we estimated 4-11 packs used
Kanuti Refuge and adjacent lands. Five of these packs were considered to be resident on Kanuti
Refuge (Wilk and Osborne 1991).
Pack size varied seasonally during our study. We found that packs were larger, up to 17 wolves,
during early winter after pups were assimilated into the pack (Grooms 1999), while at other times
of the year, packs were much smaller, some having as few as 3 individuals. The mean pack size
for the 5 packs we monitored during 1996-2001 was 7.7 ± 2.3 wolves.
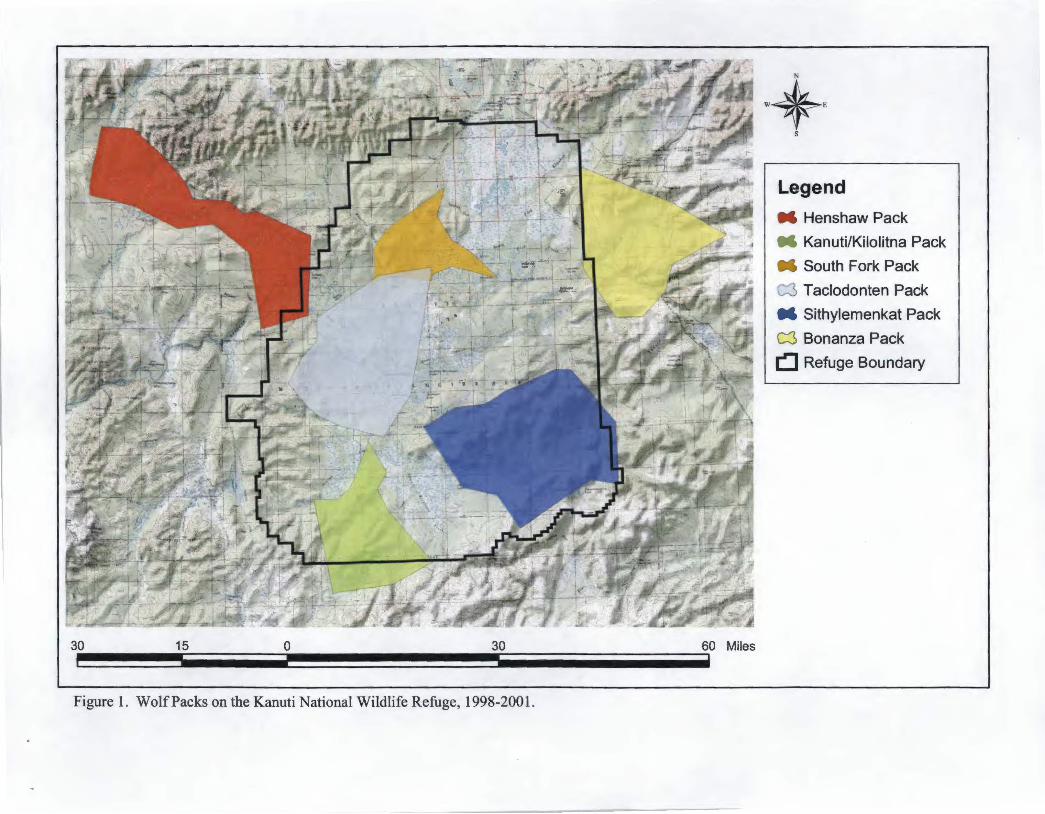
We found that the MCP size of wolf pack territories on our study area ranged from 415 km2 to
960 km2 (see Figures 1-8 maps ofMCPs of pack territory in 1998-2001). 6
Productivity
Between 1990 and 1992, we identified 10 wolf packs that occurred on or around Kanuti Refuge.
In 1992 no pups were produced in the 5 packs that we found resident on the study area (Table 3 ).
A mean ofabout 1.6 pups were produced per pack in both 1990 (7 packs) and 1991 (9 packs) in
packs we located in those years. Between 1998 and 2001, six packs of wolves (the collared male
in the Chalatna Creek pack died before we were able to establish productivity for that pack) used
our study area and their productivity ranged from 1 to 3.8 pups/pack (Table 4).
Moose:WolfRatios
A 1989 moose survey reported an estimated 1,172 moose/ 6773 km2 or 0.17 moose/km2 for
Kanuti Refuge. Wilk and Osborne (1991) estimated 69 wolves for the Refugeand adjacentlands
in the same year, and a wolf:moose ratio of 1:17. Wilk and Osborne estimated the wolf
population was 45 in 1991, and using the moose estimate from 1989, determineda wolf:moose
ratio of 1:26. A moose census conducted in 1999 produced a density estimate of 1,052
moose/7032 km2 or 0.15 mooselkm2 (Table 5). Using a mean of 5. 7 wolves/1000 km2, the
wolf/moose ratio for Kanuti Refuge is estimated to be 1 :26 (Table 6).
DISCUSSION
Territory Size and Wolf Densities
Wolf densities vary by region in Alaska and are dependent local resources. Stout (2003)
estimated there were 4-6 wolves/1 000 km2 in the central part of GMU 24 and 6-8 wolves/1 000
km2 in the northern part ofthe unit, and suggested the difference was related to prey availability.
The density of wolves on our study area (5.7/1000km2) is within this range, and the range
expected throughout interior Alaska(Ballard et all989). In addition, the wolfdensities we
report agrees with Alaska Fish and Game fall management goals (5-9 wolves/ I 000 km2) for
GMU 24 (Stout 2003).
The reportedterritory sizes of wolves in other parts of Alaska vary greatly. On the Kenai
Peninsula the average wolfterritory size was 638 km2 (Peterson et al. 1984), in South:..central 7
Alaska it was found it to be 1645 km2 (Ballard et al. 1987) and in Northwest Alaska where
wolves prey mainly on migratory caribou, territory size was 1868 km2 (Ballard et al. 1997).
It has been demonstrated that wolf territory size and the number of relocations made per pack per
year are related; as the number of relocations increases so does the pack's territory size (Ballard
et al. 1987, Burch et al. 2005). One reason for this phenomenon is that in parts of Alaska where
moose densities are low and caribou presence is sporadic, wolves are forced to travel great
distances in search ofprey. As a result, wolfterritories may overlap by as much as 70% both
· spatially and temporally because animals do not frequent and reinforce territory boundaries
(Burch pers. comm.). The MCP territories described for Kanuti Refuge are based on fewer than
50 telemetry relocations per pack. In addition, we probably also underestimate true territory sizes
because our estimates are based solely 9n the. area used by wolves during daylight hours, when
we radio-tracked animals (Burch 2001). For ,all of these reasons, the territory sizes we present in
this report should be considered minim~ estimations of the territory sizes for wolf packs in our
study area.
Wolf:Moose Ratios
Moose densities on Kanuti Refuge (15011 000 km2) are consistent with densities where there is no
predator control (Van Ballenbetghe 1991). Wolf densities on the Refuge are also within the
normal range where moose occur at relatively low densities and caribou presence is sporadic
(Stout 2003). The low moose densities on Kanuti Refuge may result from of a combination of
factors including periodic severe weather (particularly deep snow), and predation by a full
complement ofungulate predators, including wolves and grizzly and black bears (Ballard 1991).
Productivity
When compared with other locations in Alaska, the productivity of wolves was low during our
study. Ballard et al. (1987) found productivity to range from 3.7 to 7.3 pups/pack on their study
area in South-central Alaska and Peterson et al. (1984) found packs produced a mean of 4
pups/pack on the Kenai Peninsula. We,do not know if our data are an accurate representation of
wolfproductivityon our study area, or if the divergence from other studies we report resulted
from differel)ces in study techniques. 8
Management Impli~ations
There are limitations with using VHF radio-collars for wolfstudies in remote environments like
Kanuti Refug~, including the ever-increasing expense of flying, the risk to personnel of flying in
remote locations, weather restrictions, and the fact that wolves are active at night (Mech 1970)
when tracking is not possible. These can all be avoided or mitigated by using GPS collars rather
than VHF collars. In addition GPS collars provide more data per collar than VHF collars, an
important concern when trying to determine wolf densities and territory size. Therefore, in spite
of their high initial cost, the use of GPS collars should be given special consideration for future
wolf studies on the Refuge.
The large and indiscrete nature of wolf pack territories in Interior Alaska are reasons to be
cautious and thoughtful when initiating wolf inventory surveys. Given the limitations of the data
available from telemetry flight surveys when VHF collars are used, it is important that managers
realize that population estimates are not precise counts and must always be considered
cautiously.
The radio-telemetry work on Kanuti Refuge from 1991 2001 has accorded us a better
understanding ofwolfecology and therelationship ofwolves to moose on the Refuge. However,
studies have shown that bears play an important role in the survival of moose calves in Alaska,
and elsewhere; in some locations bears may take up to 40% of the moose calves produced each
spring (Alaska Department ofFish a.Ild Game 2001, Ballard and Larsen1987, Boutin 1992,
Bertram and Vivion 2002). No studieS'have been conducted on bear densities, prey relationships,
or habitat preferences on Kanuti Refuge. Therefore, we do not have a complete understanding of
the relationship between moose, and the entire resident ungulate predator guild on the Refuge.
Investigating the ecology of black and brown bears should be a research priority for Kanuti
Refuge in the future.
ACKNOWLEDGEMENTS
9
Special thanks are extended to·all of the pilots whose wolf tracking skills often determined the
success of this project. Thanks also to the cooperative agencies, the National Park Service (NPS)
and Alaska Department ofFish and Game. Thanks to John Burch (NPS), and Rick Swisher of
Quicksilver Air, and to all Kanuti Refuge staffwho helped with wolf tracking over the years.
LITERATURE CITED
Alaska Department of Fish and Game. 2001. Koyukuk River Moose Management Plan. Alaska Department ofFish and Game, Fairbanks, Alaska.
Ballard, W. B 1991. Management of predators and their prey: The Alaskan experience. Trans. 56th N. A. Wildl. and Nat. Res. Conf.
Ballard, W. B. and D. G. Larsen. 1987. Implications ofpredator-preyrelationships to moose management. Swedish Wildlife Research suppl. 1.
Ballard, W.B., L.A. Ayres, P.R. Krausman, D. J. Reed, and S. G. Fancy. 1997. Ecology of wolves in relation to a migratory caribou herd in Northwest Alaska. Wildlife Monographs No. 135
Ballard, W. B., J. S. Whitman, C. L. Gardner. 1987. Ecology of an Exploited WolfPopulation in South-Central Alaska. Wildlife Monographs No. 98.
Bertram, M.R. and M.T. Vivion. 2002. Moose mortality in eastern interior Alaska. J. Wildl. Manage.66:747-756
Boertje, R. D., P Valkenburg, and M EMcNay. 1996. Increases in moose, caribou, and wolves following wolf control in Alaska. J. ofWildl. Manage. 60:474-489.
Burch, J. W. 2001. Evaluation of wolf density estimation from radiotelemetry data. Master of Science Thesis. University of Alaska, Fairbanks, Alaska.
Burch, J. W., L. G. Adams, E. H. Follmann, and E. A. Rexstad. 2005. Evaluation of wolf density estimation from radiotelemetry data. Wildl. Soc. Bull. 33:1225-1236.
Boutin, S. 1992. Predation and moose population dynamics: A critique. J. Wildt Manage. 56: 116-127
Gasaway, W. C., R. D. Boertje, D. V. Grangaard, D. G. Kelleyhouse, R. 0. Stephenson, and D. G. Larsen. 1992. The role of predation in limiting moose at low densities in Alaska and Yukon and implications for conservation. Wildlife Monographs 120.
10
Grooms, S. 1999. Returnofthe wolf. Northwood Press, Minnetonka, Minnesota.
Hooge, P.N. and B. Eichenlaub.1997. Animal movement extension to arcview.Ver. l.l. Alaska Biological Science Center, U.S. Geological Survey, Anchorage, AK. USA
Maxwell, M. 1998. Progress report: Wolfmonitoring on Kanuti National Wildlife Refuge. U.S. Fish and Wildlife Service. Fairban:ks, Alaska.
Mech, D. L. 1970. The wolf, the ecology and behavior of an Endangered Species. University of Minnesota Press. Minneapolis MN.
Peterson, R.O., J.D. Woolingtonand T. N. Bailey 1984. Wolves oftheKenai Peninsula, Alaska. Wildlife Monographs, No. 88.
Ricketts, T.H., E. Dinerstein, D. M. Olson, C, J. Loucks, W. Eichbaum, D. DellaSalla, K. Kavanagh, P. Hedao, P. Hurley, K. Carney,R. Abell, and S. Walters. 1999. Terrestrial Ecoregions ofNorth America: A Conservation Assessment. Island Press, Washington, D.C. 508 pp.
Stout, G.W. 2003. Unit 24 wolf management report. Pages 223-231 in C.Healy, editor• Wo~f management report of survey an<! inventory activities 1 July 1999-30 Jlll'ie 2002. ,A_laska Department ofFish and Game. Juneau, AK. . ·
U.S. Fish and Wildlife Service. 1987. Comprehensive Conservation Plan, Enviroi:nnental Impact Statement, Wilderness Review. U.S. Fish and Wildlife Service, Anchorag~, Alaska.
Van Ballenberghe, V. 1991. Forty years of wolf management in the NelthinaBasin, · i.
Southcentral Alaska: A critical review. Trans. 56th N. A. WildL &Nat. Res. ConfJ
Wilk,R. J. and T. 0. Osborne. 1991. Status of the gray wolf an~ preliminary as$essment9fthe moose-wolf relationship in the Kanuti. National Wildlife Refuge, Alaska. Progress report, U.S. Fish and Wildlife Service, Fairbank:s, AK. · · ·.
' '
Worton, B. K. 1995. Using the Monte Carlo simulation to evaluate kernel-based homera.I}ge estimators. J. ofWildl. Mqnage. 59: 794-800. · ·'
Zirkle,A. 1995. A population assessmentofwolves and an accqunt ofthe predator/prey relationship on KanutiNationaiWildlife Refuge. Progress report, U.S. Fish and W;ildlife Service, Bettles, Alaska.
11
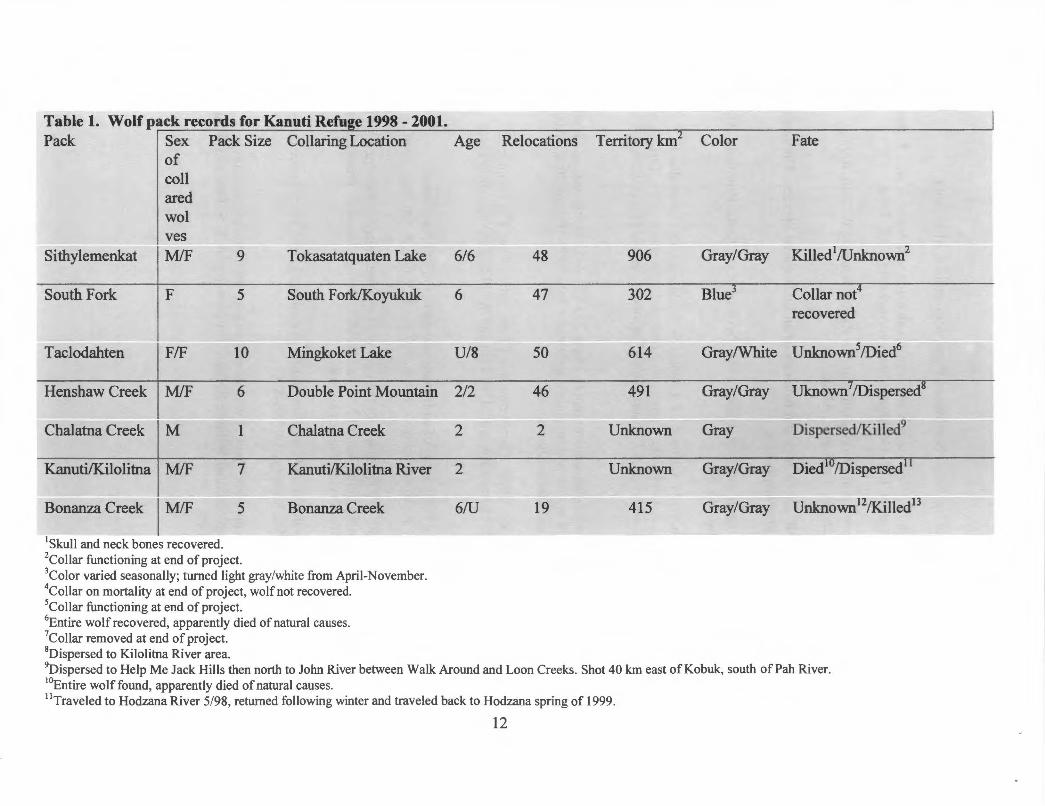
Table 1. Wolf pack records for Kanuti Refuge 1998 - 2001. Pack I Sex Pack Size Collaring Location Age Relocations Territory km.l Color Fate
of coli ared wol ves
Sithylemenkat MIF
South Fork F
Taclodahten I F/F
Henshaw Creek I MIF
Chalatna Creek I M
Kanuti!Kilolitna I MIF
Bonanza Creek I MIF
1Skull and neck bones recovered.
9 Tokasatatquaten Lake
5 South F ork!Koyukuk
10 Mingkoket Lake
6 Double Point Mountain
1 Chalatna Creek
7 K.anuti!K.ilolitna River
5 Bonanza Creek
2Collar functioning at end of project. 3Color varied seasonally; turned light gray/white from April-November. 4Collar on mortality at end of project, wolf not recovered. 5Collar functioning at end of project. 6Entire wolf recovered, apparently died ofnatural causes. 7Collar removed at end of project. 8Dispersed to Kilolitna River area.
6/6
6
U/8
2/2
2
2
6/U
- -48 906 Gray/Gray Killed 1/Unknown2
47 302 Blue Collar not recovered
50 614 Gray/White Unknown5 /Died6
46 491 Gray/Gray
2 Unknown Gray --~= . q
Dispersed/Killed
--Unknown Gray/Gray
19 415 Gray/Gray Unknown 12/Killed 13
9Dispersed to Help Me Jack Hills then north to John River between Walk Around and Loon Creeks. Shot 40 km east of Kobuk, south ofPah River. 1Dr:ntire wolf found, apparently died of natural causes. 11Traveled to Hodzana River 5/98, returned following winter and traveled back to Hodzana spring of 1999.
12

12Collar recovered frozen in the ice of the Jim River.
13Collar and bone fragments located near a moose kill.
13

Table 3. Productivity of wolf packs on Kanuti Refuge, 1990 - 1992. Values are approximates based on direct observation from aircraft.
Pack Adults1 Pups 1990 Pupsl991 Pups 1992
Alatna 8 0 0 0
Bonanza 8 6 4 0
Central 3-7 0 1 --------
Kanuti Canyon 1-4 ---·· ... ~----- -·-----Kilolitna 2-3 2 0 --------
Little Kaldoyleit 2-3 0 4 0
Old Dummy 2 -------- 07 --------
Sithylemenkat 10 -------- ;"i 0 0
Taclodahten 4- 11 3 5 --------
Todatonten 1-2 0 0 --------
Mean 1.57 1.56 0
14
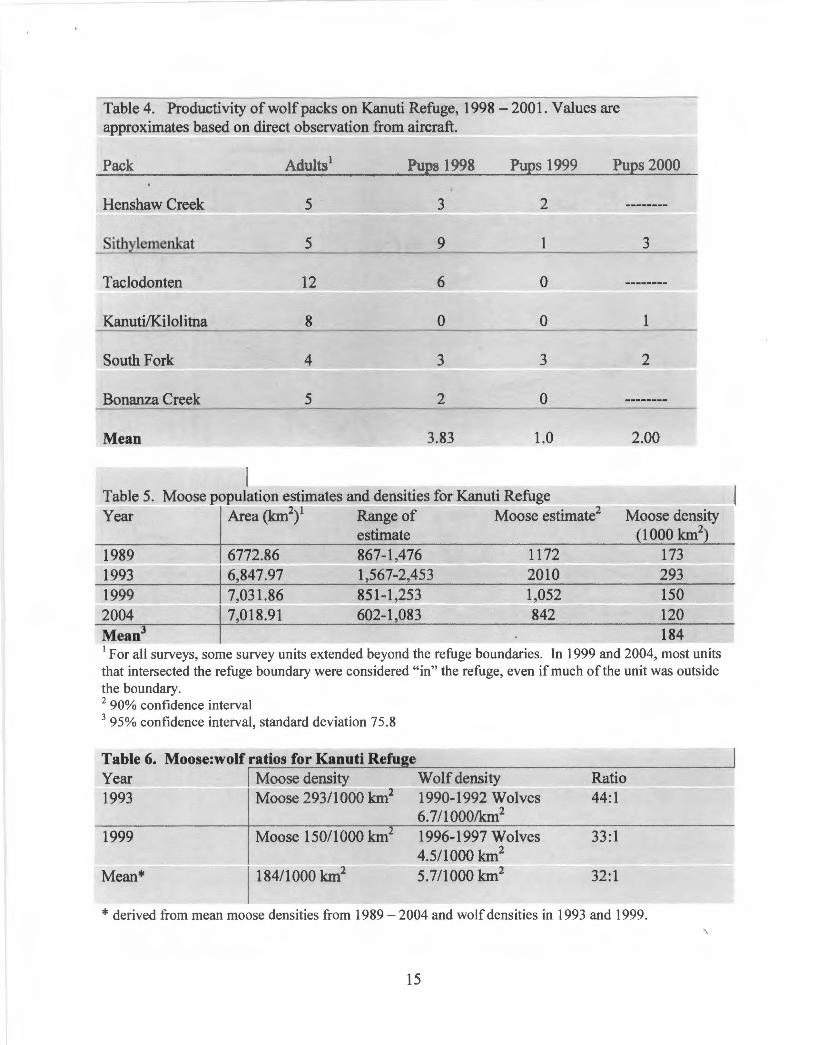
Table 4. Productivity of wolf packs on Kanuti Refuge, 1998-2001. Values are approximates based on direct observation from aircraft.
Pack Adults1 Pups 1998 Pups 1999 Pups 2000
Henshaw Creek 5 3 2 --------
Sith lemenkat 5 9 1 3
Taclodonten 12 6 0 --------
Kanuti!Kilolitna 8 0 0 1
South Fork 4 3 3 2
Bonanza Creek 5 2 0 --------
Mean 3.83 1.0 2.00
I Table 5. Moose population estimates and densities for Kanuti Refuge Year Area (km2
)1 Range of Moose estimate2 Moose density
estimate 1 000 km2)
1989 6772.86 867-1,476 1172 173 1993 6,847.97 1,567-2,453 2010 293 1999 7,031.86 851-1,253 1,052 150 2004 17,018.91 602-1,083 842 120
Table 6. Moose:wolf ratios for Kanuti Refu e Year Moose density Wolf density Ratio 1993 Moose 293/1000 km2 1990-1992 Wolves 44:1
6.7/1000/km2
1999 Moose 150/1000 km 1996-1997 Wolves 33:1 4.5/1000 km2
Mean* 1184/1000 km2 5.7/1000 km2 32:1
* derived from mean moose densities from 1989 - 2004 and wolf densities in 1993 and 1999.
15
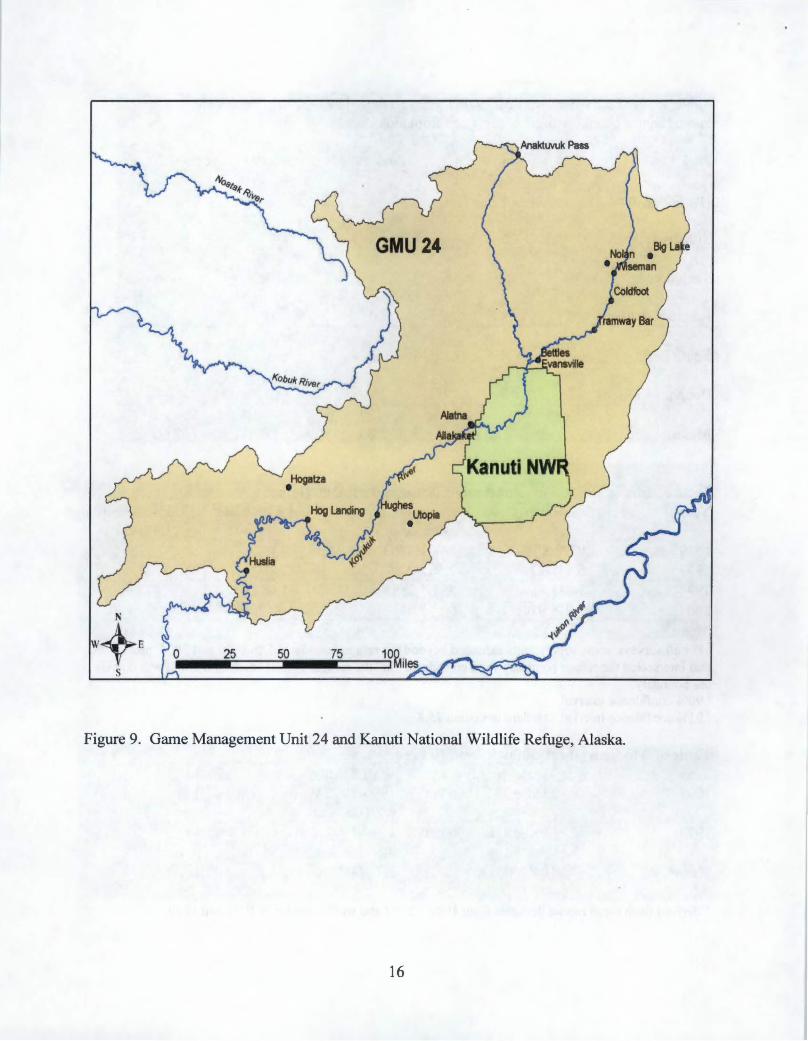
Figure 9. Game Management Unit 24 and Kanuti National Wildlife Refuge, Alaska.
16
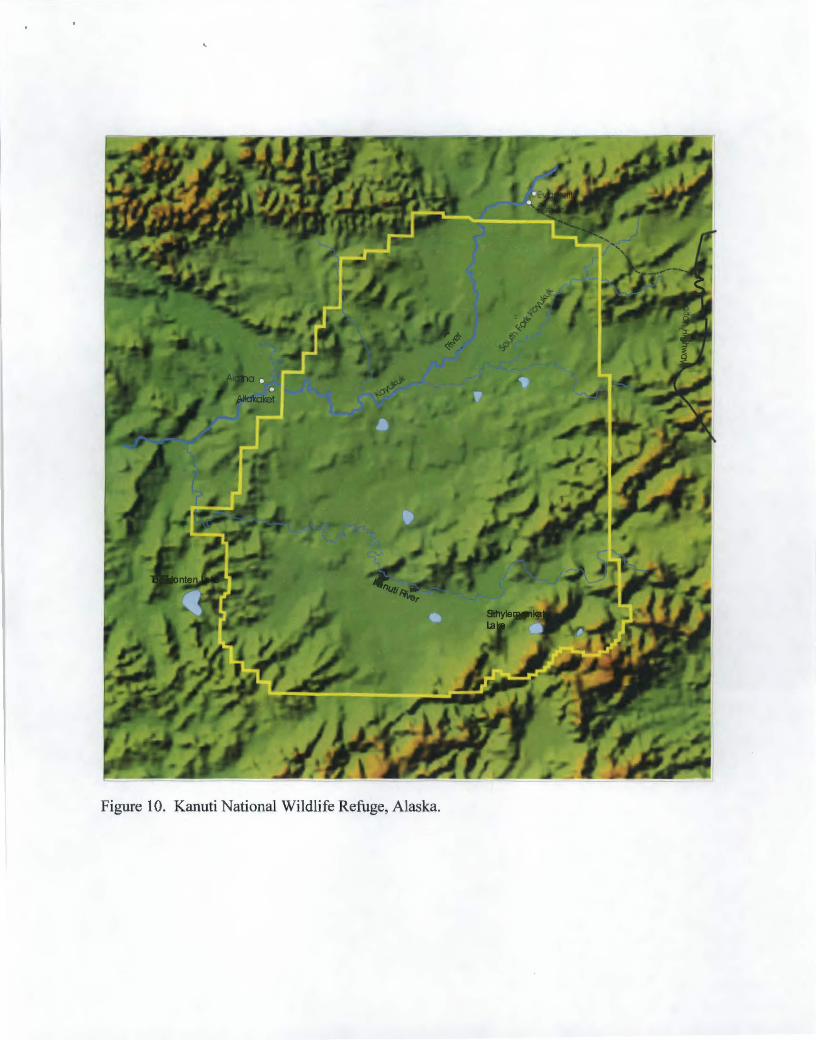
Figure 10. Kanuti National Wildlife Refuge, Alaska.
30 15 0 30 60 Miles
Figure 1. WolfPacks on the Kanuti National Wildlife Refuge, 1998-2001.
·• · s
Legend
M Henshaw Pack
M Kanuti/Kilolitna Pack
M South Fork Pack
C3 Taclodonten Pack
M Sithylemenkat Pack
C3 Bonanza Pack
~ Refuge Boundary
·•· s
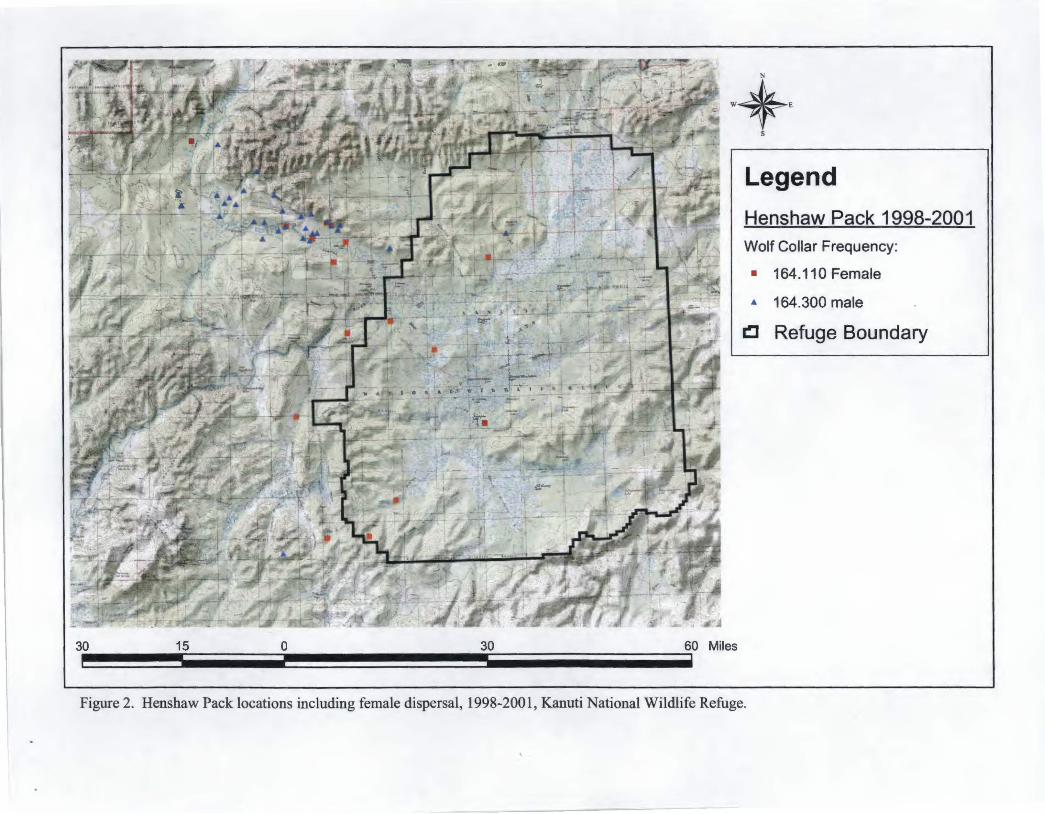
Legend
Henshaw Pack 1998-2001
Wolf Collar Frequency:
• 164.110 Female
• 164.300 male
CJ Refuge Boundary
30 15 0 30 60 Miles --Figure 2. Henshaw Pack locations including female dispersal, 1998-2001, Kanuti National Wildlife Refuge.
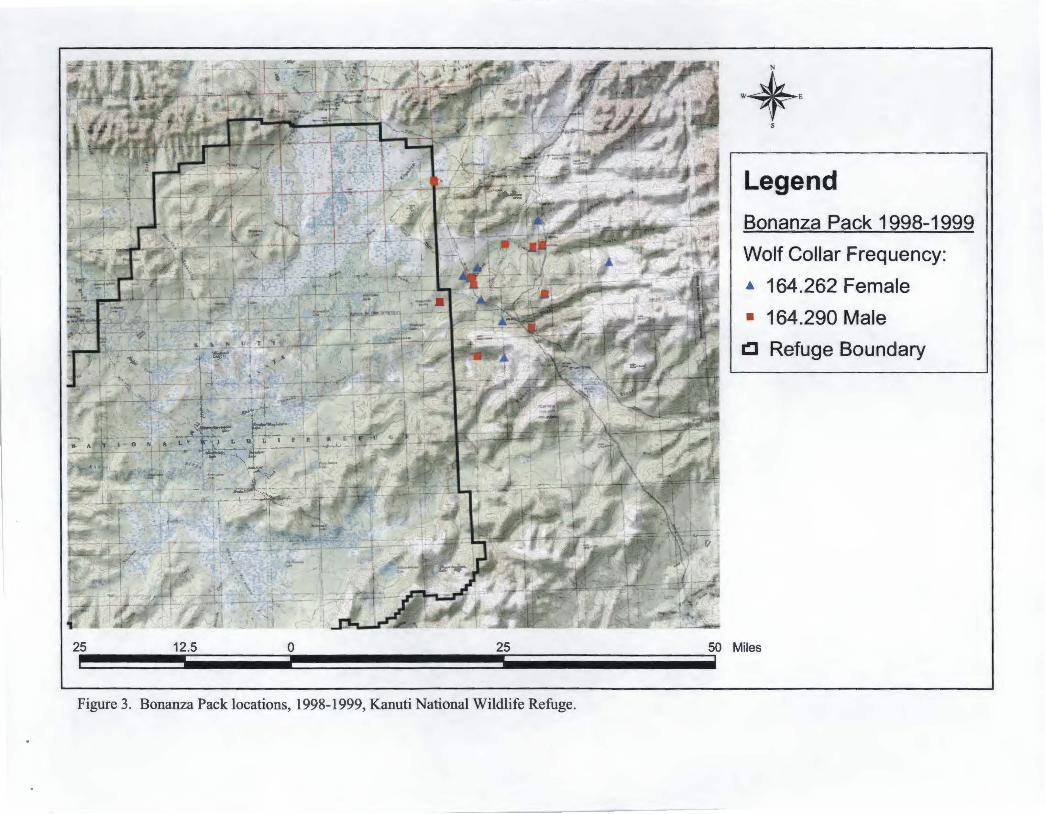
25 12.5 0 25 -Figure 3. Bonanza Pack locations, 1998-1999, Kanuti National Wildlife Refuge.
·+-s
Legend
Bonanza Pack 1998-1999
Wolf Collar Frequency:
• 164.262 Female
• 164.290 Male
l!l Refuge Boundary
50 Miles
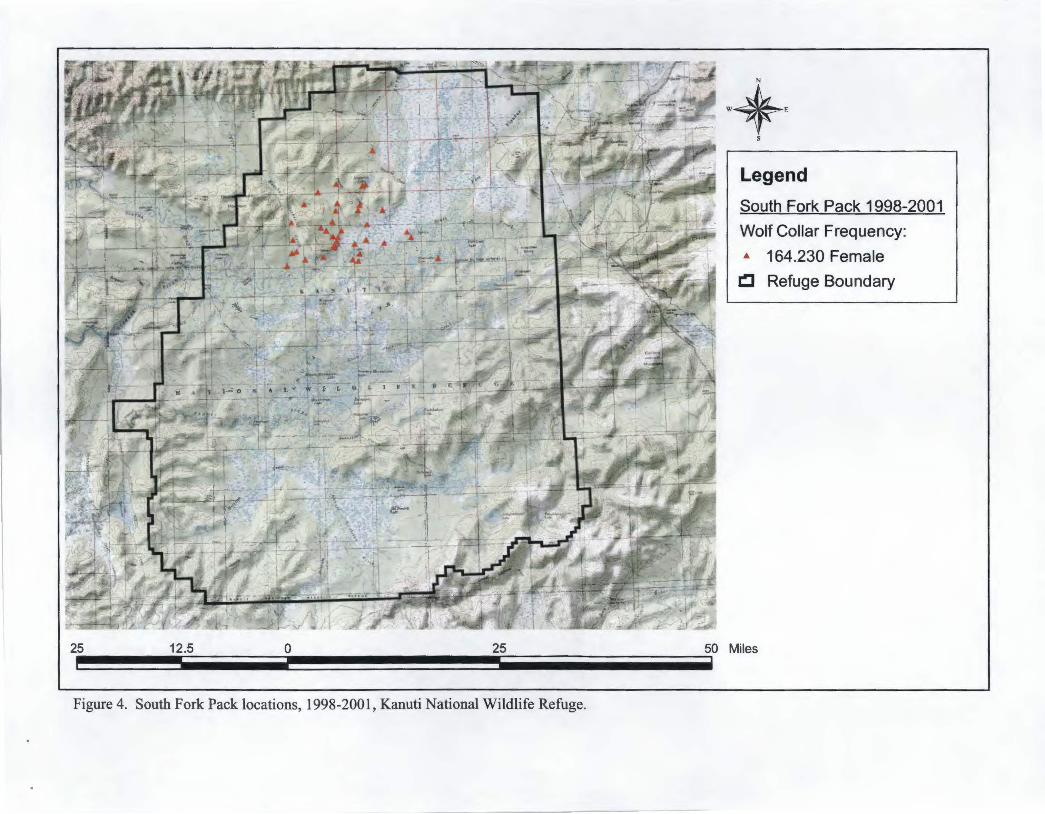
25 12.5 0 25 -Figure 4. South Fork Pack locations, 1998-2001, Kanuti National Wildlife Refuge.
.• , s
Legend
South Fork Pack 1998-2001
Wolf Collar Frequency:
• 164.230 Female
l!l Refuge Boundary
50 Miles
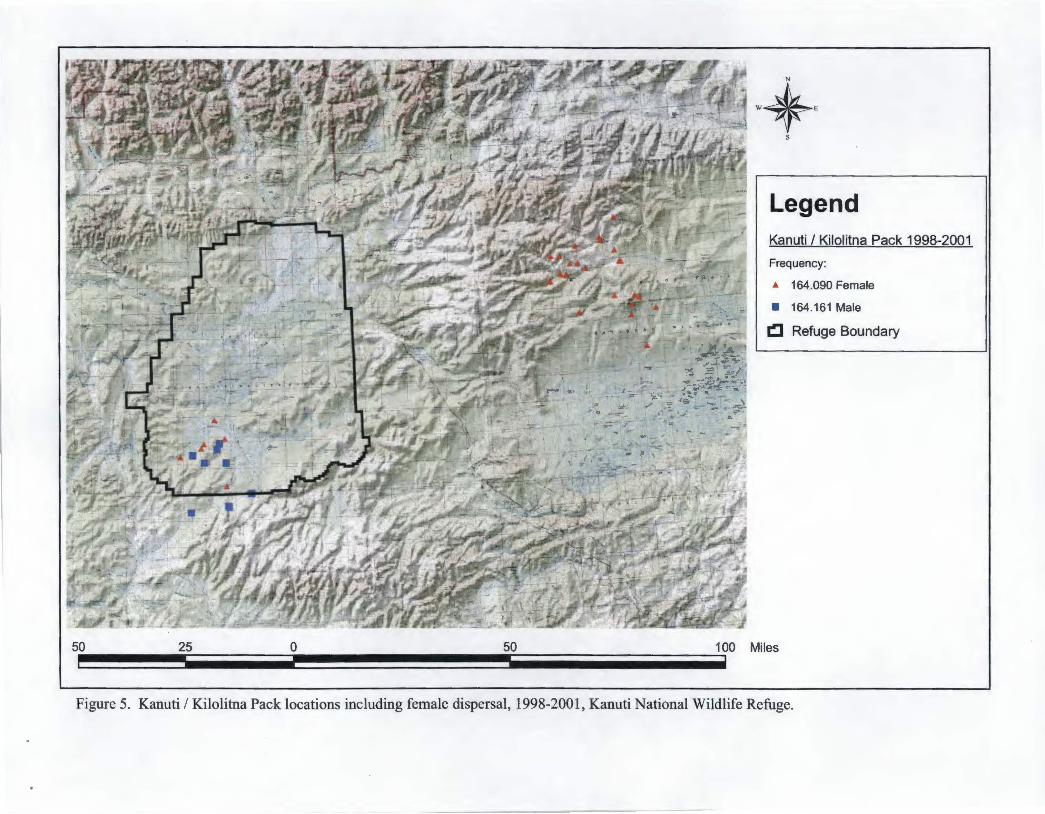
·+· s
Legend Kanuti I Kilolitna Pack 1998-2001
Frequency:
• 164.090 Female
• 164.161 Male
~ Refuge Boundary
50 25 0 50 100 Miles -Figure 5. Kanuti I Kilolitna Pack locations including female dispersal, 1998-2001, Kanuti National Wildlife Refuge.
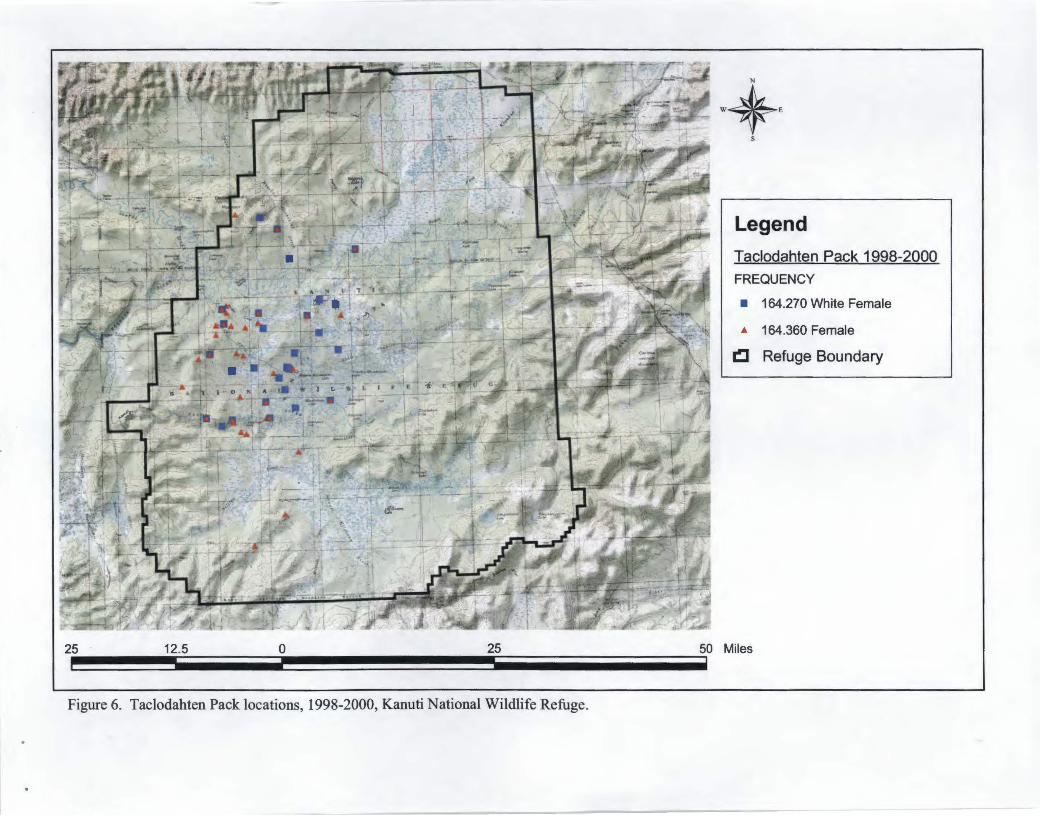
25 12.5 0 25 --Figure 6. Taclodahten Pack locations, 1998-2000, Kanuti National Wildlife Refuge.
N
•*' s
Legend
Taclodahten Pack 1998-2000
FREQUENCY
• 164.270 White Female
.t. 164.360 Female
~ Refuge Boundary
50 Miles
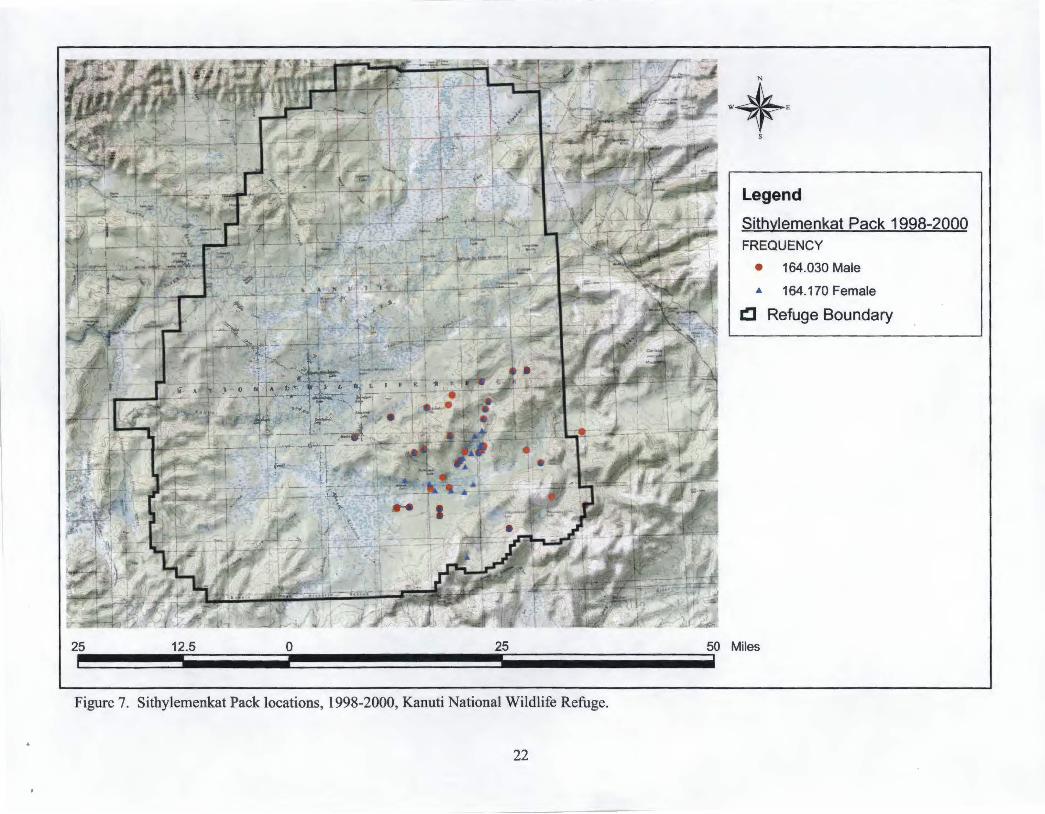
25 12.5 0 25 -Figure 7. Sithylemenkat Pack locations, 1998-2000, Kanuti National Wildlife Refuge.
22
.• , s
Legend
Sithylemenkat Pack 1998-2000 FREQUENCY
• 164.030 Male
• 164.170 Female
~ Refuge Boundary
50 Miles
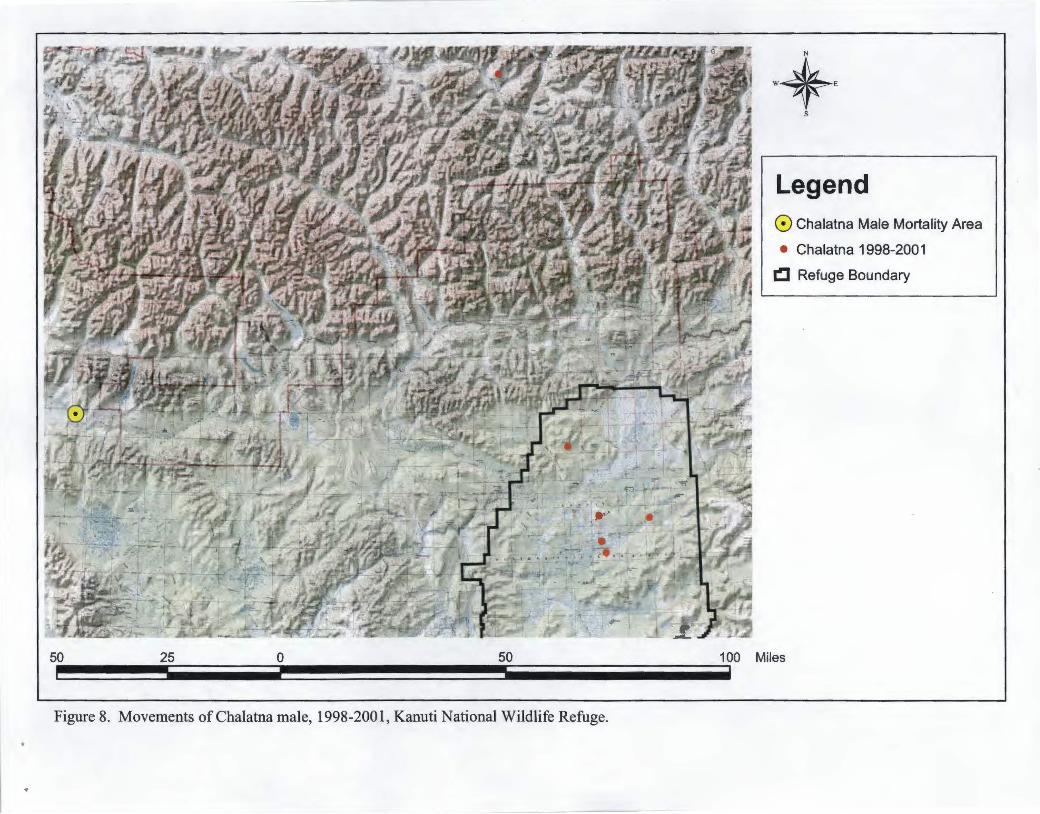
50 25 0 50
Figure 8. Movements ofChalatna male, 1998-2001, Kanuti National Wildlife Refuge.
N
·•· s
Legend 0 Chalatna Male Mortality Area
• Chalatna 1998-2001
fl Refuge Boundary
100 Miles