Embed Size (px)
Citation preview
Wood Green Town Centre Regeneration Retail Capacity Assessment London Borough of Haringey
17 February 2016
14590/PW/PW
Nathaniel Lichfield & Partners 14 Regent's Wharf All Saints Street London N1 9RL nlpplanning.com

This document is formatted for double sided printing. © Nathaniel Lichfield & Partners Ltd 2016. Trading as Nathaniel Lichfield & Partners. All Rights Reserved. Registered Office: 14 Regent's Wharf All Saints Street London N1 9RL All plans within this document produced by NLP are based upon Ordnance Survey mapping with the permission of Her Majesty’s Stationery Office. © Crown Copyright reserved. Licence number AL50684A
Wood Green Town Centre Regeneration : Retail Capacity Assessment
10675122v1
Contents
1.0 Introduction 1
Background ...................................................................................................... 1
2.0 Recent Changes and Retail Trends 2
Retail and High Street Trends .......................................................................... 2
3.0 Retail Need Assessment 8
Introduction ...................................................................................................... 8
Study Area ....................................................................................................... 8
Population and Expenditure ............................................................................. 9
Existing Retail Floorspace ................................................................................ 9
Existing Spending Patterns 2016 ................................................................... 10
Qualitative Need in Wood Green .................................................................... 13
4.0 Conclusions and Strategy Implications 18

Wood Green Town Centre Regeneration : Retail Capacity Assessment
10675122v1 P1
1.0 Introduction
Background
1.1 Nathaniel Lichfield & Partners (NLP) was commissioned by the London
Borough of Haringey to prepare the Haringey Retail and Town Centre Study
published in 2013 (HRTC 2013).
1.2 Haringey Council has commissioned a comprehensive delivery and investment
plan for the regeneration of Wood Green Town Centre. This work will inform
the Council’s emerging Action Area Pan for the Town Centre.
1.3 In order to feed into this on-going work, NLP has been commissioned by
Haringey Council to provide independent retail planning advice to undertake a
partial update of the HRTC, and to highlight the implications for the proposed
regeneration of Wood Green town centre.
1.4 The update provides more robust information on future expenditure-based
capacity for comparison and convenience goods floorspace in Wood Green.
The key elements of work updated include:
1 revised retail floorspace data for Wood Green town centre based on the
latest Goad Plan data;
2 updated turnover estimates for existing and proposed retail floorspace
within Wood Green town centre;
3 Experian’s latest 2014 local expenditure data;
4 2011 census and GLA's 2014 round of population projections;
5 Experian’s latest (October 2015) expenditure growth projections and
home shopping projections;
6 update of benchmark turnovers for existing food stores (Mintel November
2015 data);
7 impact implications of commitments implemented since 2013 and
pipeline proposals including Brent Cross; and
8 market commentary of recent changes and forecast for home shopping
and how these will influence the demand for new floorspace and retail
capacity projections.
Wood Green Town Centre Regeneration : Retail Capacity Assessment
P2 10675122v1
2.0 Recent Changes and Retail Trends
Retail and High Street Trends
2.1 This section considers the changes in the retail sector nationally and the
implications for Haringey Borough and Wood Green.
2.2 The economic downturn had a significant impact on the retail sector. A large
number of national operators failed (e.g. Phones 4 U, Blockbuster, Comet,
HMV, JJB Sports, Jessops, Clinton Cards, Woolworths, MFI, Land of Leather,
Borders, Game, Firetrap, Peacocks, La Senza, Past Times, Barratts and
Habitat), leaving major voids within town centres and on retail parks.
2.3 Many town centre development schemes were delayed or cancelled. The
demand for traditional retail warehouse operators was, and still is affected. The
main food store operators have seen a reduction in growth, with proposed new
foods cancelled.
2.4 Assessing future expenditure levels within this study needs to take into account
the likely speed of the economic recovery. Careful consideration is needed to
establish the appropriate level of expenditure growth to be adopted. This study
takes a long term view recognising the cyclical nature of expenditure growth.
Trends in population growth, home shopping/internet sales and growth in
turnover efficiency also need to be carefully considered and a balanced
approach taken.
2.5 An overview of national trends within the retail sector is set out below.
Expenditure Growth
2.6 Historic retail trends indicate that expenditure has consistently grown in real
terms in the past, generally following a cyclical growth trend. The underlying
trend shows consistent growth and this trend is expected to continue in the
future. However the recovery from the economic downturn is expected to result
in slower growth in the short term.
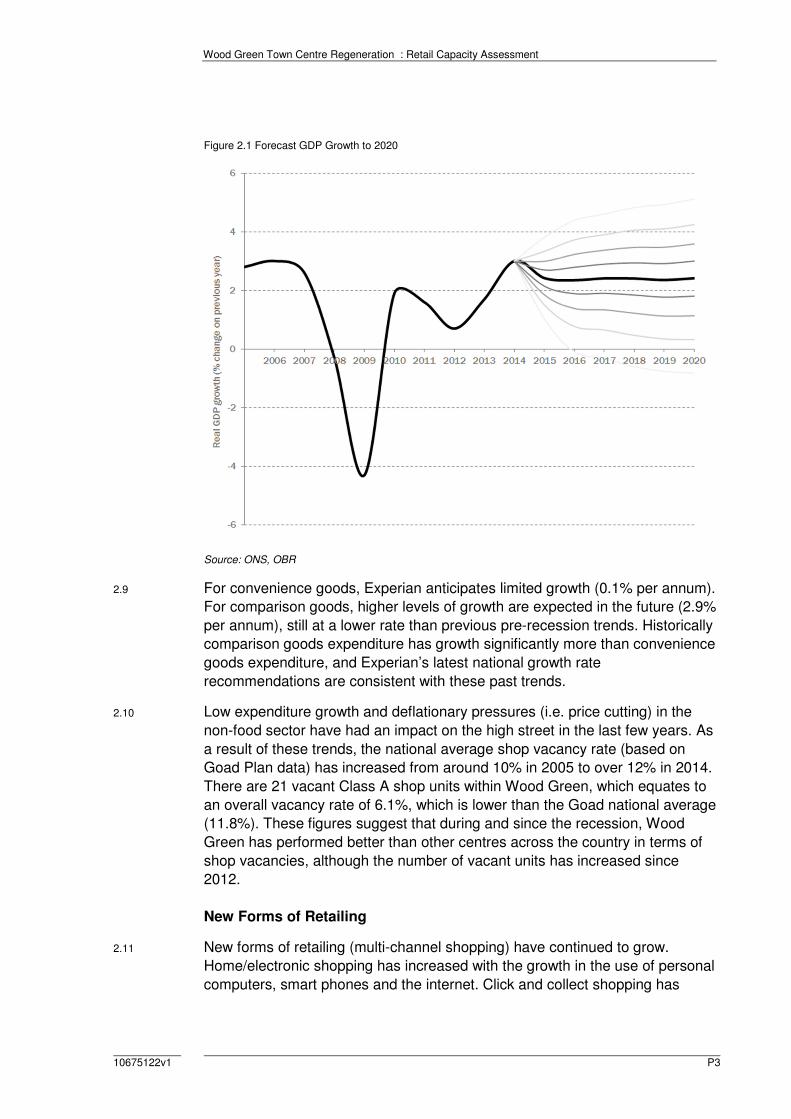
2.7 Figure 3.1 shows the Office for Budget Responsibility’s (OBR) forecast for
GDP up to 2020. After the recession in 2008, growth rebounded and from 2012
grew to the high of 3% in 2014. The OBR forecasts that growth will be slightly
above 2% per year from 2015 onwards.
2.8 In the past, expenditure growth has fuelled growth in retail floorspace, including
major out-of-centre development, particularly in the 1980s and 1990s. The
speed of recovery from the economic downturn has been slow. The high pre-
recession growth rates are unlikely to be achieved in the short term, but the
underlying trend over the medium and long terms is expected to lead to a need
for further modern retail floorspace, even allowing for continued growth in
home shopping. These national trends are anticipated to be mirrored in
Haringey.
Wood Green Town Centre Regeneration : Retail Capacity Assessment
10675122v1 P3
Figure 2.1 Forecast GDP Growth to 2020
Source: ONS, OBR
2.9 For convenience goods, Experian anticipates limited growth (0.1% per annum).
For comparison goods, higher levels of growth are expected in the future (2.9%
per annum), still at a lower rate than previous pre-recession trends. Historically
comparison goods expenditure has growth significantly more than convenience
goods expenditure, and Experian’s latest national growth rate
recommendations are consistent with these past trends.
2.10 Low expenditure growth and deflationary pressures (i.e. price cutting) in the
non-food sector have had an impact on the high street in the last few years. As
a result of these trends, the national average shop vacancy rate (based on
Goad Plan data) has increased from around 10% in 2005 to over 12% in 2014.
There are 21 vacant Class A shop units within Wood Green, which equates to
an overall vacancy rate of 6.1%, which is lower than the Goad national average
(11.8%). These figures suggest that during and since the recession, Wood
Green has performed better than other centres across the country in terms of
shop vacancies, although the number of vacant units has increased since
2012.
New Forms of Retailing
2.11 New forms of retailing (multi-channel shopping) have continued to grow.
Home/electronic shopping has increased with the growth in the use of personal
computers, smart phones and the internet. Click and collect shopping has
Wood Green Town Centre Regeneration : Retail Capacity Assessment
P4 10675122v1
become more popular. The future growth of multi-channel retailing including
home computing, internet connections and interactive TV will continue to have
an effect on retailing in the high street and from traditional stores. Trends within
this sector will have implications for retailing within Wood Green and Haringey.
2.12 Recent trends suggest continued strong growth in this sector. Experian’s Retail
Planner Briefing Note 13 (October 2015) states:
“The strong increase in online shopping in the past decade has lifted the share
of special forms of trading (SFT) to a level where it now accounts for over a
tenth of total retail sales…
The rising share of internet sales in total retail transactions dominates the
picture of SFT. Internet sales’ share of total retail sales stood at 11.7% in mid-
2015 against 4.7% in June 2008...
…non-store retailing continues to grow rapidly, outpacing traditional forms of
spending. We retain our assumption that non-store retailing will increase at a
faster pace than total retail sales well into the long term. There were 57.3
million internet users in the UK (representing 88.4% of the population) in mid-
year 2014 according to Internet World Stats. So growth of the internet user
base will be less of a driver than in the past decade. But growth momentum will
be sustained as new technology such as browsing and purchasing through
mobile phones and the development of interactive TV shopping boost internet
retailing. We expect that the SFT market share will continue to increase over
the forecast period, although the pace of e-commerce growth will moderate
markedly after about 2020. Our forecast has the SFT share of total retail sales
reaching 17.8% by 2020 rising to 19.6% by the mid-2030s.”
2.13 This retail update makes an allowance for future growth in e-tailing based on
Experian projections. It will be necessary to monitor the amount of sales
attributed to home shopping in the future in order to review future policies and
development allocations.
2.14 The implications for the demand for retail space have been carefully
considered. Some retailers operate on-line sales from their traditional retail
premises e.g. food store operators and click and collect operations, therefore
growth in on-line sales may not always mean there is a reduction in the need
for retail floorspace.
2.15 Given the likelihood that multi-channel shopping is likely to grow at a faster
pace than total retail expenditure, the retail study assessment has adopted
relatively cautious growth projections for retail expenditure (as set out in the
retail capacity methodology, Appendix 1), and allowance has been made for
retailers to increase their turnover density, due to growth in home shopping
and click and collect.
2.16 In addition to new forms of retailing, retail operators have responded to
changes in customers’ requirements. Retailers have also changed their trading
formats to include smaller store formats capable of being accommodated
within town centres (such as the Tesco Express/Metro, Sainsbury’s Central/
Local store and Marks and Spencer’s Simply Foods formats). The number of
Wood Green Town Centre Regeneration : Retail Capacity Assessment
10675122v1 P5
Tesco Express, Sainsbury’s Local and Little Waitrose stores has increased
significantly during the last decade. This trend has been particularly evident in
Haringey, with numerous local convenience stores operated by the main food
store retailers e.g. Sainsbury’s and Tesco
2.17 A number of proposed larger food stores have not been implemented across
the country, but this trend is less evident in London, perhaps due to the high
growth in population and the absence of available sites for larger food stores.
2.18 The expansion of European discount food operators Aldi and Lidl has been
rapid during the last decade. This is evident in Haringey, which currently has
an Aldi store and three Lidl stores.
2.19 Comparison retailers have also responded to market conditions. The bulky
goods warehouse sector has rationalised, including a number of mergers and
failures, and scaled down store sizes. Other traditional high street retailers
often seek large out-of-centre stores, for example Boots, Next, TK Maxx and
Poundstretcher. Matalan has also opened numerous discount clothing stores
across the UK. Sports clothing retail warehouses including Decathlon have
also expanded out-of-centre.
2.20 The charity shop sector has grown steadily over the past 20 years and there is
no sign this trend will halt. In many centres, charity shops have occupied
vacated shop premises during the recession. In many cases charity shops can
afford higher rents than small independent occupiers because of business rate
discounts, therefore it does not follow that these charity shops will be replaced
by traditional shops when the market recovers, particularly in secondary
frontages. This trend is evident in Wood Green although charity shops account
for 4.5% of all comparison shops within Wood Green, compared with the
national average of 8.4%.
2.21 The discount comparison sector has also grown significantly in recent years
e.g. pound shops. This sector is well represented in Wood Green.
2.22 The growth of money lending/pay day loan shops and betting shops has also
raised concerns amongst planning authorities, and has resulted in a change to
permitted development rights in order to control the growth of these uses in
town centres. Again this trend is evident in Wood Green.
2.23 Within town centres, many high street multiple comparison retailers have
changed their format. For over a decade, high street national multiples have
increasingly sought larger modern shop units (over 200 sq.m) with an
increasing polarisation of activity into the larger national, regional and sub-
regional centres, e.g. Central London, Brent Cross, Westfield and Lakeside.
2.24 In general operator demand for space has decreased during the recession
and, of those national multiples looking for space, many prefer to locate in
larger centres.
2.25 The demand for premises within the bulky goods sector, i.e. furniture, carpets,
electrical and DIY goods, has been particularly weak during and after the
Wood Green Town Centre Regeneration : Retail Capacity Assessment
P6 10675122v1
recession. This has led to voids on retail warehouse parks and proposals to
extend the range of goods sold to non-bulky goods.
2.26 The continuation of these trends will influence future operator requirements in
Wood Green with smaller vacant units becoming less attractive for new
multiple occupiers, and retailers increasingly looking to relocate into larger
units in higher order centres. However, smaller vacant units could still be
attractive to independent traders and non-retail services.
2.27 Recent and proposed changes to the General Permitted Development Order
(GPDO) may also have an impact on town centres. These measures allow for
greater flexibility for changes of use from retail to non-retail uses e.g. Class A
uses to C3 residential use and Class A1 to A2 use. These measures could
change the composition of town centres, in particular the amount of Class A1
space could reduce. The measures may lead to a reduction in vacant shop
premises, particularly in peripheral shop frontages, but this could have an
impact on the ability of operators to find space, in areas where demand is high.
It is unlikely these changes will have a significant impact on Wood Green,
because the centre already has a broad mix of retail and non-retail uses.
2.28 These trends are not new and have been affecting the High Street for many
years. In response to these trends, town centres have changed and diversified.
The food and beverage, leisure and non-retail service sectors have been
successful in occupying space no longer suitable for shopping. There have
been cyclical trends in vacancy rates reflecting the macro economic trends, but
in most cases town centres recovered during periods of stronger growth. The
High Street is more resilient than many commentators give it credit.
2.29 Shopping behaviour will continue to change and the High Street will need to
continue to respond. All town centres will need to focus on the advantages they
have over other forms of multi-channel shopping, for example using the
internet as an extended shop window, click and collect facilities and providing a
combined retail and leisure experience. There will always be demand for a day
out and customers cannot eat or drink on-line.
Services, Food and Beverage
2.30 Service uses perform an important role in the overall offer of a centre, and
encourage customers to shop locally. The service uses are categorised as
follows:
• Class A1 services cover a range of uses, including hairdressers, dry
cleaners, travel agents, some sandwich shops (those not categorised as
Class A3), funeral parlours and post offices.
• Class A2 services include banks, building societies, financial services,
betting offices, pawnbrokers, estate agents and employment agencies.
• Class A3/A5 includes restaurants, cafés (A3) and takeaways (A5).
• Class A4 pubs/bars (Class A4).

Wood Green Town Centre Regeneration : Retail Capacity Assessment
10675122v1 P7
2.31 Food and beverages is a fast moving and creative sector, with a steady flow of
new concepts emerging. Within this sector there has been a significant
increase in the number of national multiple chains. These national chains have
sought to increase their geographical coverage. These types of food and drink
operators (Class A3 and A4) i.e. restaurants, bars and pubs have supported
other major leisure uses, in particular cinema developments. Within town
centres, the demand has increased, including a significant expansion in the
number of coffee shops, such as Starbucks, Costa Coffee and Café Nero.
Themed restaurants have also expanded rapidly.
2.32 The key categories for food and beverage offers are:
1 impulse: characterised by their produce range that is typically highly
visual and hand-held so that it can be eaten “on the go”;
2 speed eating fast food: food that can be purchased and consumed
quickly, therefore price is low and ambience is less important. This sector
is dominated by traditional high volume fast food offers such as burgers
and fried chicken;
3 refuel and relax: a drink and snacks and a short break in a pleasant
environment rather than focusing on eating a main meal; and
4 casual dining/leisure dining: incorporating a number of food styles,
types and ethnic origins. The ambience and environment of casual dining
is as important as the food, drink and service provided. The style is
informal but is normally table service.
2.33 Food and beverage establishments (Class A3, A4 and A5) including
restaurants, bars and pubs have supported other major leisure uses on leisure
and retail parks and are important services within town and local centres.
National information available from Experian Goad indicates that the proportion
of non-retail uses within town centres across the country has increased
significantly. A balance between Class A1 and Class A3 to A5 uses needs to
be maintained.
Conclusions
2.34 The challenge for town centres generally, and within Wood Green specifically,
will be to capitalise on this growth by securing much needed investment. There
will be continued scope for Wood Green to diversify, for example the evening
economy, leisure and entertainment and more focus on convenience and
service, but comparison retail will still be the driver of growth.
2.35 The delivery of town centre redevelopment opportunities will be the priority.
There will be a requirement to build more retail floorspace within Wood Green,
not only to boost its retail offer and compete effectively with other centres, but
also to secure investment in the centre.
Wood Green Town Centre Regeneration : Retail Capacity Assessment
P8 10675122v1
3.0 Retail Need Assessment
Introduction
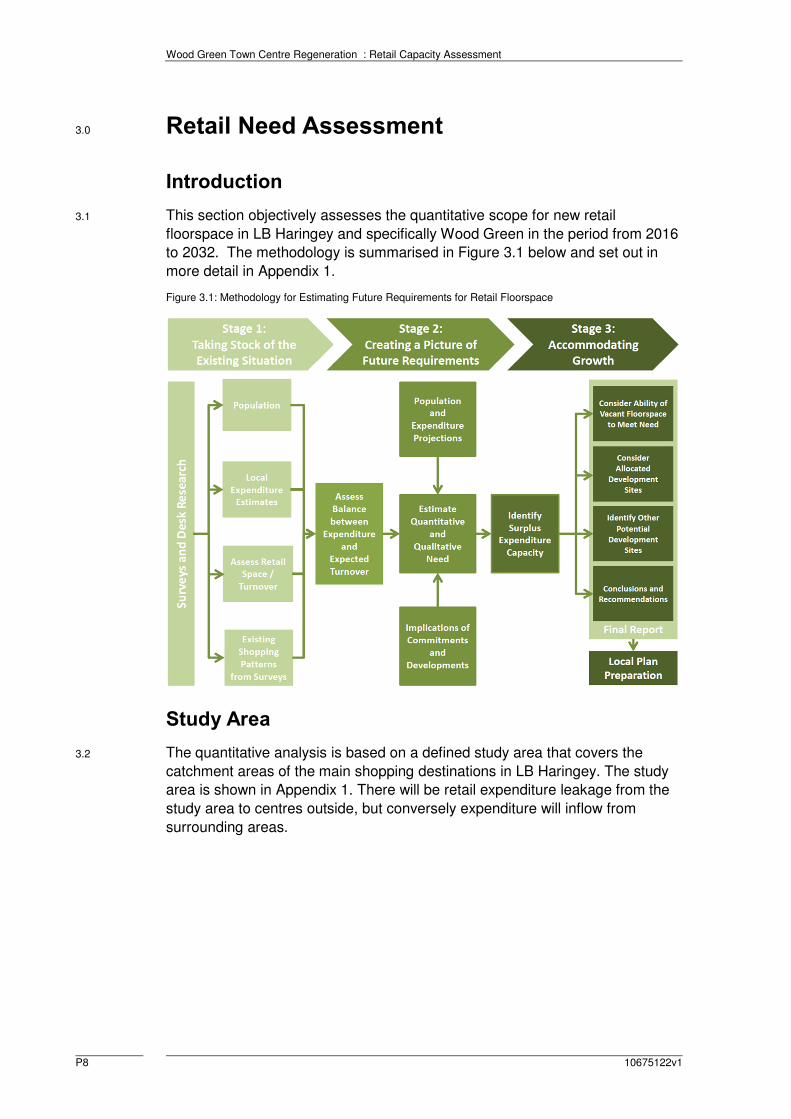
3.1 This section objectively assesses the quantitative scope for new retail
floorspace in LB Haringey and specifically Wood Green in the period from 2016
to 2032. The methodology is summarised in Figure 3.1 below and set out in
more detail in Appendix 1.
Figure 3.1: Methodology for Estimating Future Requirements for Retail Floorspace
Study Area
3.2 The quantitative analysis is based on a defined study area that covers the
catchment areas of the main shopping destinations in LB Haringey. The study
area is shown in Appendix 1. There will be retail expenditure leakage from the
study area to centres outside, but conversely expenditure will inflow from
surrounding areas.
Wood Green Town Centre Regeneration : Retail Capacity Assessment
10675122v1 P9
Population and Expenditure
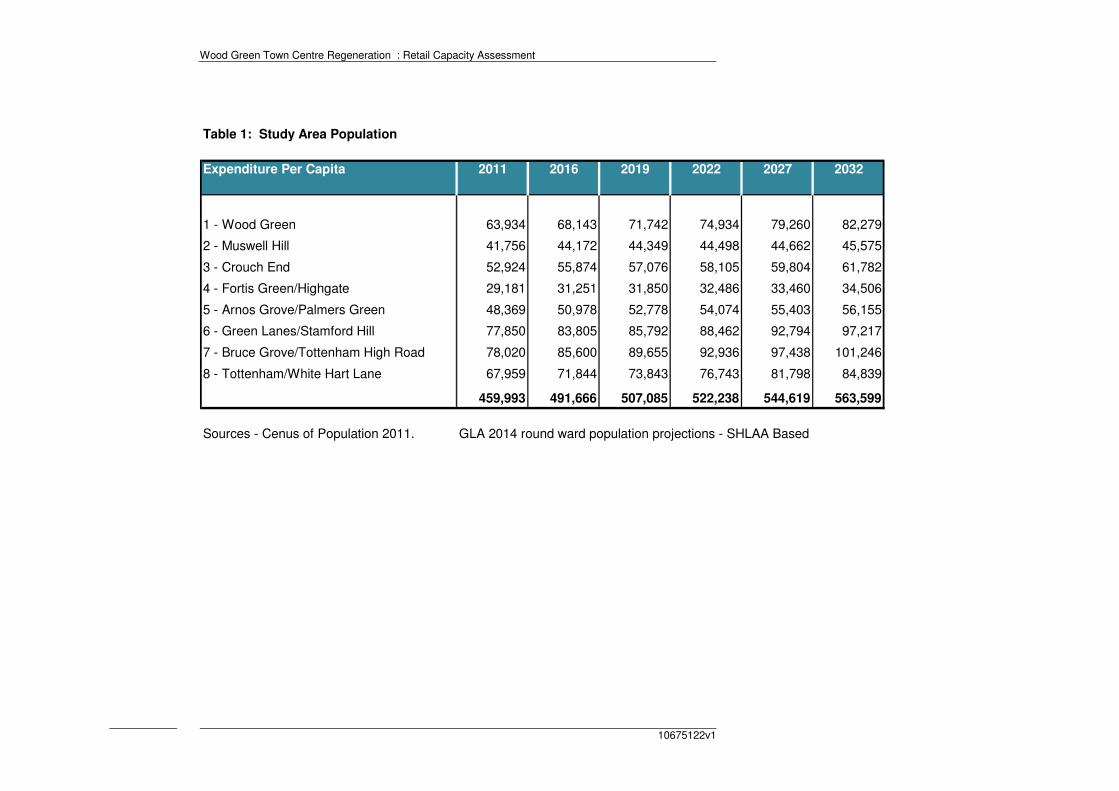
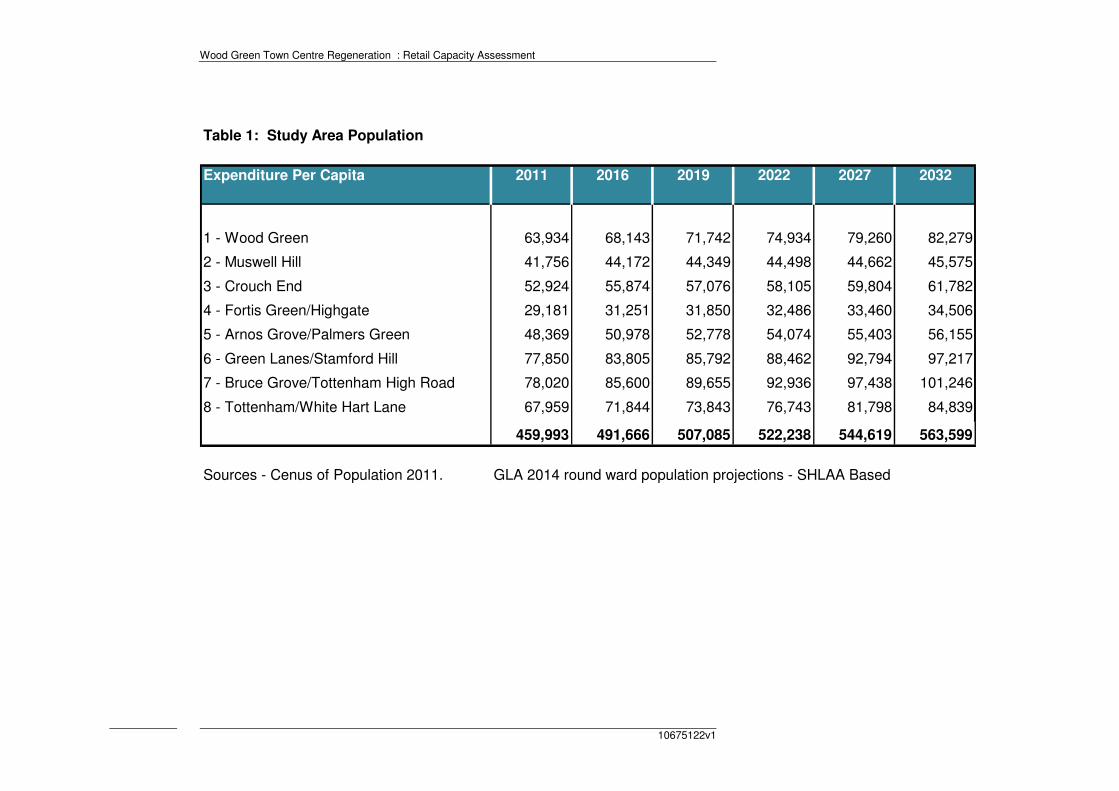
3.3 The study area population for 2011 to 2032 is set out in Table 1 in Appendix 2.
The 2011 base year population for each zone has been obtained and projected
to 2031 using the GLA 2014 Round of Demographic Projections ward (SHLAA
bases) projections.
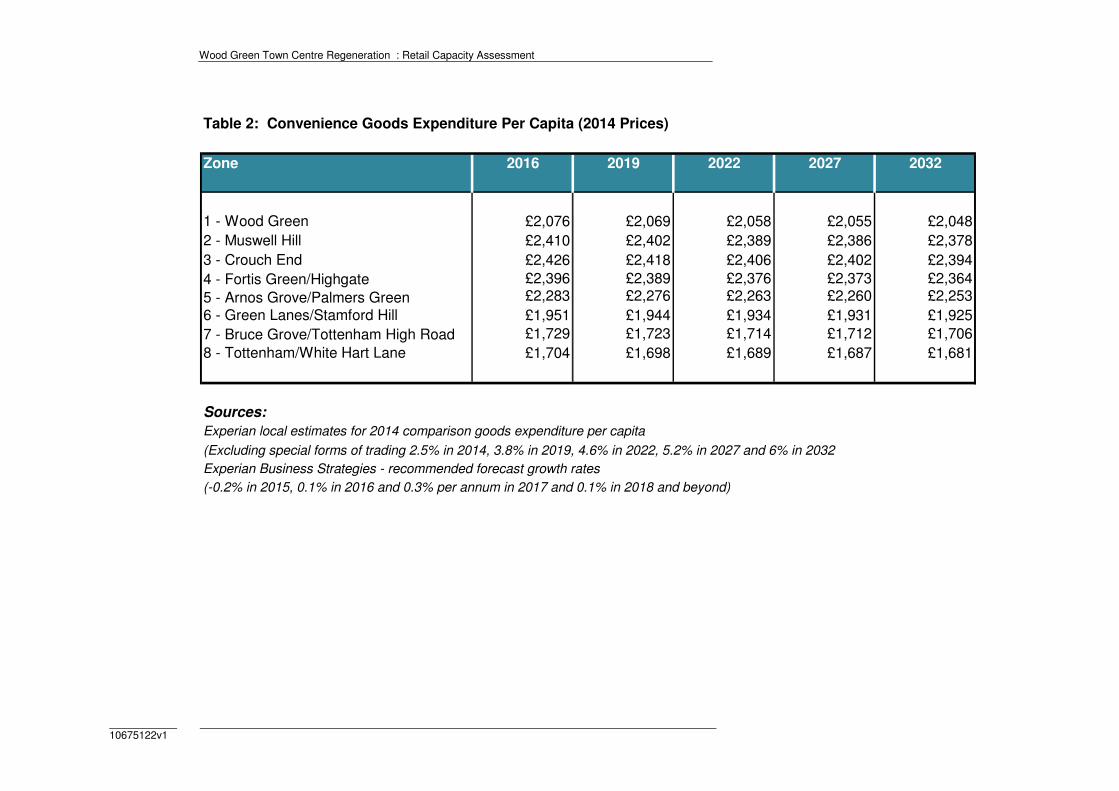
3.4 Table 2 in Appendix 2 sets out the forecast growth in spending per head for
convenience goods within each zone in the study area up to 2032. Forecasts
of comparison goods spending per capita are shown in Table 2 in Appendix 3.
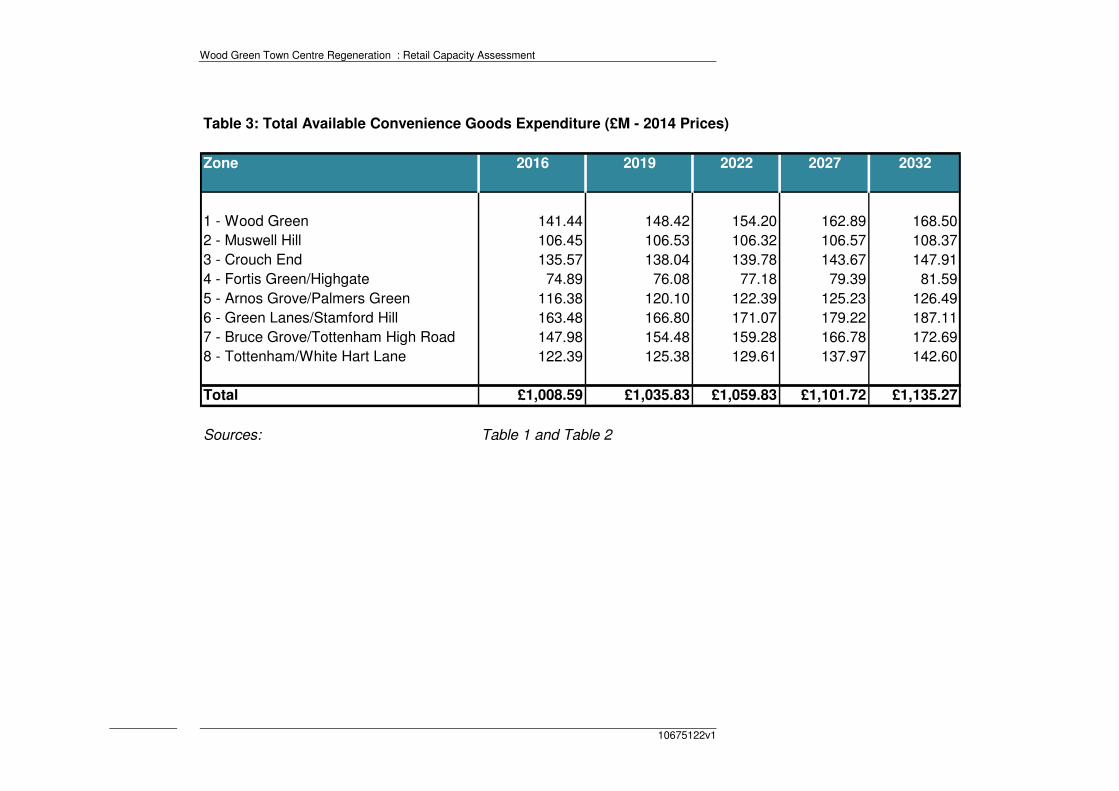
3.5 Based on the GLA population projections, as a consequence of growth in
population and per capita spending, convenience goods spending within the
study area is forecast to increase by 12.6% from £1,008 million in 2016 to
£1,135 million in 2032, as shown in Table 3 (Appendix 2).
3.6 Comparison goods spending is forecast to increase by 84% between 2014 and
2031, increasing from £1,543 million in 2014 to £2,836 million in 2031, as
shown in Table 3 (Appendix 3).
3.7 It should be noted that comparison goods spending is forecast to increase
more than convenience spending as the amount spent on food and beverage
does not increase proportionately with disposable income, whereas spending
on non-food goods is more closely linked to income.
3.8 These figures relate to real growth and exclude inflation.
Existing Retail Floorspace
3.9 Existing convenience goods retail sales floorspace within Haringey is around
52,700 sq.m net, as set out in Table 10 in Appendix 2. This floorspace figure
excludes comparison sales floorspace within food stores. This floorspace is
relatively evenly spread throughout the Borough. The amount of convenience
goods sales floorspace has increase from 48,700 sq.m net in 2012, due
primarily to the new Sainsbury’s store at Northumberland Park in Tottenham.
3.10 Within the Wood Green area convenience goods sales floorspace is around
10,500 sq.m net, about 20% of the Borough total.
3.11 Comparison goods retail floorspace within Haringey was estimated to be
around 101,400 sq.m net in 2012, of which 40,700 sq.m net (40%) was located
in Wood Green (including 1,600 sq.m net non-food within food stores). This net
sales floorspace was based on a Goad Plan gross floorspace figure of 55,800
sq.m gross (assuming a net to gross ratio of 70%). Despite the reduction in
comparison shop units in Wood Green (182 to 154), Goad indicates that the
amount of comparison goods floorspace has increased marginally to 57,200
sq.m gross, and therefore the revised sales floorspace estimate is 41,600 sq.m
net (including 1,600 sq.m net non-food within food stores).
Wood Green Town Centre Regeneration : Retail Capacity Assessment
P10 10675122v1
Existing Spending Patterns 2016
3.12 The results of the household shopper questionnaire survey undertaken by
NEMS in September 2012 were adopted to estimate base year shopping
patterns within the study area zones.
3.13 The market penetration rates were adjusted to take into account planned
commitments e.g. the new Sainsbury’s at Northumberland Park and
replacement Aldi store. Future penetration rates were adjusted to reflect the
implementation of these commitments. The adjusted future penetration rates
have been revisited to provide new base year shopping patterns at 2016.
Convenience Shopping
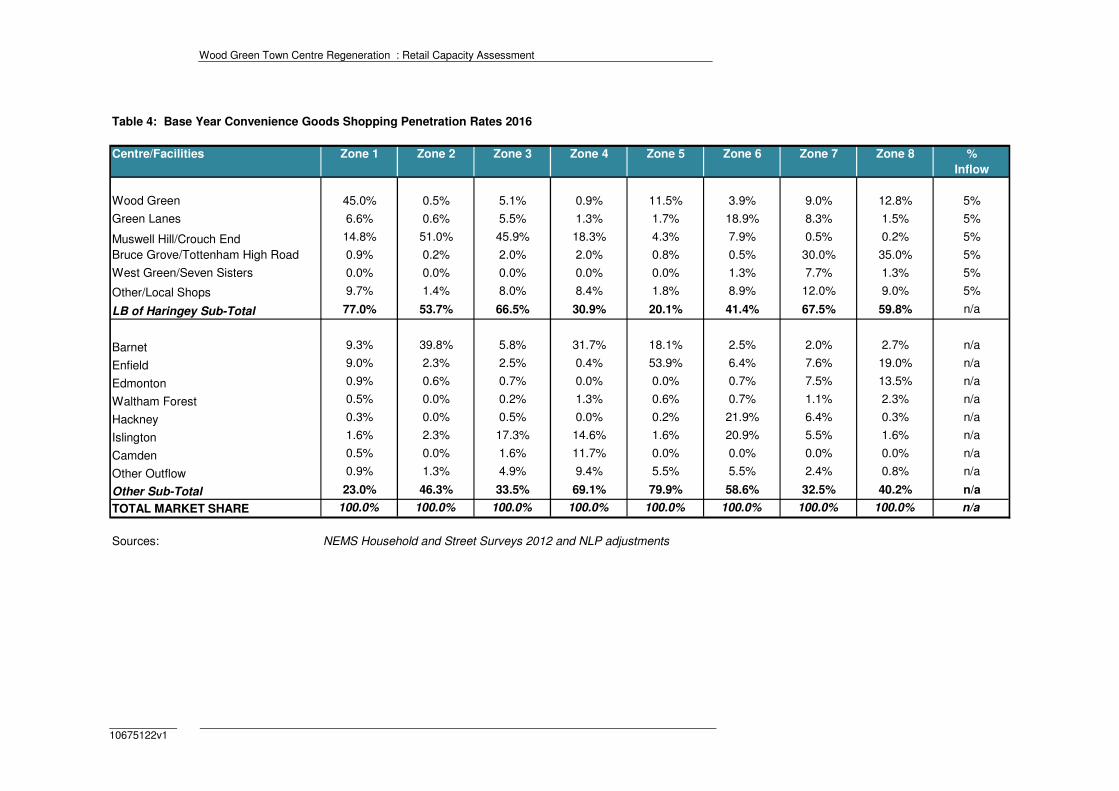
3.14 The adjusted estimates of market share or penetration within each study area
zone are shown in Table 4, Appendix 2.
3.15 Table 4 (Appendix 2) indicates the proportion of convenience goods
expenditure retained within Borough from residents in the Wood Green area
(Zone 1) is relatively high at 77%. Based on NLP’s experience from other
recent studies across London, this level of convenience goods expenditure
retention is relatively high. There appears to be limited scope to increase the
retention of convenience goods expenditure within the Wood Green area.
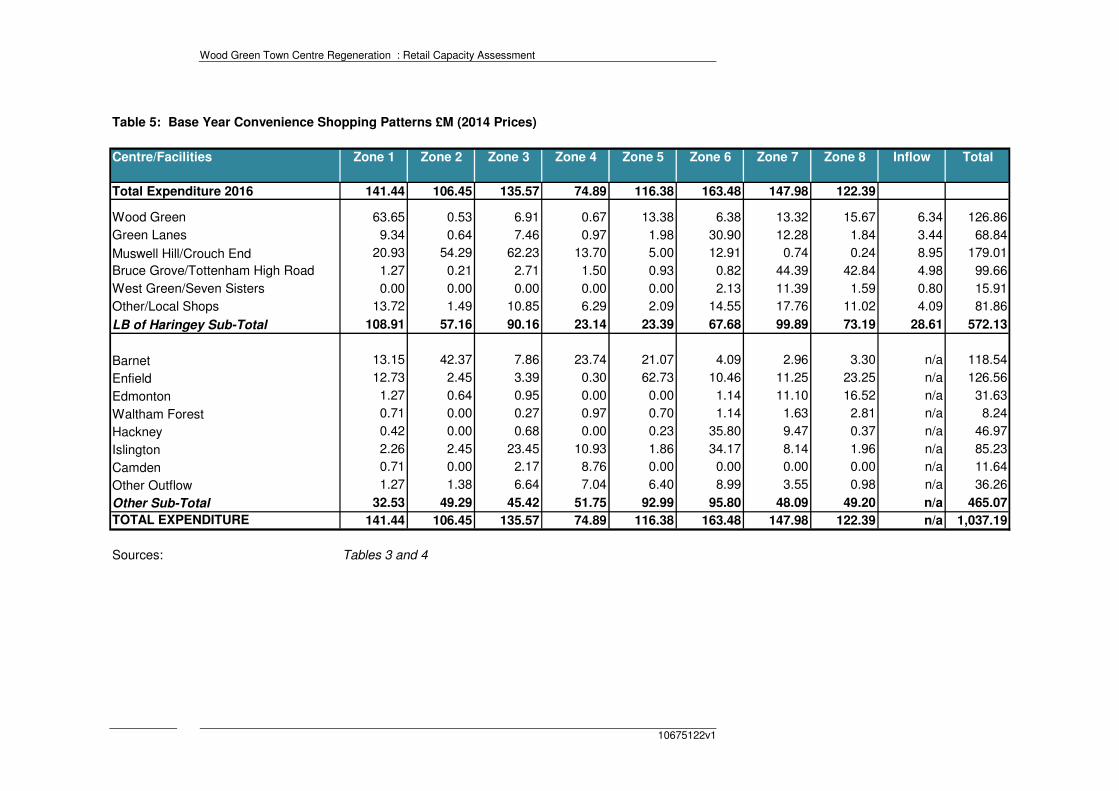
3.16 The level of convenience goods expenditure attracted to shops/stores in LB
Haringey in 2016 is estimated to be £572 million as shown in Table 5,
Appendix 2. This includes estimates of inflow from beyond the study area,
applying the adjusted market shares set out in Table 4.
3.17 The total benchmark turnover of identified existing convenience sales
floorspace within Haringey, based on company average sales densities is £496
million (Table 10 in Appendix 2), compared with the actual turnover of £572
million. These figures suggest that convenience retail sales floorspace in the
Borough is trading healthily at 15% above the expected benchmark. This
suggests a base year expenditure surplus of £76 million.
3.18 Within Wood Green the base year turnover of convenience goods facilities is
estimated to be £127 million, compared with the expected benchmark turnover
of £101 million, which suggests trading levels about 25% above expected
levels. Based on NLP’s recent experience, food stores within London tend to
trade above national average sales densities, which may reflect higher
property costs and over heads. Furthermore, food stores in London tend to be
smaller with less circulation space and therefore the sales density per unit of
floorspace is likely to be higher.
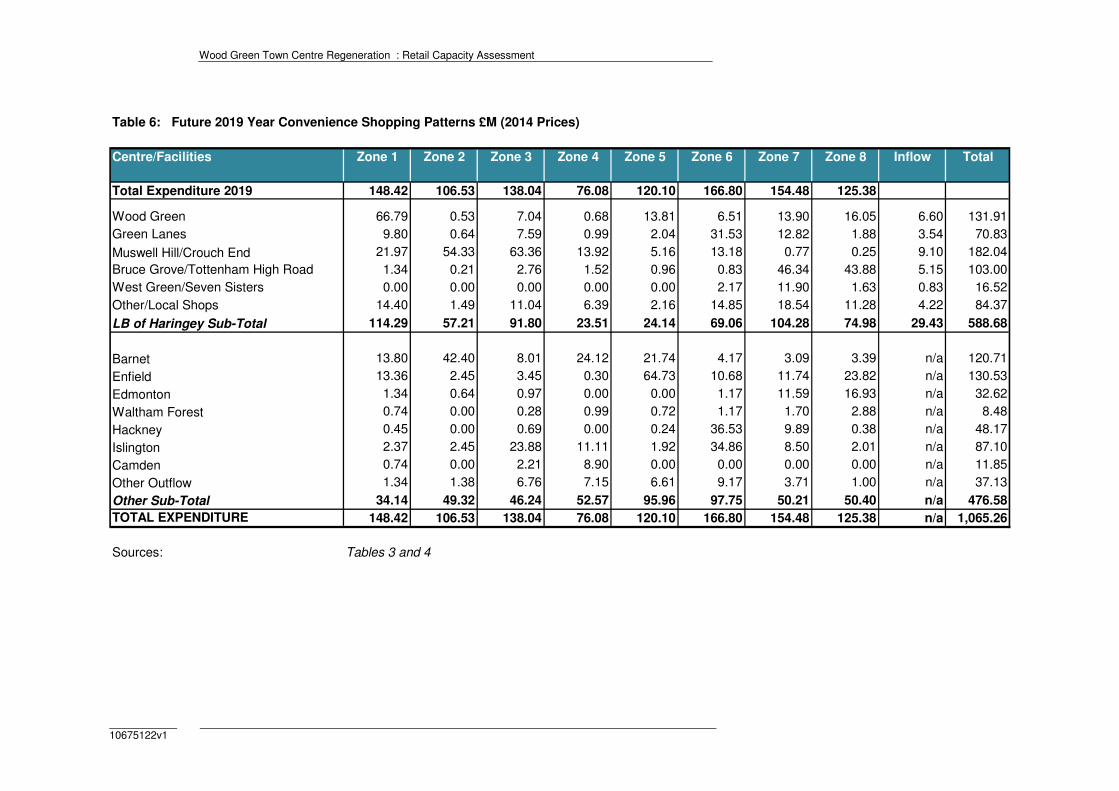
3.19 The future levels of available convenience goods expenditure in 2019, 2022,
2027 and 2032 are shown at Tables 6 to 9 in Appendix 2. These projections
are based on constant market shares. The total level of convenience goods
expenditure available for shops in Haringey between 2016 and 2032 is
summarised in Table 11 in Appendix 2. Allowing for population and
Wood Green Town Centre Regeneration : Retail Capacity Assessment
10675122v1 P11
expenditure per capita growth and increased market shares, convenience
goods expenditure available to shopping facilities in the Borough is expected to
increase from £572 million in 2016 to £603 million in 2022, an additional £31
million. Available expenditure will increase by a further £45 million by 2032, to
£648 million.
3.20 Available convenience good expenditure attracted to Wood Green is estimated
to increase from £126 million in 2016 to £147 million in 2032, an increase of
£21 million.
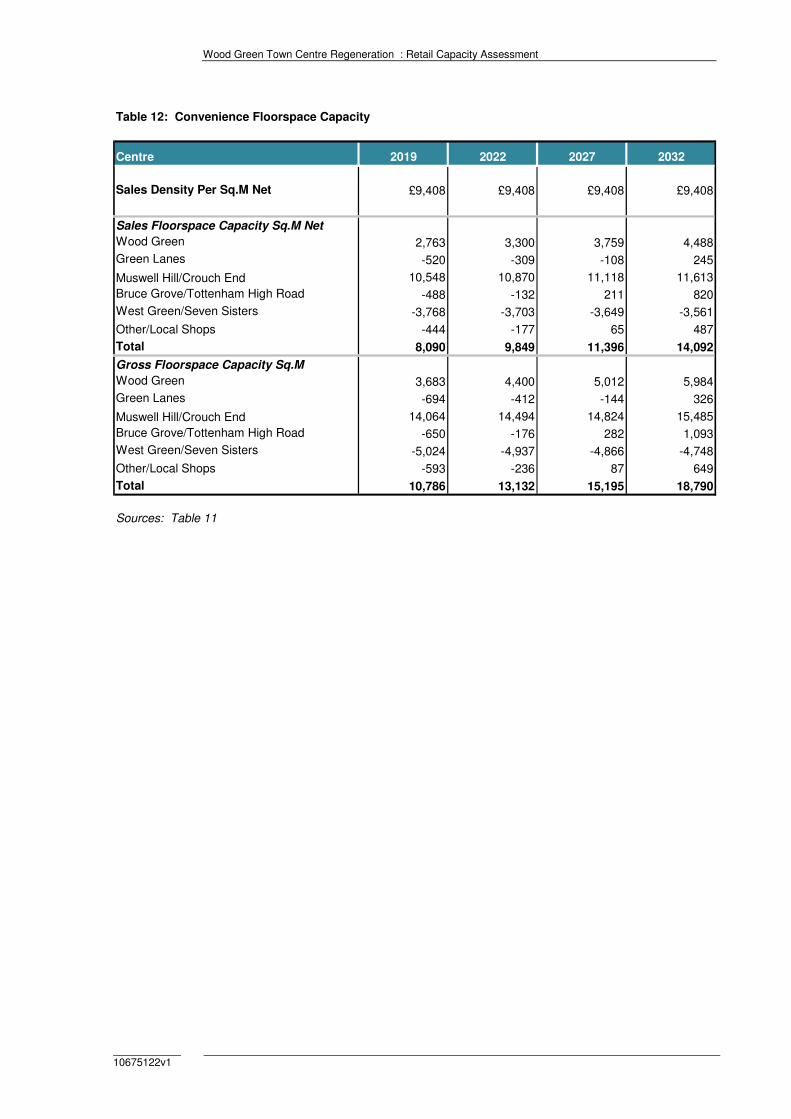
3.21 The expenditure projections are converted into potential new floorspace
estimates in Table 12 in Appendix 2. Expenditure growth is converted into
floorspace estimates based on an assumed average sales density figure for
the main food supermarket operators (for all store formats). An average sales
density of £9,408 per sq.m net has been adopted, which reflects the current
mix of floorspace within the Borough. No increase in sales density has been
assumed for convenience goods, in line with Experian forecasts.
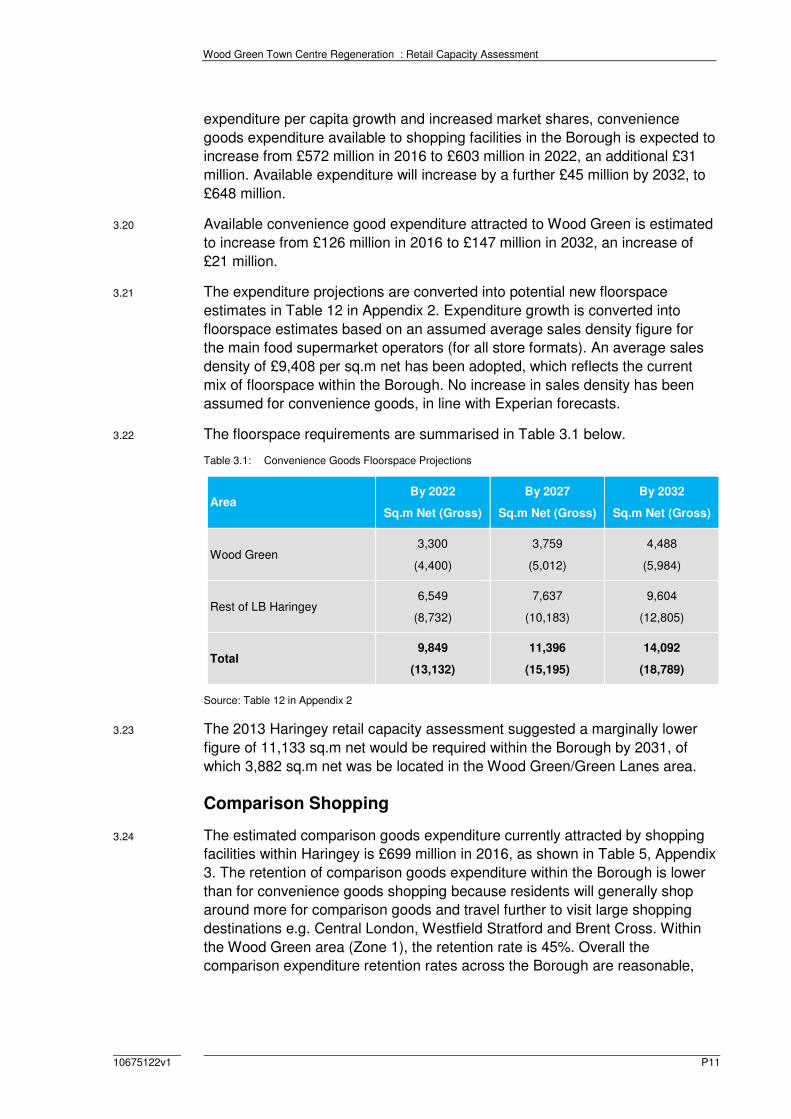
3.22 The floorspace requirements are summarised in Table 3.1 below.
Table 3.1: Convenience Goods Floorspace Projections
Area By 2022
Sq.m Net (Gross)
By 2027
Sq.m Net (Gross)
By 2032
Sq.m Net (Gross)
Wood Green 3,300
(4,400)
3,759
(5,012)
4,488
(5,984)
Rest of LB Haringey 6,549
(8,732)
7,637
(10,183)
9,604
(12,805)
Total 9,849
(13,132)
11,396
(15,195)
14,092
(18,789)
Source: Table 12 in Appendix 2
3.23 The 2013 Haringey retail capacity assessment suggested a marginally lower
figure of 11,133 sq.m net would be required within the Borough by 2031, of
which 3,882 sq.m net was be located in the Wood Green/Green Lanes area.
Comparison Shopping
3.24 The estimated comparison goods expenditure currently attracted by shopping
facilities within Haringey is £699 million in 2016, as shown in Table 5, Appendix
3. The retention of comparison goods expenditure within the Borough is lower
than for convenience goods shopping because residents will generally shop
around more for comparison goods and travel further to visit large shopping
destinations e.g. Central London, Westfield Stratford and Brent Cross. Within
the Wood Green area (Zone 1), the retention rate is 45%. Overall the
comparison expenditure retention rates across the Borough are reasonable,
Wood Green Town Centre Regeneration : Retail Capacity Assessment
P12 10675122v1
based on NLP’s recent experience across London, and reflect the influence of
higher order centres.
3.25 The implementation of new investment could provide scope to increase the
retention of comparison goods expenditure within the Wood Green area, but
conversely expansion at Brent Cross and Westfield Stratford may increase
expenditure leakage.
3.26 Based on the base year estimate of comparison goods expenditure attracted to
facilities within the Borough, the average sales density for existing comparison
sales floorspace (102,300 sq.m net) is £6,833 per sq.m net. The average
sales density in Wood Green is £6,814 per sq.m net. The Borough average
was £5,420 per sq.m net in 2012, which suggest sales densities have grown by
26% between 2012 and 2016. Overall comparison retail floorspace within the
Borough and Wood Green is trading healthily.
3.27 Available comparison goods expenditure has been projected forward to 2019,
2022, 2027 and 2032 in Tables 5 to 9 in Appendix 3, based on constant market
shares and summarised in Table 10. Available comparison expenditure to
facilities within Haringey is expected to increase from £699 million in 2016 to
£1,301 million in 2032.
3.28 Available comparison good expenditure attracted to Wood Green is estimated
to increase from £283 million in 2016 to £533 million in 2032, an increase of
£250 million.
3.29 For the purposes of this assessment, the existing comparison goods
floorspace is estimated to be trading at equilibrium in 2016 (i.e. satisfactory
levels). Table 10 assumes that the turnover of comparison floorspace will
increase in real terms in the future. A growth rate of 2% per annum is adopted,
as recommended by Experian. This growth will help to maintain the health and
viability of town centres. Trends indicate that comparison retailers historically
will achieve some growth in trading efficiency. This is a function of spending
growing at faster rates than new floorspace provision and retailers’ ability to
absorb real increases in their costs by increasing their turnover to floorspace
ratio.
3.30 Surplus comparison expenditure has been converted into net comparison sales
floorspace projections at Table 11 in Appendix 3, adopting average sales
densities in 2016 of £6,000 per sq.m, which is projected to grow by 2% in the
future due to improved turnover efficiency. The surplus expenditure at 2032
could support 36,749 sq.m net of sales floorspace (48,999 sq.m gross).
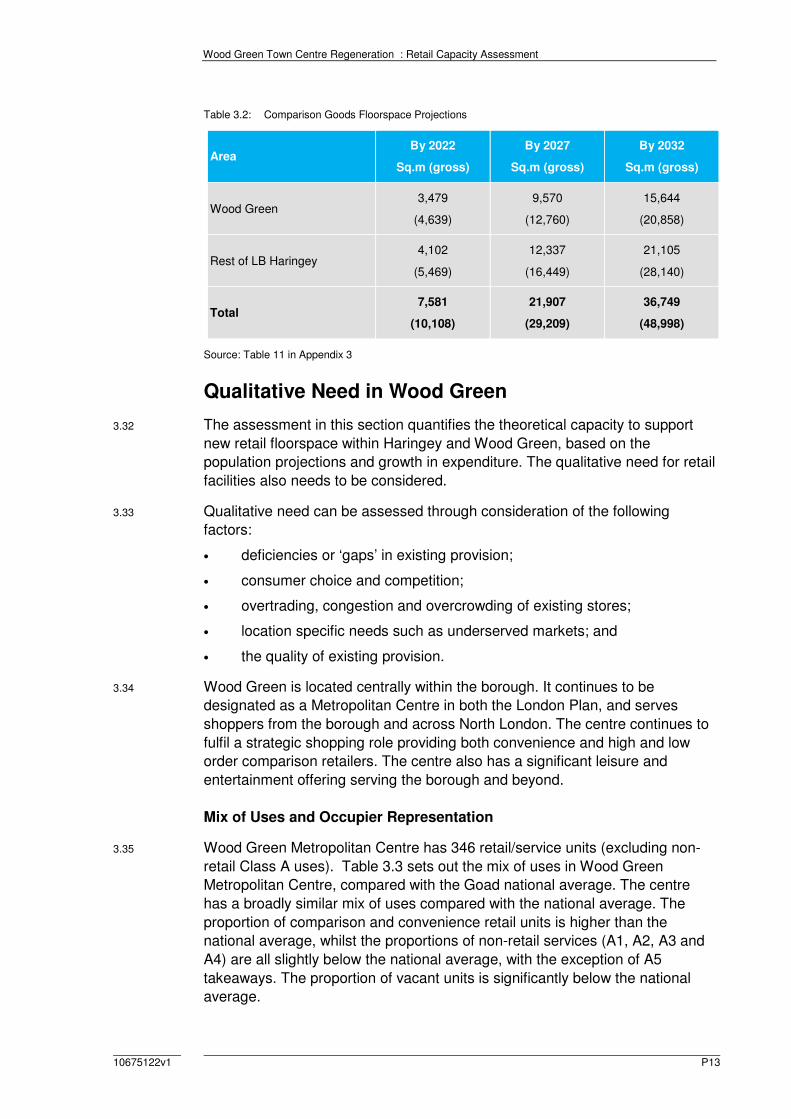
3.31 The floorspace requirements are summarised in Table 3.2 below.
Wood Green Town Centre Regeneration : Retail Capacity Assessment
10675122v1 P13
Table 3.2: Comparison Goods Floorspace Projections
Area By 2022
Sq.m (gross)
By 2027
Sq.m (gross)
By 2032
Sq.m (gross)
Wood Green 3,479
(4,639)
9,570
(12,760)
15,644
(20,858)
Rest of LB Haringey 4,102
(5,469)
12,337
(16,449)
21,105
(28,140)
Total 7,581
(10,108)
21,907
(29,209)
36,749
(48,998)
Source: Table 11 in Appendix 3
Qualitative Need in Wood Green
3.32 The assessment in this section quantifies the theoretical capacity to support
new retail floorspace within Haringey and Wood Green, based on the
population projections and growth in expenditure. The qualitative need for retail
facilities also needs to be considered.
3.33 Qualitative need can be assessed through consideration of the following
factors:
• deficiencies or ‘gaps’ in existing provision;
• consumer choice and competition;
• overtrading, congestion and overcrowding of existing stores;
• location specific needs such as underserved markets; and
• the quality of existing provision.
3.34 Wood Green is located centrally within the borough. It continues to be
designated as a Metropolitan Centre in both the London Plan, and serves
shoppers from the borough and across North London. The centre continues to
fulfil a strategic shopping role providing both convenience and high and low
order comparison retailers. The centre also has a significant leisure and
entertainment offering serving the borough and beyond.
Mix of Uses and Occupier Representation
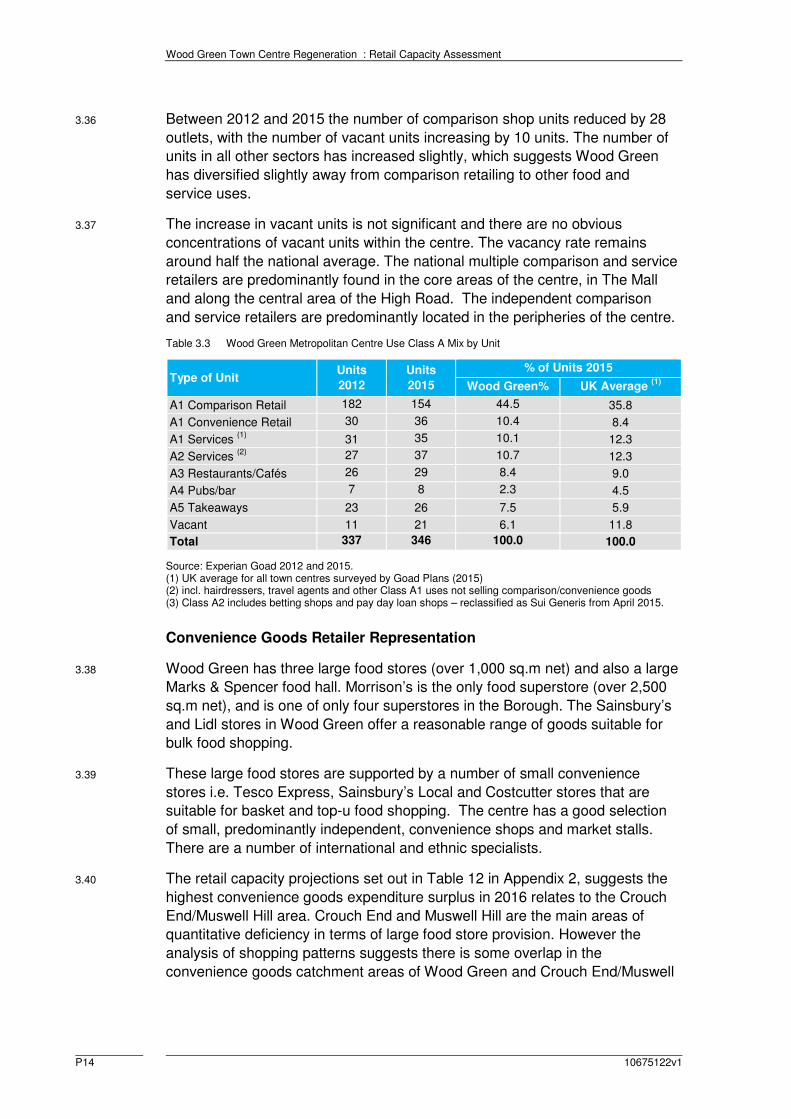
3.35 Wood Green Metropolitan Centre has 346 retail/service units (excluding non-
retail Class A uses). Table 3.3 sets out the mix of uses in Wood Green
Metropolitan Centre, compared with the Goad national average. The centre
has a broadly similar mix of uses compared with the national average. The
proportion of comparison and convenience retail units is higher than the
national average, whilst the proportions of non-retail services (A1, A2, A3 and
A4) are all slightly below the national average, with the exception of A5
takeaways. The proportion of vacant units is significantly below the national
average.
Wood Green Town Centre Regeneration : Retail Capacity Assessment
P14 10675122v1
3.36 Between 2012 and 2015 the number of comparison shop units reduced by 28
outlets, with the number of vacant units increasing by 10 units. The number of
units in all other sectors has increased slightly, which suggests Wood Green
has diversified slightly away from comparison retailing to other food and
service uses.
3.37 The increase in vacant units is not significant and there are no obvious
concentrations of vacant units within the centre. The vacancy rate remains
around half the national average. The national multiple comparison and service
retailers are predominantly found in the core areas of the centre, in The Mall
and along the central area of the High Road. The independent comparison
and service retailers are predominantly located in the peripheries of the centre.
Table 3.3 Wood Green Metropolitan Centre Use Class A Mix by Unit
Type of Unit Units
2012
Units
2015
% of Units 2015
Wood Green% UK Average (1)
A1 Comparison Retail 182 154 44.5 35.8
A1 Convenience Retail 30 36 10.4 8.4
A1 Services (1)
31 35 10.1 12.3
A2 Services (2)
27 37 10.7 12.3
A3 Restaurants/Cafés 26 29 8.4 9.0
A4 Pubs/bar 7 8 2.3 4.5
A5 Takeaways 23 26 7.5 5.9
Vacant 11 21 6.1 11.8
Total 337 346 100.0 100.0
Source: Experian Goad 2012 and 2015. (1) UK average for all town centres surveyed by Goad Plans (2015) (2) incl. hairdressers, travel agents and other Class A1 uses not selling comparison/convenience goods (3) Class A2 includes betting shops and pay day loan shops – reclassified as Sui Generis from April 2015.
Convenience Goods Retailer Representation
3.38 Wood Green has three large food stores (over 1,000 sq.m net) and also a large
Marks & Spencer food hall. Morrison’s is the only food superstore (over 2,500
sq.m net), and is one of only four superstores in the Borough. The Sainsbury’s
and Lidl stores in Wood Green offer a reasonable range of goods suitable for
bulk food shopping.
3.39 These large food stores are supported by a number of small convenience
stores i.e. Tesco Express, Sainsbury’s Local and Costcutter stores that are
suitable for basket and top-u food shopping. The centre has a good selection
of small, predominantly independent, convenience shops and market stalls.
There are a number of international and ethnic specialists.
3.40 The retail capacity projections set out in Table 12 in Appendix 2, suggests the
highest convenience goods expenditure surplus in 2016 relates to the Crouch
End/Muswell Hill area. Crouch End and Muswell Hill are the main areas of
quantitative deficiency in terms of large food store provision. However the
analysis of shopping patterns suggests there is some overlap in the
convenience goods catchment areas of Wood Green and Crouch End/Muswell
Wood Green Town Centre Regeneration : Retail Capacity Assessment
10675122v1 P15
Hill, therefore it is possible some of the surplus capacity could be transferred to
Wood Green.
3.41 There is potential to improve food store representation in Wood Green.
Comparison Goods Retailer Representation
3.42 Wood Green is the main high street comparison shopping destination and the
highest ranking centre within the Borough. The centre provides a good range
of comparison shops, including many national multiples and independent
specialists. However the offer is focus on the mid-market, value and discount
sectors.
3.43 Wood Green does not provide the same range and choice of comparison
shopping facilities when compared with higher order shopping centres e.g. the
Westfield Stratford and Brent Cross. Many residents with the Borough are
likely to continue to shop outside the borough.
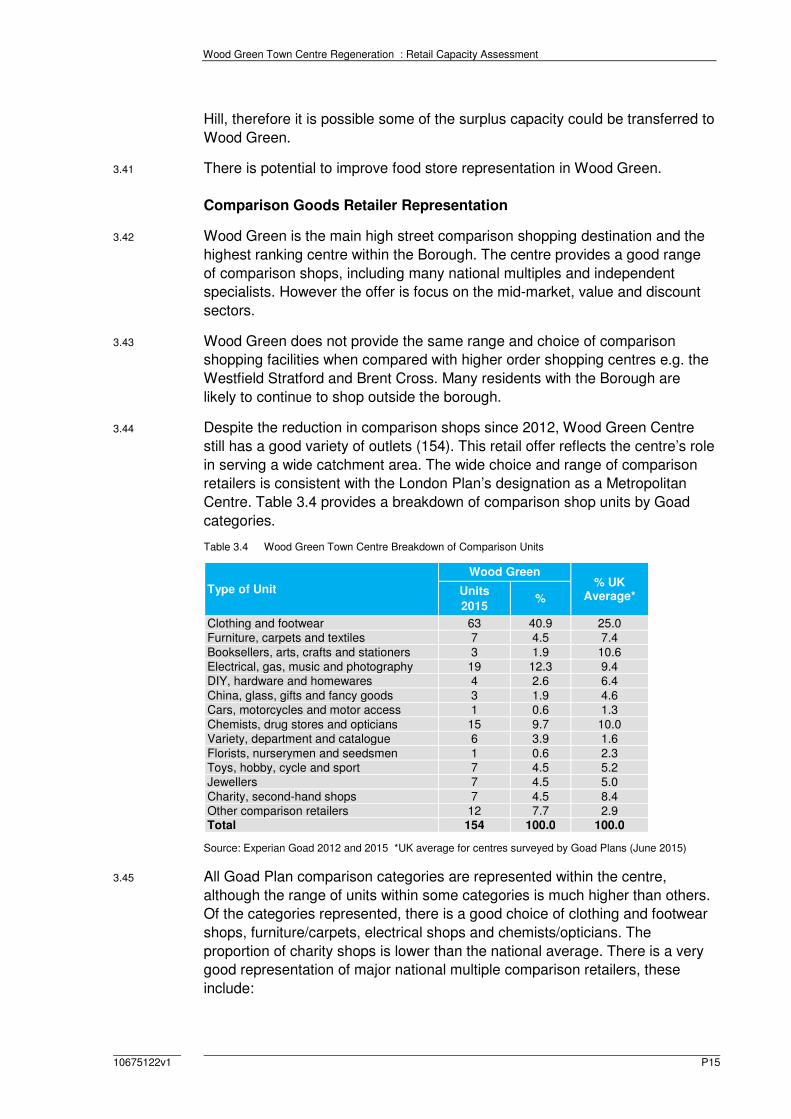
3.44 Despite the reduction in comparison shops since 2012, Wood Green Centre
still has a good variety of outlets (154). This retail offer reflects the centre’s role
in serving a wide catchment area. The wide choice and range of comparison
retailers is consistent with the London Plan’s designation as a Metropolitan
Centre. Table 3.4 provides a breakdown of comparison shop units by Goad
categories.
Table 3.4 Wood Green Town Centre Breakdown of Comparison Units
Type of Unit
Wood Green % UK
Average* Units
2015 %
Clothing and footwear 63 40.9 25.0 Furniture, carpets and textiles 7 4.5 7.4
Booksellers, arts, crafts and stationers 3 1.9 10.6 Electrical, gas, music and photography 19 12.3 9.4 DIY, hardware and homewares 4 2.6 6.4
China, glass, gifts and fancy goods 3 1.9 4.6 Cars, motorcycles and motor access 1 0.6 1.3
Chemists, drug stores and opticians 15 9.7 10.0 Variety, department and catalogue 6 3.9 1.6
Florists, nurserymen and seedsmen 1 0.6 2.3 Toys, hobby, cycle and sport 7 4.5 5.2 Jewellers 7 4.5 5.0
Charity, second-hand shops 7 4.5 8.4 Other comparison retailers 12 7.7 2.9 Total 154 100.0 100.0
Source: Experian Goad 2012 and 2015 *UK average for centres surveyed by Goad Plans (June 2015)
3.45 All Goad Plan comparison categories are represented within the centre,
although the range of units within some categories is much higher than others.
Of the categories represented, there is a good choice of clothing and footwear
shops, furniture/carpets, electrical shops and chemists/opticians. The
proportion of charity shops is lower than the national average. There is a very
good representation of major national multiple comparison retailers, these
include:
Wood Green Town Centre Regeneration : Retail Capacity Assessment
P16 10675122v1
• Argos
• BHS
• Blue Inc
• Boots the Chemist
• Bonmarche
• Burton
• Carphone Warehouse
• Claire’s
• Clarks
• Early Learning Centre
• Ernest Jones
• Game
• H Samuel
• H&M
• Halfords
• JD Sports
• Marks & Spencer
• Maplin Electronics
• Matalan
• Mothercare
• New Look
• Next
• O2
• Primark
• River Island
• Select
• Shoe Zone
• Superdrug
• The Body Shop
• Tiger
• TK Maxx
• Topman
• Topshop
• Virgin Media
• Wallis
• WH Smith
• Wilko
• Zahra
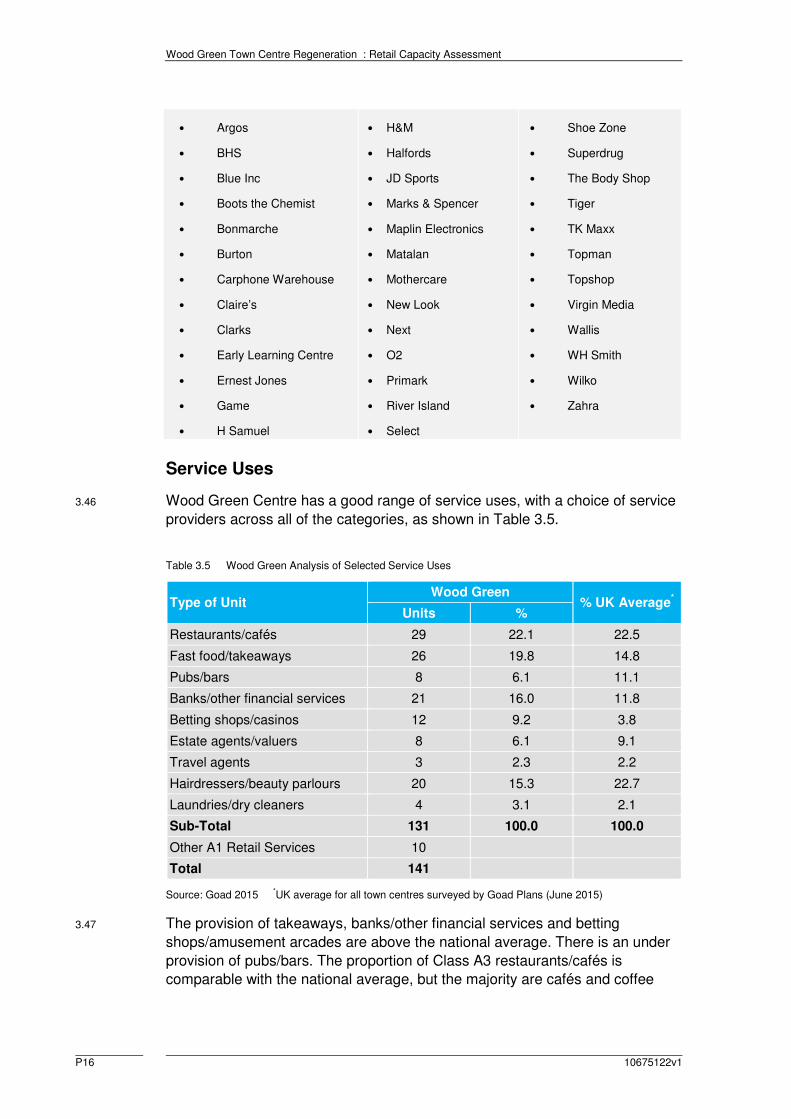
Service Uses
3.46 Wood Green Centre has a good range of service uses, with a choice of service
providers across all of the categories, as shown in Table 3.5.
Table 3.5 Wood Green Analysis of Selected Service Uses
Type of Unit Wood Green
% UK Average*
Units %
Restaurants/cafés 29 22.1 22.5
Fast food/takeaways 26 19.8 14.8
Pubs/bars 8 6.1 11.1
Banks/other financial services 21 16.0 11.8
Betting shops/casinos 12 9.2 3.8
Estate agents/valuers 8 6.1 9.1
Travel agents 3 2.3 2.2
Hairdressers/beauty parlours 20 15.3 22.7
Laundries/dry cleaners 4 3.1 2.1
Sub-Total 131 100.0 100.0
Other A1 Retail Services 10
Total 141
Source: Goad 2015 *UK average for all town centres surveyed by Goad Plans (June 2015)
3.47 The provision of takeaways, banks/other financial services and betting
shops/amusement arcades are above the national average. There is an under
provision of pubs/bars. The proportion of Class A3 restaurants/cafés is
comparable with the national average, but the majority are cafés and coffee
Wood Green Town Centre Regeneration : Retail Capacity Assessment
10675122v1 P17
shops. There are 12 restaurants, including a mix of Asian and Mediterranean
food.
3.48 Most high street banks/building societies are represented within Wood Green,
including Barclays, Co-op Bank, Halifax, HSBC, Natwest, Lloyds and
Santander. There are also several money shops and a Post Office. In addition
to Class A service uses Wood Green has several other non-retail uses serving
the community including community centres, library, doctors/dental surgeries
and several council offices.
3.49 Wood Green also has an established entertainment and leisure offer with two
cinemas (Vue and Cineworld), a Mecca Bingo hall and health and fitness
gyms.
Wood Green Town Centre Regeneration : Retail Capacity Assessment
P18 10675122v1
4.0 Conclusions and Strategy Implications
4.1 The revised retail capacity projections suggest there is scope for up to 50,800
sq.m net (67,800 sq.m gross) of comparison and convenience goods retail
floorspace in Haringey Borough as a whole by 2032, of which 20,100 sq.m net
(26,800 sq.m gross could be accommodated in Wood Green, assuming
constant market shares and the distribution of facilities across the Borough
remains unchanged.
4.2 As the main shopping destination within the Borough, Wood Green has the
best prospects for attracting investment and large scale retail development,
therefore the floorspace projections for Wood Green could be viewed as a
minimum, recognising there may be opportunities to concentrate and redirect
future growth in the Borough.
4.3 The NPPF indicates that planning authorities should promote competitive town
centres and set out policies for the management and growth of centres. Part of
this objective is to allocate a range of suitable sites to meet the scale and type
of retail and other town centre uses needed.
4.4 The NPPF indicates that it is important that needs are met in full and not
compromised by limited site availability. There are a number of issues that may
influence the scope for new floorspace and the appropriate location for this
development, as follows:
• major retail developments in competing centres;
• the re-occupation of vacant retail floorspace;
• the availability of land to accommodate new development;
• the reliability of long term expenditure projections, particularly after
2022;
• the effect of Internet/home shopping on the demand for retail property;
• the level of operator demand for floorspace; and
• the likelihood that Wood Green’s existing market share of expenditure
will change in the future in the face of increasing competition.
• the potential impact new development may have on existing centres.
4.5 The sequential approach suggests that town centres should be the first choice
for retail and leisure development. The preferred location for development
needs to be carefully considered, particularly for major development which may
have an extensive catchment area.
4.6 The existing stock of premises may have a role to play in accommodating
projected growth. The retail capacity analysis in this report assumes that
existing retail floorspace can, on average, increase its turnover to sales
floorspace densities. The floorspace projections reflect these assumptions. In
addition to the growth in sales densities, vacant shops could help to
accommodate future growth.
Wood Green Town Centre Regeneration : Retail Capacity Assessment
10675122v1 P19
4.7 Vacant units could also help to accommodate growth. The strategy should
seek to reduce shop vacancy levels across the Borough. The 2013 study
suggested it is realistic to assume reoccupied units can accommodate
approximately 8,500 sq m gross of commercial space. This estimate is only
sufficient to accommodate less than 13% of the overall floorspace projection to
2032 (67,800 sq.m gross), therefore other development opportunities will need
to be identified. Furthermore the vacancy rate in Wood Green is relatively low
and the opportunities to accommodate growth within existing premises are
more limited.
4.8 The 2013 study identified and assessed potential sites that could
accommodate additional retail development in the Borough, but the study
identified few potential retail development opportunities, primarily due to
residential areas surrounding centres. The key potential retail development
opportunities identified were in Crouch End and Wood Green. No development
opportunities were identified in Green Lanes or Muswell Hill.
4.9 The AAP for Wood Green will need to explore in more detail the potential to
intensify retail and town centre uses.

Wood Green Town Centre Regeneration : Retail Capacity Assessment
10675122v1
Appendix 1 Study Area and Methodology
Wood Green Town Centre Regeneration : Retail Capacity Assessment
10675122v1
Wood Green Town Centre Regeneration : Retail Capacity Assessment
10675122v1
Retail Capacity Methodology and Data
This section highlights the methodology and key assumptions adopted within
the retail capacity assessment update. The update broadly adopts the approach
within the Haringey Retail and Town Centres Study 2013 (HRTCS 2013).
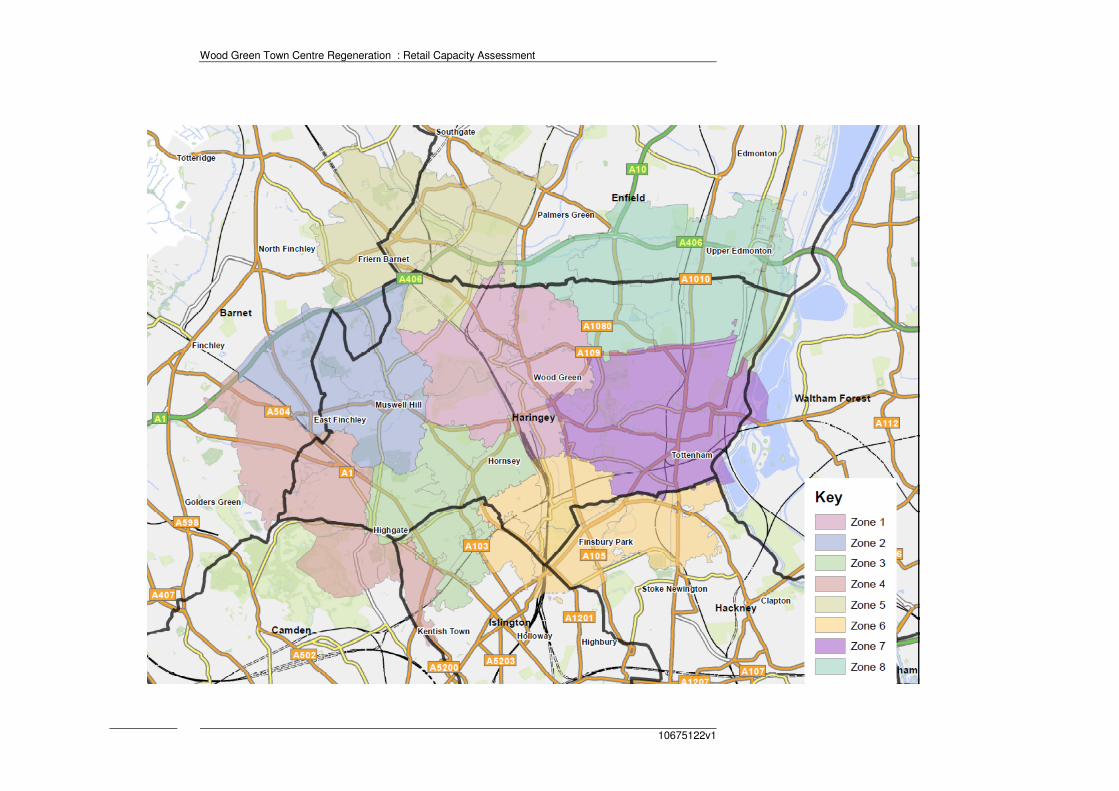
Study Area and Population
HRTCS 2013 adopted a study area based on 8 sub-zones, as shown in
Appendix 1. The study includes all parts of Haringey Borough and parts of
neighbouring boroughs, where the catchment areas of main centres (including
Wood Green) extend beyond administrative boundaries.
The HRTCS 2013 adopted 2001 Census based population projections for the
postcode sector based zones. Population has been updated based on 2011
Census data and the GLA’s latest ward level population projections to 2032
(2014 round ward population projections – SHLAA based), as shown in Table 1
in Appendix 2.
The HRTCS 2013 suggested the study area population would grow to around
453,000 in 2016. The revised projection is now much higher (over 8%) at over
491,000. The HRTCS 2013 projected the study area population would increase
to about 483,000 in 2031. The revised projection for 2032 is over 563,000.
The implications of these much higher population projections area assessed in
Section 3.
Retail Expenditure Data
All monetary values expressed in this study are at 2014 prices, consistent with
Experian's base year expenditure figures for 2014 (Retail Planner Briefing Note
13, October 2015) which is the most up to date information available.
The level of available expenditure to support retailers is based on first
establishing per capita levels of spending for the study area population.
Experian's local consumer expenditure estimates for comparison and
convenience goods for each of the study area zones for the year 2014 have
been obtained.
Experian's EBS national expenditure information (Experian Retail Planner
Briefing Note 13) has been used to forecast expenditure within the study area.
Experian's forecasts are based on an econometric model of disaggregated
consumer spending. This model takes a number of macro-economic forecasts
(chiefly consumer spending, incomes and inflation) and uses them to produce
forecasts of consumer spending volumes, prices and value, broken down into
separate categories of goods. The model incorporates assumptions about
income and price elasticities.
Experian's EBS growth forecast rates for 2014 to 2017 reflect the current
economic circumstances and provide an appropriate growth rate for the short
term (for convenience goods: -0.2% for 2014 to 2015, +0.1% for 2015 to 2016
Wood Green Town Centre Regeneration : Retail Capacity Assessment
10675122v1
and +0.3% for 2017; for comparison goods: +5.3% for 2014-2015, +3.2% for
2015-2016 and +2.9% for 2017.
In the longer term it is more difficult to forecast year on year changes in
expenditure. Experian's longer term growth average forecasts have been
adopted i.e. 0.1% per annum for convenience goods after 2016 and 3% per
annum growth for comparison goods. These growth rates are relatively cautious
when compared with past growth rates, but in our view represent realistic
forecast for future growth. These growth figures relate to real growth and
exclude inflation.
Special Forms of Trading (SFT) or non-store activity is included within
Experian's Goods Based Expenditure (GBE) estimates. SFT includes other
forms of retail expenditure not spent in shops e.g. mail order sales, some
internet sales, vending machines, party plan selling, market stalls and door to
door selling. SFT needs to be excluded from retail assessments because it
relates to expenditure not spent in shops and does not have a direct
relationship with the demand for retail floorspace. The growth in home
computing, internet connections and interactive TV may lead to a growth in
home shopping and may have effects on retailing in the high street. Experian
provides projections for special forms of trading and e-tailing. This Experian
information suggests that non-store retail sales in 2014 is:
• 8.3% of convenience goods expenditure; and
• 14.9% of comparison goods expenditure.
Experian predicts that these figures will increase in the future. However,
Experian recognises that not all of this SFT expenditure should be excluded
from a retail capacity analysis, because some of it relates to internet sales
through traditional retail businesses, rather than internet companies. The
turnover attributable to e-tail through retail businesses is included in the
company average turnovers, and therefore expenditure figures should not
exclude this expenditure. Experian has provided adjusted deductions for SFT
and projections. These projections have been used to exclude only e-tail
expenditure attributed to non-retail businesses, which will not directly impact on
the demand for retail floorspace. The adjusted figures suggest that SFT sales in
2014 are:
• 2.5% of convenience goods expenditure; and
• 11.2% of comparison goods expenditure.
The projections provided by Experian suggest that these percentages could
increase to 4.6% and 15.2% by 2022 respectively. In the longer term the growth
is predicted to fall or reverse slightly. The long term projections are 6.0% and
14.5% by 2032. These figures have been adopted in this assessment.
Home/electronic shopping has also emerged with the increasing growth in the
use of personal computers and the internet. This study makes an allowance for
future growth in e-tailing based on Experian projections. It will be necessary to
Wood Green Town Centre Regeneration : Retail Capacity Assessment
10675122v1
monitor the amount of sales attributed to home shopping in the future in order to
review future policies and development allocations.
On-line shopping has experienced rapid growth over the last 20 years, but in
proportional terms the latest available data suggests it remains a relatively low
percentage of total retail expenditure. Experian state that they expect that the
SFT market share will continue to grow, however the pace of e-commerce
growth will moderate markedly after about 2021. Experian's forecasts suggest
that the SFT share of total retail sales will reach 18.3% by 2021, rising to 19.6%
by 2034.
The implications on the demand for retail space are unclear. For example, some
retailers operate on-line sales from their traditional retail premises e.g. food
store operators. Therefore, growth in on-line sales may not always mean there
is a reduction in the need for retail floorspace. Given the uncertainties relating to
internet shopping and the likelihood that it will increase in proportional terms,
this assessment has adopted relatively cautious growth projections for retail
expenditure.
Market Shares/Penetration Rates
To assess the capacity for new retail floorspace, penetration rates are
estimated for shopping facilities within the study area. The assessment of
penetration rates are based on a range of factors but primarily information
gathered through the 2012 household survey, with NLP adjustment to reflect
changes since 2012.
The total turnover of shops within Wood Green is estimated based on
penetration rates. For convenience goods shopping turnover estimates are then
compared to average company benchmark or average sales floorspace
densities derived from Mintel’s Retail Rankings and Food Store report
November 2015, which provide an indication of how individual retail stores and
centres are performing against expected turnover averages. This allows the
identification of potential surplus or deficit capacity for retail sales floorspace.
Benchmark Turnover Levels
Company average turnover to sales floorspace densities are available for major
food store operators and are compiled by Mintel. Company average sales
densities (adjusted to exclude petrol and comparison sales and include VAT)
have been applied to the sales area of the large food stores, and a benchmark
turnover for each store has been calculated. This benchmark turnover is not
necessarily the actual turnover of the food store, but it does provide a useful
benchmark for assessing existing shopping patterns and the adequacy of
current floorspace in quantitative terms.
The estimated convenience goods sales areas have been derived from a
combination of the Institute of Oxford Retail Consultants (ORC) StorePoint
database, GOAD plans, Valuation Office data and NLP estimates based on site
visits. Estimates for comparison sales floorspace within large food stores has
Wood Green Town Centre Regeneration : Retail Capacity Assessment
10675122v1
been deducted, for consistency with the use of goods based expenditure
figures.
Average sales densities are not widely available for small convenience shops,
particularly independent retailers. Based on the mix of shops present in each
centre within Haringey and NLP’s experience of trading levels of small
independent shops informed by household shopper surveys across London, we
have adopted an average sales density of £8,000 per sq.m net for convenience
shops/stores in the study area at 2014 prices. The total benchmark turnover of
identified convenience sales floorspace within Haringey is £496 million (Tables
10 Appendix 2).
Mintel's Retail Rankings provides limited company average sales density
information for a selection of national comparison retailers. Based on NLP’s
experience the average sales density for high street comparison retailers
usually ranges between £5,000 to £8,000 per sq.m net.
Wood Green Town Centre Regeneration : Retail Capacity Assessment
10675122v1
Appendix 2 Convenience Goods Assessment
Wood Green Town Centre Regeneration : Retail Capacity Assessment
10675122v1
Table 1: Study Area Population
Expenditure Per Capita 2011 2016 2019 2022 2027 2032
1 - Wood Green 63,934 68,143 71,742 74,934 79,260 82,279
2 - Muswell Hill 41,756 44,172 44,349 44,498 44,662 45,575
3 - Crouch End 52,924 55,874 57,076 58,105 59,804 61,782
4 - Fortis Green/Highgate 29,181 31,251 31,850 32,486 33,460 34,506
5 - Arnos Grove/Palmers Green 48,369 50,978 52,778 54,074 55,403 56,155
6 - Green Lanes/Stamford Hill 77,850 83,805 85,792 88,462 92,794 97,217
7 - Bruce Grove/Tottenham High Road 78,020 85,600 89,655 92,936 97,438 101,246
8 - Tottenham/White Hart Lane 67,959 71,844 73,843 76,743 81,798 84,839
459,993 491,666 507,085 522,238 544,619 563,599
Sources - Cenus of Population 2011. GLA 2014 round ward population projections - SHLAA Based
Wood Green Town Centre Regeneration : Retail Capacity Assessment
10675122v1
Table 2: Convenience Goods Expenditure Per Capita (2014 Prices)
Zone 2016 2019 2022 2027 2032
1 - Wood Green £2,076 £2,069 £2,058 £2,055 £2,048
2 - Muswell Hill £2,410 £2,402 £2,389 £2,386 £2,378
3 - Crouch End £2,426 £2,418 £2,406 £2,402 £2,394
4 - Fortis Green/Highgate £2,396 £2,389 £2,376 £2,373 £2,364
5 - Arnos Grove/Palmers Green £2,283 £2,276 £2,263 £2,260 £2,253
6 - Green Lanes/Stamford Hill £1,951 £1,944 £1,934 £1,931 £1,925
7 - Bruce Grove/Tottenham High Road £1,729 £1,723 £1,714 £1,712 £1,706
8 - Tottenham/White Hart Lane £1,704 £1,698 £1,689 £1,687 £1,681
Sources:
Experian local estimates for 2014 comparison goods expenditure per capita
(Excluding special forms of trading 2.5% in 2014, 3.8% in 2019, 4.6% in 2022, 5.2% in 2027 and 6% in 2032
Experian Business Strategies - recommended forecast growth rates
(-0.2% in 2015, 0.1% in 2016 and 0.3% per annum in 2017 and 0.1% in 2018 and beyond)
Wood Green Town Centre Regeneration : Retail Capacity Assessment
10675122v1
Table 3: Total Available Convenience Goods Expenditure (£M - 2014 Prices)
Zone 2016 2019 2022 2027 2032
1 - Wood Green 141.44 148.42 154.20 162.89 168.50
2 - Muswell Hill 106.45 106.53 106.32 106.57 108.37
3 - Crouch End 135.57 138.04 139.78 143.67 147.91
4 - Fortis Green/Highgate 74.89 76.08 77.18 79.39 81.59
5 - Arnos Grove/Palmers Green 116.38 120.10 122.39 125.23 126.49
6 - Green Lanes/Stamford Hill 163.48 166.80 171.07 179.22 187.11
7 - Bruce Grove/Tottenham High Road 147.98 154.48 159.28 166.78 172.69
8 - Tottenham/White Hart Lane 122.39 125.38 129.61 137.97 142.60
Total £1,008.59 £1,035.83 £1,059.83 £1,101.72 £1,135.27
Sources: Table 1 and Table 2
Wood Green Town Centre Regeneration : Retail Capacity Assessment
10675122v1
Table 4: Base Year Convenience Goods Shopping Penetration Rates 2016
Centre/Facilities Zone 1 Zone 2 Zone 3 Zone 4 Zone 5 Zone 6 Zone 7 Zone 8 %
Inflow
Wood Green 45.0% 0.5% 5.1% 0.9% 11.5% 3.9% 9.0% 12.8% 5%
Green Lanes 6.6% 0.6% 5.5% 1.3% 1.7% 18.9% 8.3% 1.5% 5%
Muswell Hill/Crouch End 14.8% 51.0% 45.9% 18.3% 4.3% 7.9% 0.5% 0.2% 5%
Bruce Grove/Tottenham High Road 0.9% 0.2% 2.0% 2.0% 0.8% 0.5% 30.0% 35.0% 5%
West Green/Seven Sisters 0.0% 0.0% 0.0% 0.0% 0.0% 1.3% 7.7% 1.3% 5%
Other/Local Shops 9.7% 1.4% 8.0% 8.4% 1.8% 8.9% 12.0% 9.0% 5%
LB of Haringey Sub-Total 77.0% 53.7% 66.5% 30.9% 20.1% 41.4% 67.5% 59.8% n/a
Barnet 9.3% 39.8% 5.8% 31.7% 18.1% 2.5% 2.0% 2.7% n/a
Enfield 9.0% 2.3% 2.5% 0.4% 53.9% 6.4% 7.6% 19.0% n/a
Edmonton 0.9% 0.6% 0.7% 0.0% 0.0% 0.7% 7.5% 13.5% n/a
Waltham Forest 0.5% 0.0% 0.2% 1.3% 0.6% 0.7% 1.1% 2.3% n/a
Hackney 0.3% 0.0% 0.5% 0.0% 0.2% 21.9% 6.4% 0.3% n/a
Islington 1.6% 2.3% 17.3% 14.6% 1.6% 20.9% 5.5% 1.6% n/a
Camden 0.5% 0.0% 1.6% 11.7% 0.0% 0.0% 0.0% 0.0% n/a
Other Outflow 0.9% 1.3% 4.9% 9.4% 5.5% 5.5% 2.4% 0.8% n/a
Other Sub-Total 23.0% 46.3% 33.5% 69.1% 79.9% 58.6% 32.5% 40.2% n/a
TOTAL MARKET SHARE 100.0% 100.0% 100.0% 100.0% 100.0% 100.0% 100.0% 100.0% n/a
Sources: NEMS Household and Street Surveys 2012 and NLP adjustments
Wood Green Town Centre Regeneration : Retail Capacity Assessment
10675122v1
Table 5: Base Year Convenience Shopping Patterns £M (2014 Prices)
Centre/Facilities Zone 1 Zone 2 Zone 3 Zone 4 Zone 5 Zone 6 Zone 7 Zone 8 Inflow Total
Total Expenditure 2016 141.44 106.45 135.57 74.89 116.38 163.48 147.98 122.39
Wood Green 63.65 0.53 6.91 0.67 13.38 6.38 13.32 15.67 6.34 126.86
Green Lanes 9.34 0.64 7.46 0.97 1.98 30.90 12.28 1.84 3.44 68.84
Muswell Hill/Crouch End 20.93 54.29 62.23 13.70 5.00 12.91 0.74 0.24 8.95 179.01
Bruce Grove/Tottenham High Road 1.27 0.21 2.71 1.50 0.93 0.82 44.39 42.84 4.98 99.66
West Green/Seven Sisters 0.00 0.00 0.00 0.00 0.00 2.13 11.39 1.59 0.80 15.91
Other/Local Shops 13.72 1.49 10.85 6.29 2.09 14.55 17.76 11.02 4.09 81.86
LB of Haringey Sub-Total 108.91 57.16 90.16 23.14 23.39 67.68 99.89 73.19 28.61 572.13
Barnet 13.15 42.37 7.86 23.74 21.07 4.09 2.96 3.30 n/a 118.54
Enfield 12.73 2.45 3.39 0.30 62.73 10.46 11.25 23.25 n/a 126.56
Edmonton 1.27 0.64 0.95 0.00 0.00 1.14 11.10 16.52 n/a 31.63
Waltham Forest 0.71 0.00 0.27 0.97 0.70 1.14 1.63 2.81 n/a 8.24
Hackney 0.42 0.00 0.68 0.00 0.23 35.80 9.47 0.37 n/a 46.97
Islington 2.26 2.45 23.45 10.93 1.86 34.17 8.14 1.96 n/a 85.23
Camden 0.71 0.00 2.17 8.76 0.00 0.00 0.00 0.00 n/a 11.64
Other Outflow 1.27 1.38 6.64 7.04 6.40 8.99 3.55 0.98 n/a 36.26
Other Sub-Total 32.53 49.29 45.42 51.75 92.99 95.80 48.09 49.20 n/a 465.07
TOTAL EXPENDITURE 141.44 106.45 135.57 74.89 116.38 163.48 147.98 122.39 n/a 1,037.19
Sources: Tables 3 and 4
Wood Green Town Centre Regeneration : Retail Capacity Assessment
10675122v1
Table 6: Future 2019 Year Convenience Shopping Patterns £M (2014 Prices)
Centre/Facilities Zone 1 Zone 2 Zone 3 Zone 4 Zone 5 Zone 6 Zone 7 Zone 8 Inflow Total
Total Expenditure 2019 148.42 106.53 138.04 76.08 120.10 166.80 154.48 125.38
Wood Green 66.79 0.53 7.04 0.68 13.81 6.51 13.90 16.05 6.60 131.91
Green Lanes 9.80 0.64 7.59 0.99 2.04 31.53 12.82 1.88 3.54 70.83
Muswell Hill/Crouch End 21.97 54.33 63.36 13.92 5.16 13.18 0.77 0.25 9.10 182.04
Bruce Grove/Tottenham High Road 1.34 0.21 2.76 1.52 0.96 0.83 46.34 43.88 5.15 103.00
West Green/Seven Sisters 0.00 0.00 0.00 0.00 0.00 2.17 11.90 1.63 0.83 16.52
Other/Local Shops 14.40 1.49 11.04 6.39 2.16 14.85 18.54 11.28 4.22 84.37
LB of Haringey Sub-Total 114.29 57.21 91.80 23.51 24.14 69.06 104.28 74.98 29.43 588.68
Barnet 13.80 42.40 8.01 24.12 21.74 4.17 3.09 3.39 n/a 120.71
Enfield 13.36 2.45 3.45 0.30 64.73 10.68 11.74 23.82 n/a 130.53
Edmonton 1.34 0.64 0.97 0.00 0.00 1.17 11.59 16.93 n/a 32.62
Waltham Forest 0.74 0.00 0.28 0.99 0.72 1.17 1.70 2.88 n/a 8.48
Hackney 0.45 0.00 0.69 0.00 0.24 36.53 9.89 0.38 n/a 48.17
Islington 2.37 2.45 23.88 11.11 1.92 34.86 8.50 2.01 n/a 87.10
Camden 0.74 0.00 2.21 8.90 0.00 0.00 0.00 0.00 n/a 11.85
Other Outflow 1.34 1.38 6.76 7.15 6.61 9.17 3.71 1.00 n/a 37.13
Other Sub-Total 34.14 49.32 46.24 52.57 95.96 97.75 50.21 50.40 n/a 476.58
TOTAL EXPENDITURE 148.42 106.53 138.04 76.08 120.10 166.80 154.48 125.38 n/a 1,065.26
Sources: Tables 3 and 4

Wood Green Town Centre Regeneration : Retail Capacity Assessment
10675122v1
Table 7: Future 2022 Year Convenience Shopping Patterns £M (2014 Prices)
Centre/Facilities Zone 1 Zone 2 Zone 3 Zone 4 Zone 5 Zone 6 Zone 7 Zone 8 Inflow Total
Total Expenditure 2022 154.20 106.32 139.78 77.18 122.39 171.07 159.28 129.61
Wood Green 69.39 0.53 7.13 0.69 14.07 6.67 14.34 16.59 6.81 136.23
Green Lanes 10.18 0.64 7.69 1.00 2.08 32.33 13.22 1.94 3.64 72.72
Muswell Hill/Crouch End 22.82 54.22 64.16 14.12 5.26 13.51 0.80 0.26 9.22 184.38
Bruce Grove/Tottenham High Road 1.39 0.21 2.80 1.54 0.98 0.86 47.78 45.36 5.31 106.23
West Green/Seven Sisters 0.00 0.00 0.00 0.00 0.00 2.22 12.26 1.68 0.85 17.02
Other/Local Shops 14.96 1.49 11.18 6.48 2.20 15.23 19.11 11.67 4.33 86.65
LB of Haringey Sub-Total 118.73 57.09 92.95 23.85 24.60 70.82 107.51 77.51 30.16 603.23
Barnet 14.34 42.31 8.11 24.47 22.15 4.28 3.19 3.50 n/a 122.34
Enfield 13.88 2.45 3.49 0.31 65.97 10.95 12.11 24.63 n/a 133.77
Edmonton 1.39 0.64 0.98 0.00 0.00 1.20 11.95 17.50 n/a 33.65
Waltham Forest 0.77 0.00 0.28 1.00 0.73 1.20 1.75 2.98 n/a 8.72
Hackney 0.46 0.00 0.70 0.00 0.24 37.47 10.19 0.39 n/a 49.45
Islington 2.47 2.45 24.18 11.27 1.96 35.75 8.76 2.07 n/a 88.91
Camden 0.77 0.00 2.24 9.03 0.00 0.00 0.00 0.00 n/a 12.04
Other Outflow 1.39 1.38 6.85 7.25 6.73 9.41 3.82 1.04 n/a 37.87
Other Sub-Total 35.47 49.22 46.83 53.33 97.79 100.25 51.77 52.10 n/a 486.76
TOTAL EXPENDITURE 154.20 106.32 139.78 77.18 122.39 171.07 159.28 129.61 n/a 1,089.99
Sources: Tables 3 and 4
Wood Green Town Centre Regeneration : Retail Capacity Assessment
10675122v1
Table 8: Future 2027 Year Convenience Shopping Patterns £M (2014 Prices)
Centre/Facilities Zone 1 Zone 2 Zone 3 Zone 4 Zone 5 Zone 6 Zone 7 Zone 8 Inflow Total
Total Expenditure 2027 162.89 106.57 143.67 79.39 125.23 179.22 166.78 137.97
Wood Green 73.30 0.53 7.33 0.71 14.40 6.99 15.01 17.66 7.15 143.09
Green Lanes 10.75 0.64 7.90 1.03 2.13 33.87 13.84 2.07 3.80 76.04
Muswell Hill/Crouch End 24.11 54.35 65.95 14.53 5.39 14.16 0.83 0.28 9.45 189.04
Bruce Grove/Tottenham High Road 1.47 0.21 2.87 1.59 1.00 0.90 50.03 48.29 5.60 111.96
West Green/Seven Sisters 0.00 0.00 0.00 0.00 0.00 2.33 12.84 1.79 0.89 17.86
Other/Local Shops 15.80 1.49 11.49 6.67 2.25 15.95 20.01 12.42 4.53 90.62
LB of Haringey Sub-Total 125.42 57.23 95.54 24.53 25.17 74.20 112.58 82.50 31.43 628.60
Barnet 15.15 42.41 8.33 25.17 22.67 4.48 3.34 3.73 n/a 125.27
Enfield 14.66 2.45 3.59 0.32 67.50 11.47 12.68 26.21 n/a 138.88
Edmonton 1.47 0.64 1.01 0.00 0.00 1.25 12.51 18.63 n/a 35.50
Waltham Forest 0.81 0.00 0.29 1.03 0.75 1.25 1.83 3.17 n/a 9.15
Hackney 0.49 0.00 0.72 0.00 0.25 39.25 10.67 0.41 n/a 51.79
Islington 2.61 2.45 24.86 11.59 2.00 37.46 9.17 2.21 n/a 92.34
Camden 0.81 0.00 2.30 9.29 0.00 0.00 0.00 0.00 n/a 12.40
Other Outflow 1.47 1.39 7.04 7.46 6.89 9.86 4.00 1.10 n/a 39.21
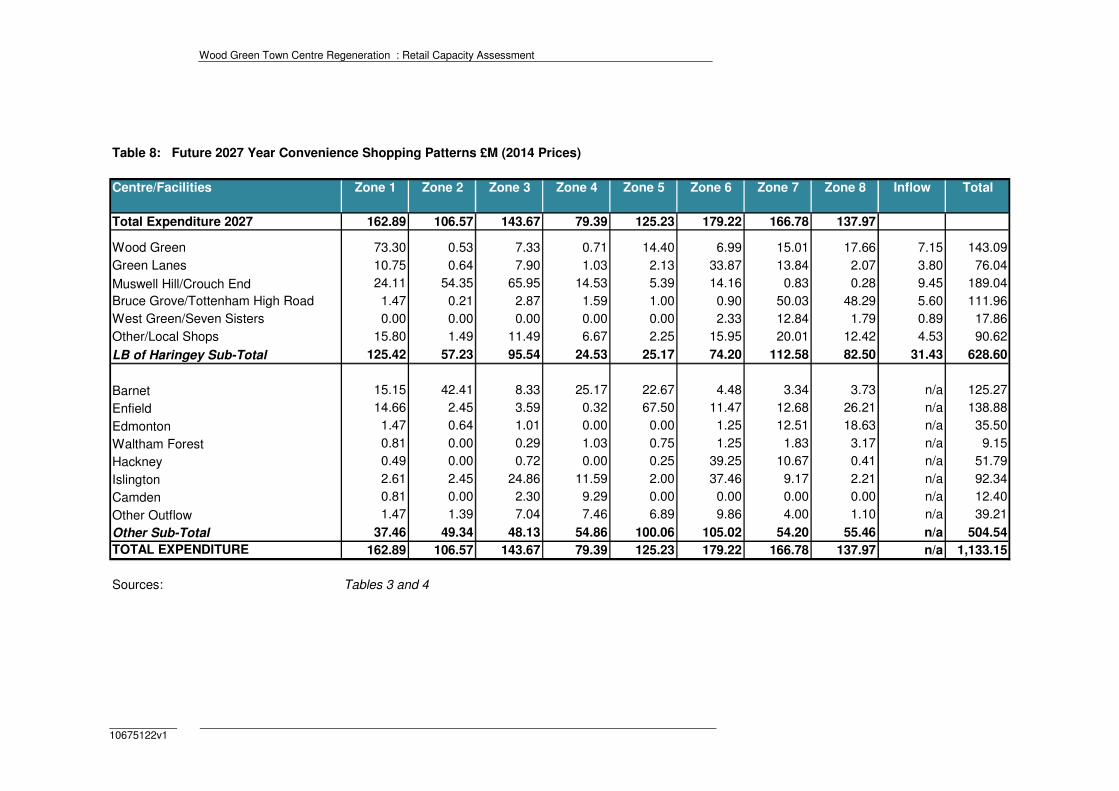
Other Sub-Total 37.46 49.34 48.13 54.86 100.06 105.02 54.20 55.46 n/a 504.54
TOTAL EXPENDITURE 162.89 106.57 143.67 79.39 125.23 179.22 166.78 137.97 n/a 1,133.15
Sources: Tables 3 and 4
Wood Green Town Centre Regeneration : Retail Capacity Assessment
10675122v1
Table 9: Future 2032 Year Convenience Shopping Patterns £M (2014 Prices)
Centre/Facilities Zone 1 Zone 2 Zone 3 Zone 4 Zone 5 Zone 6 Zone 7 Zone 8 Inflow Total
Total Expenditure 2032 168.50 108.37 147.91 81.59 126.49 187.11 172.69 142.60
Wood Green 75.83 0.54 7.54 0.73 14.55 7.30 15.54 18.25 7.38 147.67
Green Lanes 11.12 0.65 8.14 1.06 2.15 35.36 14.33 2.14 3.94 78.90
Muswell Hill/Crouch End 24.94 55.27 67.89 14.93 5.44 14.78 0.86 0.29 9.71 194.10
Bruce Grove/Tottenham High Road 1.52 0.22 2.96 1.63 1.01 0.94 51.81 49.91 5.79 115.78
West Green/Seven Sisters 0.00 0.00 0.00 0.00 0.00 2.43 13.30 1.85 0.93 18.51
Other/Local Shops 16.34 1.52 11.83 6.85 2.28 16.65 20.72 12.83 4.69 93.72
LB of Haringey Sub-Total 129.75 58.19 98.36 25.21 25.43 77.46 116.57 85.27 32.43 648.68
Barnet 15.67 43.13 8.58 25.86 22.90 4.68 3.45 3.85 n/a 128.12
Enfield 15.17 2.49 3.70 0.33 68.18 11.97 13.12 27.09 n/a 142.06
Edmonton 1.52 0.65 1.04 0.00 0.00 1.31 12.95 19.25 n/a 36.71
Waltham Forest 0.84 0.00 0.30 1.06 0.76 1.31 1.90 3.28 n/a 9.45
Hackney 0.51 0.00 0.74 0.00 0.25 40.98 11.05 0.43 n/a 53.95
Islington 2.70 2.49 25.59 11.91 2.02 39.11 9.50 2.28 n/a 95.60
Camden 0.84 0.00 2.37 9.55 0.00 0.00 0.00 0.00 n/a 12.75
Other Outflow 1.52 1.41 7.25 7.67 6.96 10.29 4.14 1.14 n/a 40.38
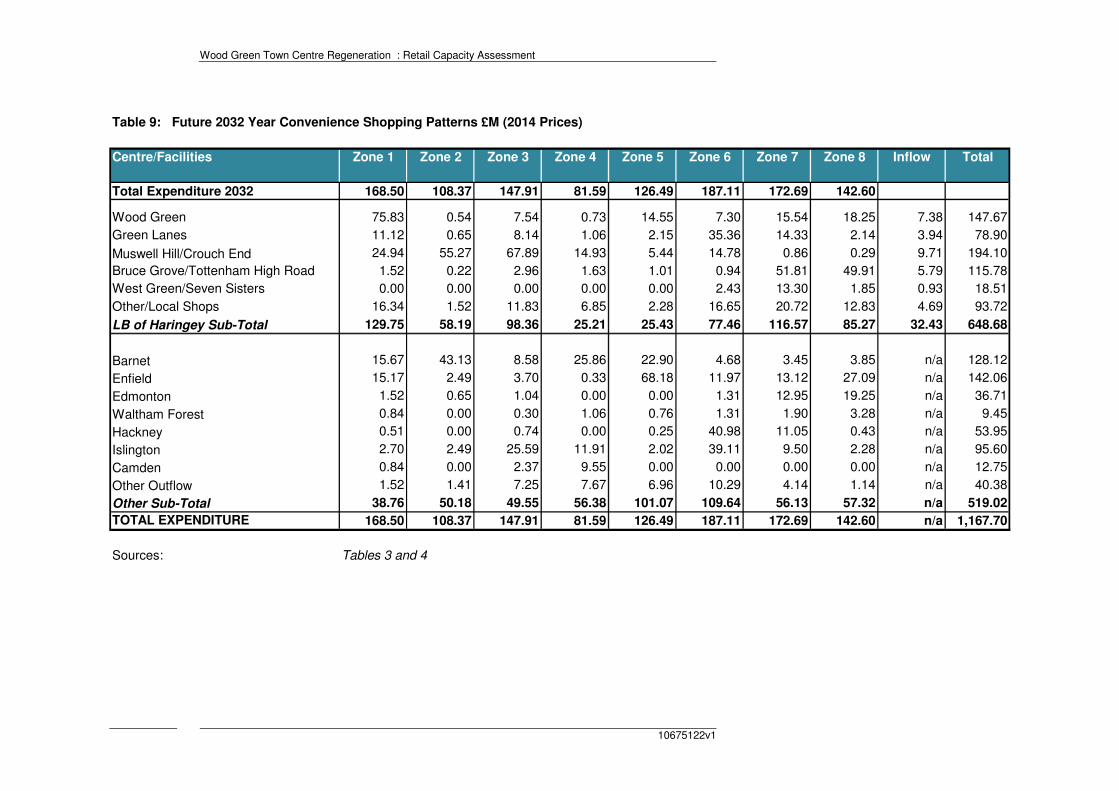
Other Sub-Total 38.76 50.18 49.55 56.38 101.07 109.64 56.13 57.32 n/a 519.02
TOTAL EXPENDITURE 168.50 108.37 147.91 81.59 126.49 187.11 172.69 142.60 n/a 1,167.70
Sources: Tables 3 and 4
Wood Green Town Centre Regeneration : Retail Capacity Assessment
10675122v1
Table 10: Convenience Floorspace and Benchmark Turnovers (2014 Prices)
Centres Store Net Sales Convenience Convenience Turnover Total
Floorspace % Sales Floorspace Density Convenience
Sq M Floorspace Sq M Net £ per Sq M Turnover £M
Wood Green Sainsbury's, 54 High Road 1,378 85% 1,171 £11,690 £13.69
Morrison's, 201 High Road 2,697 80% 2,158 £10,849 £23.41
Iceland, Mayes Road/Brook Road 450 95% 428 £7,933 £3.39
Marks & Spencer Foodhall, 46 High Road 1,347 95% 1,280 £10,329 £13.22
Lidl, 88-96 High Road, Wood Green 1,323 85% 1,125 £7,723 £8.68
Sainsbury's Local, Unit 4, Hollywood Green, Wood Green 242 95% 230 £11,690 £2.69
Tesco Express, 1-3 High Road, Wood Green 228 95% 217 £11,058 £2.40
Tesco Express, 421-451 High Road, Wood Green 256 95% 243 £11,058 £2.69
Tesco Express, 646 Lordship Lane, Wood Green 238 95% 226 £11,058 £2.50
Sainsbury's Local, 421 Lordship Lane 162 95% 154 £11,690 £1.80
Other Metropolitan Centre Shops 3,300 100% 3,300 £8,000 £26.40
Wood Green Total 11,621 10,530 £100.87
Green Lanes Sainsbury's, Williamson Road, Arena Retail Park 4,935 60% 2,961 £11,690 £34.61
Iceland, 17-19 Grand Parade 629 95% 598 £7,933 £4.74
Tesco Express, 8-9 Salisbury Parade 264 95% 251 £11,058 £2.77
Other District Centre Shops 3,951 100% 3,951 £8,000 £31.61
Green Lanes Total 9,779 7,760 £73.74
Muswell Hill/Crouch End Sainsbury's, 12 Fortis Green Road 1,386 90% 1,247 £11,690 £14.58
Marks & Spencer Simply Food, 126-138 Muswell Hill Broadway 720 95% 684 £10,329 £7.07
Little Waitrose, 390 Muswell Hill Broadway 247 95% 235 £11,665 £2.74
Other Muswell Hill District Centre Shops 1,852 100% 1,852 £7,000 £12.96
Budgens, 23 The Broadway 904 95% 859 £8,000 £6.87
Marks & Spencer Simply Food, The Exchange, 71 Crouch End Hill 231 95% 219 £10,329 £2.27
Tesco Express, 25 The Broadway 193 95% 183 £11,058 £2.03
Little Waitrose, 35-39 The Broadway, Crouch End 500 95% 475 £11,665 £5.54
Sainsbury's Local, 175-179 Stroud Green Road, Crouch End 297 95% 282 £11,690 £3.30
Tesco Express, 46-50 High Street, Hornsey 256 95% 243 £11,058 £2.69
Other Crouch End District Centre Shops 2,467 100% 2,467 £8,000 £19.74
Muswell Hill/Crouch End Total 9,053 8,747 £79.78
Bruce Grove/ Iceland, 522-528 High Road 560 95% 532 £7,933 £4.22
Tottenham High Road Asda, 490 High Road, Tottenham 1,212 80% 970 £15,213 £14.75
Turkish Food Centre, 678-672 Tottenham High Road 484 90% 436 £7,000 £3.05
Sainsbury's, Northumberland Park, High Road 6,536 60% 3,922 £11,690 £45.84
Sainsbury's Local, 669-673 High Road, Tottenham 164 95% 156 £11,690 £1.82
Tesco Express, Hale Village, Ferry Lane, Tottenham 250 95% 238 £11,058 £2.63
Aldi, 570-592, High Road, Tottenham 899 85% 764 £11,557 £8.83
Lidl, Tottenham Hale RP 1,354 80% 1,083 £7,723 £8.37
Spar PFS, 335-337 White Hart Lane 136 98% 133 £8,000 £1.07
Other District Centre Shops 1,709 100% 1,709 £8,000 £13.67
Tottenham High Road/Bruce Grove Total 13,304 9,942 £104.25
West Green Road/ Tesco, 230 High Road 4,109 65% 2,671 £11,058 £29.53
Seven Sisters Road Lidl, 269 Seven Sisters Road 497 85% 422 £7,723 £3.26
Tesco Express, West Green Road Tottenham 256 95% 243 £11,058 £2.69
Sainsbury's Local, 335-337 West Green Road 255 95% 242 £11,690 £2.83
Other District Centre Shops 1,630 100% 1,630 £8,000 £13.04
West Green Road/Seven Sisters Road Total 6,747 5,209 £51.36
Other Haringey Tesco Express, 127-133 Bounds Green 256 95% 243 £11,058 £2.69
Sainsbury's Local, 260-268 Archway Road 171 95% 162 £11,690 £1.90
Tesco Express, High Street, Highgate 138 95% 131 £11,058 £1.45
Other Local Shops 10,000 100% 10,000 £8,000 £80.00
Other Total 10,565 10,537 £86.04
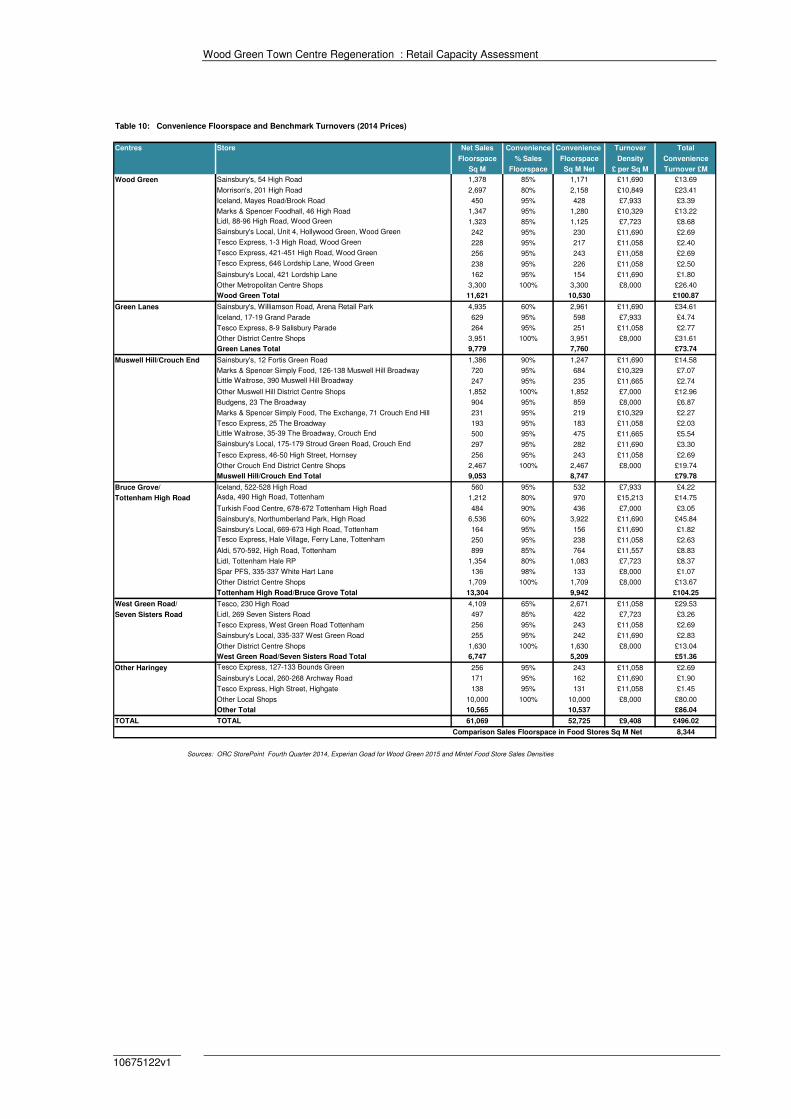
TOTAL TOTAL 61,069 52,725 £9,408 £496.02
Comparison Sales Floorspace in Food Stores Sq M Net 8,344
Sources: ORC StorePoint Fourth Quarter 2014, Experian Goad for Wood Green 2015 and Mintel Food Store Sales Densities
Wood Green Town Centre Regeneration : Retail Capacity Assessment
10675122v1
Table 11: Summary of Convenieince Expenditure 2014 to 2032
Centre 2016 2019 2022 2027 2032
Available Expenditure
Wood Green £126.86 £131.91 £136.23 £143.09 £147.67
Green Lanes £68.84 £70.83 £72.72 £76.04 £78.90
Muswell Hill/Crouch End £179.01 £182.04 £184.38 £189.04 £194.10
Bruce Grove/Tottenham High Road £99.66 £103.00 £106.23 £111.96 £115.78
West Green/Seven Sisters £15.91 £16.52 £17.02 £17.86 £18.51
Other/Local Shops £81.86 £84.37 £86.65 £90.62 £93.72
Total £572.13 £588.68 £603.23 £628.60 £648.68
Turnover of Existing Floorspace
Wood Green £100.87 £100.87 £100.87 £100.87 £100.87
Green Lanes £73.74 £73.74 £73.74 £73.74 £73.74
Muswell Hill/Crouch End £79.78 £79.78 £79.78 £79.78 £79.78
Bruce Grove/Tottenham High Road £104.25 £104.25 £104.25 £104.25 £104.25
West Green/Seven Sisters £51.36 £51.36 £51.36 £51.36 £51.36
Other/Local Shops £86.04 £86.04 £86.04 £86.04 £86.04
Total £496.02 £496.02 £496.02 £496.02 £496.02
Surplus Expenditure
Wood Green £25.99 £31.05 £35.36 £42.22 £46.80
Green Lanes -£4.90 -£2.91 -£1.02 £2.30 £5.16
Muswell Hill/Crouch End £99.23 £102.27 £104.60 £109.26 £114.33
Bruce Grove/Tottenham High Road -£4.59 -£1.24 £1.99 £7.71 £11.53
West Green/Seven Sisters -£35.45 -£34.84 -£34.33 -£33.50 -£32.85
Other/Local Shops -£4.18 -£1.67 £0.61 £4.58 £7.68
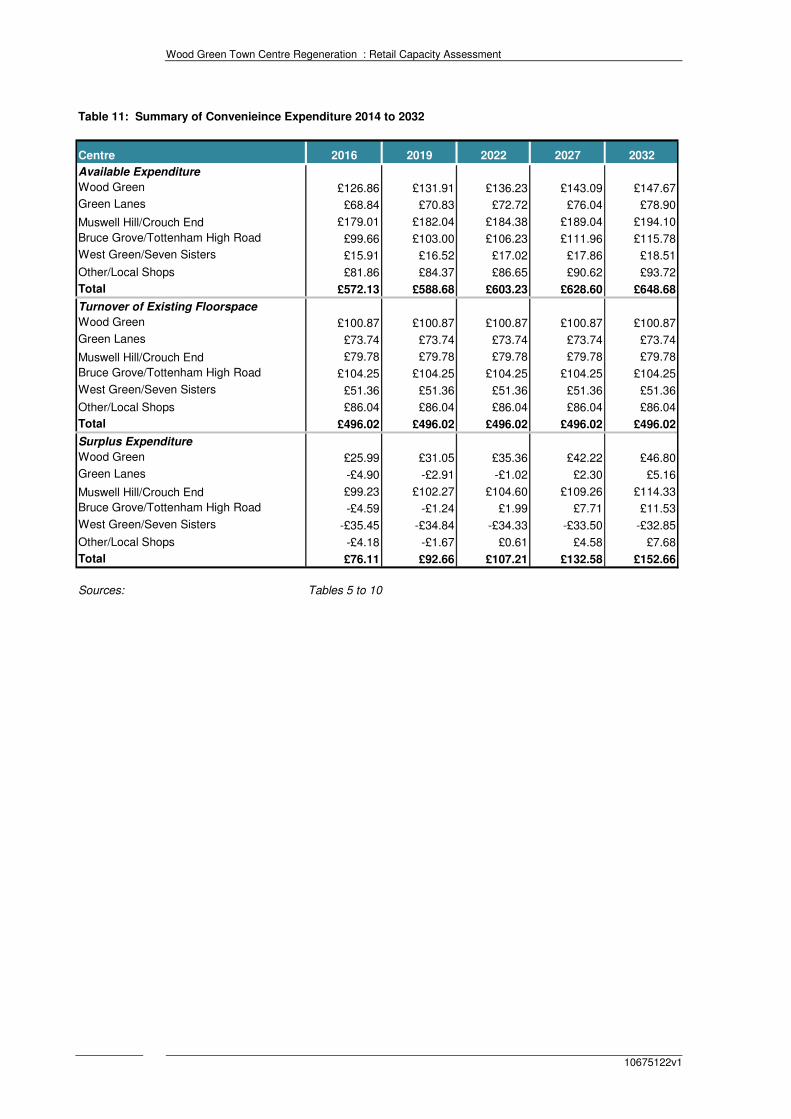
Total £76.11 £92.66 £107.21 £132.58 £152.66
Sources: Tables 5 to 10
Wood Green Town Centre Regeneration : Retail Capacity Assessment
10675122v1
Table 12: Convenience Floorspace Capacity
Centre 2019 2022 2027 2032
Sales Density Per Sq.M Net £9,408 £9,408 £9,408 £9,408
Sales Floorspace Capacity Sq.M Net
Wood Green 2,763 3,300 3,759 4,488
Green Lanes -520 -309 -108 245
Muswell Hill/Crouch End 10,548 10,870 11,118 11,613
Bruce Grove/Tottenham High Road -488 -132 211 820
West Green/Seven Sisters -3,768 -3,703 -3,649 -3,561
Other/Local Shops -444 -177 65 487
Total 8,090 9,849 11,396 14,092
Gross Floorspace Capacity Sq.M
Wood Green 3,683 4,400 5,012 5,984
Green Lanes -694 -412 -144 326
Muswell Hill/Crouch End 14,064 14,494 14,824 15,485
Bruce Grove/Tottenham High Road -650 -176 282 1,093
West Green/Seven Sisters -5,024 -4,937 -4,866 -4,748
Other/Local Shops -593 -236 87 649
Total 10,786 13,132 15,195 18,790
Sources: Table 11

Wood Green Town Centre Regeneration : Retail Capacity Assessment
10675122v1
Appendix 3 Comparison Goods Assessment
Wood Green Town Centre Regeneration : Retail Capacity Assessment
10675122v1
Table 1: Study Area Population
Expenditure Per Capita 2011 2016 2019 2022 2027 2032
1 - Wood Green 63,934 68,143 71,742 74,934 79,260 82,279
2 - Muswell Hill 41,756 44,172 44,349 44,498 44,662 45,575
3 - Crouch End 52,924 55,874 57,076 58,105 59,804 61,782
4 - Fortis Green/Highgate 29,181 31,251 31,850 32,486 33,460 34,506
5 - Arnos Grove/Palmers Green 48,369 50,978 52,778 54,074 55,403 56,155
6 - Green Lanes/Stamford Hill 77,850 83,805 85,792 88,462 92,794 97,217
7 - Bruce Grove/Tottenham High Road 78,020 85,600 89,655 92,936 97,438 101,246
8 - Tottenham/White Hart Lane 67,959 71,844 73,843 76,743 81,798 84,839
459,993 491,666 507,085 522,238 544,619 563,599
Sources - Cenus of Population 2011. GLA 2014 round ward population projections - SHLAA Based
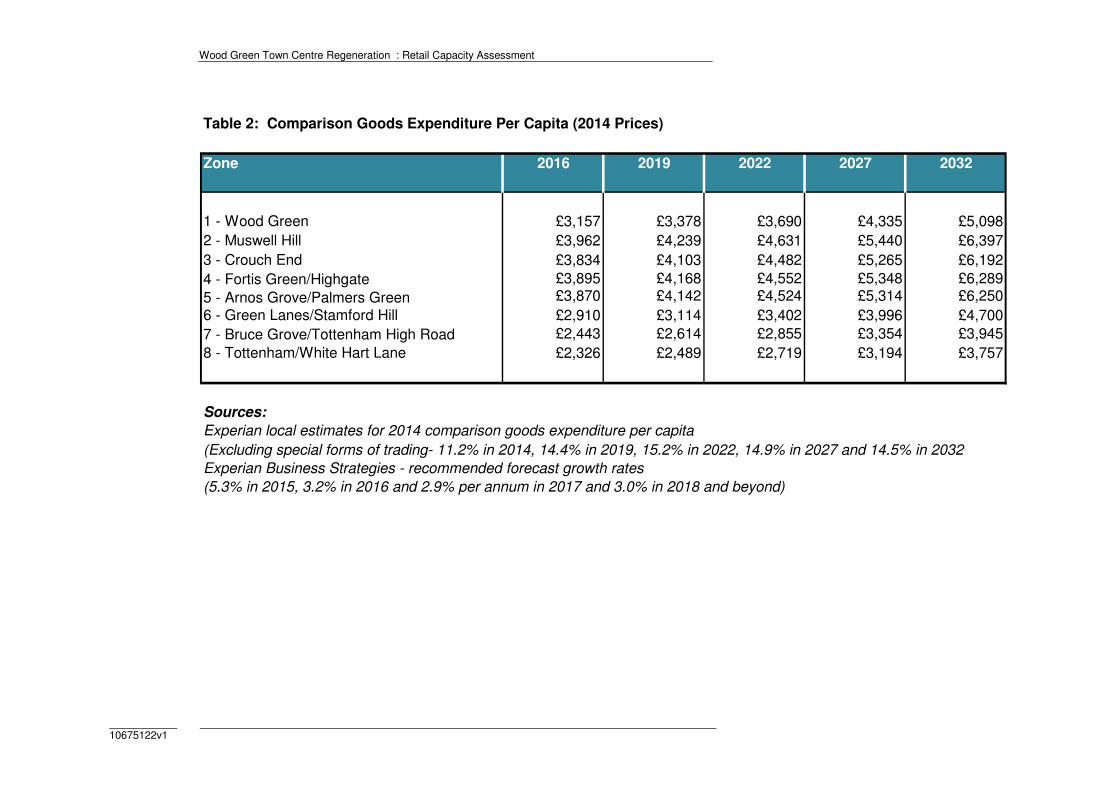
Wood Green Town Centre Regeneration : Retail Capacity Assessment
10675122v1
Table 2: Comparison Goods Expenditure Per Capita (2014 Prices)
Zone 2016 2019 2022 2027 2032
1 - Wood Green £3,157 £3,378 £3,690 £4,335 £5,098
2 - Muswell Hill £3,962 £4,239 £4,631 £5,440 £6,397
3 - Crouch End £3,834 £4,103 £4,482 £5,265 £6,192
4 - Fortis Green/Highgate £3,895 £4,168 £4,552 £5,348 £6,289
5 - Arnos Grove/Palmers Green £3,870 £4,142 £4,524 £5,314 £6,250
6 - Green Lanes/Stamford Hill £2,910 £3,114 £3,402 £3,996 £4,700
7 - Bruce Grove/Tottenham High Road £2,443 £2,614 £2,855 £3,354 £3,945
8 - Tottenham/White Hart Lane £2,326 £2,489 £2,719 £3,194 £3,757
Sources:
Experian local estimates for 2014 comparison goods expenditure per capita
(Excluding special forms of trading- 11.2% in 2014, 14.4% in 2019, 15.2% in 2022, 14.9% in 2027 and 14.5% in 2032
Experian Business Strategies - recommended forecast growth rates
(5.3% in 2015, 3.2% in 2016 and 2.9% per annum in 2017 and 3.0% in 2018 and beyond)
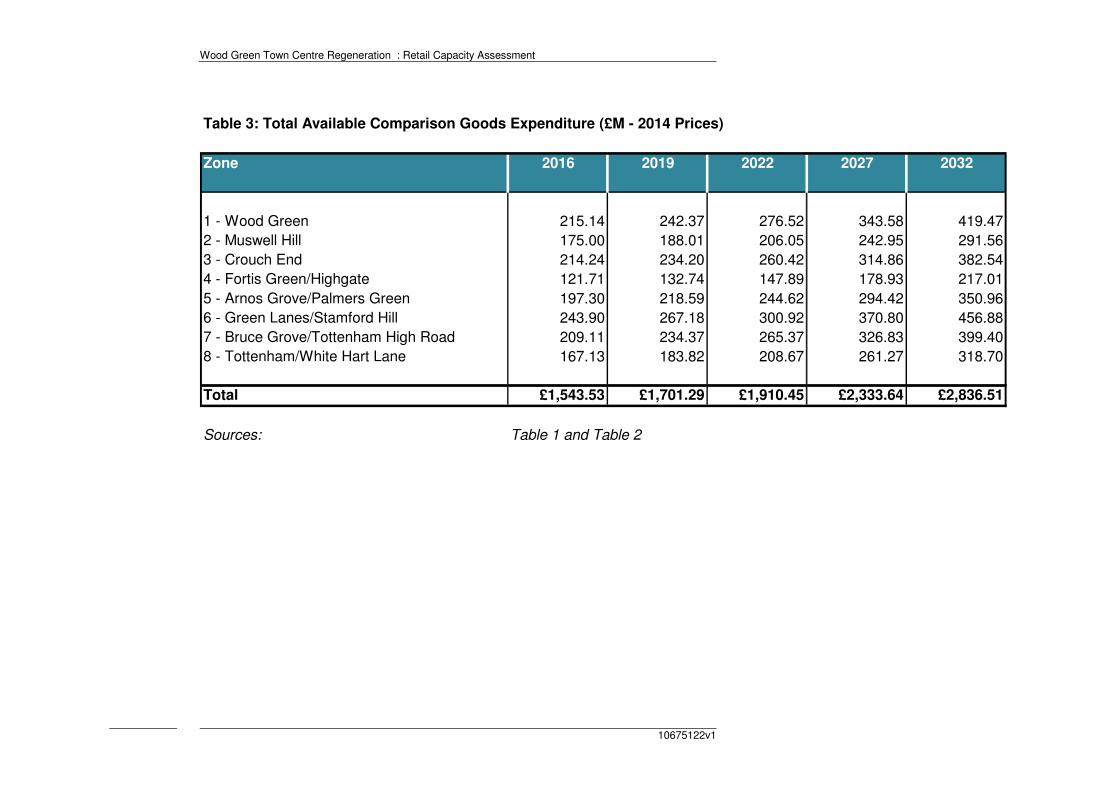
Wood Green Town Centre Regeneration : Retail Capacity Assessment
10675122v1
Table 3: Total Available Comparison Goods Expenditure (£M - 2014 Prices)
Zone 2016 2019 2022 2027 2032
1 - Wood Green 215.14 242.37 276.52 343.58 419.47
2 - Muswell Hill 175.00 188.01 206.05 242.95 291.56
3 - Crouch End 214.24 234.20 260.42 314.86 382.54
4 - Fortis Green/Highgate 121.71 132.74 147.89 178.93 217.01
5 - Arnos Grove/Palmers Green 197.30 218.59 244.62 294.42 350.96
6 - Green Lanes/Stamford Hill 243.90 267.18 300.92 370.80 456.88
7 - Bruce Grove/Tottenham High Road 209.11 234.37 265.37 326.83 399.40
8 - Tottenham/White Hart Lane 167.13 183.82 208.67 261.27 318.70
Total £1,543.53 £1,701.29 £1,910.45 £2,333.64 £2,836.51
Sources: Table 1 and Table 2
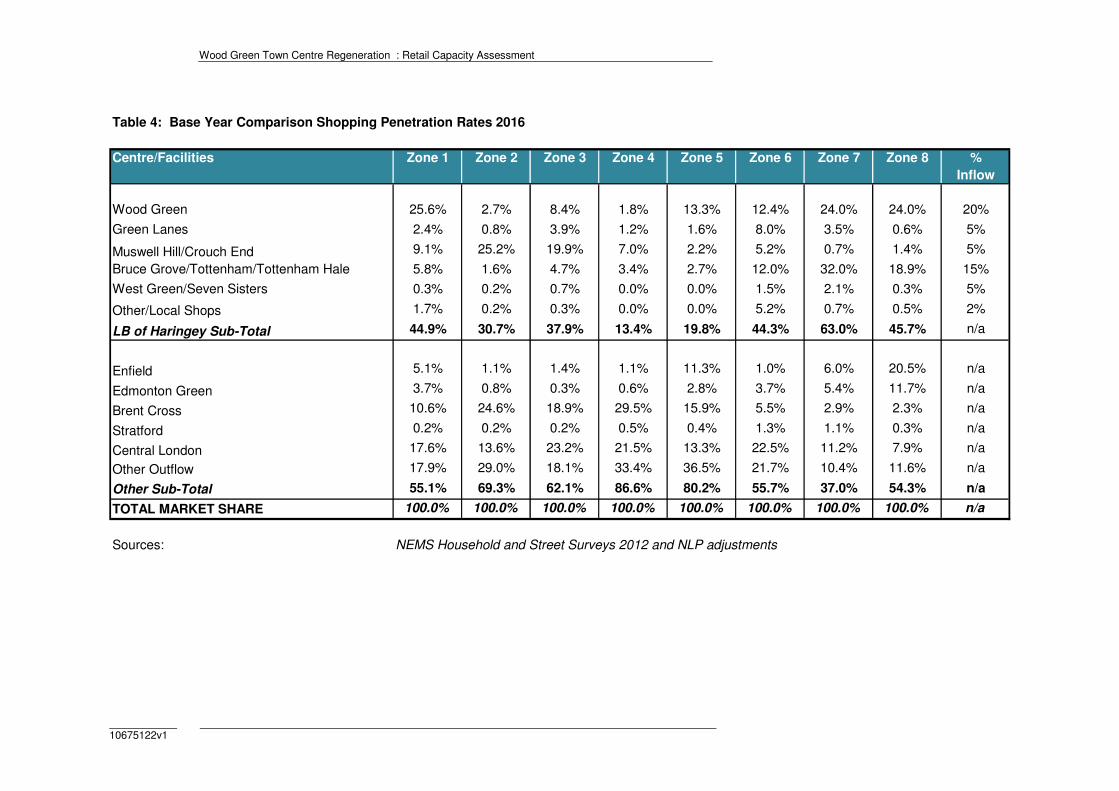
Wood Green Town Centre Regeneration : Retail Capacity Assessment
10675122v1
Table 4: Base Year Comparison Shopping Penetration Rates 2016
Centre/Facilities Zone 1 Zone 2 Zone 3 Zone 4 Zone 5 Zone 6 Zone 7 Zone 8 %
Inflow
Wood Green 25.6% 2.7% 8.4% 1.8% 13.3% 12.4% 24.0% 24.0% 20%
Green Lanes 2.4% 0.8% 3.9% 1.2% 1.6% 8.0% 3.5% 0.6% 5%
Muswell Hill/Crouch End 9.1% 25.2% 19.9% 7.0% 2.2% 5.2% 0.7% 1.4% 5%
Bruce Grove/Tottenham/Tottenham Hale 5.8% 1.6% 4.7% 3.4% 2.7% 12.0% 32.0% 18.9% 15%
West Green/Seven Sisters 0.3% 0.2% 0.7% 0.0% 0.0% 1.5% 2.1% 0.3% 5%
Other/Local Shops 1.7% 0.2% 0.3% 0.0% 0.0% 5.2% 0.7% 0.5% 2%
LB of Haringey Sub-Total 44.9% 30.7% 37.9% 13.4% 19.8% 44.3% 63.0% 45.7% n/a
Enfield 5.1% 1.1% 1.4% 1.1% 11.3% 1.0% 6.0% 20.5% n/a
Edmonton Green 3.7% 0.8% 0.3% 0.6% 2.8% 3.7% 5.4% 11.7% n/a
Brent Cross 10.6% 24.6% 18.9% 29.5% 15.9% 5.5% 2.9% 2.3% n/a
Stratford 0.2% 0.2% 0.2% 0.5% 0.4% 1.3% 1.1% 0.3% n/a
Central London 17.6% 13.6% 23.2% 21.5% 13.3% 22.5% 11.2% 7.9% n/a
Other Outflow 17.9% 29.0% 18.1% 33.4% 36.5% 21.7% 10.4% 11.6% n/a
Other Sub-Total 55.1% 69.3% 62.1% 86.6% 80.2% 55.7% 37.0% 54.3% n/a
TOTAL MARKET SHARE 100.0% 100.0% 100.0% 100.0% 100.0% 100.0% 100.0% 100.0% n/a
Sources: NEMS Household and Street Surveys 2012 and NLP adjustments
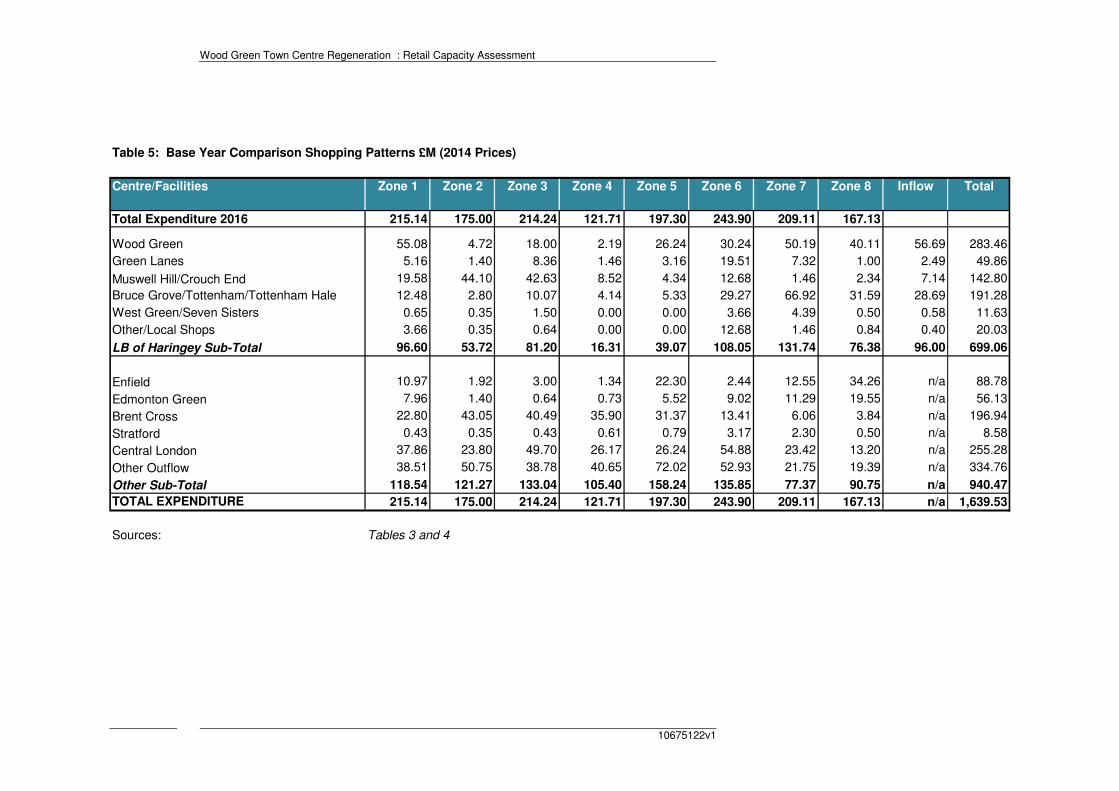
Wood Green Town Centre Regeneration : Retail Capacity Assessment
10675122v1
Table 5: Base Year Comparison Shopping Patterns £M (2014 Prices)
Centre/Facilities Zone 1 Zone 2 Zone 3 Zone 4 Zone 5 Zone 6 Zone 7 Zone 8 Inflow Total
Total Expenditure 2016 215.14 175.00 214.24 121.71 197.30 243.90 209.11 167.13
Wood Green 55.08 4.72 18.00 2.19 26.24 30.24 50.19 40.11 56.69 283.46
Green Lanes 5.16 1.40 8.36 1.46 3.16 19.51 7.32 1.00 2.49 49.86
Muswell Hill/Crouch End 19.58 44.10 42.63 8.52 4.34 12.68 1.46 2.34 7.14 142.80
Bruce Grove/Tottenham/Tottenham Hale 12.48 2.80 10.07 4.14 5.33 29.27 66.92 31.59 28.69 191.28
West Green/Seven Sisters 0.65 0.35 1.50 0.00 0.00 3.66 4.39 0.50 0.58 11.63
Other/Local Shops 3.66 0.35 0.64 0.00 0.00 12.68 1.46 0.84 0.40 20.03
LB of Haringey Sub-Total 96.60 53.72 81.20 16.31 39.07 108.05 131.74 76.38 96.00 699.06
Enfield 10.97 1.92 3.00 1.34 22.30 2.44 12.55 34.26 n/a 88.78
Edmonton Green 7.96 1.40 0.64 0.73 5.52 9.02 11.29 19.55 n/a 56.13
Brent Cross 22.80 43.05 40.49 35.90 31.37 13.41 6.06 3.84 n/a 196.94
Stratford 0.43 0.35 0.43 0.61 0.79 3.17 2.30 0.50 n/a 8.58
Central London 37.86 23.80 49.70 26.17 26.24 54.88 23.42 13.20 n/a 255.28
Other Outflow 38.51 50.75 38.78 40.65 72.02 52.93 21.75 19.39 n/a 334.76
Other Sub-Total 118.54 121.27 133.04 105.40 158.24 135.85 77.37 90.75 n/a 940.47
TOTAL EXPENDITURE 215.14 175.00 214.24 121.71 197.30 243.90 209.11 167.13 n/a 1,639.53
Sources: Tables 3 and 4
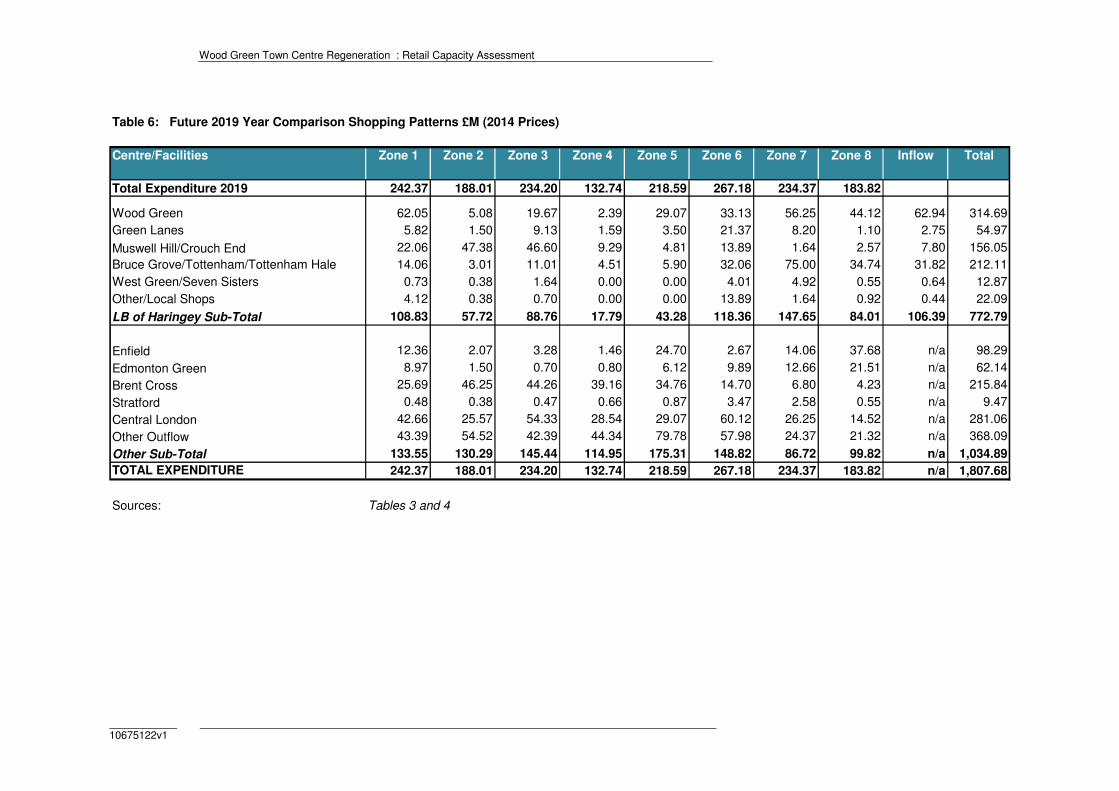
Wood Green Town Centre Regeneration : Retail Capacity Assessment
10675122v1
Table 6: Future 2019 Year Comparison Shopping Patterns £M (2014 Prices)
Centre/Facilities Zone 1 Zone 2 Zone 3 Zone 4 Zone 5 Zone 6 Zone 7 Zone 8 Inflow Total
Total Expenditure 2019 242.37 188.01 234.20 132.74 218.59 267.18 234.37 183.82
Wood Green 62.05 5.08 19.67 2.39 29.07 33.13 56.25 44.12 62.94 314.69
Green Lanes 5.82 1.50 9.13 1.59 3.50 21.37 8.20 1.10 2.75 54.97
Muswell Hill/Crouch End 22.06 47.38 46.60 9.29 4.81 13.89 1.64 2.57 7.80 156.05
Bruce Grove/Tottenham/Tottenham Hale 14.06 3.01 11.01 4.51 5.90 32.06 75.00 34.74 31.82 212.11
West Green/Seven Sisters 0.73 0.38 1.64 0.00 0.00 4.01 4.92 0.55 0.64 12.87
Other/Local Shops 4.12 0.38 0.70 0.00 0.00 13.89 1.64 0.92 0.44 22.09
LB of Haringey Sub-Total 108.83 57.72 88.76 17.79 43.28 118.36 147.65 84.01 106.39 772.79
Enfield 12.36 2.07 3.28 1.46 24.70 2.67 14.06 37.68 n/a 98.29
Edmonton Green 8.97 1.50 0.70 0.80 6.12 9.89 12.66 21.51 n/a 62.14
Brent Cross 25.69 46.25 44.26 39.16 34.76 14.70 6.80 4.23 n/a 215.84
Stratford 0.48 0.38 0.47 0.66 0.87 3.47 2.58 0.55 n/a 9.47
Central London 42.66 25.57 54.33 28.54 29.07 60.12 26.25 14.52 n/a 281.06
Other Outflow 43.39 54.52 42.39 44.34 79.78 57.98 24.37 21.32 n/a 368.09
Other Sub-Total 133.55 130.29 145.44 114.95 175.31 148.82 86.72 99.82 n/a 1,034.89
TOTAL EXPENDITURE 242.37 188.01 234.20 132.74 218.59 267.18 234.37 183.82 n/a 1,807.68
Sources: Tables 3 and 4
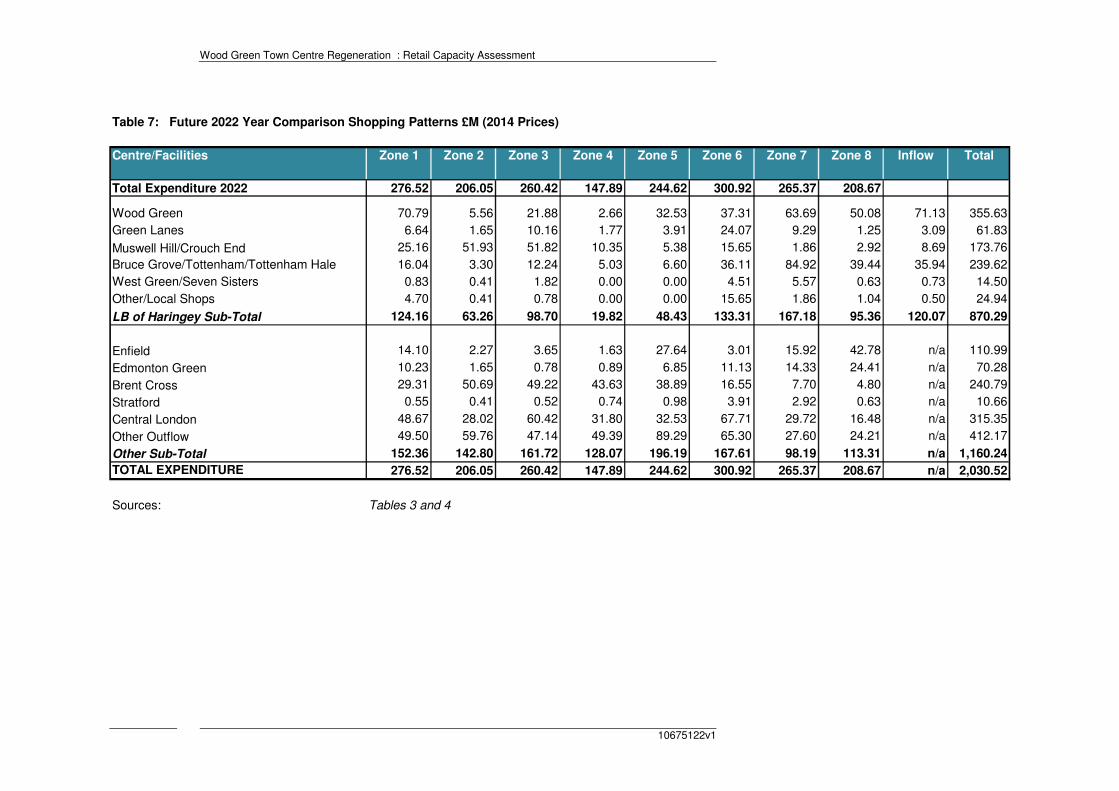
Wood Green Town Centre Regeneration : Retail Capacity Assessment
10675122v1
Table 7: Future 2022 Year Comparison Shopping Patterns £M (2014 Prices)
Centre/Facilities Zone 1 Zone 2 Zone 3 Zone 4 Zone 5 Zone 6 Zone 7 Zone 8 Inflow Total
Total Expenditure 2022 276.52 206.05 260.42 147.89 244.62 300.92 265.37 208.67
Wood Green 70.79 5.56 21.88 2.66 32.53 37.31 63.69 50.08 71.13 355.63
Green Lanes 6.64 1.65 10.16 1.77 3.91 24.07 9.29 1.25 3.09 61.83
Muswell Hill/Crouch End 25.16 51.93 51.82 10.35 5.38 15.65 1.86 2.92 8.69 173.76
Bruce Grove/Tottenham/Tottenham Hale 16.04 3.30 12.24 5.03 6.60 36.11 84.92 39.44 35.94 239.62
West Green/Seven Sisters 0.83 0.41 1.82 0.00 0.00 4.51 5.57 0.63 0.73 14.50
Other/Local Shops 4.70 0.41 0.78 0.00 0.00 15.65 1.86 1.04 0.50 24.94
LB of Haringey Sub-Total 124.16 63.26 98.70 19.82 48.43 133.31 167.18 95.36 120.07 870.29
Enfield 14.10 2.27 3.65 1.63 27.64 3.01 15.92 42.78 n/a 110.99
Edmonton Green 10.23 1.65 0.78 0.89 6.85 11.13 14.33 24.41 n/a 70.28
Brent Cross 29.31 50.69 49.22 43.63 38.89 16.55 7.70 4.80 n/a 240.79
Stratford 0.55 0.41 0.52 0.74 0.98 3.91 2.92 0.63 n/a 10.66
Central London 48.67 28.02 60.42 31.80 32.53 67.71 29.72 16.48 n/a 315.35
Other Outflow 49.50 59.76 47.14 49.39 89.29 65.30 27.60 24.21 n/a 412.17
Other Sub-Total 152.36 142.80 161.72 128.07 196.19 167.61 98.19 113.31 n/a 1,160.24
TOTAL EXPENDITURE 276.52 206.05 260.42 147.89 244.62 300.92 265.37 208.67 n/a 2,030.52
Sources: Tables 3 and 4
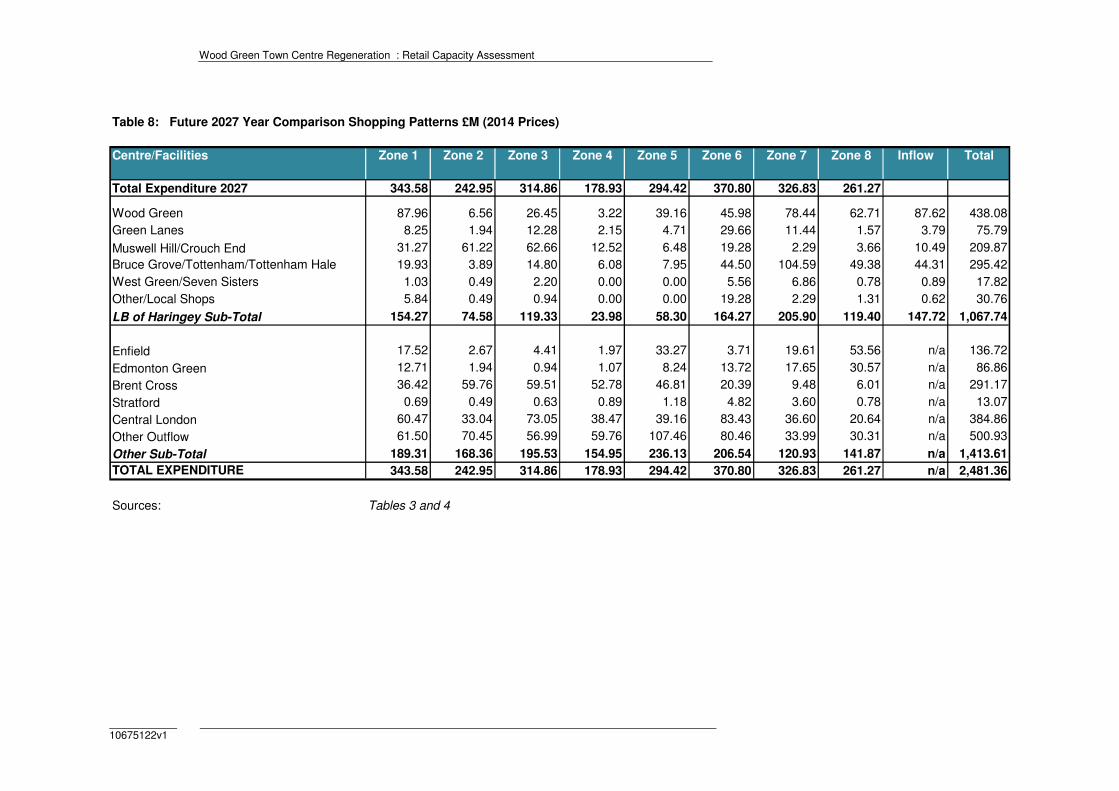
Wood Green Town Centre Regeneration : Retail Capacity Assessment
10675122v1
Table 8: Future 2027 Year Comparison Shopping Patterns £M (2014 Prices)
Centre/Facilities Zone 1 Zone 2 Zone 3 Zone 4 Zone 5 Zone 6 Zone 7 Zone 8 Inflow Total
Total Expenditure 2027 343.58 242.95 314.86 178.93 294.42 370.80 326.83 261.27
Wood Green 87.96 6.56 26.45 3.22 39.16 45.98 78.44 62.71 87.62 438.08
Green Lanes 8.25 1.94 12.28 2.15 4.71 29.66 11.44 1.57 3.79 75.79
Muswell Hill/Crouch End 31.27 61.22 62.66 12.52 6.48 19.28 2.29 3.66 10.49 209.87
Bruce Grove/Tottenham/Tottenham Hale 19.93 3.89 14.80 6.08 7.95 44.50 104.59 49.38 44.31 295.42
West Green/Seven Sisters 1.03 0.49 2.20 0.00 0.00 5.56 6.86 0.78 0.89 17.82
Other/Local Shops 5.84 0.49 0.94 0.00 0.00 19.28 2.29 1.31 0.62 30.76
LB of Haringey Sub-Total 154.27 74.58 119.33 23.98 58.30 164.27 205.90 119.40 147.72 1,067.74
Enfield 17.52 2.67 4.41 1.97 33.27 3.71 19.61 53.56 n/a 136.72
Edmonton Green 12.71 1.94 0.94 1.07 8.24 13.72 17.65 30.57 n/a 86.86
Brent Cross 36.42 59.76 59.51 52.78 46.81 20.39 9.48 6.01 n/a 291.17
Stratford 0.69 0.49 0.63 0.89 1.18 4.82 3.60 0.78 n/a 13.07
Central London 60.47 33.04 73.05 38.47 39.16 83.43 36.60 20.64 n/a 384.86
Other Outflow 61.50 70.45 56.99 59.76 107.46 80.46 33.99 30.31 n/a 500.93
Other Sub-Total 189.31 168.36 195.53 154.95 236.13 206.54 120.93 141.87 n/a 1,413.61
TOTAL EXPENDITURE 343.58 242.95 314.86 178.93 294.42 370.80 326.83 261.27 n/a 2,481.36
Sources: Tables 3 and 4

Wood Green Town Centre Regeneration : Retail Capacity Assessment
10675122v1
Table 9: Future 2032 Year Comparison Shopping Patterns £M (2014 Prices)
Centre/Facilities Zone 1 Zone 2 Zone 3 Zone 4 Zone 5 Zone 6 Zone 7 Zone 8 Inflow Total
Total Expenditure 2032 419.47 291.56 382.54 217.01 350.96 456.88 399.40 318.70
Wood Green 107.38 7.87 32.13 3.91 46.68 56.65 95.85 76.49 106.74 533.71
Green Lanes 10.07 2.33 14.92 2.60 5.62 36.55 13.98 1.91 4.63 92.61
Muswell Hill/Crouch End 38.17 73.47 76.13 15.19 7.72 23.76 2.80 4.46 12.72 254.42
Bruce Grove/Tottenham/Tottenham Hale 24.33 4.66 17.98 7.38 9.48 54.83 127.81 60.23 54.12 360.82
West Green/Seven Sisters 1.26 0.58 2.68 0.00 0.00 6.85 8.39 0.96 1.09 21.81
Other/Local Shops 7.13 0.58 1.15 0.00 0.00 23.76 2.80 1.59 0.76 37.76
LB of Haringey Sub-Total 188.34 89.51 144.98 29.08 69.49 202.40 251.62 145.64 180.06 1,301.12
Enfield 21.39 3.21 5.36 2.39 39.66 4.57 23.96 65.33 n/a 165.87
Edmonton Green 15.52 2.33 1.15 1.30 9.83 16.90 21.57 37.29 n/a 105.89
Brent Cross 44.46 71.72 72.30 64.02 55.80 25.13 11.58 7.33 n/a 352.35
Stratford 0.84 0.58 0.77 1.09 1.40 5.94 4.39 0.96 n/a 15.96
Central London 73.83 39.65 88.75 46.66 46.68 102.80 44.73 25.18 n/a 468.27
Other Outflow 75.08 84.55 69.24 72.48 128.10 99.14 41.54 36.97 n/a 607.11
Other Sub-Total 231.13 202.05 237.56 187.93 281.47 254.48 147.78 173.05 n/a 1,715.45
TOTAL EXPENDITURE 419.47 291.56 382.54 217.01 350.96 456.88 399.40 318.70 n/a 3,016.57
Sources: Tables 3 and 4
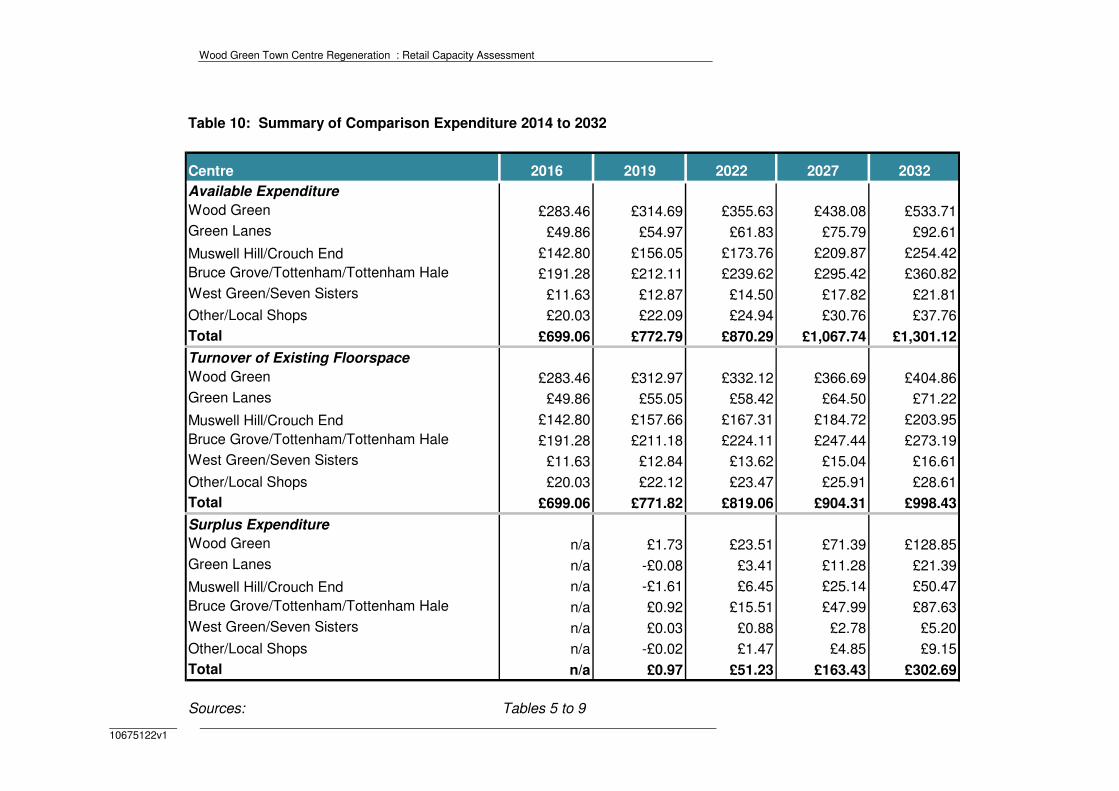
Wood Green Town Centre Regeneration : Retail Capacity Assessment
10675122v1
Table 10: Summary of Comparison Expenditure 2014 to 2032
Centre 2016 2019 2022 2027 2032
Available Expenditure
Wood Green £283.46 £314.69 £355.63 £438.08 £533.71
Green Lanes £49.86 £54.97 £61.83 £75.79 £92.61
Muswell Hill/Crouch End £142.80 £156.05 £173.76 £209.87 £254.42
Bruce Grove/Tottenham/Tottenham Hale £191.28 £212.11 £239.62 £295.42 £360.82
West Green/Seven Sisters £11.63 £12.87 £14.50 £17.82 £21.81
Other/Local Shops £20.03 £22.09 £24.94 £30.76 £37.76
Total £699.06 £772.79 £870.29 £1,067.74 £1,301.12
Turnover of Existing Floorspace
Wood Green £283.46 £312.97 £332.12 £366.69 £404.86
Green Lanes £49.86 £55.05 £58.42 £64.50 £71.22
Muswell Hill/Crouch End £142.80 £157.66 £167.31 £184.72 £203.95
Bruce Grove/Tottenham/Tottenham Hale £191.28 £211.18 £224.11 £247.44 £273.19
West Green/Seven Sisters £11.63 £12.84 £13.62 £15.04 £16.61
Other/Local Shops £20.03 £22.12 £23.47 £25.91 £28.61
Total £699.06 £771.82 £819.06 £904.31 £998.43
Surplus Expenditure
Wood Green n/a £1.73 £23.51 £71.39 £128.85
Green Lanes n/a -£0.08 £3.41 £11.28 £21.39
Muswell Hill/Crouch End n/a -£1.61 £6.45 £25.14 £50.47
Bruce Grove/Tottenham/Tottenham Hale n/a £0.92 £15.51 £47.99 £87.63
West Green/Seven Sisters n/a £0.03 £0.88 £2.78 £5.20
Other/Local Shops n/a -£0.02 £1.47 £4.85 £9.15
Total n/a £0.97 £51.23 £163.43 £302.69
Sources: Tables 5 to 9
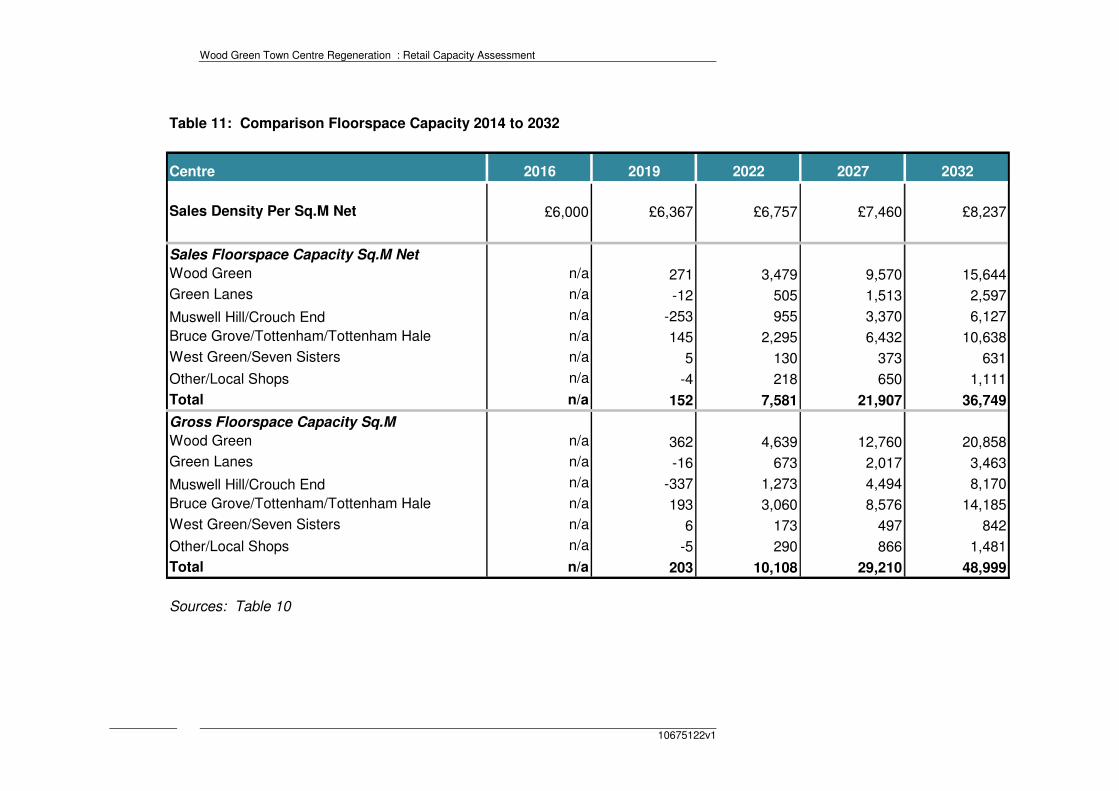
Wood Green Town Centre Regeneration : Retail Capacity Assessment
10675122v1
Table 11: Comparison Floorspace Capacity 2014 to 2032
Centre 2016 2019 2022 2027 2032
Sales Density Per Sq.M Net £6,000 £6,367 £6,757 £7,460 £8,237
Sales Floorspace Capacity Sq.M Net
Wood Green n/a 271 3,479 9,570 15,644
Green Lanes n/a -12 505 1,513 2,597
Muswell Hill/Crouch End n/a -253 955 3,370 6,127
Bruce Grove/Tottenham/Tottenham Hale n/a 145 2,295 6,432 10,638
West Green/Seven Sisters n/a 5 130 373 631
Other/Local Shops n/a -4 218 650 1,111
Total n/a 152 7,581 21,907 36,749
Gross Floorspace Capacity Sq.M
Wood Green n/a 362 4,639 12,760 20,858
Green Lanes n/a -16 673 2,017 3,463
Muswell Hill/Crouch End n/a -337 1,273 4,494 8,170
Bruce Grove/Tottenham/Tottenham Hale n/a 193 3,060 8,576 14,185
West Green/Seven Sisters n/a 6 173 497 842
Other/Local Shops n/a -5 290 866 1,481
Total n/a 203 10,108 29,210 48,999
Sources: Table 10

Wood Green Town Centre Regeneration : Retail Capacity Assessment
10675122v1
Wood Green Town Centre Regeneration : Retail Capacity Assessment
10675122v1