Embed Size (px)
Citation preview

The effect of company characteristics on working capital management A quantitative study of Swedish listed companies
Authors: Alexandra Rimo Podjaman Panbunyuen
Supervisor: Hans Nilsson
Student Umeå School of Business Spring semester 2010 Master thesis, two-year, 15 hp

i
Acknowledgements We would like to express our gratitude to everyone who have helped and supported us during the time we worked on our thesis. First, we would like to thank our supervisor, Hans Nilsson, for his patience and support throughout the work with this study. Second, we would like to thank Jessica Eriksson for her valuable advice and support. Without their suggestions, our study would not be completed. Last but not least, the special thanks go to our families for their unconditional support and encouragement.
Umeå, May 2010 Alexandra Rimo Podjaman Panbunyuen

ii
Abstract This study investigates the effect of company characteristics on the working capital management. We employed quantitative method to examine the relationship between company characteristics and the cash conversion cycle as a measure of working capital management in Swedish listed companies. The company characteristics include profitability, operating cash flow, company size, sale growth, current ratio and debt ratio. The sample consists of 40 companies in the large cap investment segment listed on NASDAQ OMX Stockholm Exchange. Financial data are extracted from companies’ annual reports of year 2007 and 2008 in order to calculate financial ratios used in the study. Using regression analysis, our results indicate that profitability, operating cash flow, company size and sale growth affect the company’s working capital management. First, we find that there is a significant positive association between profitability and the cash conversion cycle. Second, we find that the cash conversion cycle have significant negative relationship with operating cash flow, company size and sale growth. Further, we examined the industry effect and find significant positive relations with the cash conversion cycle in four industry classifications as follows: materials, industrials, health care and information technology.

iii
Table of contents 1. Introduction ................................................................................................................ 1
1.1 Problem background ............................................................................................... 1 1.2 Research question ................................................................................................... 3 1.3 Research purpose .................................................................................................... 3 1.4 Delimitations........................................................................................................... 3 1.5 Disposition .............................................................................................................. 4
2. Research Methodology ............................................................................................... 5 2.1 Choice of subject..................................................................................................... 5 2.2 Preconceptions ........................................................................................................ 5
2.2.1 Practical preconception.................................................................................... 6 2.2.2 Theoretical preconception................................................................................ 6
2.3 Ontological orientation ........................................................................................... 6 2.4 Epistemological orientation .................................................................................... 7 2.5 Scientific approach.................................................................................................. 8 2.6 Research approach .................................................................................................. 9 2.7 Selection of sources .............................................................................................. 10 2.8 Sources and criticism ............................................................................................ 10
3. Theoretical Framework and Literature Review.................................................... 12 3.1 Definition of Working capital management ..........................................................12 3.2 Positive and negative working capital .................................................................. 14 3.3 Measurement of working capital management ..................................................... 15
3.3.1 Average number of days inventory................................................................. 17 3.3.2 Average number of days accounts receivable................................................. 18 3.3.3 Average number of days accounts payable..................................................... 18
3.4 Efficient working capital management ................................................................. 19 3.4.1 The cash conversion cycle.............................................................................. 19 3.4.2 Inventory management................................................................................... 21 3.4.3 Accounts receivable management................................................................... 21 3.4.4 Accounts payable management...................................................................... 22
3.5 Minimizing, not always the best option ................................................................ 22 3.5.1 Cash management.......................................................................................... 22 3.5.2 Inventory......................................................................................................... 23
3.6 Previous studies related to working capital management ..................................... 24 3.6.1 Working capital management and firm performance..................................... 24 3.6.2 Working capital management and capital investment.................................... 26 3.6.3 Other studies related to working capital management................................... 27
3.7 Company characteristics and development of hypotheses.................................... 28 3.7.1 Profitability..................................................................................................... 28 3.7.2 Operating cash flow....................................................................................... 29 3.7.3 Company Size................................................................................................. 30 3.7.4 Sale growth..................................................................................................... 30

iv
3.7.5 Current ratio and quick ratio......................................................................... 31 3.7.6 Debt ratio........................................................................................................ 32 3.7.7 Industry effect................................................................................................. 32
4. Practical Research Method...................................................................................... 34 4.1 Data collection method ......................................................................................... 34
4.1.1 Sample selection............................................................................................. 34 4.1.2 Data collection............................................................................................... 34
4.2 Study approach...................................................................................................... 35 4.2.1 Dependent variables....................................................................................... 35 4.2.2 Independent variables..................................................................................... 35 4.2.3 Data analysis.................................................................................................. 37
4.3 Credibility criteria ................................................................................................. 39 4.3.1 Reliability....................................................................................................... 39 4.3.2 Validity............................................................................................................ 40 4.3.3 Generalisability.............................................................................................. 41 4.3.4 Replication......................................................................................................41
5. Empirical Results...................................................................................................... 42 5.1 Descriptive statistics ............................................................................................. 42 5.2 Correlation Matrix................................................................................................. 46 5.3 Regression results ................................................................................................. 48
6. Analysis of the Empirical Data ................................................................................ 52 6.1 Cash conversion cycle........................................................................................... 52 6.2 Company characteristics ....................................................................................... 52
6.2.1 Profitability..................................................................................................... 53 6.2.2 Operating cash flow....................................................................................... 53 6.2.3 Company Size................................................................................................. 54 6.2.4 Sale growth..................................................................................................... 55 6.2.5 Current ratio and quick ratio......................................................................... 55 6.2.6 Debt ratio........................................................................................................ 55 6.2.7 Industry effect................................................................................................. 56
7. Conclusion and Further Consideration.................................................................. 57 References...................................................................................................................... 59 Appendix 1: Companies included in the study, by industry Appendix 2: Pearson correlation matrix for all variables Appendix 3: Pearson correlation matrix for all variables of year 2007 and 2008 Appendix 4: Pearson correlation matrix for all variables, by industry Appendix 5: Regression results Appendix 6: Regression results (for the component of the cash conversion cycle) Appendix 7: Regression results (include year dummy variables) Appendix 8: Regression results (include industry dummy variables)

v
A List of figures Figure 1. The Working Capital Cycle 13 Figure 2. The Operating and Cash conversion cycle 17 Figure 3. The Cash Conversion Cycle 20 A List of tables Table 1. Descriptive Statistics for all samples 42 Table 2. Descriptive Statistics, by year 43 Table 3. Mean values, by industry 44 Table 4. Mean values, by company size 45 Table 5. Summary of testing of hypotheses 49

1
1. Introduction
In this chapter, we give an introduction to the chosen subject and present the problem background which lead to our research question and research purpose. We also present the study’s delimitations and finally, a disposition of the study.
1.1 Problem background The current recession has been challenging for most people and companies and the effects from it can hardly have escaped anyone. Now, in early 2010, we can finally feel a turning point in this weak economy and we can start focusing towards better times. For Sweden, the recession has been tough with a fall in GDP of about 7 percent during 2008 and 2009. The big fall in GDP was largely due to the decrease in demand towards the Swedish manufacturing companies. In contrast to the Swedish manufacturing sector, the Swedish service sector has not been affected as negatively by the recession and this is due to a good purchasing power that has been strengthen by the low interest rates, the reduced income taxes and the high level of savings in Swedish households. It is expected to take until 2014 before the Swedish economy regains a stable GDP level but already this year, 2010, a rise in consumptions among Swedish households is to be expected (Konjunkturinstitutet, 2010). Despite a tough climate on the market, a recent report from Ernst & Young and the Economist Intelligence Unit, shows that Swedish companies have managed rather well when placed at number 5 on the globalization index 2009. The report includes the 60 of the largest countries which have been evaluated concerning their openness to trade, capital movement, ideas and exchange of technology, labor mobility and cultural integration (Ernst & Young, 2009). For companies, the recession has led to changes in market conditions, for example, more costly and limited credits from banks which expose companies to greater business risks and greater vulnerability. In order to face these challenges and come up with new ways to get cash, companies have had to focus on improving and optimizing the internal activities in the company such as streamline its working capital management to release capital (Burt & Abbate, 2009). These new conditions those companies have had to face, have contributed to an increased understanding of the importance of pursuing an effective managed working capital and what positive affects it may have for a company’s liquidity and profitability. It is important to note that it is not enough with high profitability to be a successful company but an effective managed working capital is also important for success. A neglected managed working capital can, in worst case lead to the downfall of a company even if it has a high profitability (Pass & Hike, 2007).
2
A report, conducted by Ernst & Young in 2009, provides more support that the involvement in working capital management is increasing extensively and that there are great potential for improvements within this area as companies still has lots of capital tied up. The report reveals that the 2,000 largest US and European companies in the report, together has about US$1 trillion of cash tied up in working capital (Ernst & Young, 2009). Another report on the Nordic countries, where the Swedish companies represent 9% of the total 160 companies, 80 % of the Swedish companies plan to have a more effective working capital management the coming three years which indicates a higher dedication on the matter (Danske Bank & Ernst & Young, 2009). Working capital consists of current assets and current liabilities and the first one includes capital tied up in cash, short-term financial investments, inventories, account receivables and other current assets (Brealey, Myers & Allen, 2006, p. 813). Current liabilities include short-term loans, the debts to suppliers as account payables, accrued income taxes, and interest payments on long-term debts, dividend and other current liabilities (Pass & Pike, 2007). The concept of working capital management addresses companies’ managing of their short-term capital and the goal with the management of working capital is to promote a satisfying liquidity, profitability and shareholders value (Jeng-Ren, Li & Han-Wen, 2006). The three concepts, solvency, liquidity and financial flexibility, are all affected by the choices that companies make regarding their working capital policies. Simplified, a solvent company has more assets than liabilities and to find out a companies solvency, the current ratio and net working capital can be used. Liquidity, a measure of companies’ ability to pay their short-term obligations without unnecessary costs, is evaluated using the measurements; cash flow from operations, cash conversion efficiency and cash conversion cycle. The third concept, the financial flexibility, is measured by sustainable growth rate. A firm’s financial flexibility reflects a company’s ability to deal with unforeseen opportunities and adversities with regards to the company’s financial policies and structure (Maness & Zietlow, 2005, p. 25-45). These measurements, all evaluate working capital management in some way and for our study, we have chosen to use the cash conversion cycle as a measurement for working capital management. The cash conversion cycle evaluates how fast companies’ activities of resources can be converted into cash and this measurement is used to evaluate a company’s liquid situation and how effective the working capital management is (Deloof, 2003). A shorter cash conversion cycle indicates a more effective managed working capital and it has lately become more common that companies has their goal set to achieve a zeroed working capital (Maness & Zietlow, 2005, p. 15). However, a goal of having a zeroed working capital is not the optimum for all companies as a liquidity level close to zero may result in a shortage of cash which could lead to difficulty in operations and in the ability of managing their financial short-term debts. With this in mind, each company should find the level between current assets and liabilities that will serve them most
3
value (Maness & Zietlow, 2005, p. 5-9). As the effectiveness of the working capital management relies on the cash conversion cycle, companies should put their efforts in making their cash management more effective by reducing number of day accounts receivable, number of days inventories and raising number of days accounts payable (Theodore Farris II & Hutchison, 2003). Most of previous empirical studies of working capital management have focused on its effect on companies’ profitability (Deloof, 2003; Jose, Lancaster & Stevens, 1996; Hyun-Han & Soenen, 1998; Lazaridis & Tryfonidis, 2006). However, we have found one study conducted on companies in Taiwan which attempt to analyze the influence of other factors, such as business indicator, company characteristics and industry effect, on working capital management (Jeng-Ren, et al., 2006). The result suggests that two company characteristics presented by debt ratio and operating cash flow affect working capital management in the case of Taiwanese companies. This study provides the evidence that not only profitability, which has been pointed out by other researchers, affect companies’ working capital management but also other factors. This is where we got our interest to explore further into the effect of company characteristics on the management of working capital. We decide to conduct our study on Swedish listed companies because so far we could not find any empirical study regarding the impact of company characteristics on working capital management conducted in Sweden. We expect that our work would make a contribution by providing empirical evidence regarding company characteristics which affect working capital management in Swedish listed companies which would help the company to manage their working capital efficiently and lead to better operating performance.
1.2 Research question What is the effect of company characteristics on working capital management in Swedish listed companies?
1.3 Research purpose The purpose of the study is to provide the empirical evidence on the effect of company characteristics on working capital management in Swedish listed companies. We empirically examine the relationship between company characteristics and the cash conversion cycle as a measure of working capital management.
1.4 Delimitations Although we aim to provide empirical evidence on Swedish listed companies, the scope of the study have been limited due to the time limit for conducting the study. Our sample consists of 40 companies in Large Cap segment which represent only 16 percent

4
of total companies listed in NASDAQ OMX Stockholm Exchange and financial data are based on two fiscal years, the period of year 2007 and 2008. Thus, we are aware that results of this study might not be applied to entire Swedish listed companies or might not represent results over time.
1.5 Disposition Introduction We give an introduction to the chosen subject and present the problem background which lead to our research question and research purpose. We also present the study’s delimitations and finally, a disposition of the study. Research methodology Chapter two explains our choice of subject and preconceptions. We continue with the choices we made within the field of research methodology and discuss our choices of theories and sources we used. Finally, we discuss the criticisms related to those. Theoretical framework and literature review We present the theoretical framework and literature review which this study is based on. We give an introduction to the working capital management and its components and then we present literature review of previous empirical studies. Lastly, this chapter presents company characteristics, their impact on the management of working capital and the development of hypotheses which would be examined later on. Practical research method This chapter will provide information about our practical way to perform this study. We will explain the sample selection and the collection of empirical data. The chapter ends with an evaluation of the creditability criteria’s. Empirical results In this chapter we present empirical results based on Swedish listed companies’ annual reports using the statistic methods: descriptive statistics, correlation and regression. Analysis of empirical data In this part we analyze the empirical data, interpret and discuss the empirical results presented in the chapter five. We compare our empirical finding with the theory and evidence from previous empirical studies Conclusion and further consideration We will draw our conclusion and connected it to our research questions, and provide some further research consideration.

5
2. Research Methodology
In this chapter, we will explain our choice of subject and which preconceptions we had when we started this study. We will also go thorough the choices we made within the field of research methodology to give our readers an understanding of the conditions that characterise this study. In the end of this chapter we will discuss the choice of theories and sources we made and, discuss the criticisms related to those.
2.1 Choice of subject Our interest in working capital management developed from the courses taken during our study of Master’s program in Accounting at Umeå University which yield us both accounting and finance knowledge. The course Accounting, Auditing and Control provide us the knowledge of the International Financial Reporting Standard (IFRS) and the analysis of financial statement which give us an understanding of using financial statement and ratios analysis. Furthermore, the Financial management course demonstrates the important of companies’ corporate finance and short-term financial management. Our aim is to make use of our knowledge of short-term financial management and financial statement. Then we narrow down our topic to the working capital management in relation to companies’ financial statement. Doing a literature review, we found that numbers of prior empirical studies have been done in order to investigate the relationship between working capital management and profitability. Those studies used different measure of working capital and also various number of profitability measurement have been employed. However, we realize that not only profitability has an impact on working capital management but also other factors such as company characteristics should be taken into account. There are only a few empirical studies investigating the effect of company characteristics on working capital management. Moreover, none of those studies was conducted on Swedish companies. Therefore, we expect that our study would make a contribution toward academic point of view and also provide useful information for company’s management.
2.2 Preconceptions Preconceptions as life experiences affect and shape us all to be individuals with different values. It should always be considered that our preconceptions and values could affect the objectivity on different matters. In this case, it is the research question and the choice of methods that could be influenced by our life experiences. Our intention is to maintain this thesis as objective as possible and by presenting our preconceptions, that are of importance for this study we would like to inform our

6
readers of the knowledge that we contribute with and that might have colored our work. With this, we would like to make our readers aware of the fact that we have taken our preconceptions into account and considered what possible effects they may have on this study. Our awareness in this matter will hopefully strengthen the objectivity in this thesis.
2.2.1 Practical preconception
Both authors have working experience with accounting and finance. One of the authors used to work as an auditor and also as a treasury analyst before and another author have worked with accounting for a company in Sweden. This working experience has given the authors good practical knowledge within the area of accounting, auditing and finance that is of value for this study. The possible influence this practical preconception could have for the objectivity of this study shall here be taken into account. The author who worked for an audit firm is more likely to analyse companies finance from an auditor’s point of view while another author who works within a company in the biotechnology industry is more likely to analyze companies’ financial data from the company’s perspective. Our awareness of this possibility from the beginning will influence us to work against a possible influence and towards objectivity.
2.2.2 Theoretical preconception
Both authors are the students of Master’s program in accounting. We have taken courses at Umeå University within the field of accounting and finance. Previous university studies have introduced us to the components of working capital and prior courses have given us a theoretical understanding of how important it is to have an effective management for company’s operations. In our studies, we have also been in contact with annual reports so we know how they are structured and how to orientate in them which will be a beneficial knowledge in this study. Preconceptions that we have gained from theoretical sources in economy can have been angled from authors or teachers point of view and this is something that we are aware of and are taking into account which will help maintain the objectivity of this paper.
2.3 Ontological orientation Ontology, addresses the question of our perception of the reality and its existence and how people perceive and influence the social reality. Are we the one who influence or are we the one who are under the influence of the social reality? Bryman and Bell (2005, p. 33) raises two ontological beliefs, objectivism and constructionism, that differ in their perception on reality. When discussing the relationship between organisations and their employees we mean that this to some extent can be explained by objectivism,

7
which is a reason for why we lean more towards objectivism as an approach to perceive the social reality.
Objectivism and constructionism
Objectivism is a process that advocates the belief that individuals are under the influence of society’s social structures. In our case, organizations are examples of such social structures and they are to be resembled as own external entities with rules and guidelines that govern, influence and inhibit their employees (Bryman & Bell, 2005, p. 33). Managers within companies for example, are to some extent limited by their companies’ business strategies that are to be followed by everyone for the company to succeed. If a manager decides to depart from the company's strategies in a way that is unfavourable for the company, consequences will be taken to lead him on the right track again. If a company is aiming for a working capital close to zero the inventory manager would be told to keep the inventory level low, order when it is necessary. Another example of how employees can be viewed as being governed are the existence of working titles that reveals status and what role employees have in a company. With this title, employees are being objectified to people around them who build up expectations given the title. An example, the chief executive officer is expected to act and look as a chief executive officer and not as a receptionist. The title given to an employee enforces specific actions that are associated with the certain title and that people expect from an employee carrying this title. With the examples, we want to demonstrate in what way employees can be viewed as being governed by their organizations. With this said, we want to make clear that we do not embark objectivism to a full extent. We believe that in order for companies to develop in a positive direction they need those employees who can manage to think “outside the box”, be creative and break old routines that has become ineffective and see new solutions (Arbnor & Bjerke, 1994, p. 192-197). When doing so, the employee is rather the one who governs the organization instead of being the one who is governed and we are now in the field of constructionism. Constructionism advocates the belief that it is the social actors that influence the social structures and that these structures are constantly changing. (Bryman & Bell, 2005, p. 33-35).
2.4 Epistemological orientation The concept of epistemology involves the perception of knowledge. It includes theories of what is seen to be identified as knowledge and how new knowledge is reached (Bryman & Bell, 2005, p. 27). Two traditional approaches that contradict each other in their view on knowledge are empiricism and rationalism (Åsberg, 2000, p. 25).

8
Empiricism and Rationalism
Within empiricism, it is believed that knowledge only can be reached from the experiences and sensations that individuals receive from different interactions in their lifetime. The experiences are believed to be gained from observations and analysis that we encounter in our every day life and knowledge is therefore something we gain during our life and nothing we are born with. The famous politician and philosopher John Locke (1632-1704) was a devoted supporter of the empirical belief and he compared our consciousness at birth with an empty sheet. Locke describes the obtaining of new knowledge with marks on the sheet where the marks represent our newfound experiences (Åsberg, 2000, p. 25). In contradiction to empiricism, the supporters of rationalism believe that we are born with ideas and a sense, which both serves as a foundation of knowledge. Knowledge is reached when the ideas within us are declared by a reflection or an action of common sense and we gain an understanding (Åsberg, 2000, p. 26). An example of rationalism thinking is when we use oars to row in the water and it looks like they are broken. The observation we make with our eyes trick us to believe that the oars are broken when they are in fact not. Our common sense tells us the oars are still straight and that it is only due to the breakage with the surface of the water that the oars look broken. Our intention is not to gain a deeper understanding about the working capital management in our selected companies’. We aim to collect and analyze the companies’ figures objectively by using already existing formulas and statistics to get a confirmation how well our results are consistent with previous results. This way of preceding our study in order to reach new knowledge goes more in line with empiricism.
2.5 Scientific approach The two different scientific approaches, that can be applied in a research within the area of social science, are called the inductive and deductive approach. The difference between these two approaches is mainly how the theory and empiric interact with each other. .
The deductive approach Theory Observations/results
The inductive approach

9
The more time consuming approach is the inductive approach, where the starting point can be an observation that will generate data. The empirical data is collected from the observations and new theories are created (Bryman & Bell, 2005, p. 25). For a researcher who is adopting the deductive approach the research process starts from already existing/available theory where hypothesis are extracted. Data is gathered to analyse the validity of the theory and with the help of statistics an empirical test is carried out of the hypothesis (Bryman & Bell, 2005, p. 23). As we have used already existing theories to formulate our problem and then intend to use Swedish companies to test if these theories are consistent with our result, we believe the deductive method is the most appropriate method for us. Our attention is not to observe but to test our data.
2.6 Research approach When it comes to the collections of data it is important to choose data that is suitable for the study. Two approaches to choose amongst when doing a study within social science are the qualitative method and the quantitative method (Halvorsen, 1992, p. 78). The qualitative method is relevant for studies whose objective is to enter more deeply into a special topic by using a minor population and several variables. The focus with a qualitative study is directed towards discovering the specific and extraordinary within a special area in order to obtain an enhanced understanding as a result. To facilitate such particular result, a closer relation between the researcher and its information objects is often required in difference to the quantitative method (Halvorsen, 1992, p. 82-83). As regards to the quantitative method, this methods’ features are focusing more on the present time and the research is carried out in a more structured and standardize way in contrast to the qualitative method. The collected data used are more empirical and quantified and with the help of statistics, researchers use this data to verify or falsify hypothesises or replicate earlier studies to see if their results agree and can be generalized (Olsson & Sörensen, 2007). We have chosen to apply the quantitative approach for our thesis with the motivation that we intend to collect our data from the companies’ annual reports and use statistics to derive any correlation or differences that can exist. Since we intend to use numerical data to answer our research question we find the quantitative method more suitable for this thesis. The theoretical data will be quantified and transformed into number of days to make it measurable with statistics. Our intention is not to interpret our findings but to test and see how well our results agree with already existing theories.

10
2.7 Selection of sources Concerning our work in finding and collecting relevant theoretical material for our study, we have used the search engines and databases provided by the Umeå University library website. To find out the latest research regarding working capital management, we started to search for scientific articles using the databases in business field. There have been two databases that we have used and where all our articles derive from and they are; the business source premiere and Emerald. The words we have been using in the search for the scientific articles are: working capital, working capital management, cash cycle, cash conversion cycle, cash management, accounts receivable, accounts payable, short term financial management, cash flow and liquidity in different combinations. The theory we have applied to provide background information on the topic of working capital management mostly consist of student literature that we have found through the search engine ALBUM at Umeå University Library website. The keywords used here to find relevant literature are the same we used as in the search for articles. To find literature of methodological nature, we used keywords such as vetenskaplig metod, empirism, ontologi, positivism and hermeneutik, in different combinations.
2.8 Sources and criticism The majority of the scientific articles we use have all been peer previewed and published in respected journals which provide a high quality of credibility. Nevertheless, there is always the possibility that the authors to the scientific articles might influence the content of their work with own perceptions of the matter which could have a negative affect on the objectivity (Davidsson, 1994, p. 55). Being aware of this risk we have done our best to keep the information in this study as objective as possible. The literature that we have been using consists mostly of course literature which should be assumed to have a high level of creditability as they are accepted as literature at universities. Despite a quite high level of creditability of the literature there is always authors that influence there work with own perceptions and positions of matters. We are aware of this here as well and have tried to keep our self to the objective side of the information. The data retrieved for the statistic study comes from companies annual reports whose contents are governed by rules and regulations. This is positive for the creditability level of the annual reports as a source but it shall be notified that these rules and regulations

11
does not cover all risks of incorrect information. The companies can still make some beautifications of the companies’ figures to benefit business.

12
3. Theoretical Framework and Literature Review
In this chapter, we present the theoretical framework and literature review which this study is based on. We give an introduction to the working capital management and its components. Further, we present literature review of previous empirical studies. Lastly, this chapter presents company characteristics, their impact on the management of working capital based on previous studies and the development of hypotheses which would be examined later on.
3.1 Definition of Working capital management Working capital management has lately become a better known concept as more and more managers are starting to realize the benefits that a well managed working capital can bring. In literature, authors generally refer to the concept of working capital as, working capital or net working capital. These two expressions are sometimes distinguished but in this thesis we will describe them with the same definition. We believe an assimilation of the two expressions is acceptable as the expressions are so closely related with each other in their meaning. Arnold defines working capital as, “the difference between current assets and current liabilities” (Arnold, 2008, p. 515). After reviewing different sources about working capital, it has become clear that the definitions taken from Arnold is a very general definition that is frequent used to define both working capital and net working capital. This is also the definition that we will apply when we refer to working capital and net working capital in this thesis. Continuing with the concept of working capital management, Jeng-Ren, et al., describes this as “companies’ management of their short-term capital” (Jeng-Ren, et al., 2006). The short-term capital is here referred to as the current assets and current liabilities. Accordingly, we intend to follow Jeng-Ren, et al. definition about working capital management in our thesis.
Working capital management
Working capital management concern companies’ management of their short-term capital. The short-term capital refers to the capital that companies use in their daily operations and it consists of companies’ current assets and current liabilities. A well-managed working capital promotes a company’s well being on the market in terms of liquidity and it also acts in favor for the growth of shareholders value (Jeng-Ren, et al., 2006). Current assets consist of capital tied up in cash, short-term financial investments, inventories, account receivables and other current assets (Brealey, Myers & Allen, 2006, p. 813). Current assets can be defined as assets used in companies’ daily operations with the expectation to provide companies cash in return within a period no

13
longer than approximately a year. The short-term investments can be seen as a safety net for companies due to the fast cash conversion ability (Raheman & Nasr, 2007). The current liabilities include short-term loans, the debts to suppliers as account payables, accrued income taxes, and interest payments on long-term debts, dividend and other current liabilities (Pass & Pike, 2007). Current liabilities provide external financing for companies and they are especially important for smaller companies that can experience difficulties to get long-term loans (Teruel & Martı´nez-Solano, 2007). Working capital management aims to create an effective flow of the capital passing through the activities of current assets and liabilities. Figure 1 demonstrates a more detailed view of the working capital cycle and the arrows in the figure illustrate the cash flow movements within a company (Pass &Hike, 2007). Figure 1. The Working Capital Cycle Source: Pass & Hike(2007). An overview of working capital management and corporate financing. As shown in the figure, the working capital requirement consists of capital from the company’s shareholders and debenture holders. The company uses this capital along with the cash inflow to finance material needed for their business activities. If suppliers
Overheads
Shareholders
Labour
Debtors
Material
Cash
Working Capital
Requirement
Debenture holders
Credit from
Supplier Banks &
Employees Government
Shareholders
Finished Goods
14
offer credit periods, the purchased material is initially financed by the suppliers until payables are paid. Credits from banks and government also help in funding the administrative costs like labour and overheads (Pass &Hike, 2007). When purchased material has undergone a manufacturing process and become finished goods, it is time to get the products sold to earn money. The money derived from sales are used to pay debtors, finance new investments and give money back to shareholders in dividends. From here the cycle starts over again (Pass &Hike, 2007).
3.2 Positive and negative working capital By calculating the difference between current assets and liabilities the net working capital is given and this measurement demonstrates how well companies can manage their short-term commitments. The optimum situation for most companies is when they manage financing of both expected and unexpected upcoming events without experience any financial distress (Maness & Zietlow, 2005, p. 28). Companies with positive net working capital have more current assets than liabilities and can use the surplus of current assets to fulfil their financial commitments and obligations to shareholders which is a vital aspect for the continuing growth of any company (Lantz, 2008, p. 113). The advantages of having a positive net working capital are clear, but there are also disadvantages to consider and they occur when companies have to high level of capital tied up in their current assets. Tied up capital, is capital that do not generate companies any additional value and would do more good in new investments that could bring the company further return (Lantz, 2008, p. 114). If current liabilities exceed current assets, the net working capital is negative which means the company does not have enough own capital for financing its short-term debts. Most companies suffer badly when their net working capital is negative and this is a condition that also profitable companies can end up in if they do not manage their working capital efficiently. Profitability is great but it is not enough to become a successful company as a well managed working capital is equally as important. As a way to avoid bankruptcy in poor situations, companies can use credits or sell off short-term assets to get capital for payments (Maness & Zietlow, 2005, p. 5-9). In order to facilitate the managing of working capital, corporate managers use different measures to help them keep track on which level their working capital withhold. One of the more common used measures for this purpose is the cash conversion cycle that we have chosen to apply in this thesis. Following part will discuss the alternative working capital management measures that can be applied, including the cash conversion cycle.

15
3.3 Measurement of working capital management As mentioned in the chapter 1 introduction, there are three different concepts that are all affected by the choices that companies make regarding their working capital policies. The three concepts are solvency, liquidity and financial flexibility and as a continuation on the presentation of the various concepts in the introduction, a presentation of the pros and cons of the concepts various measures will here be presented (Maness & Zietlow, 2005, p. 25). Two typical solvency measures are the current ratio and the net working capital which both measure the relation between the current assets and the current liabilities to assess the company ability to pay their short-term debts. The net working capital, here defined as “the difference between current assets and current liabilities”, is an absolute measure that demonstrates how well companies can manage their short-term commitments. Because this is an absolute measure, it becomes inappropriate to use in a comparison between companies in different sizes which is a disadvantage with this measure. Maness and Zietlow also bring up Shulman and Cox discussion about the weaknesses with net working capital that it is an unbeneficial measure as the current assets and current liabilities are mixed with both financial and operational strategies. Shulman and Cox believe this mix of financial and operational strategies cause this measure to give an unfair picture of a company’s liquidity. In order to adjust this they separated the operational and financial strategies into two new measures that replaced current assets and liabilities. This way, the measure would give a more righteous value (Maness & Zietlow 2005, p. 28-29). Common liquidity measures are; cash flow from operations, cash conversion efficiency and the cash conversion cycle. The first measure, taken from companies’ cash flow statement is calculated by taking the net profit plus depreciation, long-term deferrals, and amortization. This is somewhat a more useful measure when making comparison over several years, rather than over just one year. This is because a one-year result could be misleading due to possible fluctuations on the market or situations out of the ordinary that affect the measure. For example, fluctuations on the market and newly started up companies are conditions that can contribute to a negative cash flow from operations for one or two years but due to these kind of conditions, a negative cash flow would in this case not be an alarming sign as it could be expected to recover within an acceptable near future. The second measure, the cash conversion efficiency, is gained by dividing cash flow from operations with sales. This measure is beneficial for companies as it reveals how efficiently they manage their business in terms of liquidity and profits. The measure tends to follow the companies profit levels and gives a percentage that indicates how fast companies manage to transform their sales into cash. A high percentage indicate an efficient managed working capital equally a short cash flow cycle, which is desirable. Continuing with the cash conversion cycle, this is a measure that provides the number of days it takes in average for capital, tied up in working capital, to convert into cash in the cycle (Maness & Zietlow 2005, p. 35-37).

16
One of the benefits with this measure is that it in difference to the first measure, the cash flow from operations, takes the time aspect in account. This is an advantage that will provide managers a more complete and useful liquidity measure as they get information of how efficiency their short-term capital is managed (Richards & Laughlin, 1972). The cash conversion cycle includes the average number of days inventory, the average number of days accounts receivable and the average number of days accounts payable and a short cash conversion cycle is desirable as it indicates an effective working capital management. The drawback with this measure is that it neglects the handling with in and out payments that most company has and which might add some days in the cycle. For a more accurate measure, these number of days should be withdrawn as it has nothing to do with the management of working capital. Despite this minor flaw the cash conversion cycle is known to be a very common used measure that is appreciated to contribute with good guidance for companies’ liquidity management (Maness & Zietlow 2005, p. 35-37). The third and last concept is the financial flexibility which reveals how realistic companies’ financial policies are compared with their actual ability to grow. The measurement to determine a company’s growth is called the sustainable growth rate and is simplified an equation of the return on shareholders equity and the companies’ net profit. The sustainable growth rate determines a company’s ability to grow and make investments without getting into liquidity problems. A high growth rate indicates that a company has enough profits to both manage its obligations as well as making new investments, a more preferable state than a low sustainable growth rate which indicates that a company has too little incoming cash flow to cover its obligations. The downside with this measure is that it does not consider the demand on the market which is a vital aspect for a company growth. A company could have a high sustainable growth rate but if the company is missing a market to expand in the sustainable growth rate is worthless as a measure. The strength with the sustainable growth rate measure is that it points out the relationship between profits and growth, how they reflect each other (Maness & Zietlow 2005, p. 41-43). In our study, we have chosen a liquidity measure, the cash conversion cycle, as a measure of working capital management. The cash conversion cycle presents the time span between the company’s cash disbursement to suppliers and its collection from customers which reflect from the company policies on inventory, accounts receivable and accounts payable. Moreover, the cash conversion cycle measures a company’s liquidity from the going concern perspective. Therefore, we found it to be appropriate and relevant for our study.
The cash conversion cycle
The cash conversion cycle is used to measure working capital management and it measures companies’ liquid situation and how effective the working capital is managed
17
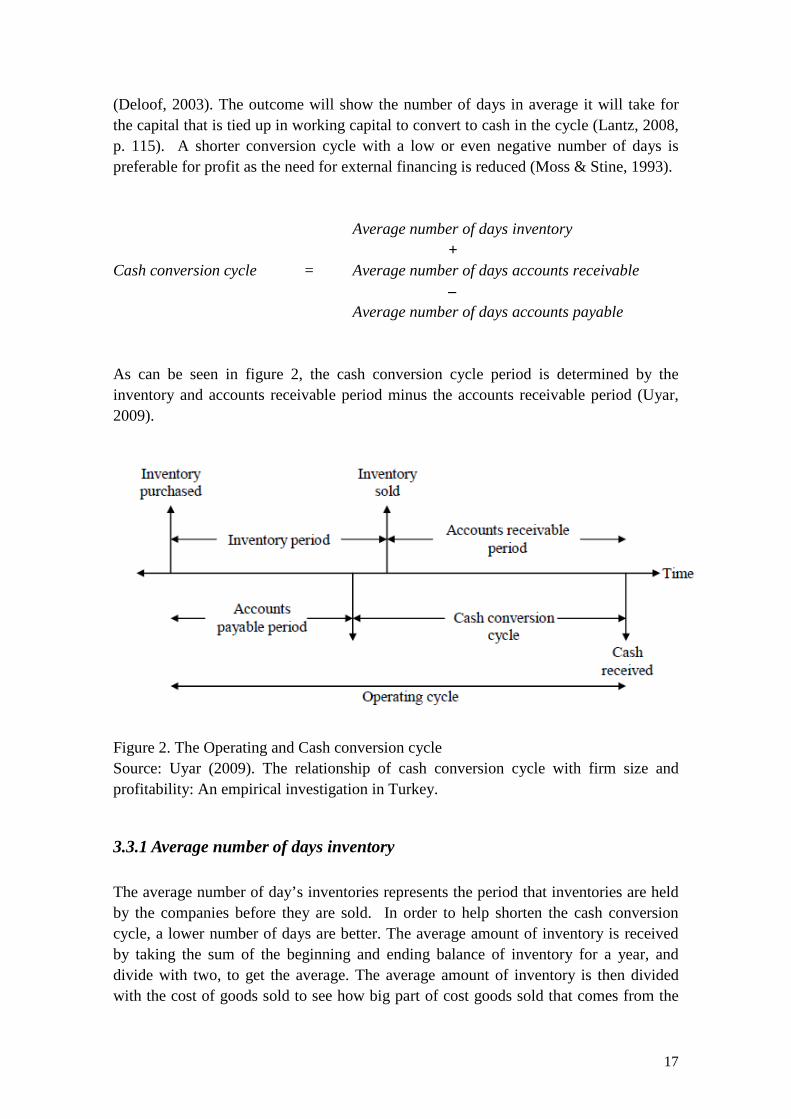
(Deloof, 2003). The outcome will show the number of days in average it will take for the capital that is tied up in working capital to convert to cash in the cycle (Lantz, 2008, p. 115). A shorter conversion cycle with a low or even negative number of days is preferable for profit as the need for external financing is reduced (Moss & Stine, 1993).
Average number of days inventory +
Cash conversion cycle = Average number of days accounts receivable –
Average number of days accounts payable As can be seen in figure 2, the cash conversion cycle period is determined by the inventory and accounts receivable period minus the accounts receivable period (Uyar, 2009).
Figure 2. The Operating and Cash conversion cycle Source: Uyar (2009). The relationship of cash conversion cycle with firm size and profitability: An empirical investigation in Turkey.
3.3.1 Average number of days inventory The average number of day’s inventories represents the period that inventories are held by the companies before they are sold. In order to help shorten the cash conversion cycle, a lower number of days are better. The average amount of inventory is received by taking the sum of the beginning and ending balance of inventory for a year, and divide with two, to get the average. The average amount of inventory is then divided with the cost of goods sold to see how big part of cost goods sold that comes from the

18
inventory. In order to get the outcome of the cash conversion cycle in days the amount given is multiplied with the average amount of days a year, 365 (Lantz, 2008, p. 115).
365xsoldgoodsofCost
InventoryAverageinventorydaysofnumberAverage =
Deloof (2003) found a significant negative relation between gross operating income and number of days inventories. This explains that an increase of the inventories is an affect from a decrease in sales which leads to lower profit for the companies. Another research by Boisjoly (2009) found an increase of inventory turnover over a period of fifteen years that indicates that companies have improved their inventory management. To manage inventory, there are several manufacturing operating managements to apply, such as; just-in-time procedures, make-to-order procedures, lean manufacturing initiatives to improve their operating processes, quality programs to reduce number of parts and supplier rationalization to reduce number of suppliers (Boisjoly, 2009).
3.3.2 Average number of days accounts receivable The average number of days accounts receivable is used as a measure of accounts receivable policy. It represents the average number of days that the company uses to collect payments from its customer. This metric is received by dividing the sum of the opening and ending balance of account receivables with two and divide this with the net sales and then multiply the outcome with the average number of days in a year. Similar to the inventory, a low number of days is desirable to keep the cash conversion cycle short (Lantz, 2008, p. 115).
365xSalesNet
recievableaccountsAveragerecievableaccountsdaysofnumberAverage =
Deloof (2003) find the significant negative relation between the average number of days accounts receivable and gross operating income as a measure of profitability. Boisjoly (2009) provide the evidence that companies have focused on improving the management of accounts receivable as their accounts receivable turnover increase over the 15 year time period for 1990-2004. Several techniques can be applied such as strengthen their collection procedures, offer cash discount and trade credit, and use receivables factoring (Boisjoly, 2009).
3.3.3 Average number of days accounts payable The average number of days account payable is used as a measure of account payable policy. It represents the average number of days the company takes to pay its suppliers.

19
While the two previous metrics is preferred to keep short, more number of day’s accounts payable is considered better for shorter cash conversion period (Lantz, 2008, p. 116).
365xsoldgoodsofCost
payableaccountsAveragepayableaccountsdaysofnumberAverage =
The study of Deloof (2003) shows a negative relation between average number of day’s accounts payable and profitability which indicates that profitability has an effect on accounts payable policy as a company with less profit takes longer payment period. In the case for Belgian companies, suppliers offer their customers substantial discount for the cash payment customer which lead to increasing profit of the company (Deloof, 2003). In the study of Boisjoly (2009), the result shows an increase in account payable turnover over the 15 year time period which is contrary to expectation as large companies have extended their payment period to suppliers from 45 to 60 days or 60 to 90 days. The explanations are that only few companies succeeded in increasing their payment terms, increasing in amount of accounts payable or decreasing in fund for working capital (Boisjoly, 2009).
3.4 Efficient working capital management
3.4.1 The cash conversion cycle By applying the cash conversion cycle, managers can keep track of how effective their working capital is managed in their operating cycle. The cash conversion cycle starts from the time companies purchase resources and proceed until cash is received from products sold. By calculating the average time it takes for capital to travel between the start and finishing point of the cash conversion cycle managers can estimate the approximate time it takes to release capital that is tied up in the short-term assets (Gentry, Vaidyanathan & Hei, 2001). If cash is tied up in different activities for too long the company has a non-effective cash flow in the cycle and this cost money (Larsson, 2005, p. 21). In general, most companies benefit from having a short cash conversion cycle since that will generate more value in the long run. The benefits, that a reduced or even zeroed net working capital can provide, are better liquidity due to a more effective operating cycle and increased earnings due to the faster routines and therefore less tied up capital. More and more companies are taking into account the significance of a well managed working capital and the benefits that it brings and this awareness have increased the trend for a net working capital close to zero (Maness & Zietlow, 2005, p. 15).

20
Inventory Accounts Accounts Payable Receivable
Cash Figure 3 The Cash Conversion Cycle Source: Commercial Loan Advice http://www.loanuniverse.com/cashcycle.gif [Retrieved 2009-10-31] The challenge with the cash conversion cycle is to arrange a suitable capital flow between the four working capital accounts so that not all commitments coincide and causes financial suffering for the company. An undesirable situation would be if a large payment has a maturity date before the company received enough receivables that could cover the payment. This could be the case if customers are late with paying or it could be a result of bad planning from the company’s side. The company would be forced to wait with the payment and risk having to pay unnecessary costs as fees because of the delay (Larsson, 2005, p. 28). The objective for managers who work with working capital is as mentioned, to find a good balance between the current assets and liabilities, a balance that is in favor for their particular company and that will provide this company the most value (Maness & Zietlow, 2005, p. 6). A well adapted balance will promote both a company’s profitability and liquidity which is a desirable outcome for most companies. Implementing a management that will promote both profitability and liquidity is difficulty as a good liquidity in general does not favor the growth of profits and vice versa. Having a high liquidity means that lots of capital is tied up in short-term assets which can be reassuring in terms of being able to pay debts and other obligations in time but this is also capital that could be used for investments to increase profitability. A company’s managers all have different interests to meet, for example, production managers would like to stock more inventory to avoid disruptions due to lack of materials, an approach that goes against the working capital managers goal for a more efficient managed working capital. The challenge for companies and their working capital managers is to get a company’s all department managers to strive after the same goals and see the bigger picture (Pass & Pike, 2007). By avoiding unnecessary interruptions and costs in order to pursue an effective working capital management, the matter of timing is of great importance. In theory, the optimal state would be if the companies are paying their account payables at maturity, receive

21
payments from the customers as quickly as possible and keep the level of the inventory to a minimum. This way the companies will benefit most value. This approach do has its obstacles and downsides, for example; a company that would be able to achieve the optimal timing as mentioned would most probably no longer be able to benefit from the quantity discounts and there is a increased risk that they would run out of money to pay their own payables with if customers are late with payments. It is a balance and challenge between risk and trying to make the operation processes more effective to the extent that it is not harmful for the company (Maness & Zietlow 2005, p. 5,6,17, 99).
3.4.2 Inventory management The composition of an inventory differs depending on what kind of production or business companies are involved in. The five different assets an inventory can consist of are; raw materials, work in progress materials, finished goods, extra material and consumption materials. Most companies have an inventory that they more or less depend on in their operation. The manufacturing companies can hold an inventory that consist of all five different materials and for them keeping an inventory is essential for their production. For most companies the inventory can be seen as an unavoidable cost (Lantz, 2008, p. 306). The management of inventory is one of the more challenging tasks for working capital managers who, if they could decide, would like to minimize the inventory as much as possible in order to shorten the cash conversion cycle and reduce costs. The risk of minimizing an inventory down to a level close to zero is that it increases the possibility of running out of materials needed in the production or running short of finished goods during a high demand. Such situation would be costly for any company due to the revenues they would loose (Maness & Zietlow, 2005, p. 99). As mentioned earlier, one of the challenges for a working capital manger is to have all the companies managers to agree about how to manage the inventory. Each manager has their own interests they first and foremost would like to satisfy which complicate the task to reach a joint decision. Each company should find the balance that they will benefit most from (Pass & Pike, 2007). The just-in-time approach is a strategy for effective inventory management and help keeping inventory levels on a lower level. The strategy aims to make the orders of material, produce and deliver just in time when it is required and not before (Brealey, Myers & Allen, p. 820).
3.4.3 Accounts receivable management Companies depend more or less on their account receivables to finance some if not all of their payables and they should therefore attempt to reduce their credit time to

22
customers as much as possible. The credit time runs from the invoice date until the due date of the invoice (Larsson & Hammarlund, 2009, p. 23-24). The reason for shortening the credit period is due to the fact that longer credit time to customers includes the unfavourable effect that it keeps companies from benefiting from the capital inflow that they are expecting from sales. By allowing customers to keep the money during a credit time companies are exposing themselves to a higher risk of ending up in an unstable financial situation. This is where the importance of timing comes in and where it becomes apparent which companies manage their working capital efficient and which companies do not (William & McAfee, 2009).
3.4.4 Accounts payable management The general guidelines for optimizing the managing of account payables involve the timing of payments. Companies should try prolonging the time of payment as long as possible as they can use the advantage of their suppliers financing their investments until payment has been made. Another argument for prolonging the time for payment is that the producing companies, for example, need some time to convert their purchased raw material into products they can get sold and get cash in return (Maness & Zietlow, 2005, . 235-238). Some suppliers offer their customers discount rates as an attempt to get them to pay their receivables before maturity date which may sound tempting but this is not always the most profitable option. To avoid being misled by theses discounts offers, companies should carefully consider every discount offer they get to see that it is beneficial in terms of their conditions. For a discount to be beneficial for the buyer the discount rate should be higher than the interest rate the company would have to pay for a loan over the same period as the discount period (Maness & Zietlow, 2005, p. 235-238). If there is no discount offer given companies should use the whole credit period and pay their payables on due date. Paying after due date should always be avoided unless the company has fallen in financial difficulties and there is no other choice. The reason for this is that delayed payments can result in unnecessary costs as late fees (Dolfe & Koritz, 2000, p. 49).
3.5 Minimizing, not always the best option
3.5.1 Cash management The management with account payables and receivables that has been described above goes under the term of cash management. Following paragraphs summarizes what cash management engage in order to shorten the cash conversion cycle (Lantz, 2008, p. 119);

23
� Extend the credit time for account payables � Shorten the credit time for account receivables � Incorporate more efficient methods for the management of account
payables and receivables, internet banking for example � Improve the procurement of capital surplus and deficits (Lantz, 2008, p.
119) Despite the ambition to minimize the cash conversion time and therefore the costs in the conversion cycle, the companies cannot escape all costs since they have their own obligations to consider. Taking into the account these responsibilities companies must keep some cash for expected as well as unexpected expenditures that occur in their everyday business. Lantz have mentioned about these three motives why companies should hold cash (Lantz, 2008, p. 119);
� The transaction motive: the company must be able to manage their own obligations like payments to suppliers. They should not be dependable on customers paying in time since they can be late and pay after due date which will involve extra costs.
� The speculative motive: the market is unpredictable and opportunities could turn up at any time and when they do, companies should see to that they have money available if they would like to invest.
� The precautionary motive: as well as the market is unpredictable so are the activities in the business. Unexpected events like; machines breaking down, a suddenly increase or decrease of the demand and more, can occur and could have a very negative influence for the whole company if not taken care of (Lantz, 2008, p. 120).
3.5.2 Inventory Seen from the working capital managers point of view they would like the companies to minimize their inventory and keep it for as short period of days as possible. This may not be the optimum for every company since there are many operations and stakeholders that depend on the inventory to be provide when needed. The reasons for holding inventory above zero are summarized in these three motives (Maness & Zietlow, 2005, p. 99).
� The transaction motive: the company must always be able to satisfy their customers’ demand that can fluctuate unexpectedly over time.
� The precautionary motive: in case of unexpected events like machines breaking down or material running out it is good to have some back up.
� The speculative motive: in case of unexpected events like orders from own suppliers failing or other interruptions or opportunities an inventory back up can be well in hand (Maness & Zietlow, 2005, p. 101).
24
3.6 Previous studies related to working capital management Working capital management has been in an interest not only to company’s management but also to academic researchers. Numbers of prior studies have been conducted to examine the relationship with working capital management as follows.
3.6.1 Working capital management and firm performance The previous study conducted by Deloof (2003) investigated the relationship between working capital management and its impact on the company’s profitability in 1,009 Belgian companies for the period from 1992 to 1996. The study uses cash conversion cycle as a measure for working capital management and gross operating income to measure profitability. Cash conversion cycle, number of days account receivable, number of days inventories and number of day account payable report negative relationship towards profitability. The regression analysis show the significant negative relation between number of days accounts receivable, number of days inventories, number of days accounts payable and gross operating income. Deloof (2003) also report the negative relationship between cash conversion cycle and profitability but it is not in the significant level. As a result, Deloof (2003) suggest that the company can increase its profitability by reducing number of days accounts receivable and number of days inventories. Hyun-Han and Soenen (1998) conducted the study to investigate the relationship between the efficiency of working capital management and its profitability using 58,985 samples in eight industries for the period from 1975 to 1994. They use the net trade cycle as a measure of working capital management efficiency. Return on assets and return on sales have been used to measure profitability. Result from regression analysis shows the significant negative association between the net trade cycle and profitability which is explained that a company with the short length of the net trade cycle is more profitable and has a higher risk-adjusted stock return. Raheman and Nasr (2007) investigated the relationship between working capital management and profitability of 94 Pakistani listed companies for the six-year period from 1999 to 2004. Net operating profitability is used to measure profitability. Average collection period, inventory turnover in days, average payment period, cash conversion cycle and current ratio on the net operating profitability include in the study. Results from descriptive analysis show that average cash conversion cycle is 73 days in Pakistani companies. Results from regression analysis show that there is a positive relation between company size and profitability. Further, the results report that profitability has significant negative relations with accounts receivable as a measure of liquidity, debt ratio, inventory turnover in days, average payment period and cash conversion cycle.

25
Yung-Jang (2002) conducted the study to investigate the relationship between liquidity management and operating performance, and the relationship between liquidity management and corporate value of 1,555 Japanese companies and 379 Taiwanese companies for the period from January 1985 to December 1996. Cash conversion cycle is used as a measure for liquidity while operating returns on assets (ROA) and pre-tax returns on equity (ROE) are used to determine operating performance. Results from the Pearson correlation coefficient in Japan companies show 1) the significant negative relation between CCC and ROA, and between CCC and ROE in five industries: food, construction, manufacturing, services and other industries and 2) the significant positive relation between CCC and ROA in petrochemical and transportation industries. For Taiwanese companies, the results show significant negative relation between CCC and ROA in most of industries. Result from regression analysis confirms the significant negative relationship between CCC and ROA. Joes, et al. (1996) conducted the study to examine the relationship between profitability using operating return on assets (ROA) and pre-tax return on equity (ROE) as measurements ,and liquidity management measured by cash conversion cycle (CCC) on a large cross-section of 2,718 companies over a twenty-year period from 1974 to 1993. Using the Pearson correlation coefficient analyze data by industry, results show the negative relationship between CCC and ROA in all industry and the significant negative relation in the service industry and the retail/wholesale industry which indicate that aggressive working capital management is associated with higher profitability. The researchers point out the factors affect the relationship between CCC and ROA such as capital intensity, product durability, production process, channel of marketing and competitive forces. Eljelly (2004) conduct the study to examine the relationship between profitability and liquidity on 29 joint stock companies in Saudi Arabia for the period from 1996 to 2000 within three industries: agriculture, industrial and services. The regression result show the significant negative relationship between companies’ profitability and liquidity which is measured by current ratio and cash conversion cycle. Then, companies are divided into two groups according to number of cash conversion cycle days. The regression results show the significant negative relationship between liquidity level measured by current ratio and their profitability in larger cash conversion cycle companies, while there is negative relation at insignificant level in shorter cash conversion cycle companies. The result indicate that the liquidity level become more important and has impact to profitability when cash conversion cycle is long. In industry regression, the result show the significant positive relationship between both cash conversion cycle and company size measured by net sales and profitability in the agricultural and manufacturing industries. García-Teruel and Martínez-Solano (2007) examine effects of working capital management on profitability of 8,872 small and medium enterprises (SMEs) in Spain for the period from 1996 to 2002. The return on assets (ROA) is used as a measure of
26
profitability, and the number of days accounts receivable, number of days inventories, number of days accounts payable and cash conversion cycle are used to measure working capital management. The correlation matrix demonstrate that the return on assets has the significant negative relationship with number of days accounts receivable, number of days inventory, number of days accounts receivable and cash conversion cycle. Researchers also conduct the panel data methodology where the results show the significant negative relationship between number of days accounts receivable, number of days inventory, cash conversion cycle and ROA. Samiloglu and Demirgunes (2008) conduct the study to examine the effect of working capital management on company profitability of listed manufacturing companies in Istanbul Stock Exchange for the period from 1998 to 2007. Cash conversion cycle, accounts receivable period and inventory period are used to measure the effects of working capital management; return on assets is used as a profitability measure. Results from regression analysis show that profitability has a significant positive relation with firm growth and significant negative relations with accounts receivable period, inventory period and leverage. Lazaridis and Tryfonidis (2006) investigate the relationship between working capital management and company’s profitability measured by gross operating profit on 131 companies listed in the Athens Stock Exchange for the period from 2001 to 2004. Regression result shows the negative relationship between cash conversion cycle and profitability. In others equations, researchers substitute the components of cash conversion cycle: number of days accounts payables, number of days accounts receivable and number of days inventories for cash conversion cycle. The researchers explain significant positive relationship between gross operating profit and number of days accounts payable as a company delays its payment which affects the higher level of working capital and use to increase its profitability which less-profit companies would make use of this to delay their payment. The significant negative relationship between gross operating profit and number of days accounts receivables is demonstrated that companies can increase their profitability by decreasing credit term giving to their customers. At last, the researchers find the negative relationship between number of days inventories and gross operating profit but it is not in significant level. They suggest that by handling cash conversion cycle and maintain accounts receivable, accounts payable and inventories at an optimal level the manager can create profit to their company.
3.6.2 Working capital management and capital investment Boisjoly (2009) conducted the study to examine the impact of working capital management and corporate reinvestment policies and practices on financial ratios and distributions of 50 non-bank companies over time for the period from 1990 to 2004. Financial ratios related to working capital management and capital investment process

27
include accounts receivable turnover, inventory turnover, accounts payable turnover, working capital per share, cash flow per share, and investment ratio. The results show the increasing of the average of five financial ratios: accounts receivable turnover, inventory turnover, accounts payable turnover, working capital per share and cash flow per share. Also, the results from ratio distribution tests show that the cash flow per share and the investment ratio have significantly changed over time which indicates that aggressive management of working capital and significant increase in productivity have resulted in significant improvement in cash flow per share and reduced the level of corporate reinvestment. Charlton, et al. (2002) investigates industry and liquidity effects in a company’s internal cash and investment. The study conducted on U.S. companies in seven industries for the period from January 1980 to December 1998. Companies have been classified into broad industry classification and then companies in each industry have been put into three groups according to its liquidity which is measured by cash conversion cycle. The regression results show that low cash conversion cycle companies have higher internal liquidity and lower overall cash constraints.
3.6.3 Other studies related to working capital management The study of Jeng-Ren, et al. (2006) investigated the determinants of the management of working capital in listed companies in Taiwan taken financial data of 35 quarters for the period from the first quarter of 1996 to the third quarter of 2004. They use the net liquid balance and working capital requirements to evaluate the company’s working capital management. Factors include business indicator, industry effect, debt ratio, growth opportunities, operating cash flow, firm performance and firm size. The study, which has net liquid balance as a measure of working capital management, report a significant positive relation with economic recession which indicate that the company maintain higher net liquid balance in the time of recession. The significant positive relations are also found with operating cash flow, firm size, growth opportunities and firm performance. On the contrary, there is a significant negative relation between net liquid balance and debt ratio. Using working capital requirement as a measure, the study find the negative relations with business indicator and recession, debt ratio and operating cash flow. The significant positive relations are reported in case of firm age, firm performance and firm size. As a result, the study point out the debt ratio and operating cash flow affect the management of working capital. Moss and Stine (1993) examine the relationship between the length of cash conversion cycle and the size of retail firms as well as the relationship between the length of cash conversion cycle and cash flow in 1,717 retailing companies for the period from 1971 to 1990. Firm size is measured by net sales and total assets and then firms are classified into five groups according to their size. Results show that large firms have better working capital management as they found the significant longer cash conversion

28
period in the smallest 20 percent of companies. The small companies have longer inventories period and accounts receivable period and also have longer accounts payable period than larger firms. The researchers recommend small firms to improve their working capital management by focus on managing their accounts receivable and inventories. They also find the significant negative relationship between cash conversion cycle and cash flow. Besides, they find the significant positive relationship between cash conversion cycle and the current and quick ratio.
3.7 Company characteristics and development of hypotheses
Referring to theoretical framework and literature review on working capital management, we find that there are several factors which have an impact on the management of working capital such as company characteristics and industry effect. The following part presents company characteristics, their impact on working capital management and development of hypotheses which would be tested in our empirical study in order to determine the effect of these company characteristics on the cash conversion cycle as a measure of working capital management.
3.7.1 Profitability Both liquidity and profitability are the core concern of the company’s management. Also, profitability is expected to have significant impact on company’s cash conversion cycle. Cash conversion cycle might have both positive and negative effect on the company profitability, for instance, while a company with long cash conversion cycle might have higher sales because of long credit term given to trade credit customers, high cost of investment in working capital might decrease profitability as well (Deloof, 2003). Hyun-Han and Soenen (1998) provide the evidence that there are the significant negative relationship between working capital management measured by net trade cycle and profitability which point out that market share lead to the bargaining power with suppliers and customers to shorter the net trade cycle and higher profitability. Lazaridis and Tryfonidis (2006) find the negative relationship between cash conversion cycle and profitability measured by gross operating profit. The researchers explain this negative result as shorter cash conversion cycle will generate more profit for a company. Jose, et al. (1996) provides the evidence that companies with high profitability tend to have shorter cash conversion cycle than low profitability companies. In their study, they classify companies into eight groups according to their profitability and calculate average cash conversion cycle of each group. Eljelly (2004) also reports significant

29
negative relationship between the liquidity level and profitability in companies with long cash conversion. Base on the prior empirical studies, we expect profitable company to have effective working capital management which results in the shorter cash conversion cycle. Hypothesis is formulated as follows: H1: Profitability is negatively related to CCC. In contrary, Jeng-Ren, et al. (2006) find the significant positive relation between the net liquid balance as a measure of working capital management and firm performance measured by return on assets. They find that high profit companies tend to have more working capital balance as a result from using conservative policy. In addition, the result with another measurement, working capital requirement, point out the positive relation which suggest that companies have inefficient working capital management which leads to high account receivable and inventory balance.
3.7.2 Operating cash flow Operating cash flow is the amount of cash flow from company’s operating activities which is used by the company in order to fund its operation, repay debt and pay dividend. It also plays an important role as financial investment when the external financing cost is high. Cash flow from operation reflects the company’s credit policy and the company’s operating decision (Nwaeze, et al., 2006). Besides, Boisjoly (2009) provide the evidence that cash flow per share increase over time for the 15 year time period. Moss and Stein (1993) find the significant negative relationship between cash conversion cycle and cash flow. They provide the evidence that the shorter cash conversion cycle companies have a larger amount of cash flow. Cash flow per total assets is used as a cash flow measurement in their study. Jeng-Ren, et al. (2006) find the significant positive relation between operating cash flow and working capital management measured by net liquid balance which is explained that companies with excess operating cash flow have more working capital which imply that the companies have efficient working capital management. In addition, they tend to keep it with high liquidity assets as cash and short-term investment. Operating cash flow reflects the company’s ability to generate cash and its working capital management policy such as inventory policy, accounts receivable policy and accounts payable policy. Excess operating cash flow would result from the effective working capital management and the shorter cash conversion cycle period.
30
Base on the prior studies and discussion, hypothesis 2 is proposed as follows: H2: Operating cash flow is negatively related to CCC.
3.7.3 Company Size Company size has effects on liquidity and working capital management since large company has more bargaining power over its suppliers and customers than smaller company. For example, large company could negotiate with its supplier for quantity discount and longer payment term. Company size is calculated from the natural logarithm of sales (Deloof, 2003) and the natural logarithm of total assets as used in the previous studies (García-Teruel & Martínez-Solano, 2007; Jeng-Ren, et al., 2006). According to Jose, et al., (1996), company size effects cash conversion cycle as larger companies tend to have lower cash conversion cycles. By using log of sales as a measure of company size, they conduct regression analysis and the result shows negative relation between cash conversion cycle and company size in five out of seven industries. Similarly, Moss and Stine (1993) provide the evidence that the small firms have longer cash conversion period than large firms as results from longer inventories period and longer accounts receivable period. However, they also find out that small firms have slightly longer accounts payable period than large firms. Jeng-Ren, et al. (2006) find the significant positive relationship between company size and working capital management measured by net liquid balance which is interpreted that large companies are able to produce more working capital in their operations than small companies. With the advantage from its bargain power, large company tends to perform better in managing their working capital and have the shorter cash conversion cycle. Hypothesis 3 is formulated as follows:
H3: Company size is negatively related to CCC.
3.7.4 Sale growth Sale growth is calculated from current year’s sale minus previous year’s sales and divided by previous year’s sales (Deloof, 2003). Company with high growth rate tend to pay more attention to manage their working capital by lengthen their payment term and speed up their collection from customers which lead to efficient working capital management (Jeng-Ren, et al., 2006).

31
Kim, et al. (1998) also finds the significant positive relationship between liquidity and growth rate as a measure of future economic conditions in their study on the US industrial companies over the period from 1975 to 1994. The researchers point out that companies having potential future investment opportunities tend to produce and maintain their level of liquidity. Opler, et al. (1999) provides the evidence that cash holdings, the ratio of cash to non-cash assets, are relatively high in companies with strong growth opportunities and risky cash flow. On the contrary, Jeng-Ren, et al., (2006) examined the impact of growth opportunities over working capital using company age as a proxy with the assumption that company has high growth rate at the early stage. Their study suggest the significant positive relationship between company age and working capital measured by net liquid balance which indicate that well-established companies with moderate growth tend to create more working capital. As the company with high growth rate is expected to produce more working capital and have better working capital management, hypothesis 4 can be stated as follows: H4: Sale growth is negatively related to CCC.
3.7.5 Current ratio and quick ratio Current ratio and quick ratio are common financial ratios. Current ratio is the ratio of current assets to current liabilities. Quick ratio is similar to current ratio, except inventory is excluded from the amount of total current assets. These two ratios are used as solvency measures to determine whether the company has enough current assets to cover its current liabilities. They show the company’s working capital position at the period of time, for instance the date as of balance sheet date. However, these two measures have been argued that they present only the coverage level of current assets over current liabilities and they do not reflect a company’s going concern (Maness & Zietlow, 2005, p. 25-28). High value of current ratio and quick ratio indicate that the company is solvent which should lead to the better liquidity, shorter cash conversion cycle and efficient working capital management. However, it may not be the case. The study conducted by Moss and Stine (1993) reports that cash conversion period has the significant positive relationship with the current and quick ratio. The company with longer cash conversion period needs to reserve more cash and short term investment for their operation which create higher current and quick ratio (Moss & Stine, 1993). Base on the prior study, hypotheses are proposed as follows:

32
H5a: Current ratio is positively related to CCC. H5b: Quick ratio is positively related to CCC.
3.7.6 Debt ratio Debt ratio shows the proportion of company’s total liabilities to its total assets. High debt ratio can interpret that the company has low internal funds and have to find external funds to finance its operations and this company tend to have less capacity to raise money through its working capital (Jeng-Ren, et al., 2006). The company with high debt ratio tends to need more cash flow from operation in order to repay its debt or renew it (Nwaeze et al., 2006). The study of Jeng-Ren, et al., (2006) demonstrates the significant negative relation between debt ratio and working capital management measured by net liquid balance which is interpreted that when companies have low working capital, they will finance their operations with external funds which make companies’ debt ratio higher. Hypothesis 6 is formulated as follows: H6: Debt ratio is positively related to CCC.
3.7.7 Industry effect Industry category is one of factors used to generalize across all companies. As companies in different industries have different natures of operation, variation in accounting and finance structure tend to be found across industries (Charlton, et al., 2002). By classify companies according to their industry, results would show industry-related differences on their working capital management and also its factors. According to Jose, et al. (1996), the variation in the cash conversion cycle measure cause by industry influence since companies have different products and markets. Their study is conducted by controlling industry influences and categorized companies into seven categories: natural resources, construction, manufacturing, services, retail/wholesale, financial services and professional services. The results show the lowest average cash conversion cycle in the service industry and the highest average cash conversion cycle in the construction industry. The study of Hyun-Han and Soenen (1998) investigate industry effect on working capital management by running regression analysis on eight industries. They find that agricultural production has the smallest number of days accounts receivable while the communication industry and the oil and gas extraction industry has the shortest average net trade cycle because of low inventory levels.

33
Results from the study on Japan and Taiwan companies (Yung-Jang, 2002) show the lowest average cash conversion cycle in food industry and the highest average cash conversion cycle in service industry on Japanese companies while the transportation industry has the lowest average of cash conversion cycle and the construction industry has the highest cash conversion cycle in the case of Taiwanese companies. García-Teruel and Martínez-Solano (2007) conducted the study on SMEs in Spain by classify companies into eight industries: agriculture, mining, manufacturing, construction, retail trade, wholesale trade, transport & public services and services. The results show that manufacturing and agriculture are the two highest average cash conversion cycles which are 96 days and 95 days respectively, transport & public services has negative cash conversion cycle and services industry has the shortest cash conversion cycle. Charlton, et al. (2002) provides the evidence of industry effects in their study of the relationship between internal funds and investment as the results are vary across industry. They found the high sensitivity of investment to cash flow in three industries out of seven industries in their study: natural resources, construction and retail/wholesale industries. Lancaster and Stevens (1999) use the Standard Industrial Classification (SIC) codes to divided companies into seven industries in order to examine industry effects on the relationship between measures of cash flow, accrual income and liquidity. The result provides the evidence that industry effects exist in the relationship which should be aware of when conducting analysis in this area. Referring to the above empirical studies, we expect that the company in different industry differs on the management of working capital. In the empirical study, we include industry effect to examine whether it has an impact on the company’s working capital management.
34
4. Practical Research Method
In this chapter, we present our data collection method, study approach, data analysis as well as credibility criteria through this study.
4.1 Data collection method
4.1.1 Sample selection Companies on the NASDAQ OMX Nordic Exchange are divided into three segments: Large Cap, Mid Cap and Small Cap. Companies with a market value over EUR one billion are classified into Large Cap segment. Mid Cap segment is a group for companies with a market value between EUR 150 million and 1 billion. Companies with a market value below EUR 150 million are presented within Small Cap segment (www.nasdaqomx.com). Even though the study intends to provide evidence on Swedish listed companies, we have to limit the scope of the sample selection owing to time limit for conducting the study. Accordingly, the sample in this study is based on Swedish companies in the large cap segment listed on NASDAQ OMX Stockholm Exchange which represent the group of biggest companies with highest market value in the stock market. As the study aims to provide the empirical evidence which would reflect the current financial situation, we have chosen our sample from the most recent information and financial data which is available at the time we conducted our study. According to the Nordic list as of February 1st, 2010, the large cap segment comprises 54 companies out of the total of 252 companies in the stock exchange market. Companies in financial sector are excluded with a concern that the cash conversion cycle, which is employed in this study, is not suitable to measure and present working capital management of companies in this nature of business such as bank and investment companies. Also, they are expected to have different working capital management strategies from other business sectors. Therefore, we obtained 40 companies as a sample in our study which is shown in appendix 1. For each company, we take financial data from company’s annual reports for the year 2007 and 2008 which give us a total of 80 observations. We have selected these two fiscal years since they are the most recent published annual reports. In addition, conducting the study on two-year period would allow us to compare changes over time and it would make the results more reliable than using one-year financial data.
4.1.2 Data collection Companies’ annual reports of the year 2007 and 2008 were downloaded from the companies’ websites. Financial data have been hand – collected from the companies’
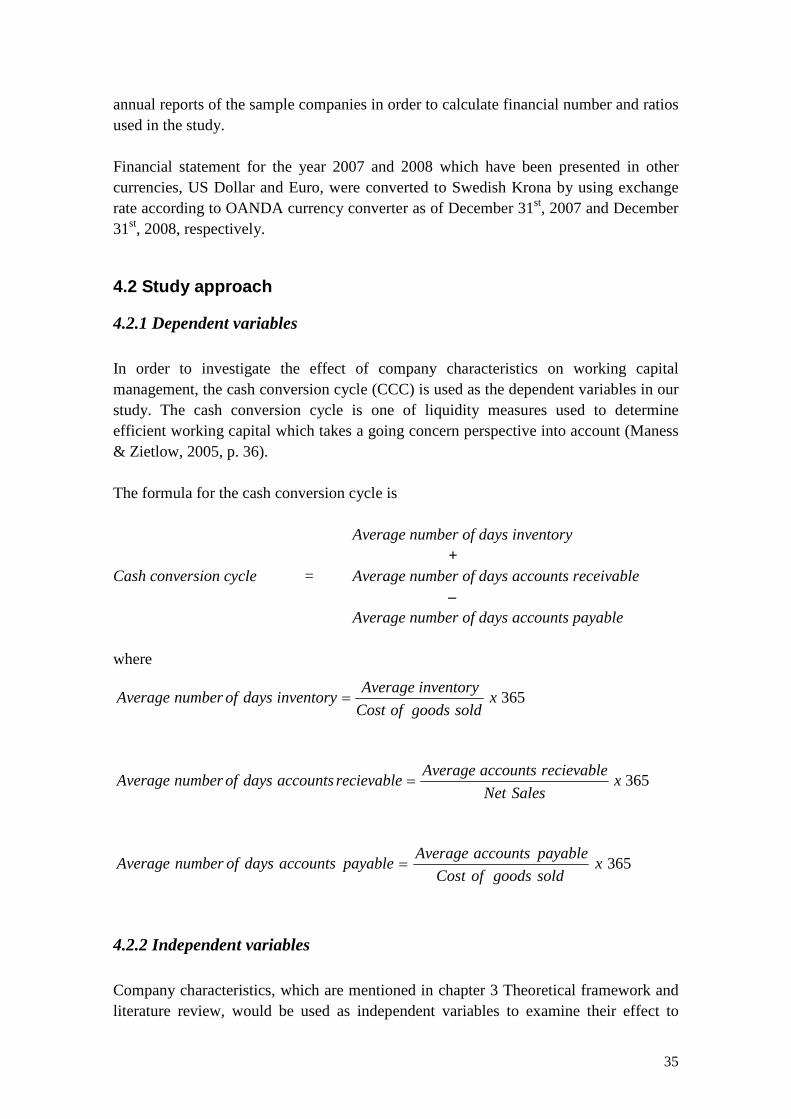
35
annual reports of the sample companies in order to calculate financial number and ratios used in the study. Financial statement for the year 2007 and 2008 which have been presented in other currencies, US Dollar and Euro, were converted to Swedish Krona by using exchange rate according to OANDA currency converter as of December 31st, 2007 and December 31st, 2008, respectively.
4.2 Study approach
4.2.1 Dependent variables In order to investigate the effect of company characteristics on working capital management, the cash conversion cycle (CCC) is used as the dependent variables in our study. The cash conversion cycle is one of liquidity measures used to determine efficient working capital which takes a going concern perspective into account (Maness & Zietlow, 2005, p. 36). The formula for the cash conversion cycle is
Average number of days inventory +
Cash conversion cycle = Average number of days accounts receivable –
Average number of days accounts payable where
365xsoldgoodsofCost
inventoryAverageinventorydaysofnumberAverage =
365xSalesNet
recievableaccountsAveragerecievableaccountsdaysofnumberAverage =
365xsoldgoodsofCost
payableaccountsAveragepayableaccountsdaysofnumberAverage =
4.2.2 Independent variables Company characteristics, which are mentioned in chapter 3 Theoretical framework and literature review, would be used as independent variables to examine their effect to

36
working capital management. In addition, two dummy variables have been included to capture industry effect and time effect. Definitions and formulas of each variable are given as follows:
Profitability
Profitability is measured by the return on assets (ROA) which is the ratio of earnings before tax and interest (EBIT) to total assets. The return on assets determines the management efficiency to use assets generates earnings. ROA is presented as a percentage. The formula for the return on assets is:
assetsTotal
EBITterestinandtaxbeforeEarningsROA
)(=
Operating cash flow
We extract the figure of cash flows from operating activities from companies’ cash flow statement. The figure is deflated by total assets for comparison. The formula for the operating cash flow is:
assetsTotal
activitiesoperatingfromflowCashflowcashOperating =
Company size
Total assets are used to measure company size. A natural logarithm of total assets is used as a proxy of company size.
Sale growth
Companies’ growth is measured by the change in sale growth over the year. The formula for the sale growth is
salessyearprevious
salessyearprevioussalessyearCurrentgrowthSales
'
)''( −=
Current ratio and quick ratio
Current ratio and quick ratio have been considered as solvency measure of working capital at the given period of time which presents the proportion of current assets to

37
current liabilities. The formula for the current ratio and quick ratio are
sliabilitieCurrent
assetsCurrentratioCurrent =
sliabilitieCurrent
sInventorieassetsCurrentratioQuick
)( −=
Debt ratio
Debt ratio presents the proportion of total liabilities to total assets. The formula is
assetsTotal
sliabilitieTotalratioDebt =
Industry effect
In order to capture industry effect, industry classifications have been included as dummy variable. We follow industry classification according to NASDAQ OMX Stockholm Exchange which has a total of ten sectors. Since we omit financials sectors and there is no Swedish company classified in utilities sector, our sample consists of companies in eight sectors as follows: 2 companies in energy, 5 companies in materials, 16 companies in industrials, 5 companies in consumer discretionary, 4 companies in consumer staples, 4 companies in health care, 1 company in information technology and 3 companies in telecommunication services.
Time effect
Time effect has been included as dummy variable in order to capture the differences between two-fiscal year financial data in our study.
4.2.3 Data analysis The quantitative data analyses has been adopted by using SPSS statistic program in order to examine the relationship between company characteristics and the cash conversion cycle as a measure of working capital management. The statistics included in our study are as follows;

38
Descriptive statistics
Continuous variables allow us to analyze quantitative data by using descriptive statistics. Descriptive statistics show characteristics of sample which include mean value, minimum, maximum and standard deviation.
Correlation analysis
Correlation is used to measure the direction of the linear relationship between two variables as well as to measure the strength of association between variables (Tabachnick & Fidell, 2007, p. 56-57). In our study, the Pearson’s Correlation Coefficient is calculated to see the relationship between all variables. As for the direction of the relationship, the positive correlation indicates that when one variable increase another also increases while the negative correlation show inverse relationship (Pallant, 2007, p. 101).
Regression analysis
There are two types of hypothesis in quantitative research: null hypothesis and alternative hypothesis. Hypotheses, which are proposed earlier in chapter 3 Theoretical framework and literature review, are alternative hypotheses where the expected relationship between factors and the cash conversion cycle have been stated while the null hypotheses are the opposite. We use the significant level at 0.05 to decide whether or not to reject or accept null hypothesis which give us 95% confidence level. If the p-value is less than or equal to the 0.05 significant level, null hypothesis will be rejected and we will conclude the alternative hypothesis is true. If the p-value is greater than the 0.05 significant level, we fail to reject the null hypothesis and conclude that the null hypothesis is plausible. In order to investigate the relationship between company characteristics and the cash conversion cycle, standard multiple regression is used to test hypotheses. The regression model is formulated to examine the relationship between factors and working capital management represented by the cash conversion cycle (CCC). Number of days inventory, number of days accounts receivable and number of days accounts payable have been substituted for the cash conversion cycle in the model to investigate the relation of the components of the cash conversion cycle and factors. The following model is estimated:
CCC = β 0 + β1PROFIT + β2CF + β3SIZE + β4GROWTH + β5CR + β6QR + β7DEBT

39
Where
CCC = Cash conversion cycle INV = Average number of days inventory AR = Average number of days accounts receivable AP = Average number of days accounts payable PROFIT = Profitability CF = Operating cash flow SIZE = Company size GROWTH = Sale growth CR = Current ratio QR = Quick ratio DEBT = Debt ratio IND_1 = 1 if company is in Energy sector and zero
otherwise IND_2 = 1 if company is in Materials sector and zero
otherwise IND_3 = 1 if company is in Industrials sector and zero
otherwise IND_4 = 1 if company is in Consumer Discretionary
sector and zero otherwise IND_5 = 1 if company is in Consumer Staples sector
and zero otherwise IND_6 = 1 if company is in Health Care sector and
zero otherwise IND_7 = 1 if company is in Information Technology
sector and zero otherwise IND_8 = 1 if company is in Telecommunication
Services sector and zero otherwise YEAR = 1 for Financial data as of year 2008 and 0 for
Financial data as of year 2007
4.3 Credibility criteria
4.3.1 Reliability The reliability criterion evaluates how careful a study has been conducted regarding the selection of data and choices made of which methods to use when measuring the data. A high level of reliability is achieved when repeatedly measurements of the same data, using the same methods to measure, gives the same or almost the same results. A high reliability indicate that the choices and selections made are appropriate for the study in terms of fulfilling the purpose of the study (Jacobsen, 2007, p. 13) The data for this study have been collected from companies’ annual reports from the year 2007 and 2008. Our data consist of figures taken from the financial statements. As

40
listed companies in Sweden, companies have been required to prepare their financial statement follow International Financial Reporting Standards (IFRS) which strengthen the reliability aspect of the contents in these annual reports and so the reliability of our data. Our choice of data has a high reliability since the figures in the annual reports we have used are consistent and will never change over periods according to regulations. Possible occurrences that can have a negative effect on the reliability are for example typos of the data that could occur when collecting and retyping the data and this could lead to misleading results. We have both double-checked the figures in our data collection which increases the reliability for a reliable set of data. Another thing to consider is, that despite the fact that auditors have examined and approved these annual reports, it can not be excluded that some figures may be misleading to some extent as companies, in an attempt to look better for business, may have embellish their figures. This is something we cannot control or know for sure but we are aware of the possibility. What should be kept in mind, regarding the reliability of our result over other time periods, is that we in our study have used data from a period of time affected by a financial crisis which has influenced the results. This current financial crisis has affected most companies very negative and as financial crises differ in extent this result is reliable to some extent as the result most likely would differ if the study was to be replicated during another crisis. Apart from the financial crisis, another factor to consider in a replication ahead of this study that could affect the reliability over time and the result is the set of companies included in the study which most likely will differ, despite the same selection, as new companies come to and others disappear. Our choice of method is statistics which together with our data is a method with high reliability as there is no room for interpretations of the result that could be negative for the reliability.
4.3.2 Validity Bryman and Bell (2005, p. 597) refers to validity as “a measure of how well a specific measurement of a concept, really gives an accurate picture of the concept”. In this study we aim to examine the association between company characteristics and working capital management measured by cash conversion cycle. The data consist of figures collected from companies’ annual reports so there is no risk for misinterpretation of the numbers. The figures are converted into number of days according to the cash conversion cycle equation which is a well known concept which strengthen the validity that the components give an accurate picture of the concept.

41
4.3.3 Generalisability The level of generalizability determines how well a result can be applied to another and larger population or context (Bryman & Bell, 2008, p. 156). Because we have chosen to exclude banks and other financial institutions from our sample this study and its result should not be seen as representable for these industries but only to the industries included in our sample. As we do not have as big sample as would be desirable for a satisfying generalizability of our result, we believe our result should be generalized with some consideration. A larger sample could be an alterative to strengthen the generalizability. Another thing to consider is if the results are generalizable to other surroundings than the surrounding that the study was conducted in. This study includes Swedish listed companies which is a circumstance that has affected the result. If the same study would include Italian listed companies instead of Swedish companies the distribution of companies in each industry would look different as well as the result due to the different set-up of companies between countries. This aspect, together with the special circumstance that this study was conducted during a recession which countries reacted differently to, make it problematic to generalize these results to other countries which we do not recommend. A careful generalizability of our results could be made to companies in Sweden as they operate under the same circumstances as the companies in our sample.
4.3.4 Replication
The replication criterion has to do with how easy it is to carry out the same study over again (Bryman & Bell, 2005, p. 48). To make a replication of this study possible, we have tried to explain our approach of the study as thoroughly as possible. A replication of this study should be fairly easy as we have used data from annual reports that will not change over time, and applied statistics as method. If others in the future would use the exact same data, from the same periods and companies and perform the same tests with the same methods that we have used, the result should be the same or close to the same with consideration to typos.

42
5. Empirical Results
In this chapter, we present empirical results from quantitative data analysis using SPSS. We start by presenting results from descriptive statistics, correlation matrix and finally regression analyses.
5.1 Descriptive statistics The descriptive statistics that will be demonstrated consist of four tables presenting; the total sample, a comparison by year, the average numbers of industry and last the average number of company size. Table 1 Descriptive Statistics for all samples Minimum Maximum Mean Std. Deviation CCC -94.00 204.00 75.38 60.97 INV 0.00 192.00 79.33 46.30 AR 5.00 119.00 53.85 23.70 AP 5.00 205.00 57.90 35.16 PROFIT -22.96 44.05 11.88 8.88 CF -0.04 0.37 0.11 0.07 SIZE 8.49 12.83 10.56 1.09 GROWTH -0.21 5.58 0.21 0.63 CR 0.58 7.35 1.53 1.01 QR 0.40 6.87 1.08 0.92 DEBT 0.05 0.96 0.61 0.17
Table 1 shows the descriptive statistics for the entire sample of our 40 companies. The first four variables are measured in the unit of days. The cash conversion cycle as we use as our dependent variable has a mean of 75.38 days. This explains that it takes in average 75.38 days for the capital that is tied up in working capital to convert into cash. The minimum amount of days it takes for the capital in the cash conversion cycle to convert into cash is -94 days and the maximum amount of days is 204. The components of the cash conversion cycle are the following three variables; the number of days inventory, the number of days accounts receivable and the number of days of accounts payable. The table shows that the minimum number of days it takes to convert into cash is very few for all of these three components as it lies at 0 and 5 days. Studying the maximum number of days, these are not as compatible for the three variables as the minimum number of days. The number of days accounts payable has

43
the highest maximum with 205 days closely followed by the number of days inventory that has a maximum of 192 days. The number of days accounts receivable has the lowest maximum with 119 days. Observing the mean in the table, the number of days accounts receivable has a mean on 53.85 days and the number of days accounts payable has a mean on 57.90 days. That fact that these variables have values close to each other is noteworthy as their maximum number of days differs greatly between them as one of them has the lowest maximum and the other one the highest. The mean for the number of days inventory is 79.33 days. The profitability, given by earnings before tax and interest to total asset, is measured in the unit of percent and for our sample the maximum profitability land on 44.05%, a minimum of -22.96 % and a mean of 11.88%. Comparing the current ratio and the quick ratio, the values are very close to each other which suggest that the inventory does not have such negative impact on the current ratio. Both ratios have a minimum level under 1 where the current liabilities are greater than the current assets. In order to manage current liabilities with enough current assets the level of the ration should stay above 1 which both the mean and the maximum are for this sample. The mean stays on a level close to 1, while the maximum comes up around 7 which tell us that the current assets are seven times greater than the current liabilities. The dept ratio variable is given by total liability to total assets and for our samples the values in the table are all between 0 and 1 which means that the companies have more assets than liabilities. If the values would be above 1 it would mean that the total liabilities exceed the total assets and this is generally an undesirable state. Table 2 Descriptive Statistics, by year
2007 2008 N Minimum Maximum Mean Minimum Maximum Mean CCC 40 -84.00 198.00 72.15 -94.00 204.00 78.60 INV 40 1.00 183.00 75.75 0.00 192.00 82.90 AR 40 5.00 108.00 53.53 5.00 119.00 54.18 AP 40 5.00 198.00 57.18 6.00 205.00 58.63 PROFIT 40 2.47 44.05 13.20 -22.96 39.30 10.56 CF 40 -0.04 0.37 0.11 0.00 0.35 0.11 SIZE 40 8.49 12.68 10.48 8.76 12.83 10.64 GROWTH 40 -0.07 5.58 0.31 -0.21 0.68 0.10 CR 40 0.81 7.35 1.54 0.58 6.20 1.53 QR 40 0.40 6.87 1.10 0.43 5.70 1.06 DEBT 40 0.06 0.96 0.61 0.05 0.92 0.61
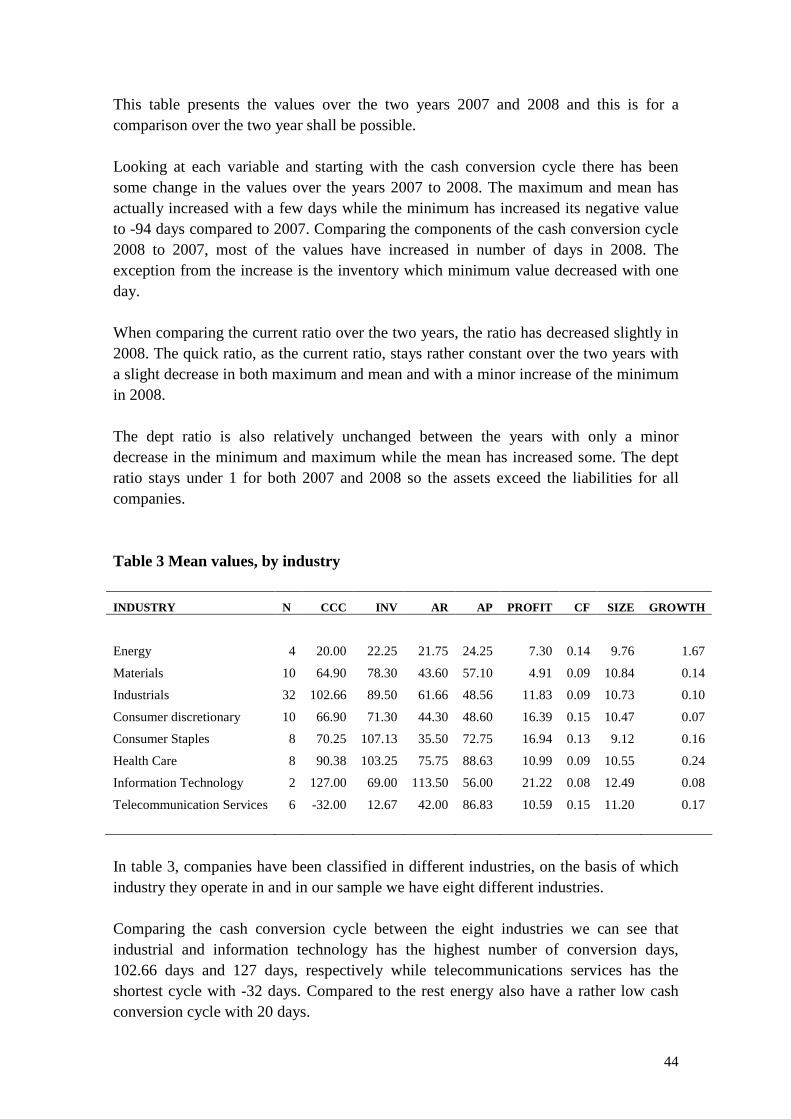
44
This table presents the values over the two years 2007 and 2008 and this is for a comparison over the two year shall be possible. Looking at each variable and starting with the cash conversion cycle there has been some change in the values over the years 2007 to 2008. The maximum and mean has actually increased with a few days while the minimum has increased its negative value to -94 days compared to 2007. Comparing the components of the cash conversion cycle 2008 to 2007, most of the values have increased in number of days in 2008. The exception from the increase is the inventory which minimum value decreased with one day. When comparing the current ratio over the two years, the ratio has decreased slightly in 2008. The quick ratio, as the current ratio, stays rather constant over the two years with a slight decrease in both maximum and mean and with a minor increase of the minimum in 2008. The dept ratio is also relatively unchanged between the years with only a minor decrease in the minimum and maximum while the mean has increased some. The dept ratio stays under 1 for both 2007 and 2008 so the assets exceed the liabilities for all companies. Table 3 Mean values, by industry
INDUSTRY N CCC INV AR AP PROFIT CF SIZE GROWTH
Energy 4 20.00 22.25 21.75 24.25 7.30 0.14 9.76 1.67
Materials 10 64.90 78.30 43.60 57.10 4.91 0.09 10.84 0.14
Industrials 32 102.66 89.50 61.66 48.56 11.83 0.09 10.73 0.10
Consumer discretionary 10 66.90 71.30 44.30 48.60 16.39 0.15 10.47 0.07
Consumer Staples 8 70.25 107.13 35.50 72.75 16.94 0.13 9.12 0.16
Health Care 8 90.38 103.25 75.75 88.63 10.99 0.09 10.55 0.24
Information Technology 2 127.00 69.00 113.50 56.00 21.22 0.08 12.49 0.08
Telecommunication Services 6 -32.00 12.67 42.00 86.83 10.59 0.15 11.20 0.17
In table 3, companies have been classified in different industries, on the basis of which industry they operate in and in our sample we have eight different industries. Comparing the cash conversion cycle between the eight industries we can see that industrial and information technology has the highest number of conversion days, 102.66 days and 127 days, respectively while telecommunications services has the shortest cycle with -32 days. Compared to the rest energy also have a rather low cash conversion cycle with 20 days.

45
Continuing with number of days inventory, the number shows that health care have a high number here as well, along with consumer staples that has the highest number of days with 107.13. Telecommunication services has the lowest value of 12.67 days of inventory followed by energy that also has a rather low number of days inventory with 22.25 days. The energy industry has the lowest number of days accounts receivable and payable. The highest number of days accounts receivable is held by the information technology. The health care and telecommunication services have the most number of days accounts payable. Generally, the energy industry keeps, in difference to the other industries, a low number of days in their components of the cash conversion cycle. Further, the energy industry has again a very low value of profitability but not the lowest percentage as that is the materials industry, which holds the lowest percentage of 4.9110. The information technology has the highest percentage of profitability at 21.22% and yet it held the lowest operating cash flow of 0.08. The consumer discretionary has the highest value of operating cash flow of 0.15. Finally, the highest sale growth is held by the energy industry and here it is the consumer discretionary that has the lowest growth of all industries. Table 4 Mean values, by company size GROUP ASSETS CCC INV AR AP PROFIT CF GROWTH
1 8,948.31 86.50 98.69 46.94 59.19 16.48 0.13 0.49
2 25,763.42 65.31 73.06 47.88 56.00 9.08 0.11 0.26
3 34,938.56 94.75 79.38 57.94 42.56 6.57 0.07 0.05
4 60,337.53 65.44 69.88 52.44 56.75 14.91 0.14 0.11
5 220,740.36 64.88 75.63 64.06 75.00 12.36 0.09 0.11
To show which influence company size has over the relationship between the cash conversion cycle and its factors, total assets has been used as a measure of company size. Our 80 samples are sorted in ascending order and then divided into five groups and each group consists of 16 samples. Table 4 demonstrates the mean values of the variables. Studying the assets of the groups it is obvious that group 5 has significantly much more assets than the rest of the groups. The difference between the assets is significantly greater between group 4 and 5, while the difference is both less and more evenly between the other four groups. Continuing with the cash conversion cycle, group 1 and 3 has the highest average number of days while the rest of the groups have values close to each other around 65 days.

46
Group 1 has the highest number of days inventory and similar with the cash conversion cycle the other groups have similar values. Comparing account receivables and account payables over the years, the latter one has more number of days in all groups except in group 3 where numbers of days accounts receivable exceed the number of days accounts payable. The group with the highest number of days are in both cases group 5, the rest of the groups have, here as well, values that are at an even level with each other. Looking at the profitability and operating cash flow, group 1 and 4 has the highest values of the both values. The group with the lowest profitability and operating cash flow values are group number 3. Concerning the sales growth, group 1 has the highest value at 0.49 and group 3 has the lowest sales growth at 0. 05.
5.2 Correlation Matrix
The Pearson’s Correlation Coefficient indices for the variables defined in the chapter 4 as shown in appendix 2
The correlation matrix indicates that the cash conversion cycle (CCC) has a significant negative correlation with operating cash flow (CF) while it shows a significant positive correlation between the cash conversion cycle and debt ratio (DEBT) at the 0.05 significant level (p<0.05). However, the value of Pearson correlation ( r ) which is used to determine the strength of the relationship suggest weak relationships between the cash conversion cycle and these two variables, operating cash flow and debt ratio, with the value of r at -0.261 and 0.271, respectively. Regarding to the coefficient of the determination, the cash conversion cycle and operating cash flow with the correlation r = -0.261 share 6.81 % of their variances and the cash conversion cycle and debt ratio that correlated r = 0.271 share 7.34% of their variances. Concerning components of the cash conversion cycle, significant correlations with related factors are found only in number of days inventory and number of days accounts receivable, whereas number of day accounts payable does not report any significant correlation with all factors. The correlation result demonstrate that number of days inventory (INV) is significantly positive correlated with profitability (r = 0.369, p<0.01) and debt ratio (r = 0.259, p<0.05). Number of days accounts receivable (AR) has a significant positive correlation with company size (r = 0.291, p<0.01) while it is significantly negative correlated with operating cash flow (r = -0.443, p<0.01) and sale growth (r = -0.259, p<0.05). The correlation results between all independent variables suggest operating cash flow and current ratio variables are significantly positive correlated with profitability at r = 0.678 (p<0.01) and r = 0.225 ( p<0.05), respectively. Current ratio and quick ratio are

47
also significant negative correlated with debt ratio at r = -0.514 (p<0.01) and r = -0.586 (p<0.01), respectively. However, the high correlation between current ratio and quick ratio at r = 0.952 (p<0.05) suggest the multicollinearity problem which would be discussed later.
The Pearson’s Correlation Coefficient of year 2007 (upper half) and 2008 (bottom half) as shown in appendix 3
The correlation matrix does not report any significant correlation between the cash conversion cycle and all variables for both year 2007 and 2008. Nevertheless, we find significant correlation between the components of the cash conversion cycle and its factors as follows: For year 2007, the correlation indices report a significant positive correlation between number of days inventory and profitability, r = 0.399 at the 0.05 significant level. Both operating cash flow and sale growth have significant negative correlation with number of days accounts receivable at r = -0.398 (p<0.05) and r = -0.361 (p<0.05), respectively. Similarly, number of day inventory is significantly positive correlated with profitability, r = 0.378, p<0.05 for year 2008. However, the correlation matrix shows only the significant negative correlation between number of days accounts receivable and operating cash flow for year 2008 (r = -0.487, p<0.01). The correlation matrix for both year 2007 and 2008 report the significant positive correlation between profitability and operating cash flow as well as the significant negative correlation between liquidity ratio, current ratio and quick ratio, and debt ratio. However, the significant positive correlation between profitability and sale growth is found only in year 2008.
The Pearson’s Correlation Coefficient by industry as in appendix 4
We find that the correlations between the cash conversion cycle and profitability are significantly positive for materials and industrials industry. As for the health care and information technology industry, significant negative correlations between the cash conversion cycle and profitability are reported. The correlations between the cash conversion cycle and debt ratio are significantly negative for industrial and telecommunication services; on the contrary, significant positive correlations are reported for materials and information technology. There is a significant positive correlation between the cash conversion cycle and sale growth for information technology industry but a significant negative correlation is found in telecommunication services.

48
Significant negative correlations are found between the cash conversion cycle and operating cash flow in health care industry and between the cash conversion cycle and company size in industrials industry. Furthermore, information technology reports significant negative correlation between liquidity ratio, both current ratio and quick ratio, and the cash conversion cycle.
5.3 Regression results In order to explore the determinants of working capital management, we examine the relationship between the cash conversion cycle as a measure of working capital and company characteristics: profitability, operating cash flow, company size, sale growth, current ratio and debt ratio. Regression results present in appendix 5. We start by checking the assumption. To avoid the possibility of multicollinearity, it is important that the results from collinearity diagnostics should have tolerance value above 0.10 and variance inflation factor (VIF), which is the inverse of the tolerance value, less than 10 as the small value of tolerance indicate the high multiple correlation with other variables (Pallant, 2007, p.156). The regression result (1), which reports the relationship between the cash conversion cycle and all variables, has the tolerance value of 0.073 for current ratio and 0.070 for quick ratio with VIF value of 13.728 and 14.186, respectively, which indicates the problem with multicollinearity. Therefore, we decide to remove quick ratio, one of the highly intercorrelated independent variables from the model. The second model is formulated, excluding the quick ratio. This formula give all tolerance value above 0.10 and VIF value less than 10 for all variables as shown under the regression model (2) in appendix 5. To evaluate our model, the value of R2 has been considered to determine the amount of variance in the dependent variables which is explained by all variables in the formula (Pallant, 2007, p.158). As for our model, the R2 value of 0.427 means the second formula explains 42.7% of the variance in the cash conversion cycle. In the case of a small sample, the adjusted R2 value should be considered as it provides more accurate estimation of the true population value (Pallant, 2007, p.158). There is a rule of thumb which can be used to determine the adjust R2 value as follows: < 0.1: poor fit, 0.11 – 0.3: modest fit, 0.31-0.5: moderate fit, >0.5: strong fit (Muijs, 2004, p. 166). In our case, the adjusted R2 value of 0.380 indicates that our formula is moderately good at predicting the cash conversion cycle.

49
The regression model (2) reports the F value of 9.068 and the Sig. of 0.000 which mean the model reach statistical significance (p<0.0005). Then, we evaluate each independent variable. As the B coefficients have different scales, the absolute value of Beta parameter under Standardized Coefficients is used in order to compare and determine the influence of independent variables on the dependent variable (Muijs, 2004, p. 167). The Sig. value is used to measure the statistic significant unique contribution of each independent variable to the formula (Pallant, 2007, p.159). In the regression model (2), we find the largest beta coefficient is -0.704 for operating cash flow which show that operating cash flow makes the strongest contribution to predict the dependent variable, the cash conversion cycle. The statistically significant are found in profitability and operating cash flow at the 0.01 significant level, and found in company size and sale growth at the 0.05 significant level. It suggests that these four variables make significant contributions to predict the dependent variable, cash conversion cycle, in the model. Table 5 Summary of testing of hypotheses
Hypothesis Variables Beta p-value
Result
H1: Profitability is negatively related to CCC.
PROFIT 0.638 0.000** Rejected
H2: Operating cash flow is negatively related to CCC.
CF -0.704 0.000** Confirmed
H3: Company size is negatively related to CCC.
SIZE -0.204 0.031* Confirmed
H4: Sale growth is negatively related to CCC.
GROWTH -0.180 0.050* Confirmed
H5a: Current ratio is positively related to CCC.
CR 0.106 0.352 Rejected
H6: Debt ratio is positively related to CCC.
DEBT 0.181 0.114 Rejected
N 80 Adjust R2 0.380 F statistic 9.068 Significance 0.000 ** Significant at the 0.01 level
* Significant at the 0.05 level
50
The results from regression model (2) are used to determined hypotheses stated in chapter 3 as show in table 5. The beta coefficient for H1 reports the positive value of 0.638 where the negative sign was expected. The p-value less than or equal to the 0.05 significant level are reported in three hypotheses, H2, H3 and H4, where null hypotheses are rejected and we can conclude that these three alternative hypotheses are true. These statistic results confirm the relationship between three company characteristics, operating cash flow, company size and sale growth, and the cash conversion cycle as a measure of working capital management. Appendix 6 shows the regression results between components of the cash conversion cycle and six variables. The regression results for number of days inventory and number of days accounts receivable are significant with F-value of 8.506 and 6.872, respectively, and adjust R2 of 0.363 and 0.308, respectively. Regression model (3) suggest all variables, except current ratio, make statistically significant contribution to the model while regression model (4) report significant results with only two variables, operating cash flow and sale growth. To examine the differences between year 2007 and 2008, year dummy variable has been included in the regression model as shown in appendix 7. The significant regression results are reported with the cash conversion cycle, number of days inventory and number of days accounts receivable at F-value of 8.022, 7.756 and 5.826, respectively, and adjusted R2 of 0.384, 0.374 and 0.300, respectively. Compare these adjust R2 to ones in appendix 5 and 6, we find that adding year variable has increased the explained variance only for the cash conversion cycle and number of days inventory. The beta values for year dummy variable are positive for the cash conversion cycle and number of days inventory which mean number of days in year 2008 is predicted to be slightly higher than those in year 2007. While the negative beta of number of days accounts receivable and number of days accounts payable indicate that number of days in year 2008 is predicted to be slightly lower than those in year 2007. However, none of these beta values is statistically significant which point out that year variable does not seem to be a significant factor. Appendix 8 present the regression results, included the industry dummy variables, in order to compare the difference between industry. Companies in Telecommunication services sector (IND_8) have been used as a reference variable. The higher adjusted R2 in all models indicate that dependent variables have been explained better in these models. The regression models report the significant positive relation with the cash conversion cycle in materials sector (IND_2), industrials sector (IND_3), health care sector (IND_6) and information Technology sector (IND_7). There are significant positive relations between materials sector (IND_2), industrials sector (IND_3) and health care sector (IND_6), and number of days inventory. Also, there is a significant positive

51
relation between health care sector (IND_6) and information Technology sector (IND_7), and number of days accounts receivable.

52
6. Analysis of the Empirical Data
In this chapter, we analyze the empirical data, interpret and discuss the empirical results presented in the chapter 5. We compare our empirical finding with the theory and evidence from previous empirical studies. We investigate the determinants of working capital management which is measured by the cash conversion cycle. The company characteristics, as independent variables, included in our study are as follows: profitability, operating cash flow, company size, sale growth, liquidity ratio and debt ratio. We also include year and industry effect as dummy variable to examine the different between each group.
6.1 Cash conversion cycle The average cash conversion period for Swedish companies is 75.38 days. The average inventory period, from inventory purchased to inventory sold, is 79.33 days. The companies receive cash collection from their customer on average at 53.85 days and the companies have accounts payable period on average at 57.90 days. The average cash conversion period of Swedish companies are quite low compared to previous studies. The shorter period are found in Belgian companies with 44.48 days and 72.966 days in Pakistani companies (Deloof, 2003; Raheman & Nasr, 2007). The longer cash conversion period are reported at 164 days in US companies, 87 days in Japanese companies, 219 days Taiwanese companies, 180 days in Saudi Arabia, 153 days Turkish companies and 189 days for companies in Athens stock market (Jose, et al., 1996; Yung-Jang, 2002; Eljelly, 2004; Samiloglu & Demirgunes, 2008; Lazaridis & Tryfonidis, 2006). We find that the regression models did not report the significant relation with the year dummy variable. However, comparison with average cash conversion cycle in year 2007, we find that year 2008 reports the longer period of 78.60 days with the increasing number of days in all three components.
6.2 Company characteristics The following analysis part is presented based on the company characteristics shown in chapter 3 Theoretical framework and literature review.
53
6.2.1 Profitability Our empirical result suggests there is a significant positive relation between the cash conversion cycle and profitability which is opposed to results found in the prior studies (Deloof, 2003; Hyun-Han & Soenen, 1998; Lazaridis & Tryfonidis, 2006; Jose, et al., 1996; Eljelly, 2004). But it is consistent with the study of Jeng-Ren, et al. (2006). Considering the component of the cash conversion cycle, the regression result point out a significant positive relation between number of days inventory and profitability which is opposed to the previous studies (Deloof, 2003; Raheman & Nasr, 2007; Samiloglu & Demirgunes, 2008; Lazaridis & Tryfonidis, 2006). The positive result with the cash conversion cycle points out that an increase in profitability is associated with a rise in the cash conversion cycle. It shows that the profitable companies tend to have the longer cash conversion cycle which indicates to inefficient working capital management. The result contrasts with our expectation. This might be affected by either inventory period, accounts receivable period or accounts payable period. For instance, the companies offer long credit period to customers to raise their sales which lead to high profitability; on the contrary it have a negative effect to the companies’ working capital as account receivable period is longer which result in the longer cash conversion period. With regard to inventory period, we might assume that profitable companies with high sale volume tend to maintain high inventory balance to supply their customers promptly. Then, they need raw material and work in process for their production as well as finished goods for sales to customer. However, the high inventory leads to the long inventory period. As for accounts payable period, in their purchasing process, the companies may receive a deal such as lower unit cost from the suppliers who offer the shorter payment term. The companies may take the deal if it is considered as providing the higher benefit with the lower unit costs which reduces cost of sales and lead to higher profit; while the shorter payable period will also make the cash conversion cycle longer. On the contrary, low profit companies tend to have more effective working capital management with the shorter cash conversion cycle. This might explain as their situations force them to be very careful with their liquidity. Then, inventories and accounts receivable are well-managed. As for long accounts payable period, it might be because they delay their payments to suppliers as Deloof (2003) points out.
6.2.2 Operating cash flow We find a significant negative relation between the cash conversion cycle and operating cash flow which is consistent with the study conducted by Moss & Stein (1993).

54
Similarly, our result supports the evidence from the study of Jeng-Ren, et al., (2006) which points out that the companies with high operating cash flow have more efficient working capital management. In addition, the regression results suggest that number of days inventory and number of days accounts receivable have significant negative relation with operating cash flow. These results indicate that the higher operating cash flow is significantly associated with the shorter cash conversion period, number of days inventory and number of days accounts receivable. Operating cash flow is one of liquidity measurement to show how much money the companies generate from their operation while the cash conversion cycle determine how well the company can convert to cash (Maness & Zietlow, 2005, p.35). Our findings present the relation of these two measurements. The companies with high operating cash flow have efficient working capital management which affect to their low level of cash conversion cycle as a measure of working capital.
6.2.3 Company Size The empirical result shows a significant negative relation between the cash conversion cycle and company size which can be explained that an increase in company size have an impact to shorter cash conversion period and better working capital management. Our results is consistent with the findings from previous studies conducted by Jose, et al., (1996) who provides the evidence of the negative relation between the cash conversion cycle and company size and Moss and Stine (1993) who find the longer cash conversion period in the smaller companies. Also, the study of Jeng-Ren, et al., (2006) which point out that the large companies can generate more working capital. As large companies, they get benefit from economies of scale and they are in the better bargaining position than those small companies. As for the components of the cash conversion cycle, the regression result reports that the number of days inventory have a significant negative relation with company size which indicate that the larger companies have shorter length period from the inventory purchased to inventory sold. The large companies might focus on their manufacturing operating management such as Just-in-time and made-to-order and achieve the desire results in their inventory management which helps the companies reduce the days inventory held. Furthermore, our result points out that number of days accounts payable have a significant positive relation with company size. This is indicated that the large companies have a longer period between the good receipt date and supplier payment date than the small companies. This might be the results from the bargaining power that large companies have over their suppliers to lengthen the payment term. On the other hand, the small companies are not in that strong bargaining power to negotiate the payment term with their suppliers which affect to their shorter number of days accounts

55
payable. In addition, this can be viewed that large companies find the higher benefit from payment term than taking an offer for cash discount and they consider payable from suppliers as interest free financing, whereas, small companies prefer to take cash discount and have short number of days accounts payable.
6.2.4 Sale growth Result from regression model suggests a significant negative relation between the cash conversion cycle and sale growth which demonstrates that a rise in sale growth have an impact to reduce the cash conversion cycle, and result in the better working capital management. The result is consistent with the prior study of Kim, et al. (1998); on the contrary, our finding is opposed to the prior research of Jeng-Ren, et al. (2006). This indicates that companies with high growth rate are more concerned to manage their working capital since the companies might need more funds to finance their operation expansion and it results in their low cash conversion cycle. The well-managed working capital provides the company internal fund which is cheaper than external fund in term of financing cost such as interest expense and administration fee. We also find that both number of days inventory and number of days accounts receivable have significant negative relation with sale growth. This indicate that companies with growth opportunities tend to have efficient inventory and accounts receivable policy which make their inventory period and accounts receivable period shorter than those with lower sale growth rate.
6.2.5 Current ratio and quick ratio Even though these two ratios are also the measurement for working capital, we cannot find any statistically significant relation between the cash conversion cycle and current ratio in our regression analysis. However, our regression result reports the positive relation between the cash conversion cycle and the current ratio, but it is not in the significant level. As the current ratio present the company’s solvency, this might demonstrate that companies with high current ratio have sufficient excess amount of current assets over current liabilities to finance their operation and capable to handle the longer cash conversion period as suggested by Moss and Stine (1993).
6.2.6 Debt ratio Number of days inventory has significant positive relation with debt ratio. Our finding supports the prior study of Jeng-Ren, et al. (2006) who point out the relation between

56
working capital management and debt ratio that low liquidity companies would seek for external funds which result in higher debt ratio. Our result indicate that companies with low debt ratio, the ratio of total liabilities to total assets, tend to have shorter inventory period, in consequence, the companies have the shorter cash conversion cycle which show their effective working capital management. On the contrary, the companies which high proportion of total liabilities tend to have inefficient working capital management that is unable to create enough internal fund and the company have to finance through external sources, such as bank, to support the operations.
6.2.7 Industry effect Examining the industry effect, the regression results report the significant positive relation with the cash conversion cycle in four industries: materials (IND_2), industrials (IND_3), health care (IND_6) and information technology (IND_7). We also find that three out of those four industries have significant positive association with number of days inventory which consist of materials (IND_2), industrials (IND_3) and health care (IND_6). Our results are consistent with the findings of previous research. Jose, et al. (1996) and Yung-Jang, 2002 suggest that industry factors have an impact on the relationship between the cash conversion cycle and profitability such as capital intensity, production process and distribution channel. Concerning the nature of business given the manufacturing as an example, inventories are the core of manufacturing industry and the companies might have to maintain the sufficient inventory level to avoid either the stock-outs or the excess balance. They require raw material and work-in-process for their production and finished goods for sale to customers which affect them to have higher inventory balance and longer inventory period than other industries. On the other hand, the excess balance would also cost the company such as loss of benefit from short-term investment, having long outstanding stocks and obsolete inventories. In addition, manufacturing companies require the efficient inventory management, supply chain management, procurement and production. Without these systems, the companies may unable to manage their inventory effectively which result in high inventory balance and long inventory period. Not only inventories balance should be concerned in case of different business, but the production period should also be taken into account. Owing to the long production period, companies have to hold it as work in process for longer time which affects a larger number of days inventory. Lastly, the significant positive relations with number of days account receivable are reported in two industries: the health care (IND_6) and information technology (IND_7).

57
7. Conclusion and Further Consideration
This chapter presents conclusion drawn from the analysis of empirical results and connected to our research question. Then, we provide further consideration for future study. In the management of the company, it is important to take both profitability and liquidity into consideration because even profitable companies might sometimes face cash flow problem. Company’s liquidity ties up in working capital which comprises current assets and current liabilities. Working capital plays a vital role in the company’s operations and requires the efficient management. The management of working capital concerns the management of cash, inventories, accounts receivable and accounts payable. It is necessary for a company to monitor its working capital properly and maintain its balance at the appropriate level. Shortage of working capital may lead to lack of liquidity as well as loss of production and sales; on the contrary, excess balance of working capital could be seen as loss of investment opportunities. One way to achieve the objective of having efficient working capital is to manage short term assets and liabilities such as implement policies on inventory, credit and collection as well as supplier’s payment term. However, we have found that there are also other factors affect the management of working capital. Previous studies on working capital management have pointed out that company characteristics, such as profitability, debt ratio and operating cash flow, affect working capital management of a company. The purpose of this study is to investigate the effect of company characteristics on the management of working capital and to provide the empirical evidence of the determinants of working capital management in Swedish listed companies. Based on a sample of 40 companies, the quantitative method has been used as our research approach to examine the relationship between company characteristics and the cash conversion cycle as a measure of working capital management in Swedish listed companies. The company characteristics included profitability, operating cash flow, company size, sale growth, current ratio and debt ratio. The three components of the cash conversion cycle, number of days inventory, number of days accounts receivable and numbers of days accounts payable, have been used to find the association with the related factors as well. Results from regression analysis reports that profitability, operating cash flow, company size and sale growth affect the working capital management in Swedish listed companies. We have found a significant positive relation between profitability and the cash conversion cycle. The positive relationship demonstrates that an increase in profitability, measured by return on assets, have an impact on a rise in the length of the cash conversion cycle which indicate less effective working capital management. Further, we have found that the length of the cash conversion cycle have inverse relations with operating cash flow, company size and sale growth. Increases in these

58
three factors, operating cash flow, company size and sale growth, reduce the length of the cash conversion cycle which indicate effective working capital management. Our results provide evidence that four company characteristics affect the management of working capital in Swedish listed companies. Accordingly, companies with these four characteristics, low profit, surplus operating cash flow, large company size, high growth rate, tend to have more efficient working capital management for the case of Swedish listed companies. As for industry effect, the regression results report the significant positive relation with the cash conversion cycle in four out of eight industries: materials, industrials, health care and information technology. Further studies could be a study to examine an impact to other measures of working capital management and to explore a relation with other factors such as economy effect. Also, future research could be conducted by extend a sample size and study in other countries.

59
References
Books Andersson, S., (1979). Positivism kontra hermeneutic. 1st edition. Göteborg: Korpen. Arbnor, I., & Bjerke, B., (1994). Företagsekonomisk metodlära. 2nd edition. Lund:
Studeentlitteratur. Arnold, G., (2008). Corporate financial management. 4th edition. Harlow: Financial
Times Prentice Hall Brealey, R.A., Mayers, S.C., Allen, F., (2006). Corporate Finance. 8th edition. New
York: McGraw-Hill/Irwin Bryman, A., & Bell, E., (2005). Företagsekonomiska forskningsmetoder. 1st edition.
Malmö: Liber Ekonomi. Bryman, A., (2008). Social research methods. 3rd edition. Oxford: Oxford University
Press. Dolfe, M., & Koritz, A., (1999). European cash management: a guide to best
practice.1st edition. Chichester: Wiley, Cop. Halvorsen, K., (1992). Samhällsvetenskaplig metod, 1st edition. Lund: Studentlitteratur. Jacobsen, D.I., (2007). Förståelse, beskrivning och förklaring: introduktion till
samhällsvetenskaplig metod för hälsovård och socialt arbete. 1st edition. Lund: Studentlitteratur.
Lantz, B. (2008). Operativ verksamhetsstyrning. 2nd edition. Lund: Studentlitteratur. Larsson, C-G., & Hammarlund, L.F., (2005). Cash management för företag. 9th edition.
Lund: Studentlitteratur. Maness, T.S. & Zietlow, J.T. (2005). Short-term financial management. 3rd edition.
Ohio: South-Western/Thomson Learning. Muijs, D. (2004). Doing quantitative research in education with SPSS. 1st edition.
London: SAGE Publications. Olsson, H., & Sörensen, S., (2007). Forskningsprocessen: kvantitativa och kvalitativa
perspektiv. 2nd edition. Stockholm: Liber.

60
Pallant, J. (2007). SPSS survival manual: A step by step guide to data analysis using SPSS for Windows version 15. 3rd edition. Berkshire, England: Open University Press.
Patel, R., & Davidsson, B., (1994). Forskningsmetodikens grunder, Att planera, genomföra och rapportera en undersökning. 1st edition. Lund: Studentlitteratur.
Tabachnick, B.G. & Fidell, L.S. (2007) Using Multivariate Statistics. 5th edition.
Boston, MA: Pearson Education. Åsberg, R., (2000). Ontologi, Epistemlologi och metodologi: en kritisk gnomgång av
vissa grundläggande vetenskapsteoretiska begrepp och ansatser. 1st edition. Göteborg: Institutionen för pedagogik och didaktik, Göteborgs universitet.
Articles Boisjoly, R.P. (2009). The cash flow implications of managing working capital and
capital investment. Journal of Business and Economic Studies, 15(1), 98-108. Charlton, W.T., Lancaster, C., & Stevens, J.L. (2002). Industry and liquidity effects in
corporate investment and cash relationships. The Journal of Applied Business Research, 18(1), 131-142.
Deloof, M. (2003). Does working capital management affect profitability of Belgian
firms? Journal of Business Finance & Accounting, 30(3/4), 573-587. Eljelly, A.M.A. (2004). Liquidity – profitability tradeoff: An empirical investigation in
an emerging market. International Journal of Commerce & Management, 14(2), 48-60.
García-Teruel, P.J., & Martínez-Solano, P. (2007). Effects of working capital
management on SME profitability. International Journal of Managerial Finance, 3(2), 164-177.
Gentry, J.A., Vaidyanathan, R., & Wai Lee, H., (1990). A Weighted Cash Conversion
Cycle, Journal of Financial Management Association of USA, 19 (1), 90-99. Hyun-Han, S., & Soenen, L. (1998). Efficiency of working capital management and
corporate profitability. Financial Practice and Education, 8(2), 37-45. Jeng-Ren, C., Li, C., & Han-Wen, W. (2006). The determinants of working capital
management. Journal of American Academy of Business, Cambridge, 10(1), 149-155.

61
Jose, M.L., Lancaster, C., & Stevens, J.L. (1996). Corporate returns and cash conversion cycles. Journal of Economics and Finance, 20(1), 33-46.
Kim, C., Mauer, D.C., & Sherman, A.E. (1998). The determinants of corporate
liquidity: Theory and evidence. Journal of Financial and Quantitative Analysis, 33(3), 335-359.
Lancaster, C., & Stevens, J.L. (1999). Corporate Liquidity and the significance of
earnings versus cash flow: An examination of industry effects. The Journal of Applied Business Research, 15(3), 37-46.
Lazaridis, I., & Tryfonidis, D. (2006). Relationship between working capital
management and profitability of listed companies in the Athens stock exchange. Journal of Financial Management and Analysis, 19(1), 26-35.
Moss, J.D., & Stine, B. (1993). Cash conversion cycle and firm size: A study of retail
firms. Managerial Finance, 19(8), 25-34. Nwaeze, E.T., Yang, S.S.M., & Yin, Q.J. (2006). Accounting information and CEO
compensation: The role of cash flow from operations in the presence of earnings. Contemporary Accounting Research, 23(1), 227-265.
Opler, T., Pinkowitz, L., Stulz, R., & Williamson, R. (1999). The determinants and
implications of corporate cash holdings. Journal of Financial Economics, 52, 3-46. Pass, C.L., & Pike, R.H. (2007). An Overview of Working Capital and Corporate
Financing, Managerial Finance, 10 (3), 1-11. DOI 10.1108/eb027318 Raheman, A., & Nasr, M. (2007). Working capital management and profitability – case
of Pakistani firms. International Review of Business Research Papers, 3(1), 279-300.
Theodore Farris II, M., & Hutchison, P.D., (2003). Measuring Cash-to-Cash
Performance, The International Journal of Logistic Management, 14 (2), 83-92. Samiloglu, F., & Demirgunes, K. (2008). The effect of working capital management on
firm profitability: Evidence from Turkey. The International Journal of Applied Economics and Finance, 2(1), 44-50.
Uyar, A. (2009). The relationship of Cash Conversion Cycle with Firm Size and
Profitability: An Empirical Investigation in Turkey, International Research Journal of Finance and Economics, 24, 186-192.

62
William, H., & McAfee, B., (2009). Producing a Healthy Caash Flow for your Business, Business and Economic Review, 55 (3), 24-25.
Yung-Jang, W. (2002). Liquidity management, operating performance, and corporate
value: evidence from Japan and Taiwan. Journal of Multinational Financial Management, 12(2002), 159-169.
Web pages Danske Bank A/S, Ernst & Young (2009). Working capital management 2009 – a
survey of Nordic companies. Ernst & Young website <http://www.fokus.no/SiteCollectionDocuments/rapport-arbeidskapital.pdf> [Retrieved April 4th, 2010].
Ernst & Young (March, 2010). Sverige top 5 i nytt globliseringsindex. Ernst&Young
website<http://www.ey.com/SE/sv/Newsroom/News-releases/pressmeddelande-100316-sverige-top-5-i-globaliseringsindex-Copy-> [Retrieved April 4th, 2010].
EYGM Limited (June, 2010). All tied up – Working capital management report 2009.
Ernst & Young website <http://www.ey.com/Publication/vwLUAssets/All_tied_up-_working_capital_management_report_for_2009/$FILE/All%20tied%20up.pdf> [Retrieved April 2nd, 2010].
Konjunkturinstitutet (April, 2010). The Swedish economy March 2010.
Konjunkturinstitutet website <http://www.konj.se/download/18.2b8975271278f4c2de580005657/KL_mar2010eng.pdf> [Retrieved April 12th, 2010].
Loanuniverse (1998-2004). Asset conversion cycle. Loanuniverse website
<http://www.loanuniverse.com/cashcycle.html> [Retrieved October 31st , 2009]. NASDAQ OMX Nordic (March, 2010). The Nordic list as of February 1st, 2010.
NASDAQ OMX website <http://www.nasdaqomxnordic.com/shares/> [Retrieved: March 5th, 2010].
NASDAQ OMX Nordic (May, 2010). Rules book for issuers NASDAQ OMX
Stockholm 1 May 2010. NASDAQ OMX website < http://nasdaqomx.com/digitalAssets/68/68118_nasdaq_omx_stockholm_rule__book__for__issuers_2010_05_01.pdf> [Retrieved May 23rd, 2010].
NASDAQ OMX Nordic (May, 2010). Rules for the construction and maintenance of
the NASDAQ OMX and Oslo Børs All-share, Benchmark, Tradable and sector indexes, Version 1.9.2/March 2010. NASDAQ OMX website

63
<https://indexes.nasdaqomx.com/docs/Methodology_NASDAQ_OMX_and_Oslo_Bors_Equity_Indexes.pdf> [Retrieved May 23rd, 2010].
OANDA (March, 2010). OANDA Currency converter. OANDA website
<http://www.oanda.com/currency/converter/> [Retrieved: March 14th, 2010].

1(1)
Appendix 1: Companies included in the study, by industry Energy Alliance Oil Company Ltd. Lundin Petroleum AB
Consumer Discretionary Autoliv Inc. SDB Electrolux AB Hennes & Mauritz AB Husqvarna AB Modern Times Group MTG AB
Materials Boliden AB Holmen AB Lundin Mining Corporation SSAB AB Svenska Cellulosa AB SCA
Consumer Staples Axfood AB Hakon Invest AB Oriflame Cosmetics S.A Swedish Match AB
Industrials ABB Ltd Alfa Laval AB ASSA ABLOY AB Atlas Copco AB Hexagon AB Lindab International AB NCC AB SAAB AB Sandvik AB SCANIA AB Seco Tools AB Securitas AB Skanska AB SKF AB Trelleborg AB Volvo AB
Health Care AstraZeneca PLC Elekta AB Getinge AB Meda AB Information Technology Ericsson, Telefonab. L M Telecommunication Services Millicom International Cellular S.A. Tele2 AB TeliaSonera AB
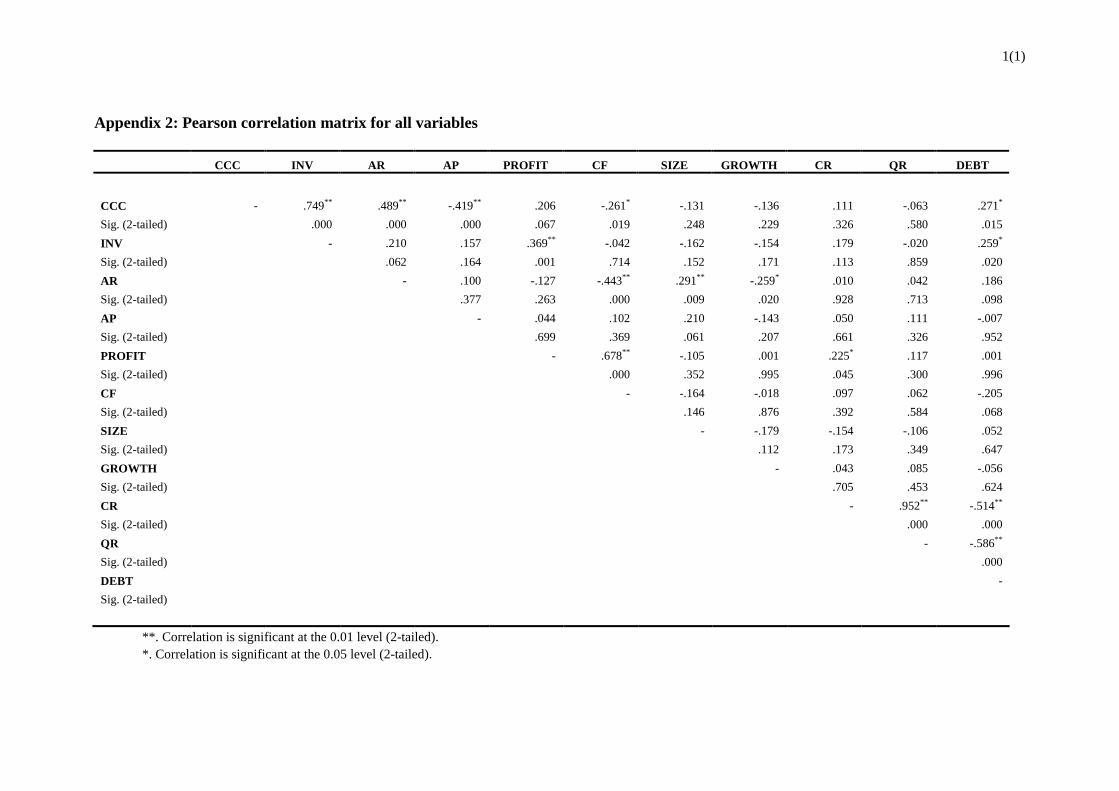
1(1)
Appendix 2: Pearson correlation matrix for all variables
CCC INV AR AP PROFIT CF SIZE GROWTH CR QR DEBT
CCC - .749** .489** -.419** .206 -.261* -.131 -.136 .111 -.063 .271*
Sig. (2-tailed) .000 .000 .000 .067 .019 .248 .229 .326 .580 .015
INV - .210 .157 .369** -.042 -.162 -.154 .179 -.020 .259*
Sig. (2-tailed) .062 .164 .001 .714 .152 .171 .113 .859 .020
AR - .100 -.127 -.443** .291** -.259* .010 .042 .186
Sig. (2-tailed) .377 .263 .000 .009 .020 .928 .713 .098
AP - .044 .102 .210 -.143 .050 .111 -.007
Sig. (2-tailed) .699 .369 .061 .207 .661 .326 .952
PROFIT - .678** -.105 .001 .225* .117 .001
Sig. (2-tailed) .000 .352 .995 .045 .300 .996
CF - -.164 -.018 .097 .062 -.205
Sig. (2-tailed) .146 .876 .392 .584 .068
SIZE - -.179 -.154 -.106 .052
Sig. (2-tailed) .112 .173 .349 .647
GROWTH - .043 .085 -.056
Sig. (2-tailed) .705 .453 .624
CR - .952** -.514**
Sig. (2-tailed) .000 .000
QR - -.586**
Sig. (2-tailed) .000
DEBT -
Sig. (2-tailed)
**. Correlation is significant at the 0.01 level (2-tailed). *. Correlation is significant at the 0.05 level (2-tailed).

1(1)
Appendix 3: Pearson correlation matrix for all variables of year 2007 and 2008 (the above and below the diagonal, respectively)
CCC INV AR AP PROFIT CF SIZE GROWTH CR QR DEBT
CCC - .725** .487** -.405** .218 -.225 -.129 -.197 .039 -.112 .288
Sig. (2-tailed) .000 .001 .009 .177 .163 .428 .222 .812 .491 .072
INV .767** - .187 .201 .399* .011 -.154 -.214 .101 -.069 .291
Sig. (2-tailed) .000 .248 .213 .011 .944 .342 .184 .533 .671 .068
AR .492** .229 - .104 -.226 -.398* .288 -.361* -.038 -.006 .196
Sig. (2-tailed) .001 .156 .525 .160 .011 .072 .022 .815 .970 .225
AP -.435** .117 .096 - -.003 .119 .212 -.190 .039 .093 .024
Sig. (2-tailed) .005 .474 .554 .983 .464 .188 .239 .811 .567 .885
PROFIT .216 .378* -.049 .088 - .777** -.166 -.111 .204 .079 -.098
Sig. (2-tailed) .182 .016 .765 .590 .000 .307 .496 .206 .630 .547
CF -.293 -.085 -.487** .087 .607** - -.176 -.074 .111 .055 -.143
Sig. (2-tailed) .067 .600 .001 .594 .000 .277 .650 .496 .736 .380
SIZE -.141 -.182 .293 .206 -.039 -.146 - -.220 -.155 -.112 .025
Sig. (2-tailed) .384 .262 .066 .202 .813 .369 .172 .340 .492 .876
GROWTH -.002 -.010 -.122 -.094 .352* .237 -.126 - .058 .106 -.080
Sig. (2-tailed) .992 .953 .453 .564 .026 .141 .438 .721 .514 .623
CR .186 .263 .063 .062 .252 .081 -.153 -.004 - .964** -.535**
Sig. (2-tailed) .250 .101 .701 .704 .116 .619 .345 .979 .000 .000
QR -.009 .038 .099 .135 .156 .069 -.097 .015 .937** - -.588**
Sig. (2-tailed) .955 .818 .544 .407 .337 .671 .552 .928 .000 .000
DEBT .259 .231 .177 -.037 .085 -.273 .080 .010 -.490** -.588** -
Sig. (2-tailed) .107 .152 .276 .819 .601 .088 .623 .950 .001 .000
**. Correlation is significant at the 0.01 level (2-tailed). *. Correlation is significant at the 0.05 level (2-tailed).

1(2)
Appendix 4: Pearson correlation matrix for all variables, by industry
CCC INV INDUSTRY PROFIT CF SIZE GROWTH CR QR DEBT PROFIT CF SIZE GROWTH CR QR DEBT
Energy .346 .388 .250 -.360 .096 .162 -.641 -.479 .644 .793 -.628 -.161 -.090 -.681
Sig. (2-tailed) .654 .612 .750 .640 .904 .838 .359 .521 .356 .207 .372 .839 .910 .319
Materials .683* -.063 .354 .074 .596 .264 .782** .543 -.063 .055 -.062 .512 .146 .660*
Sig. (2-tailed) .029 .863 .316 .838 .069 .461 .008 .105 .863 .879 .866 .130 .687 .038
Industrials .587** .213 -.410* .078 .347 .066 -.596** .582** .189 -.313 .056 .359* -.005 -.590**
Sig. (2-tailed) .000 .241 .020 .670 .051 .721 .000 .000 .301 .081 .760 .044 .977 .000
Consumer discretionary -.280 -.321 -.077 -.259 -.280 -.439 .487 .107 -.061 -.289 .100 -.032 -.176 .111
Sig. (2-tailed) .433 .366 .834 .470 .433 .204 .154 .769 .866 .418 .783 .930 .627 .760
Consumer Staples .365 .014 .638 -.337 -.240 -.274 .604 .691 .199 .064 -.030 -.153 -.240 .472
Sig. (2-tailed) .373 .973 .089 .414 .567 .511 .113 .058 .637 .880 .943 .718 .566 .238
Health Care -.913** -.950** -.698 .466 .334 .006 -.015 -.086 .006 .574 .041 -.026 -.257 -.569
Sig. (2-tailed) .002 .000 .054 .244 .419 .988 .972 .840 .989 .137 .923 .951 .539 .141
Information Technology -1.000** .a 1.000** 1.000** -1.000** -1.000** 1.000** 1.000** .a -1.000** -1.000** 1.000** 1.000** -1.000**
Sig. (2-tailed) . . . . . . . . . . . . . .
Telecommunication Services -.803 -.809 .574 -.855* .534 .569 -.983** .774 .740 -.574 .954** -.496 -.537 .982**
Sig. (2-tailed) .054 .051 .234 .030 .275 .239 .000 .071 .092 .234 .003 .318 .272 .000
**. Correlation is significant at the 0.01 level (2-tailed). *. Correlation is significant at the 0.05 level (2-tailed). a. Cannot be computed because at least one of the variables is constant.

2(2)
Appendix 4: Pearson correlation matrix for all variables, by industry
AR AP INDUSTRY PROFIT CF SIZE GROWTH CR QR DEBT PROFIT CF SIZE GROWTH CR QR DEBT
Energy -.055 .647 .672 -.615 .025 .118 -.853 -.204 .686 .752 -.658 -.042 .049 -.845
Sig. (2-tailed) .945 .353 .328 .385 .975 .882 .147 .796 .314 .248 .342 .958 .951 .155
Materials .013 -.881** .627 .049 -.343 -.426 .469 -.705* -.653* -.233 -.230 -.845** -.720* -.385
Sig. (2-tailed) .971 .001 .052 .892 .332 .219 .171 .023 .040 .518 .522 .002 .019 .272
Industrials .162 .139 .014 .243 .252 .475** -.384* -.063 -.016 .347 .098 .117 .172 -.111
Sig. (2-tailed) .375 .446 .940 .180 .164 .006 .030 .730 .931 .051 .593 .523 .346 .547
Consumer discretionary -.935** -.813** .220 -.657* -.780** -.727* .824** -.775** -.829** -.071 -.399 -.795** -.717* .662*
Sig. (2-tailed) .000 .004 .542 .039 .008 .017 .003 .008 .003 .845 .254 .006 .020 .037
Consumer Staples -.348 -.709* .745* .109 .568 .554 -.232 .367 -.046 -.465 .482 .369 .279 -.250
Sig. (2-tailed) .399 .049 .034 .798 .142 .154 .580 .371 .915 .245 .226 .368 .504 .550
Health Care -.075 -.314 -.547 -.419 .723* .768* .645 .950** .962** .878** -.624 -.159 .110 -.052
Sig. (2-tailed) .859 .448 .161 .302 .043 .026 .084 .000 .000 .004 .098 .706 .796 .903
Information Technology -1.000** .a 1.000** 1.000** -1.000** -1.000** 1.000** 1.000** .a -1.000** -1.000** 1.000** 1.000** -1.000**
Sig. (2-tailed) . . . . . . . . . . . . . .
Telecommunication Services -.898* -.901* .408 -.841* .676 .712 -.856* .742 .742 -.607 .855* -.463 -.497 .988**
Sig. (2-tailed) .015 .014 .423 .036 .141 .112 .030 .091 .091 .201 .030 .355 .316 .000
**. Correlation is significant at the 0.01 level (2-tailed). *. Correlation is significant at the 0.05 level (2-tailed). a. Cannot be computed because at least one of the variables is constant.

1(1)
Appendix 5: Regression results (1) CCC = β0 + β1PROFIT+ β2CF + β3SIZE + β4GROWTH+ β5CR+ β6QR + β7DEBT (2) CCC = β0 + β1PROFIT+ β2CF + β3SIZE + β4GROWTH+ β5CR+ β6DEBT
The table shows Beta under standardized coefficients for the respective independent variable in the model. ** Significant at the 0.01 level * Significant at the 0.05 level
Dependent variable: Cash conversion cycle Regression model:
(1) (2)
R2 0.554 0.427 Adjusted R2 0.511 0.380 F statistic 12.777 9.068 Significance 0.000 0.000 Intercept 150.297 * 166.318 * Coeff Tolerance VIF Coeff Tolerance VIF Variables: PROFIT 0.494 ** 0.414 2.413 0.638 ** 0.444 2.251 CF -0.661 ** 0.443 2.257 -0.704 ** 0.446 2.243 SIZE -0.145 0.891 1.122 -0.204 * 0.913 1.095 GROWTH -0.116 0.931 1.074 -0.180 * 0.961 1.041 CR 1.345 ** 0.073 13.728 0.106 0.615 1.625 QR -1.342 ** 0.070 14.186 - - - DEBT 0.041 0.558 1.792 0.181 0.611 1.636

1(1)
Appendix 6: Regression results (for the component of the cash conversion cycle) (3) INV = β0 + β1PROFIT+ β2CF + β3SIZE + β4GROWTH+ β5CR+ β6DEBT (4) AR = β0 + β1PROFIT+ β2CF + β3SIZE + β4GROWTH+ β5CR+ β6DEBT (5) AP = β0 + β1PROFIT+ β2CF + β3SIZE + β4GROWTH+ β5CR+ β6DEBT
The table shows Beta under standardized coefficients for the respective independent variable in the model. ** Significant at the 0.01 level * Significant at the 0.05 level
Dependent variable: INV AR AP Regression model: (3) (4) (5) R2 0.411 0.361 0.087
Adjusted R2 0.363 0.308 0.012
F statistic 8.506 6.872 1.159
Significance 0.000 0.000 0.338
Intercept 103.208 14.984 -47.735
Variables:
PROFIT 0.614 ** 0.276 -0.113
CF -0.457 ** -0.594 ** 0.221
SIZE -0.189 * 0.189 0.234 * GROWTH -0.191 * -0.235 * -0.097 CR 0.202 0.090 0.142
DEBT 0.268 * 0.087 0.094

1(1)
Appendix 7: Regression results (include year dummy variables) (6) CCC = β0 + β1PROFIT+ β2CF+ β3SIZE+ β4GROWTH+ β5CR+ β6DEBT+ β7YEAR (7) INV = β0 + β1PROFIT+ β2CF+ β3SIZE+ β4GROWTH+ β5CR+ β6DEBT+ β7YEAR (8) AR = β0 + β1PROFIT+ β2CF+ β3SIZE+ β4GROWTH+ β5CR+ β6DEBT+ β7YEAR (9) AP = β0 + β1PROFIT+ β2CF+ β3SIZE+ β4GROWTH+ β5CR+ β6DEBT+ β7YEAR
The table shows Beta under standardized coefficients for the respective independent variable in the model. ** Significant at the 0.01 level * Significant at the 0.05 level
Dependent variable: CCC INV AR AP Regression model: (6) (7) (8) (9) R2 0.438 0.430 0.362 0.087 Adjusted R2 0.384 0.374 0.300 -0.001 F statistic 8.022 7.756 5.826 0.984 Significance 0.000 0.000 0.000 0.449 Intercept 164.394 * 101.326 15.161 -47.528 Variables: PROFIT 0.666 ** 0.651 ** 0.269 -0.118 CF -0.719 ** -0.477 ** -0.590 ** 0.224 SIZE -0.210 * -0.196 * 0.191 0.235 GROWTH -0.163 -0.169 -0.239 * -0.101 CR 0.096 0.190 0.092 0.144 DEBT 0.174 0.259 * 0.089 0.095 YEAR 0.109 0.140 -0.026 -0.020
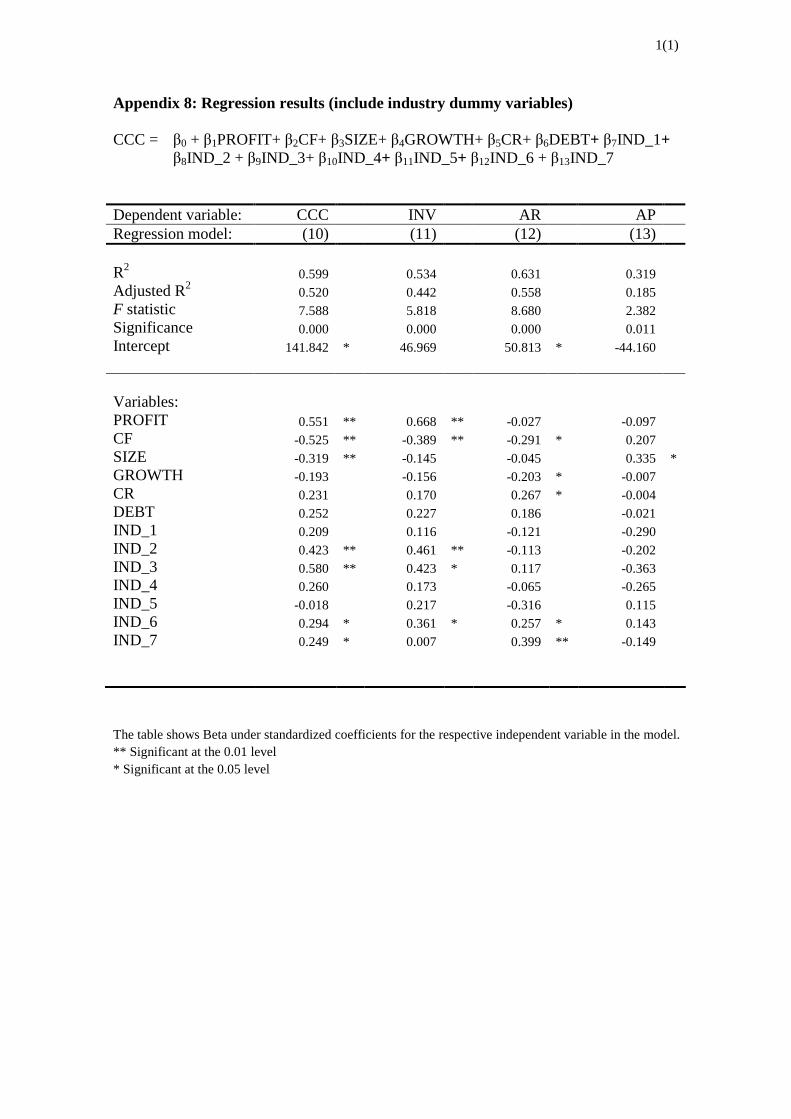
1(1)
Appendix 8: Regression results (include industry dummy variables) CCC = β0 + β1PROFIT+ β2CF+ β3SIZE+ β4GROWTH+ β5CR+ β6DEBT+ β7IND_1+
β8IND_2 + β9IND_3+ β10IND_4+ β11IND_5+ β12IND_6 + β13IND_7
The table shows Beta under standardized coefficients for the respective independent variable in the model. ** Significant at the 0.01 level * Significant at the 0.05 level
Dependent variable: CCC INV AR AP Regression model: (10) (11) (12) (13) R2 0.599 0.534 0.631 0.319 Adjusted R2 0.520 0.442 0.558 0.185 F statistic 7.588 5.818 8.680 2.382 Significance 0.000 0.000 0.000 0.011 Intercept 141.842 * 46.969 50.813 * -44.160 Variables: PROFIT 0.551 ** 0.668 ** -0.027 -0.097 CF -0.525 ** -0.389 ** -0.291 * 0.207 SIZE -0.319 ** -0.145 -0.045 0.335 * GROWTH -0.193 -0.156 -0.203 * -0.007 CR 0.231 0.170 0.267 * -0.004 DEBT 0.252 0.227 0.186 -0.021 IND_1 0.209 0.116 -0.121 -0.290 IND_2 0.423 ** 0.461 ** -0.113 -0.202 IND_3 0.580 ** 0.423 * 0.117 -0.363 IND_4 0.260 0.173 -0.065 -0.265 IND_5 -0.018 0.217 -0.316 0.115 IND_6 0.294 * 0.361 * 0.257 * 0.143 IND_7 0.249 * 0.007 0.399 ** -0.149

Umeå School of Business Umeå University SE-901 87 Umeå, Sweden www.usbe.umu.se