Embed Size (px)
Citation preview
WORKING PAPER 291
The Impact of China on Sub-Saharan Africa
Raphael Kaplinsky, Dorothy McCormick and Mike Morris November 2007
Minimum SizeX : 15mm
X
Minimum SizeX : 15mm
X
IDS_Master Logo
IDS_Master Logo_Minimum Size
About IDSThe Institute of Development Studies is one of the world's leading organisations for research, teachingand communications on international development. Founded in 1966, the Institute enjoys aninternational reputation based on the quality of its work and the rigour with which it applies academicskills to real world challenges. Its purpose is to understand and explain the world, and to try to changeit – to influence as well as to inform.
IDS hosts five dynamic research programmes, five popular postgraduate courses, and a family of world-class web-based knowledge services. These three spheres are integrated in a unique combination – as adevelopment knowledge hub, IDS is connected into and is a convenor of networks throughout theworld.
The Institute is home to approximately 80 researchers, 50 knowledge services staff, 50 support staff andabout 150 students at any one time. But the IDS community extends far beyond, encompassing anextensive network of partners, former staff and students across the development communityworldwide.
Minimum SizeX : 15mm
X
Minimum SizeX : 15mm
X
IDS_Master Logo Black
IDS_Master Logo_Minimum Size
For further information on IDS publications and for a free catalogue, contact: IDS Communications UnitInstitute of Development Studiesat the University of SussexBrighton BN1 9RE, UK
Tel: +44 (0) 1273 678269Fax: +44 (0) 1273 621202E-mail: [email protected]: www.ids.ac.uk/ids/bookshop
IDS is a charitable company, limited by guarantee and registered in England (No. 877338).
The Impact of China on Sub-Saharan Africa
Raphael Kaplinsky, Dorothy McCormick and Mike Morris November 2007
01
IDS WORKING PAPER 291
IDS WORKING PAPER 291
Institute of Development Studies at the University of Sussex Brighton BN1 9RE UK
IDS WORKING PAPER 291
The Impact of China on Sub-Saharan AfricaRaphael Kaplinsky, Dorothy McCormick and Mike Morris IDS Working Paper 291
First published by the Institute of Development Studies in November 2007© Institute of Development Studies 2007ISBN: 978 1 85864 665 0
A catalogue record for this publication is available from the British Library.All rights reserved. Reproduction, copy, transmission, or translation of any part of this publication may be madeonly under the following conditions:• with the prior permission of the publisher; or• with a licence from the Copyright Licensing Agency Ltd., 90 Tottenham Court Road, London W1P 9HE, UK,
or from another national licensing agency; or• under the terms set out below.
This publication is copyright, but may be reproduced by any method without fee for teaching or non-profit purposes, but not for resale. Formal permission is required for all such uses, but normally will be granted immediately. For copying in any other circumstances, or for re-use in other publications, or for translation oradaptation, prior written permission must be obtained from the publisher and a fee may be payable.
Available from:Communications UnitInstitute of Development Studiesat the University of SussexBrighton BN1 9RE, UKTel: +44 (0) 1273 678269Fax: +44 (0) 1273 621202E-mail: [email protected]: www.ids.ac.uk/ids/bookshop
Typeset by IDS, Brighton UK. Printed by RPM Print & Design, Chichester UK.IDS is a charitable company limited by guarantee and registered in England (No. 877338).
02
03
IDS WORKING PAPER 291
The Impact of China on Sub-Saharan Africa
Raphael Kaplinsky, Dorothy McCormick and Mike Morris
Summary
This paper focuses on the rapidly-growing links between China and SSA. The spotlight is placed on three vectors of interaction – trade, foreign investment andaid. Chinese involvement in Africa is driven predominantly by the quest for materialinputs (oil and other primary commodities) required for its infrastructural invest-ments and booming manufacturing sector. At least in the early years of this involve-ment, there appears to be close coordination between Chinese involvement inthese three related vectors.
Chinese involvement in SSA has important policy implications for growth, distribution and policy. Whilst it has provided a spur for some of SSA’s key commodity exporting economies, its impact on manufacturing (both that destinedfor domestic and export markets) has been adverse. Even some of the benefits ofthe commodity price boom are ambiguous, since these are often associated withrising exchange rates, corruption and violent conflict. Commodity-based productionalso has adverse distributional impacts when compared to manufacturing.
The rapid growth and significance of enhanced Chinese participation in SSA hasimportant implications for both future research (there are large unknowns and thepicture is changing so rapidly) and for a poverty-focused policy agenda.
Keywords: China; sub-Saharan Africa; trade; investment; textiles.
04
IDS WORKING PAPER 291
Raphael Kaplinsky was formerly at the Institute of Development Studies, duringwhich time he was responsible for launching the Asian Drivers programme. He iscurrently Professor of International Development at the Open University(Department of Policy and Practice), where he leads their Asian Drivers programmeand also cooperates closely with the African Economics Research Consortium on itsAsian Drivers programme. He recently published a book focusing in large part onthe impact of China on the global economy – Globalization, Poverty and Inequality(Polity Press) – and has researched on global value chains, South Africa, and industrial and technology policy. [email protected]
Dorothy McCormick is Associate Research Professor and Director of the Institutefor Development Studies, University of Nairobi in Nairobi, Kenya, where she hasworked since 1988. Her major research and teaching interests are in the area ofindustrialisation, small enterprise development and entrepreneurship. [email protected]
Mike Morris holds joint appointments as a Research Professor in the School ofEconomics, University of Cape Town (Policy Research on International Services andManufacturing) and the School of Development Studies, University of KwaZulu-Natal. He is also a Director of Benchmarking and Manufacturing Analysts, a consulting company which has been involved in assisting firms in the South Africanclothing and textile sector and the automotive industry. [email protected] [email protected]
05
IDS WORKING PAPER 291
ContentsSummary, keywords 3
Author notes 4
Acknowledgements 6
Executive summary 7
1 Introduction: caution and context 11
2 A framework for assessing the impact of China on SSA 12
3 Vectors, complementary-competitive and direct-indirect impacts 14
3.1 The trade channel 14
3.1.1 Assessing the impact of direct trade links 14
3.1.2 Assessing the impact of indirect trade links 18
3.2 FDI and the production channel 26
3.2.1 Investments in the energy and resource sectors 27
3.2.2 Investment in infrastructural projects 28
3.2.3 Incorporation in global production systems 29
3.2.4 Small scale entrepreneurial investments 30
3.2.5 SSA FDI in China 31
3.3 The aid channel 32
3.4 The vectors in aggregate 33
4 Key issues 36
4.1 The challenges posed to industrial policy and sectoral choice 36
4.2 The problems posed for commodity producers 37
4.3 Reacting to changing patterns of poverty and income distribution 39
4.4 The implications for the promotion of good governance, particularly in regard to fragile states 40
4.5 Global and regional integration 41
06
IDS WORKING PAPER 291
4.6 Thinking about the future – the development of ‘dynamic capabilities’ 42
4.7 Filling the knowledge gaps 43
5 An agenda for whom? 44
References 46
FiguresFigure 1.1 China-SSA trade as a proportion of SSA trade with
industrialised countries 12Figure 3.1 Balance of trade between China and SSA, 1980–2004 14Figure 3.2 Composition of Chinese imports from SSA 16Figure 3.3 AGOA country share of US market in all product categories in
which country exports were concentrated in 2003–YTD2006 23Figure 3.4 Share of non-AGOA and non-US cloth in AGOA exports to
US, 2004–2005 30
TablesTable 1.1 Trade with China and India as a proportion of trade with the
industrialised countries 12Table 2.1 A synthetic framework for assessing the impact of China on SSA 14Table 3.1 China’s import dependence (%) 15Table 3.2 Share of particular commodities in exports to China 16Table 3.3 Trade overlap – number of sectors by country 20Table 3.4 Growth of SSA clothing and textile exports, 2000–2004 21Table 3.5 Change in value of clothing exports to the US, 2004, 2005
and 2006 23Table 3.6 Employment decline in the clothing sector, 2004–2005 24Table 3.7 Comparative costs of same item of garden furniture from
SSA and Asia 26Table 3.8 China and SSA: the three primary vectors, and complementary-
competitive and direct-indirect impacts 35
BoxesBox 3.1 China’s rehabilitation of railway infrastructure in oil-supplying
SSA economies 33
AcknowledgementsThis paper was been prepared with financial support from the DFID China Office,Grant Reference Number AG4419. We are grateful to the DFID office in Beijing, toRoli Asthana in DFID Africa Policy Division and to John Humphrey for commentson an earlier draft. The views contained in this report are those of the authors. Weaccept full responsibility for any errors or omissions.
07
IDS WORKING PAPER 291
Executive summary
The challenge: maximising opportunities and minimising threats
Although SSA’s trade with China is relatively small in comparison to its trade withthe industrialised countries, it has grown very rapidly, especially since 2001. There isa danger of overestimating the historic and present impact, and underestimatingthe potential future impact of China on SSA.
1. At a general level, China’s impact on SSA:
l Involves three primary types of links – trade, production/FDI and aid;
l Is in some cases complementary to growth and poverty alleviation, in othercases it is competitive;
l Is both direct (in bilateral links between individual countries and China) and indirect (with the impact being felt in third-country markets);
l Reflects a mix of strategic, political and economic factors, and involves a range of stakeholders, both within China and in SSA.
Since these varied impacts are unevenly felt within and between countries, it isimportant to maintain a comprehensive perspective if the opportunities are to bemaximised and the threats minimised in such a way as to sustain poverty alleviationand to enhance income distribution.
2. More specifically, with regard to the trade channel:
l China has predominantly imported a limited number of products – mostly oil and hard commodities – from a limited number of SSA economies. In return, itpredominantly exports manufactures, mostly final consumption goods.
l Most is known about the direct trade links, in which China now has a growing trade surplus with SSA. These direct trade links combine complementary impacts (notably enhancing consumer welfare through cheap goods), and competitive impacts where there is evidence that domestic manufacturers are in some countries being squeezed by China-sourced imports.
l The indirect trade links, arising through Chinese participation in global markets,are more difficult to assess. In general, it would appear that SSA economies gain from these indirect links, since the price of many of SSA’s imports are falling due to growing Chinese competitiveness, and China’s imports ofcommodities are pushing up the prices of SSA exports. However, in some sectors, notably clothing and furniture, there is persuasive evidence that China’sgrowing competitiveness in global markets is having a very harmful impact on poor SSA exporting economies. Lesotho, Swaziland, Madagascar and Kenya have all been badly hit, and there have been particularly damaging impacts on South Africa. Employment loss has been high, with very severe distributional and poverty impacts.
IDS WORKING PAPER 291
08
3. With regard to the FDI, production and aid vectors:
l The Chinese presence in SSA appears to be driven primarily by the strategicsearch for raw materials rather than for final markets or for low-cost production platforms.
l Chinese firms work to longer time horizons than Western and Japanese firms, in part because many are state-owned and do not appear to be subject to the same short-term profit-maximising imperatives, and in part because of theiraccess to low-cost capital.
l There is increasing Chinese participation in the energy and resource sectors, particularly in fragile states such as the Sudan, Angola and the DRC. This is linked to attempts by some fragile states to evade pressures by western donors and NGOs to promote more transparent and better governance.
l Other realms of activity are in infrastructure development (Chinese firms appear to have costs which are one-quarter to one-half less than Western and South African firms); in small enterprises in some countries (for example Sierra Leone); in trading (for example, Namibia); and in farming (for example, as is emerging in Mozambique).
l Chinese aid is growing throughout the region, particularly in recent years, and appears to be carefully targeted to complement its commercial activities, including in fragile states.
What we don’t know
Whilst these major policy challenges are clear, important key knowledge gaps existwhich need to be filled if policy responses are to be appropriately nuanced forindividual country circumstances. The major knowledge gaps are with regard to:
l The need for baseline studies to assess the changing future impact of China on SSA;
l Analyses of the determinants of SSA competitiveness and the steps required toenhance productivity (for example, in clothing, textiles, footwear and furniture, as well as in export-oriented food crops);
l A more thorough assessment of indirect impacts of China’s trade on SSA, facilitating the development of appropriate policies for providing special and differential treatment to low income SSA economies in global markets;
l Determining the impact of China on consumer welfare, income distribution and absolute poverty levels in SSA, through an analysis of the consumer benefits derived from cheaper imports, and the distributional implications of a switch in specialisation away from labour-intensive manufactures to capital intensive commodities;
l Distinguishing generic from sub-regional and country-specific impacts, aiding the classification of different types of SSA economies;
l Identifying likely future areas of threat and opportunity;
09
IDS WORKING PAPER 291
l Determining the drivers of China’s strategic engagement with SSA and theirimpact on transparent and better governance on the continent.
Conclusions
This growing Chinese presence raises six major policy challenges for SSA if themanifold opportunities are to be grasped and the threats minimised:
1 It poses particular threats to the manufacturing sector. Here the outlook is not entirely bleak, but SSA countries need to take explicit steps to counteract the dangers posed to existing and future capabilities in industry.
2 Although the commodity boom favours some SSA economies, it poses verysevere problems of economic management. Poorly-handled, a resource-boom can easily become a resource-curse. Much can be learned from the experience of other countries (including in SSA) in handling these resource-booms.
3 Notwithstanding the welfare gains to the poor from lower import prices, the expansion of capital-intensive mineral production and the decline oflabour-intensive manufactures pose severe challenges for poverty-alleviationand income distribution. There is, moreover, the additional problem that resource-production is closely associated with violence, corruption and fragile states. Policies to ameliorate these potential adverse poverty-related impacts need to be addressed.
4 Linked to this, China has actively forged closer links with fragile states and this has undermined attempts by the global community to enhance transparency and better governance. There is also emerging evidence that attempts to foster better corporate and environmental governance are also being undermined by China’s presence in some SSA countries.
5 African economies are being pulled in different directions with regard to their linkages with other economies. One pressure is to sustain historical links with the EU and North America, cemented by various preferential trading agreements. Another pressure is to strengthen links with other SSAeconomies, particularly in southern Africa. A third pressure is to enhance links with Asia in general, and China in particular. Scarce administrative and strategic capabilities may require SSA economies to choose how they respond to these various pulls. There are strong arguments for a concerted ‘look East’ policy.
6 The key capability which SSA economies require is the development ofdynamic capabilities to scan changing environments, to develop appropriate strategic responses and to implement these strategies effectively. Unless these capabilities are built – in government, in the corporate and farming sectors, and in civil society – the opportunities offered by Chinese growth may be overwhelmed by the threats which are raised. This applies particularly to emerging sectors of Chinese demand (for example, imports of food products).

All of this poses severe challenges for a variety of stakeholders:
l for governments, firms, farms and civil society within SSA;
l for Chinese stakeholders who may be insufficiently aware of their impact on SSA;
l for DFID and other bi- and multi-lateral agencies who have much to offer in helping to build appropriate (dynamic) capabilities, and to mediate between different governments and stakeholders.
IDS WORKING PAPER 291
10
1 Introduction: caution and contextA policeman encounters a drunkard under a streetlight and asks him whathe is doing. ‘Looking for my house key’ is the stuttered and barely audiblereply. Ever willing to help, the policeman says – ‘I’ll help you look. Now,where exactly do you think you lost the key?’. ‘Oh, near the pub, a couple ofblocks away’. ‘Really’, says the policeman, ‘in that case, why look here?’. ‘Oh,the light is much better here – I’d never find it in the dark near the pub’.
The aphorism of the drunk and the policeman cautions us to be aware of twoimportant pitfalls in assessing the impact of China on SSA (or indeed other regionsand countries). First, there is a danger that we focus on those issues where weknow something, and ignore those for which we can find no information. Thismight either be because an issue is real and important, but the information has notbeen collected, or because the issue is emerging rapidly, and has not yet manifesteditself clearly. The second important failing is that there is a tendency to concentrateon measurable phenomena (for example, trade data), and ignore difficult-to-measure issues (for example, the extent to which FDI is motivated by geo-strategicreasons).
It is important to keep a sense of perspective on the existing and potential impactsof China on SSA. Although there has been a recent resurgence of growth in theSSA region, the overall picture on both poverty-reduction and growth remainsbleak. There is thus a tendency to continually search for quick-fixes for SSA. Asthese fail to deliver rapid results, a new straw is clutched. The danger is that Chinabecomes the new ‘big opportunity’ and in so doing, we overestimate both thespeed with which these opportunities can be grasped, and the potential negativeimpact which China’s growth poses for SSA.
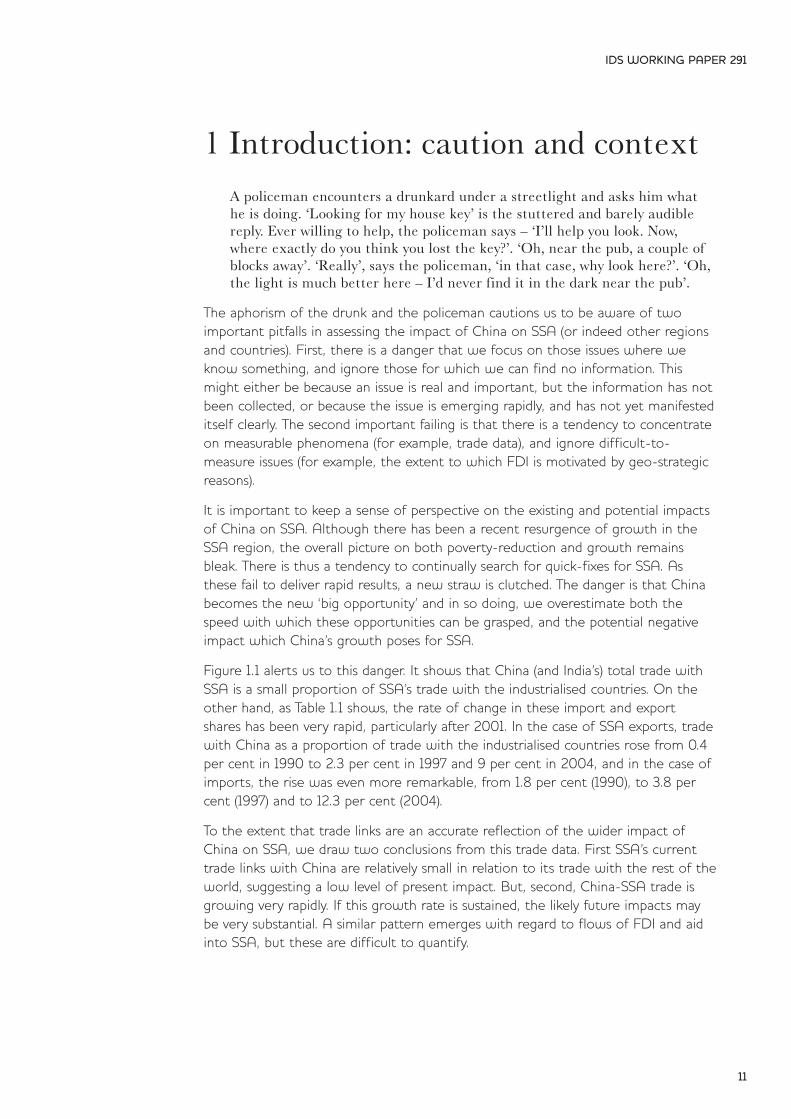
Figure 1.1 alerts us to this danger. It shows that China (and India’s) total trade withSSA is a small proportion of SSA’s trade with the industrialised countries. On theother hand, as Table 1.1 shows, the rate of change in these import and exportshares has been very rapid, particularly after 2001. In the case of SSA exports, tradewith China as a proportion of trade with the industrialised countries rose from 0.4per cent in 1990 to 2.3 per cent in 1997 and 9 per cent in 2004, and in the case ofimports, the rise was even more remarkable, from 1.8 per cent (1990), to 3.8 percent (1997) and to 12.3 per cent (2004).
To the extent that trade links are an accurate reflection of the wider impact ofChina on SSA, we draw two conclusions from this trade data. First SSA’s currenttrade links with China are relatively small in relation to its trade with the rest of theworld, suggesting a low level of present impact. But, second, China-SSA trade isgrowing very rapidly. If this growth rate is sustained, the likely future impacts maybe very substantial. A similar pattern emerges with regard to flows of FDI and aidinto SSA, but these are difficult to quantify.
11
IDS WORKING PAPER 291
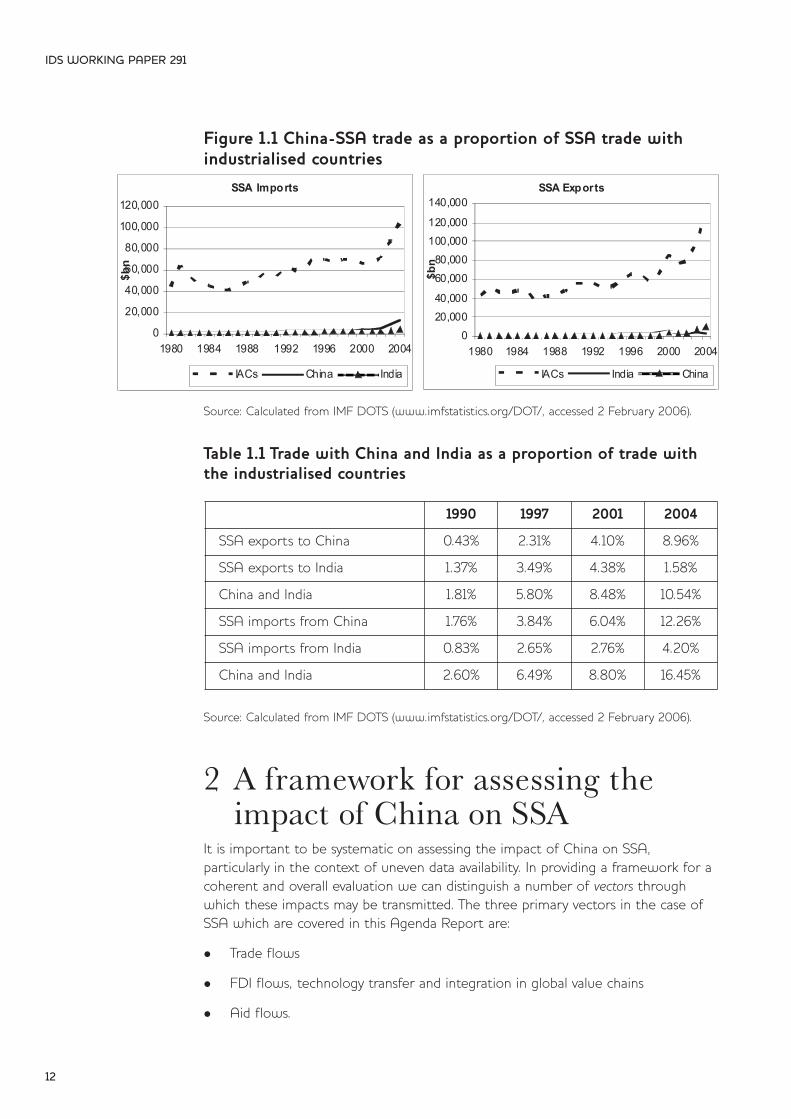
Figure 1.1 China-SSA trade as a proportion of SSA trade withindustrialised countries
Source: Calculated from IMF DOTS (www.imfstatistics.org/DOT/, accessed 2 February 2006).
Table 1.1 Trade with China and India as a proportion of trade withthe industrialised countries
Source: Calculated from IMF DOTS (www.imfstatistics.org/DOT/, accessed 2 February 2006).
2 A framework for assessing the impact of China on SSA
It is important to be systematic on assessing the impact of China on SSA, particularly in the context of uneven data availability. In providing a framework for acoherent and overall evaluation we can distinguish a number of vectors throughwhich these impacts may be transmitted. The three primary vectors in the case ofSSA which are covered in this Agenda Report are:
l Trade flows
l FDI flows, technology transfer and integration in global value chains
l Aid flows.
IDS WORKING PAPER 291
12
SSA Imports
0
20,000
40,000
60,000
80,000
100,000
120,000
1980 1984 1988 1992 1996 2000 2004
$bn
IACs China India
SSA Exports
020,00040,000
60,00080,000
100,000120,000
140,000
1980 1984 1988 1992 1996 2000 2004
$bn
IACs India China
1990 1997 2001 2004
SSA exports to China 0.43% 2.31% 4.10% 8.96%
SSA exports to India 1.37% 3.49% 4.38% 1.58%
China and India 1.81% 5.80% 8.48% 10.54%
SSA imports from China 1.76% 3.84% 6.04% 12.26%
SSA imports from India 0.83% 2.65% 2.76% 4.20%
China and India 2.60% 6.49% 8.80% 16.45%
These are not the only vectors through which a given country or region may havean impact on another country or region (IDS 2006). For example, there may beimpacts transmitted through the environment, through financial flows, or throughparticipation in institutions of regional and global governance.
In each of these vectors, it is possible for China-SSA relations to be either comple-mentary or competitive (or indeed both). In the case of the trade channel, forexample, China may provide SSA with appropriate capital goods and cheap consumer goods, and SSA may provide China with the commodities it requires tofuel its continued economic expansion. Both countries gain from this relationship.On the other hand, China’s export of consumer goods to SSA may displace localproducers, leading to competitive impacts on workers and entrepreneurs in thesesectors.
This distinction between complementarity and competitiveness is easily understood.By contrast the distinction between the direct and indirect impacts is less obvious,and its significance is less widely recognised. The direct impacts are relatively simpleand clear. In the case of the trade illustrations discussed in the previous paragraph,for example, both complementary and competitive impacts occur as a result ofdirect bilateral relations between China and SSA. These impacts are often also easilymeasured, by charting the direct trade flows between China and SSA, breaking thisdown by sectors and countries, and over time. The indirect impacts are less obviousand occur as a result of China’s relations with third-countries, working their wayindirectly through to SSA. Staying with the case of trade for example, China’sdemand for commodities may raise their prices at a global level, and even though acountry like Ethiopia does not export animal feed to China (a direct impact), it sellsanimal feeds into a global market in which prices have been raised by China’s growing imports (indirect impact). As we shall see below, and particularly in thecase of trade, the indirect impacts of China on SSA may often be much more substantial than the direct impacts. However, almost all of the analysis of theimpact of China on SSA (and indeed on other developing countries) focuses ondirect, bilateral relations, and hence tend to miss some of the key issues ofimportance.
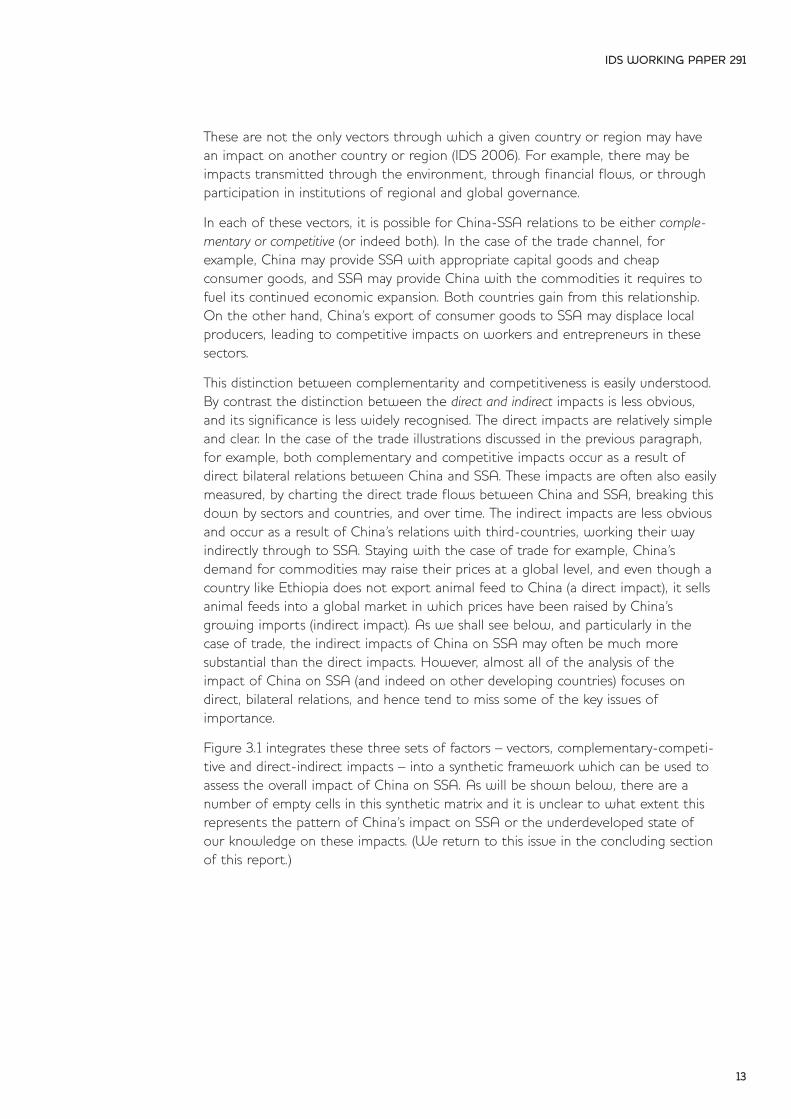
Figure 3.1 integrates these three sets of factors – vectors, complementary-competi-tive and direct-indirect impacts – into a synthetic framework which can be used toassess the overall impact of China on SSA. As will be shown below, there are anumber of empty cells in this synthetic matrix and it is unclear to what extent thisrepresents the pattern of China’s impact on SSA or the underdeveloped state ofour knowledge on these impacts. (We return to this issue in the concluding sectionof this report.)
IDS WORKING PAPER 291
13
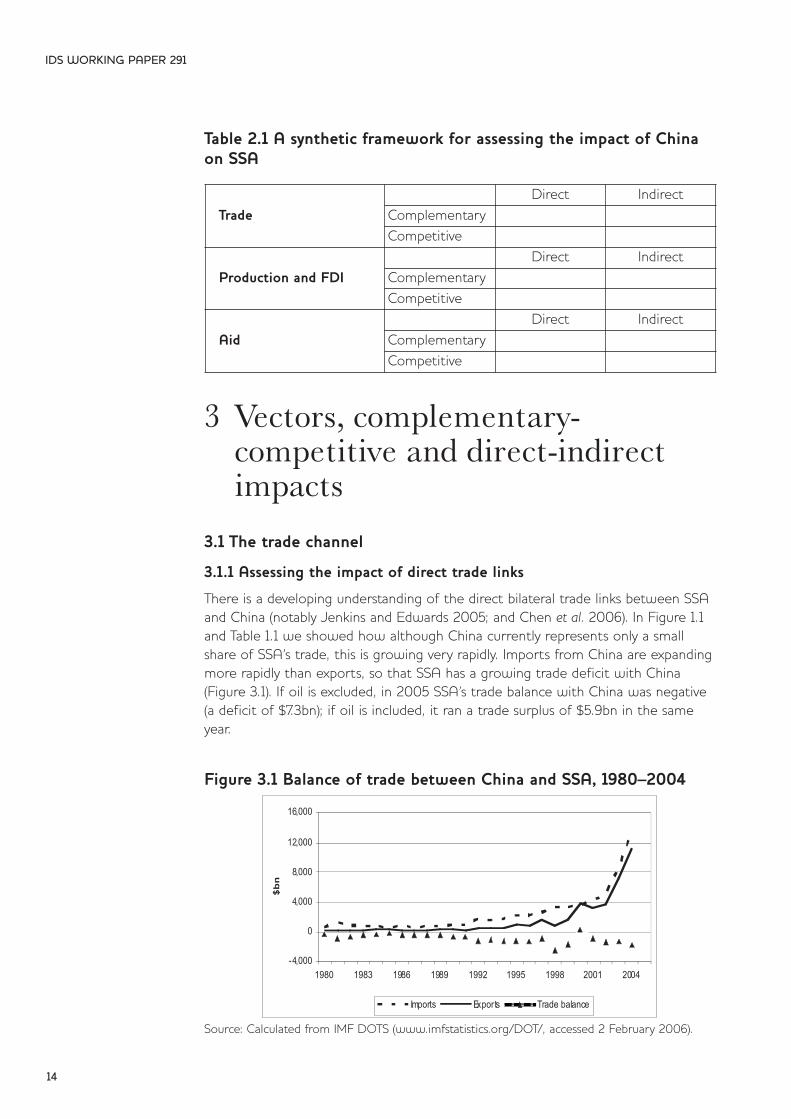
Table 2.1 A synthetic framework for assessing the impact of Chinaon SSA
3 Vectors, complementary-competitive and direct-indirect impacts
3.1 The trade channel
3.1.1 Assessing the impact of direct trade links
There is a developing understanding of the direct bilateral trade links between SSAand China (notably Jenkins and Edwards 2005; and Chen et al. 2006). In Figure 1.1and Table 1.1 we showed how although China currently represents only a smallshare of SSA’s trade, this is growing very rapidly. Imports from China are expandingmore rapidly than exports, so that SSA has a growing trade deficit with China(Figure 3.1). If oil is excluded, in 2005 SSA’s trade balance with China was negative(a deficit of $7.3bn); if oil is included, it ran a trade surplus of $5.9bn in the sameyear.
Figure 3.1 Balance of trade between China and SSA, 1980–2004
Source: Calculated from IMF DOTS (www.imfstatistics.org/DOT/, accessed 2 February 2006).
IDS WORKING PAPER 291
14
TradeDirect Indirect
ComplementaryCompetitive
Production and FDIDirect Indirect
ComplementaryCompetitive
AidDirect Indirect
ComplementaryCompetitive
-4,000
0
4,000
8,000
12,000
16,000
1980 1983 1986 1989 1992 1995 1998 2001 2004
$bn
Imports Exports Trade balance
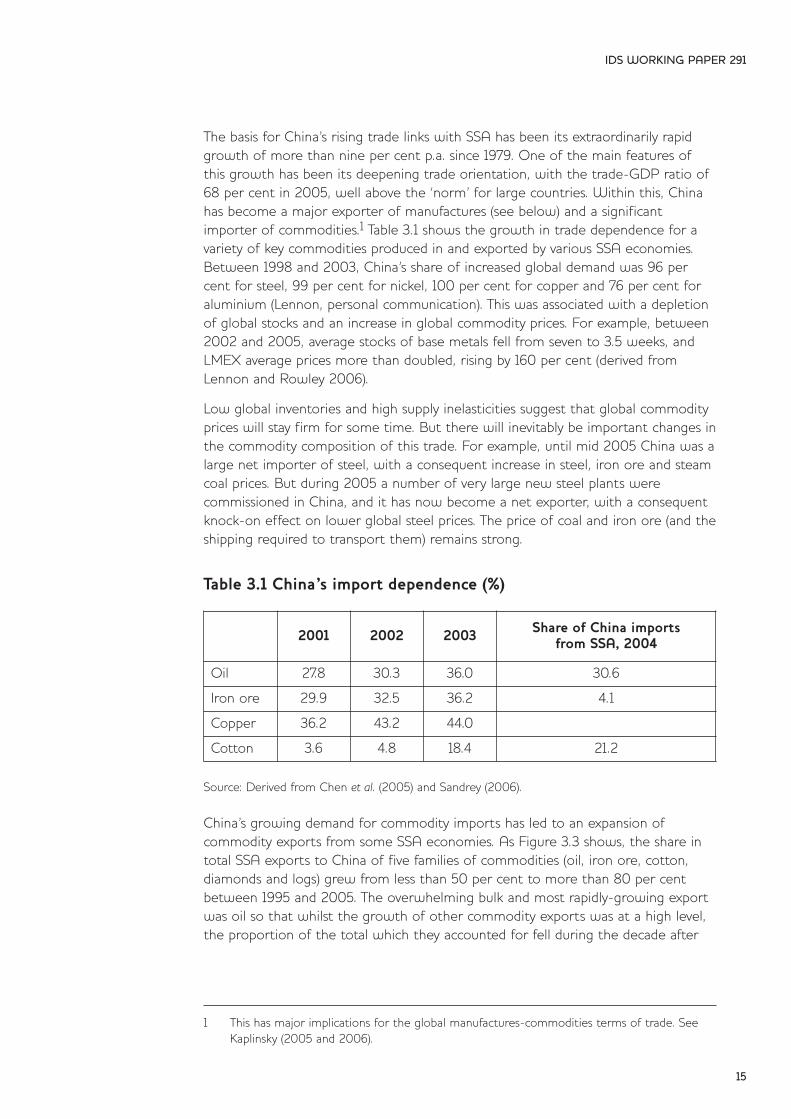
The basis for China’s rising trade links with SSA has been its extraordinarily rapidgrowth of more than nine per cent p.a. since 1979. One of the main features ofthis growth has been its deepening trade orientation, with the trade-GDP ratio of68 per cent in 2005, well above the ‘norm’ for large countries. Within this, Chinahas become a major exporter of manufactures (see below) and a significantimporter of commodities.1 Table 3.1 shows the growth in trade dependence for avariety of key commodities produced in and exported by various SSA economies.Between 1998 and 2003, China’s share of increased global demand was 96 percent for steel, 99 per cent for nickel, 100 per cent for copper and 76 per cent foraluminium (Lennon, personal communication). This was associated with a depletionof global stocks and an increase in global commodity prices. For example, between2002 and 2005, average stocks of base metals fell from seven to 3.5 weeks, andLMEX average prices more than doubled, rising by 160 per cent (derived fromLennon and Rowley 2006).
Low global inventories and high supply inelasticities suggest that global commodityprices will stay firm for some time. But there will inevitably be important changes inthe commodity composition of this trade. For example, until mid 2005 China was alarge net importer of steel, with a consequent increase in steel, iron ore and steamcoal prices. But during 2005 a number of very large new steel plants were commissioned in China, and it has now become a net exporter, with a consequentknock-on effect on lower global steel prices. The price of coal and iron ore (and theshipping required to transport them) remains strong.
Table 3.1 China’s import dependence (%)
Source: Derived from Chen et al. (2005) and Sandrey (2006).
China’s growing demand for commodity imports has led to an expansion ofcommodity exports from some SSA economies. As Figure 3.3 shows, the share intotal SSA exports to China of five families of commodities (oil, iron ore, cotton, diamonds and logs) grew from less than 50 per cent to more than 80 per centbetween 1995 and 2005. The overwhelming bulk and most rapidly-growing exportwas oil so that whilst the growth of other commodity exports was at a high level,the proportion of the total which they accounted for fell during the decade after
IDS WORKING PAPER 291
15
1 This has major implications for the global manufactures-commodities terms of trade. See Kaplinsky (2005 and 2006).
2001 2002 2003 Share of China imports from SSA, 2004
Oil 27.8 30.3 36.0 30.6
Iron ore 29.9 32.5 36.2 4.1
Copper 36.2 43.2 44.0
Cotton 3.6 4.8 18.4 21.2
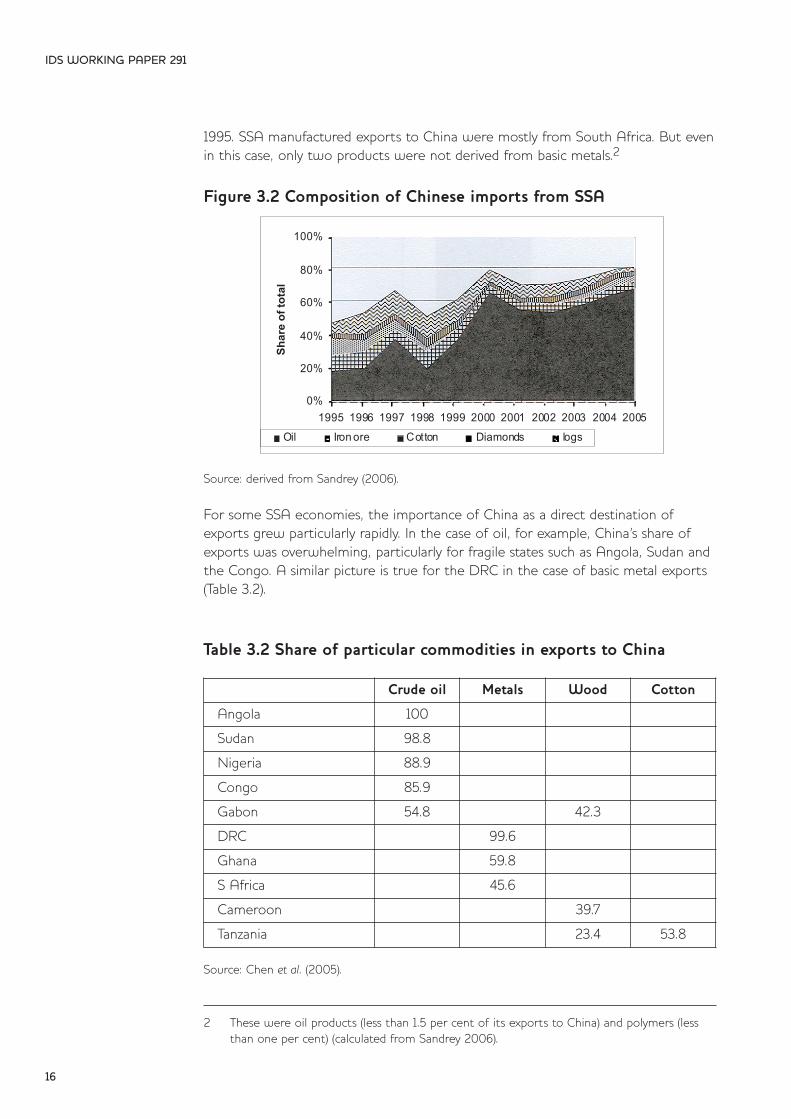
1995. SSA manufactured exports to China were mostly from South Africa. But evenin this case, only two products were not derived from basic metals.2
Figure 3.2 Composition of Chinese imports from SSA
Source: derived from Sandrey (2006).
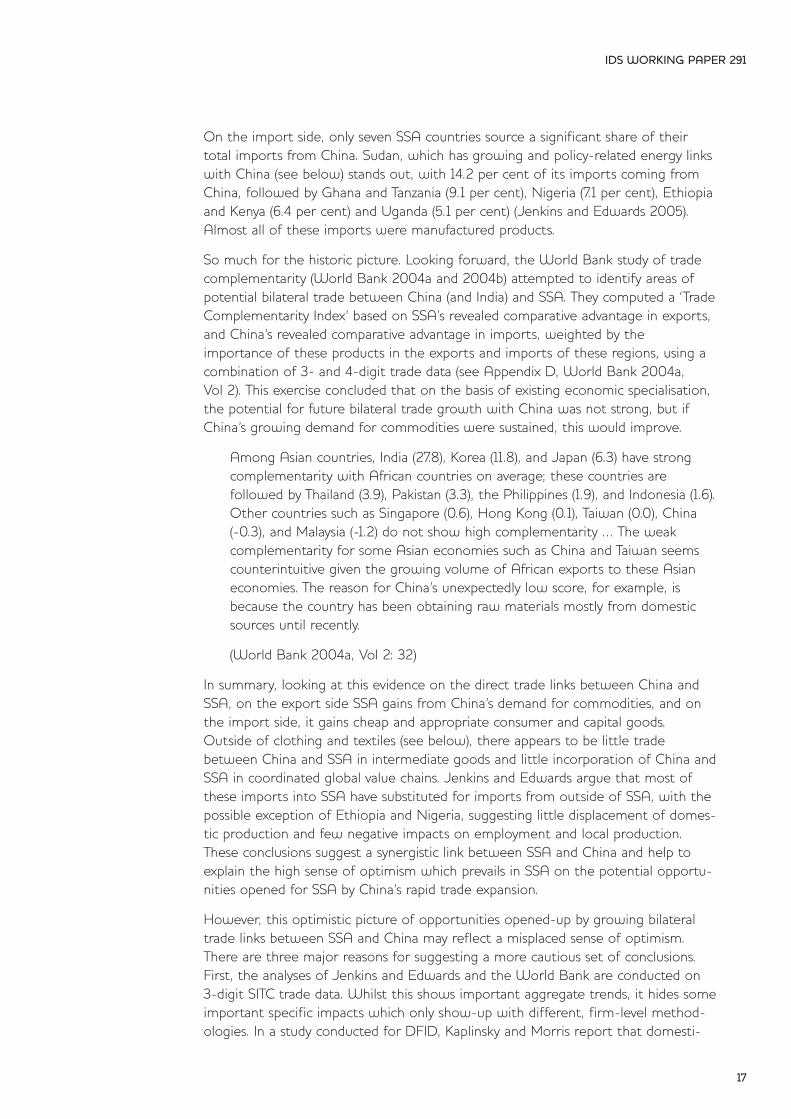
For some SSA economies, the importance of China as a direct destination ofexports grew particularly rapidly. In the case of oil, for example, China’s share ofexports was overwhelming, particularly for fragile states such as Angola, Sudan andthe Congo. A similar picture is true for the DRC in the case of basic metal exports(Table 3.2).
Table 3.2 Share of particular commodities in exports to China
Source: Chen et al. (2005).
IDS WORKING PAPER 291
16
2 These were oil products (less than 1.5 per cent of its exports to China) and polymers (less than one per cent) (calculated from Sandrey 2006).
Crude oil Metals Wood Cotton
Angola 100
Sudan 98.8
Nigeria 88.9
Congo 85.9
Gabon 54.8 42.3
DRC 99.6
Ghana 59.8
S Africa 45.6
Cameroon 39.7
Tanzania 23.4 53.8
0%
20%
40%
60%
80%
100%
1995 1996 1997 1998 1999 2000 2001 2002 2003 2004 2005
Shar
eof
tota
l
Oil Iron ore Cotton Diamonds logs
On the import side, only seven SSA countries source a significant share of theirtotal imports from China. Sudan, which has growing and policy-related energy linkswith China (see below) stands out, with 14.2 per cent of its imports coming fromChina, followed by Ghana and Tanzania (9.1 per cent), Nigeria (7.1 per cent), Ethiopiaand Kenya (6.4 per cent) and Uganda (5.1 per cent) (Jenkins and Edwards 2005).Almost all of these imports were manufactured products.
So much for the historic picture. Looking forward, the World Bank study of tradecomplementarity (World Bank 2004a and 2004b) attempted to identify areas ofpotential bilateral trade between China (and India) and SSA. They computed a ‘TradeComplementarity Index’ based on SSA’s revealed comparative advantage in exports,and China’s revealed comparative advantage in imports, weighted by the importance of these products in the exports and imports of these regions, using acombination of 3- and 4-digit trade data (see Appendix D, World Bank 2004a, Vol 2). This exercise concluded that on the basis of existing economic specialisation,the potential for future bilateral trade growth with China was not strong, but ifChina’s growing demand for commodities were sustained, this would improve.
Among Asian countries, India (27.8), Korea (11.8), and Japan (6.3) have strongcomplementarity with African countries on average; these countries are followed by Thailand (3.9), Pakistan (3.3), the Philippines (1.9), and Indonesia (1.6).Other countries such as Singapore (0.6), Hong Kong (0.1), Taiwan (0.0), China (-0.3), and Malaysia (-1.2) do not show high complementarity … The weak complementarity for some Asian economies such as China and Taiwan seemscounterintuitive given the growing volume of African exports to these Asianeconomies. The reason for China’s unexpectedly low score, for example, isbecause the country has been obtaining raw materials mostly from domesticsources until recently.
(World Bank 2004a, Vol 2: 32)
In summary, looking at this evidence on the direct trade links between China andSSA, on the export side SSA gains from China’s demand for commodities, and onthe import side, it gains cheap and appropriate consumer and capital goods.Outside of clothing and textiles (see below), there appears to be little tradebetween China and SSA in intermediate goods and little incorporation of China andSSA in coordinated global value chains. Jenkins and Edwards argue that most ofthese imports into SSA have substituted for imports from outside of SSA, with thepossible exception of Ethiopia and Nigeria, suggesting little displacement of domes-tic production and few negative impacts on employment and local production.These conclusions suggest a synergistic link between SSA and China and help toexplain the high sense of optimism which prevails in SSA on the potential opportu-nities opened for SSA by China’s rapid trade expansion.
However, this optimistic picture of opportunities opened-up by growing bilateraltrade links between SSA and China may reflect a misplaced sense of optimism.There are three major reasons for suggesting a more cautious set of conclusions.First, the analyses of Jenkins and Edwards and the World Bank are conducted on3-digit SITC trade data. Whilst this shows important aggregate trends, it hides someimportant specific impacts which only show-up with different, firm-level method-ologies. In a study conducted for DFID, Kaplinsky and Morris report that domesti-
IDS WORKING PAPER 291
17
cally produced clothing and furniture manufactures in both Ghana and South Africaare being displaced by imports from China (Kaplinsky and Morris 2006a). Similaranecdotal evidence can be found with regard to clothing and footwear manu-facture in many SSA economies. For example, in Zambia the trades unions assertthat imports of Chinese clothes have undermined the clothing and electrical sector,and in Nigeria trade unions blame Chinese imports for the loss of 350,000 jobs(www.nzherald.co.nz/). In Ethiopia, although competition from Chinese shoeimports has led to an upgrading of processes and design by many domestic firms, ithas simultaneously had a negative impact on employment and domestic output. Astudy of 96 micro-, small and medium domestic producers reported that as a consequence of Chinese competition, 28 per cent were forced into bankruptcy, and32 per cent downsized activity. The average size of microenterprises fell from 7 to4.8 employees, and of SMEs, from 41 to 17 (Egziabher 2006).
However, damaging though these impacts might be, it is not so much the displace-ment of existing producers which is an outcome of China’s growing exports toSSA, but in relation to future production. Here, particularly in the case of light consumer goods – the bulk of Chinese exports to SSA – there are important andadverse long-term implications for SSA industrialisation (Kaplinsky and Morris2006b). What ‘spaces’ will they be able to move into as their economies grow andthey seek to diversify?
However, the third and by far the most important indicator of caution arises inregard to the indirect impact of China’s trade with SSA. That is, it is not so much inthe growth of direct bilateral economic trade links that we must look to forimpact, but on the indirect links. Both China and SSA trade in global markets. ButChina’s trade footprint is so large that it is in itself altering global prices, and thishas significant impacts on SSA. The problem is that these indirect trade impacts aremuch more difficult to analyse than the direct impact, which is why almost all ofthe analysis so far has been on the growth and impact of direct trade links.
3.1.2 Assessing the impact of indirect trade links
A number of attempts have been made to assess the impact of indirect trade links.Using a high level of data disaggregation (HS 8-digit) Kaplinsky and Santos Paulinoshow that the greater China’s participation in trade with the EU, the more likelyproduct prices are to fall, and that this impact is greatest with regard to the products exported into the EU by low-income economies (Kaplinsky and SantosPaulino 2006). The major product of relevance to SSA was the export of clothinginto the EU by Mauritius, Madagascar and South Africa.
Jenkins and Edwards estimate the significance of indirect trade links by computingExport Similarity Indices, utilising 3-digit SITC trade data. They conclude from thisthat there is little evidence of widespread competition in global markets for manu-factured products. However, they caution their results by noting that they are usinga high level of data aggregation. For example, by illustration, at 3-digits Botswanaand India export the same products – diamonds – and may seem to be in comp-etition with each other. But whilst Botswana exports raw diamonds, India usesthese raw diamonds and exports cut-diamonds. In this case, rather than competi-tion between Botswana and India, the relationship is one of complementarity. Thus,
IDS WORKING PAPER 291
18
at a high 3-digit level of aggregation the data is unable to distinguish adequatelybetween inter- and intra-industry effects.
Stevens and Kennan (2006) adopt an innovative approach, again utilising trade data,but at a much higher level of disaggregation (6-digit HS classifications). They beginin similar vein to the World Bank’s Trade Complementarity Index by identifyingproducts which were significant and rapidly-growing export and import items forChina and were in turn relatively intensively traded by developing countries. Thisyields seven major imports into China (animal feeds, chemicals and five comm-odities), and eight major Chinese exports (ferrous metals, aluminium and six manufactures). In each case they identify major SSA exporters and importers. Theydetermine beneficiary countries as those which export a product which Chinaimports (a growing market opportunity) or import a product which China exports(falling prices of more appropriate products). The losers are those economies whichexport products which China exports (export competition and falling prices) orimport products which China imports (rising prices).
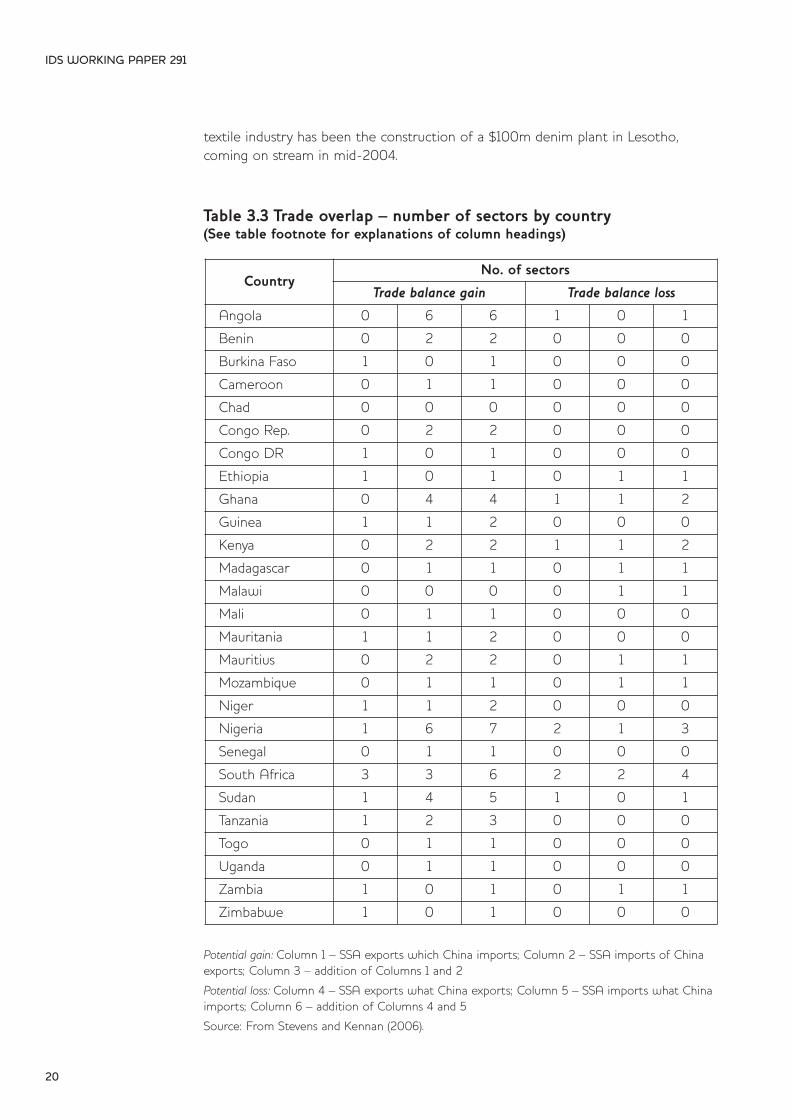
Using this methodology, it would seem that more SSA economies gain in moresectors than those who lose (Table 3.3). Most of the gains are experienced by countries which import a product which China exports (column 2 in Table 3.3),although some also gain as exporters of products which China imports (column 1).A few SSA countries lose by competing in global markets where China is anexporter (column 4), and a smaller number of countries who lose by importingproducts which China imports from the world (column 5).
3.1.2.1 Assessing the indirect trade links in the clothing and textile sectors
Although insightful, this analysis of indirect trade effects remains at a relatively highlevel of trade aggregation (6-digits) and masks the severity of China’s negative indirect impact of SSA manufacturing exports. This only emerges from moredetailed sectoral analyses. By far the most significant manufactured export fromSSA in recent years has been in the clothing and textile sector, largely as a result ofUS AGOA preferences. Table 3.4 shows not just significant export growth, butgrowing reliance on the US market. For some SSA economies, these rapidly-growing exports have become especially significant. In 2002 clothing and textileexports accounted for 50 per cent of Lesotho’s GDP. In Kenya, in 2004 employ-ment in the clothing EPZ enterprises was equivalent to 20 per cent of formal sector manufacturing employment.
The primary driver for these growing clothing and textile exports has been tradepreferences in general and the US AGOA preference scheme in particularHowever, within AGOA, there has been a key derogation on the rules of originwhich allows SSA exporters to import inputs from outside of the AGOA region orthe US. (Mauritius and South Africa, which do not qualify as least developed countries, do not qualify for this derogation, although Mauritius was provided witha one-year derogation between 2004–2005). This derogation was initially limitedto September 2004, then extended to September 2007, and has now been furtherextended to 2012. The intent of the original rules of origin was to encourage backward integration into the textile sector. However, the consequence of applyingthe derogation has been that, the only significant case of the development of a
IDS WORKING PAPER 291
19
textile industry has been the construction of a $100m denim plant in Lesotho, coming on stream in mid-2004.
Table 3.3 Trade overlap – number of sectors by country(See table footnote for explanations of column headings)
Potential gain: Column 1 – SSA exports which China imports; Column 2 – SSA imports of Chinaexports; Column 3 – addition of Columns 1 and 2
Potential loss: Column 4 – SSA exports what China exports; Column 5 – SSA imports what Chinaimports; Column 6 – addition of Columns 4 and 5
Source: From Stevens and Kennan (2006).
IDS WORKING PAPER 291
20
CountryNo. of sectors
Trade balance gain Trade balance loss
Angola 0 6 6 1 0 1
Benin 0 2 2 0 0 0
Burkina Faso 1 0 1 0 0 0
Cameroon 0 1 1 0 0 0
Chad 0 0 0 0 0 0
Congo Rep. 0 2 2 0 0 0
Congo DR 1 0 1 0 0 0
Ethiopia 1 0 1 0 1 1
Ghana 0 4 4 1 1 2
Guinea 1 1 2 0 0 0
Kenya 0 2 2 1 1 2
Madagascar 0 1 1 0 1 1
Malawi 0 0 0 0 1 1
Mali 0 1 1 0 0 0
Mauritania 1 1 2 0 0 0
Mauritius 0 2 2 0 1 1
Mozambique 0 1 1 0 1 1
Niger 1 1 2 0 0 0
Nigeria 1 6 7 2 1 3
Senegal 0 1 1 0 0 0
South Africa 3 3 6 2 2 4
Sudan 1 4 5 1 0 1
Tanzania 1 2 3 0 0 0
Togo 0 1 1 0 0 0
Uganda 0 1 1 0 0 0
Zambia 1 0 1 0 1 1
Zimbabwe 1 0 1 0 0 0
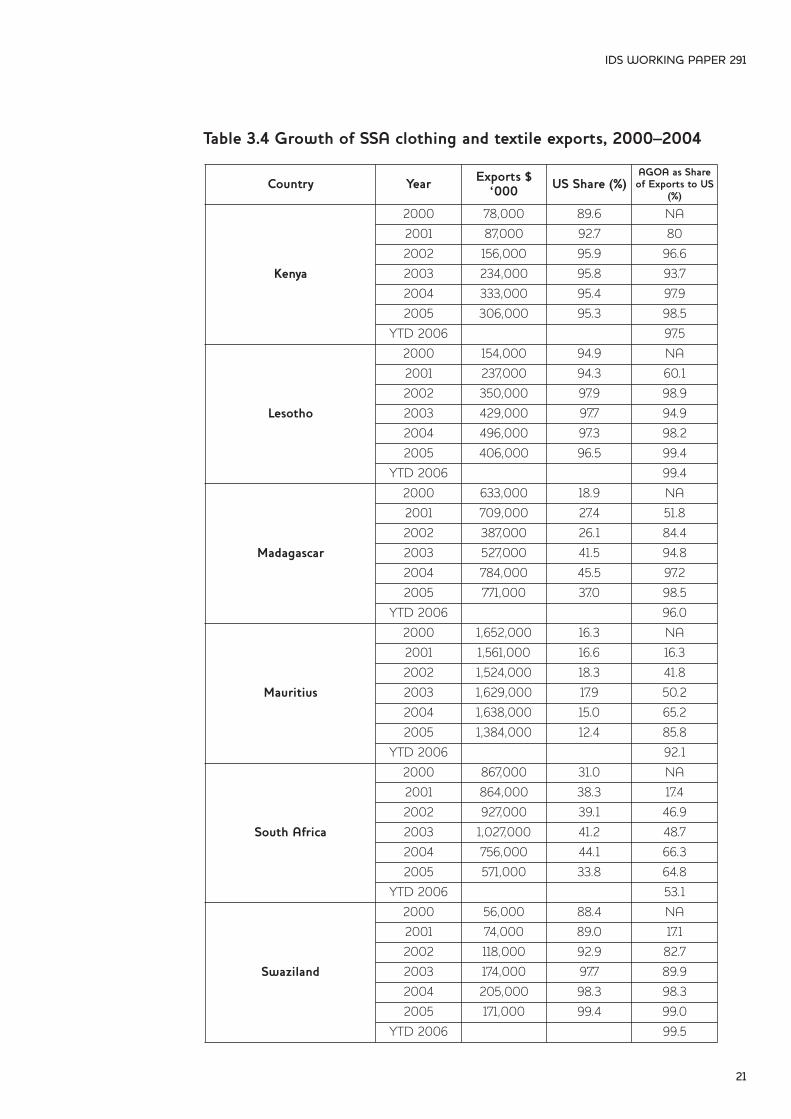
Table 3.4 Growth of SSA clothing and textile exports, 2000–2004
IDS WORKING PAPER 291
21
Country Year Exports $‘000 US Share (%)
AGOA as Shareof Exports to US
(%)
Kenya
2000 78,000 89.6 NA
2001 87,000 92.7 80
2002 156,000 95.9 96.6
2003 234,000 95.8 93.7
2004 333,000 95.4 97.9
2005 306,000 95.3 98.5
YTD 2006 97.5
Lesotho
2000 154,000 94.9 NA
2001 237,000 94.3 60.1
2002 350,000 97.9 98.9
2003 429,000 97.7 94.9
2004 496,000 97.3 98.2
2005 406,000 96.5 99.4
YTD 2006 99.4
Madagascar
2000 633,000 18.9 NA
2001 709,000 27.4 51.8
2002 387,000 26.1 84.4
2003 527,000 41.5 94.8
2004 784,000 45.5 97.2
2005 771,000 37.0 98.5
YTD 2006 96.0
Mauritius
2000 1,652,000 16.3 NA
2001 1,561,000 16.6 16.3
2002 1,524,000 18.3 41.8
2003 1,629,000 17.9 50.2
2004 1,638,000 15.0 65.2
2005 1,384,000 12.4 85.8
YTD 2006 92.1
South Africa
2000 867,000 31.0 NA
2001 864,000 38.3 17.4
2002 927,000 39.1 46.9
2003 1,027,000 41.2 48.7
2004 756,000 44.1 66.3
2005 571,000 33.8 64.8
YTD 2006 53.1
Swaziland
2000 56,000 88.4 NA
2001 74,000 89.0 17.1
2002 118,000 92.9 82.7
2003 174,000 97.7 89.9
2004 205,000 98.3 98.3
2005 171,000 99.4 99.0
YTD 2006 99.5
In assessing the outcome of the two years of quota removal on these six SSAclothing and textile exporters, we concentrate on the clothing sector since with theexception of South Africa, there are negligible direct exports of textiles to the US.In each case we compare export volumes and market shares for all exports.However, since a key to market developments lies in unit price behaviour, we alsoanalyse unit prices at the highest level of trade disaggregation (10-digit HS productcategories).
As can be seen from Table 3.5 and Figure 3.3, the major trends were that:
l The value of SSA clothing exports to the US dropped by 25 per cent between 2004 and 2006 (January–November for both years). This masked differential country performance. Lesotho experienced a fall in export value of 15 per cent, most of which occurred in 2005; its exports stabilised in 2006. Madagascar, fared worse (a decline of 24 per cent), as did Swaziland (22 per cent). Kenya saw largely unchanged exports (a fall of only three per cent). The biggest casualties were South Africa (a decline of 54 per cent) and Mauritius (a decline of 62 per cent). Significantly neither of these latter two economies were able to utilise the 3rd country fabric derogation.
l By contrast, in the same period, the value of China’s clothing and textile exports to the US increased by 82 per cent. In the major products exported to the US by AGOA, the value of Chinese exports rose by 161 per cent (the aggregate export values are for 2004–2006; the changes in unit values are for2004–2005).3
l Unit prices on average remained reasonably stable in key product groupings forindividual SSA countries, with Madagascar experiencing the sharpest decline (10per cent). In contrast, in the same product groupings, the unit value of Chinese exports almost halved. (However, it is not clear to what extent this was due to a reduction in the unit prices of individual products, or China’s entry into producing lower-end products within each of these 10-digit product classifications.)
l In general AGOA economies performed less badly in their major exported items than they did in aggregate, suggesting a process of specialisation. However, alarmingly, in general China’s export growth and the rate of price decline in these AGOA-populated sectors were greater than for its overall textile and clothing exports, suggesting potentially heightened competition forSSA products in the future.
l There has been significant churn as exporting firms in SSA have struggled with competition. For example, seven of the 10 largest product items (10-digit classification) exported from AGOA between January–November 2006 were not exported to the US in the same period in 2005, and only six of the ten major exported items in 2005 were exported in 2006.
IDS WORKING PAPER 291
22
3 Because of the degree in churn in exported products (see accompanying text below) it was not feasible to compare unit price performance over the 2004–2006 period.
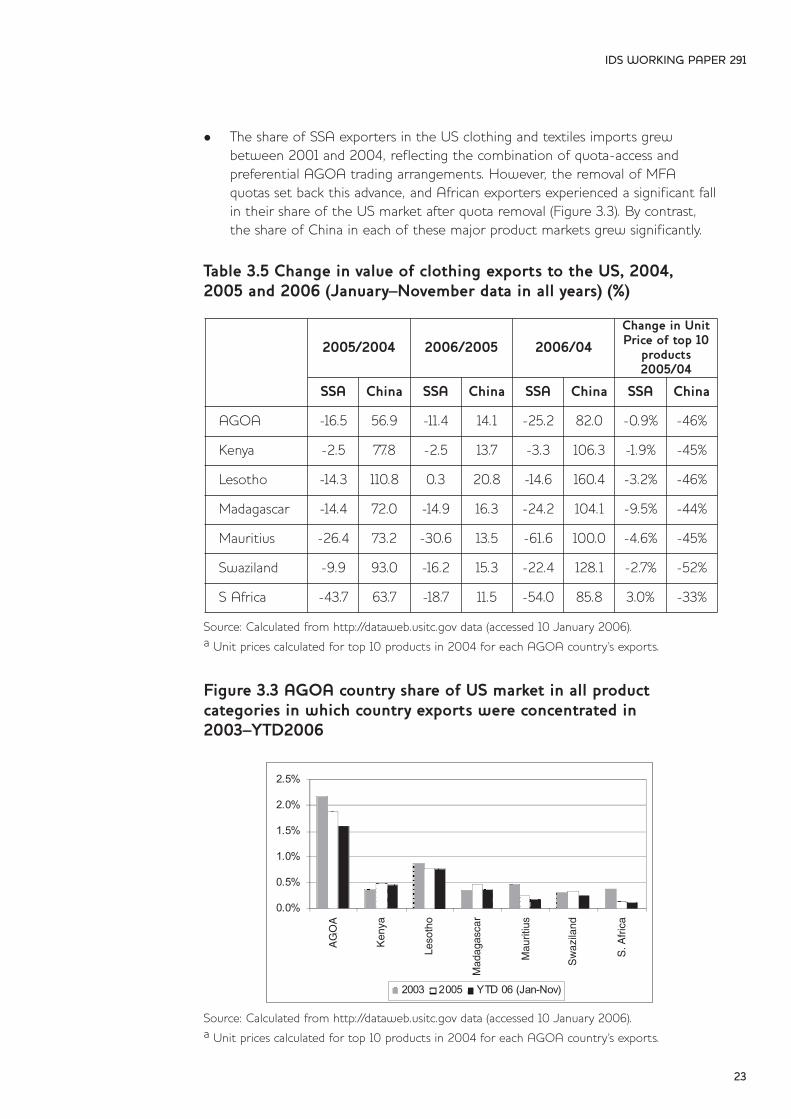
l The share of SSA exporters in the US clothing and textiles imports grew between 2001 and 2004, reflecting the combination of quota-access and preferential AGOA trading arrangements. However, the removal of MFA quotas set back this advance, and African exporters experienced a significant fallin their share of the US market after quota removal (Figure 3.3). By contrast, the share of China in each of these major product markets grew significantly.
Table 3.5 Change in value of clothing exports to the US, 2004,2005 and 2006 (January–November data in all years) (%)
Source: Calculated from http://dataweb.usitc.gov data (accessed 10 January 2006).a Unit prices calculated for top 10 products in 2004 for each AGOA country’s exports.
Figure 3.3 AGOA country share of US market in all product categories in which country exports were concentrated in2003–YTD2006
Source: Calculated from http://dataweb.usitc.gov data (accessed 10 January 2006).a Unit prices calculated for top 10 products in 2004 for each AGOA country’s exports.
IDS WORKING PAPER 291
23
2005/2004 2006/2005 2006/04
Change in UnitPrice of top 10
products2005/04
SSA China SSA China SSA China SSA China
AGOA -16.5 56.9 -11.4 14.1 -25.2 82.0 -0.9% -46%
Kenya -2.5 77.8 -2.5 13.7 -3.3 106.3 -1.9% -45%
Lesotho -14.3 110.8 0.3 20.8 -14.6 160.4 -3.2% -46%
Madagascar -14.4 72.0 -14.9 16.3 -24.2 104.1 -9.5% -44%
Mauritius -26.4 73.2 -30.6 13.5 -61.6 100.0 -4.6% -45%
Swaziland -9.9 93.0 -16.2 15.3 -22.4 128.1 -2.7% -52%
S Africa -43.7 63.7 -18.7 11.5 -54.0 85.8 3.0% -33%
0.0%
0.5%
1.0%
1.5%
2.0%
2.5%
AGOAKen
ya
Leso
tho
Madag
asca
r
Mauriti
us
Swazila
nd
SAfric
a
2003 2005 YTD 06 (Jan-Nov)
AG
OA
Ken
ya
Leso
tho
Mad
agas
car
Sw
azila
nd
S.A
fric
a
Mau
ritiu
s
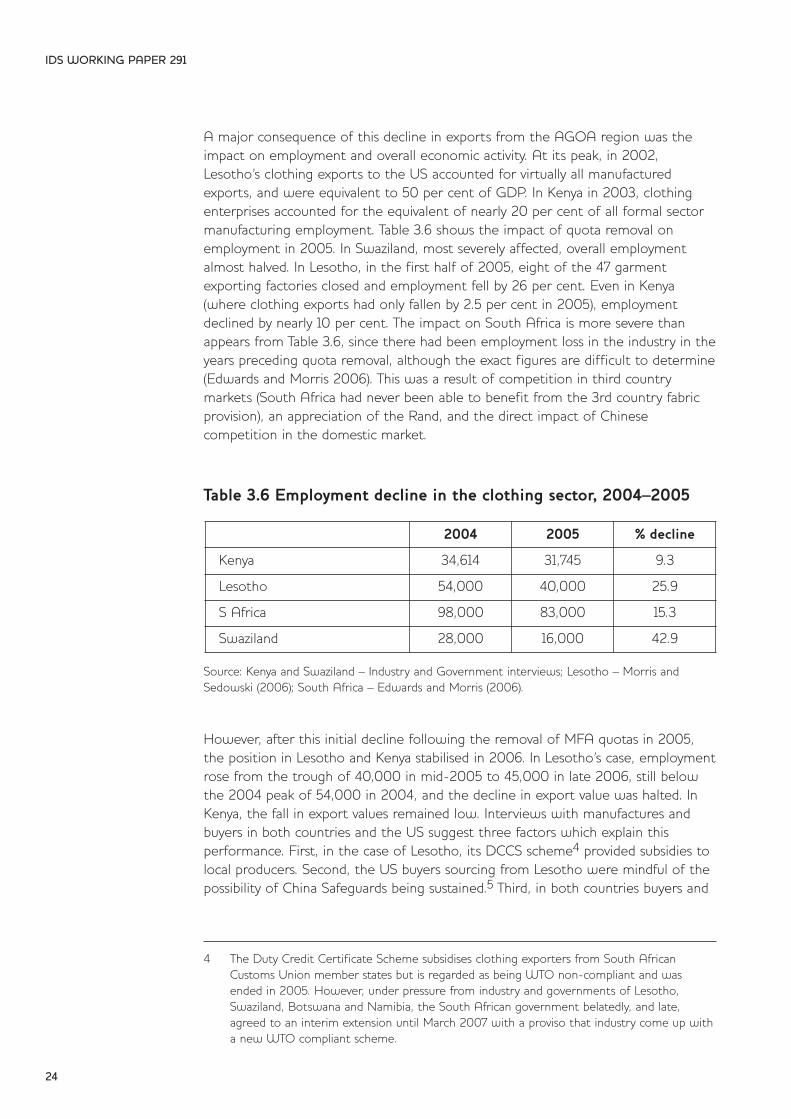
A major consequence of this decline in exports from the AGOA region was theimpact on employment and overall economic activity. At its peak, in 2002,Lesotho’s clothing exports to the US accounted for virtually all manufacturedexports, and were equivalent to 50 per cent of GDP. In Kenya in 2003, clothingenterprises accounted for the equivalent of nearly 20 per cent of all formal sectormanufacturing employment. Table 3.6 shows the impact of quota removal onemployment in 2005. In Swaziland, most severely affected, overall employmentalmost halved. In Lesotho, in the first half of 2005, eight of the 47 garmentexporting factories closed and employment fell by 26 per cent. Even in Kenya(where clothing exports had only fallen by 2.5 per cent in 2005), employmentdeclined by nearly 10 per cent. The impact on South Africa is more severe thanappears from Table 3.6, since there had been employment loss in the industry in theyears preceding quota removal, although the exact figures are difficult to determine(Edwards and Morris 2006). This was a result of competition in third country markets (South Africa had never been able to benefit from the 3rd country fabricprovision), an appreciation of the Rand, and the direct impact of Chinese competition in the domestic market.
Table 3.6 Employment decline in the clothing sector, 2004–2005
Source: Kenya and Swaziland – Industry and Government interviews; Lesotho – Morris andSedowski (2006); South Africa – Edwards and Morris (2006).
However, after this initial decline following the removal of MFA quotas in 2005,the position in Lesotho and Kenya stabilised in 2006. In Lesotho’s case, employmentrose from the trough of 40,000 in mid-2005 to 45,000 in late 2006, still belowthe 2004 peak of 54,000 in 2004, and the decline in export value was halted. InKenya, the fall in export values remained low. Interviews with manufactures andbuyers in both countries and the US suggest three factors which explain this performance. First, in the case of Lesotho, its DCCS scheme4 provided subsidies tolocal producers. Second, the US buyers sourcing from Lesotho were mindful of thepossibility of China Safeguards being sustained.5 Third, in both countries buyers and
IDS WORKING PAPER 291
24
4 The Duty Credit Certificate Scheme subsidises clothing exporters from South African Customs Union member states but is regarded as being WTO non-compliant and was ended in 2005. However, under pressure from industry and governments of Lesotho, Swaziland, Botswana and Namibia, the South African government belatedly, and late, agreed to an interim extension until March 2007 with a proviso that industry come up witha new WTO compliant scheme.
2004 2005 % decline
Kenya 34,614 31,745 9.3
Lesotho 54,000 40,000 25.9
S Africa 98,000 83,000 15.3
Swaziland 28,000 16,000 42.9
producers had the expectation that the 3rd country sourcing provision (which hadbeen due to expire in September 2005), would be maintained (as we shall seebelow, this was broadly correct). And, finally, in the case of Kenya, its currency didnot appreciate relative to the US$. (We will return to the significance of thesefindings in Section 4.)
Why did the other AGOA exporters not experience a similar stabilisation in 2006?Neither South Africa nor Mauritius was able to benefit from the 3rd country fabricprovision. Moreover, South African producers experienced a rising exchange rateand suffered more than most from a breakdown in extending the DCCS. In thecase of Swaziland, notwithstanding a decline in products destined for the US market, 2006 showed a stabilisation of exports as a number of South African firmsrelocated and ‘exported’ into the South African domestic market. The stabilisationof exports in 2006 is not reflected in the data because it is intra SACU trade andappears as an increase in clothes for the domestic market. Moreover, Swaziland didnot benefit from an efficient policy infrastructure which has distinguished Lesotho’sresponse to the crisis. Finally, in the case of Madagascar, two factors led to a diversion of exports away from the USA and into other markets. Firstly many ofthe principals in the clothing sector were of Mauritian or European origin, and theyhad made the strategic decision to focus on the EU market (witness the relativelylow share of the US in Madagascar’s exports in Table 3.4 above).6 Secondly, in 2005the Madagascan producers began to supply the rapidly expanding South Africanmarket.
A similar story can be told for the resource-intensive and labour-intensive furnituresector (Kaplinsky and Morris 2006a). SSA’s share of global furniture trade has fallensince the mid-1990s from more than 1 per cent to less than 1 per cent, and nowlargely comprises of exports from SSA. But South African furniture exports arefalling rapidly, and firm-level research shows direct competitive impacts fromChinese (and Vietnamese and Indonesian) producers in global markets (Table 3.7).
IDS WORKING PAPER 291
25
5 The Chinese accession agreement to the WTO, allows for safeguard tariffs and quotas to beapplied solely against Chinese textiles and clothing, even when imports exert only a slight adverse impact on the domestic industry. In June 2005, the EU and China reached an agreement that limited 10 categories of Chinese textiles exports to the EU to between 8 and 12.5 per cent growth above a specified base period for the next three years. In December 2005, the US and Chinese trade representatives agreed to a three-yearagreement reducing US imports of Chinese textile and apparel products in all or parts of 34sensitive categories.
6 Unlike China which faces duties in exporting clothing into the EU (generally in excess of 12 per cent, but varying with the product), SSA exporters into the EU benefit from zero-tariffentry.
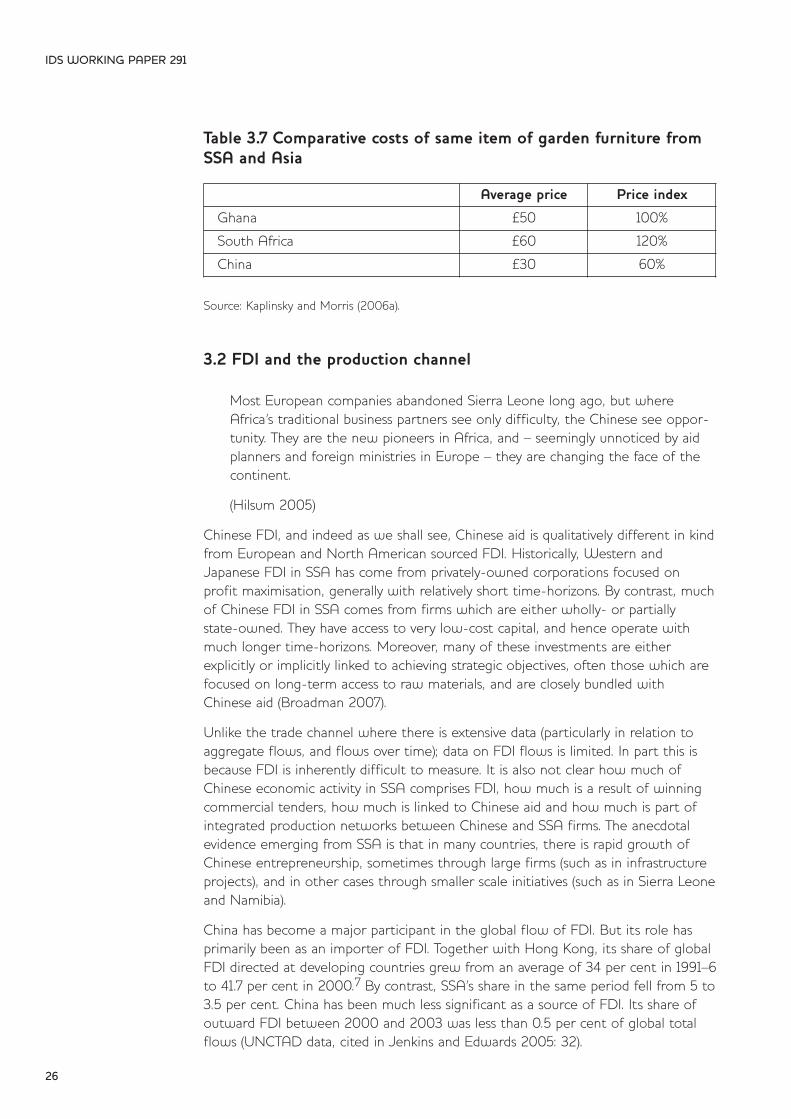
Table 3.7 Comparative costs of same item of garden furniture fromSSA and Asia
Source: Kaplinsky and Morris (2006a).
3.2 FDI and the production channel
Most European companies abandoned Sierra Leone long ago, but whereAfrica’s traditional business partners see only difficulty, the Chinese see oppor-tunity. They are the new pioneers in Africa, and – seemingly unnoticed by aidplanners and foreign ministries in Europe – they are changing the face of thecontinent.
(Hilsum 2005)
Chinese FDI, and indeed as we shall see, Chinese aid is qualitatively different in kindfrom European and North American sourced FDI. Historically, Western andJapanese FDI in SSA has come from privately-owned corporations focused on profit maximisation, generally with relatively short time-horizons. By contrast, muchof Chinese FDI in SSA comes from firms which are either wholly- or partially state-owned. They have access to very low-cost capital, and hence operate withmuch longer time-horizons. Moreover, many of these investments are eitherexplicitly or implicitly linked to achieving strategic objectives, often those which arefocused on long-term access to raw materials, and are closely bundled withChinese aid (Broadman 2007).
Unlike the trade channel where there is extensive data (particularly in relation toaggregate flows, and flows over time); data on FDI flows is limited. In part this isbecause FDI is inherently difficult to measure. It is also not clear how much ofChinese economic activity in SSA comprises FDI, how much is a result of winningcommercial tenders, how much is linked to Chinese aid and how much is part ofintegrated production networks between Chinese and SSA firms. The anecdotalevidence emerging from SSA is that in many countries, there is rapid growth ofChinese entrepreneurship, sometimes through large firms (such as in infrastructureprojects), and in other cases through smaller scale initiatives (such as in Sierra Leoneand Namibia).
China has become a major participant in the global flow of FDI. But its role hasprimarily been as an importer of FDI. Together with Hong Kong, its share of globalFDI directed at developing countries grew from an average of 34 per cent in 1991–6to 41.7 per cent in 2000.7 By contrast, SSA’s share in the same period fell from 5 to3.5 per cent. China has been much less significant as a source of FDI. Its share ofoutward FDI between 2000 and 2003 was less than 0.5 per cent of global totalflows (UNCTAD data, cited in Jenkins and Edwards 2005: 32).
IDS WORKING PAPER 291
26
Average price Price index
Ghana £50 100%
South Africa £60 120%
China £30 60%
There has been a rapid growth in the flow of Chinese FDI, following the govern-ment’s ‘go global’ strategy initiated in 2001 and directed at the corporate sector.FDI in SSA reached a total of $1bn by mid-2005, up by $125m in the first sixmonths of 2005 alone (World Bank 2004a for all data in this paragraph). For manyfirms, SSA is an important proving ground. As a Chinese hotel manager in SierraLeone observed, ‘Africa is a good environment for Chinese investment, because it’snot too competitive,’ (Hilsum 2005). However, notwithstanding this drive to out-ward FDI, the official number of investments recorded by the Chinese Ministry ofCommerce remains small – less than 50 investments p.a. between 1998 and 2002.By comparison with that from other Asian economies, Chinese FDI also tends tobe relatively small-scale, with an average size of less than $3m between 1998 and2002. However, after 1998 the flow of Chinese FDI increased dramatically, exceed-ing the value of flows from Japan. Prior to the large Chinese investments in theenergy sector in SSA in recent years, most of this FDI was directed to South Africa(manufacturing) and Zambia (copper).
The pattern of recent Chinese involvement in production in SSA, including throughFDI, can be characterised by four major trends:
l Increasing investments in the energy and resource sectors;
l Participation in infrastructural projects;
l Participation in global production networks;
l Small scale entrepreneurial investments.
3.2.1 Investments in the energy and resource sectors
In recent years, Chinese energy companies have become increasingly prominent asinvestors in Africa. The Chinese National Petroleum Corporation (CNPC) is heavilyinvolved in Sudan where it is engaged in a joint venture with the SudanGovernment, Petronas (Malaysia) and the Talisman Energy (Canada). It has a 40 percent share in the $1.7bn Greater Nile Petroleum Operating Company, an equivalentshare in a new project in Darfur and in the Melut Basin. It is a big investor inNigeria where it received access to exploration sites as part of a package whichincluded the construction of a 1,000 megawatt hydroelectric plant in Mambila. Inalso has a controlling share of a refinery in Kaduna. A second Chinese energy company, Sinopec, is an investor in the Sudan, Gabon and Angola.
Chinese investments in the mining sector, primarily in copper in Zambia, haveexceeded $160m and Chinese firms are beginning to invest also in cobalt and cop-per mines in the DRC.
IDS WORKING PAPER 291
27
7 Some of this was ‘round-tripping’ FDI – Chinese firms exporting capital to Hong Kong and then taking advantage of government incentives for inward FDI.
3.2.2 Investment in infrastructural projects
Chinese firms have become an increasingly important participant in the construc-tion sector (Centre for Chinese Studies 2006). Many of these firms are state-owned, as in the case of the China Road and Bridge Corporation which wasinvolved in 500 construction projects by 2004. Participation in infrastructure andconstruction projects range from stadiums in West Africa, to Presidential Palaces (inKinshasa), dams (a $650m tender for Nile River Merowe Dam project), roads, rail-ways and government buildings.
Chinese involvement in Mozambique is indicative both of the growing scale ofthese activities and the competitiveness of Chinese firms. (This discussion onMozambique is drawn from Bosten 2006.) Remarkably, it also occurs in an economywhere currently China appears to see no specific strategic interest in resources tofeed the growing appetite of its manufacturing sector. It has singularly failed toinvest in any of the recent investments in the Mozal Aluminium Smelter, SasolNatural Gas, Kenmare Mineral Sands, Moatize Coal Mines and the Corridor SandsTitanium Project. Chinese firms have also not tendered for some large infrastructureprojects such as the Maputo Port Development Project, the Limpopo railway line,the Zambezi Bridge construction (2006–2009), and the rehabilitation of the Senarailway line.
Instead, Chinese firms began by engaging in prominent Chinese aid-related projectssuch as the Mozambique Parliament buildings (1999), the building for the Ministryof Foreign Affairs (2004), the Chissano Conference Centre (2003) and the newmilitary quarter. Each of these projects either involves gift-aid or loans on conces-sional terms, ranging from £5m for the Conference Centre to $12m for the Ministryof Foreign Affairs building. In Namibia, Chinese firms have built aid-related show-pieces such as the Supreme Court and the Police and Prison Training College inWindhoek, a luxury hotel in Walvis Bay and a housing estate in Katimo Mulilo(Dobler 2006).
Very recently, Chinese firms have begun to branch out into a soya processing plant($10m), the production of prawns ($12m), a large shopping centre and industrialwarehousing in Maputo. Perhaps more significantly, Chinese firms have begun tocompete effectively in the rehabilitation of infrastructure, particularly roads, whereChinese firms are involved in the repair of more than 600 kms of Mozambique’sroads (two-thirds of the total being rehabilitated), and the rehabilitation of a largebridge between Mozambique and Tanzania. Chinese firms have also recently wontenders to repair water systems in Maputo ($30m) and Beira and Quelimane ($15m).
This growing participation in construction and infrastructure reflects the competi-tiveness of Chinese firms, which are reported to provide good quality projects at aprice discount of 25 to 50 per cent compared to other foreign investors. It is notclear how this cost-advantage is derived, but preliminary enquiry suggests it arisesfrom a combination of factors which include:
l Lower margins;
l Chinese firms have access to much cheaper capital than local investors;8
IDS WORKING PAPER 291
28
l The almost exclusive employment of low-paid Chinese staff, often apparently living at even lower standards than the Mozambique population, and living in secluded barracks;
l The use of Chinese materials, with very little local sourcing;
l The use of standard designs;
l Less attention to environmental impacts;
l Access to a hard currency premium paid by the Chinese government;
l The Chinese Government provides subsidies to Chinese companies when they establish themselves overseas.
A study of Chinese Construction firms in four SSA economies (Angola, SierraLeone, Tanzania and Zambia) provides some data on the source of the competitive-ness of Chinese construction firms (Centre for Chinese Studies 2006). This arises inpart from the intensive use of Chinese labour. For example, in Angola, Chinese con-struction firms pay Chinese workers around $1 per day, compared to non-Chinesecompanies who pay their Angolan workers $3–4 per day. But it also arises from theuse of cheap inputs sourced largely from China rather than from the local economy.Again, in Angola, cement imported from China costs $4/50kg, compared to $10/kgfor Angolan-made cement. Chinese firms also benefited heavily from low-cost andsometimes subsidised capital, although this was more difficult to evidence.
3.2.3 Incorporation in global production systems
Chinese manufactured exports are more effectively described as ‘East Asian products’, incorporating inputs from surrounding countries (Humphrey and Schmitz2006). In fact China is in trade-deficit in its region. This reflects a process of thegrowing interconnection of production in regional, coordinated value chains, andtrade in increasingly finely-differentiated intermediate products.9
With one exception, there is little evidence that Chinese and SSA firms are inter-connected in these global value chains. The exception is the case of textiles andgarments. As saw in Section 3.1 above, exports of clothing to the US have becomevery significant for six SSA economies, including for four least developed economies– Lesotho, Madagascar, Kenya and Swaziland. The basis for their export successunder the AGOA programme is the specific derogation which gives them theopportunity to incorporate fabric and other inputs sourced from outside the AGOAregion or the USA. This is a temporary derogation which has been extended once
IDS WORKING PAPER 291
29
8 In the case of the clothing and textiles sectors, the cost of capital for Chinese investors (less than 3 per cent) is much lower than for COMESA investors (in the region of 15 per cent) (Manchester Trade Team 2005).
9 This is one reason why the use of aggregate trade data provides little insight into the driversof trade since it fails to distinguish between largely ‘arms-length’ inter-industry trade in complementary products and intra-industry trade in intermediates in coordinated global andregional value chains.
(from September 2005 to 2007), and which is currently the subject of intense lobbying.
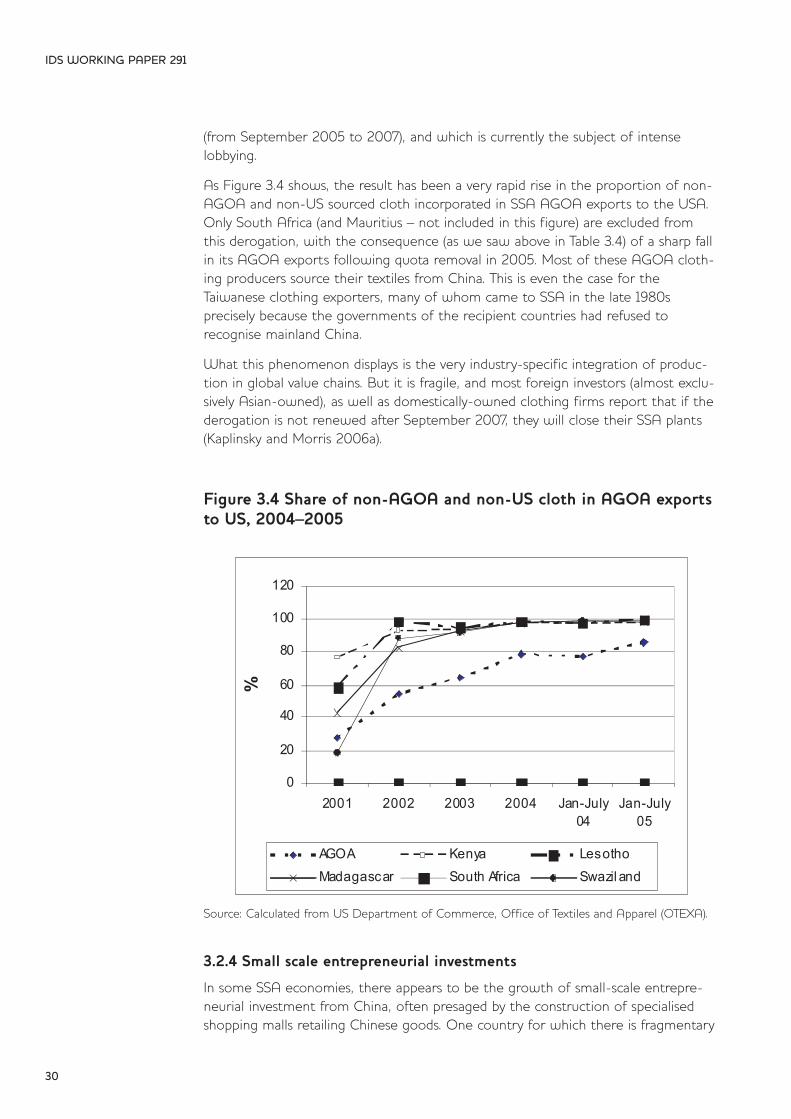
As Figure 3.4 shows, the result has been a very rapid rise in the proportion of non-AGOA and non-US sourced cloth incorporated in SSA AGOA exports to the USA.Only South Africa (and Mauritius – not included in this figure) are excluded fromthis derogation, with the consequence (as we saw above in Table 3.4) of a sharp fallin its AGOA exports following quota removal in 2005. Most of these AGOA cloth-ing producers source their textiles from China. This is even the case for theTaiwanese clothing exporters, many of whom came to SSA in the late 1980s precisely because the governments of the recipient countries had refused to recognise mainland China.
What this phenomenon displays is the very industry-specific integration of produc-tion in global value chains. But it is fragile, and most foreign investors (almost exclu-sively Asian-owned), as well as domestically-owned clothing firms report that if thederogation is not renewed after September 2007, they will close their SSA plants(Kaplinsky and Morris 2006a).
Figure 3.4 Share of non-AGOA and non-US cloth in AGOA exportsto US, 2004–2005
Source: Calculated from US Department of Commerce, Office of Textiles and Apparel (OTEXA).
3.2.4 Small scale entrepreneurial investments
In some SSA economies, there appears to be the growth of small-scale entrepre-neurial investment from China, often presaged by the construction of specialisedshopping malls retailing Chinese goods. One country for which there is fragmentary
IDS WORKING PAPER 291
30
0
20
40
60
80
100
120
2001 2002 2003 2004 Jan-July04
Jan-July05
%
AGOA Kenya LesothoMadagascar South Africa Swazil and
evidence is Sierra Leone. Here, Chinese FDI has become very prominent, particular-ly in a context where more traditional European and US investors have been waryof political risks and are subject to pressures to support good governance. Chineseinvestors appear to be less concerned with these risks and very flexible and rapid intheir responses. The Sierra Leone ambassador to Beijing observed that
The Chinese are doing more than the G8 to make poverty history … If a G8country had wanted to rebuild the stadium, we’d still be holding meetings! TheChinese just come and do it. They don’t hold meetings about environmentalimpact assessment, human rights, bad governance and good governance. I’mnot saying it’s right, just that Chinese investment is succeeding because theydon’t set high benchmarks.
(Hilsum 2005)
Investments in Sierra Leone include a joint venture with the government in anindustrial estate making mattresses, tiles, hair lotions and other light industrial prod-ucts. Unlike other Chinese FDI in SSA’s resource and energy sectors, most of theseinvestments in Sierra Leone are undertaken by small-scale private investors, in thiscase mostly from Hunan Province (Financial Times, 16 March 2005).
An important, and almost certainly significant (albeit poorly evidenced) channel ofChinese presence in SSA is the growing number of Chinese traders to be found inmany SSA economies. A good example of this is the expanding community ofwholesalers in Oshikango, Namibia, a small trading town on the broader withSouthern Angola (Dobler 2006). By 2005 there were between 70 and 120 Chineseworking in 22 shops in this trading complex. They originate from all over China, andhave little in common, even speaking different Chinese dialects. The pioneer in thisregion came to Namibia in 1993, and moved to Oshikango in 1999. Perhapsbecause of his relative longevity, he is the only trader who has diversified into otherregions in Namibia. Oshikango’s Chinese traders mostly import and then re-exportbasic consumer goods such as clothing, textiles, footwear, simple electronicconsumer goods and mattresses. These are sold at a very cheap price – a carton of300 shoes, for example, for $100.10 This phenomenon of small-scale trading is notlimited to Namibia, and similar rapidly-growing trade-linked communities are foundall over SSA. The number of Chinese living in Lusaka is estimated to have increasedfrom 3,000 to 30,000 over the past decade, with an estimated 160,000 Chineseliving in South Africa, many of whom are clustered in a suburb of Johannesburg.
3.2.5 SSA FDI in China
The flow of FDI between SSA and China is not one-way, although most of SSAinvestment in China comes from South Africa. Here a number of large SouthAfrican firms have a growing presence. This includes SABMiller (now the world’ssecond largest brewing company), which has invested more than $400m in China
IDS WORKING PAPER 291
31
10 The invoiced import price for these same products is an astonishingly-low $5, suggesting the possibility of under-invoicing from China, perhaps to fund round-tripping FDI back into China.
since 1994, and has equity in 30 local breweries (Goldstein 2004). Other largeinvestors are SASOL, which is about to join local Chinese investors in two verylarge coal-to-petroleum plants (each at more than $3bn) in the North WestProvince of China, Kumba Resources (part of Anglo American) in the production ofZinc, SAPPI (also owned by Anglo American, in paper), Polifin in chemicals andABSA and NEDCOR in the financial sector.
Aside from these South African investments, there are a few isolated cases of firmswhose origins lay in SSA investing in China. Chandaria Holdings, with its roots inTanzania and subsequently in Kenya, has for example a number of manufacturingplants in China which it sees as the focal point for its new investments in develop-ing countries (Interview with Dr Manu Chandaria, June 2004).
3.3 The aid channel
As in the linked case of FDI, Chinese aid to SSA, of which little is known, appearsto be very closely linked to strategic and political objectives, perhaps even more sothan the aid offered by some European countries and the US. The formal linksbetween China and SSA go back to the Bandung Conference in 1955. Until themid-1990s, much of this aid was directed to Liberation Movements and to furtherthe desire to politically isolate Taiwan. But since the mid 1990s, aid appears to beincreasingly directed towards broader strategic objectives, and in particular to thedevelopment of links with resource-rich SSA economies. In general, Chinese aid isclosely bundled with infrastructural projects, often linked to the extraction andexport of minerals and oil to China.
Chinese aid to SSA can be grouped into six categories. The first is financial assistance for key investments. As of mid-2005, the Chinese government had provided aid to approximately 800 individual projects, including flagship projectssuch as the 1,860 km TAZARA railway linking Zambia and Tanzania in the early1970s (Box 3.1). Linked to this, in recent years, has been a programme of limiteddebt-relief, totalling RMB10.5bn owed by 31 SSA countries. The third form of aidprovided has been a growing training programme (http://english.sina.com/china/1/2006/0107/60908.html, accessed 3 March 2006). China’s African HumanResources Development Fund had provided training in China to 9,400 Africans bythe end of 2004, and a further 3,800 places were planned for each of 2005 and2006. 15,600 scholarships were offered to 52 SSA countries in 2005. Fourth, Chinahas provided technical assistance to SSA – more than 600 teachers and more than15,000 Chinese doctors have worked in 52 SSA countries (including 1,100 at theend of 2004).
Fifth, in an initiative announced at the second ministerial meeting of the Sino-African Cooperation Forum held at the end of 2003, China has instituted a programme of tariff exemption for 25 SSA economies, covering 190 products,including food, textiles, minerals and machinery. The policy took effect at thebeginning of 2005 (People’s Daily, 20 October 2005, www.chinadaily.com.cn,accessed 3 March 2006). These trade references are called for since Chinese tariffson imports from SSA, although generally lower than Indian tariffs, were significant-ly higher than those in other Asian economies. We do not have data on the
IDS WORKING PAPER 291
32
differential tariffs levied by China on imports from SSA compared to tariffs levied by individual SSA countries on imports from China. Finally, China has in very recentyears begun to provide peacekeeping forces to SSA, with 1,500 troops beingdeployed by mid-2006.
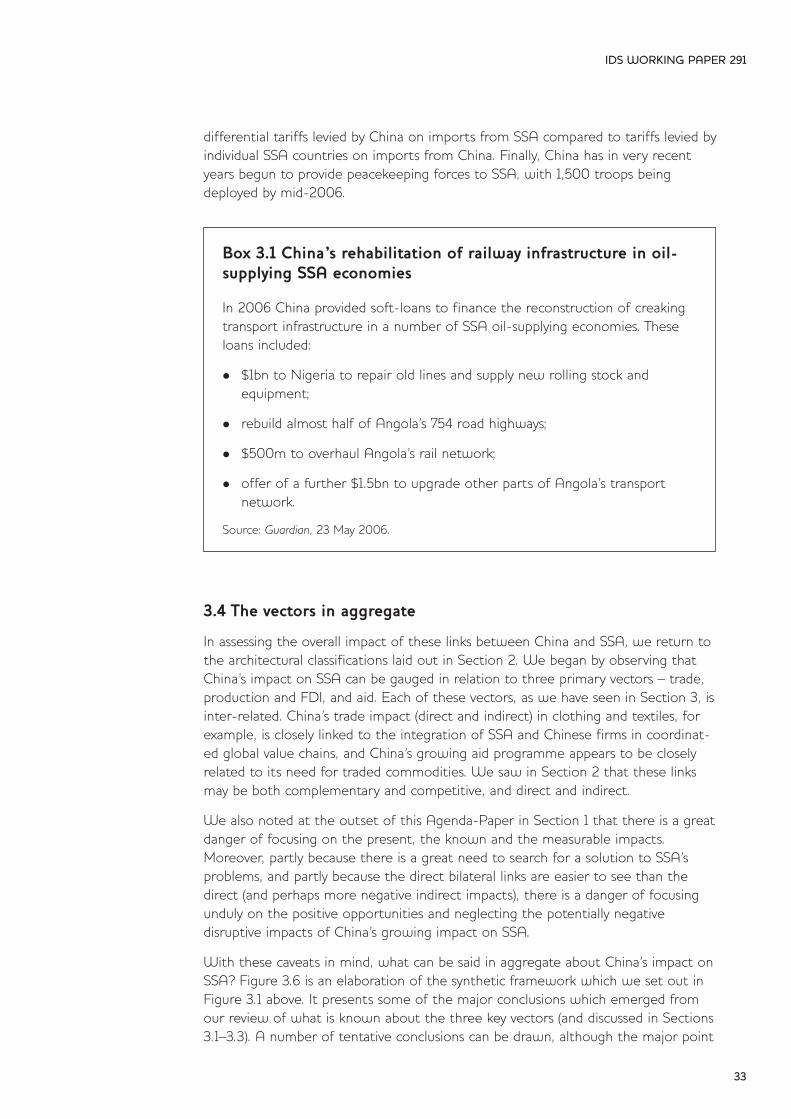
Box 3.1 China’s rehabilitation of railway infrastructure in oil-supplying SSA economies
In 2006 China provided soft-loans to finance the reconstruction of creakingtransport infrastructure in a number of SSA oil-supplying economies. Theseloans included:
l $1bn to Nigeria to repair old lines and supply new rolling stock and equipment;
l rebuild almost half of Angola’s 754 road highways;
l $500m to overhaul Angola’s rail network;
l offer of a further $1.5bn to upgrade other parts of Angola’s transport network.
Source: Guardian, 23 May 2006.
3.4 The vectors in aggregate
In assessing the overall impact of these links between China and SSA, we return tothe architectural classifications laid out in Section 2. We began by observing thatChina’s impact on SSA can be gauged in relation to three primary vectors – trade,production and FDI, and aid. Each of these vectors, as we have seen in Section 3, isinter-related. China’s trade impact (direct and indirect) in clothing and textiles, forexample, is closely linked to the integration of SSA and Chinese firms in coordinat-ed global value chains, and China’s growing aid programme appears to be closelyrelated to its need for traded commodities. We saw in Section 2 that these linksmay be both complementary and competitive, and direct and indirect.
We also noted at the outset of this Agenda-Paper in Section 1 that there is a greatdanger of focusing on the present, the known and the measurable impacts.Moreover, partly because there is a great need to search for a solution to SSA’sproblems, and partly because the direct bilateral links are easier to see than thedirect (and perhaps more negative indirect impacts), there is a danger of focusingunduly on the positive opportunities and neglecting the potentially negative disruptive impacts of China’s growing impact on SSA.
With these caveats in mind, what can be said in aggregate about China’s impact onSSA? Figure 3.6 is an elaboration of the synthetic framework which we set out inFigure 3.1 above. It presents some of the major conclusions which emerged fromour review of what is known about the three key vectors (and discussed in Sections3.1–3.3). A number of tentative conclusions can be drawn, although the major point
IDS WORKING PAPER 291
33
of Table 3.10 is not so much to provide a comprehensive overview (since so little isknown about the detail of these impacts, and so many are only of emergingimportance), but rather a framework for thinking through the issues and the rangeand extent of potential impacts.
The conclusions which we draw are as follows:
l We are not able to fill all the ‘cells’ in this framework. For example, it is possible that there will be indirect complementary effects in the FDI/production channel, and it is conceivable that Chinese-coordinated global value chains producing in the Middle East may source inputs from plants located in SSA. But we can find no evidence for this type of linkage. Does this inability to fill cells reflect the absence of impacts, unmeasured impacts or poorly-manifested impacts?
l Direct impacts are easily evidenced, both with regard to complementary and competitive impacts. By contrast, indirect inputs are more difficult to evidence and much more difficult to measure.
l Data on the trade channel (Section 3.1 above) is much better than that on the production/FDI and aid vectors. Is this a function of our lack of knowledge on production and aid and/or the availability of global trade data, or does the tradeimpact assert itself first and most significantly?
l With the exception of indirect competitive effects in manufacturing through the trade channel, in general the balance of existing evidence would tend to support the view that the positive impacts (‘opportunities’) are probably more important than the negative impacts (‘threats’). But it is unclear whether this isa function of the evidence which is available, or the reality of the real world.
l It is difficult to generalise across countries and sectors. They might experience the impacts in each of these three vectors in very different ways. For example, commodity exporters in SSA may gain from rising commodity prices (complementary indirect effects), whilst SSA commodity importers may suffer from thevery same price rise (competitive indirect effects).
l We have no available methodology for providing a ‘net outcome’, even forindividual countries and regions. This is partly because some impacts are not-measurable, and partly because they involve trade-offs between winners (consumers buying cheap clothing imports) and losers (displaced domesticproducers of clothing).
Table 3.8 provides a largely static picture. For example, it suggests that the tradeimpacts have been most important so far. How will this change over time?
IDS WORKING PAPER 291
34
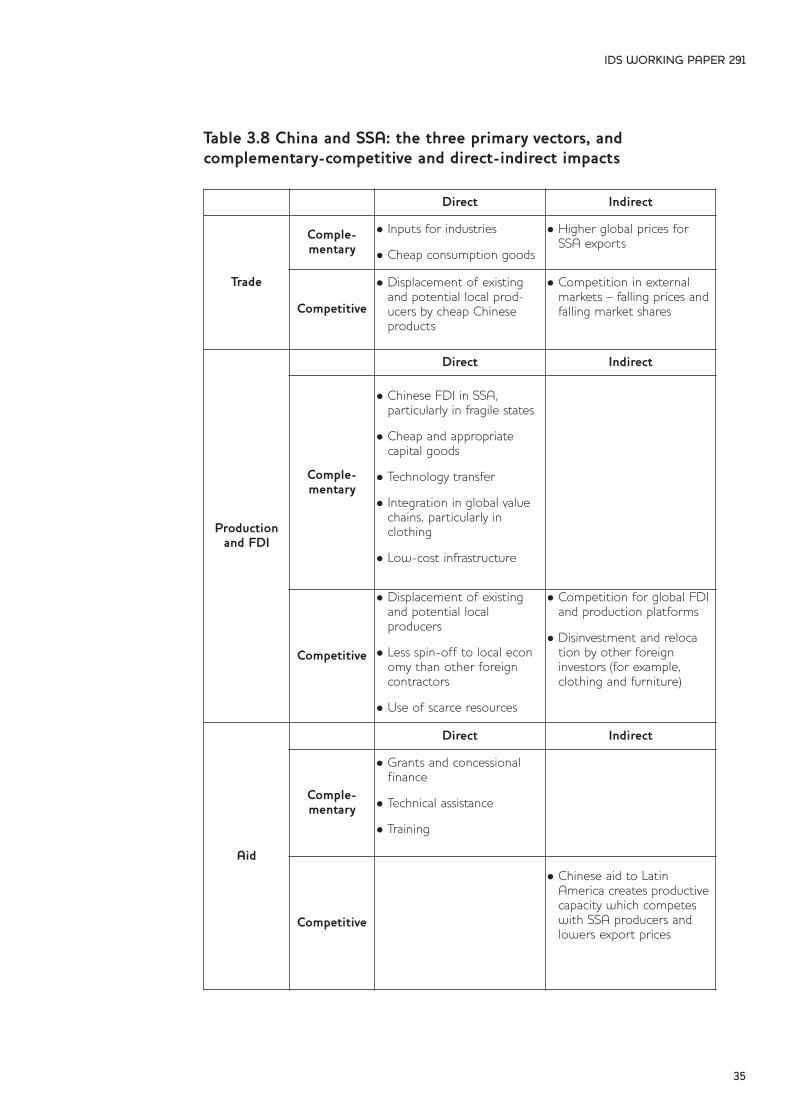
Table 3.8 China and SSA: the three primary vectors, and complementary-competitive and direct-indirect impacts
IDS WORKING PAPER 291
35
Direct Indirect
Trade
Comple-mentary
l Inputs for industries
l Cheap consumption goods
l Higher global prices forSSA exports
Competitive
l Displacement of existing and potential local prod-ucers by cheap Chinese products
l Competition in external markets – falling prices and falling market shares
Productionand FDI
Direct Indirect
Comple-mentary
l Chinese FDI in SSA, particularly in fragile states
l Cheap and appropriate capital goods
l Technology transfer
l Integration in global value chains, particularly in clothing
l Low-cost infrastructure
Competitive
l Displacement of existing and potential local producers
l Less spin-off to local economy than other foreign contractors
l Use of scarce resources
l Competition for global FDI and production platforms
l Disinvestment and relocation by other foreign investors (for example, clothing and furniture)
Aid
Direct Indirect
Comple-mentary
l Grants and concessional finance
l Technical assistance
l Training
Competitive
l Chinese aid to Latin America creates productivecapacity which competes with SSA producers and lowers export prices
4 Key issuesWhat follows from this analysis of the impact of China on SSA, and how does thisinform major policy choices?
In the discussion which follows in this section, we address the implications forpolicy in six key areas. We do not offer detailed prescriptions for change but,instead, as in the case of the synthetic framework used to assess the impact ofChina on SSA, to see these as promoting the basis for discussions with key stake-holders, within SSA and China, in DFID and with and in other bi- and multi-lateralagencies. The key issues are:
1 The challenges posed to industrial policy and sectoral choice;
2 The problems posed for commodity producers;
3 Reacting to changing patterns of poverty and income distribution;
4 The implications for the promotion of good governance, particularly in regard to fragile states;
5 Global and regional links;
6 Thinking about the future;
7 Filling the knowledge gaps.
4.1 The challenges posed to industrial policy and sectoral choice
It is in the industrial sector that SSA is most clearly challenged by the growth ofthe Chinese economy. In the absence of Chinese demand for SSA manufacturedexports (with the marginal exception of South Africa) China’s impact on SSA indus-trialisation arises from its growing exports. This affects SSA on two related andthreatening fronts – competition in internal markets for domestically-orientedmanufacturers, and competition in external markets from export-oriented industry.
It is in the clothing, textiles, furniture and footwear sectors that most is knownabout these issues. With regard to domestic markets, imports from Asia generally,and China in particular, are making life very hard for domestic manufacturers.Ghanaian furniture and clothing exporters find it increasingly difficult to competewith Chinese imports, as do South African manufacturers (Kaplinsky and Morris2006b). A similar pattern can be found in the Ethiopian footwear sector (Egziabher2006). Although data is scarce, discussions with manufacturers and retailers in anumber of SSA economies with domestic manufacturing sectors suggest thatimport penetration is increasing in all markets, and in most of the traded-goodsmanufactured sectors.
However, the challenge to SSA industry is much more substantial than these current impacts might suggest. This is because for much of SSA, industry is currently poorly developed, and is often largely confined to the food-processingindustry (where products degrade over time and have a high transport-to-value
IDS WORKING PAPER 291
36
ratio), building materials (a high transport-to-value ratio and producing customisedproducts) and the informal manufacturing sector (producing to low levels of qualityand largely using waste materials. The real policy challenge is not to existing industry, but to potential industry. That is, what space is there for SSA manufactur-ing to expand in the future? And, what implications does this have for the growthof dynamic capabilities, learning externalities and structural transformation?
What can be done about this bleak picture? First, there is scope for improving theproductivity of existing industries, often by working with value chains (for example,forestry, timber and furniture) rather than individual firms or subsectors. Detailedfirm-level analysis of productivity in the clothing sector in South Africa (Barnes,Morris and Gastrow 2006) and in COMESA (Manchester Trade Team 2005) detailthe nature of these productivity gaps. Kaplinsky and Morris (2006a) also report evidence of significant productivity improvements following the introduction oftraining schemes in Lesotho. Competitiveness in all sectors is a moving target, andfor various reasons, few SSA industries have hitherto been able to address this challenge of building dynamic capabilities. There is, however, no intrinsic reason whythis should be the case, and there is thus considerable scope for effective industrialpolicies.
A second area of policy intervention arises with respect to trade policy. Here theremay be a need for selective protection on the import side. But, as we saw in theearlier discussion of AGOA exports, SSA requires continued preferential treatmentagainst China (and other Asian economies) in external markets. With regard to theUS, the derogation on rules of entry in the clothing sector must be sustainedbeyond September 2007, even if it provides incentives which act contrary to deep-ening value added in the textiles sector. To avoid this stifling innovation, there istherefore the need to link AGOA rules of origin derogation to active industrialpolicies to promote the textiles sector in the SSA region. EU roles of origin are sotightly specified and restrictive that they provide little scope for least developedcountry exports of manufactures from SSA, particularly in the clothing and textilessector.
A further important lesson which emerges from China’s growing trade presence isfor SSA producers to be less concerned about the sector of production (for exam-ple, manufacturing versus services versus agriculture) and more focused on identify-ing niches where they can build barriers to entry to Chinese producers through thedevelopment of innovative capabilities. In manufacturing this may be increasinglydifficult as Chinese competences grow, whereas in horticulture and services, includ-ing knowledge-intensive services, relative capabilities may be high, as in the case ofKenya’s horticulture sector, South Africa’s medical sector and East Africa’s wildlifetourist sector.
4.2 The problems posed for commodity producers
Probably the most significant opportunity opened-up to SSA by China’s rapidgrowth is the enhanced incentives which rising demand and prices provide to commodity producing countries. Many SSA economies have rich primary productresources, including some of the poorest economies such as Nigeria, the DRC and
IDS WORKING PAPER 291
37
Angola, many of whom are characterised by fragile states. Rapid growth in SouthAfrica (and in other middle-income commodity exporters in Latin America) is anindication of the benefits which this might provide.
Yet, one of the sharpest lessons we can draw from comparative international experience is that there is no clear correlation between development and com-modity resources. Some commodity producers have fared well – Australia andCanada are cases in point. By contrast other commodity producers have fared badly,reflecting what some have termed the ‘resource curse’. In yet other cases such asKorea and Japan, rapid economic growth has occurred without significantresources – indeed, it is often argued that that they grew because of the absenceof resources.
Nevertheless, China’s growing demand for resources does offer significant opportunities to many SSA economies. But the lesson which can be drawn frominternational experience is that the benefits of this resource boom will not followautomatically – they need effective management. In addition to the link betweenpatterns of governance and resource-exploitation (which we will consider below inSection 4.4), this poses four major challenges to economic and social policy.
First and foremost, those economies with suitable natural resources need to develop the supply elasticities required to take advantage of raised global demandand prices. This may require a combination of inputs, including enhanced infrastruc-ture, targeted wooing of selected global resource-producing firms and the develop-ment of training and research and technology organisations (RTOs) in the respectiveNational Systems of Innovation.
Second, resources are often finite (at least in high-grade deposits) and prices areoften cyclical. There is thus a clear need to husband resource to ensure that thefruits can be drawn down over time, rather than at a single point in time. Thisposes important challenges for the economic management of resource rents (asGottschalk and Prates 2005 stress in their analysis of China’s growing trade withLatin America). Clearly SSA policymakers can gain from comparative experience inthis regard. Third, and related, one of the major problems posed by a growth incommodity prices is the impact on exchange rates – the ‘Dutch Disease’. Higherexports and raised prices often lead to currency appreciation. This creates problemsfor other exporting sectors, and promotes forms of structural change which lead toa reallocation of resources from the traded- to the non-traded goods sectors. Manynon-commodity exporters in SSA are beginning to suffer from these Dutch Diseaseeffects, particularly those linked to the appreciating Rand. Here there are perverseand adverse impacts on Lesotho and Swaziland – they face the downside of a cur-rency appreciating due to commodity exports, without benefiting on the upsidefrom raised commodity revenues. Again, SSA governments can learn from interna-tional experience in this regard, including from relatively successful SSA economiessuch as Botswana.
A fourth policy challenge arises in regard to the management of the environmentalconsequences of resource exploitation. This is most topical in relation to the depletion of forests (www.globaltimber.org.uk), which affects not only large globalissues such as climate change, but also the location-specific degradation of specificenvironments (such as the recent mudslide in the Philippines which destroyed a
IDS WORKING PAPER 291
38
whole town and arose as a consequence of illegal timber logging). These environ-mental spillovers are often substantial, and are not confined to the logging sector.The negative externalities may also be widespread, arising in part also as a conse-quence of transporting commodities to the coast.
4.3 Reacting to changing patterns of poverty and income distribution
Trade-related income poverty and distribution impacts can be very substantial(McCulloch, Winters and Cirera 2002). Although little is known about the detailedimpact on China’s trade on SSA patterns of income distribution, there are reasonsto believe that it will be very substantial.
On the positive side, one of the major implications of growing imports of manu-factures from China is the benefits which this provides to consumers, particularly tolow-income consumers. This is not just a phenomenon affecting SSA, since thedecline in prices of basic manufactures is a primary factor holding inflation at bay inmany OECD economies (including the UK). As we have seen, many SSA manufac-turers complain that Chinese products are displacing locally-produced commodities,but as Jenkins and Edwards point out, the primary displacement effect is onimports of manufactures from other, non-SSA economies.11 Wholesalers and retailers are switching their sourcing to cheap Chinese suppliers, and this almostcertainly has major positive impacts on consumer welfare. It is however an unmeasured impact, and we have little idea of its overall significance in consumerwelfare, nor in which sectors the primary benefits are being felt. This is becausemost household consumption studies do not collect data at a sufficiently disaggregated basis, failing even to distinguish between food- and non-food purchases, let alone different types or sources of manufactures.
There are also rapidly-emerging negative consequences of Chinese trade on incomedistribution. On the one hand, employment in many labour-intensive manufacturingsectors is being lost, most visibly in export-oriented clothing enterprises (see Table3.6 above). On the other hand, the rise in commodity production is associated bothwith capital-intensive technologies (biasing returns to holders of capital, rather thanto labour), and because of the large-scale of commodity production, to highly-concentrated forms of ownership. This is not an intrinsic problem of all primaryproduction, since many soft-commodities (such as tea, coffee, cotton and horticulture) are labour-intensive and locally-owned, But, hitherto, most commodityexports to China have been oil and hard commodities, particularly basic metals.
There is an additional global dimension to these emerging patterns of income distribution, since manufacturing incomes are either largely local within SSA (labour)
IDS WORKING PAPER 291
39
11 Jenkins and Edwards conclude, ‘In the absence of data on the expenditure patterns of poorhouseholds and the extent to which they consume imported goods it is only possible tomake a crude estimate of the likely impact of imports’ (Jenkins and Edwards 2005: 29). ‘Only in Uganda of the eight countries, do basic consumer goods account for more than 20 per cent of total imports from China, although both Ghana and Tanzania are slightly below this level’ (ibid.: 29).
or flow to firms based in low- and middle-income Asian economies (including inIndia and Sri Lanka). By contrast, with the exception of South Africa, commodityproduction almost exclusively occurs through the operations of foreign transnationalfirms. A mitigating factor with regard to the distributional consequences ofcommodity production is that it is relatively easy to tax, providing revenues to governments. But as we shall see in Section 4.4 below, the use of these state revenues does not necessarily suggest that their poverty and distributional impactsare positive.
4.4 The implications for the promotion of good governance, particularly in regard to fragile states
Recent years have seen concerted and multifaceted attempts by Western aiddonors, consumers and NGOs to promote various initiatives aimed at promotinggood governance in SSA. Some of these address the issue of transparency, someare targeted at preventing abuses of human rights and some are aimed at the corporate sector with respect to labour rights and environmental impacts.
Much of Chinese FDI and investment in SSA has run against attempts by the globalaid-community to promote better governance in SSA. For example, in the Sudan,the major Canadian investor withdrew because of concerns about Darfur andSudan’s poor record on human rights. Its 40 per cent shareholding was replaced byCNPC, a China-state-owned oil company. This has led to Sudan’s emergence as anet oil-exporter. It has also led to China becoming a major exporter of manu-factures to Sudan. China supplies weaponry to Sudan and has helped constructplants in Sudan to manufacture small arms and ammunition. More visibly, China hasvetoed attempts in the Security Council to actively censure Sudan for the civil warin Darfur.
In Angola, after Western donors postponed a donors-conference meeting due toconcerns with non-transparency in mid-2005, China offered Angola a soft-loan of$2bn. This soft loan, for 17 years at 1.5 per cent per annum with a five year graceperiod (but tied to China-sourced inputs) also enabled Chinese firms to win-outover Indian competitors in accessing Angolan oil reserves. In Zimbabwe, althoughoffering much less involvement and aid than Mugabe requested, Chinese firms haveinvested in the minerals and farming sectors, and have helped rehabilitate roads. InJune 2006, China agreed to build three power stations and provide other infra-structural assistance worth in excess of $1bn in exchange for commodities such aschrome. Whilst Western countries have embargoed arms-sales to Zimbabwe, Chinahas continued supplying military equipment, including K8 fighter planes.
In the private sector, whilst Western firms have demanded fair labour practices inproduction in products sourced directly from SSA countries, some of the produc-tion routed through Chinese firms has not complied with labour standards in thesame way (Kaplinsky and Morris 2006a). There are also accusations that Chinesefirms have imported illegally-logged timber from SSA (www.globaltimber.org.uk),and as we saw earlier, the Sierra Leone ambassador to Beijing remarked that theChinese ‘Don’t hold meetings about environmental impact assessment, humanrights, bad governance and good governance. I’m not saying it’s right, just that
IDS WORKING PAPER 291
40
Chinese investment is succeeding because they don’t set high benchmarks’ (Hilsum 2005).
The ability of Chinese firms to invest in fragile states – such as Angola, the DRC,Sudan and Sierra Leone – is almost certainly linked to the political economy of theChinese corporate sector. Many Chinese firms investing on SSA are partly or whollystate-owned, and reflect the desire of the Chinese government to build a long-term presence in a resource-rich continent. But, perhaps even more so than in thecase of other forms of Chinese participation in SSA, this is an area of great sensitivity which is characterised by assertion and rumour as much as by detailedevidence.
There is a further indirect impact of China’s demand for commodities on the natureof governance in SSA. In the 1960s in particular, the very large surpluses that someAfrican economies could earn from exporting agricultural commodities stimulatedkleptocratic governance and undermined the legitimacy of newly-independentregimes. Since the 1970s, world market prices for most agricultural exports havedeclined substantially, and this form of kleptocracy has declined considerably.However, recent research shows that rents derived from the extraction of ‘pointresources’ (oil, gas, diamonds and minerals) have, since the 1970s, clearly encouragedauthoritarian rule, high military expenditure, corruption and violence (Rosser 2006).There are wide variations within Africa. Whilst Botswana is often cited as theexception to the general pattern, in other African countries, the discovery of largemineral resources has led to the deterioration in the standard of living of most people. This is the recent experience of the African country where Chinese companies are most deeply involved in resource extraction – the Sudan. Thus, tothe extent that there is a generic trend towards commodity production and mineralrents as a consequence of China’s growing need for material inputs, it is likely thatthis will exacerbate some forms of poor governance in SSA.
4.5 Global and regional integration
Historically, most of SSA’s trade links have been with the former metropolitanpowers, either directly with the UK (in the case of Anglophone countries) andFrance (for Francophone countries), or more generally with Europe and NorthAmerica. These links have been strengthened through the development of variousforms of preferential trade arrangements (Lome-Cotonou, AGOA, EPAs and FTAs).It is not surprising therefore, as we saw in Figure 1.1, that currently most of SSA’strade is with the historically industrialised countries.
Two major developments are disturbing these historical patterns. First, and this conclusion emerges from the data on trade patterns, there appears to be a naturally growing regional market in southern Africa, as is occurring in the case ofMerciful in Latin America, reflecting regional externalities in production (Evans,Kaplinsky and Robinson 2006). But, secondly, the rapid growth in trade betweenSSA and China (and to some extent India) evidenced in Table 1.1 suggests a growing‘magnetic pull’ from the East. This poses a major policy challenge to individual andgroups of SSA economies, particularly relevant in the context of stretched policyand administrative systems – given the growing importance of regional ties in the
IDS WORKING PAPER 291
41
global economy, who should they link with, and what forms of linkage might thisinvolve? Should they aim to go North, go East or stay local?
Here it is possible to distinguish between what might be termed ‘NegativeIntegration’ and ‘Positive Integration’ (Evans et al. 2006). The former refers to theremoval of barriers to trade, as in the case of FTAs and WTO-orchestrated multi-lateral trade liberalisation. In contrast, positive integration involves targeted policiesfocusing on particular forms of market imperfections (for example, promotinglearning about China and its language), strengthening poor infrastructure constrain-ing particular geographical links, and actively seeking to develop various forms of‘deep integration’ in China-SSA global value chains. It may also involve the develop-ment of particular patterns of trade preference, as in the recent Chinese initiativeto lower tariffs on imports of manufactures from 25 least developed SSAeconomies.
Increasingly, SSA economies are going to need to develop explicit policies in theseareas. It will necessarily involve a ‘joined-up’ mix of economic and political initiatives.As SSA loosens its links with Europe and North America, it will also be necessaryfor countries, particularly those in southern Africa, to determine how much weightthey wish to place on intra-continental regional links, and how much on forgingnew regional links with China and other Asian Driver economies.
4.6 Thinking about the future – the development of ‘dynamiccapabilities’
As we have seen, economic and political links between China and SSA are changingvery rapidly. From the perspective of SSA economies, therefore, it is the capacity tochange, to grasp opportunities and to minimise threats that is key. In the businessliterature, this is referred to as the development of ‘dynamic capabilities’. Thisinvolves a combination of search-capabilities, strategic-formulation-capabilities andimplementation-capabilities, as well as the capacity to continually change these asnew threats and opportunities arise.
Many of the dynamic capabilities which are required to meet these challenges areprefigured in the policy-related issues discussed in Sections 4.1–4.6 above. There ishowever at last one additional capability which is required, and that is the ability ofSSA producers to anticipate future opportunities and threats opened-up by sustained Chinese expansion. For example, one emerging opportunity is the promo-tion of Chinese tourism. China has recently ‘certified’ seven SSA countries as touristdestinations, with more than 70,000 tourists visiting Africa in the 20 months toend-2005. With the growth in Chinese per capita incomes, there is likely to be aconsiderable growth in tourism in the future.
Another possibility is in regard to China’s food needs. At 3,040, China’s per capitacalorie consumption is on average 90 per cent of that in the high incomeeconomies (Chen et al. 2006), so future import needs are likely to reflect a changein the composition of food consumption rather than a significant increase in its volume (FAO 2002). So far, China has sourced very little food from SSA (or, indeed,from elsewhere), partly because it has imported intermediates such as animal feedto support its own meat-producing sector. Most of the feed imported so far has
IDS WORKING PAPER 291
42
been soya, and the primary origin of these imports has been from Latin America(Jenkins, Dussel Peters and Moreira 2006). Although this has had knock-on effectsof Ethiopia’s exports of sesame (a substitute in some markets for soya), SSA hasgained little from this trade in animal-feeds.
This raises a series of strategic issues for SSA food producers, which require carefulconsideration, informed by data rather than wild speculation. Will China continue toproduce its own meat? Will its growing per capita income lead it to import horti-cultural products, fish and chicken? If they do, will these imports come directlyfrom eastern and southern African economies which have a demonstrated compar-ative advantage in some of these sectors, or will SSA gain indirectly from China’sgrowing imports from a supply-constrained global economy? As we saw above,Chinese investors are beginning to pioneer soya production in Mozambique and thismay be a sign of future prospects.
These examples of tourism and soya are just that – examples. They represent futurepossibilities. At the same time, it is also necessary to anticipate future threats. Amajor potential problem for many SSA economies is the possibility that energyprices will rise significantly as a consequence of constrained global supplies and rapidly growing demand from China and India. So, too, might the price for otherSSA imports, including food. What pressures will a rapidly diversifying Chineseeconomy place on economies such as South Africa who have become successfulexporters of automobiles and auto components?
4.7 Filling the knowledge gaps
It is abundantly clear from the discussion above that we know more about thequestions which have to be addressed on China’s impact on SA than on the natureof these impacts. There are significant knowledge-gaps, and unless these are filled,policy- and capability-development will be undermined and may be misdirected.
We can conclude with some confidence that the three primary vectors of trans-mission are indeed trade, FDI/production and aid, and that we know more aboutthe direct impacts than the indirect impacts. We can also conclude that in order tounderstand China’s growing involvement in SSA, it is as important to focus on thegeostrategic and political imperatives, as on the narrow pursuit of financial gain.But, other than this, we cannot at present draw any conclusions with confidence.We cannot assess whether on balance China’s impact is likely to be positive ornegative, and for which countries and regions, and for which particular stakeholdersin particular countries and regions.
In order to widen and deepen the policy perspectives listed in Section 4.6 above,key knowledge gaps need to be addressed, amongst which the following are mostimportant:
l The need for baseline studies to assess the changing future impact of China on SSA;
l Analyses of the determinants of SSA competitiveness and the steps required toenhance productivity (for example, in clothing, textiles, footwear and furniture, as well as in export-oriented food crops);
IDS WORKING PAPER 291
43
l A more thorough assessment of indirect impacts of China’s trade on SSA, facilitating the development of appropriate policies for providing special and differential treatment to low income SSA economies in global markets;
l Determining the impact of China on consumer welfare, income distribution and absolute poverty levels in SSA, through an analysis of the consumer benefits derived from cheaper imports and the distributional implications of a switch in specialisation away from labour-intensive manufactures to capital intensive commodities;
l Distinguishing generic from sub-regional and country-specific impacts, aiding the classification of different types of SSA economies;
l Identifying likely future areas of threat and opportunity;
l Determining the drivers of China’s strategic engagement with SSA and theirimpact on transparent and better governance on the continent;
l Diffusing lessons from the successful experience in coping with the challenges posed by China, drawn both from within SSA and from other regions.
5 An agenda for whom?Meeting this policy agenda and knowledge-gaps is a multifaceted task. It clearly is achallenge which confronts all the major stakeholders in SSA. Governments areclearly key stakeholders. But so are many SSA producers – firms and farms – whoare affected, directly and/or indirectly by existing and potential Chinese expansion.How aware are they of these opportunities and threats, and what capabilities dothey require to develop these strategic capabilities and to respond appropriately?Similar questions can of course be asked with respect to a range of civil societyactors such as trades unions and NGOs.
The Chinese government and key stakeholders in China face analogous challenges.Are they adequately aware not just of the opportunities which are being opened-up in SSA, but also of the threats which they pose to different stakeholders inSSA? An example is the case of SSA’s AGOA clothing exports which experiencedan almost 20 per cent fall in the first year after quota removal with devastatingimpacts on employment in Lesotho and Swaziland. Are Chinese stakeholders awareof the problems which previous generations of resource-hungry foreign investorsconfronted in SSA, including growing resentment from the local population due tolimited spillovers into the local economy? May they begin to suffer the same disruption in their resource activities as are currently being experienced by Shell inNigeria, or in previous decades when African countries nationalised resource-firmsin part because of their low linkages with the local economy? Does China need tothink about engaging with western aid donors in the promotion of good gover-nance in SSA, not just as issues in human rights, but in order to maintain the ruleof law which Chinese investors require if they wish to obtain long-term and profitable access to SSA resources and markets? What responsibilities, if any, doesthe Chinese government have to uphold the interests of SSA in institutions ofglobal governance?
IDS WORKING PAPER 291
44
What implications are there for DFID and other bi- and multi-lateral agencies? Whatroles might they play in building appropriate dynamic capabilities in SSA, in makingthe Chinese more aware not just of their positive impact, but also the negativedirect and indirect impacts of their growth on SSA? How might China be persuaded to participate more actively in the promotion of more transparent andbetter governance in SSA, particularly in countries with fragile states? What rolemight they play in intermediating discussions Chinese and SSA stakeholders?
This agenda-setting paper makes no pretence to answer these, and otherimportant questions. Instead it has attempted to provide a framework for assessingthe state of our knowledge, and for structuring a systematic response on behalf ofkey stakeholders in SSA and China.
IDS WORKING PAPER 291
45
ReferencesBarnes, J.; Morris, M. and Gastrow, M. (2006) An Assessment of the South AfricanClothing Industry’s Operational Competitiveness Relative to a Set of InternationalCompetitors, PRISM Research Report
Bosten, E. (2006) ‘China’s Engagement in the Construction Industry of SouthernAfrica: The Case of Mozambique’, paper prepared for the Asian and Other Driversof Global Change Workshop, St Petersburg, 19 and 20 January
Broadman, H. (2007) Africa’s Silk Road: China and India’s New Economic Frontier,Washington, DC: The World Bank
Centre for Chinese Studies (2006) China’s Interest and Activity in Africa’s Constructionand Infrastructure Sectors, Stellenbosch: Centre for Chinese Studies
Chen, M.-X.; Goldstein, A.; Pinaud, N. and Reisen, H. (2005) ‘China and India:What’s in it for Africa?’, mimeo, Paris: OECD Development Centre
Dobler, G. (2006) South-South Business Relations in Practice: Chinese Merchants inOshikango, Namibia, www.ids.ac.uk/asiandrivers (accessed 5 April 2006)
Edwards. L. and Morris, M. (2006) An Evaluation of the Employment Trends in theClothing and Textile Industry, PRISM Working Paper, Policy Research in InternationalServices and Manufacturing, SALDRU, University of Cape Town,www.saldru.uct.ac.za/prism/evaluation-of-employment-trends-25O.pdf
Egziabher, Tegegne Gebre (2006), ‘Asian Imports and Coping Strategies of Medium,Small and Micro Firms: The Case of Footwear Sector in Ethiopia’, mimeo, AddisAbaba: Addis Ababa University
Evans, D.; Kaplinsky, R. and Robinson, S. (2006) ‘Deep and Shallow Integration inAsia: Towards a Holistic Account’, IDS Bulletin 37.1: 12–22
Evans, D.; Gasiorek, M.; Holmes, P.; Iacovone, L.; Iwanow, T.; Jackson, K.; Robinson,S. and Rollo, J. (2006) ‘Regional Trade Agreements and Developing Countries:Shallow and Deep Integration, Trade, Productivity, and Economic Performance’report to DFID under project no. 04 5881, Brighton: University of Sussex
Food and Agriculture Organisation (2002) World Agriculture: Towards 2015/2030,Rome: FAO
Goldstein, A. (2004) Regional Integration, FDI and Competitiveness in Southern Africa,Paris: OECD Development Centre
Gottschalk, R. and Prates D. (2005) The Macroeconomic Challenges of East Asia’sGrowing Demand for Primary Commodities in Latin America, G-24 Discussion PaperSeries for UN, Geneva: UNCTAD
Hilsum, L. (2005), ‘We Love China’, Granta 92: The View from Africa, London: GrantaPublications, www.granta.com/extracts/2616 (accessed 3 March 2006)
Humphrey, J. and Schmitz, H. (2006) The Impact of China on Asia, agenda-settingpaper prepared for DFID, Brighton: IDS
IDS WORKING PAPER 291
46
IDS Asian Drivers Team (2006) ‘The Impact of the Asian Drivers on the DevelopingWorld’, IDS Bulletin 37.1: 3–11
Jenkins, R. and Edwards, C. (2005) The Effect of China and India’s Growth and TradeLiberalisation on Poverty in Africa, DCP 70, London: DFID
Jenkins, R.; Dussel Peters, E. and Moreira, M. (2006) The Impact of China on LatinAmerica, agenda-setting paper prepared for DFID, Brighton: IDS
Kaplinsky, R. (2006) ‘Revisiting the Revisited Terms of Trade: Will China Make aDifference?’, World Development 34.6: 981–95
—— (2005) Globalization, Poverty and Inequality, Cambridge: Polity Press
Kaplinsky, R. and Morris, M. (2006a) ‘Dangling by a Thread: How Sharp are theChinese Scissors?’, mimeo, Brighton: IDS
—— (2006b) The Asian Drivers and SSA; MFA Quota Removal and the Portentsfor African Industrialisation?’, mimeo, paper prepared for Asian and Other Driversof Change Workshop, St Petersburg, Brighton: IDS
Kaplinsky, R. and Santos-Paulino, A. (2006) ‘A Disaggregated Analysis of EUImports: Implications for the Study of Patterns of Trade and Technology’, CambridgeJournal of Economics 30.4: 587–611
Lennon, J. (2004), ‘Overview of Chinese Commodities’, mimeo, London: MacquarieResearch Metals and Mining
Lennon, J. and Rowley, A. (2006), Commodities Outlook: Steady as She Goes in 2006,London: Macquarie Bank Ltd
Manchester Trade Team (2005) Impact of the End of MFA Quotas and COMESA’sTextile and Apparel Exports Under AGOA: Can the Sub-Saharan Africa Textile andApparel Industry Survive and Grow in the Post-MFA World?, report prepared forUSAID East and Central Africa Global Competitiveness Trade Hub
Mayer, J. and Fajarnes, P. (2005) Tripling Africa’s Primary Exports: What? How?Where?, UNCTAD Discussion Paper 180, Geneva: UNCTAD
McCulloch, N.; Winters, L.A. and Cirera, X. (2002) Trade Liberalisation and Poverty: AHandbook, London: Centre for Economic Policy Research
Morris, M. and Sedowski L, (2006) Report on Government Responses to New Post-MFA Realities in Lesotho, PRISM Working Paper 2, Policy Research in InternationalServices and Manufacturing, SALDRU, University of Cape Town.www.saldru.uct.ac.za/prism/lesotho_clothingrept.pdf
Rosser, A. (2006) The Political Economy of the Resource Curse: A Literature Survey, IDSWorking Paper 268, Brighton: IDS
Sandrey, R. (2006) ‘The African Trading Relationship with China’, mimeo, CapeTown: Trade Law Centre for Southern Africa
Stevens, C. and Kennan, J. (2006) ‘How to Identify the Trade Impact of China onSmall Countries’, IDS Bulletin 37.1: 33–42
IDS WORKING PAPER 291
47
World Bank (2004a) Patterns of Africa-Asia Trade and Investment, Potential forOwnership and Partnership, Washington, DC: World Bank, Africa Region PrivateSector Group
—— (2004b) Country Analytical Briefs with Compendium of Country-Specific Analysis ofAfrica-Asia Trade Complementarity, Washington, DC: World Bank, Africa RegionPrivate Sector Group
IDS WORKING PAPER 291
48

IDS WORKING PAPER 291
49