Embed Size (px)
Citation preview

Deliverable D 5
Cost-benefit analysis of measures forvulnerable road users
Public
P R O M I S I N G
Promotion of Measures for Vulnerable Road UsersContract No. RO-97-RS.2112
Workpackage 5
Contribution of:TRL, Transport Research Laboratory, United Kingdom
July 2001 THIS PROJECT WAS FUNDED BY THEEUROPEAN COMMISSION DGVII UNDER THETRANSPORT RTD PROGRAMME


Deliverable D 5
Cost-benefit analysis of measures forvulnerable road users
Public
P R O M I S I N G
Promotion of Measures for Vulnerable Road UsersContract No. RO-97-RS.2112
Project Co-ordinator: SWOV Institute for Road Safety Research, the Netherlands
Co-ordinator Workpackage 5:TRL - Transport Research Laboratory, United Kingdom
Partners Workpackage 5:SWOV - Institute for Road Safety Research, the NetherlandsTØI - Institute of Transport Economics, Norway
July 2001 THIS PROJECT WAS FUNDED BY THEEUROPEAN COMMISSION DGVII UNDER THETRANSPORT RTD PROGRAMME

Notice to the reader
This volume is one of the six deliverables of the European research project PROMISING, on thepromotion of mobility and safety of vulnerable road users. The research was carried out by aconsortium of European partners, which was co-ordinated by the SWOV Institute for Road SafetyResearch.
The main report of the PROMISING project is written and edited by SWOV, based on the contributionsof the various authors of the six deliverables. These deliverables were not re-edited, but are published inthe form in which they were furnished by the authors. SWOV is not responsible for the contents ofdeliverables that were produced by authors outside SWOV.
Copies of the following PROMISING publication can be obtained by contacting the respective author,or by downloading them from the SWOV website www.swov.nl.
Final report for publicationPromotion of mobility and safety of vulnerable road users. Final report of the European research projectPROMISING. SWOV Institute for Road Safety Research, Leidschendam, the Netherlands.
Deliverable 1Measures for pedestrian safety and mobility problems. Final report of workpackage 1. NTUA National Technical University of Athens, Greece.
Deliverable 2Measures to promote cyclist safety and mobility. Final report of workpackage 2. VTT Technical Research Centre of Finland, Espoo, Finland.
Deliverable 3Integration of needs of moped and motorcycle riders into safety measures. Final report of work-package 3. SWOV Institute for Road Safety Research, Leidschendam, the Netherlands.
Deliverable 4Safety of young car drivers in relation to their mobility. Final report of workpackage 4. BASt Bundesanstalt für Straßenwesen, Bergisch-Gladbach, Germany.
Deliverable 5Cost-benefit analysis of measures for vulnerable road users. Final report of workpackage 5. TRL Transport Research Laboratory, Crowthorne, United Kingdom.
Deliverable 6National and international forums to discuss the approach and the results of PROMISING. Final reportof workpackage 7. SWOV Institute for Road Safety Research, Leidschendam, the Netherlands.
LeafletIntegrated planning for mobility and safety is promising. Leaflet on the European research projectPROMISING. SWOV Institute for Road Safety Research, Leidschendam, the Netherlands.

1
CONTENTS
SUMMARY ...............................................................................................31 INTRODUCTION..............................................................................62 TYPOLOGY OF TARGET GROUPS OF ROAD USERS ANDMEASURES ..............................................................................................8
2.1 Vulnerable and inexperienced road users.......................................................... 82.2 Typology of measures designed to improve safety and mobility...................... 9
3 MOBILITY DATA AND EXPOSURE..........................................123.1 Definition of exposure ..................................................................................... 123.2 Vulnerable road users ...................................................................................... 133.3 Policies which impact on exposure ................................................................. 143.4 Data available on exposure of vulnerable road users ...................................... 16
3.4.1 Walking ................................................................................................... 173.4.2 Cycling..................................................................................................... 243.4.3 Motorcyclists ........................................................................................... 283.4.4 Young drivers .......................................................................................... 29
4 FACTORS INFLUENCING EXPOSURE/MOBILITY..............305 DATA AVAILABLE ON ACCIDENTS........................................31
5.1 National data.................................................................................................... 315.2 Hospital data .................................................................................................... 325.3 Insurance company data .................................................................................. 325.4 Location of accidents....................................................................................... 335.5 Comparison between national data sets........................................................... 33
6 UNDER-REPORTING OF ACCIDENTS ....................................357 FRAMEWORK FOR COST-BENEFIT ANALYSIS ..................39
7.1 The role of cost-benefit analysis in policy making and priority setting .......... 397.2 Relevant impacts of measures ......................................................................... 407.3 Estimation of impacts ...................................................................................... 417.4 The duration of effects and service life of measures ....................................... 447.5 Measures of efficiency..................................................................................... 457.6 Valuation of relevant impacts.......................................................................... 487.7 Some results from the WALCYNG-project .................................................... 547.8 Dilemmas in the application of cost-benefit analysis...................................... 55
8 FACTORS AFFECTING THE RESULTS OF COST-BENEFITANALYSES .............................................................................................60
8.1 A taxonomy of factors affecting the size of costs and benefits ....................... 608.2 Implications for the possibility of generalising the results of cost-benefitanalyses.................................................................................................................... 72
9 CASE ILLUSTRATIONS OF COST-BENEFIT ANALYSES...749.1 Conversion factors for the value of benefits and costs.................................... 749.2 Selection of measures for cost-benefit analysis............................................... 769.3 Roundabouts .................................................................................................... 779.4 Road lighting ................................................................................................... 789.5 Integrated area-wide speed reduction measures .............................................. 809.6 Environmentally adapted through-roads ......................................................... 839.7 Upgrading pedestrian crossings....................................................................... 85

2
9.8 Parking regulations .......................................................................................... 869.9 Front, rear and side underrun guard rails on trucks......................................... 879.10 Local bicycle policy to encourage mode switching..................................... 889.11 Bicycle lanes................................................................................................ 909.12 Advanced stop lines for cycles at junctions................................................. 929.13 Mandatory wearing of bicycle helmets ....................................................... 939.14 Improving bicycle conspicuity .................................................................... 959.15 Daytime running lights on cars.................................................................... 969.16 Daytime running lights on motorcycles....................................................... 989.17 Mandatory wearing of helmets for moped and motorcycle riders............... 999.18 Design changes on motorcycles ................................................................ 1009.19 Graduated licensing systems – lowered age-limit for driver training inSweden................................................................................................................... 1009.20 Graduated driver license – license on probation in Austria....................... 1029.21 Disco buses in Germany............................................................................ 103
10 CONCLUSIONS AND RECOMMENDATIONS ......................10710.1 Conclusions ............................................................................................... 10710.2 Recommendations ..................................................................................... 109
11 REFERENCES...............................................................................111
3
SUMMARY
The report examines the issues of measuring exposure and relating this to accidents.It concludes that monitoring of exposure is clearly important if valid conclusions are tobe drawn from changes in casualty numbers. However the means to monitor exposureaccurately, especially for pedestrians and cyclists, are not routinely available.
It appears from studies in a number of countries that accidents with fatal injuries arealmost always recorded by the police and by the hospitals. The level of recording ofinjury to pedestrians and pedal cycles seems to vary somewhat between countries. Thismay well be due as much to recording protocols in the various countries as to true under-reporting to the police. What does seem to be prevalent in the literature is a problem withthe level of reporting to the police of pedal cycle injuries in particular. Care needs to betaken when comparing studies and databases as definitions of what is a pedestrian orpedal cycle accident may differ in important ways between hospital based researchersand road safety researchers.
Cost-benefit analysis is a technique designed to help policy makers find the mostefficient way of realising policy objectives. It is based on economic welfare theoryand the definition of efficiency given in that theory. The requirement to assignmonetary values will restrict the application of cost-benefit analysis to measureswhose effects are well known and situations in which policy objectives are clearlyarticulated and widely supported. It cannot be used to settle constitutional issues orprofound disagreements over policy objectives. The results of a cost-benefit analysisare determined by the assumptions that are made. The assumptions made should fitnational or local conditions. The results of cost-benefit analyses will vary betweencountries, and it will in general not be correct to generalise the results of theseanalyses across countries. For some road safety measures, however, generalstatements can be made concerning factors that influence the size of costs andbenefits.
Cost-benefit analyses have been made of the following measures designed to improvesafety and mobility for vulnerable and inexperienced road users:
- Roundabouts,- Road lighting,- Integrated area wide urban speed reduction schemes,- Environmentally adapted through-roads,- Upgrading pedestrian crossings,- Parking regulations,- Front, side and rear underrun guard rails on trucks,- Local bicycle policy to encourage mode switching from car driving,- Bicycle lanes,- Bicycle paths,- Advanced stop lines for cycles at junctions,- Mandatory wearing of bicycle helmets,- Improving bicycle conspicuity,- Daytime running lights on cars,- Daytime running lights on mopeds and motorcycles,

4
- Mandatory wearing of helmets for moped and motorcycle riders,- Design changes on motorcycles,- Graduated licensing - lowered age limit for driver training,- License on probation - lowered BAC-limit for novice drivers,- Disco buses.
In general, measures that improve both safety and mobility, or are neutral with respectto mobility, tend to have good benefit-cost ratios. Measures that reduce mobility,particularly by substantially reducing speed, tend to have a less favourable ratio ofbenefits to costs.There exist very few technical and non-restrictive measures that can improve safetyfor inexperienced drivers and for riders of mopeds and motorcycles.Measures that improve visibility or conspicuity (lighting, reflective devices, daytimerunning lights) or reduce driving speed are generally very effective in improvingsafety for pedestrians and cyclists.The analyses presented are in most cases based on data taken from one country. Onlyfor daytime running lights on cars has a cost-benefit analysis encompassing all ofEurope been performed.
The following recommendations are put forward with respect to research anddevelopment.
1 An international conference or research project should be held in order to establishconsensus with respect to identification of the relevant effects of measures thataffect safety and mobility for vulnerable and inexperienced road users. It isparticularly important to discuss and agree on how these measures affect theenvironment and road user security (subjective safety).
2 In current cost-benefit analysis, measures that reduce speed in urban areas tolevels below about 40 km/h are often rejected in cost-benefit analyses becauseincreased costs of travel time defeat any gain in safety or environmental amenityobtained by the measures. These results are often regarded as problematic and acritical examination of possible biases in current cost-benefit analyses of speedreducing measures in urban areas is called for.
3 The methods used to estimate the cost of accidents, costs of travel time and othercosts of non-marketed goods used in cost-benefit analyses should be standardisedbetween countries to the highest possible extent. However, variations in cost ratesthat are attributable to differences in income and population preferences should berespected.
Recommendations are also put forward with respect to the use of measures to improvesafety and mobility for vulnerable and inexperienced road users.
1 Measures that improve conspicuity and visibility will often improve safety for allroad users, but particularly for pedestrians and cyclists. An increased use ofdaytime running lights on cars, reflective devices worn by pedestrians andcyclists, and road lighting is encouraged. These measures are in many cases likelyto give benefits that widely exceed the costs.
2 Measures that reduce driving speed, especially in urban areas, will improve safety,and sometimes mobility, for pedestrians and cyclists. Measures that reduce speedmay, however, impose additional travel time on motorists. Measures that reduce
5
speed for motorists in urban areas will not always pass a cost-benefit test. Thereare, however, alternatives to basing speed limits in urban areas on cost-benefitanalysis. An alternative that deserves careful attention is to determine speed limitsaccording to the principles of Vision Zero, as stated by the Swedish National RoadAdministration.
3 The wearing of helmets protects both cyclists and riders of mopeds and motor-cycles from head injury. It is at the present state of knowledge not possible toperform an adequate cost-benefit analysis of mandatory helmet wearing forcyclists. For moped and motorcycle riders, on the other hand, helmet wearingshould always be mandatory.
4 The possibility of improving safety for motorcyclists by design changes onmotorcycles should be explored carefully. For the time being, however, mostdesign changes that have been proposed remain experimental and both their costsand effects are highly uncertain.
5 There exist few technical and non-restrictive measures that can improve safety forinexperienced drivers. Graduated licensing and driver’s license on probation, arepromising measures for inexperienced drivers. The continued use of thesemeasures is encouraged.

6
1 INTRODUCTION
The objective of this workpackage was to bring together the information providedfrom the detailed reviews of each group of road users in the other workpackages, in aconsistent way, to show the benefits and costs that might arise as a result of safetymeasures directed at these road users and to define a framework for cost-benefitanalysis of measures designed to improve the safety and mobility of vulnerable andinexperienced road users and to give some case illustrations of cost-benefit analysesof selected measures.
The workpackage was led by Pat Wells from the Transport Research Laboratory(UK).The cost-benefit analyses were carried out by Rune Elvik from the Institute forTransport Economics, TØI, (Norway) under contract to The Institute for Road SafetyResearch, SWOV (Netherlands) with assistance from Frank Poppe from SWOV.
The main research problems that are discussed in the report include:
(1) What current knowledge exists on the accident levels and exposure to risk ofvulnerable and inexperienced road users?
(2) What measures can improve the safety and mobility of these road users?(3) What are the basic ingredients of a cost-benefit analysis? Which are the issues
that can be resolved by means of such analyses and which are the issues thatcannot be resolved by cost-benefit analyses?
(4) Which factors affect the results of cost-benefit analyses? To what extent can theresults of such analyses be generalised from one country to another?
(5) Which are the most cost-effective measures that can improve the safety andmobility of vulnerable and inexperienced road users?
The following tasks were defined as part of this workpackage.
1. Define analysis methodology. This task consisted in defining in detail the elementsthat should be included in cost-benefit analyses, preparing a list of relevant safetymeasures, defining in detail the required data and illustrating the use of themethodology by some examples.
2. Assessment of mobility data. A complete cost-benefit analysis generally requiresfairly detailed data at the micro level. By the micro level is meant for each roaduser (or an average road user for the group concerned), for each vehicle, for eachcrossing location, for each junction, etc. Data has been supplied by workpackages1 to 4, and workpackage 5 has, to a large extent, been based on input from theseworkpackages.
3. Synthesis of evidence on present injury risk. Based on input from workpackages 1to 4, a synthesis of evidence on exposure and accident levels for the target groupsof road users has been prepared. Underreporting of injury accidents in officialaccident statistics, which is a particularly severe problem for cyclist accidents, hasbeen examined. The quality of exposure data varies between countries, as do the

7
definitions of reportable injuries vary between countries. These issues have beenexamined in the report.
4. Synthesis of evidence on costs and effects of safety measures. The term safetymeasure denotes any measure having the reduction of accidents or injury severityas one of its objectives.
5. Economic valuation of safety and mobility. In order to perform a cost-benefitanalysis of a measure, an economic valuation of all relevant effects of the measureis needed. The relevant effects in the present project can be divided into threemain categories: (1) Safety effects, (2) Mobility effects (restrictiveness ofmeasures), and (3) Costs of implementing a measure. All three categories ofeffects have to be valued in monetary terms in order to perform a cost-benefitanalysis.
This report considers first the target groups in the project and the types of measuresthat affect their safety and mobility. It then examines the evidence available onaccidents and exposure. The elements in the framework for cost-benefit analysis areconsidered and the possibilities of generalising the results of such analyses at aninternational level is discussed. The report then examines examples of cost-benefitanalysis of selected safety measures, designed to improve the safety of vulnerable andinexperienced road users.

8
2 TYPOLOGY OF TARGET GROUPS OF ROAD USERS ANDMEASURES
2.1 Vulnerable and inexperienced road users
There are four target groups of road users in this project:
(1) Pedestrians,(2) Cyclists,(3) Moped and motorcycle riders,(4) Inexperienced drivers.
Common to these road user groups is the fact that their risk of injury is substantiallyhigher than for other road user groups. A case illustration of this is given in Figure 1.Figure 1 shows injury rates per million person kilometres of travel in Norway for thefour target groups of road users studied in this project, compared to the injury rate ofthe safest group of car drivers. For the purpose of this comparison, inexperienceddrivers have been defined as car drivers who are 18 or 19 years old. The minimumage for driving a car in Norway is 18 years.
A similar pattern is found in all motorised countries, although the numerical values ofthe accident rates will of course vary. It is important to realise, however, that theaccident rate for a certain group of road users seems to depend on the amount of travelperformed by that group. Thus, for example, the fatality rate for cyclists in a numberof European countries is known to vary in inverse proportion to the amount of cyclingdone per inhabitant (see section 9.1). In countries where people cycle a lot, cyclistshave a lower fatality rate (fatalities per million cycle kilometres) than in countrieswhere people cycle less. This observation has a bearing on how one should estimatethe effects on accidents of measures that induce more travel. The point will bediscusses more in detail in a later section of the paper.

9
Figure 1: Injury rate (injuries per million person kilometres of travel) for variousgroups of road users in Norway.
2.2 Typology of measures designed to improve safety and mobility
A broad range of measures that may affect safety and mobility for the target groups ofroad users will be surveyed. A distinction is made between the following types ofmeasures:
(1) Technical and non-restrictive measures,(2) Technical and restrictive measures,(3) Non-technical and non-restrictive measures,(4) Non-technical and restrictive measures.
A technical measure is any measure that involves a modification of roads, trafficcontrol devices or vehicles. Non-technical measures comprise all measures that aredirected at road users directly, but do not change the traffic system as such.
The concept of a restrictive measure can be interpreted in many ways. As a firstapproximation, a measure will be regarded as restrictive if it:
(1) Reduces the opportunities for travel, for example by prohibiting driving at certaintimes (for example, night-time curfews for young and inexperienced drivers),
(2) Restricts the choice of mode of travel, for example by banning the use of a certaintype of vehicle (for example, banning certain types of motorcycles),
(3) Prolongs travel time, for example by imposing additional waiting time at crossingfacilities (for example, a vehicle actuated traffic signal may impose longer delayson pedestrians waiting to cross a road),
0,870,78
1,56
1,85
0,73
0,11
0,00
0,20
0,40
0,60
0,80
1,00
1,20
1,40
1,60
1,80
2,00
Pedestrians Cyclists Moped riders Motorcycle riders Young drivers Safest drivers
10
(4) Requires pedestrians and cyclists to adapt to motorised traffic, for example byimposing detours or restricting the use of traffic lanes (for example safety fencesat pedestrian crossings or a prohibition against cycling in driving lanes whencycle lanes are provided),
(5) Otherwise increases the cost of travel, for example by requiring the use ofprotective devices (for example making the wearing of cycle helmets mandatory).
It is recognised that there are more dimensions to the concept than these. Restrictionis primarily a psychological concept, related to the freedom of choice and to not beingsteered from outside. Perception of these qualities obviously varies betweenindividuals and is rather difficult to capture objectively.
A preliminary list of relevant measures is given in Table 1. The table does not includea classification of measures in terms of their technical nature or whether the measuresare restrictive or not.

11
Table 1: Preliminary list of relevant measures.
Pedestrians CyclistsMoped or motorcycleriders
Inexperienced drivers
Walking tracks Cycle tracks Licensing ageregulations
Licensing ageregulations
Sidewalks Cycle lanes Basic rider training Basic driver training
Road lighting Road lighting Advanced ridertraining
Advanced drivertraining
Simple markedcrossings
Simple markedcrossings
Graduated licensing Graduated licensing
Signalised crossings Signalised crossings Treatment of problemdrivers
Night-time curfews
Grade separatedcrossings
Grade separatedcrossings
Engine capacityrestrictions
Treatment of problemdrivers
Refuges in crossings Refuges in crossings Cycle designparameters
Special insurancesystems
Raised crossings Raised crossings Use of crash helmets
Safety fences atcrossings
Advanced stop linesfor cyclists
Protective clothing
Pedestrian streets Use of cycle helmets
Woonerfs etc Cycle designparameters
One way streets Lateral distancespacers
Street parkingprohibitions
Reflectors and lightson cycles
Pedestrians Cyclists Moped or motorcycleriders
Inexperienced drivers
Speed reducingdevices (humps)
Cycle brake systems
Reflective devices(clothing, etc)
Speed reducingdevices (humps)
Daytime running lightson cars
Daytime running lightson cars
Soft bumpers etc oncars
Soft bumpers etc oncars
Training of children Cycle training

12
3 MOBILITY DATA AND EXPOSURE
3.1 Definition of exposure
The basic concept of exposure denotes the opportunity for road users to becomeinvolved in accidents, that is, when a person occupies the road that person becomesexposed to risk of road accident involvement. Being exposed to risk is not the same asbeing involved in an accident.
Exposure is a measure of how much of an activity there is. For example how muchdriving on motorways, or riding on cycleways. Risk relates this to the number ofaccidents which occur. For high risk behaviour there may be many casualties forrelatively little activity, for low risk behaviours it may be possible to undertake a greatdeal of the activity with very few casualties.
A related concept is that of mobility. Mobility for road users is a measure of how theycan move within the road environment. If mobility is reduced, exposure and hencecasualties may also be reduced, but this reduced mobility may be unacceptable.
Exposure is usually assumed to relate to quantifiable measures; e.g. journey length, ortime spent in travel. But less easily quantifiable measures such as the busyness of theroads or behavioural factors such as whether children or elderly road users areaccompanied on their journeys also affect exposure. If risks are perceived to be high(regardless of the reality of the situation) this may lead to a reduction in mobility formany vulnerable groups.
Whilst vehicle flow multiplied by road length or trips by mode and trip length havelong been used as proxies for motorised vehicle exposure, measures of exposure ofother road users are much less well established. This is due to difficulties in definingtrips, measuring trip occurrence, and measuring interaction with other modes whichpresent risk to vulnerable road users.
Defining the basis of exposure measures is important to understanding. Definition ofexposure in different ways can imply very different risks to road users. Table 2 showsthe effect of considering exposure in terms of three different base measures; thedistance travelled, the time spent in travel, and the number of trips undertaken.
Taking the KSI (Killed and Seriously Injured) figures and comparing walking withcar travel in terms of distance, walking is about 12 times more dangerous than cartravel. But in terms of time spent travelling the risks are more similar with walkingbeing one and a half times more risky than being in a car, and in terms of trips there isabout the same risk during a walking trip as during a car trip.

13
Increasing mobility will result in increased exposure. However the increase inaccidents will generally be less than would be expected because the relationshipbetween traffic flows and accidents is non-linear. Summersgill et al (1996) haveshown that for pedestrians crossing at junctions increasing pedestrian flows result in areducing accident risk per crossing pedestrian. A similar reduction in risk per cyclistis found with increasing numbers of cyclists at junctions. These are specific examplesof a more general result which shows that for two interacting flows at a junction(whether these are car flows, pedestrian or other vehicle flows) accidents and flowshave a square root relationship
i.e.: Accidents car - ped = Constant. √Flow car .√Flow ped
3.2 Vulnerable road users
Pedestrians, cyclists and motorcyclists are particularly vulnerable to being injured ifthey are involved in an accident. However this is an area where the difficulties ofmeasurement are highest and existing sources of data least reliable.
Exposure for cyclists and pedestrians is very localised and site specific. They will beaffected by "boundaries" which do not affect motor vehicles. For example a majorroad may act as a barrier to a cyclist or walker but is a gateway to freedom ofmovement for a motor vehicle. The potential for interaction with vehicles depends onwhether they are on a footway or cycleway or on the road; whether they are in an area
Table 2: Number of casualties per units travelled by occupants and riders of severaltransport modes in the year 1988.
Casualty rate per 100 million
CasualtiesOccupant/rider trips
Occupant/rider km
Occupant/ riderhours
Killed
Pedal cycle 227 12.5 4.6 64
Walk 1753 7.0 6.6 27
Motorcycle 670 122 11.4 342
Car 2142 5.2 0.4 12.4
Bus and Coach 17 0.4 0.06 1.4
Killed and Seriously Injured (KSI)
Pedal cycle 4879 268 98 1377
Walk 17880 72 68 279
Motorcycle 12654 2311 215 6461
Car 29346 71 5.7 170
Bus and coach 892 14 2 51
From: Transport Statistics Great Britain 1979-1989

14
where motor vehicles are excluded or where there is speed restraint; whether they aremoving along or across any traffic streams.
The relationship between walking and road accidents is complex. Walking may occurin the vicinity of a road but walking in pedestrian areas (either segregated pathways orpedestrianised shopping areas) may form a significant proportion of a journey forsome walkers. Recreational and leisure walking is thought to be increasing but muchof this is away from roads and probably should not feature in discussions of roadcasualty reduction. Since most walking data is likely to come from self reporting itwill be necessary to ask people to identify the distances travelled on or beside publichighways, as well as the traffic flows, speeds and constraints on free vehiclemovement on each highway. This implies a very detailed questionnaire.
There are further complexities when the problems of age are considered. Elderly roadusers are known to adapt their behaviour to avoid some situations which they view asdangerous (e.g. reducing their driving or walking in the dark). Young pedestrians maybe playing at the road side and not "travelling" anywhere, thus reducing their apparentexposure if the measure is distance travelled between a trip origin and a tripdestination.
3.3 Policies which impact on exposure
Policies which are designed to affect travel behaviour may be applied at national orlocal level. These policies may affect different road users in different ways
Policies which are designed to encourage walking or the use of public transport mayobtain their effect by discouraging the use of the private car. This may be done bymaking car parking less convenient or more expensive in urban areas or by introducingrestrictions on access by cars to central areas of towns or to residential areas. Suchmeasures, seen as negative or restrictive by car drivers, are usually implemented toencourage shifts to more environmentally friendly modes of travel. Policies whichencourage particular modes of travel will often be supported by the provision of specificmeasures. For example countries which encourage cycling are more likely to providecycle facilities than those where cycling is viewed as less important. The result of this isthat where there are low levels of cycling the cyclists may be sharing the road space withother traffic and be at high risk of accidents. This means that the relationship betweendistance travelled by cyclists and accidents will not be a linear one. In countries wherethe amount of cycling is large the major part of cycle journeys may be travelled in saferconditions on cycleways and cycle lanes, hence keeping the accident levels down. Thedirection of cause and effect is not easy to see here. Where there is less cycling there isless demand for dedicated facilities but then the perceived risks of cycling may reducethe amount of cycling and hence the apparent need for facilities!
Another factor in this non-linearity will be that where cyclists form a significant part ofthe traffic flow the drivers of other vehicles are more likely to make allowance for theirpresence.Within recent years the UK government has introduced several new transport policiesaimed at encouraging the use of alternative methods of transport to the car.

15
In 1998 the UK government published its White Paper - A New Deal for Transport:better for everyone detailing its commitment to an Integrated Transport Policy. Thepaper states that planning guidance to local councils will be revised to reduce relianceon the car. Local services should be within walking distance and public transport linksshould be convenient. Guidance to local authorities will make it clear that higherpriority should be given to walking, cycling and public transport, improving facilitiesfor people to make connections and better information for passengers. Local transportplans will set local targets for increasing walking and cycling which will be achievedby such things as giving priority at junctions to reduce waiting times, maintainingcycle lanes and footpaths properly and relocating road space to cyclists andpedestrians where appropriate.
In 1996 the UK government launched the National Cycling Strategy with the aim thatby 2002, cycle use in the UK will double and then double again by the year 2012.This target is to be achieved by cycle friendly planning, improved cyclist safety, morecycle parking and road space, reducing cycle theft and changing attitudes towardscycling. As well as a national target, local authorities and other transport providersand trip generators are to set local targets as part of the strategy which will contributeto the central targets to increase cycle use. Initiatives such as school travel plans,which establish safer routes for children to walk and cycle to school, are encouragedas part of the strategy. One such scheme, the Myton cycleway in Warwick UK linkingmajor housing areas with schools has reduced traffic and emissions at school timesand offers students and residents a healthier travel option (DETR 1998).
Several local targets for the increase in cycling are reported in Matthew(1995).Bradford’s ‘Cycling Action Plan’ in 1993 recommended a target of an increase inoverall levels of cycling from 0.7% of all trips to 4% by 2001 but at the same timereducing the cycle accident rate by 30%. In 1994 the DOT gave an initial grant of£3million to the London Cycle Network which aimed to restore the level of cycleusage in London to 1981 levels by 1996 and to double these levels by 2001. TheOxford Local Plan Review of June 1993 set a target of increasing cycle use by 50%by 2000, and the city and county are continuing to engage in an energetic campaign ofcycle promotion, which includes a steady extension of cycle parking facilities. Onetarget within Bedford’s draft Structure Plan for 2011 is for 50% of all journeys towork within urban areas to be by public transport, walking or cycling with the help ofits newly launched ‘Travelwise’ public awareness campaign.
A UK pedestrian strategy is also planned with its own targets for the increase ofwalking. One target is to halt the current decline in walking by the year 2003 and toincrease the proportion of journeys where walking is the main mode to one third of alljourneys by the year 2008. Also it is hoped to increase the average distance walkedfrom 200 to 250 miles per person per year by 2008. The strategy will list actions to betaken at a national and local level to encourage walking, such as improving roadsafety, reallocation of road space, providing pavements fit to walk on, makingcrossing the road easier and increasing personal security. Local targets will also be setby local authorities. As a result of these new priorities in transport, existing fundingwill be reallocated towards pro-walking schemes.
Policies in other countries have developed the ‘sustainable traffic safety concept’ andthe ‘Vision zero” approach’.

16
The starting point of the sustainable safety concept - as it is being developed mainlyin the Netherlands (Wouters 1994) - is that in principle man is the reference standard.In the concept, we should try to drastically reduce the probability of accidents inadvance, by means of the infrastructural design. And where accidents still occur, theprocess which determines the severity of these accidents should be influenced suchthat serious injury is virtually excluded. Hence, a sustainable, safe traffic system has• a structure that is adapted to the limitations of human capacity through proper
design, and in which streets and roads have a neatly appointed function, thusavoiding improper use;
• vehicles fitted with ways to simplify the tasks of man and constructed to protectthe vulnerable human being as effectively as possible; and
• a road user who is adequately educated, informed and, where necessary,controlled.
The concept can be 'translated' in some, more practically oriented, safety principles:• prevent unintended use, i.e. use that is inappropriate to the function of that road or
street;• prevent large discrepancies in speed, direction and mass at moderate and high
speeds, i.e. reduce the possibility of serious conflicts in advance;• prevent uncertainty amongst road users, i.e. enhance the predictability of the
course of the road or street and people's behaviour on the road or street.
The 'Vision zero' of Swedish origin (Rumar 1996, Tingvall 1995) takes a differentstand in designing the road transport system from the most common safety strategy,which is generally based on designing the system to minimise the number of eventsthat cause injury. Starting point of its safety strategy is that the system has to bedimensioned in such a way that possible conflicts, or incidents which might causeinjury, never result in exceeding a politically pre-defined level of an unacceptable lossof health. In achieving the 'zero vision' in reality, the intention is to create a situationin which exposure to violence is minimised. At the same time, the degree of violencehas to be kept below the violence tolerance level of an optimally protected humanbeing. So, in this approach too, man is in principle the reference standard. Someprovisional elaborations of the concept partly resemble in practice, as we understandit, elements of the sustainable safety concept.
The 'Zero Vision' concept was recently adopted in Denmark.
3.4 Data available on exposure of vulnerable road users
The most widely used measure of exposure is the distance travelled in differenttransport modes. This requires detailed surveys on travel behaviour which are, ingeneral, expensive. Only a few countries have routine collection of travel data whichis detailed enough to allow the exposure of vulnerable road users to be estimated.The OECD report on Vulnerable road users (OECD 1998) collated exposure datafrom a number of countries (see Table 3).
The report describes the type of travel surveys undertaken in member countries.While the data varies between countries it is possible to use it to make estimates of the

17
exposure for different groups within the population.
3.4.1 Walking
Short Trips in European countries (WALCYNG 1996) presents data taken fromnational travel surveys , literature and statistical surveys in European countries. Table4 shows data on the number of trips in 10 countries. The sources are as in the OECDreport with extra information from Norway – National Travel Survey 1991/92,Germany – Kontinuierliche Erhebung zum Verkehrsverhalten 1989, and Austria –Verkehrhebung 1992.
Data is also given on the length of walking and cycling trips. In Norway, 68% ofwalking trips are shorter than or equal to 1km, and 83% are shorter or equal to 2km.For the other countries similar figures are 76% under 2km for Sweden, 82% forDenmark, 82% under 2.5 km (1 mile) in Great Britain, 90% under 2.5km for theNetherlands, 86% under or equal to 2km for Germany and 87% for Switzerland.Averages for Austria and France show a mean length of around 1km, but most walksare shorter than 1km, though some long walks give a rather high average. The Finnishdata shows that only for trips shorter than 1km are the non-motorised transport modesprevailing. It seems that an acceptable distance for walking is between 1 and 2km.The average length of walking trips varies from just under 1 km in Great-Britain to2.8km in Finland
Table 3: Travel surveys in member countries (from OECD 1998).
Country Survey Year No. of persons incl.in survey
Age
Finland National 1992 7 125 18-70 years
Sweden National-ongoing 1994 5 235 6-84 years
Denmark National-ongoing 1992 6 243 6 years and older
Great Britain National-ongoing 1991-93 25 173 all
The Netherlands National-ongoing 1992 25 000 12 years and older
France Grenoble 1992 6 years and older
Lyon 1985 6 years and older
Switzerland National 1994 43 006 10 years and older
Australia National 1985-86 45 000 all
New Zealand National 1990 8 719 5 years and older
Japan Tokyo-Urban area 1988 820 000(300 000 families)
5 years and older

18
The Finnish and Danish data includes all trips longer than 200m and 300m respectively. The data for all the othercountries includes all trips.
Survey data from seven European countries (Denmark, Finland, France, Great Britain,the Netherlands, Sweden, Switzerland) is presented in WP1 (Pedestrians problemanalysis; PROMISING, 2001a). The data show that 15-30% of all trips are made bywalking, the highest figure being for Great Britain; the proportions decrease significantlywhen only considering trips between home and work. For short trips under 5km, thefigures may rise to 40%, or more as in Great Britain; however, use of the car remainsfrequent with 30-60%, of trips using the car, but this is lower in the Netherlands due toextensive use of bicycles.. Generally, the number of daily walking trips is higher forwomen than for men, and it does not seem to vary much according to age, except forDenmark and Switzerland where elderly people tend to walk more.
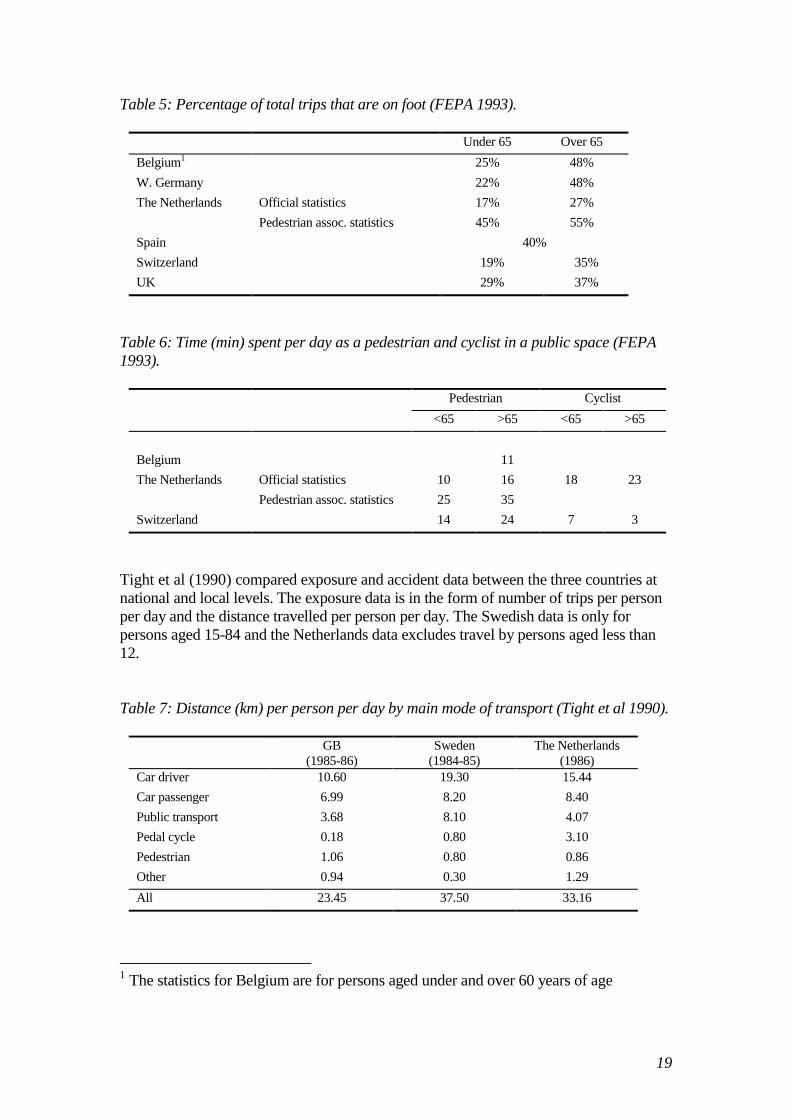
The Federation of European Pedestrian Associations reviewed the position of theelderly pedestrians in Europe (1993) on behalf of the EC’s European Year of OlderPeople. The report gives exposure data collected from pedestrian associationsthroughout Europe concentrating especially on those over retirement age. Theexposure while walking and cycling of those over retirement age and those underretirement age are compared in terms of the percentage of trips on foot and the timespent walking and cycling in a public space are shown in Tables 5 and 6.
Table 4: Number of walking and cycling trips per person per day.
Country Year On foot Bicycle
Norway 1991/92 0.66 0.20
Sweden 1994/95 0.48 0.37
Finland 1992 0.39 0.22
Denmark 1992 0.30 0.50
Great Britain 1992/94 0.84 0.05
The Netherlands 1994 0.67 1.01
Germany 1989 0.79 0.34
Austria (Ober) 1992 0.55 0.18
Switzerland 1989 0.75 0.33
France – Grenoble 1992 0.98 0.16
France – Lyon 1985 1.15 0.06
19
Table 5: Percentage of total trips that are on foot (FEPA 1993).
Under 65 Over 65
Belgium1 25% 48%
W. Germany 22% 48%
The Netherlands Official statistics 17% 27%
Pedestrian assoc. statistics 45% 55%
Spain 40%
Switzerland 19% 35%
UK 29% 37%
Table 6: Time (min) spent per day as a pedestrian and cyclist in a public space (FEPA1993).
Pedestrian Cyclist
<65 >65 <65 >65
Belgium 11
The Netherlands Official statistics 10 16 18 23
Pedestrian assoc. statistics 25 35
Switzerland 14 24 7 3
Tight et al (1990) compared exposure and accident data between the three countries atnational and local levels. The exposure data is in the form of number of trips per personper day and the distance travelled per person per day. The Swedish data is only forpersons aged 15-84 and the Netherlands data excludes travel by persons aged less than12.
Table 7: Distance (km) per person per day by main mode of transport (Tight et al 1990).
GB(1985-86)
Sweden(1984-85)
The Netherlands(1986)
Car driver 10.60 19.30 15.44
Car passenger 6.99 8.20 8.40
Public transport 3.68 8.10 4.07
Pedal cycle 0.18 0.80 3.10
Pedestrian 1.06 0.80 0.86
Other 0.94 0.30 1.29
All 23.45 37.50 33.16
1 The statistics for Belgium are for persons aged under and over 60 years of age

20
Table 8: Trips per person per day by main mode of travel (Tight et al 1990).
GB(1985-86)
Sweden(1984-85)
The Netherlands(1986)
Car driver 0.87 1.14 1.13
Car passenger 0.54 0.42 0.48
Public transport 0.31 0.34 0.18
Pedal cycle 0.07 0.32 0.95
Pedestrian 0.95 0.66 0.60
Other 0.05 0.04 0.09
All 2.80 2.92 3.43
It is interesting that in total the Swedes travel 1.6 times as far as the British and about thesame as the Dutch. However, walking and cycling make up 5 and 4 per cent of the totaldistance travelled in Britain and Sweden respectively and 12 per cent in the Netherlands.When not in their cars, the Swedes use public transport and the Dutch cycle. On averagethe British do not travel as far as the Swedes or the Dutch: when not travelling by carthey are most likely to be on public transport or walking.
ADONIS (1998) presents data from a survey of attitudes to modal choice for shorttrips in three large European cities. A total of 354 people from Amsterdam, Barcelonaand Copenhagen were interviewed.
Of total trips made by all modes, the proportion of walking journeys ranged from 9%in Copenhagen to 18% in Amsterdam and 31% in Barcelona. Of total trips made byall modes, the proportion made by bicycle was highest in Copenhagen (51%)followed by Amsterdam (34%). None of the interviewees bicycled in Barcelona. Onaverage, people in Amsterdam and Barcelona made more trips on foot (2.5 and 2.7)compared with Copenhagen (1.7). More trips per day were made by bicycle inAmsterdam (3.5) than Copenhagen (2.2). The average trip by foot was shortest inBarcelona (0.77km) and longest in Copenhagen (2.27km): in Amsterdam the averagedistance was 1.06km. An average journey by bicycle was roughly the same length inAmsterdam (2.59km) and Copenhagen (2.60km).
In Amsterdam people travelled to work mainly by car (55%) or bicycle (42%) and veryfew walked. In Barcelona most people would drive to work (65%) but a substantialnumber would also walk (40%). In Copenhagen most journeys to work and school wereby bicycle (65%). In Amsterdam and Copenhagen personal business was, to a largeextent, carried out by bicycle (50% and 65% respectively) whereas in Barcelona peoplewould walk(65%). Leisure journeys in Amsterdam (53%) and Copenhagen (59%) weremainly by car whereas in Barcelona they were on foot (63%). Multimodal trips weremost common in Amsterdam and the least common in Copenhagen. 14% of all journeysby foot, 5% of all bike trips and 1% of all car trips were combined trips.The differences in the amount of walking and cycling where investigated with regard toattitudes and behaviour in the three cities. In all three cities the most important reason forwalking was distance, the acceptable length appearing to be around 1km. People inBarcelona where very negative about cycling believing that it was not a comfortablemode of transport and that they felt very vulnerable on a bike.

21
Jensen (1998) presents data from the Danish travel surveys of 1993-1995, May 1997 andfrom the national travel survey of children and the elderly 1993-94. Danish peoplewalked 1.2 billion km per year during 1993-95. During May 1997 about 65% of tripsless than 300m were on foot and 16.7% by bicycle. The report looked at the effect agehas on exposure in terms of km walked per day and risk.
The study shows that people in large cities in Denmark walk further than those in lesswell populated cities. A person in municipalities with 0-25,000 inhabitants walked onaverage 0.4km per day compared to an average of 0.6km per person per day walked in amunicipality with 50,000-99,999 inhabitants. People in Copenhagen and Frederksbergwalked on average 0.9km per person per day but in the suburbs close to Copenhagen theaverage was 0.7km per person per day.
Table 9: Total distance walked (km) per day by each age group.
Age Distance walked per day (km)
16-24 430,000
25-34 470,000
35-44 370,000
45-54 340,000
55-64 280,000
65-74 260,000
75+ 380,000
The report also gives relative risk for walking in twilight and darkness in comparisonwith daylight, walking in rural compared with urban areas, and crossing roads comparedwith walking alongside roads. The risk of injury when walking was less overall on ruralroads than urban roads but pedestrians on rural roads were more likely to be injuredwalking along the road and walking in twilight or darkness than urban pedestrians.
Table 10: Pedestrian casualties per million km walked.
Daylight Twilight anddarkness
Crossing Walking alongroads
Total
Urban areas 0.74 1.97 0.79 0.11 1.03
Rural areas 0.28 2.08 0.26 0.18 0.59
Promising WP1 presents data from France’s two surveys which collect travel data(Rennesson and Lourdaux, 1998; PROMISING, 2001a). A national survey ‘INSEEtransport & communication survey’ covering the whole of France collecting dailyshort distance trips and long distance weekend trips. Also Household Surveys arecarried out at town level, collecting data on individual travel practices, modal split aswell as opinions and attitudes towards transport.
23.2% of weekday trips in France are walking trips (people aged over 5 years,continental France, 1993-94).

22
Table 11: Modal split according to purpose.
Walking Two-wheelers
All purposes 28% 4%
Related to work 11% 6%
Related to school 42% 6%
Local shopping 49% 5%
Large shops 15% 2%
As with the Danish report the amount of walking was greater in areas with largerpopulations than those with smaller populations. 30.5% of weekday trips in Paris werewalking trips compared with only 17.6% of trips in districts with a population of lessthan 50,000, 21.6% of trips in districts with a population of 50,000 to 300,000, and23.5% of trips in districts with a population of over 23.5%.
The report discussed the effect that jobs and age had on exposure. Farmers walked theleast frequently with only 9.9% of their trips on foot. Those without a job walked 31.6%of their trips. Pensioners and children aged 6-14 walked 33.1% and 39.5% of their tripsrespectively.
Breithaupt (1994) selected four residential areas in the Netherlands selected and 600questionnaires were distributed to parents through schools. A response rate of 73%was reported as 434 usable questionnaires were returned. Also 330 children and 100parents, who had themselves grown up in the area, were interviewed. The studyfocused on four main areas: the age of independence, the frequency of play outside,whether play was supervised and the degree of independence in moving around.
Table 12: Frequency of play outside.
Amsterdam Haarlem Loon op Zand Weststellingwerf
Almost never 31.3% 13.4% 1.6% 1.1%
Once a week 12.6% 5.9% 3.8% 0.5%
Twice a week 30.8% 22.7% 21.9% 15.8%
Three times a week + 25.2% 58.0% 72.7% 82.5%
The study concludes that in places where basic traffic engineering measures havebeen taken, the children enjoy a greater freedom of movement but that even thosechildren living on a ‘woonerf’ have their movements restricted by the nearest busyroad.
Ward et al (1994) details a pedestrian exposure study in Britain funded by the AAFoundation for Road Safety Research in 1994. Northampton was chosen because it isa typical self contained British town. A sample of 400 private households were used.An interviewer called and left self-completion diaries for each member of thehousehold aged over 5 years after they had agreed to take part. They were asked torecord their activity on foot during a specified day. The interviewers called back and

23
checked that enough information had been given to enable them to re-walk all thewalks and for all other activities on foot to be located. While re-walking theinterviewers recorded details such as road type, pavement condition, lighting and typeof crossing facility used.
The study showed that people in Northampton made on average 2.4 walk trips a dayand for those that walked, the distance travelled was about 1100m. These data aresimilar to the data reported by Tight et al. The average trip length was 0.48km and theaverage number of roads crossed by those who walked was 5.51, 15% of them atprotected crossings.
The study looked at the effect on exposure of age, socio-economic group, caravailability and health. 85% of 5-9 year olds walked on the survey day compared toonly 59% of those aged 65 and over. Only 50% of those registered disabled walked onthe survey day compared with 75% for the population as a whole. Among those withno car available, those who live in a household where the head is unemployed wereless likely to walk than those with employed heads. Other than this differences inexposure between those with cars available and those without and between socio-economic groups showed no clear pattern.
In a study carried out by TRL (Lowe 1999) a random sample of 10,000 adults inEngland were sent a questionnaire with a travel diary and asked to detail all walking andcycling journeys on a single day. Included with each of these was a children’s version ofthe questionnaire which was intended for any child between the ages of 5 and 16 livingin the household of the adult respondent. Approximately 20% of the questionnaires werereturned and a telephone survey of non-respondents demonstrated that the sample wasrepresentative of the population.
The questionnaire included questions on the number of roads crossed and the business ofthose roads as well as estimates of the time spent walking or cycling. (the respondents’memory of time spent walking was shown to be an accurate measure of actual timespent).
The respondents made an average of 1.85 walking trips a day and spent 33 minuteswalking. The respondents who walked crossed an average of 5.07 roads a day with 26%of them at protected crossings. An average of 0.18 cycling trips a day were made by therespondents. Those who cycled spent an average of 58 minutes cycling a day. 21% ofthe child respondents played on or by the road for, on average, 111 minutes a day.
Variations in exposure relating to age, gender, socio-economic group, car availability,ethnicity, health, region of the country and day of the week were studied. 30% of malesaged 11 to 15 cycled on the survey day but only 8% of females of this age cycled. Therewas no clear trend in the differences in the amount of cycling between different jobcategories, but manual workers made longer walking journeys. 72% of the respondentsin London walked on the survey day compared with 65% nationally. At weekendsrespondents made fewer trips but spent more time walking. 68% of children whoseparents do not have a car available to use walked to school compared to 55% of thosechildren whose parents have a car.
Silcock et al (1998), video-recorded a range of locations in Britain where pedestrians are

24
at risk. Computers were used to analyse the video tapes and extract data concerning thenumber of crossing movements and interactions between pedestrians and vehicles. Thenumber of pedestrians crossing the road was taken as the indicator of exposure as thegreat majority of pedestrian accidents result from failed attempts to cross the road safely.
They called the interactions ‘rated events’ with the rating related to severity of risk. Theless serious interactions between pedestrians and vehicles were coded as either:
Encounters - situations in which at least one of the traffic participants observably adaptshis/her behaviour by a change of speed or a change of course,orConflicts – two traffic participants maintain such course and speed that a sudden evasivemanoeuvre of one of the participants is required to avoid collision.
The presumption is that a relationship exists between the numbers of accidents recordedand the numbers of encounters and conflicts observed.Around 150 rated events per thousand crossing events were observed in zones with nocrossing facilities or within 50 metres of a crossing facility, compared with rates of 30 orfewer rated events per 1000 crossings on refuges, Pelicans or at other light controlledjunctions.
Analysis revealed that more males are involved in events relative to the number crossing.Age also has an influence with young males and older females appearing to be thegroups more involved in more than the expected number of events, particularly awayfrom formal crossings.
3.4.2 Cycling
Matthew (1995) reports cycle trips as a percentage of total trips for various EuropeanCountries, cities and towns as well as trend data in the amount of cycling, includingtargets set by individual towns.

25
Parker (1996) shows how the number of cars in a Danish household affects theamount of walking and cycling. The data is from the Danish national travel survey(1992).
Table 14: Kilometres walked/cycled per person per day.
No car One car Two + cars
Walking 1.0 0.5 0.4
Cycling 3.0 1.3 0.7
Table 13: Cycle trips as a percentage of total trips.
Country Town Past % Cycle trips
Sweden Malmo 20%
Vasteras 33%
Denmark National 18%(1993)
Finland National 12%(1986)
Great Britain National 2%
Oxford 26%(1984) 21%
York 22%
Birmingham 2%
Colchester 7%
Leicester 4%
Cambridge 34%
Bradford 1%
Nottingham 3%
The Netherlands National 27%
Groningen 57%
Tilburg 36%
Delft 40%(1982) 43%(1985)
Houten 33%
Poland Krakow 20%
Germany National 11%(1991)
Munich 6%(1976) 15%
Hanover 9%(1976) 16%
Munster 29%(1981) 43%(1992)
Austria Salzburg 11%(1985) 19%
Graz 7%(1979) 14%(1991)
Switzerland Basle 8%(1970) 16%(1990)
Geneva 20%
France Strasbourg 12%
Italy Padou 12%

26
Edwards (1998) gives the percentage of journeys which are made on foot or bybicycle in the Netherlands and Great Britain. In total there were 4.4 billion km cycledin Great Britain in 1994. The figures for the Netherlands are for 1989 and for GreatBritain are for 1985/86 from the National Travel Surveys in the two countries.
Table 15: Cycle journeys in the Netherlands and Great Britain.
The Netherlands Great Britain
Journeys by cycle per week 7.1 0.5
Percentage of all journeys 27.5% 2.4%
Km by cycle 22.8 1.4
Percentage of all km 9.4% 0.8%
% walking and cycling of all journeys 36% 45%
The WP2 report about cyclists (PROMISING, 2001b) presents slightly different datataken from Hansen (1994) and Carré (1997) for the modal share of cycling and alsoshows how bicycle ownership varies between the countries of Europe and how itrelates to cyclist exposure.
Table 16: Bicycle ownership and modal split.
Inhabitants,thousands
(1992)
No. of bikes,thousands
(1991)
Bikes/thousandinhabs.
Bike km peryear, billions
(1992)
Bike kmper inhab.per year
Modalsplit %
Denmark 5162 4500(1992) 870 2.7 520 17
Finland 5029 3500 690 7
France 57206 19000 330 11 190 2.8
Great Britain 56388 25000 440 5 90 1.5
Netherlands 15129 15000 990 12.5 830 28
Norway 4286 3000(1992) 700 1.3 300 4
Sweden 8643 6000 690 3.3 380 15
As well as discussing general exposure data in distance cycled Mynors et al (1994)look at the effect of weather and geography on exposure. The seasons create greatervariations in traffic levels for bicycles than for cars. Only the Netherlands appears tomaintain detailed national statistics on this (Centraal Bureau voor de Statistiek,1992).In 1991, these show that the fewest cycle trips were made in December – 21% fewerthan for the average day – while the most cycle trips were in May and August, whichregistered 13% more daily trips than the average. For cycle kilometres, the variationwas greater, with 33% less than average in December, and 34% more than average inAugust. Such figures as are available for Germany give a similar result. A study ofoffice workers in Copenhagen in 1989 indicated that of those people who normallycycled to work in good weather, 60% still cycled when it was raining. In winter, 66%cycled except in slippery conditions, when the figure was reduced to 39% cycling.
O’Donoghue (1993) uses UK traffic census data and National travel survey data toinvestigate cycling on different classes of road. 81% of pedal cycle traffic is on minor
27
roads, 14% on major built-up roads and only 5% on major non built-up roads. Thereport also gives similar statistics for motorcycles: 46% on minor roads, 25% onmajor built-up roads, 23% on major non built-up roads and 6% on motorways.1989/91 NTS data shows that cycling was most common during May-July, averagingaround one-fifth more than the rest of the year. In 1989/91 36% of households had atleast one cycle and every 100 people owned 27 bicycles. An average person made 21cycle journeys a year and cycles 41 miles a year. An average cycle travelled 153 milesper year.
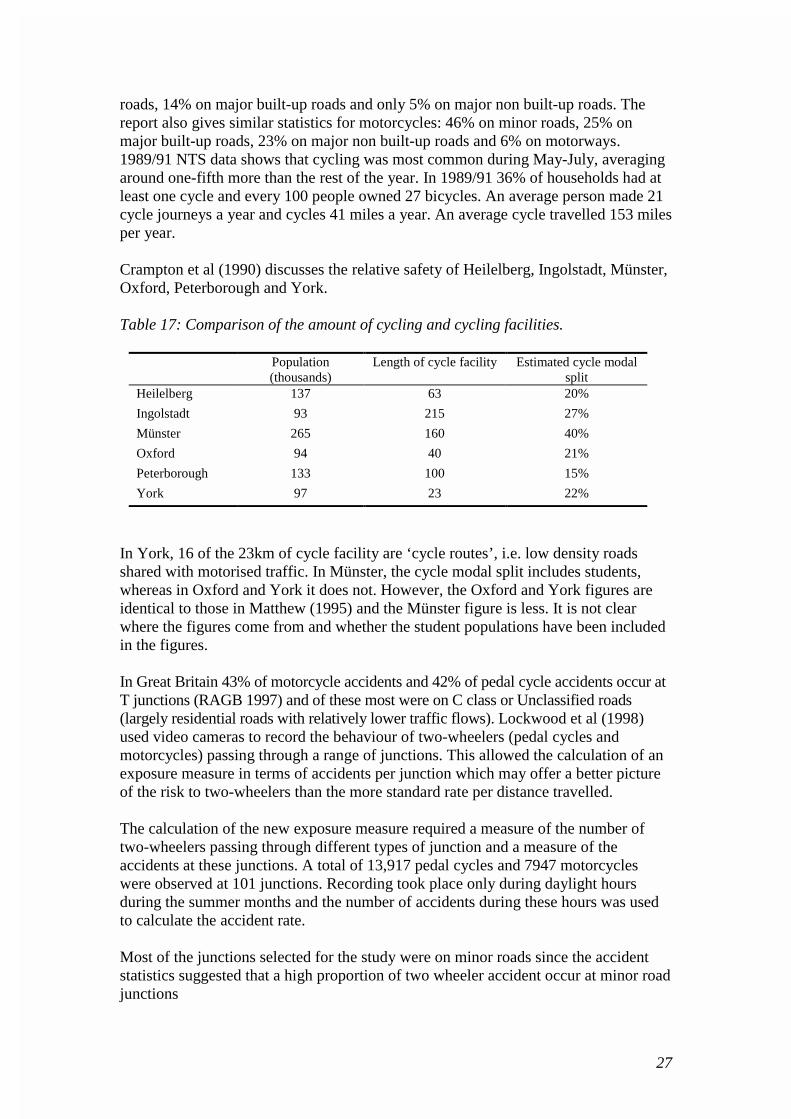
Crampton et al (1990) discusses the relative safety of Heilelberg, Ingolstadt, Münster,Oxford, Peterborough and York.
Table 17: Comparison of the amount of cycling and cycling facilities.
Population(thousands)
Length of cycle facility Estimated cycle modalsplit
Heilelberg 137 63 20%
Ingolstadt 93 215 27%
Münster 265 160 40%
Oxford 94 40 21%
Peterborough 133 100 15%
York 97 23 22%
In York, 16 of the 23km of cycle facility are ‘cycle routes’, i.e. low density roadsshared with motorised traffic. In Münster, the cycle modal split includes students,whereas in Oxford and York it does not. However, the Oxford and York figures areidentical to those in Matthew (1995) and the Münster figure is less. It is not clearwhere the figures come from and whether the student populations have been includedin the figures.
In Great Britain 43% of motorcycle accidents and 42% of pedal cycle accidents occur atT junctions (RAGB 1997) and of these most were on C class or Unclassified roads(largely residential roads with relatively lower traffic flows). Lockwood et al (1998)used video cameras to record the behaviour of two-wheelers (pedal cycles andmotorcycles) passing through a range of junctions. This allowed the calculation of anexposure measure in terms of accidents per junction which may offer a better pictureof the risk to two-wheelers than the more standard rate per distance travelled.
The calculation of the new exposure measure required a measure of the number oftwo-wheelers passing through different types of junction and a measure of theaccidents at these junctions. A total of 13,917 pedal cycles and 7947 motorcycleswere observed at 101 junctions. Recording took place only during daylight hoursduring the summer months and the number of accidents during these hours was usedto calculate the accident rate.
Most of the junctions selected for the study were on minor roads since the accidentstatistics suggested that a high proportion of two wheeler accident occur at minor roadjunctions

28
Table 18: Two-wheeler accidents per traverse of a junction
Junction type
Major/minor Minor/minor Residential Roundabout
No of sites 24 19 38 20
Accidents per milliontraverses
1.16 1.74 1.27 3.34
The study has shown that two-wheelers are particularly at risk at roundabouts. Most ofthese were large roundabouts with several entry lanes. The study did not include mini-roundabouts which have been found in some European studies to reduce two wheeleraccidents
3.4.3 Motorcyclists
In a survey carried out in Britain by the Social and Community Planning Research1987/1988 (Lynn 1990) 10,000 questionnaires were sent to a random national sampleof motorcycle owners. The questionnaires included questions on age, sex, ridingexperience, tests passed, exposure, engine size and details of accident involvement.6245 questionnaires were returned by current riders.
The average yearly mileage of all motorcycle riders was calculated to be 3700 miles.Females rode on average 2083 miles a year and males 4020. 19 year olds had thelargest mileage, 5561 compared to 1797 miles a year for those aged 55 and over. Theaverage mileage for bikes up to 50cc was 2342 and for over 500cc was 5705. Themajority of respondents did all or most of their mileage in built-up areas. 45% didmost of their biking in daylight.
Broughton (1995) presents data from the UK National Road Traffic Survey and showsbillion vehicle kilometres travelled by road class for motorcycle and pedal cycles (seeTable 19).
Pedal cycles are not allowed on motorways. It can be seen that motorcycles travelfurther than bicycles on the main roads but the opposite is true on the minor roads.Roads are classified as built-up or non built-up according to the speed limit, abuilt-up road has a limit of at most 40mph (64km/h). Major roads are motorways andA class roads, minor roads are B and C class and unclassified roads. A roads arefurther classified into Trunk roads, for which the national government is responsible,and principal roads which are the responsibility of the local authorities.

29
3.4.4 Young drivers
As part of a survey carried out in Finland (Hatakka et al. 1992), 42,000 questionnaireswere sent out to young drivers requesting accident and exposure data. There was a75% response rate. The data consists of self-reported exposure data from 7605 youngdrivers aged between 18 to 20 with driving licences 6 to 20 months old. The averagetotal mileage was 17520km and 1397 km/month. For comparison a group of 6730new drivers aged 21 and older had a average total mileage of 9443km and891km/month. The average mileage in km/month was 992km for females and1797km for males.
Table 19: Distance travelled by road class (billion vehicle km).
Motorcycles Pedal cycles
Motorways 0.2 0
Built-up major roads Trunk 0.1 0
Principal 0.9 0.6
All 1.0 0.6
Non built-up major roads Trunk 0.4 0
Principal 0.6 0.2
All 1.0 0.2
All minor roads 1.9 3.6
All roads 4.1 4.4

30
4 FACTORS INFLUENCING EXPOSURE/MOBILITY
Car availabilityData from the 1992 Danish national travel survey shows how car availability affectsthe average distance walked. The distance walked per day drops from an average of1km for those with no car to 0.4km for those with two or more cars. (Parker 1996)
EthnicityIn a recent British national survey, of those children living in a household with a car,30% of children from non-white backgrounds walked to school compared with 15%of white children.
AgePeople aged over 65 make a higher proportion of their trips on foot than those agedunder 65 but make fewer trips and walk on average less distance than younger people.
Rural/urban30.5% of weekday trips in Paris are walking trips compared with only 17.6% of trips indistricts with a population of less than 50,000. (Papon 1997).
Socio-economic groupingData from the French INSEE transport and communication survey shows thatindividuals without a job walk the most with 31.6% of their trips being on foot. Ofthose who work, employees walk the most and farmers walk the least (9.9%). (Papon1997).
HealthThe pedestrian study of Northampton carried out in 1994 asked respondents if theyhad difficulty going out on foot. Of those with such a difficulty 60% walked on thesurvey day compared with 50% of those registered as disabled and 76% of those withno difficulty walking. (Ward et al. 1994).
Weather conditionsIn 1989 a survey of office workers in Copenhagen showed that 66% of those whowould normally cycle to work, cycled if it was raining and only 39% cycled inslippery conditions. (Mynors et al. 1994).
Time of yearNTS data from Britain (1989/91) shows that cycling was most common during May-July, averaging around one-fifth more than the rest of the year. (O’Donoghue 1993).

31
5 DATA AVAILABLE ON ACCIDENTS
5.1 National data
National accident data collection systems vary between countries. In a survey for theEU project DUMAS, it was found that, in general, the police attend accidents anddraw up an accident report if there is a casualty. In some countries (the CzechRepublic, France, Germany), the police also draw up an accident report for accidentswhere there is material damage only, when the damage is serious enough to exceed acertain cost. In Italy material damage only accidents were recorded up to 1991 and inAustria up to 1994. However, inaccuracies in reporting the various values containedin the national road accident data collection form are observed in all nine DUMAScountries. Such inaccuracies are increasing due to the lack of proper training of thepolice officers collecting the information.
Definitions of the road accident types contained in national accident data showdifferences among the various European countries. Even a basic concept such as thedefinition of a fatal accident, shows important differences. The international definitionof persons killed in road accidents, as the persons who died within 30 days from theday of the accident, is used in most of the European countries. However, differentdefinitions are used in France (6 days), Italy (7 days), Spain, Greece and Portugal (24hours). Correction factors are used by these countries for the conversion to theuniform European definition.
Table 20 gives the definitions of injury severity among the various EU countries. Theminimum injury for which it is required that the accident is recorded is also differentin each country. In particular, the distinction between seriously and slightly injuredpersons show significant differences among countries. For example in Italy there is nosuch distinction of injury severity.

32
Table 20: Comparison of basic definitions of road accident terms used in the EUcountries (DUMAS WP4)
definition of Correction Definition of Definition of Criteria of Definition of Reporting Reporting ofperson killed factor to the seriously slightly injury degree build-up area of injury material damage
30 days deaths injured injured accidents only accidents
Germany 30 days 1Hospitalised
> 1 dayOther injuries
Duration tothe hospital
Zone inside city /commune signs
yesMore than 4.000
DM
France 6 days 1,09Hospitalised
> 6 daysHospitalised
< 6 daysDuration to
the hospitalZone inside city /commune signs
yes no
Italy 7 days 1,07 - - -Built-up area
yes up to 1991
Netherlands 30 days 1 - - -Built-up area
yes yes
Belgium 30 days 1Hospitalised
> 1 dayOther
Duration tothe hospital
Zone inside city /commune signs
yes no
Luxembourg 30 days 1Hospitalised
> 1 dayOther injuries
Duration tothe hospital
Zone inside city /commune signs
yes yes
Great Britain 30 days 1Hospitalised +serious injuries
Slight injuriesHospitalised +injuries' type
Inside zone with speedlimit of 30/40 km/h
yes no
Ireland 30 days 1Hospitalised
> 1 dayOther
Duration tothe hospital
Inside zone with speedlimit of 30/40 km/h
yes no
Denmark 30 days 1Fractures, burns,
crane injurySlight injuries
Type ofinjuries
Zone inside city /commune signs
yes At local level
Greece On the spot 1,12 HospitalisedNot
HospitalisedHospitalised
Built-up areayes no
Spain30 days (1 day up
to 1994)1 (1,3 up to
1994)Hospitalised
NotHospitalised
HospitalisedBuilt-up area
yes no
Portugal On the spot / transportto the hospital
1,3 HospitalisedNot
HospitalisedHospitalised
Zone inside city /commune signs
yes From 1987
Europe 12 30 days - - - - 12 5
5.2 Hospital data
Hospitals collect data on attendance at emergency departments and admissions. Thisinformation often includes information on road traffic accident casualties. Thisinformation is useful for cross-checking data collected by police and to record deathsoccurring after the accident. Whilst not as rigorously checked as police recordedaccident data they provide a means for estimating the degree of under-reporting ofaccidents and casualties in the police files.
Comparison of accident data and the police record for a particular accident can also beused to check on the accuracy information contained within the records. For example,in England, in a comparison of hospital admission data with the national road accidentdata file, it was found that for every five casualty records reported to the police fourmatching hospital admission records had factual errors on items such as age. AnotherBritish study shows that in 11.6 per cent of cases examined, the recorded age of thecasualty in the police data base has been erroneous.
5.3 Insurance company data
The files of insurance companies include information on both injury and damage-onlyaccidents but they are not exhaustive, as at least two large categories of accidents arenot included: 1) single vehicle accidents involving vehicles without full insurance and2) accidents with minor material damage in which the persons involved prefer not tomake insurance claims.
33
In general, it is difficult to use data from insurance companies and in many countriesthey are not used for accident analysis. However for small scale accident analysis e.g.for identifying black spots, it may be possible to obtain information on such accidentsthrough insurance companies. Since material damage only accidents are far morenumerous than accidents with casualties they may allow for a better statisticalanalysis, especially in urban areas where they occur more frequently. The bestestimates currently in use in Britain of the ratio of damage only accidents to injuryaccidents is about 15:1. The use of insurance company data would help to refine theseestimates.
However, problems with the commercial sensitivity of insurance company data andthe fact that it is collected for a different purpose make access to, and use of it,difficult.
5.4 Location of accidents
In order to carry out detailed analysis a reliable system of location of accidents isnecessary. The identification of the exact location of an accident is often a difficulttask for the police. This is a problem which leads to varying levels of inaccuracybetween countries and within countries when the urban and rural networks areconsidered separately. Within built-up areas accidents are usually located by streetname and at intersections by the names of the intersecting streets. On urban links,non-junction accidents are usually located by street number or by reference toprominent buildings or squares. However, in rural areas there is no such convenientdense network of roads and junctions to use for locating accidents and reference tokilometre markers is one of the most frequently used methods. This has a highpotential for error and many accidents cannot be located to within 100 metres ormore.
With the advance of information technology the quality of the locational data shouldimprove. Geographic Information Systems (GIS), already used in some EU countries,currently provide a means for systematic recording of accident locations and whenthey are more widely used, consequent improvements in recording of location areexpected to occur. In the future, the use of Geographic Positioning Systems (GPS)will provide for the necessary accuracy in the recording of the accident location.
5.5 Comparison between national data sets
There are sufficient differences between countries to make it difficult to comparenational databases across the whole range of casualties. Table 20 above showed thedifferent definitions of injury severity in use. Until a systematic injury severitydescriptor is in common use, only the comparison of fatalities between countries isreliable, and even then, adjustment factors need to be used for some countries’ data.
Access to national road accident data files suffers from data confidentiality problems.In many countries, the users of the accident data, such as local authorities, cannot gaindirect access to the national data base. The solution is to use the local databases whichare held by the police, or to request tabulations and aggregations from the holders of

34
the national database. There are also problems in accessing data due to the differentmethods used for data storage. Under the framework of the EU CARE project accessto national disaggregate road accident data files has been granted to authorisedadministrations from some EU countries. In December 1997, seven countries werelinked to each other’s data through the CARE system. The access to nationaldatabases and, through the CARE system, to the databases of other countries, is usefulmainly to those interested in international comparisons of accident data and accidentrisk. At a local level, the more useful comparisons are likely to be those between onetown and another in a region.

35
6 UNDER-REPORTING OF ACCIDENTS
Under-reporting of accidents is a problem in all countries. The reason that under-reporting rates are calculated is to give road safety researchers and practitioners abetter estimate of the real scale and risk of injury to different groups of road users.Not all accidents, nor all injured persons in reported accidents, are reported to thepolice even if they occur on the roads and involve vehicles. Under-reporting is likelyto create a bias in the data because serious or fatal accidents are more often reportedto the police than slight ones. Fatal accidents have a high level of being recorded asthe police are usually called and spend some time at the site investigating thecircumstances of the crash. When people are involved in an accident where there areinjuries, but no-one goes to hospital, research has indicated that they are much lesslikely to report the accident to the police. These slight accidents are also less likely toresult in the police attending the scene to control traffic or to take statements fromthose involved, this decreases the likelihood of them coming to the attention of thepolice.
In most countries under-reporting is a particular problem for vulnerable road usersand the percentage of cyclist casualties whose accidents are in the hospital recordsand reported to the police may be as low as 10 percent in the case of slight injury. Thecommonest unreported cycle accident (Mills 1989) is a single vehicle accident ofteninvolving a child and away from a highway. People, including the police, tend to viewthese as domestic or recreational accidents rather than traffic accidents. The reportingrates for pedestrian injury tend to be higher across the range of injury than for thepedal cycles with up to 80 percent of slight injuries being reported. Pedestrianaccidents most commonly result from motor vehicle impacts within the highwaysystem boundaries and are unlikely to be viewed as anything other than trafficaccidents. Table 21 gives an overview of the reporting rates in Britain.
However the levels of under-reporting cannot be assumed to be the same acrosscountries, and ETSC have collated information on reporting levels to calculate a costfor non-reported as well as reported accidents. To take account of the effect ofmisclassification, under-recording and under-reporting the number of serious andslight casualties appearing in national figures it has been estimates that these shouldbe multiplied by 2.76 and 1.70 respectively (OECD 1998).
Six hospital-based under-reporting studies carried out in Great Britain have beensummarised in Table 21 below which gives the range of levels of under-reporting fordifferent degrees of injury severity and for different road users.

36
A hospital based study of casualties carried out in 1984-85 found that 74% of slightinjuries and 61% of serious injuries sustained by pedal cyclists were not reported tothe police, although no fatalities went unreported. (O’Donoghue 1993).
In a survey of motorcyclists the respondents claimed to have reported only 17% oftheir accidents, with only half of the serious injury accidents reported to the police.Accidents involving the largest bikes were more than twice as likely to be reported tothe police as those involving smaller bikes. (Lynn 1990)
In the case of pedestrians, a study of pedestrian exposure and accident risk carried outin the English town of Northampton found that for all ages the level of under-reporting of pedestrian casualties to the police was about 24%. (Ward et al. 1994).This is in line with the results of the hospital based study shown in Table 21.
In Denmark, the Accident Analysis Group at Odense University Hospital has kept anaccount of the extent to which the police record road accidents involving casualties inthe hospital’s area. For the years 1990-1994, 33-42% of pedestrian casualties inaccidents with motor vehicles were recorded by the police (Accident Analysis Group,1991-1995). Comparisons between hospital and police records show that the policerecords only include about 20% of casualties of road accidents. Hospital recordsinclude pedestrian casualties where no vehicle is involved but the pedestrian is injured
Table 21: Percentages of casualties reported (estimated from hospital-based studies inGreat Britain.
Percentage reported
Min Max Average
Vehicle occupant Fatal 100 100 100
Serious 85 91 89
Slight 70 82 77
All injuries 75 86 81
Pedestrian Fatal 100 100 100
Serious 82 91 85
Slight 60 80 67
All injuries 73 85 77
Motorcyclist Fatal 100 100 100
Serious 67 73 70
Slight 42 63 51
All injuries 56 66 61
Pedal-cyclist Fatal 100 100 100
Serious 17 41 33
Slight 9 29 21
All injuries 22 34 27
All casualties Fatal 100 100 100
Serious 66 82 76
Slight 55 66 62
All injuries 50 72 62

37
due to tripping or falling; these accidents are registered as home or leisure accidents.70-75% of pedestrian casualties occur in situations where no vehicle is involved. Thisstudy highlights sources of injury to pedestrians other than collisions with traffic. Asimilar study in Britain indicates that ten times as many people are injured by trippingand falling in the road environment as are injured by vehicles (Department of Tradeand Industry).
In the Netherlands, hospital survey data was compared with accident data from theTraffic Accident Registration (based on police reports) of the Ministry of Transport. Itshowed that the registration of recordable accidents accounted for only 20% ofaccidents reported by those interviewed. However, accidents reported by interviewedcasualties also included pedestrian falls which are not considered registrable as roadtraffic accidents. Completeness of the registration appeared dependent on injuryseverity, age and mode. The most under-recorded road user casualties were cyclists(9%), while the best were car occupants (37%).
A Swedish study carried out in 1983-84, compared an estimated number of injuries toadults aged 14 to 74 to the corresponding figures recorded in police reports Thulin1989). It showed that only 37% of injuries were recorded in statistics (32% of theslight ones and 59% of the serious ones). When considering the various transportmodes separately, it was found that coverage of cyclist accidents by the police wasparticularly low (15%), which may be in part due to cyclist falls without collision notbeing reported Another study based on hospital data and police reports was carriedout in 1992 on a sample of accident victims seeking treatment in Lund UniversityHospital. Police data included 1514 victims, and hospital data 1076: only 843 victimswere found to have been recorded both by the police and the emergency department.Cyclists are shown to account for 15% of the victims in police data, and for 35% inhospital data. Information on pedestrians injured by falls is reflected in the hospitaldata alone (Berntman 1994).
A study of bicycle injuries was carried out in Finland (Olkkonen 1993). It was basedon information derived from the health care records (with additional interviews andquestionnaires) in the town of Mikkeli and its surroundings in 1980, as well as fromhealth care records of Mikkeli Central Hospital and of four hospitals in Helsinki in1985-86, and from the national hospital discharge register in 1980. This informationwas compared to official police statistics. The results suggested that the incidence inthe population of cyclists injuries was 15 times higher than the figure derived frompolice data.
A study in Norway using exposure data from the National Norwegian Travel Survey1991/92 and accident data from official accident statistics (police-reported accidents)and hospital statistics, showed that the official statistics cover approximately one thirdof the true number of road accidents with personal injury. (Bjørnskau 1994).

38
A German study (reported in DUMAS WP6) found that:• The number of accident fatalities is reported with a fairly high degree of accuracy;
the number of unreported cases being less than 5%.• For major injuries (requiring in-patient treatment) it was found that about 45% of
motorised road user injuries, 70% of cyclist injuries and 50% of all pedestrianinjuries remained unreported.
• For minor injuries (requiring out-patient treatment) 50% of car occupant injuries,60% of motorised two-wheeler injuries, 80% of cyclist injuries and 65% of allpedestrian injuries remained unreported.
• The highest number of unreported cases were found among children and juvenilesinvolved in accidents as cyclists, especially single vehicle accidents.
In an in-depth study carried out in Brescia (Italy) (reported in Ref DUMAS WP4)accidents with injuries which are unreported are a quarter of those reported. Thedistributions of reported and unreported accidents differed For example, under-reporting was found to be more frequent in the following types of accidents, in orderof importance:
• light collisions, even with serious consequences,• knocking into or over pedestrians, often with injuries due to falling,• falling off two-wheel vehicles (accidental falls -even due to trying to avoid
collisions with other vehicles-, collisions with parked vehicles -even due to doorbeing opened suddenly-, collisions with moving vehicles),
• passengers falling off at the bus stop, either because of bus starting too soon ordoors being closed too quickly,
• passengers falling or thrown from seat inside the bus due to sharp braking orcollision with another vehicle.
Table 22: Number of injured and killed road users per million person km travelled.
Official data Hospital data Ratio
Car drivers 0.174 0.316 1.82
Car passengers 0.312 0.596 1.91
Moped 1.452 3.867 2.66
Motorcycle 1.667 4.646 2.78
Bicycle 1.258 13.46 10.7
Pedestrian 0.829 1.921 2.32
For mopeds, motorcycles and bicycles the figures relate to drivers and passengers.

39
7 FRAMEWORK FOR COST-BENEFIT ANALYSIS
7.1 The role of cost-benefit analysis in policy making and prioritysetting
The policy-making process can be divided analytically into a number of stages. Figure2 shows one model of the stages of policy-making (Elvik, Mysen and Vaa 1997). Thestages have been arranged in the order that appears to be logically the most naturalone. No corresponding chronological order of the stages is implied. Figure 2 is,however, purely an analytical model and not meant as a literally correct description ofpolicy making.
Determine constraints�
Formulate policy objectives�
Describe current problems�
Develop policy options�
Estimate expected consequences of each policy option�
Compare policy options and define basis for choosingpreferred option
�
Choose preferred policy option�
Implement chosen policy programme�
Evaluate actual consequences of chosen policy�
Reassess policy objectives or programme
Figure 2: The Stages of Policy-Making – Analytical Model.
Logically speaking, the first stage of policy making is to determine constraints. Byconstraints is meant everything that is taken as given and not amenable to influence ofany acceptable policy instrument. In most cases, the decision with respect toconstraints is taken implicitly. Policy makers concentrate on aspects they think can beinfluenced and disregard those that they think cannot be influenced. In most roadsafety programmes, traffic volume is taken as a constraint; no attempt is made toinfluence it. Another commonly accepted constraint is current budget levels. Ingeneral, it is fair to say that guidelines for cost-benefit analysis do not advice policymakers with respect to how they can best determine the constraints of policy-makingin a certain area.

40
Determining constraints is a very important step in the policy-making process. Thesubsequent steps of formulating policy objectives, describing problems, developingpolicy options and estimating the consequences of each policy option determine theset of measures to which formal techniques of priority setting, like cost-benefitanalysis, are applied. Yet, these important steps are hardly dealt with at all in formalmodels of policy-making. Textbooks in cost-benefit analysis, for example, lay downprinciples for choosing between ready-made policy options with known effects. Thetextbooks do not tell how the options are developed.
There is, however, little point in setting priorities strictly according to economiccriteria of efficiency if the potentially most effective measures have been left out ofthe programme. It is therefore essential to make sure that all the really effectivemeasures are included in the set of measures to which the formal techniques ofpriority setting are applied. Choices are always made within a frame that is definedoutside the framework of cost-benefit analysis.
To illustrate this, consider the following two frames for setting priorities. One frameis the policy objective of reducing the total number of traffic injuries in a country. Ifno other constraints are imposed, a broad range of measures will be relevant, and afairly long list of alternative measures has to be developed in order to make sure thatthe most cost-effective measures have been taken into consideration. Another possibleframe might be to provide school children with a safe crossing location in the vicinityof an elementary school. The number of potentially relevant measures is then muchsmaller and basing the choice of measures strictly on a cost-benefit analysis may beregarded as problematic.
7.2 Relevant impacts of measures
Which are the relevant impacts of safety measures that ought to be included in cost-benefit analyses? In general, the answer to this question is that every impact to whicha preference is attached should be included, irrespective of whether the impact isintentional or not. This means that, in addition to impacts on the number of accidentsor the number of injured people, cost-benefit analyses should generally includeimpacts on mobility, the costs of travel and the environment.
No standard taxonomy of relevant impacts exists. A preliminary list of potentiallyrelevant impacts of measures is shown in Figure 3.

41
Main categories Subcategories
MOBILITY The number and length of tripsThe speed of travel
TRAVEL COST The direct outlays for travel
ROAD SAFETY The number of accidentsThe severity of accidentsThe accident rate (accidents/km of travel)
ENVIRONMENT The emission of noiseThe emission of air pollution (all types)The visual intrusion of road systemsThe insecurity (subjective safety) of road users
Figure 3: Taxonomy of relevant impacts of safety measures.
When making such a list of impacts, it is important to avoid double counting of them.The problem of double counting is particularly relevant for environmental impacts,since there are many of them that are closely related. It is tempting to include, forexample, both the insecurity (subjective safety or anxiety) of road users and thebarrier effect of a road as environmental impacts. However, as these impacts arelikely to overlap to a significant extent, including both of them would probablyintroduce an element of double counting into the list of impacts. In Figure 3 onlysecurity has been included.
7.3 Estimation of impacts
The estimation of the impacts of the measures on safety will be based on a model thatallows account to be taken separately of:
(1) The exposure (amount of travel) of each road user group,(2) The risk of injury,(3) The effect of each measure on the exposure and risk of each road user group.
The basic model for estimating the number of injuries that can be prevented by eachsafety measure is:
Number of prevented injuries = Exposure x Risk x Effect of measure
The first two terms of this expression gives the expected number of injuries that canbe affected by a measure. The effect of each measure will, to the extent available datamake it possible, be partitioned into the following contributions:
42
Effect on safety = Change in exposure x Change in accident rate x Change ininjury severity
This formulation allows the net change in the number of injuries to be broken downinto contributions from changes in exposure, changes in the number of accidents perkilometre of travel (accident risk), and changes in the severity of injuries. Adistinction can thus be made between measures seeking to reduce the number ofaccidents and measures seeking to reduce injury severity. Accident rate is defined asthe number of accidents (all levels of severity) per million (vehicle or person)kilometre of travel:
Accident rate = travelof kilometresMillion
accidents ofNumber
In general, the relevant measure of exposure for road related measures and policeenforcement is vehicle kilometres of travel. For vehicle related and road user relatedmeasures, the relevant measure of exposure in most cases is person kilometres oftravel.
A similar model will be applied to estimate the impact of a measure on the en-vironment. Consider, for example, the impact of a measure on the emission of airpollution:
Effect on pollution = Change in exposure x Change in specific emission rate
With respect to environmental impacts, the term “exposure” denotes the populationexposure to a certain concentration of ambient pollution. This, in turn, depends on theamount of traffic and the dispersion of emissions from traffic to people:
Population exposure = Traffic volume x Dispersion of emissions in time andspace
There is adequate knowledge about how noise generated by traffic spreads to thesurroundings. Less is known about how various forms of pollution spread.Simplifying assumptions will therefore be made with respect to population exposurefor pollution.
In order to estimate the various impacts of a measure, data are needed about thefollowing items:
(1) Traffic volume, which for road related measures and police enforcement denotesthe AADT (annual average daily traffic) at the location where the measure iscarried out and for vehicle related and road user related measures denotes theannual driving distance (kilometres per year) of a vehicle or road user.
(2) Type of environment, for which a rough distinction is made between urban andrural environments. It will be assumed that, except for global pollution and roaduser security, only the urban population is exposed to the environmental impactsof traffic.
(3) Accident rate, as defined above (number of accidents per million kilometre oftravel). In general only injury accident rates should be used, as the reporting of

43
property damage only accidents, at least for specific roads, is too unreliable toestimate accident rates. Even injury accident rates are subject to incompleteaccident reporting, which varies between countries. Indeed, not even the de-finition of a traffic fatality is the same in the EU countries.
(4) Speed of travel, when relevant. Some measures affect the speed of travel. Thespeed of travel is measured in terms of the mean speed of vehicles passing arecording station along the road.
(5) Length of waiting times, when relevant. Some measures, especially at junctions orother crossing locations, affect the length of waiting times for various groups ofroad users. Sometimes, there will be a trade off between different groups of roadusers in this respect. Traffic signals may, for example, shorten the waiting timesfor pedestrians and prolong the waiting times for motorists. Waiting time ismeasured as the mean, expected length of time a road user arriving at random at acertain location must wait (measured in seconds or minutes).
(6) Vehicle operating costs. Measures that affect the speed of travel or the length ofwaiting time, will generally also affect vehicle operating costs.
(7) Noise emission, when relevant. In general, measures that affect traffic volume orthe speed of travel will also affect traffic noise. Traffic noise is generallymeasured in decibel (A).
(8) Emission of air pollution, when relevant. In general, measures that affect trafficvolume, the speed of travel or mean waiting times will also affect the emission ofair pollution. Measures that involve constructing new roads located further awayfrom urban areas will also affect population exposure for pollution. Data on theemission of pollution are perhaps best given as emissions in grams per kilometreof travel, preferably specified according to type of emissions, for example carbonmonoxide (CO), carbon dioxide (CO2), nitrogen oxides (NOx), sulphur oxides(SOx), particulate matter (PM10 or PM2.5) and volatile organic compounds (VOC).
(9) Road user insecurity, when relevant. Some measures, especially those that affecttraffic volume, the speed of travel and/or provide improved crossing facilities, arelikely to affect the insecurity of road users. Ideally speaking, data ought to beprovided on the current level of insecurity and how various measures affect roaduser insecurity. However, this is an area where little is known and relevant dataare most likely to be missing. A universally accepted definition of insecurity andan accepted method for measuring it does not exist. Whatever knowledge there isabout insecurity is therefore likely to be fragmentary and based on parochialmethods for measuring it.
(10) Effects of measures on relevant outcome variables. In order to estimate theimpacts of various measures on the relevant outcome variables, measured inphysical units (changes in the number of accidents prevented, changes in theamount of pollution in kilograms or tonnes), the effects of measures on therelevant outcome variables must be known. These effects are perhaps best givenas the percentage change a measure brings about in a certain outcome variable,for example the percentage change in the number of accidents or the percentagechange in pollution emissions.
In addition to these variables, the direct implementation costs of a measure must beknown in order to estimate the cost-benefit value or cost-effectiveness of the measure.The direct implementation costs of a measure may be of two types: investment costsand operating costs. Investment costs are all costs of introducing a measure. Operatingcosts are all costs that are incurred to maintain a measure or operate it on a continuous

44
basis. The predominant type of cost differs between different types of measures.Often, investment costs will dominate for road related measures, whereas operatingcosts will dominate for training measures or police enforcement.
7.4 The duration of effects and service life of measures
The duration of the effects of various measures varies. Rough guidelines with respectto the duration of effects and length of service for various measures are given in Table23. A few comments are needed for some categories of safety measures listed in thetable.
The duration of the effects of road pricing or taxes imposed on motor fuel or thepurchase of motor vehicles is not known. The effects are likely to differ in the shortand long term (Fridstrøm and Rand 1993). In the short run, road users adapt to roadpricing or increases in fuel prices by slightly reducing the amount of travel. The effectwill usually be quite small, and may disappear within a year or two if real incomerises. In the long run, increasing the prices of car ownership and use of cars can havegreater effects. People will adapt to higher prices by buying cheaper cars and bydriving fewer kilometres per year. These long-term effects will, however, takeperhaps 10-15 years to become fully manifest.
Vehicle related safety measures are listed in Table 23 as having a service life of some10-15 years. This is based on the assumption that the vehicle fleet takes 10-15 years toturn over completely. The effects of some vehicle related safety measures last longer.Seat belts, for example, continue to be effective as long as they are required invehicles and worn by drivers and passengers, no matter how long it takes for thevehicle fleet to turn over. It is, however, inappropriate to estimate costs for a periodlasting longer than the expected service life of a vehicle.
Information and enforcement are presumed to have contemporaneous safety effectsonly. This means that an information campaign, or some enforcement activity, iseffective as long as it is carried out, but not after it has been terminated. Thisassumption may be somewhat too pessimistic. Some information campaigns andenforcement blitzes are known to have had effects some time after their termination.The effects do not, however, last very long and it is impossible to say in general howlong any effects are likely to last after the termination of an information campaign orsome enforcement activity. Some kinds of information can have very long-termeffects, at least at an individual level.

45
Table 23: Duration of effects (service life) of a number of road safety measures.Typical values.
Category of safety measureTypical duration of safety effects (servicelife)
Land use planning; new residential areas 25-40 years
Road pricing; fuel or vehicle taxation systems 1-3 years for use of existing motorvehicles, 10-15 years through vehiclepurchasing decisions
Changing the modal split of travel Contemporaneous effect only
Major road investment projects (new roads) 25-40 years
Minor road investment projects 15-25 years
Traffic control by means of highway signs 10-15 years
Traffic control by means of road markings 1-10 years
Upgrading road maintenance 1 year
Vehicle safety regulations (for new vehicles) 10-15 years
Driver education and training (new drivers) 1-3 years
Training of children 1-3 years
Public information campaigns Effect only during campaign, or a shorttime after
Conventional police enforcement Effect only when operated, or a short timeafter
Automatic police enforcement Effect only when operated, or a short timeafter
7.5 Measures of efficiency
Cost-benefit analysis is based on the principle of social efficiency. Social efficiency isa technical term in welfare economics. A policy or a programme is regarded asefficient if it improves the welfare of at least one person without reducing it foranybody else. Policies that are efficient in this sense satisfy the criterion of Pareto-optimality. It has long been recognised, however, that Pareto-optimality is a much toostringent criterion of social efficiency.
Most economists therefore subscribe to a less demanding criterion (potential Pareto-improvement) stating that a project improves welfare if those who benefit from it can,at least in theory, compensate those who lose from it and still retain a net benefit. Thisis equivalent to saying that projects for which the monetary value of the benefits,estimated according to the willingness-to-pay principle, exceed the monetary value ofthe costs, estimated according to the opportunity cost principle, are efficient, whereasprojects for which the benefits are smaller than the costs are inefficient.
Two measures of efficiency are used in cost-benefit analysis. These are the net presentvalue of a project and the benefit-cost ratio. The net present value of a project isdefined as:
Net present value = Present value of all benefits – Present value of all costs

46
The benefit term includes all effects that are valued monetarily in an analysis.Different benefits are usually added to obtain total benefits. Negative benefits, forexample increased travel time are subtracted. The cost term usually denotes theimplementation costs of a measure, expressed in terms of the opportunity cost from asocial point of view. The benefit cost ratio is defined as:
Benefit-cost ratio = coststion implementa of luePresent va
benefits all of luePresent va
As is easily seen, there is a simple definitional relationship between net present valueof benefit-cost ratio. When the net present value is positive, the benefit-cost ratioexceeds the value of 1.0.
One of the greatest problems in cost-benefit analysis is to obtain valid and reliablemonetary valuations of all relevant impacts. This objective is rarely, if ever, fullyrealised. It is therefore often relevant to carry out a cost-effectiveness analysis inaddition to, or in stead of, a cost-benefit analysis. A cost-effectiveness analysis is ananalysis in which the objective is to find the cheapest way of realising a certain policyobjective. In cost-effectiveness analyses, only one policy objective is considered.
The cost-effectiveness of a road safety measure can be defined as the number ofaccidents prevented per unit cost of implementing the measure:
Cost-effectiveness = measure oftion implementa of costsUnit
measuregiven aby prevented accidents ofNumber
In order to estimate the cost-effectiveness of a road safety measure, the followinginformation is needed:
(1) An estimate of the effectiveness of the safety measure in terms of the number ofaccidents it can be expected to prevent per unit implemented of the measure,
(2) A definition of suitable units of implementation for the measure,(3) An estimate of the costs of implementing one unit of the measure,(4) A method for converting all costs of implementation to an annual basis (in order
to make measures with different time spans comparable)
The accidents that are affected by a safety measure will be referred to as targetaccidents. In order to estimate the number of accidents prevented per unitimplemented of a safety measure, it is necessary to:
(1) Identify target accidents (which may, in the case of general measures like speedlimits, include all accidents),
(2) Estimate the number of target accidents expected to occur per year for a typicalunit of implementation,
(3) Estimate the percentage effect of the safety measure on target accidents. Thisdefines the numerator of the cost-effectiveness ratio of a safety measure.
To estimate the denominator, the first step is to define a suitable unit of imple-mentation of the measure. In the case of infrastructure measures, the appropriate unit

47
will often be one junction or one kilometre of road. In the case of area-wide or moregeneral measures, a suitable unit may be a typical area or a certain category of roads.In the case of vehicle safety measures, one vehicle will often be a suitable unit ofimplementation, or, in the case of legislation introducing a certain safety measure onvehicles, the percentage of vehicles equipped with this safety feature or complyingwith the requirement. As far as education and training is concerned, the number oftrained pupils according to a certain training scheme may be a useful unit ofimplementation. The unit cost will be the cost of training one pupil. It is difficult todefine a meaningful unit of implementation for public information. It seemsreasonable, however, to rely on the assumption that the effects of public informationdepend on the total volume of information. In that case, there is no need for countingunits of implementation; effects are related directly to the total costs, rather than theunit costs. For police enforcement, the number of man-hours of enforcement perkilometre of road per year may be a suitable unit of implementation.
Once a suitable unit of implementation is defined, unit costs can be estimated. Inorder to make the cost-effectiveness ratios of different safety measures comparable, itis necessary to relate both the number of prevented accidents and the costs ofimplementing the measure to a certain time reference. This need arises because therelationship between costs and the duration of effects varies a lot between safetymeasures. The duration of the effects of various measures was discussed in section7.4.
In order to get comparable implementation costs for all safety measures, irrespectiveof the duration of their safety effects the easiest method is to convert investment coststo annual capital costs. This comparability can be accomplished by convertinginvestment costs to an annuity. An annuity is a constant amount, which, if paidthroughout the period it applies to, has the original investment cost as its presentvalue. When investment costs are expressed as annuities, they can be added to theannual costs of operation and maintenance to get the total costs of a safety measure.
The cost-effectiveness criterion for priority setting has a number of advantages as wellas shortcomings. The advantages of the criterion are:
(1) It is generally easier to calculate the cost-effectiveness of a safety measure than tocalculate its benefit-cost ratio. Calculating cost-effectiveness requires knowledgeabout safety effects and costs of implementation only. To calculate benefit-costratios one needs more information, concerning, for example, accident costs andthe effects of a safety measure on mobility.
(2) Cost-effectiveness highlights the safety effects of measures. A cost-benefit ratio,on the other hand, is determined not just by safety effects but also by the effects ofa measure on mobility and on environmental factors.
(3) Cost-effectiveness does not require the use of accident costs. Accident costs canbe difficult to estimate and the estimates are often controversial.
The major shortcomings include the following:
(1) The cost-effectiveness criterion cannot be used to compare safety effects fordifferent levels of accident severity. Some safety measures (e g road lighting andspeed limits) have different percentage effects for accidents of different degrees of

48
severity. For such measures, there will be different cost-effectiveness ratios foreach level of accident severity. These different ratios cannot be compared withoutassigning weights to the different levels of accident severity. In cost-benefitanalysis, such weights are assigned by means of the unit costs per accident orinjury for each level of accident or injury severity.
(2) The cost-effectiveness criterion cannot be used to trade off safety against otherpolicy objectives. The criterion does not say at what level of cost-effectiveness ameasure becomes too expensive. Cost-effectiveness cannot, in other words, beused to determine the level of a safety programme that maximises welfare in aneconomic sense of that term.
(3) The cost-effectiveness criterion disregards the effects of safety measures onmobility and the environment. In practice, however, these effects are oftenimportant and in some cases decisive for the introduction of a certain measure.
Despite its major shortcomings, cost-effectiveness is an interesting criterion forranking alternative safety measures. It informs decision-makers about the prioritiesthat would result if improving safety were the only target of transport policy.Information of this kind is useful in discussing the potential conflicts that may existbetween improving safety and other objectives of transport policy.
Cost-benefit analysis is particularly useful in those areas of policy making where: (1)there are multiple policy objectives, (2) the objectives are partly conflicting and (3)the objectives refer to goods that do not have market prices.
7.6 Valuation of relevant impacts
The most difficult part of a cost-benefit analysis is often to obtain theoretically correctand empirically valid and reliable monetary valuations of all relevant impacts.Literally hundreds of studies have been made to determine the value of goods that donot have market prices, like the reduction of environmental pollution. Cost-benefitanalysis recognises the fact that something can have a value, even if it does not have aprice. Perhaps ironically, a cost-benefit analysis is to a large extent based on thenegation of the famous definition of an economist, given by Oscar Wilde: Aneconomist is a person who knows the price of everything and the value of nothing. Acost-benefit analysis, on the other hand, is an undertaking that tries to find the valueof everything, and usually accepts the price of nothing as a measure of its value.
There are a few basic principles of valuation of non-marketed goods in cost-benefitanalysis. Foremost among these is the principle that the valuation of a good should bebased on the willingness-to-pay of the potential purchasers of the good. In order toestimate the willingness-to-pay for a non-marketed good, a hypothetical market is setup, in which people are asked to state their willingness-to-pay for a certain amount ofthe good, or choose between various options that provide different amounts of thegood. There is a host of methodological pitfalls in such studies. It would go beyondthe scope of this report to discuss all these difficulties in detail. Fairly extensivediscussions can be found in, for example, Elvik (1993), Kidholm (1995) and Schwab-Christe and Soguel (1995).
An important item in cost-benefit analyses of road safety measures is road accident
49
costs. A detailed survey of current practice in estimating road accident costs in mostof the EU countries and a few countries not members of the EU has been made by aninternational group of experts as part of the COST-research programme established bythe European Union. The report from this survey (project COST-313) was publishedin 1994 (Alfaro, Chapuis and Fabre 1994). In addition to describing current practicein the countries included in the survey, the report discusses methods for estimatingroad accident costs from a theoretical point of view and presents somerecommendations with respect to the choice of method of cost estimation.
The COST-report contains recommendations with respect to the cost items that oughtto be included in estimates of road accident costs and with respect to the methods forestimating the various cost items. Five major cost items were identified:
(1) Medical costs,(2) Costs of lost productive capacity (lost output),(3) Valuation of lost quality of life (loss of welfare due to accidents),(4) Costs of property damage,(5) Administrative costs.
These five major cost elements can be divided into two main groups. The first groupincludes cost items 1, 2, 4 and 5. The other group consists of cost item 3, the valuationof lost quality of life. Whereas market prices exist for the four former cost elements,this is obviously not the case for the valuation of lost quality of life. It is onlyrecently, which means during the latest ten or fifteen years, that any motorisedcountry has tried to estimate the monetary value of lost quality of life. The other fourcost items have, however, been estimated in many motorised countries for a longtime, starting in the nineteen fifties in the United States, Great Britain and Sweden.
The costs of road accidents were first estimated in the nineteen fifties in Great Britainand the United States. Today, all the highly motorised countries try to estimate thesecosts, but the cost items included, and the methods used in estimating them, differsbetween countries. A detailed survey of the methods used in 20 motorised countries toestimate road accident costs, has been made by Elvik (1995).
The survey considered the valuation of fatalities only. Differences between countrieswith respect to the definition and level of reporting of non-fatal injuries make itdifficult to compare the costs of non-fatal injuries. Figure 4 shows the officialeconomic valuations of a traffic accident fatality in 20 motorised countries in 1991 inmillion Norwegian kroner (NOK).

50
Figure 4: Official economic valuation of a traffic accident fatality in 20 motorisedcountries in 1991. Million NOK per fatality.
Three cost elements are identified in Figure 4: (1) The valuation of lost quality of life,termed ”welfare”, (2) The costs of lost output (”output”), and (3) Direct outlays(”direct”). The total costs per fatality vary from 17.8 million Norwegian kroner(NOK) to about 0.9 million NOK. Not all countries estimated the costs of lost qualityof life in 1991. In countries that did include this cost item, it represented more thanhalf of the total costs. On the average, including an estimate of the costs of lost qualityof life added 8 million NOK to the costs of a fatality.
Several countries, including Norway, have revised their road accident costs since1991. In Norway, a report published in 1993 (Elvik 1993) recommended including avaluation of lost quality of life in the accident costs. This resulted in a major upwardrevision of the costs of a traffic accident fatality in Norway. The cost of a fatalityincreased from 3.0 million NOK to 15.6 million NOK (1993 prices). The valuation oflost quality of life contributed 12.4 million NOK to this dramatic jump in costs.
The contribution of the main cost elements to current road accident costs in Norway isshown in Table 24.
0,00
2,00
4,00
6,00
8,00
10,00
12,00
14,00
16,00
18,00
20,00
CH USA FIN S GB NZ D DK A JPN B AUS LUX N CDN F P E I NL
Direct
Output
Welfare

51
Table 24: Current road accident costs in Norway. Costs per injured person and peraccident in Norwegian kroner (NOK); 1995-prices.
Unit for valuationDirect and indirect
costsValuation of quality
of life Total costsInjured person
Fatal injury 3,480,000 13,120,000 16,600,000
Very serious injury 5,580,000 5,790,000 11,370,000
Serious injury 1,890,000 1,890,000 3,780,000
Slight injury 210,000 290,000 500,000
Property damage only 15,000 15,000
Mean per injured person 550,000 880,000 1,430,000
Accident
Fatal accident 3,940,000 14,860,000 18,800,000
Injury accident 775,000 1,225,000 2,000,000
PDO accident 30,000 30,000
It is readily seen that the valuation of lost quality of life constitutes more than half thetotal cost. The contribution of this cost element is particularly important for fatalinjuries, for which it makes up about 80% of the total costs.
As far as the valuation of other impacts of measures is concerned, a distinction mustbe made between measures that affect travel demand (traffic volume) and measuresthat do not affect travel demand. With respect to measures that affect travel demand,the relevant valuation is the change in consumers’surplus that results from the changein travel. This concept can be illustrated by means of an example. This example isgiven in Figure 5.
The amount of travel depends on the generalised costs of travel. By generalised cost ismeant the sum of all costs, direct out of pocket costs as well as other costs incurredwhen travelling, like the use of time, the exposure to pollution and the exposure to therisk of accident. Figure 5 shows how the amount of travel done by an individual(measured, for example, as the number of trips done per day) depends on thegeneralised costs of travel. Suppose a measure is introduced that cuts the generalisedcosts of travel from 4 to 3 (arbitrary units). The amount of travel can then be expectedto increase. The expected increase in travel demand is shown in Figure 5 by the linesconnecting price and number of trips before and after the drop in the generalised costsof travel.

52
Figure 5: Illustration of the valuation of changes in travel demand in terms ofchanges in consumers’ surplus.
The area denoted A in Figure 5 is the benefits to existing travel of the decline ingeneralised costs. The area denoted B in Figure 5 is the benefits of induced travel, thatis of the increase in travel demand generated by the decline in the generalised costs oftravel. By convention, the size of the benefits of induced travel is approximated by atriangle, the size of which is estimated by multiplying the increase in travel demandwith the savings in generalised costs of travel, divided by two.
In practice the generalised costs of travel are rarely known with sufficient precision. Itis not always obvious which items go into the generalised costs of travel. Are, forexample, the harmful effects on human health of exposure to pollution included? Wesimply do not know. It can be hypothesised that pedestrians and cyclists try to avoidthe most polluted roads. But what about car drivers? Some drivers may try to avoidthe most polluted conditions for the sake of their own well being, but in general cardrivers cannot be assumed to include the effects of pollution in the community atlarge in their generalised cost of travel. Hence, most of the costs of pollution arelikely to be external from a car driver’s point of view.
The generalised costs of travel are subjective and will vary from one individual toanother. One of the problems of using the generalised costs of travel to estimate thebenefits of induced travel, is the fact that some of the costs that go into the generalisedcosts of travel may be misperceived by road users. For example, many car driverstend to reckon only fuel costs when they estimate vehicle operating costs. But vehicleoperating costs include several other items, of which depreciation (the decline in thevalue of the car) is not the least important.
0
1
2
3
4
5
6
7
8
0 2 4 6 8 10 12
Number of trips (arbitrary units)
A: Benefits for existing travel
B: Benefits for induced travel

53
Misperception of risks, costs or other things that go into a cost-benefit analysis raisesa dilemma, which will be discussed more in the next section. Let us merely note inpassing that most economists tend to accept the observed demand for a commodity asthe correct basis for estimating the value of the commodity, even if demand may inpart be based on incomplete information or irrational behaviour.
It is beyond the scope of this study to carry out a survey of the literature dealing withthe valuation of non-marketed goods. This literature is vast and surveying it would bea major project by itself. Rather than trying to undertake such a project, a set ofillustrative valuations of impacts to be included in cost-benefit analyses is given inTable 25. The table is based on two recent Norwegian studies (Elvik 1998, Mysen,Solheim and Elvik 1998) that provide valuations of a number of impacts.
Table 25: Valuation of impacts for use in cost-benefit analyses. Norwegian kroner(NOK). 1995-prices.
Main impact SubcategoriesVehicle type, roaduser etc
Unit of valuation Value per unit(NOK 1995)
MOBILITY Travel time Pedestrian Person/hour 73
Cyclist Person/hour 59
Car occupant Person/hour 48
Bus passenger Person/hour 35
TRAVEL Vehicle Passenger car Km/travel 0.86
COST Operating Single truck Km/travel 2.22
Cost Truck/trailer Km/travel 3.26
Bus Km/travel 3.98
SAFETY Road All (Police Fatality 16,600,000
Accidents Reported Critical injury 11,370,000
Injury Serious injury 3,780,000
Accidents) Slight injury 500,000
Mean 1,430,000
ENVIRON- Traffic noise Small cars Km/travel 0.055
MENT Heavy cars Km/travel 0.550
Air pollution CO2 Tonne of CO2 220
NOx Kg of NOx 115
SO2 Kg of SO2 37
VOC Kg of VOC 15
PM10 Kg of PM10 1,800
This list of valuations that have been used in cost-benefit analyses in Norway is farfrom complete. It does not include a valuation of insecurity or other elements of thegeneralised costs of travel for pedestrians and cyclists. The values of travel time forpedestrians and cyclists given in Table 25 are highly preliminary estimates based onthe WALCYNG-project (Stangeby 1997). Values of travel time and vehicle operatingcosts for mopeds and motorcycles are not included in Table 25.

54
The road accident costs refer to police reported injury accidents in Norway. Whenestimating these costs, account has been taken of incomplete accident reporting. Tothe extent that underreporting is known, the costs include all accidents, irrespective ofwhether they are reported in official statistics or not. Recently (Elvik 1998), moredetailed estimates have been made for various road user groups. According to theseestimates, the mean cost of an injury accident is lower for cyclists than for motorists.The cost of a pedestrian accident is, however, higher than the cost of an accidentinvolving motor vehicles only.
The effects on land use and business development of improving road infrastructure isa topic of long-standing controversy (see, for example, the survey paper by Gramlich1994). The current majority opinion among economists is that what is often termed“regional impacts” are captured by the change in consumers’ surplus for inducedtraffic attributable to road improvements. Hence, to add to this a valuation of growthin employment or the creation of new firms would constitute double counting ofbenefits. By the same token, one could argue that the benefits to shopkeepers ofcreating pedestrian streets is included in the generalised costs of walking, at least tothe extent that a drop in these costs fully reflects the benefits to pedestrians of gettingrid of cars.
7.7 Some results from the WALCYNG-project
As part of the WALCYNG-project, a stated preference survey was carried out inNorway for the purpose of valuing monetarily a number of aspects of cycling. Detailsof the study are found in Stangeby (1997). In this report, only the main results arepresented.
Figure 6 shows the valuations of several aspects of cycling of a sample of commuterswho used their own cars to travel to work. The valuations are expressed in terms ofthe daily parking fee car commuter were willing to pay to avoid cycling. Negativeamounts are factors that discourage cycling. Positive amounts are factors thatencourage cycling.
It can be seen that, for example, unsafe traffic conditions is one of the factors thatinhibit cycling. Car commuters value unsafe traffic conditions at 9 NOK per(working) day, which amounts to about 2,000 NOK per year (with about 220-230working days in a normal year).
It is tempting to interpret this value as an indication of the value of road userinsecurity. However, it is not known precisely what respondents include in theconcept “unsafe traffic conditions”. Moreover, this is the value that car driversattribute to unsafe traffic not the value that cyclists attribute to unsafe traffic. Besides,the costs of insecurity are likely to vary depending on local conditions. What isneeded for cost-benefit analysis is a valuation formula that captures the variations intime and space of insecurity. An overall daily mean value, like the one given in Figure6, does not meet this need.

55
18
9
-6
-7
-9
-12
-12
-18
-29
3
-8
-12
11
-35 -25 -15 -5 5 15 25
Student
Mountain bike
Raining
More than one car
Unsafe traffic conditions
More than one personwith a driving licence
Steep incline
Company car
Never cycling
Bicycle lane
Parking indoor
Parking outdoor
Facilities for showering
NOK
Figure 6: Average parking fee per day for changing mode from driving a car to go bybicycle on the journey to work. NOK/day. The Norwegian Marketing/SP-survey
7.8 Dilemmas in the application of cost-benefit analysis
Cost-benefit analysis is based on an efficiency criterion and is designed to help infinding the most efficient means to promote a set of policy objectives that have beenconverted to a common metric by means of monetary valuation. It is also designed tohelp policy makers decide about the amount of resources that should be used to attaincertain policy objectives, that is to decide on how far one ought to go to realise thoseobjectives. A number of dilemmas can arise when using cost-benefit analysis as an aidto priority setting in public policy. Some of these dilemmas will be briefly discussedbelow:

56
(1) Incomplete or incorrect valuation of relevant impacts,(2) Valuations based on poorly informed or irrational choices,(3) Profound disagreement about policy objectives,(4) The trade off between efficiency and equity or distributional objectives,(5) The trade off between efficiency and basic rights or constitutional principles.
These points will be discussed in turn.
Ideally speaking, the use of cost-benefit analysis requires a monetary valuation of allrelevant impacts of a project. This includes not just policy objectives, but unintendedside effects as well. At the current state of knowledge, a complete and theoreticallysatisfactory economic valuation of all relevant impacts of a project is not alwayspossible. As argued above, important impacts of road safety measures designed forpedestrians, cyclists or riders of mopeds or motorcycles have not yet been valuedmonetarily. This means that cost-benefit analysis may discriminate against thesegroups of road users. Unless, for example, generalised costs of travel for pedestriansand cyclists and the costs of insecurity are included in cost-benefit analyses, theseanalyses do not necessarily show the most efficient way of setting priorities betweensafety measures.
The proliferation of items that are included in cost-benefit analyses raises the problemof double counting. This problem is particularly relevant with respect toenvironmental factors. There is no doubt that exposure to air pollution is a hazard tohuman health. One would therefore expect less pollution to produce benefits in termsof reduced morbidity and mortality. But how can one reliably partition the effects ofpollution among specific pollutants? Can really the marginal contribution of, say, acertain dose of nitrogen oxides to human mortality be reliably identified? And,provided that it really can, how can people intelligently assign a monetary value to thebenefits of reduced emission of nitrogen oxides? Pollution can affect your health evenif you do not notice it. Some of the gases that damage health you can neither see norsmell. Their effects on health are, of course, noticeable, at least above a certainthreshold, but how can a lay person know if a certain ailment was caused by nitrogenoxides and not by an unhealthy life style?
The danger of double counting has lead some economists to recommend keepingclosely related environmental factors out of cost-benefit analysis. The trouble withthis recommendation is that factors that are left out of cost-benefit analysis may,perhaps unconsciously, be given a lower priority than factors that are included. Somepeople argue that some things, like human life or an unspoilt natural environment, areinfinitely valuable and therefore cannot be included in a cost-benefit analysis.Ironically, such a point of view entails the risk that saving human lives or protectingthe environment get neglected in policy making, at least if it is based on cost-benefitanalysis.
The relationship between road user insecurity and road safety (as measured by thecount of accidents or an accident rate) illustrates both the problem of a possibledouble counting and the problem of valuations based on poorly informed or irrationalchoices. There is no doubt that a feeling of insecurity in traffic is a serious problemfor many people. Parents, for example, will not allow children to play outside if there

57
is motor traffic in the neighbourhood. Old people are often fearful to cross the road; ifit is slippery during winter some old people do not dare to walk outside at all.
On the other hand, it is hard to resist the idea that an excessive feeling of security intraffic is an important cause of accidents. Road users feel safe and underestimate therisks involved in many situations. This may cause dangerous behaviour thatnecessitates regulations and police enforcement. Most road users want to feel safe,and when they do so, they tend to think that the risk of accident is negligible. Hence,measures that make people feel safer are often demanded, even these measures do notalways reduce the number of accidents.
Figure 7 shows the possible effects of four measures on security and safety. It is seenthat the use of seat belts is assumed to improve both safety and security. Higher speedis assumed to reduce both safety and security. The idea underlying this assumption, isthat road users choose a speed that does not make them feel insecure; hencepromoting higher speed would make some drivers feel insecure. Both these cases areuncomplicated in the sense that both safety and security move in the same direction.
Figure 7: Possible effects of four measures on safety (number of accidents) andsecurity (feeling of safety)
The other two cases present a conflict. An ordinary marked pedestrian crossing makespedestrians feel safer (Schioldborg 1979), but actually increases the number ofaccidents (Elvik, Mysen and Vaa 1997). Introducing this measure is a dilemma.Surely, it cannot be right for public bodies to make people feel safer when the feelingrests on a false sense of security? Assigning a monetary value to increased security inthis case raises an ethical dilemma. It cannot be ethically right to fool people intobelieving that road safety has been improved when that is not the case.
RoundaboutsHigher speed
Seat beltsPedestrian crossings
Security
Safety

58
The final case is roundabouts. It seems likely that roundabouts make drivers feelinsecure, and that, indeed, the enhanced feeling of insecurity may be one of thereasons why roundabouts reduce accidents. But is it right to inflict a feeling ofinsecurity on people? Well, as long as it only makes people behave more carefully itis difficult to see that any harm is done, even if road users would prefer not to feelinsecure. But, as argued above, perhaps the most important problem today is thatmany people feel much too safe in traffic; they do not pay sufficient attention to it andbecome involved in accidents simply because they did not notice the other road user.
The fact that some measures are in demand because they make road users feel safer(increases security) may lead to conflicts. If cost-benefit analysis is to function asintended, it is essential to remain neutral with respect to priorities between specificmeasures. The surest way of making a mess of things is to turn certain measures intoan end of their own, rather than a means to the end of promoting road safety. Thevaluation of safety refers strictly to safety as a policy objective, and not to specificmeasures designed to promote this objective. Yet, in actual policy making,maintaining this strict separation between ends and means is often difficult.
Ideally speaking, cost-benefit analysis assumes that there is agreement concerningpolicy objectives and their relative importance in relation to one another. Cost-benefitanalysis is not designed to resolve profound disagreements about policy objectives.You cannot resolve political disputes by making calculations. Cost-benefit analysis istherefore best suited in those areas of policy making where there is widespreadagreement on objectives and fairly extensive – and widely accepted - knowledgeabout alternative policy instruments that may realise the objectives.
Cost-benefit analysis can help in finding the priorities that maximise efficiency withrespect to certain policy objectives. It helps, in other words, to select the mostefficient means to realise given objectives. It will very often be the case, however,that maximum efficiency in the use of policy instruments is not an overridingprinciple of policy making. In many instances, this principle, although relevant,competes with at least two other principles that are not included in cost-benefitanalysis.
Two of the most basic principles are those of social justice, or equity, and politicallegitimacy, or democratic process. It has been argued, for example, that it is unfairthat pedestrians and cyclists are subject to a much higher injury accident rate perkilometre of travel than motorists. Some countries (like Sweden, see Vägverket 1995)have therefore set a target of reducing the accident rate for pedestrians and cyclistsmore drastically than for motorists. To realise a target of this kind, one may have toresort to more drastic measures to reduce the accident rate of pedestrians and cycliststhan the measures taken to reduce motorist accident rates. This may imply a departurefrom priorities based on cost-benefit ratios exclusively.
Basic democratic rights and constitutional principles are absolute constraints that arenot subject to cost-benefit analysis. You do not perform a cost-benefit analysis offreedom of speech, even if a lot of stupid things are said in many debates. You do notrestrict the right to vote to people who will vote for the same party as you, or topeople who are “sufficiently” informed to make an intelligent choice between

59
political parties. Although it may happen that populist parties get a lot of votes you donot subject the right to vote to a cost-benefit analysis for that reason.
The point is that democracy has its price. Yet democratic rights are regarded asuniversal human rights that should not be infringed, even if those rights are notalways exercised in the best interest of everybody. The scope for cost-benefit analysisdoes not extend to the larger issues of democratic government, but is restricted topriority setting at a much lower level of governing.

60
8 FACTORS AFFECTING THE RESULTS OF COST-BENEFITANALYSES
This chapter reviews some of the factors that influence the results of a cost-benefitanalysis. These are factors that determine the size of estimated costs and benefits and,therefore, whether measures pass the compensation test of cost-benefit analysis.
8.1 A taxonomy of factors affecting the size of costs and benefits
The results of a cost-benefit analysis are affected by a number of factors. It isconvenient to put these factors in two groups: (1) Confounding factors, which arefactors unrelated to the preferences that determine the level of benefits, and (2)Variations in preferences and real income that determine the level of costs andbenefits. The factors that will be discussed include:
(1) Varying levels of accident reporting in different countries,(2) The relationship between amount of travel and accident rates,(3) Varying effects of safety measures in different countries,(4) Varying economic valuations of road safety in different countries,(5) The extent to which other effects than safety can be included in cost-benefit
analyses of road safety measures,(6) The context of implementation of measures, especially with respect to previously
introduced measures.
These factors will be discussed in turn.
Varying levels of accident reporting. This was discussed in detail Chapter 6. Figure 8shows the best current estimate of the percentage of injuries treated at hospitals(including as outpatients) that are reported in official road accident statistics in eightEuropean countries. The level of accident reporting is seen to vary from 21 to 57%.These differences are statistically highly significant and mean that it would beincorrect to base analyses on an average reporting level for all European countries. Ifsuch an average were to be used, it would underestimate safety problems and thebenefits of safety measures in countries with a low level of reporting (below average)and overestimate them in countries with a high level of reporting. The varying levelsof accident reporting means that, for example, accident rates based on officialaccident statistics cannot be compared between countries. Strictly speaking, not eventhe number of fatalities is comparable across countries, because the definition of atraffic fatality differs and not all fatalities are reported in official statistics(Hutchinson, 1984). However, the variation between countries in the reporting offatalities is much smaller than the variation in the reporting of non-fatal injuries.

61
Figure 8: Levels of accident reporting in official road accident statistics in eightEuropean countries. Source: Elvik, 1999.
It is important to include all accidents in cost-benefit analyses of safety measures,irrespective of whether they are reported or not. The importance of including non-reported accidents in cost-benefit analyses is clearly illustrated in the estimates madeby the European Transport Safety Council (1997) of the costs of reported and non-reported accidents. These estimates are reproduced below in Table 26. According tothese estimates, the costs of non-reported accidents amount to almost 50% of the totalcosts of road accidents. The average cost of a non-reported accident, is however,lower than the average cost of a reported accident. This difference in costs is mainlydue to the fact that injuries are, on the average, less severe in non-reported accidentsthan in reported accidents.
In planning road safety measures, one is naturally confined to relying on informationabout the reported accidents only. According to Table 26, the average reporting levelfor injury accidents in EU-countries is about 45%. When the non-reported injuries aredisregarded, the mean cost of an injury amounts to 58,000 ECU. However, when thenon-reported injuries are included, and their cost allocated to the reported injuries, themean cost of a reported injury increases to 71,500 ECU.
21
54
39
57
43
37
55
25
0
10
20
30
40
50
60
Denmark France Germany Great Britain Netherlands Norway Sweden Switzerland

62
Table 26: Total number of accidents in the European Union and associated costs.
Costs (in billion ECU 1995-prices)
Total number in EU(thousands)
Economic cost Value of humanlife Total costs
Fatalities 45 21 29 50
Serious injuries 505 23 33 56
- reported 355 16 23 39
- non-reported 145 7 10 17
Slight injuries 2,950 7 0 7
- reported 1,180 3 0 3
- non-reported 1,770 4 0 4
PDO-accidents 46,000 49 0 49
- reported 11,500 12 0 12
- non-reported 34,500 37 0 37
Total reported 13,080 52 52 104
Total unreported 36,415 48 10 58
Total 49,495 100 62 162PDO = Property Damage Only
The relationship between the amount of travel and accident rates. In chapter 8.3 amodel was described for estimating the effects of safety measures on the number ofinjuries. According to this model, the expected number of accidents is the product ofexposure and accident rate. It is increasingly recognised, however, that the accidentrate is not independent of the amount of exposure (Hauer, 1995). Figure 9 illustratesthis for cyclist fatality rates for fifteen European countries. The figure was derivedfrom information given by Schollaert et al (1997), supplemented with information forNorway given by Borger and Frøysadal (1993).
The figure shows the relationship between the amount of cycling per inhabitant peryear and the fatality rate of cyclists, measured as the number of killed cyclists perhundred million cycle kilometres. A negative relationship between exposure (amountof cycling) and accident rate is clearly visible. The more people cycle, the lower is theaccident rate of cyclists. This means that one does not remove the effect of exposureon the number of accidents by computing an accident rate. If, for example, the amountof cycling increases by 50%, the number of accidents will not necessarily increase by50%, but according to Figure 9, probably by less than 50%.

63
Figure 9: Relationship between kilometres cycled per inhabitant per year and cyclistfatality rate (killed cyclists per 100 million cycle kilometres) in 15 Europeancountries. Source: Schollaert et al 1997; Borger and Frøysadal, 1993.
Several factors may account for the tendency of accident rates to decline as theamount of exposure increases. In the first place, as each cyclist accumulates morekilometres, he or she becomes more experienced and more aware of the hazards oftraffic. In the second place, when cyclists become more numerous in traffic, drivers ofmotor vehicles become more aware of the presence of cyclists and may behave moreconsiderately towards them. In the third place, countries where cycling is common,like Denmark or the Netherlands, are likely to provide better facilities for cyclists thancountries where cycling is less common.
Varying effects of safety measures in different countries. The effects of safetymeasures can vary from one country to another. Figure 10 illustrates this for the caseof traffic separation. By traffic separation is meant the provision of a physicallyseparate road or track for cycling, sometimes reserved for cyclists, sometimes mixedwith pedestrians. The figure shows the percentage change in the number of bicycleaccidents found in evaluation studies made in different countries.
The effects attributed to traffic separation are seen to vary substantially betweencountries. The results obtained in Denmark, Germany, Great Britain, the Netherlandsand Norway agree fairly well with one another. However, the results reported forSweden and the United States are very different from the results reported for the othercountries.
y = 123,66x-0,6338
R2 = 0,7320,00
5,00
10,00
15,00
20,00
25,00
30,00
0 200 400 600 800 1000 1200
Kilometres cycled per inhabitant per year

64
Figure 10: Effects of traffic separation on the number of bicycle accidents in differentcountries
What is the right thing to do in a case like this? Should one accept the results ofevaluation studies at face value, as they have been reported in different countries? Orshould a cost-benefit analysis be based on an average estimate of effect, based onevaluation studies made in numerous countries? What about countries in which noevaluation studies have been reported? What should constitute the basis for estimatingthe effect of a measure in those countries?
Evaluation research aims for general knowledge. But how far should the efforts toattain general knowledge be carried? Is it defensible to generalise the results ofevaluation studies made all over the world, perhaps during a period of some thirty toforty years, into one overall mean estimate of effect? In most cases such a broadgeneralisation would probably not make much sense. The effects of a measure onsafety are likely to vary from one place to another, depending on, for example, designfeatures of the measure, road user behaviour, and a host of other factors.
One quickly realises, however, that it is impossible to consider all these factors whensummarising the results of evaluation studies. It is no doubt true that the effects of ameasure will vary from one location to another, but trying to account for all suchvariations almost leads to epistemological nihilism, that is to a denial that it ispossible to obtain generally valid knowledge at all. If the effects that were attributedto a certain measure in study A are expected to be very different in study B, it hardlymakes sense to publish study A because nothing of general interest can be learnedfrom it. Hence, a belief in the possibility of attaining generally valid knowledgeunderlies all evaluation studies.
An assumption underlying the above discussion, is that one can take the results ofevaluation studies at face value, that is as showing the true effects of the measures that
-17-12
1
-11 -8
23
76
-6
-50
0
50
100
150
200
Denmark Germany Great Britain Netherlands Norway Sweden United States All countries

65
have been evaluated. Unfortunately, this is almost never the case. Virtually allevaluation studies in road safety are non-experimental studies that do not fully controlfor the effects of confounding factors. Figure 11 clearly illustrates this point. It showsthe mean effects on the number of bicycle accidents attributed to tracks for walkingand cycling in Norway, depending on study design.
Figure 11: Mean effects on the number of bicycle accidents attributed to tracks forwalking and cycling in evaluation studies made in Norway depending on the design ofthe evaluation study
The various study designs have been identified on the basis of which confoundingfactors they control. In before-and-after studies controlling for general trends in thenumber of accidents in a larger area, a decline of 61% in the number of bicycleaccidents was found. Before-and-after studies controlling both for general trends andregression-to-the-mean (RTM) indicate that the number of bicycle accidents increaseby 1%. Before-and-after studies controlling for changes in traffic volume indicate aremarkable increase of 67% in the number of bicycle accidents. Finally, case-controlstudies, that is studies that compare that accident for cyclists on roads with separatetracks to the accident rate of cyclists in mixed traffic, show a decline in accident rateof 19%. In other words, the results of evaluation studies range from 61% accidentreduction to 67% accident growth, depending on study design. On top of this, itshould be noted in passing that none of the estimates presented in Figure 11 isstatistically significant. Nevertheless, the very large differences found underline theimportance of critically considering study design when summarising the results ofevaluation research.
What, then, is to be concluded from this discussion? The third edition of theNorwegian Traffic Safety Handbook, published in December 1997 (Elvik, Mysen andVaa, 1997), summarises evidence from a very large number of evaluation studies thathave been made to determine the effects of 124 road safety measures. In summarising
-61
1
67
-19
-80
-60
-40
-20
0
20
40
60
80
Before/after (controlling trend) Before/after (controlling trend,RTM)
Before/after (controlling trafficvolume)
Case-control
Study design in evaluation studies

66
the results of these studies, meta-analysis has been used to a very large extent. Thefollowing guidelines have been used to summarise the results of evaluation studies bymeans of meta-analysis.
(1) Road safety measures are described at the most detailed level possible on the basisof evaluation studies,
(2) Effects on accidents or injuries of different levels of severity are, if possible, keptapart for at least the following levels of severity: (a) Fatal accidents, (b) Accidentsinvolving personal injury, (c) Property damage only accidents,
(3) Different definitions of the effects of a safety measures are kept apart, the mostcommon definitions being: (a) Changes in the number of accidents, (b) Changes inaccident rate, (c) Changes in injury severity,
(4) The results of studies using different study designs are kept apart, using the levelof control of confounding variables as the key to distinguishing between differentstudy designs,
(5) Statistical uncertainty is estimated for all results, in the form of a 95% confidenceinterval for the standard error of the mean,
(6) The distribution of results around the mean value is examined, to check for thepossible presence of multimodality, skewness or outlying data points that undulyinfluence the results.
While these guidelines do not guarantee that important differences are not glossedover, and unimportant differences highlighted, they hopefully reduce the risk oferroneous conclusions.
Varying economic valuations of road safety in different countries. The fact thatofficial estimates of road accident costs vary a lot between countries has been shownearlier (see Figure 4). The same issue arises with respect to these variations as withrespect to variations in the effects of safety measures between countries: to whatextent should the differences between countries be accepted, to what extent shouldthey be replaced by an average that eliminates them?
The answer to this question depends in part on how one conceives of the role of cost-benefit analysis as an instrument of policy making. If one accepts the basic tenets ofwelfare economics, on which cost-benefit analysis is based, the rule to follow insorting out relevant from irrelevant differences in the valuation of road safety can besimply stated. Differences in road accident costs that are attributable to either (a)differences in market prices or (b) differences in individual preferences for safetyshould be retained. All other differences should be eliminated.
Preferences for road safety are manifested in the amounts people are willing to pay inorder to improve road safety. Since road safety is a normal good, willingness to payfor it depends on income. The higher your income, the more you are likely to bewilling to pay to have road safety improved. The efficiency criterion of welfareeconomics implies that the provision of road safety should match exactly the demandfor it.
Yet this rule is not literally followed anywhere. If one were to follow it, improvingroad safety for millionaires would be worth more than improving it for the lessaffluent. But, at least officially, no country differentiates the provision of road safety

67
based on individual income. This means that the efficiency criterion of cost-benefitanalysis is not strictly adhered to. At the international level, a strict adherence to thiscriterion becomes problematic, because the differences in income levels betweencountries are very large, even within Europe. On the other hand, disregarding thesedifferences also involves problems. In the first place, the costs of providing a certainlevel of safety are likely to differ between countries. If an average value of safety isused for countries with different levels of cost, safety may be overprovided in low-cost (low-income) countries and underprovided in high-cost (high-income) countries.The terms overprovided and underprovided refer to the level of road safety provisionthat would be in line with the preferences of the general public.
In the second place, averaging the value of safety across countries only makes sense ifthe values being averaged include the same elements and have been estimated thesame way in all countries. Otherwise, the average cannot be interpreted asrepresenting an “average preference” in any meaningful sense.
In the third place, there is always going to be an element of arbitrariness with respectto the choice of countries an average value of safety applies to. Does a global averagemake sense? Probably not, because the differences between the richest and poorestcountries are simply too large and the recording of even fatal accidents likely to beincomplete in the poorest countries. Does an average for the OECD-countries makesense? Perhaps. At least all these countries are generally counted among the rich andhighly motorised countries. Still, their levels of income and safety vary substantially.
A recent analysis of value-of-life studies in several countries (Miller, 1998), providesthe most comparable estimates currently available of the value of a statistical life at aninternational level. The analysis was based on studies of the willingness to pay forsafety made in twelve countries. The analysis indicated that the income elasticity ofthe demand for safety is about 1.3 to 1.5. Based on this, Miller estimated the valuationof a statistical life in several countries. Figure 12 presents the results of the analysis.

68
Figure 12: Values of a statistical life in different countries as a function of averageincome level (GNP per capita). Source: Miller, 1998, Table 4.
The value of a statistical life in the fifteen European countries represented in Figure12 varies from 7.5 million US dollars in Switzerland to 0.74 million US dollars inGreece. These estimates are the best current estimates of the value people in thesecountries are likely to attribute to increased safety.
The value of a statistical life varies in inverse proportion to the level of fatality risk intraffic. This is shown in Figure 13, which shows the relationship between the value ofa statistical life and the number of road accident fatalities per 100,000 inhabitants.The pattern found in Figure 13 makes one wonder about the direction of causality. Isthe accident rate high in some countries because they put a low value on human life,or is the value of human life low because the accident rate is so high? Causality mayflow in both directions. However, it may be regarded as a dilemma that by using thevaluations in Figure 13, one will preserve, and perhaps even enlarge the differences inaccident rate between countries. The largest expenditures to improve safety will bejustified in those countries that have the highest value of a statistical life.
0
1000
2000
3000
4000
5000
6000
7000
8000
0 5000 10000 15000 20000 25000 30000 35000 40000 45000 50000
Gross National Product per capita (1995 US Dollars)
Greece
Portugal
Spain
Italy
Great Britain
Finland
Sweden
Netherlands
FranceAustria
Germany
Belgium
Norway
Denmark
Switzerland

69
Figure 13: Relationship between the value of a statistical life and road accident ratein fifteen European countries. Sources: Miller 1998 and IRTAD.
What are the conclusions of this discussion? The main conclusion is that the valuationof road safety in a specific country ought to be based on studies of the willingness topay for safety made in that country. For countries where no such studies are available,the valuation of safety ought to be based on the relationship shown in Figure 12.
Inclusion of effects other than safety in cost-benefit analyses. Most road safetymeasures have an effect on other policy objectives in addition to safety. This meansthat cost-benefit analyses ought to include these effects in addition to effects onsafety. In some cases, these effects may be decisive for the results of a cost-benefitanalysis. The effects that ought to be included in cost-benefit analyses have beenlisted in Figure 3, but it is not always possible to include all these effect in a cost-benefit analysis. The effects that are likely to be most difficult to include in cost-benefit analyses at the current state of knowledge are:
(1) All components of air pollution,(2) The visual intrusion caused by road systems,(3) Road user insecurity
Until a few years ago, it was not common to include an economic valuation of airpollution in cost-benefit analyses. Today, a number of estimates of these costs areavailable, but no consensus has emerged. There are at least three major problemsinvolved in estimating the costs of air pollution and the effects of various measures onair pollution. The first problem concerns what types of air pollution to include. Thesecond problem concerns what types of effects of air pollution to include, especiallywhether the effects should be assessed in terms of dose-response curves for well-defined medical outcomes like death or the onset of certain respiratory diseases or interms of subjective expressions of annoyance caused by air pollution. The third
y = 6E-07x2 - 0,0065x + 26,487
R2 = 0,4836
0
5
10
15
20
25
30
0 1000 2000 3000 4000 5000 6000 7000 8000
Value of a statistical life (thousands 1995 US dollars)
Portugal
Greece
Spain
Great Britain
Italy
Finland
Netherlands
Sweden
Norway
Austria
FranceBelgium
Germany
Denmark
Switzerland

70
problem is how one should add the costs of various types of air pollution and variouseffects of it in a way that is complete, while at the same time avoids double counting.
It is beyond the scope of this report to further discuss these problems. Only three briefobservations will be made. There seems to be a tendency for the estimated costs of airpollution to become higher as more types of pollution and more effects of it areincluded in the estimates. Since none of the estimates made so far pretends to becomplete, one may hypothesise that previous estimates of the costs of air pollutionhave underestimated those costs. The second observation is that the costs of airpollution are relevant for cost-benefit analyses of a number of important road safetymeasures. All measures that affect speed, for example, also affect air pollution,because vehicle emissions depend on speed. All measures that require the additionaluse of energy, like daytime running lights, may increase vehicle pollution emission.Measures that provide pedestrians and cyclists with a separate road system located atsome distance from the main road will reduce the amount of pollution pedestrians andcyclists are exposed to, because the ambient concentration of vehicle pollutants fallsrapidly as the distance from the source is increased. The third and final observation isthat the current economic valuations of air pollution in various countries are likely tobe at least as incompatible as the accident cost estimates.
The visual intrusion of a road system, or its ugliness, is a factor for which hardly anyestimates of the costs to society can be found. In the short run the solution willtherefore have to be to leave it out of cost-benefit analyses altogether.
The valuation and possible inclusion of road user insecurity in cost-benefit analysishas been discussed above. It is obvious that change in the level of road user insecurityis an important impact of very many road safety measures. Still, too little is knownabout these impacts to include them in cost-benefit analyses, except perhaps forillustrative purposes only.
The context of implementation of measures – interaction between measures. Theeffects of a certain road safety measure on the number of accidents may depend onwhether it is introduced as a stand-alone measure or as part of a package of measures.The effects may also depend and on whether it is introduced into an environmentwhere few measures have been implemented or into an environment where a lot ofmeasures have been implemented. The differences in effect depending on the contextof implementation could be large enough to affect the results of cost-benefit analysesof measures.
To illustrate this, consider the case of road lighting and bypasses. Suppose cost-benefit analyses have been made of these two measures for a small village. Supposethat the results, provided only one of the measures is carried out, are as given below(arbitrary monetary values for illustration only):
Bypass Lighting
Benefits 102 35
Costs 100 20

71
Now suppose the bypass is built. Traffic volume in the village is then cut in half andthe expected number of accidents in the village is then also cut in half. The benefits ofintroducing road lighting are then reduced from 35 to 17.5, and the measure no longergives a benefit that exceeds the cost. Suppose, on the other hand, that road lighting isinstalled before a bypass has been built. Road lighting cuts the number of accident byabout 10%, and thus reduces the benefits of the bypass from 102 to 98.5. It is nolonger good value for money to build the bypass. Hence, both measures give benefitsthat are greater than costs if carried out alone, but none of the measures give benefitsthat are greater than costs if the other measure has already been introduced. But ifboth measures were introduced at the same time, then what would their joint benefitsbe?
The benefits of introducing both measures would, essentially, be the sum of thebenefits of measure A, given that measure B has been introduced and the benefits ofmeasure B, given that measure A has been introduced. In the present example, thatwould be 98.5 + 17.5 = 116. The combined cost would be 120. Hence, a cost-benefitanalysis would conclude that these two measures should not be introduced as apackage.
Evidently, only one of the measures ought to be introduced in this case, although bothof them pass the cost-benefit test when taken alone. In this case, road lighting shouldbe introduced first, because it has both the best benefit/cost ratio and the highest netpresent value.
In general, denote by Ei the effect of measure i on the number of accidents, expressedas a percentage change (in most cases a percentage reduction). Then Ri is the residualnumber of accidents still expected to occur when measure i has been implemented:
Ri = 1 - Ei
If, for example, a measure affects 100 accidents and has a 20% effect on thoseaccidents, the residual when the measure has been implemented is 0.8 (1 – 0.2). Asimple model to estimate the combined effect of two measures on the number ofaccidents, when one of them reduces the number of accidents by 20% and the other by30%, is:
Combined effect = 1 – (0.8 x 0.7) = 1 – 0.56 = 0.44
That is, the combined effect of the measures is an accident reduction of 44%, not50%, as the sum of their individual effects would seem to imply. This simple modelof estimating the combined effects of several safety measures that affect the sametarget accidents assumes that the percentage effects of the measures remainsunaffected when the measures are combined in a package. The validity of thisassumption is unknown. It is, however, the simplest model that can be used. Until amore complicated model can be supported by empirical research, using the simplestpossible model is defensible by virtue of the principle of insufficient reason.

72
8.2 Implications for the possibility of generalising the results of cost-benefit analyses
The results of cost-benefit analyses can probably only rarely be generalised from onecountry to another. The basic approach to cost-benefit analysis is, of course, universal.But the numerical values for costs and benefits that are put into the analyses are likelyto vary widely from one country to another. Add to this the variation in accidentreporting level, possibly varying effects of safety measures and varying initial levelsof safety, and you get a picture of very widely varying results of cost-benefit analysis.
It is perhaps instructive to try to distinguish between legitimate and irrelevant sourcesof variation in the results of cost-benefit analyses. Among the legitimate sources ofvariation in results are:
(1) Varying economic valuation of road safety between countries, at least in so far asit can be traced to varying income levels and varying preferences for safety.Variation that are attributable to an incomplete estimation of costs are, on theother hand, irrelevant and should be disregarded (this argument assumes that thesame basic cost components are relevant everywhere).
(2) Varying levels of cost of implementing a certain safety measure. The costs ofimplementing a certain safety measure are likely to vary between countries. Themost comparable cost estimates are those that have been converted to a commoncurrency, like the Euro, on the basis of exchange rates adjusted to purchasingpower parity.
(3) Varying adjustment factors for incomplete accident reporting based on the levelof reporting prevailing in each country.
(4) Varying economic valuation of effects other than safety of measures takenprimarily to improve road safety. It may be the case, for example, that the costsused for travel time vary between countries. Such variations ought to be acceptedon the same basis as similar variations in accident costs.
(5) Varying discount rates used to convert future costs and benefits to present value.Differences in discount rates that are related to the real level of interest rates in acountry or to the average return on capital earned by investments in a countryshould be retained at an international level.
(6) Varying effects of safety measures, attributable to either (a) systematic and knowndifferences in traffic environment between countries or (b) whether the measuresare carried out as part of a package of measures or not.
If these factors are treated as legitimate sources of differences in the results of cost-benefit analyses, it means that no attempt should be made to standardise the analysesat an international level with respect to these factors. Irrelevant sources of variationshould on the other hand be removed, and analyses standardised with respect to thesefactors. They include:
(1) Differences in road accident costs, attributable to differences in estimationmethods and cost components included. Confer the report from COST-313(Alfaro, Chapuis and Fabre 1994) for recommendations with respect to costelements to be included and estimation techniques to be used.

73
(2) Differences in the valuation of other effects, like travel time, changes in pollution,and so on, related to differences in items included and estimation techniques used.
(3) Differences in the estimated effects on safety of a specific measure that cannot bejustified in terms of research findings documenting that the true effects differbetween countries (and preferably explaining why this is the case).
(4) Differences with respect to the items included in a cost-benefit analysis, unlessthere is research to show, for example, that a measure affecting travel time in onecountry has no effect on travel time in another country.
As these lists indicate, a fairly detailed examination a cost-benefit analyses performedin different countries is needed in order to determine if differences in the results aredue to legitimate or irrelevant factors.

74
9 CASE ILLUSTRATIONS OF COST-BENEFIT ANALYSES
9.1 Conversion factors for the value of benefits and costs
In an attempt to make the results of the cost-benefit analyses as widely applicable aspossible, conversion factors have been developed to translate results that apply to onecountry to another country. These conversion factors are based on comparisons ofaccident costs in different countries (ETSC, 1997; Miller, 1998) and adjustmentfactors for price levels (ESA, 1997). Table 27 presents the conversion factors.
Table 27: Conversion factors for costs and benefits of road safety measures in theEU-countries and Norway. Sources: See text
Relative levels. Average for EU = 100
Country
Value of astatistical lifeETSC 1997
Value of astatistical lifeMiller 1998 Accident costs
Prices ofpublic con-sumption
Net correctionfactor
Austria 166 116 116 116 100
Belgium 109 132 132 98 135
Denmark 70 134 134 122 110
Finland 157 111 111 97 114
France 63 123 123 111 111
Germany 189 128 128 130 98
Great Britain 103 81 81 87 93
Greece 38 26 26 57 46
Ireland 58 NA 58 78 74
Italy 126 82 82 91 90
Luxembourg 97 NA 97 141 69
Netherlands 122 125 125 104 120
Norway NA 153 153 114 134
Portugal 63 34 34 45 76
Spain 38 54 54 77 70
Sweden 106 135 135 115 117
Mean for EU 100 100 100 100 100NA = not available
The first column gives the relative level of accident costs (the value of a statisticallife) in the EU-countries in 1995, according the report published by the EuropeanTransport Safety Council (ETSC, 1997). In this report, an attempt has been made toeliminate differences between countries in estimation methods affecting the level ofaccident costs. The costs given by ETSC include a valuation of lost quality of life(“pain, grief and suffering”) caused by road accidents. The average cost for all EU-countries has been set to 100 and the costs for each country are given relative to thisvalue. The second column gives similar estimates prepared by Miller (1998). Millerhas summarised studies made in twelve countries of the willingness-to-pay for

75
reduced risk of fatal injury. A best estimate was derived for each country. Theestimates were then regressed on mean income per capita. An income elasticity ofabout 1.5 in the demand for safety was found. Based on this income elasticity, Millerestimated predicted values of a statistical life for several countries.
As can be seen from Table 27, the estimates of ETSC and Miller are very similar.There are some differences as well. In developing the correction factors, the valuespresented by Miller have been used for all countries for which they are available. Forcountries that Miller did not include in his survey, the values provided by ETSC havebeen used. The results are presented in the third column.
The fourth column gives the relative price levels for final government consumption inthe EU as of 1995, according to the European Statistical Agency (ESA, 1997). Thenet correction factor to be used in cost-benefit analyses is the ratio of the correctionfactor for accident costs to the correction factor for price level. For Austria, forexample, this (116/116) x 100 = 100, when setting the EU-average equal to 100. Anexample will show the use of the correction factors. If the benefit-cost ratio of ameasure has been estimated to 1.5 for Austria, the benefit-cost-ratio of the samemeasure in Norway would be 1.34 x 1.5 = 2.0. For Greece it would be 0.46 x 1.5 =0.7.
The conversion factors are very crude. They are based on accident costs and prices ofgovernment consumption only, and disregard all other impacts of road safetymeasures. Besides, the factors assume that the effects of the measures are the same inall countries. These assumptions are unlikely to be correct. It is nevertheless hopedthat the conversion factors at least indicate the direction of the corrections that have tobe made in order to transfer the results of cost-benefit analyses from one country toanother.
The implications of using the conversion factors will not be explored in this report. Itshould be pointed out, however, that these implications are likely to be regarded asproblematic in some cases. A measure that gives good value for money in, forexample, Norway, will not necessarily do so in Greece and Portugal. This means thatpolicy recommendations based on cost-benefit analyses may recommend furtherimproving safety in countries that have a good safety record, while not introducing thesame safety measures in countries that have a poorer safety record.
Some of the cost-benefit analyses presented below use ECUs to measure costs andbenefits. These analyses rely on the cost estimates given in a report issued by theEuropean Transport Safety Council (1997). According to this report, road accidentscost a total of 162 billion ECUs in 1995. The reported number of injured personsacross the European Union was 1,580,000. The mean cost per injured person wastherefore 102,500 ECU. Assuming that on the average, 1.35 persons are injured ineach officially reported road accident, the average cost per reported accident becomes138,500 ECU. It is further assumed that travel time is valued at a cost of 10 ECU pervehicle per hour. This is a mean value for all types of vehicle.
76
9.2 Selection of measures for cost-benefit analysis
This chapter gives some case illustrations of cost-benefit analyses of measures thathave been proposed and discussed in previous chapters.
The report from Workpackage 1, dealing with pedestrian safety, lists and discusses avery large number of safety measures for pedestrians. It is not possible to conductcost-benefit analyses of all these measures. For some measures, not enough is knownabout costs and effects to make cost-benefit analyses. The following measuresdiscussed by workpackage 1 have been selected for analysis:
- Roundabouts- Road lighting- Integrated area wide speed reduction measures in urban areas- Environmentally adapted through-roads- Upgrading ordinary marked pedestrian crossings- Parking regulations- Side protection of trucks
Most of these measures will benefit cyclists as well as pedestrians. Workpackage 2concerns bicycle safety. The report from this Workpackage also discusses a largenumber of safety measures, of which the following have been selected for analysis:
- Local bicycle policy intended to encourage mode switching from car driving tocycling
- Bicycle lanes- Advanced stop line for bicycles at signalised junctions- Mandatory wearing of bicycle helmets- Improving bicycle conspicuity
In addition to these measures that are more or less targeted specifically at pedestrianand cycle accidents, the following measure has been shown to improve safety forpedestrians and cyclists:
- Daytime running lights on cars
Workpackage 3 concerns the safety of moped and motorcycle riders. There are notmany technical and non-restrictive safety measures available to improve the safety ofthese road users, but the following measures have been selected for cost-benefitanalysis:
- Daytime running lights for motorcycles- Mandatory wearing of helmets for motorcyclists- Design changes for motorcycles to improve safety
The subject of Workpackage 4 is the safety of young drivers and riders. Again this isa safety problem that does not have easy solutions. Most of the measures that areknown to be effective in reducing the number of accidents among young andinexperienced drivers involve some kind of restriction on their mobility. A cost-

77
benefit analysis has been made of the following measure:
- Graduated licensing, including the introduction of a lowered BAC-limit for newdrivers
- The introduction of a lowered BAC-limit for new drivers- Provision of Disco Buses to prevent impaired driving to and from discotheques
For simplicity, most cost-benefit analyses presented below refer to one junction, onepedestrian crossing, a road section of 1 kilometre length or one year’s normalexposure for a road user. Some of the analyses refer to all of Europe (daytime runninglights for cars), or to specific instances of application of a measure.
9.3 Roundabouts
The provision of roundabouts in urban and suburban areas has become increasinglymore common in recent years. Modern roundabouts are designed according to theoffside priority rule, which means that traffic entering the roundabout has to give wayto circulating traffic already in the roundabout. This regulation, in addition to thedeflection brought about by the central island in a roundabout serve to reduce speed.Moreover, the task of road users entering the roundabout is simplified, in that alltraffic comes from one direction only. Roundabouts have therefore lead to substantialimprovements in safety.
In addition, roundabouts have greater capacity than junctions controlled by give waysigns or traffic signals. In junctions carrying large traffic volumes, which means morethan an AADT (annual average daily traffic) of roughly 10,000 roundabouts thereforeshortens travel time, despite the fact that speed is reduced. This shortening is broughtabout by shorter waiting time, especially in junctions with a high proportion ofvehicles entering from the minor road.
The major assumptions made in the cost-benefit analysis and the results of theanalysis are given below. The calculations are illustrative only, but the assumptionsmade are meant to be typical for the application of this measure in an urbanenvironment. A distinction is made between three leg junctions and four leg junctions,because the effects of roundabouts on safety and mobility differ between these typesof junction. No effects on pollution have been assumed, although in junctions with ahigh traffic volume, a certain reductions in vehicle emissions can be expected. Adiscount rate of five percent has been used. A time horizon of 25 years is used. Thismeans that the present value of benefits equals 14.094 times the first year benefits.The results of the analysis are given in Norwegian kroner (NOK).

78
Number of legs in junction
Assumptions made and results of analysis Three legs Four legs
Annual average daily traffic (typical value) 7,500 15,000
Injury accidents per million entering vehicles 0.10 0.15
Expected annual number of accidents 0.27 0.82
Effect on accidents of converting to roundabout -25% -35%
Annual number of prevented accidents 0.07 0.29
Present value of accident cost savings (25 yrs, 5%) 1,540,000 6,480,000
Travel time change per entering vehicle (seconds) 0 -3
Present value of travel time savings 0 6,430,000
Total benefits 1,540,000 12,910,000
Costs of installing roundabout (investment) 1,250,000 1,500,000
Benefit/cost ratio 1.23 8.61
It is seen that converting junctions to roundabouts gives benefits that exceed the costsunder the assumptions made. In general, a roundabout is a good solution for junctionswith a daily traffic of more than about 5,000 vehicles. Benefits exceed costsirrespective of whether travel time savings are included or not. The effects on traveltime are therefore not decisive for the results of the analysis. Benefits would exceedcosts even if there were a slight increase in travel time.
Roundabouts reduce the number of pedestrian accident by the same percentage as allother accidents (Elvik, Mysen and Vaa 1997). As far as bicycle accidents areconcerned, the effect appears to be somewhat smaller, in the order of 10-20%reduction in the number of accidents.
9.4 Road lighting
Road lighting is a very effective accident prevention measure (Elvik 1995). It isparticularly effective in reducing fatal accidents and accidents involving pedestrians.Since these types of accident involve higher costs than the average accident, roadlighting gives large savings in accident costs. An average cost of 2,000,000 NOK perprevented injury accident in built up areas has been assumed. It has been assumed thatroughly speaking one third of all accidents happens in darkness. The results of anillustrative estimate of costs and benefits are given below.
It should be noted that these estimates are conservative. It has been found that roadlighting slightly increases driving speed (Bjørnskau and Fosser 1996). If the benefitsof travel time savings were added to the safety benefits, installing road lighting wouldbecome even more beneficial than indicated below.

79
Location of application
Assumptions made and results of analysisPedestriancrossing
Urban roadsection
Annual average daily traffic (typical value) 10,000 15,000
Injury accidents per million vehicles/vehicle kms 0.10 0.40
Expected annual number of accidents 0.37 2.19
Of which accidents in darkness 0.15 0.65
Effect on accidents of installing road lighting -50% -30%
Annual number of prevented accidents 0.07 0.20
Present value of accident cost savings (25 yrs, 5%) 2,240,000 5,640,000
Total benefits 2,240,000 5,640,000
Costs of installing road lighting (investment) 200,000 400,000
Present value of operating costs 110,000 210,000
Total costs 310,000 610,000
Benefit/cost ratio 7.23 9.25
The effects on safety of installing road lighting vary, depending on the previous levelof illumination and the quality of lighting. The relationship between the quality oflighting and the effects on injury accidents is indicated in Figure 14. The figure showsthat when existing road lighting is partly switched off, the number of injury accidentswill increase. The effect on accidents of a substantial upgrading of lighting is thesame as the effect of installing lighting on a previously unlit road.
A trend line has been inserted in Figure 14 to highlight the relationship between thequality of lighting and the effect on accidents.
Figure 14: Relationship between quality of lighting (change in luminance level) andeffect of road lighting on the number of injury accidents.
17
-8
-13
-32
-28
y = -29,696Ln(x) + 15,633
R2 = 0,9429
-40
-30
-20
-10
0
10
20
Half of lighting switchedoff
Luminance leveldoubled
Luminance levelincreased by a factor of
2-5
Luminance levelincreased by factor of
more than 5Lighting on previously
unlit road
Change in quality of lighting

80
9.5 Integrated area-wide speed reduction measures
Driving speed has a major effect on the probability of becoming involved in anaccident and on the severity of injuries once the accident has occurred. For example,the proportion of pedestrians who are killed rises rapidly when impact speed is morethan 30 km/h (Anderson et al 1997). The lower the driving speed, the smallerbecomes the chances of accidents involving serious injury to pedestrians or cyclists.In Great Britain, area-wide speed reduction measures have been applied in manyareas. The Transport Research Laboratory (Finch 1998) has summarised experiencefrom these schemes.
Just over half the schemes (56%) were located in urban residential areas with 29%occurring on main roads in rural locations and the remaining 15% in town centreareas. 74% of the schemes were aimed at reducing speed, with 64% aimed at accidentreduction, and 36% at reducing the volume of through traffic. Nearly every schemewas intended to address two of these problems and many were aimed at all three.Environmental improvements were sought in 17% of the schemes, fairly evenlyspread over the three types of location. This low proportion is probably related to therelatively high costs associated with environmental improvements. 60% of theschemes fell within the cost range £10,000 to £100,000. About 20% cost less than£10,000 and the same percentage cost over £100,000. Significantly 9% of theschemes cost more than £250,000, so traffic calming should not be seen as a cheapmeasure.
Figure 15 summarises the effects of the area-wide speed reduction schemes in threedifferent types of area: (1) Town centres, (2) Rural main roads, and (3) Residentialareas. Effects are given as the percent change in traffic volume, mean speed and thenumber of injury accidents from the before-period to the after-period.
Figure 15: Mean effects of area-wide speed reduction measures in Great Britain.Adapted from Finch 1998.
-9
-1
-18
-36
-20
-34
-64
-53
-68
-80
-70
-60
-50
-40
-30
-20
-10
0
Town centre Rural main road Residential area
Traffic volume
Mean speed
Accidents

81
Traffic volume was reduced in all areas, varying from 1% to 18%. Mean speed wassharply reduced, from 32.0 to 20.5 miles/h (36% reduction) in town centres, from 43.2to 34.5 miles/h (20% reduction) on rural main roads, and from 35.6 to 23.5 miles/h(34% reduction) in residential areas. The number of injury accidents was reduced by50 to 70%. These accident reductions are not implausibly large. In general, thenumber of injury accidents depends on the square of speed. Hence, a speed reductionof, for example 36%, would be expected to lead to a reduction of:
(Speed after/Speed before)2 = 0.642 = 0.41 = 59% reduction
In town centres, traffic volume was reduced by 9%. In addition to the reduction inaccidents attributable to reduced speed, one would therefore expect an additionaldecline of 9%, leading to a total accident reduction of 0.41 x 0.91 = 0.37,corresponding to a 63% accident reduction. The observed value of 64% accidentreduction is remarkably close to this value. Applying a similar reasoning to the otherareas leads to identical results. The observed accident reductions are likely to becaused mainly by the speed reduction measures that were introduced.
The data available for the area-wide speed reduction measures are eminently suitableto cost-benefit analysis. Such an analysis is summarised below. Amounts are inPounds sterling. For simplicity, it has been assumed that each scheme affects 1kilometre of road.
Costs and benefits by type of area
Assumption made and results of analysisTown centre Rural main
roadResidential
areaNumber of prevented injury accidents/year 53 34 145
Saving in accident costs (£, 25 years, 5%) 33,350,000 21,400,000 91,260,000
Increased costs of travel time (£, 25 years, 5%) 21,900,000 21,930,000 53,250,000
Loss of consumers’ surplus of travel 2,415,000 460,000 9,300,000
Total benefits 9,035,000 -990,000 28,710,000
Costs of implementing measures (£) 4,910,000 2,785,000 2,955,000
Benefit/cost ratio 1.84 -0.36 9.72
The value of travel time was set at 7 pence per minute, based on a recent survey byWardman (1998). The value of one hour of travel then becomes 4.2 Pounds. Toillustrate how the cost of increased travel time was estimated, consider the case oftown centres. 93,000 vehicles are affected each day of the year. Each vehicle isdelayed by 0.0109 hours (the difference between driving 1 kilometre at 32 miles/h and20.5 miles/h). The costs of increased travel time then become:
93,000 x 365 x 0.0109 x 4.2 x 14.094 = 21,900,000.
The estimates for rural main roads and residential areas were made the same way.175,000 cars per day were assumed to be affected by increased travel time on ruralmain roads. 170,000 cars per day were assumed to be affected in residential areas.

82
In town centres, about 9,400 cars disappeared each day. This reduction in trafficvolume entails a loss of consumers’ surplus. It is difficult to estimate the size of thisloss very precisely. However, it is at least equal to the size of the increase in the costsof travel time, given per kilometre of travel. Otherwise, this increased cost would nothave deterred drivers from driving. For town centres, this amounts to 0.0109 x 4.2 =0.045 Pounds per kilometre of driving. A value of 0.05 was assumed for all areas. Fortown centres, the loss of consumers’ surplus then becomes:
9,400 x 365 x 0.05 x 14.094 = 2,415,000.
The estimates were made the same way for rural main roads and residential areas.When all effects are summarised, the net benefits are positive in town centres andresidential areas, but negative on rural main roads. The fact that net benefits turn outto be negative on rural main roads is mainly attributable to the large increases in thecosts of travel time. The increased costs of travel time more than offset the benefits ofaccident savings. A recent Norwegian study of measures designed to support reducedspeed limits in urban areas came to the same conclusion (Elvik 1998). Increased costsof travel time are larger than the savings in accident costs.
The fact that the benefit-cost ratio is most favourable for residential areas is notsurprising. Residential roads tend to have high accident rates and low speed isgenerally regarded as an improvement in residential quality.
These results illustrate several troublesome aspects of current cost-benefit analyses. Inthe analyses presented above, an average cost of 43,550 Pounds per injury accident at1997-prices was used. There is no information on how the schemes affected accidentseverity. In general, however, a speed reduction will reduce accident severity. In orderto bring this into a cost-benefit analysis, one would need to know how the speedreducing schemes affected accidents at each level of severity from fatal accidentsthrough slight injury accidents. This shows that fairly detailed information about thesafety effects of a measure is needed in order to do a correct cost-benefit evaluation.
In the second place, it is not obvious that the mean value of travel time, aggregated forall trip purposes and all groups of road users, ought to be used in every cost-benefitanalysis. In residential areas at least, one may expect the proportion of heavy vehicles(lorries and buses) to be smaller than on rural main roads. Moreover, the proportion oftrips that are business trips is likely to be smaller in residential areas than in otherareas. The value of travel time is higher for heavy vehicles than for small vehicles,and higher for business trips than for other travel purposes. One would thereforeexpect the mean cost of travel time for trips done in residential areas to be lower thanfor trips done on rural main roads. However, detailed knowledge of the compositionof traffic by type of vehicle and trip purpose by type of area is needed in order toaccount for these differences in a cost-benefit analysis.
In the third place, the effects of the speed reducing measures are evaluated strictlyfrom a road user point of view. When car drivers are forced to slow down, that countsas an added cost. A similar point of view applies to reduced traffic volume. Whentravel becomes less attractive, there is less of it, and that counts as a loss for thepotential travellers. But an important objective of speed reducing measures is toimprove conditions for those who live or work in an area, or for those groups of road
83
users who do not drive a car. A reduction of traffic is perhaps a reduction of benefitfrom the road users’ point of view, but may well be perceived as a benefit from thepoint of view of residents or non-motorised travellers. Less motor traffic means lessnoise and pollution. It also means that crossing the road becomes easier. A cost-benefit analysis that does not include these benefits is incomplete and one-sided. Itfavours car drivers’ point of view and interests at the expense of those who do notdrive.
In a wider perspective, one may wonder how a long-term target of curbing the use ofcars in the interest of environmental sustainability can fit into the current frameworkfor cost-benefit analysis. Measures that reduce motor traffic, either by raising thedirect costs or by slowing traffic down, will often fail a cost-benefit test, because lesstraffic counts as a negative benefit. In this sense, cost-benefit analysis can hardly besaid to be neutral with respect to long-term policy objectives. Reduced cost andincreased demand always counts as a benefit in cost-benefit analysis, whereas areduction in demand – ceteris paribus – counts as a loss of benefit. Policies that aim toreduce travel demand are very difficult to justify by means of cost-benefit analysis.Yet it may be precisely such policies that are needed in order to promote a sustainabletransport system.
9.6 Environmentally adapted through-roads
An environmentally adapted through-road is a main road passing through a village orsmall town which has been modified in order to reduce speed and improve theenvironment. Roads are reconstructed by providing humps or raised pedestriancrossings, by widening the pavement and narrowing the driving lanes, by plantingflowers and trees to make the road look nicer, by regulating parking more strictly andby introducing other measures that are intended to beautify the road and its closestsurroundings.
Environmentally adapted through-roads have been constructed in many small townsacross Europe. A collection of examples, amply illustrated by photographs, isprovided in a report by Herrstedt and other (1993), published by the Danish RoadDirectorate in 1993. Based partly on this collection, Elvik (1998) has performed cost-benefit analyses of environmentally adapted through-roads based on Norwegian data.These data are fairly representative of conditions in Northern Europe as far asinvestment costs, traffic volume and accident rates are concerned. Figure 16 presentsa typical example of the results of the analyses.
Benefits are given as positive numbers, losses as negative numbers. Investment costsare given as a positive number. Figure 16 shows that accident costs are reduced, butall other travel costs are increased. Speed is reduced, leading to an increase in traveltime costs. At the speeds relevant for this analysis – roughly speaking speeds between55 and 40 km/h – vehicle operating costs tend to increase if speed is reduced. Perhapssurprisingly, even environmental costs are expected to increase slightly when anenvironmentally adapted through-road is built. The increase in environmental costs isattributable to an increase in specific pollution emissions at low speed. Specificpollution emissions denote the emission in grams per kilometre of driving of specificpollutants like NOx, CO2 and VOC. Traffic noise is reduced, but the benefits of this

84
are more than offset by the increase of polluting gas emissions. The sum of allbenefits is actually negative, implying that the measure should not be carried out evenif did not cost anything at all.
Figure 16: Cost-benefit analysis of environmentally adapted through-road in Norway.Source: Elvik 1998.
Once again, this kind of result leaves one wondering if there is something seriouslywrong with the current framework for cost-benefit analysis. Briefly speaking, currentcost-benefit analyses of road projects are based on the preferences of road users. Itshould not come as a great surprise that road users want cheap and fast transport, andthat everything that makes it more expensive to travel or slows travel down is hardlyperceived as an improvement from the traveller’s point of view. But this perspectiveis one-sided. Travel has substantial negative effects on the environment. Althoughthese “external effects of transport”, as they are referred to in economic jargon, aresupposed to be included in the above cost-benefit analysis, one may doubt if theyhave been given sufficient weight.
The right way of bringing environmental objectives into cost-benefit analysis dependsin an important way on how one defines the right of ownership to environmentalbenefits. On the one hand, one could argue that road users collectively (as taxpayers)own the road and are entitled to use it as they wish. On the other hand, one couldargue that those who are neighbours to a road have the right to clean air and to notbeing disturbed by traffic noise. Since both a public road and a cleaner environmentare public goods, one cannot settle the matter by assigning formal rights of ownershipto these goods in the same way, as private goods are individually owned. It isultimately a matter of how one defines the rights citizens are entitled to exercise in ademocratic society. It is beyond the scope of this report to settle such constitutionalissues.
8,3
-10,4
-1,9-0,8
-3,2
7,2
-15,9
-20,0
-15,0
-10,0
-5,0
0,0
5,0
10,0
Accidents Travel timeVehicle
operation Environment Total benefit CostNet present
value
Component of benefits or costs
AADT = 5,000 Accident rate = 0.50 injury accidents per million vehicle kilometre
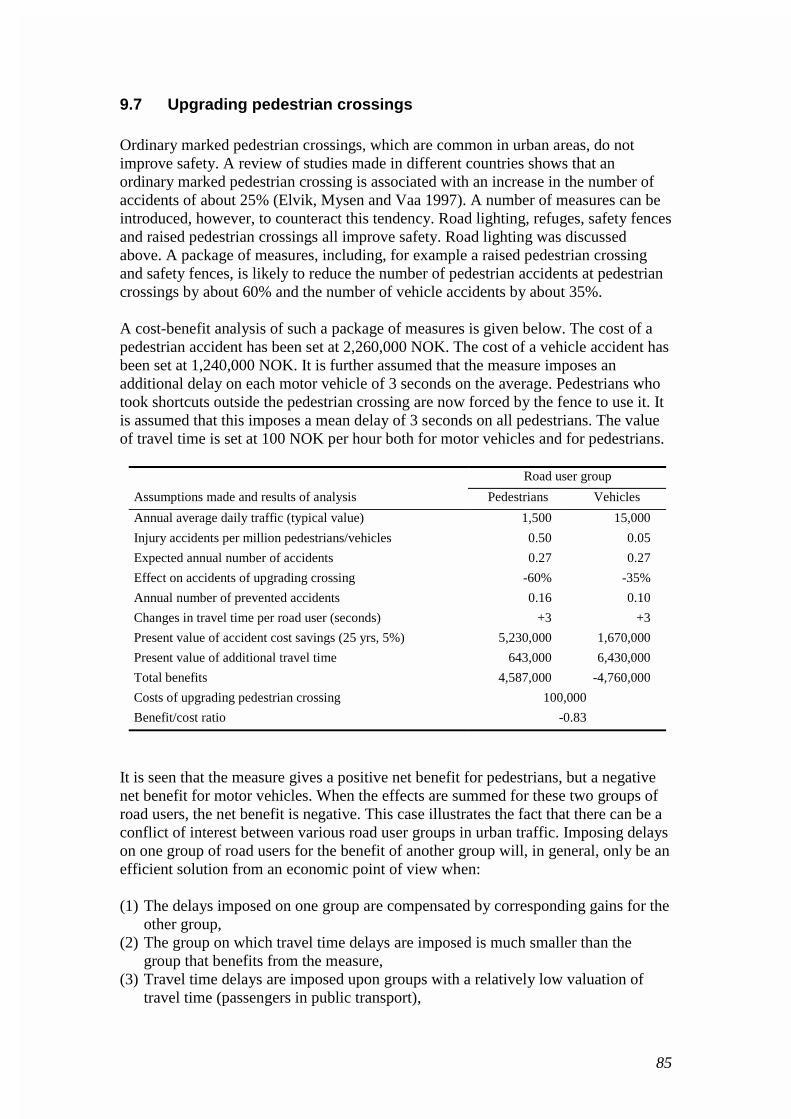
85
9.7 Upgrading pedestrian crossings
Ordinary marked pedestrian crossings, which are common in urban areas, do notimprove safety. A review of studies made in different countries shows that anordinary marked pedestrian crossing is associated with an increase in the number ofaccidents of about 25% (Elvik, Mysen and Vaa 1997). A number of measures can beintroduced, however, to counteract this tendency. Road lighting, refuges, safety fencesand raised pedestrian crossings all improve safety. Road lighting was discussedabove. A package of measures, including, for example a raised pedestrian crossingand safety fences, is likely to reduce the number of pedestrian accidents at pedestriancrossings by about 60% and the number of vehicle accidents by about 35%.
A cost-benefit analysis of such a package of measures is given below. The cost of apedestrian accident has been set at 2,260,000 NOK. The cost of a vehicle accident hasbeen set at 1,240,000 NOK. It is further assumed that the measure imposes anadditional delay on each motor vehicle of 3 seconds on the average. Pedestrians whotook shortcuts outside the pedestrian crossing are now forced by the fence to use it. Itis assumed that this imposes a mean delay of 3 seconds on all pedestrians. The valueof travel time is set at 100 NOK per hour both for motor vehicles and for pedestrians.
Road user group
Assumptions made and results of analysis Pedestrians Vehicles
Annual average daily traffic (typical value) 1,500 15,000
Injury accidents per million pedestrians/vehicles 0.50 0.05
Expected annual number of accidents 0.27 0.27
Effect on accidents of upgrading crossing -60% -35%
Annual number of prevented accidents 0.16 0.10
Changes in travel time per road user (seconds) +3 +3
Present value of accident cost savings (25 yrs, 5%) 5,230,000 1,670,000
Present value of additional travel time 643,000 6,430,000
Total benefits 4,587,000 -4,760,000
Costs of upgrading pedestrian crossing 100,000
Benefit/cost ratio -0.83
It is seen that the measure gives a positive net benefit for pedestrians, but a negativenet benefit for motor vehicles. When the effects are summed for these two groups ofroad users, the net benefit is negative. This case illustrates the fact that there can be aconflict of interest between various road user groups in urban traffic. Imposing delayson one group of road users for the benefit of another group will, in general, only be anefficient solution from an economic point of view when:
(1) The delays imposed on one group are compensated by corresponding gains for theother group,
(2) The group on which travel time delays are imposed is much smaller than thegroup that benefits from the measure,
(3) Travel time delays are imposed upon groups with a relatively low valuation oftravel time (passengers in public transport),
86
(4) The travel time delays imposed are too small to matter from an economic point ofview and are therefore assigned zero cost.
The term “efficient” as used here denotes a change for which the benefits exceed thecosts, as valued by the people who benefit or who incur the costs. This concept is theone underlying cost-benefit analysis. It does not embody notions of fairness, forexample. If, for example, one considers it unfair that cars impose delays onpedestrians, then the above calculations are less relevant. One may also think thatdelays or savings of only three seconds do not matter – you cannot use those threeseconds to do anything meaningful.
The notion of a threshold value for travel time delays or savings is troublesome,however. Why would pedestrians want to cross the road outside a pedestrian crossing,only to save a few seconds? Why would safety fences be needed? Why are somedrivers reluctant to give way to pedestrians at pedestrian crossings, if it only delaysthem by an insignificant few seconds? Why do we have to force drivers to slow downby installing raised pedestrian crossings?
It is perhaps not travel time as such which matters. Maybe it is the hassle of gettingout of one’s routine, of having to change behaviour and pay more attention to trafficthat explains behaviour in such situations. A pedestrian crossing outside a pedestriancrossing may not want to save time. He simply does not want to make a detour,because it is felt as unnecessary.
Yet, this does mean that there is an element of added cost – of inconvenience – to thepedestrian in using the formal crossing location. Whether this element of in-convenience is labelled “travel time” or something else matters less. It should berecognised that the concept of valuation of travel time, as used by economists, has afairly broad scope and is intended to include all forms of behaviour in which traveltime is traded off against other goods, no matter what the motives underlying thosetradeoffs are.
9.8 Parking regulations
Parked cars are a traffic hazard for pedestrians, particularly children. Research hasshown that prohibiting on-street parking improves safety (Elvik, Mysen and Vaa1997). The number of accidents is reduced by about 25% in streets where on-streetparking is prohibited. It is not known, however, whether removing parking from onestreet merely leads to a displacement of the problem to a neighbouring street.
To remove this complication from the analysis, it will be assumed that a garage isbuilt and that all parking is moved from the street to the garage. It will be assumedthat the costs of building and operating the garage is paid by those who use it, and thatit does therefore not involve any additional public expenditure. For a one kilometreresidential street with double-sided parking, parking capacity may be around 250 cars.It has then been assumed that the net space occupied by each car is 7.5 metres. Thisalso includes the space occupied by junctions along the street.

87
Constructing a garage for 250 cars will cost about 25 million NOK. Annual operatingcosts for the garage will be about 2.5 million NOK. Assuming construction costs areamortised in 25 years, the total annual costs will be 4.275 million NOK at a 5%interest rate. This amounts to 17,100 NOK per parking space in the garage. Inaddition, signing the parking prohibition will cost about 25,000 NOK.
Assuming the street has an AADT of about 2,000 and an accident rate of about 0.70injury accidents per million vehicle kilometres, a 25% reduction in the number ofaccidents corresponds to a saving in accident costs of about 2.9 million NOK (presentvalue for 25 years). This is far more than the costs of signing the prohibition, but lessthan the costs of constructing the garage. Incurring this cost therefore cannot bedefended by reference to safety effects alone. Garage parking does, however, provideother advantages to car owners. By renting space in a garage, one is alwaysguaranteed a parking space. Theft of the car may be less likely and leaving it parkedfor a long time may be less of a problem than it is when parking onstreet.
9.9 Front, rear and side underrun guard rails on trucks
There exists very little knowledge concerning the effects of underrun protectiondevices for trucks (Elvik, Mysen and Vaa 1997). A recent British study (Knight 1998)has estimated the potential effects on fatalities of providing guard rails around allsides of trucks to prevent underriding and make crashes less severe. Based on thisstudy, Table 28 has been drawn up.
Protecting all sides of trucks by means of energy absorbing devices with a low groundclearance (best currently available technology) is expected to reduce the number offatal injuries by about 12% (158 out of 1358). The effect on injuries is likely to besmaller as some of those who otherwise would have been killed do not avoid injuryaltogether. An estimate in the range of 5-10% injury reduction appears to bereasonable.
A preliminary cost-benefit analysis has been made on the basis of Norwegian data.The results of this analysis were as follows (Table 28).It was assumed that providing full protection against underriding would cost about13,500 NOK per truck. The expected annual cost of accidents for a truck in Norway isabout 39,000 NOK. If it is assumed that this cost is reduced 10% per year, the presentvalue of the savings in accident costs (15 years, 5% discount rate) can be estimated toabout 40,000 NOK. This easily exceeds the cost of providing protection againstunderriding. Benefits would exceed costs even if the safety effect was as small as 5%.It would therefore seem to be a good idea to provide trucks with protection againstunderriding.

88
Table 28: Estimate of expected effects on fatalities of underrun guard rail protectionon trucks. Adapted from Knight 1998.
Group of road userinjured in crash
Current number offatalities
Effect of underrunguard rail (%)
Number of fatalitiesprevented
Car occupants 671
- frontal impacts 555 -23% 128
- rear impacts 42 -33% 14
- side impacts 74 -5% 4
Pedestrians 175 0% 0
Cyclists 76 -13% 10
Motorcyclists 81 -2% 2
Other groups 191 0% 0
Total 1385 -12% 158
9.10 Local bicycle policy to encourage mode switching
Car driving imposes external costs on society. By external costs are meant all coststhat are not taken into account by drivers, and are, effectively, treated as zero costs.The major categories of external costs caused by motor travel include:
• Costs of air pollution• Costs of traffic noise• Part of the costs of traffic congestion• Part of the costs of injury accidents
These costs are all related to unintended negative effects of transport and do to amajor extent not have market prices. It is difficult to estimate the external costs ofmotor transport and no international consensus estimate exists. Depending on howcosts are estimated, and which items are included, it is therefore possible to arrive atvery different results.
Cycling does not generate the same external costs as car driving. The major item inthe external costs of cycling is likely to be accident costs. Contrary to motorisedtransport, cycling may generate external benefits, not just external costs. The externalbenefits of cycling may include, for example, the savings in public health carespending obtained if the general physical fitness of the population improves as a resultof more cycling.
In order to gain an impression as to whether it would make sense at all to try to makecar drivers choose cycling instead of driving, an estimate of the external costs of cardriving and cycling will be presented. Considering the great uncertainty in estimatesof the external costs of transport, the numerical estimate presented below should beregarded as an example only. Nevertheless, the cost estimates are intended to bereasonable. They have been derived from a report published by the European

89
Conference if Ministers of Transport in 1998 (ECMT 1998). The cost estimates aregiven in NOK.
Estimates of the mean external costs per kilometre of driving a private car are given inTable 29.
Table 29: External costs of driving 1 kilometre with a passenger car. Estimatesapplicable to Norway. NOK per kilometre. Rounded values
Type of traffic environment
Type of cost Countryside Suburban Town centre
Air pollution 0.075 0.27 1.07
Traffic noise 0.025 0.08 0.23
Injury accidents 0.15 0.20 0.25
Total cost 0.25 0.55 1.55
It has been assumed that all costs of air pollution and traffic noise are external. Forroad accidents, it has been assumed that 40% of the costs are external (Elvik 1994).This external cost consists of about 30% that are costs external to the traffic system,that is imposed on society in general, and 10% that are an injury externality inaccidents in which cars cause injuries to other road users. A mean cost per injuryaccident of 2.5 million NOK in the countryside, 2.0 million NOK in suburban areasand 1.6 million NOK in town centres has been assumed. An accident rate forpassenger cars of 0.15 injury accidents per million kilometres of driving has beenassumed for the countryside. For the suburban and town centre traffic environments,injury accident rates of 0.3 and 0.4 per million kilometres of driving, respectively,have been assumed.
Cycling can be assumed to generate no external costs relating to air pollution andtraffic noise. The external accident costs of cycling differ from those of car driving forat least three reasons:
(1) Cycling has a higher accident rate than car driving. If single bicycle accidents notreported to the police are included, the injury accident rate for a cyclist in Norwayis about 40 times higher than for a car driver.
(2) Injury severity in bicycle accidents is, perhaps surprisingly, on the average lowerthan injury severity in motor vehicle accidents. This is the fact when all bicycleaccidents are included. It is not true, however, of accidents in which cyclists arestruck by cars.
(3) Cyclists injure other road users less frequently than car drivers. Hence, the injuryexternality costs will be a smaller part of the external costs of accidents than forcar drivers.
The mean external costs of bicycle accidents have been estimated to about 0.70 NOKper kilometre of cycling in Norway. This is an average applying to all types of trafficenvironment. These external costs exceed those of car driving for both the rural andsuburban traffic environments. In town centres, the external costs of car driving areprobably greater than those of cycling, which suggests that a reduction in the total

90
external costs would be possible by switching from driving to cycling. On the otherhand, cyclists are more at risk in town centres, which means that the external accidentcosts of cycling in town centres is likely to be higher than the average externalaccident costs.
Possible external benefits of cycling are difficult to estimate. A simple numericalexample, given in Elvik (1999), shows that the savings from a reduction of 20% in theincidence of short term illness among 20 workers who take up cycling to work as aform of exercise could amount to about 580,000 NOK per year. This is the presentvalue for 25 years, applying a discount rate of 7%. The amount of cycling that wasassumed to be performed by the workers during one year in this example is 9,200kilometres (230 x 2 x 20). Annual savings from reduced absence from work are50,000 NOK. This is an external benefit of more than 5 NOK per kilometre ofcycling. This dwarfs the external cost of accidents. Even if the external benefits ofcycling were much smaller, they would still more than offset the external accidentcosts.
This shows that it would make sense from an economic point of view to encouragecycling, even when the external costs of cycling are greater than the total externalcosts of car driving. Cycling generates external benefits in the form of improvedhealth that car driving does not. It is important to include these external benefits in acost-benefit analysis, otherwise erroneous conclusions may be drawn from acomparison based on the external costs exclusively.
9.11 Bicycle lanes
Bicycle lanes are a cheap and effective way of improving the conditions for cyclists inurban areas. There is conflicting evidence on the safety effects of bicycle lanes (Elvik,Mysen and Vaa 1997). However, in countries with a well-established tradition ofcycling, like the Netherlands, bicycle lanes appear to affect safety favourably. Theprovision of bicycle lanes may lead to a slight decline in driving speed, because thelanes reserved for motor vehicles become a bit narrower. Cyclists may save traveltime, because they can travel unencumbered on their own lanes, not having to adapt tomotor vehicles or pedestrians all the time. This can make cycling a more attractivemode of travel in urban areas.
In the cost-benefit analysis presented below, it has been assumed that the provision ofcycle lanes reduces the number of bicycle accidents by 10%, and in addition to thatreduces the generalised costs of travel for cyclists (excepting that part of these costsrelated to accidents) by 20%. This is assumed to lead to a 15% increase in cycling.For motor traffic and pedestrians, a reduction in accidents of 30% is assumed. Speedis assumed to go down about 5%, from a mean of 50 km/h before the measure to 47.5km/h after. The mean cost of accidents in urban areas, 1,600,000 NOK per policereported injury accident, has been used.
It is possible to give some highly preliminary estimates of the generalised costs oftravel for pedestrians and cyclists, and some elements of those costs, based on thefindings of the stated preference survey conducted as part of the WALCYNG-project(Stangeby 1997). Since none of these costs have so far been estimated in other

91
studies, they are used for illustrative purposes only. These values should not beregarded as definite.
According to the WALCYNG-report, the cost of travel time is 73 NOK/hour for apedestrian and 59 NOK/hour for a cyclist. Other studies (Elvik 1998) show that themean speed of travel is about 6 km/hour for a pedestrian and about 9 km/hour for acyclist. This gives costs of travel time of 12.17 NOK/km and 6.56 NOK/km, forpedestrians and cyclists, respectively. It is assumed that the cost of travel time is thedominant element of the generalised cost of travel for pedestrians and cyclists. It isfurther assumed that the costs of insecurity represent the other important element inthe generalised costs of travel for pedestrians and cyclists. If the cost of insecurity isassumed to be 2,000 NOK per pedestrian or cyclist per year, they come to about 6.7NOK/km of travel for pedestrians (mean annual walking distance 300 km) and about4.5 NOK/km of travel for cyclists (mean annual cycling distance 440 km). Aconservative estimate of the generalised costs of travel based on these assumptions is15 NOK/km for pedestrians and 10 NOK/km for cyclists. This corresponds to about 1ECU per km for cyclists. The results of the cost-benefit analysis are presented below.
Road user group
Assumptions made and results of analysis Cyclists All others
Annual average daily traffic (typical value) 1,500 15,000
Injury accidents per million road user kms 0.80 0.40
Expected annual number of accidents 0.44 2.19
Effect on accidents of bicycle lane -10% -30%
Annual number of prevented accidents 0.04 0.66
Present value of accident cost savings (25 yrs, 5%) 988,000 14,816,000
Present value of additional travel time 8,122,000
Benefits of reduced generalised costs of travel 16,660,000
Total benefits 17,648,000 6,694,000
Costs of marking bicycle lane (renewal after 5 yrs) 2,500,000
Benefit/cost ratio 9.74
It turns out that the benefits of the savings in the generalised costs of cycling, and theattendant induced cycling, are far greater than the savings in accident costs. Formotorists, the savings in accident cost exceed the increase in the costs of travel time.Marking bicycle lanes on both sides of an urban road (1 kilometre) has been assumedto cost 700,000 NOK initially. Marking will have to be renewed every five years tomaintain the effects. The present value of initial and future costs for marking bicyclelanes is about 2,500,000 NOK. Benefits exceed costs by a wide margin.
It should be noted that the assumptions made with respect to changes in travel timeand the volume of cycling are not decisive for this result. Even if bicycle lanes areconsidered as an accident prevention measure exclusively, benefits still clearly exceedcosts.

92
9.12 Advanced stop lines for cycles at junctions
Advanced stop lines for cycles at junctions have been found to reduce the number ofaccidents (Elvik, Mysen and Vaa 1997). In addition, it has been argued that advancedstop lines will reduce cyclist exposure to pollution from automobiles (Lidström 1980).This sounds reasonable, since cyclists would be closer to the exhaust pipes if theystop alongside cars or behind them than if they stop in front of them.
Advanced stop lines for cyclist may impose a very slight delay on motor traffic, sinceit has to stay behind the cyclists when traffic lights turn green. In the analysispresented below, a mean delay of 2 seconds has been assumed. This has not beendocumented, but is used as an illustration of the order of magnitude of a possibleeffect only (if any delay at all is imposed, it will at most amount to seconds, notminutes).
The benefit of a possible reduced exposure of cyclists to pollution is very difficult toput a monetary value on. There exist a number of estimates of the external costs of airpollution from cars in towns, amounting in general to some 0.25 to 0.50 NOK pervehicle kilometre for light cars. The duration of exposure during the red phase at asignalised junction is fairly short. On the other hand, cars are running on empty andtherefore emit more pollution than when they are moving. Simply to see whatdifference this factor could make to the results of a cost-benefit analysis, the benefitsof reduced cyclist exposure to pollution have been fixed to 0.10 NOK per car enteringthe junction. This is of course an illustrative and exploratory estimate only. The meancost of a police reported injury accident in urban areas (1,600,000 NOK) has beenused. Stop lines have been assumed to require renewed marking every five years. Ithas been assumed that marking them costs 250,000 NOK per junction. The results ofa cost-benefit analysis are presented below.
The analysis indicates that benefits are greater than costs by a wide margin. Thisconclusion applies even if the non-safety related effects of the measure aredisregarded. The estimated benefit of reduced exposure to pollution, in particular, issurprisingly large and possibly shows that the assumptions made with regard to thiseffect are erroneous.
Road user group
Assumptions made and results of analysis Cyclists All others
Annual average daily traffic (typical value) 1,500 15,000
Injury accidents per million entering road users 0.50 0.10
Expected annual number of accidents 0.27 0.55
Effect on accidents of advanced stop line -25% -50%
Annual number of prevented accidents 0.07 0.27
Present value of accident cost savings (25 yrs, 5%) 1,543,000 6,173,000
Present value of additional travel time 4,290,000
Benefits of reduced exposure to pollution 7,720,000
Total benefits 9,263,000 1,883,000
Costs of marking stop line (renewal after 5 yrs) 890,000
Benefit/cost ratio 12.52

93
9.13 Mandatory wearing of bicycle helmets
Mandatory wearing of bicycle helmets has been introduced in Australia, New Zealandand some of states of the United States (in the United States mostly for schoolchildren). The evaluation studies that have been made indicate that a law requiringcyclists to wear helmets generates three effects (Elvik, Mysen and Vaa 1997):
(1) The helmet effect, which reduces the likelihood of sustaining a head injury in anaccident. This effect manifests itself in a decline in the proportion of all injuries tocyclists that are head injuries.
(2) The behavioural adaptation effect, which means that some cyclists may cycle lesscarefully when they feel protected by a helmet than when they do not wear one.This effect manifests itself in an increase in the accident rate per kilometre ofcycling once helmets become more commonly used.
(3) The exposure effect, which means that some people stop cycling when helmetwearing becomes the law. This effect manifests itself in a decline in the number ofkilometres cycled once helmet wearing is made mandatory.
Laws requiring the wearing of helmets are controversial and not always popularamong cyclists. Robinson (1996) claims that such laws are actually harmful to publichealth, because the lack of exercise resulting from a decline in cycling increases therisk of disease more than the decline in head injuries brought about by increasedhelmet wearing. It is, according to Robinson, better to cycle without a helmet and hurtyour head, than to sink into the couch in front of the TV-set and get a heart attackafter a few years.
It is, of course, very difficult to evaluate the validity of this argument. In principle, itcould be correct, but it could also be wrong. It does not seem likely that those whocycle for the exercise are going to give up exercising altogether even if they stopcycling. If they enjoy the exercise, a more reasonable assumption would be that thesepeople take up other forms of exercise, like jogging, swimming or playing football. Ifthose forms of exercise are safer than cycling, a net benefit to public health may bethe result of less cycling.
On the other hand, long-term sustainability in the transport system is promoted by theuse of non-polluting forms of transport and counteracted by the use of polluting formsof transport. Until a clean car can be manufactured, an objective of environmentalsustainability is an argument in favour of increased use of non-motorised forms oftransport.
According to a synthesis of evaluation studies available until mid 1997 (Elvik, Mysenand Vaa 1997), the net effect of laws requiring the use of bicycle helmets can bedecomposed into the following partial contributions:
Net effect = Behavioural adaptation effect x Helmet effect x Exposure effect
Net effect = 1.15 x (0.75) x 0.70 = 0.80
A decline in the number of injured cyclists of about 20% has been found. This is thenet result of an increase of about 15% in accident rate and a decline of about 30% in
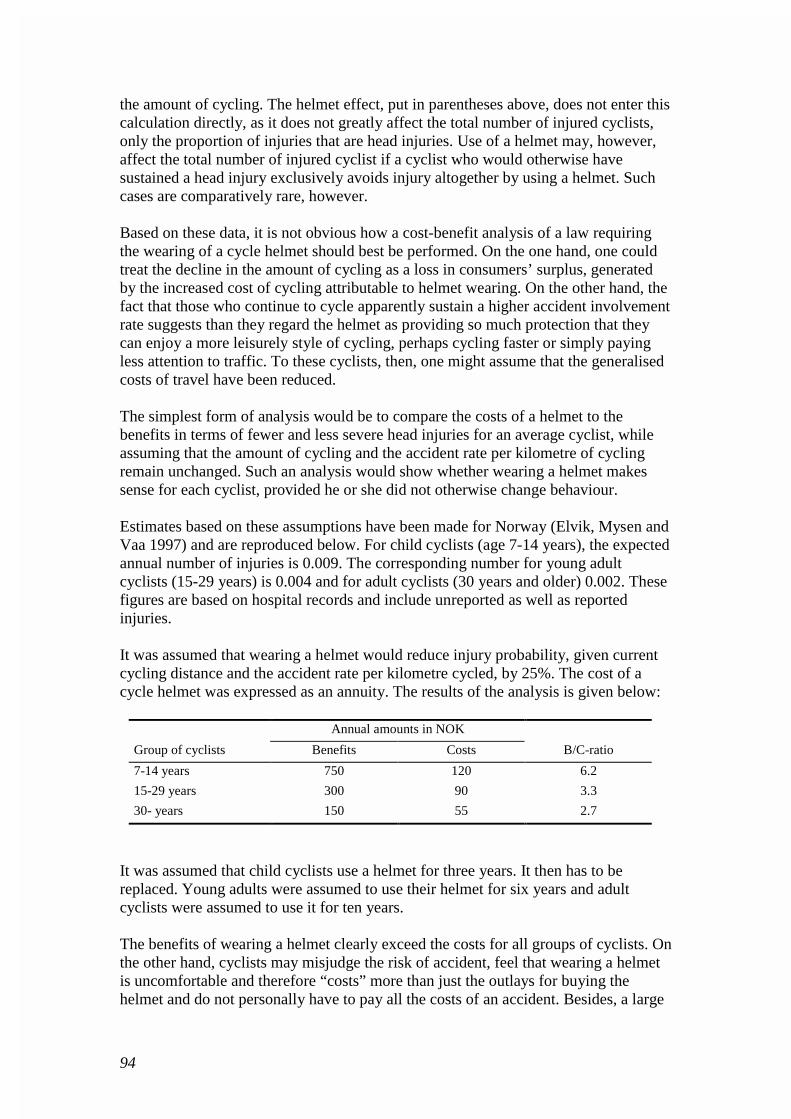
94
the amount of cycling. The helmet effect, put in parentheses above, does not enter thiscalculation directly, as it does not greatly affect the total number of injured cyclists,only the proportion of injuries that are head injuries. Use of a helmet may, however,affect the total number of injured cyclist if a cyclist who would otherwise havesustained a head injury exclusively avoids injury altogether by using a helmet. Suchcases are comparatively rare, however.
Based on these data, it is not obvious how a cost-benefit analysis of a law requiringthe wearing of a cycle helmet should best be performed. On the one hand, one couldtreat the decline in the amount of cycling as a loss in consumers’ surplus, generatedby the increased cost of cycling attributable to helmet wearing. On the other hand, thefact that those who continue to cycle apparently sustain a higher accident involvementrate suggests than they regard the helmet as providing so much protection that theycan enjoy a more leisurely style of cycling, perhaps cycling faster or simply payingless attention to traffic. To these cyclists, then, one might assume that the generalisedcosts of travel have been reduced.
The simplest form of analysis would be to compare the costs of a helmet to thebenefits in terms of fewer and less severe head injuries for an average cyclist, whileassuming that the amount of cycling and the accident rate per kilometre of cyclingremain unchanged. Such an analysis would show whether wearing a helmet makessense for each cyclist, provided he or she did not otherwise change behaviour.
Estimates based on these assumptions have been made for Norway (Elvik, Mysen andVaa 1997) and are reproduced below. For child cyclists (age 7-14 years), the expectedannual number of injuries is 0.009. The corresponding number for young adultcyclists (15-29 years) is 0.004 and for adult cyclists (30 years and older) 0.002. Thesefigures are based on hospital records and include unreported as well as reportedinjuries.
It was assumed that wearing a helmet would reduce injury probability, given currentcycling distance and the accident rate per kilometre cycled, by 25%. The cost of acycle helmet was expressed as an annuity. The results of the analysis is given below:
Annual amounts in NOK
Group of cyclists Benefits Costs B/C-ratio
7-14 years 750 120 6.2
15-29 years 300 90 3.3
30- years 150 55 2.7
It was assumed that child cyclists use a helmet for three years. It then has to bereplaced. Young adults were assumed to use their helmet for six years and adultcyclists were assumed to use it for ten years.
The benefits of wearing a helmet clearly exceed the costs for all groups of cyclists. Onthe other hand, cyclists may misjudge the risk of accident, feel that wearing a helmetis uncomfortable and therefore “costs” more than just the outlays for buying thehelmet and do not personally have to pay all the costs of an accident. Besides, a large

95
part of the savings in accident costs are external from the cyclist’s point of view thatis they do not translate into a monetary benefit for the cyclist. Factors like these mayexplain why only a few cyclists wear helmets, despite the fact that the savings inaccident costs exceed the costs of the helmets.
It is concluded that the assumptions one would have to make to do a cost-benefitanalysis of mandatory bicycle helmet wearing are still too uncertain for such ananalysis to make sense.
9.14 Improving bicycle conspicuity
Darkness is a major risk factor for cyclists. If the risk of injury in daylight is set to1.0, the relative risk in darkness is about 1.8 according to a Swedish report(Andersson et al 1998).
An important reason why bicyclists run a higher injury risk in darkness than indaylight is that many bicycles are poorly lit and difficult to see. Reflective devices onthe bicycle or the rider can improve conspicuity substantially and thereby makebicycles easier to detect and identify. Available evaluation studies (Elvik, Mysen andVaa 1997) do not indicate how improving bicycle conspicuity affects the number ofaccidents. The studies do, however, show that detection distances become greaterwhen conspicuity is improved. If the inverse value of detection distance is taken as ameasure of potential accident risk, then the potential decline in risk when detectiondistance is increased can be estimated. If, for example, detection distance increasesfrom 100 metres to 150 metres, risk is reduced from 1/100 to 1/150, or by 33%. Table30, which is copied from the Traffic Safety Handbook indicates the effects of thevarious reflective devices on potential accident risk.
Table 30: Effects of bicycle safety devices on potential accident risk.
Percent change in potential accident risk
Type of equipment Accidents that are affectedBest estimate 95% confi-
dence interval
Reflective pedals Multi-party accidents in dark -75 (-85; -60)
Spoke reflectors Multi-party accidents in dark +9 (+1; +18)
Ankle light on bicyclist Multi-party accidents in dark -22 (-35; -9)
Reflective jacket for bicyclist Multi-party accidents in dark -10 (-15; -5)
Lit rear light Rear-end collisions in dark -80 (-67; -90)
Mean effect of one device Multi-party accidents in dark -35 (-40; -29)
Combined effect of all devices Multi-party accidents in dark -95 (-97; -93)

96
The effects vary greatly from one type of device to another. The mean effect of asingle reflective device, including a lit rear light, is a reduction of 35% in the risk ofmulti-party accidents in darkness. The combined effect of using all devices is adecline of 95% in the risk of multi party accidents in darkness. Use of the variousdevices varies. According to a Norwegian survey, about 65% of bicycles, use spokereflectors (the least effective device according to Table 29).
In the following analysis, it will be assumed that a combination of devices that reducethe number of multi-party accidents in darkness by 50% is used. It is further assumedthat these devices cost about 500 NOK per cycle and have an effect lasting for fiveyears.
The average number of police reported injury accidents per cyclist per year in Norwayis about 0.00035 (950 accidents and 2,650,000 cyclists). The true number of accidentsis substantially higher, about 0.005 per cyclist per year. It is assumed that 20% of allaccidents are affected by the safety devices, and that these accidents are reduced by50%, amounting to a 10% reduction in the total number of accidents (50% of 20%equals 10% of the total). This amounts to about 0.0005 prevented injuries per cyclistper year.
According to cost estimates for Norway, the present value of the savings in accidentcosts during five years amounts to 510 NOK. This is nearly equal to the assumedcosts of the measures (500 NOK) and indicates that the measures are likely to givebenefits that exceed the costs.
9.15 Daytime running lights on cars
Daytime running lights an effective accident countermeasure that is being introducedin more and more countries (Elvik 1996). It is, however, a controversial measure,especially with respect to the effects on accidents involving pedestrians or cyclists. Ithas been argued, for example, that a widespread use of headlights on motor vehicleswould tend to make pedestrians and cyclists comparatively less conspicuous and thusmore easy to overlook. On the other hand, interaction between road users involvestheir mutual observation, not just one group observing the other. Headlights on motorvehicles make them easier to see by pedestrians and cyclists. Whether one likes it ornot, it is in the majority of cases pedestrians or cyclists who take evasive action toprevent accidents in encounters with motor vehicles (see, for example, Howarth1985). It thus helps to prevent accidents that pedestrians and cyclists are better able tosee motor vehicles.
The effects of daytime running lights on cars for various types of accident have beenexamined by Elvik (1996). Figure 17 presents the main results of this study.
Figure 17 contains three measures of the effects of daytime running lights that havebeen used in evaluation studies. The first one is the accident rate, which is defined asthe number of multi-party daytime accidents per million vehicle kilometres. Thesecond one is the simple odds, which is defined as the odds of multi-party daytimeaccidents to all other accidents. The third one is the odds ratio, which is defined as theodds of a multiparty daytime accident to a single daytime accident, divided by the

97
corresponding odds for night-time accidents. The choice of measure of effect has alsobeen controversial in studies that have evaluated the safety effects of daytime runninglights. The effects given in Figure 17 refer to laws requiring the use of daytimerunning lights. Such laws have been introduced in Canada, Denmark, Finland,Hungary, Norway, and Sweden.
Figure 17: Effects of daytime running lights on cars with respect to various types ofaccident. Source: Elvik 1996.
It is seen that no matter how one measures the effects of daytime running lights, thenumber of pedestrian accidents is reduced. The reduction is between 10 and 20%. Thenumber of bicycle accidents is also reduced. Depending on how effects are measured,the decline is from 2% to 19%.
Koornstra, Bijleveld and Hagenzieker (1997) have made an extensive and detailedsurvey of the literature concerning the effects of daytime running lights. They haveconverted all measures of effect to a common definition, which refers to the effects ofgoing from 0% to 100% use of daytime running lights. Based on this comprehensivereview, Koornstra et al estimate that a 100% use of daytime running lights in allcountries of the European Union would reduce that number of fatalities by 12%, thenumber of injured persons by 10%, and the total number of accidents (includingproperty damage only accidents) by 6%.
Koornstra et al performed a cost-benefit analysis of a law requiring the use of daytimerunning lights throughout the European Union. In the most conservative version, theresults of this analysis are as follows:
-13
3
-20
-6
-20
-7
-12
-5
20
-13
-2
0
-5-3
-12
4
-10
-19
4
-11-9
-25
-20
-15
-10
-5
0
5
10
15
20
25
Angle Rearend Pedestrian Cyclist Motorcyclist Unspecified All accidents
Types of accident affected
Accident rate
Simple odds
Odds ratio

98
Costs or benefits Amount in billion ECU
Total benefits 4.78
Costs of installing daytime running lights 0.08
Additional fuel consumption 1.13
Additional light bulb consumption 1.26
Additional emission of pollution 0.18
Total costs 2.65
Benefit/cost ratio 1.80
They also present two more optimistic versions of the cost-benefit analysis, in whichbenefits are estimated to 5.5 billion ECU and 11 billion ECU. Even if the mostconservative estimate of the benefits is correct, there is no doubt that the benefits ofthis measure clearly exceed the costs.
9.16 Daytime running lights on motorcycles
Motorcycles are less easy to see than cars because of they are smaller. It is wellestablished that poor conspicuity is a contributory factor in many accidents involvingmotorcycles. It is therefore reasonable to expect the compulsory use of daytimerunning lights on motorcycles to improve conspicuity and reduce the number ofaccidents.
A review of studies that have evaluated the effects of daytime running lights on thenumber of motorcycle accidents (Elvik, Mysen and Vaa 1997) concludes that the bestcurrent estimates are as follows:
Percent change in the number of accidents
Measure evaluated Type of accident affectedBest estimate
95% CIUse of DRL vs non-use All accidents -10 (-35;+23)
Law requiring DRL-use Multi-party daytime -7 (-10; -4)
Law requiring DRL-use All accidents -3 (-7; +1)
These estimates are consistent with each other. Motorcycles that use daytime runninglights have an accident rate, which is about 10% lower than motorcycles that do notuse daytime running lights. When a law requiring the use of daytime running lights isintroduced, the number of multi-party daytime accidents is, on the average, reducedby about 7%. This effect is smaller than the difference in accident rate betweenmotorcycles using daytime running lights and those not using it, since the increase inthe use of daytime running lights upon introduction of a law is seldom from 0% to100%. Finally, multi-party daytime accidents are only about 50% of all accidents.Hence, the effect of daytime running lights on all accidents is likely to be smaller thanthe effect on multi-party daytime accidents.

99
Based on Norwegian accident data, the annual expected number of injury accidentsfor an average moped rider is about 0.005. The corresponding figure for an averagemotorcycle rider is about 0.01. Using these annual injury frequencies, the benefit of alaw requiring the use of daytime running lights has been estimated to 215 NOK peryear per moped rider and 430 NOK per year per motorcycle rider (Elvik, Mysen andVaa 1997).
The cost of using daytime running lights amounts to about 40 NOK per year for amoped and about 60 NOK per year for a motorcycle (Elvik, Mysen and Vaa 1997).Hence, the benefit-cost ratio is about 5.4 for mopeds and about 7.2 for motorcycles.These results are likely to have general validity, since the assumptions made are ratherconservative. It is therefore quite likely that the benefits of requiring mopeds andmotorcycles to use daytime running lights will exceed the costs in most Europeancountries.
9.17 Mandatory wearing of helmets for moped and motorcycle riders
The wearing of helmets is mandatory for riders of mopeds and motorcycles in mostEuropean countries. There are, however, still a few exceptions to this rule. In theNetherlands, riders of the smallest kind of mopeds – really bicycles with a very smallengine – are exempt from the law requiring helmets to be worn. The wearing rate forhelmets among riders of these mopeds is almost zero. In Greece, the overall wearingrate for helmets is estimated to about 20%. The report from Workpackage 3 providesmore details concerning the wearing of motorcyclist helmets in different countries.
Wearing a helmet makes a major difference to the risk of injury for a moped ormotorcycle rider. Experience shows that helmet wearing rates close to 100% can beattained, by making the wearing of helmets mandatory. This is the case for bothNorway and Sweden.
To illustrate the possible benefits and costs of mandatory helmet wearing formotorcyclists, estimates applying to Norway are briefly reproduced. The mean injuryfrequency for a motorcyclist or moped rider in Norway is about 1% (I e 1% of allriders are injured during one year). The benefit of wearing a helmet has beenestimated to about 4,300 NOK per motorcyclist or moped rider per year (Elvik,Mysen and Vaa 1997). The cost of purchasing a helmet is about 1,000 NOK.Assuming that the helmet is written off in five years, the annual costs (annuity) comesto 250 NOK. Benefits are, in other words, about 17 times greater than costs(4,300/250).
This result is not surprising. All cost-benefit analyses of crash helmets that have beenreported in the literature come to the same conclusion: Mandatory helmet wearing is ameasure for which benefits exceed costs by a wide margin.

100
9.18 Design changes on motorcycles
Motorcycle travel is known to carry a high risk of injury. Some of the most effectivemeasures to reduce this risk have already been implemented, or are at least widelyused. These measures include helmet wearing, the wearing of protective clothing andthe use of daytime running lights. Restrictions on the engine capacity of motorcyclesare also very common. Despite these measures, the risk of injury remains high.
A review of studies for the Traffic Safety Handbook (Elvik, Mysen and Vaa 1997)shows that slightly changing the design of motorcycles could reduce the risk of injury.Among the design changes that have been shown to reduce the risk of injury are:
(1) Slightly prolonging the front wheel fork,(2) Constructing a frangible footrest, which is torn off when it touches the ground,(3) Slightly lowering the seat,(4) Providing a windshield,(5) Providing a fairing to protect knees and legs.
A conservative estimate of the combined effect of these design changes on injuryprobability is 25% reduction. The costs are not well known. It is possible, to estimatea critical value for the costs, by estimating the benefit of a 25% reduction inmotorcyclist injury risk.
The injury risk of motorcyclists varies from country to country. In Norway, theaverage annual injury risk of a motorcyclist is about 0.01, or 1%. Assuming anaverage cost of 100,000 ECU per injury, the present value for a ten year time horizonof a 25% reduction in injury risk at this level of is 1,930 ECU per motorcyclist. Thismeans that if the design changes cost more than this per motorcycle, and if they havean effect only on safety, benefits will be smaller than costs.
9.19 Graduated licensing systems – lowered age-limit for driver trainingin Sweden
In 1993, Sweden introduced a new lower age limit for starting driver training. The ageat which training was permitted was reduced from 17 ½ years to 16 years. Thelicensing age remained 18 years. The objective of this reform was to give novicedriver more opportunities for training before becoming fully licensed drivers. It wasassumed that by driving more before passing the licensing examination, novicedrivers would start with more experience and hence a lower accident rate than beforethis reform.
The Swedish Road and Transport Research Institute (VTI) has evaluated the effects ofthe 16-year age limit on accidents (Gregersen 1997). The evaluation found a reductionof 35% in the injury accident rate of those who started driver training at 16 comparedto those who started at 17 ½. The accident rate for property damage only accidentswas reduced by 25%. Both these reductions were statistically significant. Datacollected as part of the evaluation study show that those who started driver training at16 had an average of 118 hours of training before licensing. Those who started at

101
17½, before the new age limit was introduced, had an average of 48 hours of training.This difference was almost exclusively related to the amount of behind-the-wheeltraining. Hence, the objective of increasing the amount of training was realised.
It is well known from other studies (see, for example, Sagberg 1997) that the accidentrate among novice drivers is inversely related to their driving distance. The longer aperson drives per year, the lower is his or her accident rate per kilometre of driving. Itis therefore reasonable to expect an increase in the amount of driver training to reducethe accident rate.
On the other hand, only about half of 16-year olds in Sweden chose to start drivertraining at new permitted age. The rest chose to wait. There is therefore a certainpossibility that part of the difference in accident rate found between those who starteddriver training at 16 and those who started at 17 ½ could be attributable to selectiverecruitment, and not an effect of the training itself. This possible source of bias doesnot necessarily mean that the additional training obtained by those who started at 16was ineffective, but could mean that the effect has been overestimated.
60 additional hours of pre-licensing training may correspond to about 1,800 kilo-metres of driving, assuming that an average speed of 30 km/h is maintained duringtraining. The evaluation report by Gregersen does not contain an estimate of the costsof this additional training. However, based on a Norwegian estimate (Christensen1997), the costs of 60 hours of private driver training can be estimated to:
60 hours x 62.8 NOK per hour = 3,768 NOK in costs of travel time1,800 kilometres x 0.90 NOK per kilometre = 1,620 NOK in vehicle operating costs
The costs of travel time applied in this calculation are those that apply to leisure tripsfor car drivers. The vehicle operating costs used in this estimate, are the costs tosociety of driving a car. The private costs are higher, as they include petrol taxes thatare excluded from the costs to society. The total costs come to 5,388 NOK, which isrounded to 5,000 SEK per driver in this analysis.
According to the report by Gregersen, the mean accident rate for a novice driver whostarted training at 16 is about 7 injury accidents per 1,000 drivers per year in the firstyear of driving after licensing. If taken at face value, the results of the evaluationstudy suggest that the savings in injury accidents attributable to the 16 year age limitsis about 3.5 injury accidents per 1,000 drivers per year. (A reduction of 35% in theinjury accident rate implies that an accident rate of about 10.5 per 1,000 drivers peryear would be expected in the absence of additional training).
For 1997, the official accident costs for Sweden were 14,200,000 SEK per fatality,6,100,000 SEK per severely injured person, and 360,000 per slightly injured person inpolice reported injury accidents. Applying current official Swedish accident costs, theaverage cost of a police reported injury accident comes to about 2,400,000 SEK. Asaving of 3.5/1,000 per driver per year therefore amounts to 3,500 SEK.
The report by Gregersen states that 16.8% of those who started driver training at 16were involved in a self reported accident during their first year of driving afterlicensing. The great majority of these accidents are probably minor property damage

102
only accidents. Assuming, as stated in the report, that starting training at 16 reducesthe risk of a self reported accident by 25%, an accident saving of about 5.5 accidentsper 100 drivers per year can be calculated. Applying the current Swedish mean cost of13,000 SEK per property damage only accident, this amounts to a saving of 715 SEKper driver per year. The results of the cost-benefit analysis can be summarised asfollows:
Savings in injury accidents in the first year of driving 8,400 SEKSavings in PDO accidents in the first year of driving 715 SEKTotal accident savings 9,115 SEKCosts of additional training 5,000 SEKBenefit-cost ratio 1.82
The savings in accident costs obtained during the first year of driving outweigh theadditional costs of training.
It seems likely, though, that any effect during the second and third years of drivingwill be smaller than during the first year of driving. Moreover, the true effects of theadditional training may be smaller than assumed in this calculation, due to theselective recruitment effect adduced to above.
9.20 Graduated driver license – license on probation in Austria
In recent years, several countries have introduced a graduated licensing system fornew drivers. One version of such a system – driver’s license on probation – wasintroduced in Austria in 1992. The driving license on probation was introduced inAustria on January 1, 1992 in order to reduce the increasing number of accidentscaused by novice, especially young, drivers. The law prescribes a probation period oftwo years for novice drivers. In addition the legal BAC-limit (blood alcoholconcentration) for novice drivers was lowered from 0.08% to 0.01%. For otherdrivers, the legal BAC-limit was not changed. During the probation period, thefollowing offences lead to an obligatory participation in a driver improvementprogramme as well as to an extension of the two years period of probation for anadditional year:
• offence against the 0.01%-BAC limit• causing an injury or fatality• committing a dangerous offence, for example, seriously exceeding the speed
limits
Five years after the introduction of this measure an analysis was carried outconcerning the number of passenger car drivers involved in accidents with personalinjuries and fatalities. In this analysis holders of driving licences on probation werecompared with all the other drivers. The results indicate a 32.5% decrease in thenumber of accidents within the group of novice drivers. The decrease within the groupof all the other drivers was merely 8.9% in the same period.
In the year of the introduction of this law (1992) 19.2% fewer new licences wereissued compared to the year before. Even taking into account this declining number of

103
novice drivers, the analysis still indicates an accident reduction of 18.7% (number ofnovice drivers involved in accidents with personal injuries and fatalities related to thenumber of holders of driving licences on probation). These results are described inTable 31.
Table 31: Number of car drivers injured in Austria before and after introduction oflicense on probation. Source: Kaba 1998.
1991 1996 Change
Number of injured novice drivers 9,035 6,099 -32.5%
Percent of novice drivers involved in accidents 4.11% 3.34% -18.7%
Number of injured drivers in total 44,372 40,434 -8.9%
The best estimate of the effect of license on probation based on these figures isprobably the excess decline in the accident rate of novice drivers compared to theaccident rate of all other drivers. This is estimated by the ratio 0.813/0.911, whichcomes to 0.892 or a 10.8% decrease.
Kaba (1998) presents a cost-benefit analysis based on the assumption that driver’slicense on probation reduced accidents by 18.7%. By re-estimating his figures basedon accident reduction of 10.8%, one gets:
Savings in accident costs 579 million SchillingCosts of measure 65 million SchillingBenefit/cost ratio 8.91
The benefits outweigh the costs by a wide margin. This would be the case even if thetrue safety effects were much smaller than assumed in the analysis.
9.21 Disco buses in Germany
In order to reduce the high number of late-night road accidents among 18 to 24-year-olds at weekends, numerous public transport services, in particular disco buses, havebeen set up in Germany since the early nineties.
The disco buses are intended to contribute to road safety is by offering a safealternative to young people unfit to drive (especially owing to alcohol) and to youngpeople dependent on taking lifts from unfit drivers. The following data about thesebus services were collected by BASt for the PROMISING project.
22.2% of disco-goers are under 18 years of age, 42% between 18 and 20, 25.5%between 21 and 24 and 10.3% between 25 and 31. In rural areas, however (Thedistricts of Forchheim and Osterholz), there is a much higher proportion ofadolescents under 18 (27% and 34.9% respectively).
The potential contribution to road safety by late-night transport services for peopleinvolved in leisure-time activities therefore focuses on target groups of 15 to 17 and

104
18 to 24-year-olds. Bus services in three areas are included in this analysis:Wupperthal, Osterholz and Forchheim.
Wupperthal. The late-night bus service has been running since May 1992 by theWuppertal Stadtwerke AG, a local public transport company owned by the town ofWuppertal. The bus service is operated according to an efficiently co-ordinatedtimetable, with a star-shaped route network, linking all suburbs with the town centre.A total of eight routes operate every hour on Friday and Saturday nights and on nightsbefore public holidays between 12.45 a.m. and 3.45 a.m.
Osterholz. The HotLine bus service run by Bremen/Lower Saxony Public TransportServices has been in operation since November 1990. Initially, there were three routesbut since February 1993 there have been four operating in the district of Osterholz andScharmbeck.
One of these bus routes was set up solely for the purpose of transporting passengers toa disco in the district of Cuxhaven, which borders to the north. In 1993, the HotLinebus network was enhanced by seven additional routes, which partly serve the districtsof Rotenburg and Verden to the east and south-east respectively. The HotLine serviceis solely a disco bus service connecting the central residential areas to the discos. Itsaim is to contribute towards increasing road safety for young people. The bus terminalis at Bremen Main Station. At each of the three discos in the district there areconnections to and from the other bus routes in the system.
Routes and timetables are adapted to coincide with the opening times of the discos.On Friday nights the service begins at about 8.30 p.m. and the buses run at differenttimes and at different intervals, depending on the route, until about 6.00 a.m. OnSaturday nights, the service does not start until 9.00 p.m. Again, each route has itsown specific timetable and the service ends at about 4.00 a.m. During the schoolsummer holidays, the service is suspended for nine weeks.
Forchheim. In February 1990, the District of Forchheim set up a so-called «LeisureTime Bus Service». Eight routes in all connect the main residential areas with the fourdiscos in the district. Two routes go to two communities in the District of Bamberg tothe north.
Here again, the aim of the service is to reduce the problems surrounding leisure timetransport for young people as well as to increase road safety. The route network is starshaped and focuses on the two largest towns in the district, Forchheim andEbermannstadt where there are connections between the various routes. The serviceonly operates on Saturday nights and during the «Anna Festival» in Forchheim. Eachroute provides a bus to the discos at about 6.30 p.m., a later bus and two returnjourneys at about 1.00 a.m. and about 3.00 a.m. Unfortunately, there are no availabledetails concerning the user group.
Cost-benefit analysis. The operating costs of these three bus services in 1996 were760,000 Deutsche Mark (DM) for the Wupperthal service, 430,000 DM for theOsterholz service and 182,000 DM for the Forchheim service. Accident statistics areavailable only for the years 1990-1996. The statistics for 1990 refer to the olderBundesländer (West Germany), the statistics for 1991 through 1996 refer to the whole

105
of Germany. This means that it is only possible to a before-and-after study for two ofthe three areas included: Wupperthal and Osterholz. For Wupperthal, the year 1991 isused as the before-period, the years 1993-1996 are used as the after-period. Theanalysis for Osterholz refers to the extension of the service in 1993. The years 1991and 1992 form the before-period, the years 1994-1996 form the after period. Table 32shows the number of injured persons in police-reported accidents before and afterintroduction of the Disco Buses in Wupperthal and Osterholz.
Table 32: Changes in the number of injured persons following introduction of DiscoBuses in Wupperthal and Osterholz in Germany. Based on data provided by BASt.
Area Age group PeriodDisco Bus group Comparison
group
Wupperthal 15-17 years Before 47 22,833
After 220 98,259
18-24 years Before 299 120,955
After 926 430,332
Osterholz 15-17 years Before No data 45,083
After 193 75,764
18-24 years Before 410 238,376
After 544 317,943
The data presented in Table 32 can be used to estimate the effects of the Disco Buses.The effect of the Disco Buses can be estimated by forming an odds ratio based onthese figures. Among 18-24 year olds in Wupperthal, for example, there was anincrease from 299 to 926 from before to after introduction of the Disco Buses. For thewhole of Germany, used as a comparison group, there was an increase from 120,955to 430,332. The odds ratio is (926/299)/(430,332/120,955), which is 0.87, indicating areduction of about 13% in the number of injured persons. Three estimates of effectcan be derived from Table 32 (no estimate can be derived for 15-17 year olds inOsterholz, as before-data are lacking):
Wupperthal, 15-17 years old: 1.09 = 9% increase = 18 more injured peopleWupperthal, 18-24 years old: 0.87 = 13% reduction = 138 fewer injured peopleOsterholz, 18-24 years old: 0.995 = 0.5% reduction = 3 fewer injured people
The net effect is 123 fewer injured people per year. Current average costs of injuriesin Germany are 1,200,000 DM per fatality, 54,000 DM per severely injured person,and 4,100 DM per slightly injured person. Using statistics for 18-24 year olds for thewhole of Germany, about 1.9% of all victims are killed, 25.0% are severely injuredand 73.1% are slightly injured. This gives a weighted average cost of 39,300 DM perinjured person. An annual saving of 123 injured persons then amounts to 4,833,900DM per year.
In addition to saving road accident costs, the Disco Buses allow savings to be made inthe costs of operating a car. It is difficult to quantify these benefits, as it is difficult tothe amount of car travel replaced by bus trips. No attempt has therefore been made to

106
estimate these savings. Assuming that the savings in accident costs estimated aboverepresent the total savings in Wupperthal and Osterholz, the following comparison ofcosts and benefits can be made:
Savings in accident costs 4,833,900 DMOperating costs of Disco Buses (Wupperthal and Osterholz) 1,190,000DMBenefit-cost ratio 4.06
Benefits exceed costs by a wide margin. This would be true even if the Disco Busesprovided far smaller accident savings than estimated above.

107
10 CONCLUSIONS AND RECOMMENDATIONS
10.1 Conclusions
Exposure and accidents.
(1) Monitoring of exposure is clearly important if valid conclusions are to be drawnfrom changes in casualty numbers. It is also needed if estimates of the safetybenefits of policies are to be calculated and understood. However the means tomonitor exposure accurately, especially for pedestrians and cyclists, are notroutinely available.
(2) A range of research data has been identified but comparability of either exposure oraccident data is difficult because of differences between the methods of collection,the scale and detail of the surveys.
(3) Accident data needs to be related to the detailed exposure data if risk is to becalculated and evaluated. Similarly, when costs and benefits of measures arecalculated it will be essential to use accidents and exposure which relate to thespecific measure being evaluated.
It appears from studies in a number of countries that accidents with fatal injuries arealmost always recorded by the police and by the hospitals. The level of recording ofinjury to pedestrians and pedal cycles seems to vary somewhat between countries. Thismay well be due as much to recording protocols in the various countries as to true under-reporting to the police. What does seem to be prevalent in the literature is a problem withthe level of reporting to the police of pedal cycle injuries in particular. The basis onwhich an accident is defined as a traffic accident may be the issue here. Many studiesreport about 10 per cent concurrence between hospital and police records for the lesssevere injuries and indicate that this figure includes all falls from a bicycle, whether ornot a motor vehicle was involved. Similarly highlighted is the discrepancy between somestudies of pedestrian injury where all injuries are included even when a vehicle is notinvolved. Care needs to be taken when comparing studies and databases as definitionsof what is a pedestrian or pedal cycle accident may differ in important ways betweenhospital based researchers and road safety researchers.
Applicability of cost-benefit analysis. The main conclusions can be summarised asfollows:
1 Cost-benefit analysis is a technique designed to help policy makers find the mostefficient way of realising policy objectives. It is based on economic welfare theoryand the definition of efficiency given in that theory. Very briefly stated, a measureis regarded as efficient if the benefits are greater than the costs.

108
2 In order to apply cost-benefit analysis to support policy making, it is necessary to:(a) State all policy objectives in as precise terms as possible,(b) Assign monetary values to the policy objectives,(c) Conduct a broad survey of possible policy instruments and measures,(d) Determine the effects of the measures with respect to all policy objectives,(e) Convert these effects to monetary terms, and(f) Estimate the costs to society of implementing the measures.In short, these requirements restrict the application of cost-benefit analysis tomeasures whose effects are well known and situations in which policy objectivesare clearly articulated and widely supported.
3 Cost-benefit analysis cannot be used to settle constitutional issues or profounddisagreements over policy objectives. Nor is the technique intended to help infinding fair or equitable solutions to social problems. Matters that mainly concernjustice or fairness must be decided on another basis.
4 The results of a cost-benefit analysis are determined by the assumptions that aremade. The assumptions made should fit national or local conditions. If, forexample, there is reason to believe that the effect of a safety measure on thenumber of accidents varies systematically from one country to another (as is thecase for daytime running lights on cars), the analysis should reflect this condition.It is important to rely on national estimates of accident costs, and not try toharmonise these at the EU-level.
5 The results of cost-benefit analyses will vary between countries, and it will ingeneral not be correct to generalise the results of these analyses across countries.For some road safety measures, however, general statements can be madeconcerning factors that influence the size of costs and benefits.
Results of cost-benefit analyses. As part of this project, cost-benefit analyses havebeen made of a number of measures designed to improve safety and mobility forvulnerable and inexperienced road users. The results of these analyses can besummarised as follows:
1 Cost-benefit analyses have been made of the following measures designed toimprove safety and mobility for vulnerable and inexperienced road users:
- Roundabouts- Road lighting- Integrated area-wide urban speed reduction schemes- Environmentally adapted through-roads- Upgrading pedestrian crossings- Parking regulations- Front, side and rear underrun guard rails on trucks- Bicycle lanes- Bicycle paths- Advanced stop lines for cycles at junctions- Mandatory wearing of bicycle helmets- Improving bicycle conspicuity- Daytime running lights on cars- Daytime running lights on mopeds and motorcycles- Design changes on motorcycles- Graduated licensing – driver’s license on probation- Disco buses

109
2 In general, measures that improve both safety and mobility, or are neutral withrespect to mobility, tend to have good benefit-cost ratios. Measures that reducemobility, particularly by substantially reducing speed, tend to have a lessfavourable ratio of benefits to costs.
3 There exist very few technical and non-restrictive measures that can improvesafety for inexperienced drivers and for riders of mopeds and motorcycles.
4 Measures that improve visibility or conspicuity (lighting, reflective devises,daytime running lights) or reduce driving speed are generally very effective inimproving safety for pedestrians and cyclists.
5 The analyses presented are in most cases based on data taken from one country.Only for daytime running lights on cars has a cost-benefit analysis encompassingall of Europe been performed.
For results of the specific analyses, the reader is referred to chapter 9.
10.2 Recommendations
The recommendations made on the basis of this report have been divided into twogroups. The first group consists of recommendations for further research anddevelopment of policy making instruments, particularly cost-benefit analysis. Thesecond group of recommendations concerns the use of various measures to improvesafety and mobility for vulnerable and inexperienced road users.
Recommendations for research and development. The following recommendationsare put forward with respect to research and development.
An international conference or research project should be held in order to establishconsensus with respect to identification of the relevant effects of measures that affectsafety and mobility for vulnerable and inexperienced road users. It is particularlyimportant to discuss and agree on how these measures affect the environment androad user security (subjective safety).
In current cost-benefit analysis, measures that reduce speed in urban areas to levelsbelow about 40 km/h are often rejected in cost-benefit analyses because increasedcosts of travel time defeat any gain in safety or environmental amenity obtained bythe measures. These results are often regarded as problematic and a criticalexamination of possible biases in current cost-benefit analyses of speed reducingmeasures in urban areas is called for.
The methods used to estimate the cost of accidents, costs of travel time and othercosts of non-marketed goods used in cost-benefit analyses should be standardisedbetween countries to the highest possible extent. However, variations in cost rates thatare attributable to differences in income and population preferences should berespected.

110
Recommendations for use of measures. The following recommendations are putforward with respect to the use of measures to improve safety and mobility forvulnerable and inexperienced road users.
Measures that improve conspicuity and visibility will often improve safety for all roadusers, but particularly for pedestrians and cyclists. An increased use of daytimerunning lights on cars, reflective devices worn by pedestrians and cyclists, and roadlighting is encouraged. These measures are in many cases likely to give benefits thatwidely exceed the costs.
Measures that reduce driving speed, especially in urban areas, will improve safety,and sometimes mobility, for pedestrians and cyclists. Measures that reduce speedmay, however, impose additional travel time on motorists. Measures that reduce speedfor motorists in urban areas will not always pass a cost-benefit test. There are,however, alternatives to basing speed limits in urban areas on cost-benefit analysis.An alternative that deserves careful attention is to determine speed limits according tothe principles of Vision Zero, as stated by the Swedish National Road Administration.
The wearing of helmets protects both cyclists and riders of mopeds and motorcyclesfrom head injury. It is at the present state of knowledge not possible to perform anadequate cost-benefit analysis of mandatory helmet wearing for cyclists. For mopedand motorcycle riders, on the other hand, helmet wearing should always bemandatory.
The possibility of improving safety for motorcyclists by design changes onmotorcycles should be explored carefully. For the time being, however, most designchanges that have been proposed remain experimental and both their costs and effectsare highly uncertain.
There exist few technical and non-restrictive measures that can improve safety forinexperienced drivers. Graduated licensing and driver’s license on probation, arepromising measures for inexperienced drivers. The continued use of these measures isencouraged.

111
11 REFERENCES
Accident Analyses Group (1991-1995). Ulykker 1990-94, Tilskadekomme registreretpå skadesruen, Odense Universitetshospital.
ADONIS (1998). Behavioural factors affecting modal choice: Analysis andDevelopment Of New insight Into Substitution of short car trips by cycling andwalking – ADONIS. Swedish National Road and Transport Research Institute VTI,Linköping.
Alfaro, J-L.; Chapuis, M.; Fabre, F. (Eds.) (1994). COST 313. Socioeconomic cost ofroad accidents. Report EUR 15464 EN. Brussels, Commission of the EuropeanCommunities.
Anderson, R.W.G., McLean, A.J., Farmer, M.B.J., Lee, B.H. and Brooks, C.G.(1997). Vehicle travel speeds and the incidence of fatal pedestrian crashes. AccidentAnalysis and Prevention, 29, 667-674.
Andersson, G., Brüde, U., Larsson, J., Nilsson, G., Nolén, S. and Thulin, H. (1998).Trafiksäkerhetspotentialer och trafiksäkerhetsreformer 1994-2000. VTI-meddelande831. Linköping, Väg- och transportforskningsinstitutet.
Berntman, M. (1994). Methods for collecting information about seriously injuredtraffic victims. Department of Traffic Planning and Engineering, Lund University ofTechnology, Bulletin 6, Sweden.
Bjørnskau, T. (1994). A Comparison of Risks of different Road User Groupsdependent on types of Accident Data. Proceedings of the third internationalconference on safety and the environment in the 21st century: lessons from the past,shaping the future, p189-98 Transportation Research Institute, Technion-IsraelInstitute, Israel.
Bjørnskau, T. and Fosser, S. (1996). Bilisters atferdstilpasning til innføring avvegbelysning. Resultater fra en før- og etterundersøkelse på E-18 i Aust-Agder. TØIrapport 332. Oslo, Transportøkonomisk institutt.
Borger, A. and Frøysadal, E. (1993). Sykkelundersøkelsen 1992. TØI-rapport 217.Oslo, Transportøkonomisk institutt.
Breithaupt, U. (1994). Driven Out, Sent Off. Results of an investigation into theinfluence of the increasing number of cars and the treat of danger from traffic on thefreedom of movement of children on the streets. Proceedings of the conferenceStrategic Highway Research Program and Traffic Safety on Two Continents, VTIkonferens No1A, Part 2 1994.
Broughton, J. (1995). Sources of national Exposure data in Great Britain. SeminarProceedings , International Road Traffic and Accident Databases, 11-13 September1995, Helsinki, Finland.
Crampton, G., Hass-Klau, C. and Thrush, J. (1990). Bicycle Safety in German andEnglish towns. PTRC 10-14 September 1990, Seminar G.

112
DETR (1998). A new deal for transport: better for everyone. Department ofEnvironment, Transport and the Regions. London.
DUMAS (1998). Developing Urban Management And Safety; Workpackage 4:Accident investigation. DG VII European Commission Brussels.
DUMAS (1998). Developing Urban Management And Safety; Workpackage 6: Safetyfor pedestrians and two-wheelers. DG VII European Commission Brussels.
Edwards, G.G. (1998). The development and promotion of measures for vulnerableroad users with regard to mobility integrated with safety taking into account theinexperience of the different groups. TRL unpublished report PR/SE/44/98. TransportResearch Laboratory, Crowthorne.
Elvik, R. (1993). Økonomisk verdsetting av velferdstap ved trafikkulykker.Dokumentasjonsrapport. TØI-rapport 203. Oslo, Transportøkonomisk institutt.
Elvik, R. (1995). An analysis of official economic valuations of traffic accidentfatalities in 20 motorized countries. Accident Analysis and Prevention, 27, 237-247.
Elvik, R. (1995). A Meta-Analysis of Evaluations of Public Lighting as an AccidentCountermeasure. Transportation Research Record, 1485, 112-123.
Elvik, R. (1996). A meta-analysis of studies concerning the safety effects of daytimerunning lights on cars. Accident Analysis and Prevention, 28, 685-694.
Elvik, R. (1998). Opplegg for konsekvensanalyser av tiltak for gående og syklende.TØI-notat 1103. Oslo, Transportøkonomisk institutt.
Elvik, R.(1998). Støttetiltak for lavere fartsgrense i tettbygde strøk. TØI-notat 1107.Oslo, Transportøkonomisk institutt.
Elvik, R. (1999). Incomplete accident reporting: A meta-analysis of studies made intwelve countries. Paper 990047. Submitted for the 1999 Annual Meeting of theTransportation Research Board, Washington DC, January 10-16, 1999.
Elvik, R., Mysen, A.B. and Vaa, T. (1997). Trafikksikkerhetshåndbok. Oversikt overvirkninger, kostnader og offentlige ansvarsforhold for 124 trafikksikkerhetstiltak.Tredje utgave. Oslo, Transportøkonomisk institutt.
Eurostat (1997). Comparison in real terms of the aggregates of ESA. Table 2 Pricelevel indices. Provided by Statistics Norway.
European Transport Safety Council (1997). Transport accident costs and the value ofsafety. ISBN 90-801936-9-0. Brussels, European Transport Safety Council.
Federation of European Pedestrian Associations (1993). Elderly Europeans on Foot.
Finch, D.J. (1998). Promising: Cost benefit data for area-wide schemes. Unpublishednote prepared in October 1998 for the PROMISING project. Crowthorne, Berkshire,Transport Research Laboratory.

113
Fridstrøm, L. and Rand, L. (1993). Markedet for lange reiser i Norge. TØI-rapport220. Oslo, Transportøkonomisk institutt.
Glad, A. (1985). Research on drinking and driving in Norway. A survey of recentresearch on drinking and driving and on drinking drivers. State-of-the-art report 15 inthe Transport and Communications series. Oslo, Institute of Transport Economics.
Glad, A. (1996). Alkolås Beskrivelse av og redegjøring for effekter av tekniskinnretning som skal hindre promillekjøring. I: TemaNord rapport 1996:597, 135-157.København, Nordisk Ministerråd.
Gramlich, E.M. (1994). Infrastructure Investment: A Review Essay. Journal ofEconomic Literature, 32, 1176-1196.
Hatakka, M., Keskinen, E., Laapotti, S., Katila, A. and Kiiski, H. (1992). What makesyoung drivers risky? Proceedings of fourth European Workshop on RecentDevelopments in Road Safety Research 1991.
Hauer, E. (1995). On exposure and accident rate. Traffic Engineering and Control, 36,134-138.
Herrstedt, L., Kjemtrup, K., Borges, P. and Anderesen. P.S. (1993). An ImprovedTraffic Environment. A Catalogue of Ideas. Report 106. Road Data Laboratory, RoadStandards Division, Road Directorate, Copenhagen.
Howarth, C.I. (1985). Interactions between drivers and pedestrians: Some newapproaches to pedestrian safety. In Evans, L.; Schwing, R. C. (Eds): Human Behaviorand Traffic Safety, 171-185. New York, NY, Plenum Press.
Hutchinson, T.P. (1984). Medical statistics on road accident injury in severalcountries. In Yagar, S. (Ed): Transport Risk Assessment, 43-76. University ofWaterloo Press, Waterloo, Ontario.
Jensen, S.U. (1998). Pedestrian Safety – Analyses and Safety Measures. Division ofTraffic Safety and Environment, Danish Road Directorate, Copenhagen.
Kaba, A. (1998). Necessity and benefits of driver improvement. In Proceedings ofEuropean Seminar on Cost-Effectiveness of Road Safety Work and Measures,Luxembourg, November 26-27, 1997. Luxembourg, PRI.
Kidholm, K. (1995). Estimation af betalingsvilje for forebyggelse af personskader vedtrafikulykker. Udgivelse 21 i serien: Afhandlinger fra det samfundsvidenskabeligefakultet på Odense Universitet. Odense.
Knight, I. (1998). Accidents involving commercial vehicles in the United Kingdom.Paper presented at the DEKRA Symposium on the Passive Safety pf CommercialVehicles, Stuttgart, Germany, October 1998.
Koornstra, M. J.; Bijleveld, F.; Hagenzieker, M. P. (1997). The safety effects ofdaytime running lights. Report R-97-36. Leidschendam, SWOV Institute for RoadSafety Research.

114
Lidström, E.-B. (1980). Exposition för bilavgaser vid cykling. Examensarbete iKemiteknik och miljö, våren 1980. Göteborg, Chalmers tekniska högskola,institutionen för teknisk kemi.
Lockwood, C., Winnett, M., Osborn, R. and Wells, P. (1998). Two-wheeler exposureand accident causation. TRL unpublished report PR/TT/31/98. Transport ResearchLaboratory, Crowthorne.
Lowe, E. (1999). A new survey methodology for measuring pedestrian and cyclistexposure. TRL unpublished report PR/TT/008/99. Transport Research Laboratory,Crowthorne.
Lynn, P. (1990). Factors affecting the accident liability of motorcyclists – an analysisof survey data. Contractor Report 146, Transport Research Laboratory, Crowthorne.
Matthew D. (1995). More Bikes – Policy into Best Practice. Cyclist Touring Club.
Miller, T.R. (1998). Variations between countries in values of statistical life. Un-published manuscript. Landover, MD, National Public Service Research Institute.
Mills, P.J. (1989). Pedal cycle accidents – A hospital based study. RR220 TransportResearch Laboratory Crowthorne Berks.
Mynors, P. and Savell, A. (1994). Comparisons of Cycle Provision in Four NorthEuropean Countries. Transportation Planning Systems, Vol 2, No 3, pp.59-67.
Mysen, A.B., Solheim, T. and Elvik, R. (1998). NOx-utslipp fra vegsektoren –effekter av ulike tiltak. TØI-notat 1101. Oslo, Transportøkonomisk institutt.
O’Donoghue, J. (1993). How much cycling is there? How safe is it? Report of theVelo-City Conference, Nottingham, 1993.
OECD (1997). Safety of vulnerable road users. Organization for Economic Co-operation and Development, Paris, France.
Olkkonen, S. (1993). Bicycle injuries: incidence, risk factors and consequences.Report 39/1993. Liikenneturva, Helsinki.
Parker A.A. (1996). Bicycle Friendly Roads are safer for all users. Velo AustralisInternational Bicycle Conference, Oct 27-Nov 1996. Promaco Conventions Pty Ltd.
Poppe, F. (1993a). Verkeersrisico’s in Nederland 1. De cijfers. R-93-57.Leidschendam, SWOV.
Poppe, F. (1993b). Verkeersrisico’s in Nederland 2. Verantwoording. R-93-58.Leidschendam, SWOV.
PROMISING (2001a). Measures for pedestrian safety and mobility problems. Finalreport of Workpackage 1. Contribution of NTUA National Technical University ofAthens, Greece. SWOV Institute for Road Safety Research, Leidschendam, theNetherlands.

115
PROMISING (2001b). Measures to promote cyclist safety and mobility. Final reportof workpackage 2. Contribution of VTT Technical Research Centre of Finland.SWOV Institute for Road Safety Research, Leidschendam, the Netherlands.
Rennesson C., Lourdaux H. (1998). French National Report on Pedestrian Safety,Report for workpackage 1, Promising project.
Robinson, D. L. (1996). Head injuries and bicycle helmet laws. Accident Analysisand Prevention, 28, 463-475.
Rumar, K. (1996). The Swedish National Road safety Programme - a new approach toroad safety work. Swedish National Road Administration.
Schioldborg, P. (1979). Fotgjenger og bilfører - to forskjellige verdener? Psykologiskinstitutt, Universitetet i Oslo.
Schollaert, U., Coppieters, M.-C., Flaxen, D. and Bergerhoff, J. (1997). TransportDemand of Modes not covered in International Transport Statistics. Cycling. FinalReport. European Union contract no E1-B96-B2 7040-SIN 6051-ETU. Brussels,European Commission.
Schwab-Christe, N.G. and Soguel, N.C. (Eds.) (1995). Contingent Valuation,Transport Safety and the Value of Life. Boston, MASS, Kluwer Academic Publishers.
Silcock, D.T., Walker, R. and Selby, T. (1998). Pedestrians at risk. Ross SilcockLimited.
Stangeby, I. (1997). Attitudes towards walking and cycling instead of using a car.TØI-report 370. Oslo, Institute of Transport Economics.
Summersgill, Kennedy and Baynes (1996). Accidents at three arm priority junctionson urban single carriageways. TRL Report 184 Crowthorne, Berks.
Thulin, H. (1989). Uppskrivningsfaktorer för polisrapporterade olyckor ochpolisrapporterade skadade. VTI notat T 53. Linköping, VTI.
Tight, M.R. and Carsten, O.M.J. (1990). Problems for Vulnerable road users in GreatBritain, the Netherlands and Sweden, Drive Project V1031. Institute for TransportStudies, University of Leeds.
Tingvall, C. (1995). The Zero Vision - a Road transport System Free from SeriousHealth Losses. Swedish National Road Administration.
Vägverket (1995). Nationellt trafiksäkerhetsprogram 1995-2000.Trafiksäkerhetsrapport 1994. Borlänge, Vägverket.
WALCYNG (1996). Short Trips in European countries, Internal report ofworkpackage No 1.
Ward, H.A., Cave, J., Morrison, A., Allsop, R. and Evans A. (1994). Pedestrian activityand accident risk. AA Foundation for Road Safety Research, AA Foundation for RoadSafety, Basingstoke.

116
Wardman, M. (1998). The value of travel time: A review of British evidence. Journalof Transport Economics and Policy, 32, 285-316.
Wouters, P.J.J. (1994). Urban safety strategies in the Netherlands. In: InternationalConference on Living and walking in cities, Brescia, 1994.


