Embed Size (px)
Citation preview
11/14/2018
1
METHODS FOR NEAR REAL-TIME ANALYSIS OF DBP PRECURSORS AND RELATED NOM PROPERTIES
Dave Reckhow, Griffin Moriarty, Yue Sun, Patrick WittboldUniversity of Massachusetts – Amherst
Celina DozierArizona State University - Tempe
WQTC, Toronto - November 2018
1
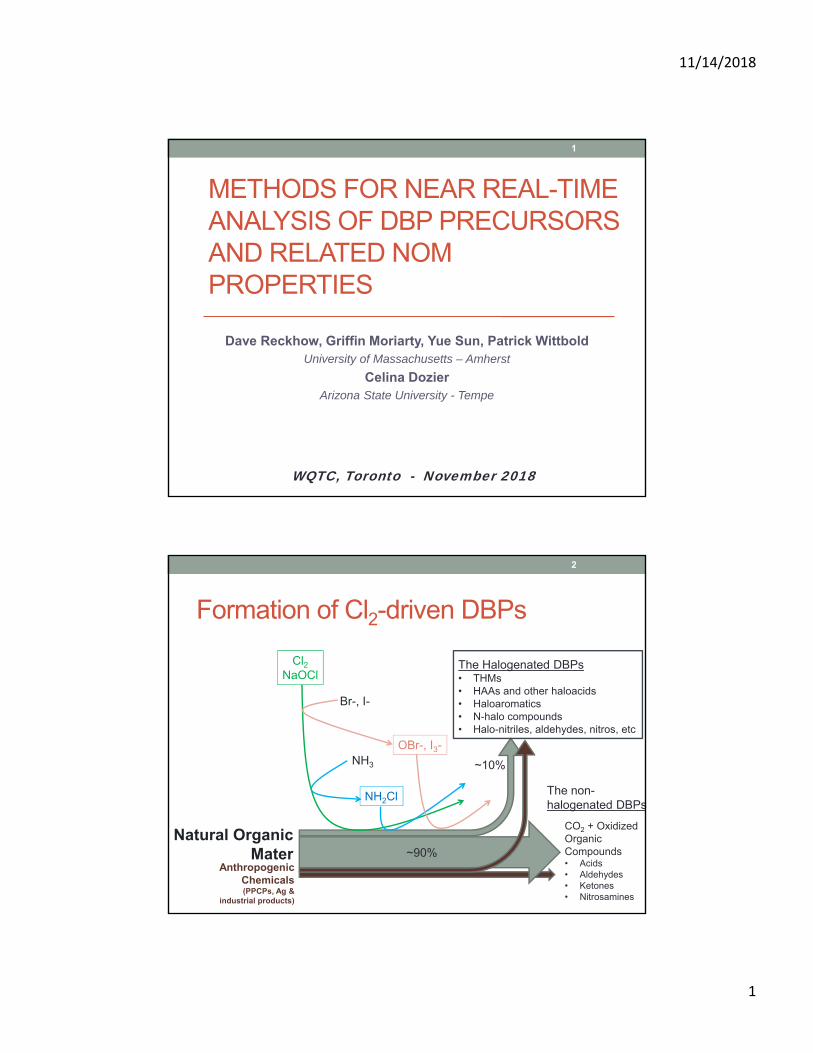
Formation of Cl2-driven DBPs
2
Natural OrganicMater
AnthropogenicChemicals(PPCPs, Ag &
industrial products)
Cl2NaOCl
NH3
Br-, I-
OBr-, I3-
~90%
CO2 + Oxidized Organic Compounds• Acids• Aldehydes• Ketones• Nitrosamines
NH2Cl The non-halogenated DBPs
The Halogenated DBPs• THMs• HAAs and other haloacids• Haloaromatics• N-halo compounds• Halo-nitriles, aldehydes, nitros, etc
~10%
11/14/2018
2
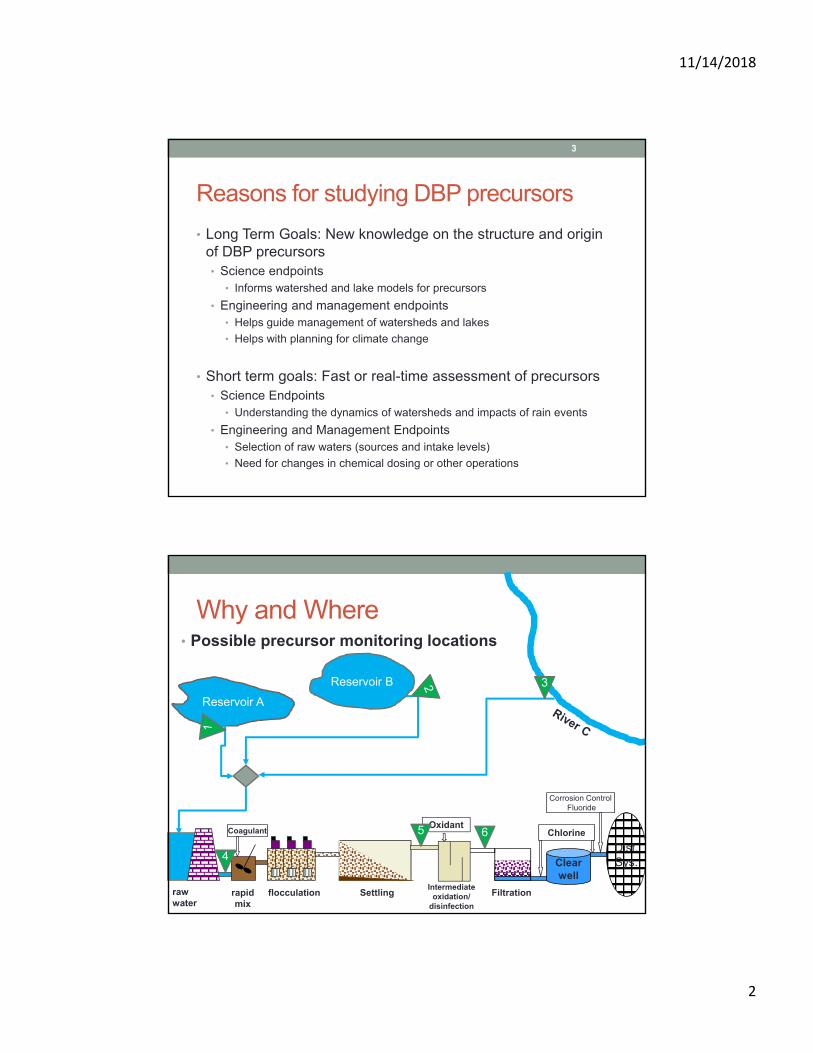
Reasons for studying DBP precursors
• Long Term Goals: New knowledge on the structure and origin of DBP precursors• Science endpoints
• Informs watershed and lake models for precursors
• Engineering and management endpoints• Helps guide management of watersheds and lakes
• Helps with planning for climate change
• Short term goals: Fast or real-time assessment of precursors• Science Endpoints
• Understanding the dynamics of watersheds and impacts of rain events
• Engineering and Management Endpoints• Selection of raw waters (sources and intake levels)
• Need for changes in chemical dosing or other operations
3
Why and Where• Possible precursor monitoring locations
Dist.Sys.Clear
well
Coagulant Chlorine
Settling
Corrosion ControlFluoride
raw water
flocculationrapidmix
Filtration
Oxidant
Intermediate oxidation/
disinfection
Reservoir A
Reservoir B
5 6
4
3
11/14/2018
3
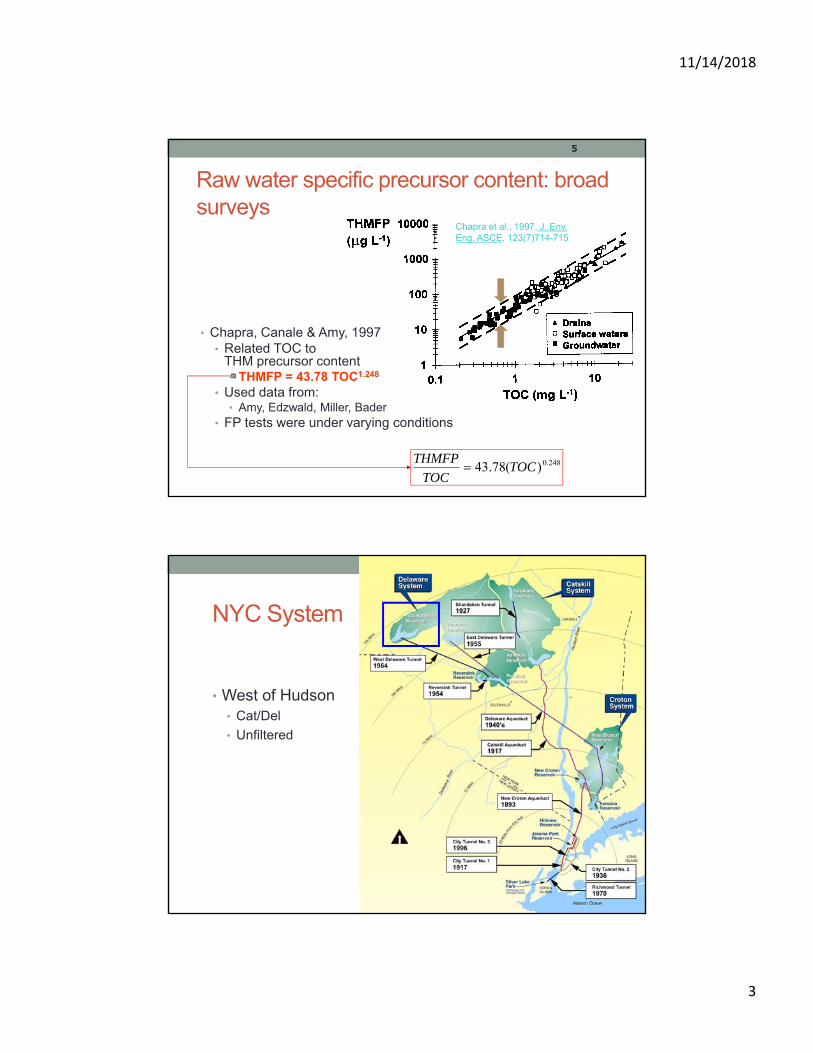
Raw water specific precursor content: broad surveys
5
Chapra et al., 1997, J. Env. Eng. ASCE, 123(7)714-715
248.0)(78.43 TOCTOC
THMFP
• Chapra, Canale & Amy, 1997• Related TOC to
THM precursor content• THMFP = 43.78 TOC1.248
• Used data from:• Amy, Edzwald, Miller, Bader
• FP tests were under varying conditions
NYC System
6
• West of Hudson• Cat/Del
• Unfiltered
11/14/2018
4
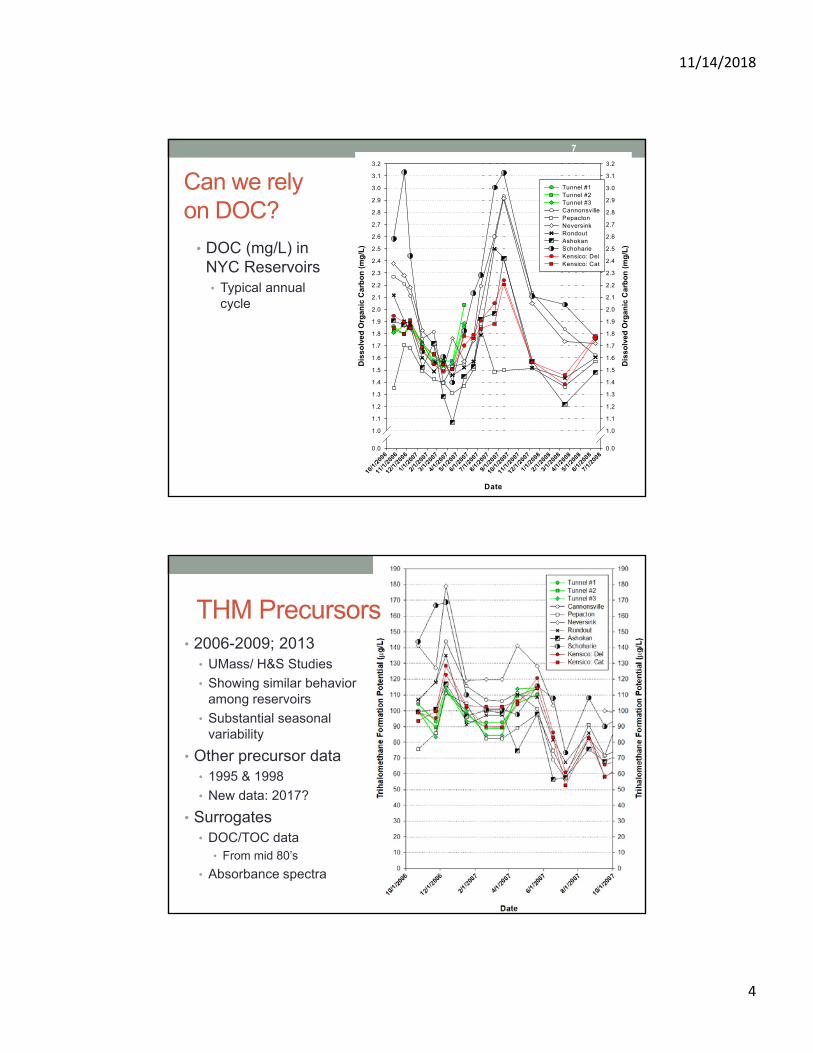
Can we rely on DOC?
• DOC (mg/L) in NYC Reservoirs• Typical annual
cycle
7Date
10/1
/200
6
11/1
/200
6
12/1
/200
6
1/1/
2007
2/1/
2007
3/1/
2007
4/1/2
007
5/1/
2007
6/1/2
007
7/1/
2007
8/1/2
007
9/1/2
007
10/1
/200
7
11/1
/200
7
12/1
/200
7
1/1/2
008
2/1/
2008
3/1/
2008
4/1/
2008
5/1/
2008
6/1/
2008
7/1/
2008
Dis
solv
ed O
rgan
ic C
arb
on
(m
g/L
)
0.0
1.0
1.1
1.2
1.3
1.4
1.5
1.6
1.7
1.8
1.9
2.0
2.1
2.2
2.3
2.4
2.5
2.6
2.7
2.8
2.9
3.0
3.1
3.2
Dis
solv
ed O
rgan
ic C
arb
on
(m
g/L
)
0.0
1.0
1.1
1.2
1.3
1.4
1.5
1.6
1.7
1.8
1.9
2.0
2.1
2.2
2.3
2.4
2.5
2.6
2.7
2.8
2.9
3.0
3.1
3.2
Tunnel #1Tunnel #2Tunnel #3CannonsvillePepactonNeversinkRondoutAshokanSchoharieKensico: DelKensico: Cat
7
• 2006-2009; 2013• UMass/ H&S Studies
• Showing similar behavior among reservoirs
• Substantial seasonal variability
• Other precursor data• 1995 & 1998
• New data: 2017?
• Surrogates• DOC/TOC data
• From mid 80’s
• Absorbance spectra
THM Precursors
11/14/2018
5
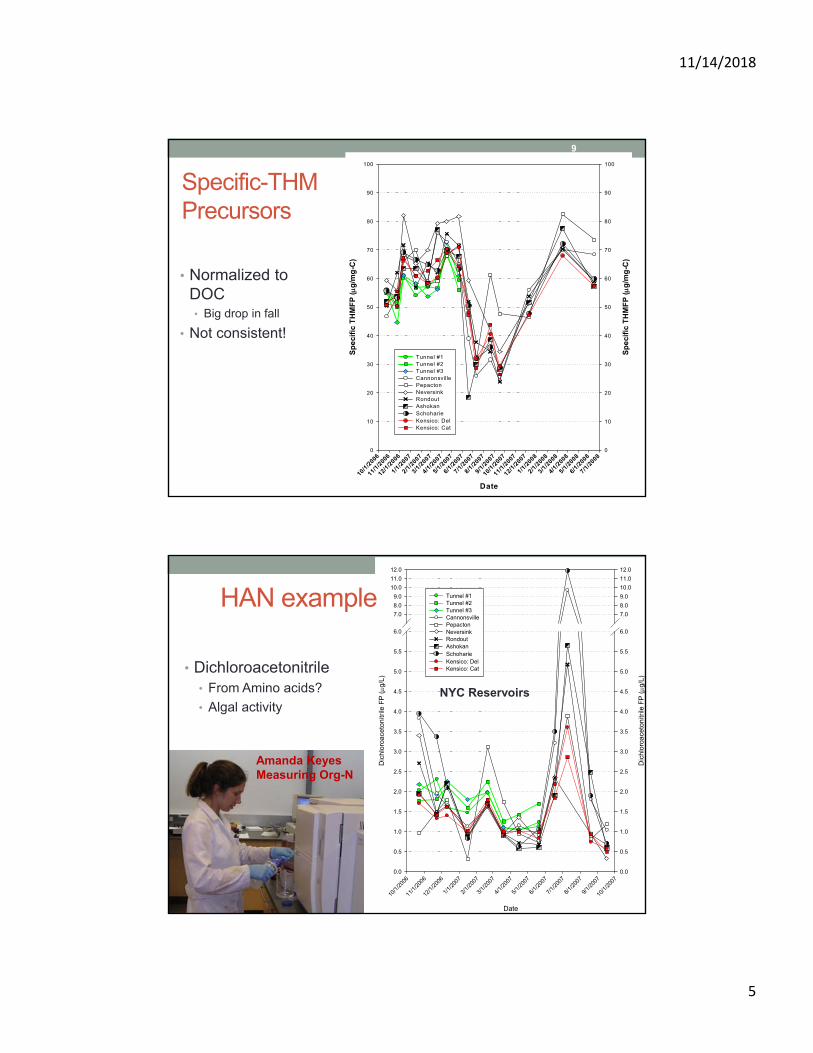
Specific-THM Precursors
• Normalized to DOC• Big drop in fall
• Not consistent!
9Date
10/1/2
006
11/1/
2006
12/1
/2006
1/1/2
007
2/1/2
007
3/1/2
007
4/1/2
007
5/1/
2007
6/1/2
007
7/1/
2007
8/1/2
007
9/1/2
007
10/1
/2007
11/1/2
007
12/1/2
007
1/1/2
008
2/1/
2008
3/1/2
008
4/1/
2008
5/1/2
008
6/1/
2008
7/1/2
008
Sp
eci
fic
TH
MF
P (g
/mg
-C)
0
10
20
30
40
50
60
70
80
90
100
Sp
eci
fic
TH
MF
P (g
/mg
-C)
0
10
20
30
40
50
60
70
80
90
100
Tunnel #1Tunnel #2Tunnel #3CannonsvillePepactonNeversinkRondoutAshokanSchoharieKensico: DelKensico: Cat
9
• Dichloroacetonitrile• From Amino acids?
• Algal activity
10
Date
10/1
/200
6
11/1
/200
6
12/1
/200
6
1/1/
2007
2/1/
2007
3/1/
2007
4/1/
2007
5/1/
2007
6/1/
2007
7/1/
2007
8/1/
2007
9/1/
2007
10/1
/200
7
Dic
hlo
roa
ceto
nitr
ile F
P ( g
/L)
0.0
0.5
1.0
1.5
2.0
2.5
3.0
3.5
4.0
4.5
5.0
5.5
6.0
7.0
8.0
9.0
10.0
11.0
12.0
Dic
hlo
roa
ceto
nitr
ile F
P (g
/L)
0.0
0.5
1.0
1.5
2.0
2.5
3.0
3.5
4.0
4.5
5.0
5.5
6.0
7.0
8.0
9.0
10.0
11.0
12.0
Tunnel #1Tunnel #2Tunnel #3CannonsvillePepactonNeversinkRondoutAshokanSchoharieKensico: DelKensico: Cat
Amanda KeyesMeasuring Org-N
NYC Reservoirs
HAN example
11/14/2018
6
DOC is a blunt tool
• At 25g-THM precursor/mg-C, • 0.25% of the NOM carbon become incorporated into THMs,
• 99.75% of NOM carbon does not form THMs
• Using DOC as a proxy for THM precursors is a bit like using TDS for iodide• It might correlate, but it might not
• Can we do better: yes!• Spectral based parameters
• UV Abs, full UV/Vis spectra, fluorescence
• Reactivity based parameters• Chlorine demand, COD
• Accelerated DBP formation
11
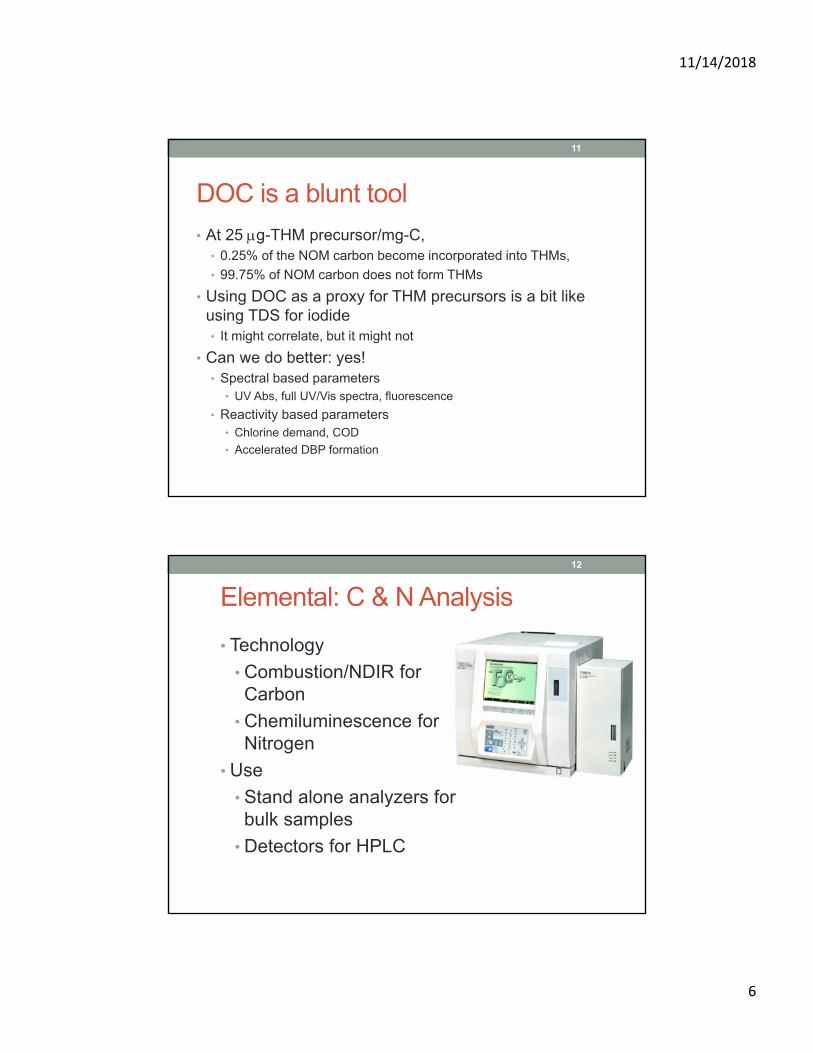
Elemental: C & N Analysis
• Technology
• Combustion/NDIR for Carbon
• Chemiluminescence for Nitrogen
• Use
• Stand alone analyzers for bulk samples
• Detectors for HPLC
12
11/14/2018
7
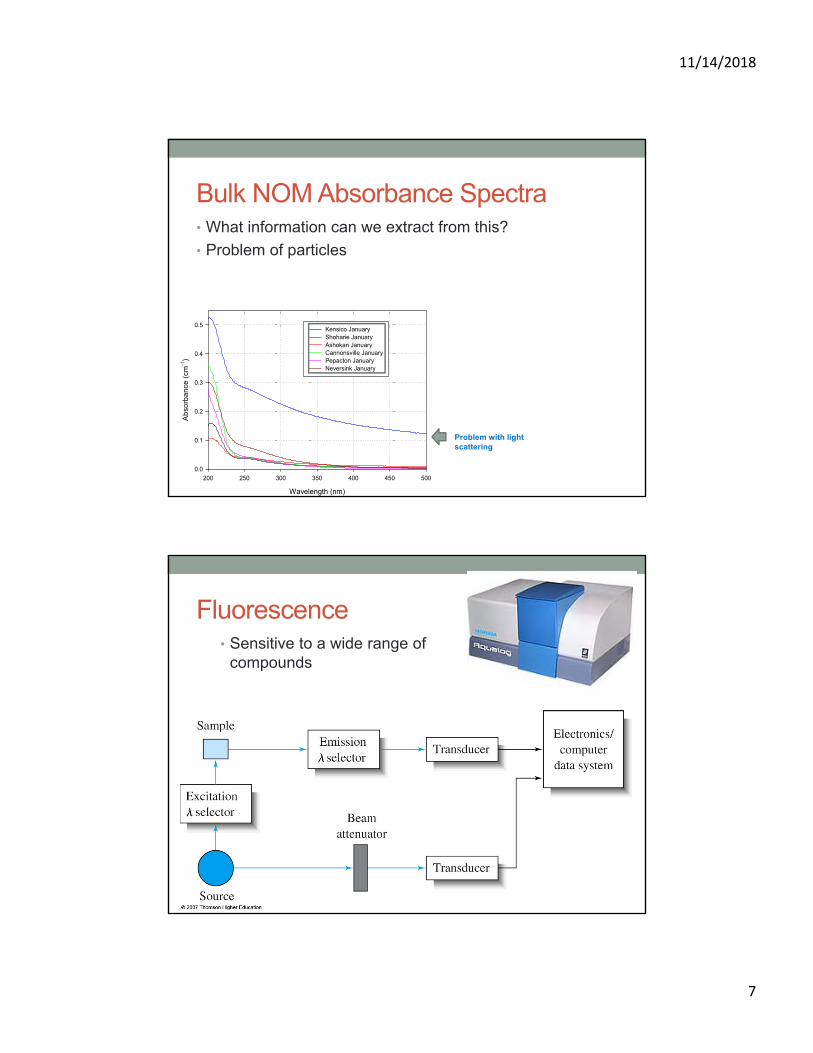
Bulk NOM Absorbance Spectra• What information can we extract from this?
• Problem of particles
Wavelength (nm)
200 250 300 350 400 450 500
Ab
sorb
an
ce (
cm-1
)
0.0
0.1
0.2
0.3
0.4
0.5Kensico January Shoharie January Ashokan January Cannonsville January Pepacton January Neversink January
Problem with light scattering
Fluorescence• Sensitive to a wide range of
compounds
11/14/2018
8
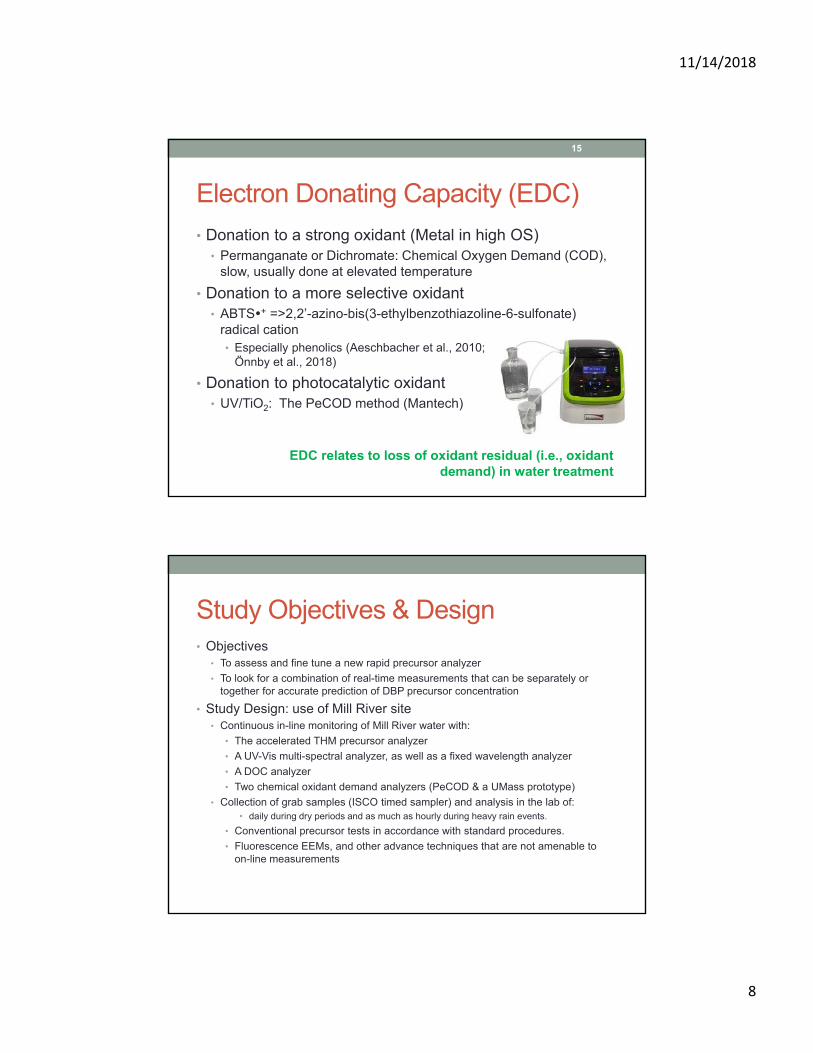
Electron Donating Capacity (EDC)
• Donation to a strong oxidant (Metal in high OS)• Permanganate or Dichromate: Chemical Oxygen Demand (COD),
slow, usually done at elevated temperature
• Donation to a more selective oxidant• ABTS+ =>2,2’-azino-bis(3-ethylbenzothiazoline-6-sulfonate)
radical cation• Especially phenolics (Aeschbacher et al., 2010;
Önnby et al., 2018)
• Donation to photocatalytic oxidant• UV/TiO2: The PeCOD method (Mantech)
15
EDC relates to loss of oxidant residual (i.e., oxidant demand) in water treatment
Study Objectives & Design• Objectives
• To assess and fine tune a new rapid precursor analyzer
• To look for a combination of real-time measurements that can be separately or together for accurate prediction of DBP precursor concentration
• Study Design: use of Mill River site• Continuous in-line monitoring of Mill River water with:
• The accelerated THM precursor analyzer
• A UV-Vis multi-spectral analyzer, as well as a fixed wavelength analyzer
• A DOC analyzer
• Two chemical oxidant demand analyzers (PeCOD & a UMass prototype)
• Collection of grab samples (ISCO timed sampler) and analysis in the lab of:• daily during dry periods and as much as hourly during heavy rain events.
• Conventional precursor tests in accordance with standard procedures.
• Fluorescence EEMs, and other advance techniques that are not amenable to on-line measurements

11/14/2018
9
• Located in north Amherst and goes through a natural greenbelt southwest to Hadley and the Connecticut River
• Above-average water quality
• Feeds to Connecticut River
• Continuously pumped into Water and Energy Testing Facility for sampling and water quality monitoring
• Pressure transducers for continuous measurement of stage, translated to discharge
Mill River
Field Site
• Mill River
Land Use Percent of Total
Forest 58.3
Cropland 8.3
Pasture 5.1
Forested Wetland 3.3
Urban Public/Institutional 3.3
Non‐Forested Wetland 3.0
Low Density Residential 2.8
Medium Density Residential 2.3
Very Low Density Residential 2.2
Open Land 1.8
Multi‐Family Residential 1.5
Water 1.4
Commercial 1.1
Participation Recreation 1.0
Brushland/Successional 1.0
Other 3.6
11/14/2018
10
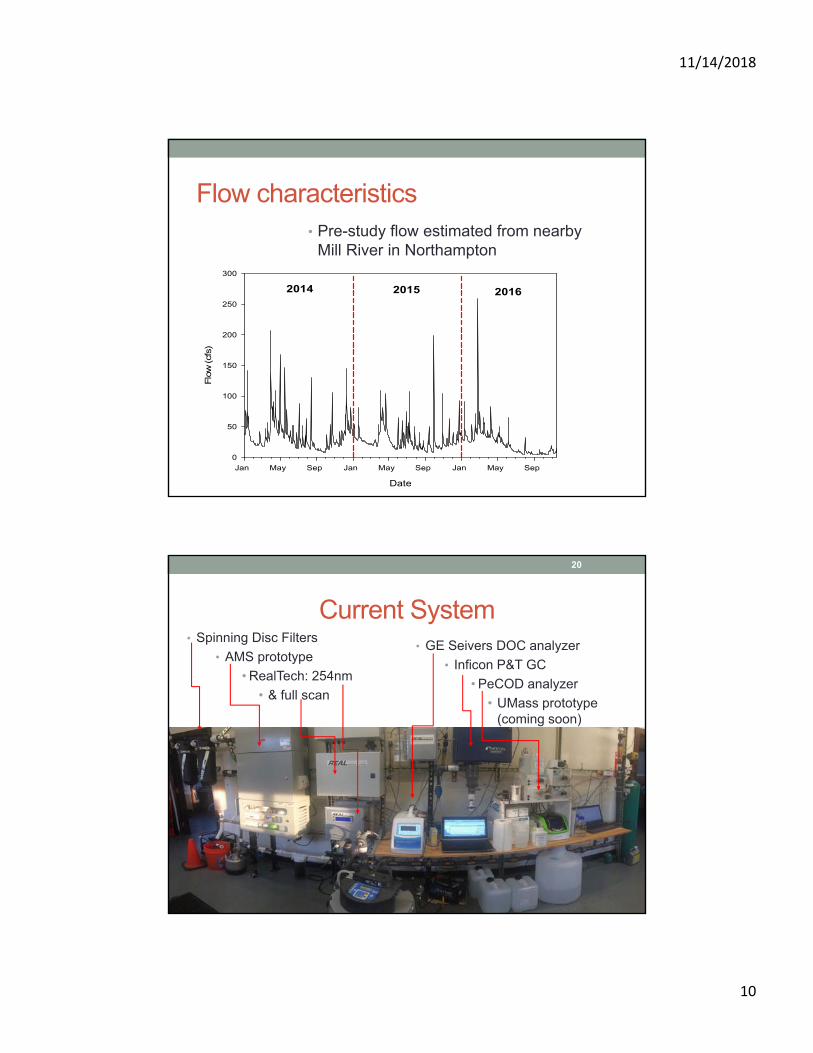
Flow characteristics
Date
Jan May Sep Jan May Sep Jan May Sep
Flo
w (cf
s)
0
50
100
150
200
250
300
2014 2015 2016
• Pre-study flow estimated from nearby Mill River in Northampton
Current System• Spinning Disc Filters
• AMS prototype
• RealTech: 254nm
• & full scan
• GE Seivers DOC analyzer
• Inficon P&T GC
• PeCOD analyzer
• UMass prototype (coming soon)
20
11/14/2018
11
25 point medians
Date
Mar Apr May Jun Jul
DO
C (m
g/L
)
2
4
6
8
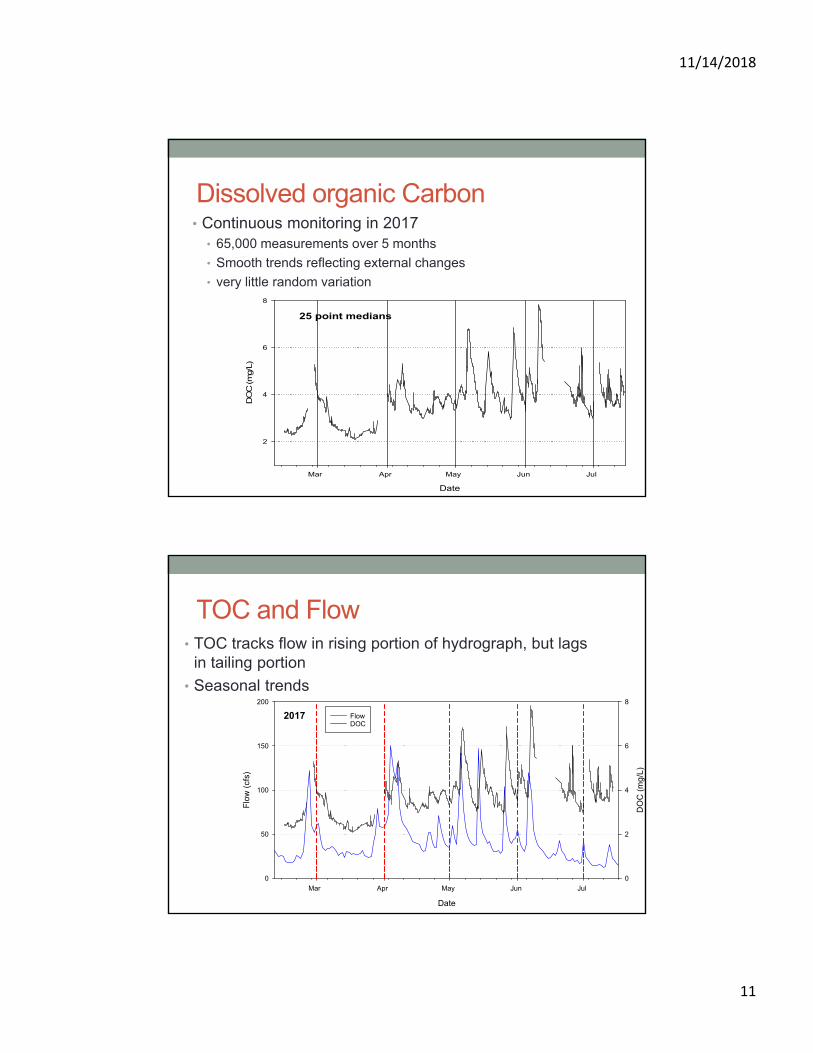
Dissolved organic Carbon• Continuous monitoring in 2017
• 65,000 measurements over 5 months
• Smooth trends reflecting external changes
• very little random variation
Date
Mar Apr May Jun Jul
Flo
w (
cfs)
0
50
100
150
200
DO
C (
mg/
L)
0
2
4
6
8
FlowDOC
2017
TOC and Flow• TOC tracks flow in rising portion of hydrograph, but lags
in tailing portion
• Seasonal trends
11/14/2018
12
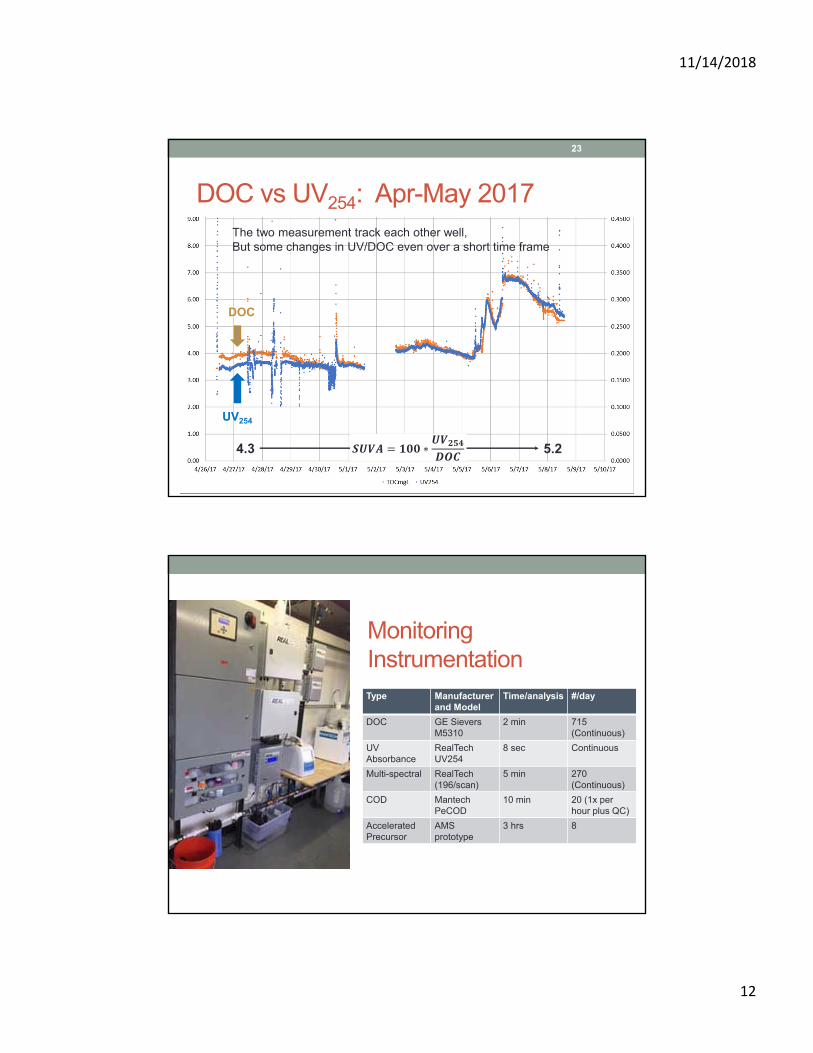
DOC vs UV254: Apr-May 2017
23
DOC
UV254
The two measurement track each other well,But some changes in UV/DOC even over a short time frame
4.3 5.2∗
Monitoring Instrumentation
• COD Mantech PeCOD
Type Manufacturer and Model
Time/analysis #/day
DOC GE Sievers M5310
2 min 715 (Continuous)
UV Absorbance
RealTechUV254
8 sec Continuous
Multi-spectral RealTech(196/scan)
5 min 270 (Continuous)
COD MantechPeCOD
10 min 20 (1x per hour plus QC)
Accelerated Precursor
AMS prototype
3 hrs 8
11/14/2018
13
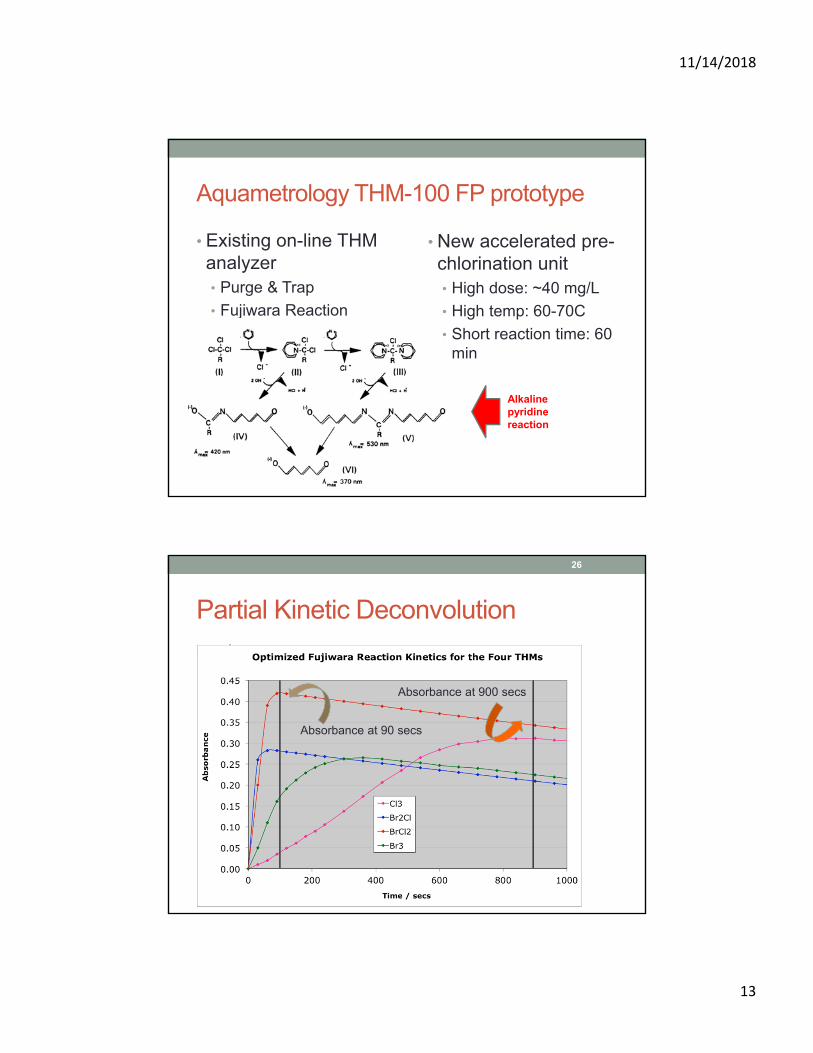
Aquametrology THM-100 FP prototype
• Existing on-line THM analyzer• Purge & Trap
• Fujiwara Reaction
• New accelerated pre-chlorination unit• High dose: ~40 mg/L
• High temp: 60-70C
• Short reaction time: 60 min
Alkaline pyridine reaction
Partial Kinetic Deconvolution
• asdas
26
Absorbance at 90 secs
Absorbance at 900 secs
11/14/2018
14
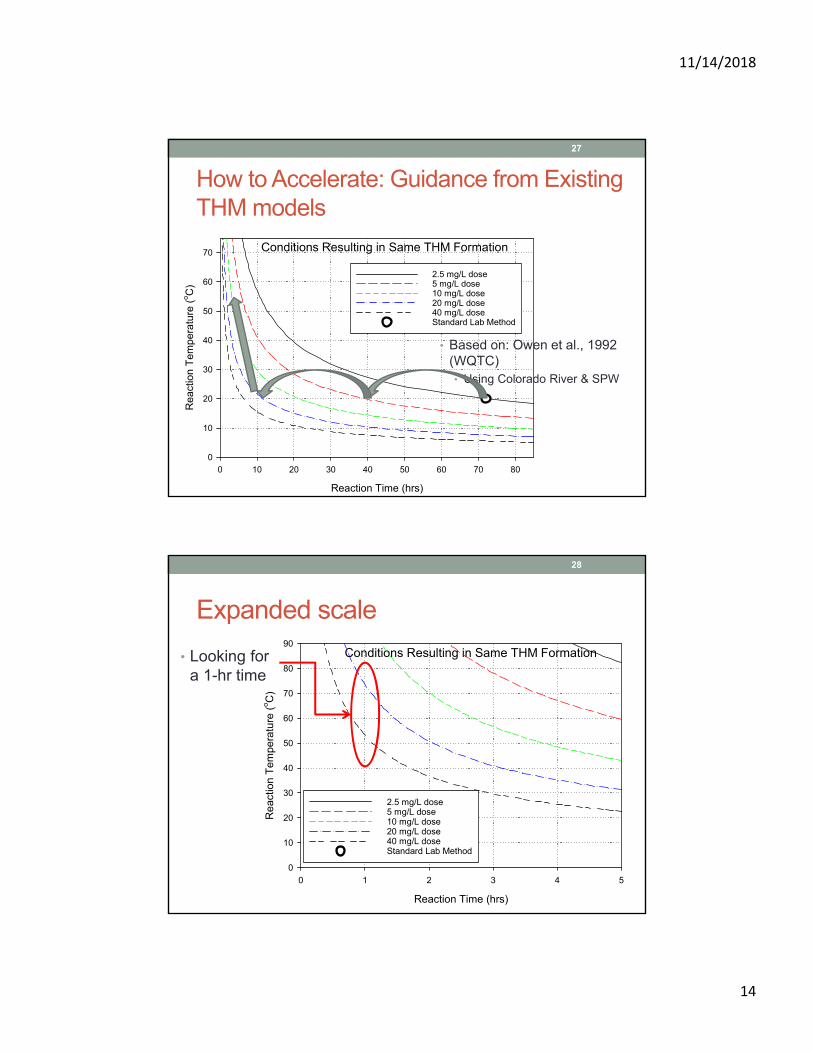
27
Conditions Resulting in Same THM Formation
Reaction Time (hrs)
0 10 20 30 40 50 60 70 80
Rea
ctio
n T
empe
ratu
re (
oC
)
0
10
20
30
40
50
60
70
2.5 mg/L dose5 mg/L dose10 mg/L dose20 mg/L dose40 mg/L doseStandard Lab Method
• Based on: Owen et al., 1992 (WQTC)• Using Colorado River & SPW
How to Accelerate: Guidance from Existing THM models
Expanded scale
28
Conditions Resulting in Same THM Formation
Reaction Time (hrs)
0 1 2 3 4 5
Re
actio
n T
empe
ratu
re (
oC
)
0
10
20
30
40
50
60
70
80
90
2.5 mg/L dose5 mg/L dose10 mg/L dose20 mg/L dose40 mg/L doseStandard Lab Method
• Looking for a 1-hr time
11/14/2018
15
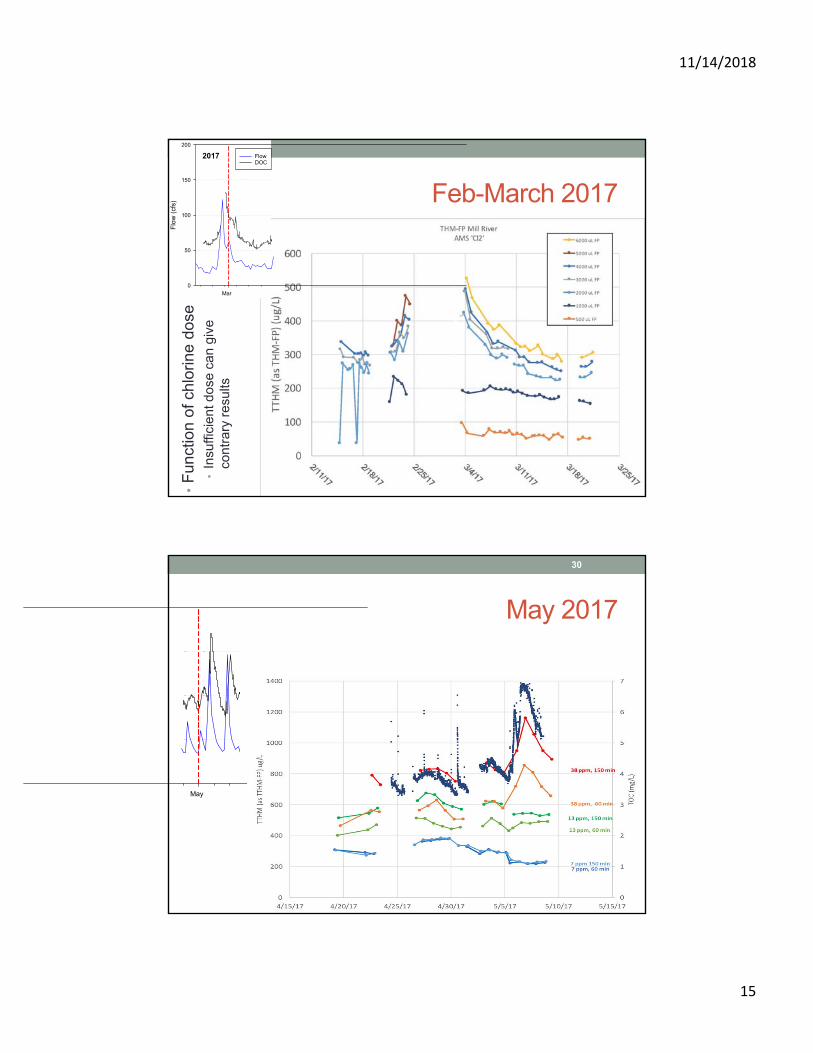
Feb-March 2017•
Fun
ctio
n of
chl
orin
e do
se•
Insu
ffici
ent d
ose
can
give
co
ntra
ry r
esul
ts
Mar
Flo
w (
cfs)
0
50
100
150
200
FlowDOC
2017
May 2017
• m\
30
May
11/14/2018
16
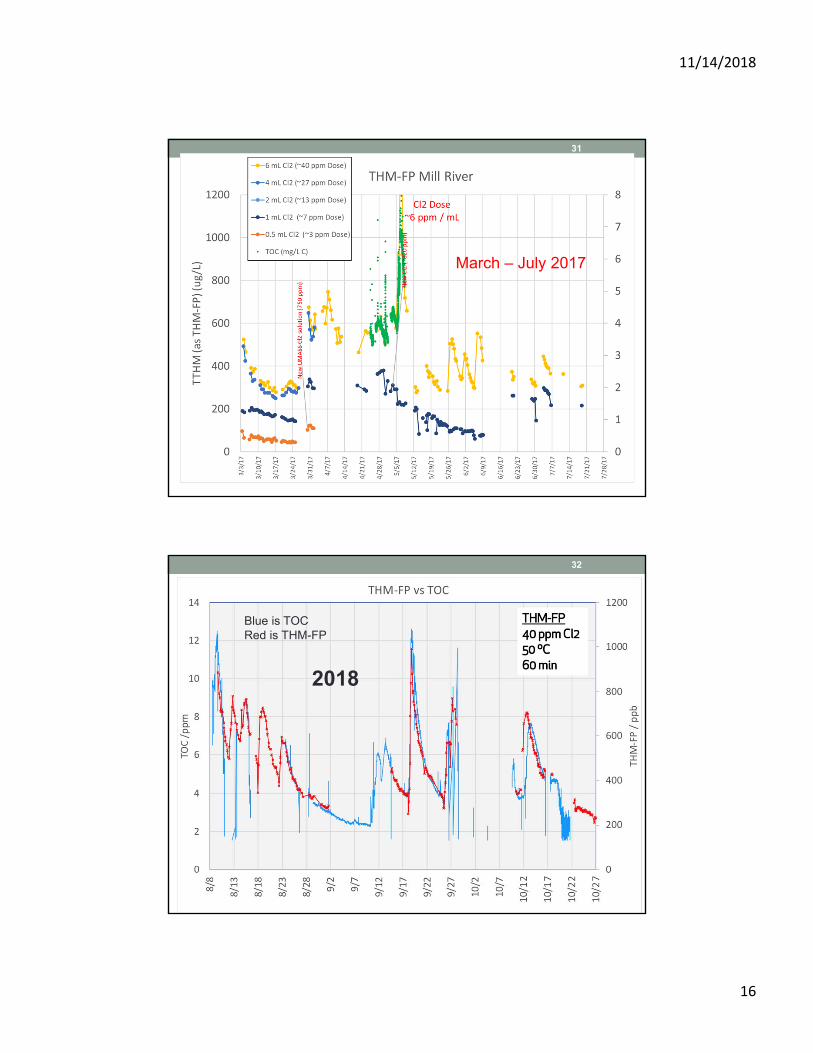
31
March – July 2017
• sadas
32
Blue is TOCRed is THM-FP
2018
11/14/2018
17
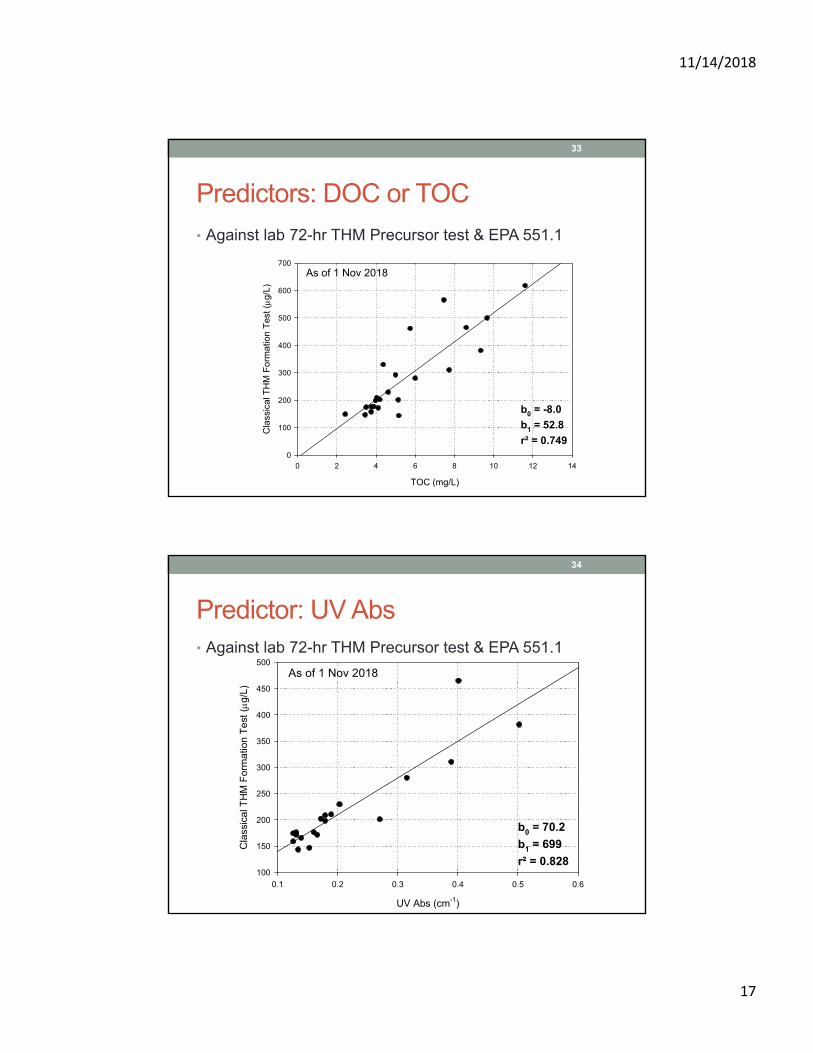
Predictors: DOC or TOC
33
As of 1 Nov 2018
TOC (mg/L)
0 2 4 6 8 10 12 14
Cla
ssic
al T
HM
For
mat
ion
Tes
t ( g
/L)
0
100
200
300
400
500
600
700
b0 = -8.0
b1 = 52.8
r² = 0.749
• Against lab 72-hr THM Precursor test & EPA 551.1
Predictor: UV Abs
34
As of 1 Nov 2018
UV Abs (cm-1)
0.1 0.2 0.3 0.4 0.5 0.6
Cla
ssic
al T
HM
For
mat
ion
Tes
t (
g/L)
100
150
200
250
300
350
400
450
500
b0 = 70.2
b1 = 699
r² = 0.828
• Against lab 72-hr THM Precursor test & EPA 551.1
11/14/2018
18
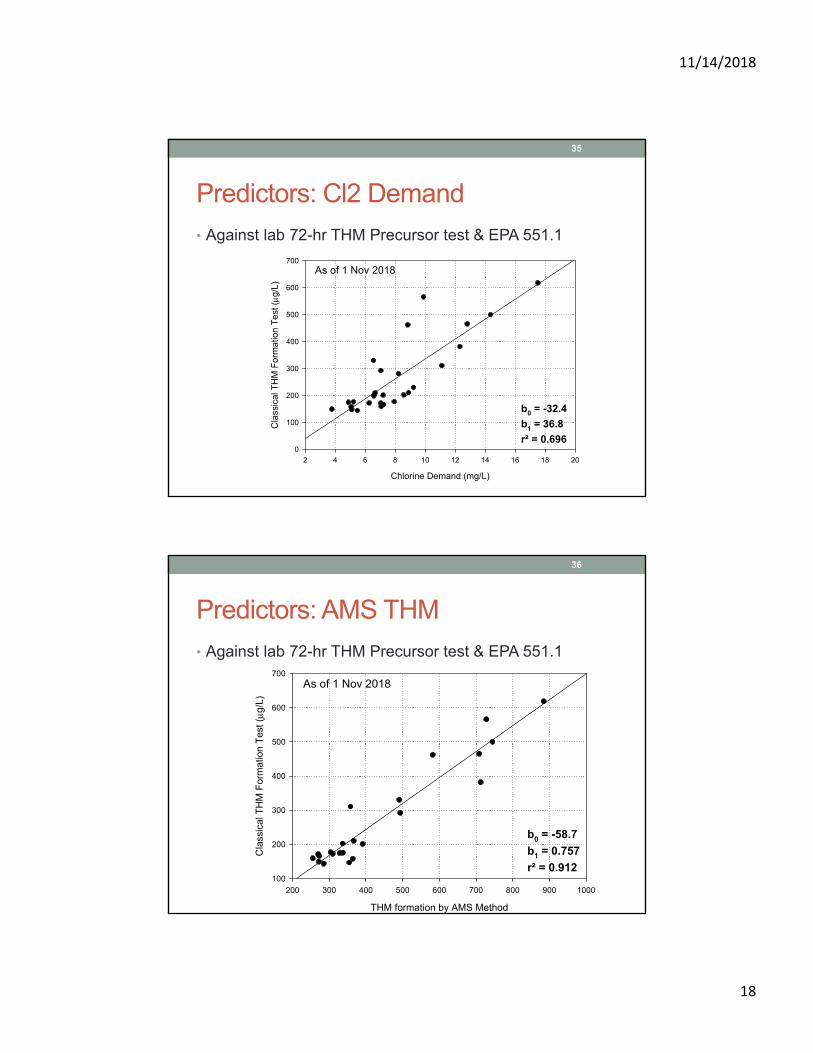
Predictors: Cl2 Demand
• Against lab 72-hr THM Precursor test & EPA 551.1
35
As of 1 Nov 2018
Chlorine Demand (mg/L)
2 4 6 8 10 12 14 16 18 20
Cla
ssic
al T
HM
For
ma
tion
Te
st ( g
/L)
0
100
200
300
400
500
600
700
b0 = -32.4
b1 = 36.8
r² = 0.696
Predictors: AMS THM
36
As of 1 Nov 2018
THM formation by AMS Method
200 300 400 500 600 700 800 900 1000
Cla
ssic
al T
HM
For
mat
ion
Tes
t (
g/L)
100
200
300
400
500
600
700
b0 = -58.7
b1 = 0.757
r² = 0.912
• Against lab 72-hr THM Precursor test & EPA 551.1
11/14/2018
19
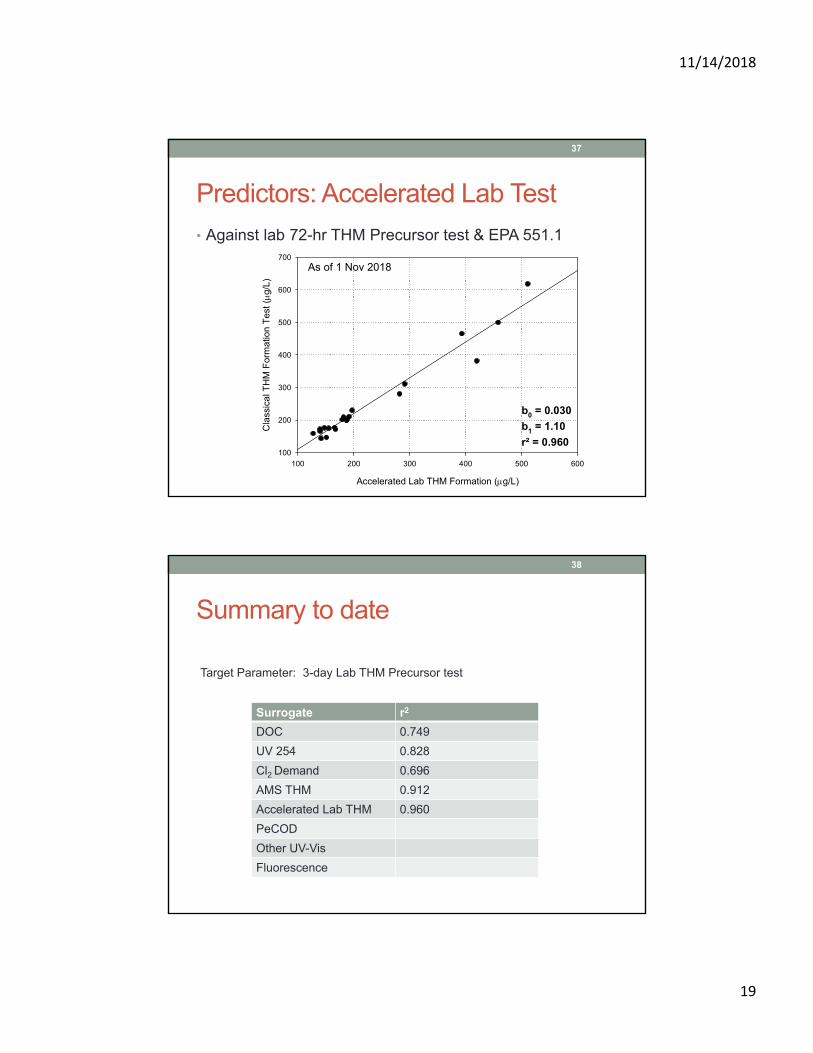
Predictors: Accelerated Lab Test
37
As of 1 Nov 2018
Accelerated Lab THM Formation (g/L)
100 200 300 400 500 600
Cla
ssic
al T
HM
For
mat
ion
Tes
t (
g/L)
100
200
300
400
500
600
700
b0 = 0.030
b1 = 1.10
r² = 0.960
• Against lab 72-hr THM Precursor test & EPA 551.1
Summary to date
Surrogate r2
DOC 0.749
UV 254 0.828
Cl2 Demand 0.696
AMS THM 0.912
Accelerated Lab THM 0.960
PeCOD
Other UV-Vis
Fluorescence
38
Target Parameter: 3-day Lab THM Precursor test
11/14/2018
20
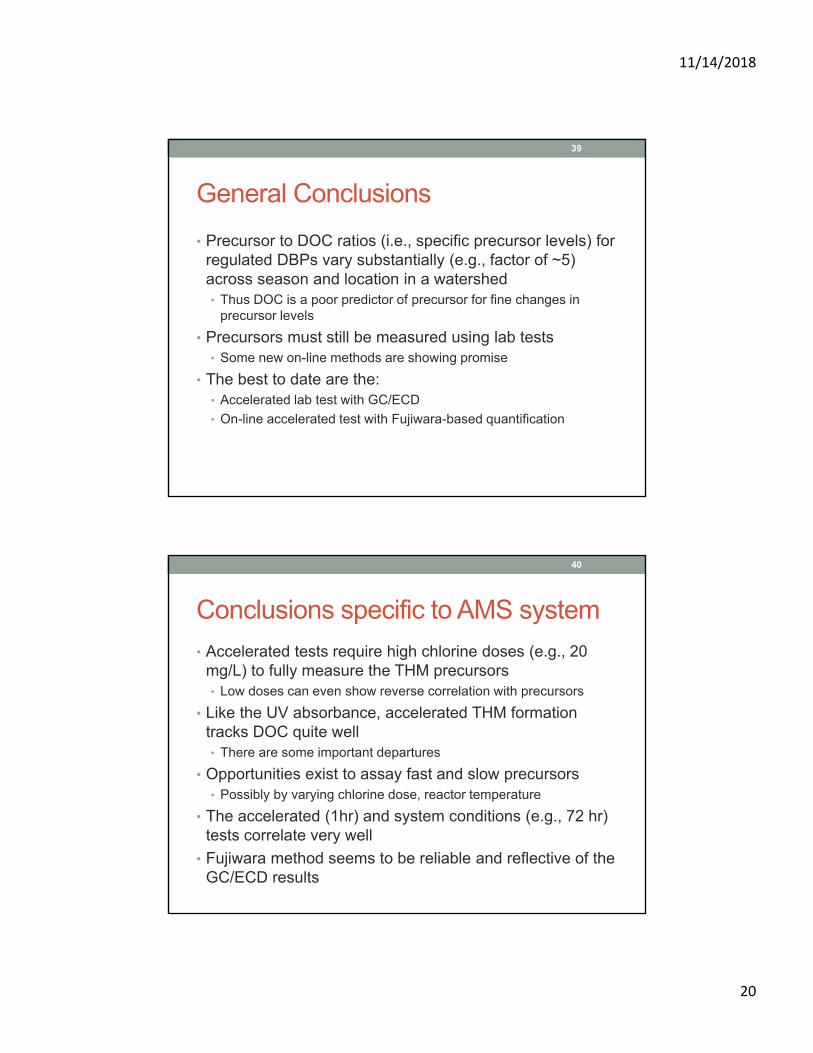
General Conclusions
• Precursor to DOC ratios (i.e., specific precursor levels) for regulated DBPs vary substantially (e.g., factor of ~5) across season and location in a watershed• Thus DOC is a poor predictor of precursor for fine changes in
precursor levels
• Precursors must still be measured using lab tests• Some new on-line methods are showing promise
• The best to date are the:• Accelerated lab test with GC/ECD
• On-line accelerated test with Fujiwara-based quantification
39
Conclusions specific to AMS system
• Accelerated tests require high chlorine doses (e.g., 20 mg/L) to fully measure the THM precursors• Low doses can even show reverse correlation with precursors
• Like the UV absorbance, accelerated THM formation tracks DOC quite well• There are some important departures
• Opportunities exist to assay fast and slow precursors• Possibly by varying chlorine dose, reactor temperature
• The accelerated (1hr) and system conditions (e.g., 72 hr) tests correlate very well
• Fujiwara method seems to be reliable and reflective of the GC/ECD results
40
11/14/2018
21
Acknowledgments
• Massachusetts Clean Energy Center
• Hazen & Sawyer Engineers
• Water Research Foundation
• NYSERDA• New York State Energy Research & Development Authority
• Many past students and utility personnel in other locations
41