Embed Size (px)
Citation preview

1
Poverty: some issues1
Michael Lipton
Severe absolute IC2 (income-consumption) poverty halved in 1981-2005. The fall has continued since. It
is unprecedented in scale, speed and spread. Meanwhile there have been huge advances in measuring ab-
solute IC poverty, and in understanding how agriculture is central to its causes and cures. We understand
better how poverty is reduced by farm growth; wider access to farmland; and rises in demand for work
relative to supply, in quality of work due to education, and in ratios of workers to dependents.
Yet this progress has exposed huge gaps. Progress in reducing absolute IC poverty has exposed regions
and groups where it has hardly fallen, usually alongside slow or no progress in farm production, land ac-
cess, or demand for labour and skills relative to population. Progress in understanding IC poverty leaves
us knowing too little about why some groups and areas stay behind – and about which sorts of agriculture,
and which land arrangements, conduce best to poverty reduction. There are problems about how we
measure IC poverty and compare it among times and places, e.g. to monitor progress towards the MDG of
halving the proportion of people in severe absolute poverty between 1990 and 2015.
With unprecedented gains and huge gaps, one would expect intensified efforts in poverty-researching/re-
ducing professions. Yet these have seen a strange diversion of effort. Despite the gains in understanding
and reducing poverty, we have moved away from filling the gaps, and towards three fascinating side is-
sues: relative poverty, multidimensional poverty and poverty panels.
At the time, there seemed good reasons for these diversions. They have provided ‘ladders’ to some in-
sights. However, these were partial and misleading because the ladders were not fully sound. It is time to
kick away the ladders, fill the research gaps, and focus on key issues. What are the causes and other rele-
vant correlates of severe absolute IC poverty, still affecting 1.4bn people, over 1bn of them rural? (Rural
people will comprise over half the absolute poor until at least 2050 [Ravallion 20xx].) How are the nature,
structure and treatment of poverty affected by two new contexts: rising inequality, harming growth as
well as poverty; and climate change and other threats to sustainability? The two contexts combine: if en-
vironmental constraints mean slower growth, poverty reduction requires more attention to inequality.
2. Progress against severe absolute income-consumption poverty: the crude facts at aggregate level
IC poverty is lack of sufficient IC resources to meet a basic minimum standard of (a) well-being, (b) ful-
filment of positive or desirable capabilities.3 Lack of well-being and/or fulfilment is why we are worried
about poverty, but they are not the same as poverty.
The poor can sometimes improve, or can be assisted by an enabling State to improve, their ‘conversion ef-
ficiency’ of IC into well-being and capabilities. For example, some poor households are above the average
for such households - show ‘positive deviance’ [Zeitlin 19xx] - in converting income into nutrients, or nu-
trients into health, activity, child growth and school performance. That is only in part because positive de-
viants are better at allocating household resources among uses, family members, or times: the poor, espe-
cially the very poor, seldom survive unless they have already made such allocations (addictions, perhaps,
apart). Also, in raising conversion efficiency, the poor also face handicaps in acquiring and using infor-
mation, education and ‘social capital’. Many poor are also risk-, and hence change-, averse, being pre-
carious: even small IC-falls force harsh choices (skip meals or take a child out of school?)
1 This paper is based on a Centennial Lecture delivered at Bristol University on 9 June 2009 2 Most absolutely poor people can neither save nor borrow much. Hence their income is usually close to their consumption. In estimating IC pov-
erty it is preferable to measure consumption, which (a) is more accurately reported and measured than income, (b) shows current living levels -
resources used to meet perceived current requirements, (c) indicates permanent income better than does income itself, since the poor’s limited
saving/lending or dissaving/borrowing is mainly used to smooth incomes over seasons and life-cycles. Most surveys measure either income or
consumption poverty, but standard conversion factors have been estimated for main regions. [refs] 3Basic minimum capabilities threatened by poverty (in nutrition, health, educational access, etc) are identifiable and not very controversial. The capabilities approach at higher income levels suffers from disagreement on which individual capabilities are desirable, consistent or sustainable.

2
What sort of resources do poor people lack? The focus, in low-income countries especially, has been on
levels of consumption below basic consumer needs. Almost all the forty developing countries with least
resources per person, as indicated by average GDP at 2005 purchasing power parity – and all the largest
such countries - set national poverty lines at, or near, the cost of a basic-needs bundle comprising a mini-
mum diet plus ‘allowance’ for non-food needs, and close to $1.25 2005PPP/person/day. Among countries
other than the forty with lowest average 2005PPP mean GDP, poverty lines rise with mean income/con-
sumption, typically to $2 for middle-income countries and $4-15 for high-income countries. It is, how-
ever, possible to standardise the poverty definition at or near $1.25 2005PPP/person/day in almost all
countries. Much effort has gone into household surveys tracking it over time [Ravallion et al].
Some backtracking into history has been tried [Bourgignon and Morrison]. In 1821 probably some 80%
of the world’s population was below this harsh poverty line, in 1890 67%, in 1929 and 1950 about 55%
and in 1980-81 31.5%. By 1981, absolute extreme poverty in OECD had almost vanished. Later data are
for ‘developing countries’ - Africa, Asia (except Japan, S Korea, Hong Kong, Singapore and Malaysia),
Latin America, and communist/transitional countries. Their poverty incidence [Ravallion and colleagues,
the source of the data in these paragraphs unless otherwise stated] fell from 52% in 1981 to 42% (1987),
39% (1993), 34% (1999) and 26% (2005). Incomplete evidence suggests that though slowed by dearer
food and growth slowdown due to the financial crisis, absolute poverty incidence at this harsh line of
$1.25 2005PPP/person/day continued to fall, being 23-24% of developing-country populations in 2009.
How poor are the absolute poor and how do they survive? In 2005, they averaged 87c consumption/day at
2005 PPP – 30% below the ($1.25) poverty line. This has also improved since 1981 (when they averaged
only 74c, 40% below the line). How can the average person below the poverty line survive on 30-40%
below average basic needs - let alone the many well below this average?
(a) Measured private consumption largely excludes gathered foods and other common property resources
(a significant, though falling, part of the consumption of the poor [Jodha 19xx]); rental value of owned
houses; and the free or subsidised element of government services;
(b) Absolute poverty is measured by consumption per person. The poor have higher child/adult ratios
than the non-poor, and small children eat less than adults. Hence typical, many-child poor households
need less food per person than do typical non-poor households.
(c) There is a tragic reverse of this coin: why have the poor have such high ratios of children to adults?
Child mortality among the poor is much higher than among the non-poor, due to frequent child deaths and
higher fertility to replace, or insure against, such deaths. Even surviving under-fives are underfed, leading
sometimes to life-threatening wasting, and often to lifelong, often severe and unhealthy stunting: the very
poor need less food per person than the non-poor because poverty has already reduced their bodies and
occasionally their brainpower, and therefore their needs and capabilities. Further, severe malnutrition
among under-fives, if they survive, impairs mid-life responses to infections and later degenerative dis-
eases. The chronic poor have scant chance of reaching old age. Part of the answer to the question, ‘How
do the poor survive, though many consume less than average basic needs?’ is that many do not survive; or
survive more briefly than the better-off; or survive only with impaired capabilities.
To sum up: (1) risk of absolute poverty fell by over half in 1890-1981, halved again in the developing
world in 1981-2005, and is still falling; (2) average depth of absolute poverty fell too; (3) despite such
progress, rapid far beyond any historical precedent, in 2005 there were 1.4 billion people just surviving
(or not) below a harsh $1.25/day PPP poverty line - on average about 30% below it.
3. Progress in measuring and understanding poverty: profiles
Quality-controlled household surveys of income and/or consumption and poverty - in anything from 2 to
30 or more of the past fifty years - are available for over 95% of developing and transitional populations.
These surveys measure headcount (incidence), poverty gap, and other important indicators. The main ini-
tial use of these surveys has been to conduct poverty profiles, identifying differences between poor, the
near-poor, and the clearly non-poor. Typical findings are that the poor:
--- have much worse education, nutrition, health (but not self-reported health) and life expectancy at birth;

3
--- hence have larger families and ratios of children to prime-age adults, outweighing their lower ratios of
old people to prime-age adults, so the poor have much higher dependency ratios than the non-poor;
--- are likelier to be rural, agricultural, remote, members of minority ethnic groups/tribes, etc.
Partha Dasgupta [ref] argues that poverty-profile correlations are (a) obvious and therefore boring, (b)
useless because causally unstructured, (c) misleading, hinting that poor people - or policymakers – can
cure poverty by tackling its correlates: maybe the best way to better education is poverty reduction, not
the other way round. These are important cautions, but poverty profiles remain useful and are not to be re-
jected on grounds of endogeneity/causality paralysis.
As for objection (a), static cross-section profiles are not always obvious or even expected. For example,
absolute risk aversion is not much larger among poorer households [Binswanger]. The poor are not like-
lier to be landless than the non-poor in some African countries. Female-headed households in Asia (but
not Latin America) are not more IC-poverty-prone than male-headed households. Indigenos in Latin
America are not much likelier to be poor than others, if educational level and main language are the same.
Also, even when profile correlations are obvious, patterns of exceptions are interesting. Why are the IC-
poor relatively educated or healthy in China, Sri Lanka and Costa Rica, or in South but not North India?
As for objection (b), poverty profiles can be causally structured, perhaps by using appropriate ‘extra in-
formation’ from other studies. For India and China, Fan et al. [refs] show the regions in which various
types, of public investment are associated with more, or less, subsequent poverty reduction.
As for objection (c), poverty profiles, even where not causally structured, can help policy. They can pro-
vide useful indicators of places, family types or occupations likely to contain the poorest, helping to tar-
get subsidy or advancement programmes (where direct and overt targeting induces the non-poor to under-
report income). Poverty profiles, even if simply multiple correlations, can also challenge assumed causali-
ties, e.g. by showing that discrimination or access, not caste or skin shade, relates to poverty. Profiles can
also give hints for action. That certain groups of IC-poor households achieve adequate nutrition suggests
how undernourished poor households, too, can be helped to achieve individual or household ‘positive de-
viance’ [Zeitlin]. The greater dependence of the IC-poor on common property resources - however caused
- suggests much greater policy focus on these [Jodha]. The IC-poor’s higher dependence on hired labour
suggests that public works or employment guarantees may ‘self-target’ them [Gaiha, Ravallion].
However, Dasgupta is right that causal structure matters. In using poverty profiles, questions about selec-
tion bias, endogeneity, and reciprocal or joint causation almost always need to be asked. Whether, for ex-
ample, contraception causes poverty reduction, or whether ‘development is the best contraceptive’ for the
poor, is an empirical and explorable matter, and has been much explored, with quite strong results.
Some profile-based links to absolute IC-poverty - of weak human capital, of high fertility and child/adult
ratios, of rural residence and farming work - are robust. I shall focus on the last, but first make a general
point. In drawing policy conclusions, e.g. (but not only) about agriculture’s role in poverty reduction, suc-
cessive profiles (not panels) are needed to update our perceptions about appropriate anti-poverty policy.
(1) In India the number of absolute poor depending mainly on farm labour for livelihoods overtook
the number depending mainly on farming in the mid-1980s and is now about 50% higher [ref].
(2) Where (1) applies, it suggests that except where farmland is very equal (China, Vietnam, parts of
West Africa, Kerala State in India), agricultural growth increasingly contributes to poverty reduc-
tion more via extra employee income than via extra farm income. Agriculture remains a promis-
ing engine of poverty-reducing forms of growth, but only with attention to the employment effect
of innovations (better seeds and irrigation rather than combines, say) or to land redistribution.
(3) States, and periods, of higher inequality in India, and elsewhere, are worse at turning given
growth into poverty reduction, for both arithmetical and political reasons [Ravallion].
(4) These profile findings, supplemented by others, give strong policy findings. In Latin America
land inequality has a long ‘tail’, continuing to retard poverty reduction (and probably growth)
long after agriculture has ceased to engage even 20-25% of the people [de Janvry, Carter]. In

4
Latin America, with its extreme land inequality, agricultural growth is no better at reducing pov-
erty that similar income rises generated in other sectors – in sharp contrast to Africa and Asia [].
We could not have learned these things from poverty profiles alone, but we could have relied on them if
all we had were findings of macro-studies and panels.
4. Gaps in reducing, measuring and curing poverty: areas of persistently high poverty
‘Poverty in East Asia - the world’s poorest region in 1981 - has fallen from nearly 80% of the population
living on less than $1.25PPP2005 a day in 1981 to 18% in 2005 (about 340m), and mean consumption of
the poor rose from 69c to 95c/day’. Largely owing to dramatic progress in poverty reduction in China in
1981-2005 - the number of poor fell by about 600 million! - the MDG of halving absolute IC poverty in
1990-2015 has already been achieved in East Asia. In the developing world outside China, IC-poverty in-
cidence has fallen from 40% to 29% over 1981-2005, although the total number of poor has remained un-
changed at around 1.2 billion. ‘[The] poverty rate in South Asia has also fallen, from 60% to 40% over
1981-2005’ and their mean consumption rose from 84c to 95c/person/day, but the absolute number of
poor did not fall (600m in 2005). In sub-Saharan Africa ‘the $1.25 a day poverty rate [showed] no sus-
tained decline [in 1981-2005], starting and ending at around 50%.’ Mean consumption of the poor was
23% below Asian levels: 73c per person per day. ‘The number of poor people nearly doubled, from 200m
in 1981 to 380m in 2005’ [Ravallion..]. Caution is needed about the apparent fall in SSA’s poverty inci-
dence from a 1996 peak of 58% (reaching 50% in 2005). Post-2000 household surveys cover smaller pro-
portions of people in SSA than elsewhere; least is known about conflict zones, where trends may be
worse. Also, from 2006, Africa’s poor probably suffered as world recession took hold, the minerals boom
moderated, and the long downtrend in staples prices reversed. Unfortunately, little credence attaches to a
much-publicised recent claim of rapid poverty reduction in SSA, based not on household surveys but on
national-accounts data supported by largely imputed income distributions [Sala–i-Martin, Ravallion xx].
Not only regional groups of countries (sub-Saharan Africa and Central Asia) but also zones within coun-
tries have experienced relatively slow falls in poverty. Normally such areas of persistently high poverty
(APHPs) feature relatively slow falls in child mortality and, even more, in fertility. Hence child/adult ra-
tios and dependency ratios remain high. Hence households find it hard to save or work their way out of
poverty. Migration from APHPs has been a huge source of global poverty reduction in the last seventy
years, but remaining APHPs - almost by definition - are far from areas with promising opportunities to
escape poverty and/or have poor populations not readily able to reach such areas. The latter often arises
because APHPs offer few chances of education to a standard permitting substantial income gains from
migration; have few contacts in recipient areas to facilitate settlement or work; and are remote, or in many
cases linguistically distinct, from the main population centres. APHPs normally feature both slower
growth and worse conversion of given growth into poverty reduction. APHPs usually still depend heavily
on agriculture, yet have little water control4 and, partly for that reason, relatively sluggish seed-
fertilityiliser technology, especially for smallholder food output. Most of these features characterise the
NW-SW ‘poverty crescent’ provinces in China; with a far larger share of population, India’s ‘BIMARU
states’; and similar sluggish regions within Indonesia, Bangladesh, Pakistan, Nigeria, South Africa. In
Latin America APHPs tend to be on hilly and otherwise marginal lands.
It is widely believed and probably true, though not rigorously established, that a much larger part of
global absolute poverty now than in (say) 1970 is due to differences between APHPs and other areas. It
has been hypothesised that such differences are due to spatial poverty traps [refs] at three levels: overall
interactions of big aggregates; governance; and individual decisions.
Individuals are trapped by characteristics of both household and area of residence that, at once, impede
poverty reduction in place and migration elsewhere. Most familiarly, children in poor households in re-
gions with bad provision of inexpensive education – e.g., crudely, in North but not South India – cannot
4A comparative Asian study shows that in eight countries (including China, India and Indonesia) rural households were much likelier to be poor than otherwise similar households inadjacent unirrigated areas [Lipton xx]

5
acquire much human capital. That impedes their chances to escape poverty, whether by migration, higher-
income local nonfarm diversification, or agricultural innovation. Also, poor people in poor regions usu-
ally live in villages with low seed improvement rate, water control, and hence fertilityiliser inputs; that
means both low productivity of farm labour (so people in poor households must work most of the time to
eat properly, especially if land very unequal) and sluggish productivity of farm land (so farmwork cannot
increase output much faster than labour supply). due to short education, early marriage, high child mortal-
ity, late and slow reduction in fertility and hence faster population increase (Cassen), larger family size,
higher dependency ratios.
Governance is worse in ‘trapped’ provinces (and nations?) partly because cost to politicians of losing
bribe income more; problems harder; taxable capacity less; ‘political’ time and risk-bearing capacity of
poor small (absent prospects to grow in place or migrate). Collier: civil conflict is fuelled by low alterna-
tive income prospects for soldiers.
Aggregate province-level data on farm Q, Q/L, Q/A - and population transition - bear all this out.
Bargain regions: Fortunately, as with older ‘vicious circles’ of poverty-nutrition and poverty-savings,
traps also imply options for escape, for virtuous circles. Some ‘trapped’ regions (and countries?) are also
‘bargain sectors’ in terms of returns to public investment in agriculture, research, education and roads
(Hazell, Fan, Thorat). But causal direction is a problem with this evidence: education, innovation … may
cut poverty, or lower poverty (or exposure to smaller shocks) may be needed to increase uptake of educa-
tion, innovations. There are ways to tease out which is which. More difficult and neglected is the issue of
whether a road in region 1 (from A to B) make poverty fall faster there only because C and D still have no
roads (to each other, A or B) and actually lose when A and B get a road, and can specialise and trade?
Does better education raise output, or just the qualification needed to get jobs of given productivity
(which would harm the poor, less able to ‘buy’ such qualifications)?
MEASUREMENT GAPS are also serious. The household survey base, except in parts of W and Central
Africa and central Asia, is now mostly adequate, but some poverty groups (the homeless, the conflicted)
are grossly undersampled. So are the wealthiest, which matters if we need to assess the role of inequality
in poverty.
BN/PPP vs FEM: But the main issue is that basic-needs listing is top-down and underestimates local and
personal variation, while dollar-a-day raises huge pricing problems (cf huge rise in number of ‘poor’, esp
in China, India, when we shifted to $2005PPP1.25 base). Far better, less problematic and more intuitive
to measure poverty by food-energy method: the poverty line is the consumption level at which a house-
hold (of given composition) just meets food energy needs. This does NOT say ‘only food energy matters’,
but assumes that the average severe-poor household divides its consumption more-or-less rationally
among needs – calories, micronutrients, dietary acceptability, shelter, clothing, fuel, primary schooling
costs, etc. (subject to average addiction constraints). That is, we assume that a household, if it chooses to
acquire just enough food to meet basic energy needs, ‘reveals a preference’ for similar choices in respect
to other needs judged similarly acute. The food-energy method, in principle used in formulating the In-
dian poverty line, allows us to compare the proportion of people in ‘objective’ absolute poverty and the
extent to which they fall short of adequacy - over time and among places - without price and PPP dubi-
eties and without imposing some official’s basic-needs bundle.
Remaining problems: FEM permits international/temporal comparative analysis that is disconnected, as
PPP is not, from (a) someone up there deciding what needs are, (b) price and PPP hassles. BUT neither
the PPP basic-needs method nor the food-energy method solves all measurement problems:
(1) Apart from proportionate shortfall below a poverty line, and the proportion by which the poor’s mean
income falls short of that line, poverty is clearly more damaging if income is very unequal among the
poor. There are various ways to measure this effect, but the policy conclusion, ‘reduce intra-poor inequal-
ity’, is problematic. Redistributors, seeking to give income to the poorest, would never prioritise mulcting
those who are merely very poor. Targeting policy gains only, or even mainly, on the very poorest 5% or
so is likely to be at the cost of cost-effectiveness. Yes, it is desirable to avoid incentives to ‘score’ well in
reducing the headcount poverty incidence by concentrating scarce resources on those just below the pov-
erty line, who each need very little to move above it. But that can be achieved by adding ‘higher mean
consumption for the poor’ to ‘number of poor’ as a policy goal. (Note that ‘higher mean consumption of

6
the poor’ alone cannot be a poverty goal, because mean consumption of the poor falls when poor people,
but with above mean consumption of the poor, rise above the poverty line.)
(2) households get income and consume, but individuals are poor or non-poor. How does one get from
household income/consumption to an assessment of individual adequacy? Measuring income or consump-
tion per adult equivalent instead of per person is a start (as done in OECD) but there’s a deeper problem.
Mostly, it’s assumed that basic-needs (BN) or food-energy consumption, within the household, is divided
‘fairly’ among its members. Yet in some areas many households practise food or health-care discrimina-
tion against small girls (and in favour of boys). A variant of the food-energy method might deal with this;
we might establish, for each country, the consumption level, given a household’s age- and gender-
structure, at which each household members achieves just-adequate height and weight paths.
(3) ‘Sufficient calories for good health’, whether with BN or FEM, isn’t a problem-free concept (initial
body size, work, perhaps adaptation?), but such issues can be dealt with or parametrised for.
(4) FEM and BN both home in on a very low poverty line. Almost nobody in OECD and very few in
some developing areas has consumption so low as to (expect to) be food-poor - though groups with low
total consumption have bad diets even in OECD, the problem is their much higher obesity risk! The
World Bank uses a higher poverty line, $2PPP2005/person/day, for these areas. But shouldn’t a poverty
line represent a threshold? ‘Consumption too low to expect to get sufficient calories for health’ is such a
threshold, perhaps trapping (some of) those who start below it. Is there an analogous higher threshold for
a higher poverty line? I suggest ‘consumption so low that it is typically associated with zero saving’. That
has problems (lifecycle savings behaviour; how much income is left for savings, e.g. after paying for so-
cial obligations, varies a lot across countries, castes, even villages; and is outlay for schooling ‘saving’?)
but they seem manageable, and the expected-zero-savings line is a threshold, above the FEM threshold,
but also representing a step change in capacity to get out of poverty.
Beyond incidence: The headcount (proportion of people below the line) is an inadequate measure be-
cause it ignores the depth of poverty. That can be put right by using the poverty gap index – in which each
person, as a proportion of population, is poverty-weighted by her proportionate shortfall below the pov-
erty line (those above the line being weighted zero). Even that doesn’t allow for the increasing suffering
caused as distance from the poverty line rises. That’s often handled by using the ‘squared poverty gap in-
dex’ – in which each person, as a proportion of population, is weighted by the square of her proportionate
shortfall below the poverty line (again, zero for those above the line). The poorer a poor person is, the
greater her contribution to poverty on this index. Of course, squaring is completely arbitrary. And large
numbers below a poverty line – if it reflects some genuine threshold such as caloric adequacy – is a dif-
ferent problem from high mean shortfall, and maldistribution among the poor is a different problem
again. A clever index for aggregating these problems, called ‘poverty’, is not as clever as it looks. More
useful would be:
Cost of elimination: A measure of the cost, per head of non-poor population, of eliminating poverty (as-
suming total, or partial, success in targeting benefits on the poor, and neutral incentive effects).
Fuzzy poverty: A poverty measure that does not - as do headcount, PGI and squared PGI - assume that
all and only those measured below the poverty line are poor. Due to reporting and measurement errors,
and to differences in conversion efficiency of income into basic needs (e.g. due to health condition, addic-
tion or household skill), some households below the line are not poor, and some above it are poor. This
can be addressed by a ‘fuzzy poverty measure’ of the likeliest headcount, PGI, etc. of poverty – counting,
say, 100% of persons below two-thirds of the standard poverty line, gradually falling to 80% of persons at
the standard line, and continuing to fall to, say, 10% of persons consuming 50% above the standard line.
The exact schedule should be an empirical matter, derived from the actual probabilities of (for example) a
household’s acquiring just-sufficient food energy at different levels of total consumption per equivalised
adult.
Before and after 2015: It would have been silly to change measures in midstream, while progress
against poverty towards the MDG was being monitored. But after 2015 the UN system should move to a
better, more comparable measure than PPP dollars-a-day. FEM, while it has problems too, is the best can-
didate available. Measurement does matter, to identify policies that are better, or worse, at reducing pov-
erty. But there are other big gaps in our understanding of absolute poverty, and why some places and
groups have proved bad at escaping it. Poverty profiles, etc., have identified welfare-type ways to help the
7
poor, and these can certainly help their productivity and independence too – better health and education
advance mobility and choice; social protection and health care enable people to take more production
risks; and so on. But there has been much less use of household data to explore the most promising direct
productivity-based paths out of poverty for the poor, especially in lagging areas. Hence the ‘poverty-
researching professions’ have a huge agenda, and with limited resources no scope for major distractions.
Slide 8. From gaps to priorities? Strange diversions of effort in the poverty-researching/reducing
professions 1: relative poverty (RP)
Why RP?
The wish to evaluate poverty ‘not absolutely’ is a misguided fruit, grown from some healthy roots:
(a) Inclusion: Poor’s lack of welfare may come from not keeping up with neighbours (happiness litera-
ture) and lack of inclusion/participation, which can be a lacked ‘capability’ as is nutrition. In OECD coun-
tries, with little severe absolute poverty, many families, especially children, face ‘social exclusion’ for
lack of sufficient resources to afford the time or commodities that provide entry to some key social groups
(Townsend). This has been the main inspiration of EU policy on social inclusion and UK emphasis on re-
ducing the proportion of children in relative poverty. But social exclusion should be attacked by getting,
to the excluded, opportunities paid for by taxing the rich, not those around the median income. The fight
against social exclusion and gross inequality cannot justify the measures of relative poverty now in use,
nor inattention to an absolute poverty line.
(b) Gross inequality - not just of opportunity, even outcome, but income, especially when not achieved
but ascribed (by inheritance, mutual remuneration committees, etc.) - is bad for justice, growth, happi-
ness, self-esteem, and (arithmetically as well as politically) for reducing (absolute) poverty. With re-
source-based/climate-constrained consumption growth slowdown, further advance, for the 1.4 bn still in
absolute poverty, must come more than in the past from inequality reduction;
(c) ‘No’ IC-poverty in OECD: v little basic-needs $1.25 PPP05, FEM or even $2PPP05 poverty left in
developed countries, and even in growing developing countries falling sharply; and savings experience
suggests that at $2PPP2005/day people can and do save; so how to sustain concern for the ‘relative de-
prived’ even when all >$2?
(d) Absolute national poverty lines tend to rise with mean income, reflecting a rising perception of ba-
sic needs. Ravallion and Chen, ‘Weakly relative poverty’, WBPRWP#4844, Feb 2009: ‘Across our sam-
ple of developing countries, the overall elasticity of the poverty line to mean consumption is around 0.7 -
close to the values found for developed countries’. But elasticity zero (absolute poverty line does not rise
with mean income) among 39 poorest countries [Ravallion, Chen and Shangri-La 2009, fig. 2]. Even in
less-poor countries, where it does, it reflects statisticians’ decisions based on each nation’s (elite) view of
its norm - not revealed preference or people’s own view of where poverty starts.
Poorest quintile? Measures of relative poverty stem from these concerns, but fail to capture them. An ex-
treme but common practice is to assess characteristics of people in lowest income quintile (or moving in
and out of that quintile) and to call them features of the poor (or transient poor). Obviously on that defini-
tion the relatively poor are always with us and are always one-fifth of population.
<x% mean? Then, if very rich and very poor prosper, relative poverty tends to rise!
<y% median? (df) In EU and some other OECD (though not USA where an absolute poverty line is
used) 60% of each country’s, contemporary median inc (per equivalised adult, which is good) is poverty
line.
[www.nscb.gov.ph/pov/TCPovStat/readg_materials/rioXG/Relative%20Pov%20Practices/RelPov_ES.pdf
Dennis 2003]: ‘Within the EU, the official indicator [of] pov [is proportion of consumer units below] 60%
of median income per consumer unit ..weight of 1.0 to the first adult, 0.5 to any other persons aged 14 or
over, and 0.3 to each child’. Other countries, and some OECD, have used 40% or 50%; others again have
keyed relative poverty to mean rather than median income, of course leading to much higher alleged ‘rela-

8
tive poverty’ incidence. In such cases ‘relative poverty’ is not necessarily always with us, provided
enough income is redistributed in the ‘right’ way to those below the relative poverty line. What’s wrong?
Arbitrary, jelly anchors: (1) No reason to prefer contemporary mean or median. The choice of either, as
a basis for income or consumption poverty measures, raises insuperable problems [Smeeding, Easton].
(2) If mean or median is clearly better, why choose any given %age of it as poverty line? ‘In Western
Europe in recent years … thresholds such as 50% or 60% of median or mean income [have been] used’
[Nolan and Whelan 2007: 151]. The different measures produce different results, not only for the numbers
and proportions claimed to be in relative poverty, but for trends, and for the ranking of different countries
and policies [e.g. Saunders and Smeeding 2002: Table 1]. So ‘dominance testing’ is often inconclusive –
country A or period T or policy P is associated with more relative poverty than B if the line is set at 40%
of the median, vice versa at 60%, or at 50% of the mean. (3) It isn't just that we are given no reason to
anchor ‘relative poverty’ at >60% rather than >40% or >70% of median or mean; it’s much more serious.
There is in principle no relative poverty line anchor, as BN, FEM, and expected-positive-saving equiv-
alised C or Y, provide anchors for an absolute poverty line.
Focus on wrong sort of inequality: RP, e.g. on the EU definition, directs us to the wrong sort of inequal-
ity: between those just below the contemporary poverty line (the just-poor) and those between (roughly)
median income and, say, 70% of median income (the modest). Taxing, say, 5% of the modest’s income
will not push them below 60% of median income, and will therefore not raise the numbers in EU-defined
relative poverty. Giving the tax yield to the just-poor, not far below the ‘60% of contemporary median’
relative-poverty line, will bring many of them above that line. Median income and therefore the poverty
line may well not change due to this redistribution, so relative poverty falls, perhaps a lot. On the other
hand, if the top 10% of the income distribution get even richer at the expense of those already below the
60%-of-contemporary-median poverty line, that increases next year’s ‘contemporary‘ median and may
actually reduce the measured numbers of relative poor!
Measuring and attacking relative poverty focuses on inequality between the modest and the poor. That is
(1) Not the sort of inequality that is most worrying. What’s taken off is (often self-awarded, soon inherit-
ed) income share of top 1% - the CEO-worker gap. The more this is, the more it (rather than low-end con-
centration) impedes, arithmetically and politically, poverty reduction, and perhaps growth. Focus on pov-
erty relative to 60% of median not only diverts from task of fighting absolute poverty, but also from task
of analyzing, and providing policies and incentives to cut, gross inequality. Wherever poverty line is set,
it’s ‘better’ to raise income of those below that line by transfer from the top 1%, than by transfer from
those just above the poverty line. Yet in practice definitions of relative poverty imply the opposite.
(2) Not a credible target for redistributive poverty reduction.
(3) If so used (rather than top-end inequality), with paradoxical result that making the benefits trap bite
(so that, as the poor earn 60%-80% median income, they lose benefits) makes measured relative poverty
less, impeding advances for those at 60-80% median income!
(4) Not of great concern to the poor. When did you last hear someone on 55% of median income say,
“What I feel excluded from is the capabilities of those on 65% of median income”? Don’t they rather re-
sent the self-awarded rewards of bankers or MPs, especially if not obviously brilliant, or the inherited in-
comes of the often idle children of the successful? If a ‘relative poverty anchor’ can be established – what
people relate to in considering themselves poor; what is the Smithian non-shame, or non-exclusion, stan-
dard – it may well have nothing to do with contemporary mean, median or anything else, but rather with
experience of the past, which is where notions of reference (including shame) have to be formed.
Don’t blame it on Smith! Contrary to the perceived view, Adam Smith did not advocate a relative-
poverty line as such. He argued that taxes on items perceived as ‘necessaries’ raised wages and hence
prices - and that perceived ‘necessaries’ were whatever custom deemed so, to avoid either physical want
or shame on grounds of ‘that disgraceful degree of poverty which, it is presumed, nobody can well fall
into without extreme bad conduct’. For 18th-century Europeans but not ancient Romans, ‘necessaries’ in-
cluded linen shirts. ‘[I]n the same manner, leather shoes [are necessary, by custom, for t]he poorest cred-
itable person [not to be] ashamed to appear in public .. In Scotland [they are] necessary .. to the lowest or-
der of men; but not .. of women .. In France they are necessaries neither to men nor to women, the lowest
rank of both sexes appearing [without them] publicly, without any discredit .. Under necessaries, there-

9
fore, I comprehend not only those things which nature, but those things which the established rules of de-
cency, have rendered necessary to the lowest rank of people. All other things I call luxuries … As the
wages of labour are everywhere regulated partly .. by the average price of .. necessar[ies], whatever raises
this average price must .. raise those wages so that the labourer may still be able to purchase that quantity
of [necessaries] .. A tax upon [them] .. must, therefore, occasion a rise in the wages of labour .. [The]
manufacturer will charge upon the price of his goods this rise of wages, together with a profit .. [T]axes
upon .. luxuries, even upon those of the poor .. [often] have no effect upon the wages of labour.’ Smith is
analysing the different effects of taxing different goods. He is not advocating, e.g. against absolute-
poverty concepts. Any sensible absolute basic-needs bundle, and certainly the bundle of things consumed
by someone just meeting FEM consumption, will certainly include that person’s shame-reducing (linen)
needs, if she is meeting her FEM needs. In no way does Smith’s argument justify defining poverty, in any
year, as household income per equivalised person below 60% of that year’s median. Don’t blame Smith,
or Amartya Sen’s superb analysis of poverty as lack of capabilities, for definitions that, even in OECD,
set absurd targets, produce damaging policies consistent with acting to impoverish the poor and enrich the
richest, and thus undermine the fight against both absolute poverty and widening or unjustified top-end
inequality: definitions now being tried even in countries with mass life-threatening absolute poverty
alongside burgeoning top-end incomes.
Weak RP better, but still odd results, and diversionary in poor countries: Ravallion and Chen,
‘Weakly relative poverty’, WBPRWP#4844, Feb 2009, have constructed a less objectionable indicator of
relative poverty – kicking in only when mean income exceeds $1.25PPP2005/person/ day, and even
above that level with a constraint that the indicator of relative poverty must fall if everyone’s income rises
by the same proportion. Nevertheless, on their measure, the incidence of relative poverty in South Asia in
1981-2005 rose from 61.6% to 62.3% - while absolute PPP$1.25 poverty fell from 59.4% to 40.3%. In a
region where in 1981 most people were in absolute poverty, and in such countries, as the authors have
shown, relative poverty contributes little to the setting of the poverty line, this is a very puzzling conclu-
sion. I doubt whether the relative-poverty concept can be rescued.
Absurd results for classic ‘EU’ relative poverty measure: (a) If everyone’s income doubles in a coun-
try, ‘relative’ poverty, so defined, doesn't fall. (b) Proportions below this year’s relative poverty line can
rise sharply, yet relative poverty fall. (c) A country where the poor consume half as much as another
country can have less relative poverty. ‘Most people are not experts on social statistics, but they know that
something must be wrong with a measurement that says the British are poorer than the Bulgarians … Ac-
cording to the Commission, Ireland has the highest poverty rate in the European Union and the figure is
increasing g. Yet Ireland has had a stellar record of g in jobs and income over the last 15 years. The stan-
dard of living for nearly everyone has increased since the early 1990s at a rate unprecedented in recent
European history. What’s the catch? Income growth has been slightly larger in the upper 80% of the
population than it has in the lower 20%’ [Beblavy et al. 2006].
Slide 9. Main RP measure (IC < 60% contemporary median) gives absurd results: example
Using the EU’s ‘60%’ RP definition - also the UK definition, as of child poverty – for some distributions
of income, and with no change in anyone’s income before tax and transfers, a government can slash “rela-
tive poverty” by making the richest richer, the poorest poorer, and pushing the 2008 median consumer be-
low the 2008 poverty line in 2009 – all this cuts the 2009 median with which people allegedly compare
themselves, and in this example slashes ‘RP’ from 46% to 12.5%. The
(1) imposing extra tax of half monthly income on households at the 2008 median, pushing them below
60% of that 2008 median in 2009;
(2) taxing the poorest households at 25%
(2) sharing the tax take among the richest households.
Redistribution from households somewhat above median poverty, sufficient to push them below the old
relative poverty line, has created a new line, with the effect of reducing relative poverty from 46% in
2008 to 12.5% in 2009.

10
If you think the above initial distribution is odd, I reply:
(1) If the Titanic is holed below the waterline, that's so however odd the hole; ditto for the EU/UK con-
cept of relative poverty, or any similar definition.
(2) I'm not sure that the family of distributions and policy effects IS all that odd. The big falls in "(rela-
tive) child poverty" in the UK in 1997-2005 accompanied - were due to? - very slow growth, if any, in
median post-tax incomes (alongside runaway growth in the incomes of the richest 1%). Policies in New
Zealand in 1980-95 substantially shifted income from the middle 40% of people to the top 20-25%, while
GDP-per-person grew little. Such policies tended significantly to reduce median, typical income. They
thus reduced the proportion of people having less than, say, 60% of that median. Thus policies increasing
inequality, consciously and perhaps deliberately, can and do claim credit for reducing poverty incidence
and depth relative to median income, even though the number of people below any plausible absolute in-
come cutoff, and their distance below that cutoff, have increased [Easton 2002].
Not hard to see appeal of ‘relative poverty’ measure to governments, especially in countries of OECD but
increasingly in countries in successful developing LAC/Asia. When such a country’s median income is
held back, by what are globally good things - technical progress cutting relative wage of non-tertiary-
educated, globalization cutting relative wage (in rich countries) of unskilled manufacturing workers and
call-centre operators – how can governments claim big advances against ‘poverty and inequality’? By
providing means-tested benefits to the poorest (which they lose as they approach the median), while ac-
cepting redistribution from current median-earners, mainly to the richest whose incomes race away. Next
year’s ‘contemporary’ median is pushed down relative to the income of the poorest; ‘relative poverty’ on
EU and similar measures falls. Governments spin this, sometimes as slashing poverty, sometimes as at-
tacking inequality, while in the important and hard-to-treat senses poverty at best falls sluggishly and ine-
quality explodes. But scholars should not support such spin.
Slide 10. Strange diversions 2: multidimensional poverty (MP)
Misery has several aspects. IC poverty is one aspect. Progress for deprived people means increasing
welfare and capabilities along several dimensions. Income or consumption (IC) adequacy is only one of
them, though usually a cause or consequence, and sometimes a precondition, for others. For instance, the
poor have worse health: Horace could not today claim: ‘For pallid death kicks in with equal power/The
pauper’s tavern and the prince’s tower’. Even in the UK ‘a boy born in Calton, Glasgow, lives on average,
28 years less than one born a few miles away in Lenzie’, and 11 years more if born in Hampstead, NW
London, than near St Pancras railway station two miles away [Times Online, ‘Report exposes post-code
lottery of life and death in the UK’, http://www.timesonline.co.uk/tol/news/uk/article4625123.ece 28-8-
08. In developing countries the differences are even larger, though they have been narrowing.
Interactions/separations/sequences of IC poverty with other dimensions of misery - illness, under-
education, exclusion - are key to improving each.
We lose information - and therefore understanding - by combining distinct deprivations and calling them
parts, or aspects, of one thing, poverty. Some income-rich people, places and groups are ill or under-
educated. Some income-poor people show ‘+ve deviance’ in nutrition, health, education, and/or political
rights and self-esteem. We need to understand how and why. We also need to learn about efficient se-
quences for reducing illfare and underfulfilment. When and where is more or better schooling the ‘best’,
most cost-effective path to raise the incomes of the poor? When and where is higher farm and food pro-
duction the best path out of income poverty? When and where is investment best divided between the two
paths? If we lump all evils into poverty, measured as a composite, we skirt the key questions. There are
three routes to MPMs.
Single ‘multidimensional measure’ of poverty (MPM). In fact there are strong complementarities be-
tween income, health, literacy, self-esteem and participation. Yet often such complementarities are weak-

11
ened – by household decisions or local/national policy (e.g. poverty much more ‘detached’ from bad edu-
cation in S India than in N India). So many people are IC-poor but healthy, IC-rich but unhealthy or illit-
erate, etc. An MPM, by ‘hoovering up’ other ills into ‘poverty’, hides the important questions. Who,
where, when, why are people - or countries - deprived in some dimensions but not others? How can
household, group, or public action help the IC poor to gain health or educational capabilities, or help
those lacking these to escape IC-poverty? How is IC-poverty causally linked to various sorts of ill-health
and under-education? Further, MPMs are arbitrary in what they include, what they exclude, and how they
weight. They create reams of paper, misemploy many bureaucrats, and fascinate some of the world’s best
economists. Yet two countries with the same MPM, e.g. human poverty index, can differ in a (literally)
infinite number of different ways, including endowments, capabilities or welfare. MPMs and other lump-
ing indexes of progress or stagnation have no logical basis. Have MPMs even propaganda value? Does
shame at low HDIs drives governments, or empower civil soc/NGOs, to more/better/more focused public
action? More than evidence of high IC poverty or cholera or illiteracy, which at least signals where action
is most needed?
Sets of ‘MPMs’ of evils? Some authors seek to present multidimensional poverty indicators without ag-
gregating them. The EU’s Luxemburg Income Study (apart from measuring trends in relative IC poverty
as defined by it) presents data for dimensions of poverty ‘deliberately presented individually with no at-
tempt to produce an overall score across the dimensions’, so as to avoid the problem of indices with
weights, inclusions and exclusions that are ‘arbitrary in fundamental and unavoidable ways’. Yet the
study then scores countries by the number of dimensions on which assorted proportions of the population
suffer shortfalls [Nolan and Whelan 2007: 149, 156], implicitly weighting the dimensions equally, and
excluded dimensions (goals) at zero. Back to a single MPM in disguise!
MPM ‘dominance’ tests: whether country X, or period T, is better that country Y or period S with re-
spect to numerous dimensions (goals) across all, or a wide range of plausible, weightings of goals – sel-
dom work; if they do, they at best provide rankings, not measures of difference, and not relative costs and
benefits. Batana and Duclos 2008 show urban areas almost universally dominating rural areas on multi-
dimensions within each of six West African countries, but otherwise I read the paper as rejecting ‘robust-
ness over aggregation procedures across dimensions of welfare, robustness over aggregation procedures
across individuals, and robustness over choices of multidimensional poverty lines’. But the main criticism
of this, as of other MPM approaches, is (a) why call the MPMs poverty? (b) why divert attention from
what’s really important for policy: interactions between, and good sequencing of, escapes from C-I pov-
erty, from undereducation, from ill-health and from other miseries?
MPM has woken us up to the many sources of misery. Now put it to sleep, and understand (and
cure) their interactions.
IC-poverty is itself a summary variable, with many dimensions – but a price weighting which at least re-
flects what people are willing to pay for more of each. For any person, etc., ‘consumption’ stands for a
particular amount of calories from rice, another amount of copies of a particular newspaper, etc. (‘Income
stands for all these, plus saving, or (for net dissavers) minus net borrowing.) Income is the level of the
constraint on a person’s, or a nation’s, material resources, and consumption is the level of the constraint
on current using-up of those resources. It makes no sense to combine a statement that a person or group
faces a particularly harsh level of that constraint - i.e. is income-poor or consumption-poor – with a state-
ment about how that person or group uses its income, or consumption, subject to that constraint. Income
and the way that it is used, separately but interactively, affect whether a person is education-poor or self-
esteem-poor. (There is a third component: the local ‘value’ and accessibility of publicly provided or sub-
sidised goods - clinics, schools, roads, law and order.)
Focusing on IC poverty does not mean neglecting other dimensions of misery: illness, under-education,
lack of rights or self-esteem, etc. All are linked to income/consumption poverty, and to each other, in a
complex web of causes and effects, often mutual. In some cases, little can be done to reduce either ill-
health or income poverty without more, or more accessible, or better, health activities - doctors or medi-
cines or health-seeking behaviour. For other times, places and groups, medical interventions will do little

12
for the health-deprived or the income-poor, in the absence of econ policies to raise income, or to change
its distribution. Health depends often, but not always, mainly on medical or personal health behaviour,
and poverty on econ policy and personal income decisions. But this neat ‘ministerial’ division does not
always work. (Later I shall argue that, in countries with widespread severe poverty, agricultural and ld
policy and progress are often the main determinants of poverty reduction.) These are empirical issues. The
answer is not always obvious. But the questions are crucial and answering them is made harder by lump-
ing together different forms of human misery and calling them ‘poverty’.
Slide 11. Strange diversion 3: household panel data [note attritive panels grossly, sometimes gro-
tesquely, understate social mobility, and the proportion of it comprised by churning]
Definition, rise: Panel surveys interview the same households (the panel) over several years, at intervals,
and track which households are IC-poor at the time of an interview (a ‘round’ of the panel), which escape
poverty between rounds, and which fall into poverty. There are now perhaps 100 well-conducted house-
hold panel surveys of poverty, as against hardly any 30 years ago. Many panel estimates in the excellent,
careful survey by [Dercon and Shapiro 2006:Table 2] report probability, not of moving into or out of pov-
erty, but of moving into or out of the lowest IC-quintile; this may say something about social mobility, but
not about anti-poverty policy. Yet the panels which do measure movement into and out of poverty, claim
to have much enriched our knowledge and understanding of poverty and how to reduce it.
Claims: 1. Though ‘results are imperfectly comparable … in most countries, over half the people a cross-
section may identify as poor, are transient poor, and a minority are chronically poor.’ (A transiently poor
person in this context is someone who is not poor in all periods, but only poor in some periods consid-
ered, while a chronically poor person is poor throughout the data period). YET A fine research centre’s
reports build on panel surveys to identify national-level chronic poverty, its causes and correlates [Chron-
ic Poverty Report 2008-9 http://www.chronicpov.org/pubfiles/Chapter_1.pdf ]. It concluded that around
2002 ‘at least [27-37% of the dollar-a-day poor] were chronically poor’5 – a wide range.
2. In Ethiopia 1989-94, ‘those moving in and out of poverty [differ, often statistically significantly, from]
those staying poor. Those moving out of poverty had [better or more] land, livestock … educated heads of
the household … roads, rainfall, … producer prices … household male labour supply’. More generally
‘those moving out of poverty tend to be able to rely on good endowments, in terms of assets such as land
and livestock, human capital and infrastructure’[ibid.]. In a range of panels, low capital, land and educa-
tion; lack of formal or non-farm work; large households; many children; births between rounds of the
panel; and young household heads are repeatedly associated with higher risk of falling into poverty, and
with lower chances of escaping it [ibid., Table 5]. The association of health risks on falling into poverty is
little studied, but where explored turns out to be strong.
3. ‘Those countries which respond most effectively to chronic poverty … have less than open political
systems – Ethiopia, Uganda and Vietnam … There is now a wealth of evidence that social protection is a
cost-effective means of reducing … chronic poverty … The chronically poor are often found in the re-
gions with the least agricultural potential and furthest from the main national markets. With poor transport
and communications infrastructure, they are effectively locked out of national growth processes and glob-
alization’.
Mostly known from cross-sections. Panels add little causal knowledge. All this sounds promising, but
so far we have learned disappointingly little from the panels. First, we knew these correlations from cross-
section surveys anyway. Second, the hope has been largely disappointed that household-specific, time-
series data would get from correlation to causation, resolving a problem that curses standard poverty pro-
files: when and where should policy focus on illness or undereducation as the cause of poverty, and when
and where on poverty (probably due mainly to landlessness and low farm productivity) as the reason why
the poor cannot afford health and education? Third, there is a deep reason for these disappointments.
5‘320-443 mn people’, measured when the 2002 dollar-poor (strictly $1.08PPP1993) were estimated at 1.2bn (prior to the new set of $ $1.25 PPP2005 estimates).

13
Though the panel effort was worthwhile and has yielded some advances, the panel procedure (and only
secondarily the methods of most of the specific surveys) inherently cannot meet the expectations raised.
Many claimed conclusions for poverty analysis and policy from panel data, including those above, and
most claimed policy implications, cannot be inferred from the panels. ‘More panels’ will not help. It is
time to re-group the research effort in poverty analysis. Why?
Ageing, increasingly atypical panel households: We cannot infer, from what is happening to chronic
vis-à-vis transient poverty in the panel, what is happening to it in the nation as a whole. Panel data tell us
only the proportion of the initial panel in chronic or transient poverty. If the initial panel of households
was typical of the population at the time, it becomes less and less typical of the population as time goes
by. For a start, the heads of the households in the panel grow one year older each year, as we all do. But
normally the average age of household heads in a country does not change, or rises by at most a few
weeks each year. Why does this increasing unrepresentativeness of the panel matter, in estimating chronic
and transient poverty? The period when a household has several small children, and perhaps only one
earning adult, carries special risk of transient poverty. As time goes by, the (ageing) panel becomes less
and less exposed to that risk – and therefore increasingly under-represents transient poverty in the popula-
tion as a whole. On the other hand, widows in many countries (though their average income is often
above the national average) have well above-average proportions of people in chronic poverty. As the
panel households age, they come to contain proportions of widows – and hence of chronically poor wid-
ows – rising much more rapidly than do the populations as a whole. In general, as time goes by, the com-
position of households in the panel increasingly diverges from the composition of households in the popu-
lation. There are ways of adding to the households in the panel over time to allow for this, but - cost apart
(fewer than 1 in 10 panel surveys does so: ibid.) - they make the panel data less useful for tracking chang-
es in particular households, or groups, over time. [Dercon et al. 2006: 5 of 50 panels were rotating [or v
short] notoriously difficult to use for clear inference on poverty dynamics … hard to disentangle … pov-
erty fluctuations and measurement error [and, specially with not-very-large samples, changes due to age-
ing household/head: synchronic v diachronic] from genuine poverty mobility’.
Short panels prove little: Most panels still have only two or three rounds, and in 2/3 of cases these are
fewer than 5 years apart [ibid., Table A.1]; telling us the proportion of ever-poor who were sometimes not
poor, and calling them ‘transient poor’, tells us very little if the panel had only two rounds separated by at
most 4 years. Comparing panels with different durations and numbers of rounds, and drawing inferences
about transience or permanence (or moving in or out) of poverty let alone its causes, is invalid, as are such
inferences from a time-series covering only 2-4 years.
Especially with small changes and churning prevalent: Most households moving into, or out of, pov-
erty in 1-3 years (or even 5-6 years) do not change their income or consumption much, except in dramati-
cally growing areas such as urban SW China. Most households move from just below the poverty line to
just above, or vice versa. Strong interpretations of very small changes are doubtful especially sue to the
prevalence, as shown by longer panels, of “churning”. Suppose that, given the poverty line in 2000, exact-
ly and only the lowest three deciles of panel households in 2000 are poor. Suppose also that by 2005 half
the households who in 2000 had been in the decile just below the poverty line have moved into the decile
just above it, whereas only a quarter of the households which in 2000 had been in the decile just above the
poverty line have in 2005 slipped into poverty. We can be confident, from panels with more frequent
rounds and over longer periods, that many of the households who had moved into, or out of, poverty be-
tween 2000 and 2005 will have ‘churned’ above and below the poverty line several times before 2000, be-
tween 2000 and 2005, and/or after 2005.
Yet long household panels wounded by attrition bias – and non-sameness of ‘the same’ household:
the more the rounds, and the longer the interval between rounds, the more unrepresentative does the panel
become, and the higher is the drop-out rate of households from the panel through death or other attrition
(see below). Even more fundamentally, it is unclear what ‘a household’, let alone a panel of ‘the same
households’ over, say, above 10 years means: most households will have substantially changed member-
ship, split or disappeared. Beegle, de Weerdt and Dercon [2008] argue that only panels of individuals
14
make sense over long periods. That’s certainly true if we want to understand life-course or inherited pov-
erty – cohort data needed.
The problem of attrition is severe, and biases the reports of transient vs chronic poverty (and of their
causes) in serious ways and to unknown extents. “Respondents’ selective refusal to participate … ac-
counts for much attrition in industrialized countries but … in developing countries … inability to track
households plays a more important role” [Beegle at al 2008]. 10-15% attrition per year is not unusual.
‘Attriting’ households seem much likelier to have died of/migrated into or out of poverty than households
that stay in the panel. Beegle et al [2008] strongly confirm this in a Tanzanian panel by carefully tracking
sampled households that have moved from the village, and show that this hugely increases estimated
movement out of poverty, and the estimated extent to which that is due to successful migration towards
non-farm work. Tracing households that broke up or died without migrating, or that moved to other rural
areas, would presumably find more households that also moved into poverty: ‘basic needs poverty rate
declined 8% [Well above non-panel sample national rate: ageing?] … While for those found residing in
the baseline community poverty rates dropped by 4%, they dropped 11, 13 and 23% for those who moved
to neighbouring communities, elsewhere in Kagera and outside the Kagera Region respectively [age-
comp?]’ Very few panel studies do such tracking, perhaps for lack of time or resources, so most panels
grossly underestimate mobility into and out of poverty, and misreport its causes in large and indetermi-
nate ways.
An important use of panel data has been to cast light on Ravallion’s concept of ‘spatial poverty traps’.
Cross-sec data show that in some regions (a) being poorer households is strongly associated with low lev-
els of education, which impede promising avenues both of progress at home and of migration elsewhere;
(b) there is much less (and/or much worse) free or inexpensive schooling in regions with many poor
households than in other regions of the same country. The cross-section data usually leave the directions
of causation unclear: are poor people, and poor regions, poor because uneducated or uneducated because
poor? Panel data are sometimes supposed to add information about spatial poverty traps by tracking pov-
erty, and escape from it, in households in different regions ‘before and after’ improvements either in
school provision or in the household’s uptake of it. The addition of information is doubtful if panel
households, during the panel, become much less representative of the populations of the regions and na-
tions as a whole – and suffer sharp attrition.
Is chronic poverty, even if identified by panels, ‘worse’ or ‘needing more policy focus/different ac-
tions from transient poverty’? Given the ‘amount’ of total poverty, there may well be no clear gains -
indeed there may be losses - from reducing chronicity. Should policy focus on the chronic poor? Maybe
not. (1) Av depth of transient poverty is often, perhaps usually, greater than the average depth of chronic
poverty – almost certainly in very low-income areas with a ‘severe’ poverty line: people cannot survive
chronically far below that line. (2) Households often become transient-poor for reasons making them es-
pecially vulnerable to further shocks: illness of main earner, unemployment, crop failure, twins. Steering
resources away from reducing such poverty, to concentrate them on the chronic poor, would harm (a) the
poorest of the poor, (b) people when they are most vulnerable and least resilient, perhaps making their
transient poverty permanent. (3) Maybe more cost-effective to help transient poor given depth of poverty
(e.g. seasonal public works). (4) More fundamentally, given the amount of poverty, should governments
concentrate anti-poverty resources on cutting chronicity? Given the trend in absolute poverty, should (and
can) governments stimulate or reduce turnover, e.g. if headcount povertyequal. 25 is it ‘better’ for every-
one to be poor for 3 months per year? Andy Warhol claimed to want a world where everyone is famous
for fifteen minutes; given a country’s incidence and depth of poverty, is it best for such poverty to move
around households, so that for every household it is transient and for none chronic – i.e. all households
are vulnerable, precarious? A policy focus on chronic poverty, rather than ‘wasting’ resources on transient
poverty, might be sought, using panel surveys to identify the chronic poor among the poor. However,
even if panel surveys can reliably identify ways to do that, the policy approach may be ill-advised.
Some new knowledge from panels, but … Panels are far from useless! Non-panel poverty data show
that larger households, and households with higher child/adult ratios, tend to be poor; it adds some info to
learn (as we may from panels) that an extra childbirth increases a household’s risk of subsequently falling
into poverty between panel rounds, and cuts its capacity to maintain above-poverty income or consump-

15
tion in face of typical recessions/adjustments between panel rounds. The point is not to decry such new
knowledge, but to stay open on whether it can be inferred from panels, which have raised false expecta-
tions. To know what is happening to a country’s poverty incidence and depth, and to the composition and
regional distribution of poor (or very poor, or non-poor) households, one needs random country-wide
sample surveys at different dates. Getting those bigger, better, more integrated with intensive micro-
surveys, and more analyzed matters more, now, than more panel surveys.
Conclusion: redirect poverty research and action away from the Three Diversions. But to what?
Slide 12. The new context requires new research and action: inequality and poverty
[Ferreria and Ravallion 2009]:
Within-nation IC inequality rising 30 of 49 countries with data, including big ones (India, China, Rus-
sia, USA) show Gini rising 1990s-2000s, 13 falls, 6 no change (+/- 2.5%) .. consistent with much other
evidence.
Yet durably very unequal countries grow slowly and keep gains from poor. ‘[For 130 countries in
1995-2005] the high-income economies .. record the lowest inequality measures, and SSA and LAC the
highest .. -ve correlation between inequality and GDP per capita (rsq equal −0.44, sig at 1%) .. No country
has successfully developed beyond middle-income status [and ‘Above a GNP/hd c. $15,000 p.a., extreme
absolute poverty essentially vanishes’] while retaining very high IC inequality. High inequality (a Gini
above 0.5, say) is a feature of underdevelopment’. This keeps IC growth from the poor (i) ex post:
>$12,000/hd GDP, huge variation in IC poverty given mean inc. ‘Around $2,000, one can find countries
with the same per capita income levels reporting IC poverty from zero to 65%, due to differences in ine-
quality’; (ii) in process: big inter-country variation in gpoverty ‘to do both with initial inequality and
with changes in that level’ (i.e. on the ‘incidence’ of econ g)’ …. Cross-sec, g good for poor, yet ‘[In
1981-2005] 1% g in inc/hd4% fall in headcount IC absolute poverty for countries with Gini indices in
the mid-20s, but for countries with a Gini index of about 0.60 1% g of inc/hdfall in IC abs poverty near
zero.’ [Not just arithmetic – low inequalityclustering near poverty line – but politics: above a certain
Gini the rich can see to it that they get MORE of extra than of extant GDP. ‘The higher initial inequality
in a country or the greater [its] increase .. the [faster is] g needed to achieve any given rate of poverty re-
duction’
Among-nation fall in inequality partial, perhaps reversing, antidote: Falling (population-weighted)
between-country inequality 1960-2000 ( poverty down): Asia-only [still rising if India and China are
excluded]; and outweighed by rising within-country inequality, so rise in ‘global inter-household ine-
quality’
‘Horizontal’ within-country inequality (Stewart), if high/rising, worsens poverty by instability due to
ethnic/regional tensions, especially if high initial poverty cuts options for soldiers, raises attractiveness of
returns from rebels/coupists (Collier).
Demographic inequality and IC-inequality mutually reinforcing to slow down growth and its con-
version into poverty reductionpossibility of remedial virtuous circle: worse-performing Indian
States (Cassen), Asian countries (Bloom etc), tend to combine lower-mean-IC, higher-IC-poverty, slower
growth and poverty reduction, and bad demographics: higher, and later/slower-falling [child mortality,
female disadvantage, family-planning disadvantage] high fertilityhigh dependency]poverty. EL,
for 45 developing/transitional countries: fertility (CBR-IMR) raises IC poverty by retarding economic
growth and by skewing distribution against the poor. The average country in 1980 had 18.9% IC-poor;
had it only reduced fertility by 5 per 1000 throughout the 1980s (as did many Asian countries), this figure
would have been reduced to 12.6% by 1990: effects via growth and via distribution are about the same.
Poverty reduction can rely less on growth in next 40 years than in last 40, i.e. must depend more on
inequality reduction, despite past inequality rise - and severe inequality in some, not all, poverty-
persistent places (E, S but not W, Cent SSA). (1) Long-left-out regions (among and within nations) sys-
tematically harder to grow? (demographics, resource base, connectedness, socio-political structure, late-

16
coming). (2) World faces slower growth mainly due to climate change, soil/mineral depletion (including
SSA’s major net NPK loss) and other threats to sustainability (especially water). Linked to rising relative
price of energy, maybe food; long, deep world recession and rising governmental and private risk aver-
sion. Low asset inequality, and (in developing countries where much income is ascribed) IC inequali-
ty, slower growth (E/S SSA), and low poverty reduction given growth (Benabou, Barro, Birdsall.)
These strong macro-findings largely depend on dubious cross-national regressions. Household, vil-
lage, town poverty analysis needed, to understand underlying decisions and interactions.
Slide 13. The new context requires new research and action: farms and land
Farms (especially if small) are labour-intensive (much main income source for poor; 75% rural; even
rural non-farm emp-g depends mainly on prior g of farm income and cons demand) and food-focused
(65%+ of consumption below $1.25 line comprises food), ‘sectoral composition of growth does seem to
matter for poverty reduction’ (Ferreira and Ravallion). An $100 of extra GDP from agriculture is usu-
ally much more pro-poor than from non-ag. This is is a very strong effect in China (Montalvo and Raval-
lion 2008); Indonesia (Thorbecke and Jung 1996), mostly due to employment effects; India (Datt and
Ravallion 1998a,b) where ‘over places and times, faster agricultural growth is substantially beneficial for
both rural and urban poverty reduction, services growth moderately so, and industrial growth ineffectual
[Eastwood and Lipton 2000]. Timmer hypothesised that this works best in low-inequality countries and
indeed it seems not to work in LAC where ag not only unequal-land but also highly-distorted/low-
labour-use and slow-TFP-growth (across LAC neither agricultural nor indl g, but only service sector g,
produces statistically sig. gains for either U or R poor: de Janvry and Sadoulet 2000). But growth in agri-
culture is also 3-4x more pro-poor than growth in nonag in one of Asia’s most unequal countries, Philip-
pines (Kakwani (2001))6. In high-inequality Zambia extra GDP from ag, esp staples, associated with
much more poverty reduction than in industry (Thurlow and Wobst 2007). Khan (1999) applies Thor-
becke and Jung’s methods to S Africa, one of the world’s most unequal countries (and ags), and finds that
g produces most poverty reduction if it is agricultural. A study (Bourguignon and Morrisson 1998) con-
fined to small and medium developing countries [confirming that] agricultural growth is the most pro-
poor. ‘All the studies in individual low-income countries … confirm the “common sense” expectation that
agricultural growth is more pro-poor than non-agricultural growth [but not in mid-income Brazil: Ferreira
et al. 2007]. Perhaps the contrary results [in a minority of] cross-national data analyses of “unequal” de-
veloping countries] are due in part to problems of method’ Eastwood and Lipton 2000).
The famous inverse relationship between farm size and farm output per hectare in developing countries
(IR) helps! Massive evidence of IR alongside increasing land scarcity ‘helps’ consistency between growth
and poverty reduction in early small-farm-based development. Land inequality crowds land into larger
farms, with high L-supervision costs, much less L/ha, and in K-scarce developing countries less
Q/ha (Lipton LR book), helping to explain macro-evidence that high land (and education) inequality
(more than income inequality) slows economic growth AS WELL AS impact of given growth on poverty
reduction. In most SSA and Asian countries, land share in small farms is rising, partly on efficiency
grounds, but, alarmingly, within ‘Ethiopia, Kenya, Rwanda, Mozambique, and Zambia .. land distribution
within the small-farm sector [is] getting more concentrated’ (Jayne et al. 2003). In S Africa extreme land
inequality combines with very high genuine unemployment (living off remittances and pensions) to create
– as in LAC – far higher pov, given mean GDP, than typifies Asia and most of SSA, AND to retard agri-
cultural growth. Note also (a) pro-poor impact of agricultural research [Mathur and Pachico (eds. 2003)],
(b) in India and China both growth returns and poverty-reducing returns per extra $ on a range of agricul-
ture-linked inputs – research, irrign, rural roads – have become higher in many poorer regions than in the
most advanced areas (Fan et al 2000; Fan and Zhang 2000a), (c) much past land reform with good
growth-poverty results.
The green revolution has proved pro-poor, freeing wage-goods, forex, labour, skills, and non-farm
demand for wider GDP growth later (Asia 1976-99): productivity-led, not-too-unequal agricultural
frowth has been main initiator/preceder of economic growth and poverty reduction. Green revolution in
6elasticity of the pov gap ratio is -1.12 with respect to agricultural growth, but only -0.34 for services growth, and -0.25 for indl growth

17
Asia provided broad-based source for initially poor of higher farm, rural nonfarm and urban food-buyer
incomes, and preceded/enabled migratory de-agriculturisation, where success a major source of poverty
reduction (Dercon on Tanzania) but not if ‘premature’ as in S Africa (Eastwood, Kirsten and Lipton).
Demographic transition interwoven with agriculture-led growth. [Poor’s gains depend on their get-
ting fertility falls faster than labour-supply fallsdependency ratio falls while D(L) continues rising] Asia’s not-too-unequal land start, or land reform, helped.
Harder in poverty heartlands (water, soil nutrients, climate).
SSA needs unprejudiced irrigation/fertility/seed thrust for pro-poor g
Does (non-financial) globalizationfast pro-poor growth? If, and only if, small-farm-based ag
transformation happens first! [Land inequality harder for poor to adjust to food price fluctuations]
We ‘know’ this from macro-outcomes; household/village research, transcending 3 diversions, must
study the micro-decisions.
An emerging ‘narrative’ links agricultural takeoff, low land inequality, decelerating population, fal-
ling ratios of children to workers, reduced resource depletion, rapid reduction of absolute IC pov-
erty, and growth (though probably slower than in 1980-2005). The causality among changes in
population, resources, food, education, growth, distribution and poverty – the ‘Malthus module’ -
is ‘too’ complex and intertwined for a general solution (economics, unlike physics, is too backward
to move from the narrative to a general theory of everything), but we have some tested bits of the-
ory, many advancing and some refuting Malthus’s own. Poverty studies need to revert to sorting
out these interactions at household and community level, and to get away from the diversions.
AUXILIARY NOTES
Yes, it’s poor households that successfully migrate from agriculture that have best chance to escape pov-
erty (Dercon); but this either requires prior agricultural growth (and areas getting it indeed tended to do
better for the poor), or is at expense of others entering poverty. In low/middle-income countries
The issue of food prices, ag g and pov reduction
Food Prices, Agricultural Development and Pov Presentation to the Conference “The immoral biofuel?”
Royal Swedish Academy for Ag and Forestry Stockholm, 23 October 2008 Alan Matthews Professor of
European Agricultural Policy Trinity College Dublin Ireland [email protected] At
http://www.tcd.ie/Economics/staff/amtthews/Personal/Papers/Matthews%20Food%20prices%20and%20p
ov.pdf
Five-person household livg in Bangladesh on $1/day per person spends its $5
– $3 on food,, $0.50 on household energy, $1.50 on non-foods
• A 50% increase in food and energy prices cuts $1.75 from their expenditures
• Food expenditures will be cut most, and will be accompanied by Reduced diet quality Increased
microutrient malnutrition, increasg probability of developmental damage Based on von Braun (2008)
• Impact depends on the extent to which international prices pass through to domestic mkts
– Exchange rate appreciation against the US$
– Policy instruments to insulate domestic prices from international mkts
• Government procurement, trade msres
• Different countries adopted different policies
• Impact (on producers) also depends on competitiveness and length of the domestic mktg chain
• Ivanic and Martin (2008): pass through rate of 0.66 leads to increase of 105 mn in pov, pass-through rate
of 0.33 to an increase of 45 mn.

18
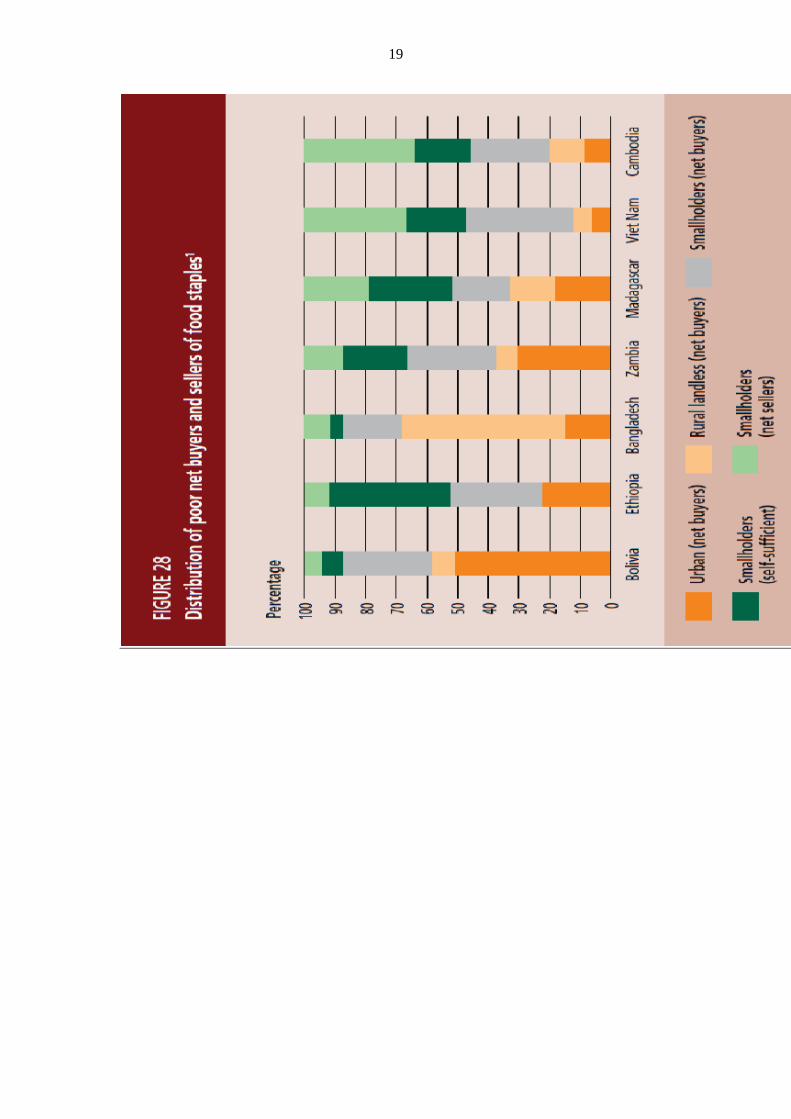
19
20
citg Barrett, Food Policy 2008, on E and S Africa:
• A large share of smallholders – commonly the majority – are net buyers of the food crops they produce
– Household not autarchic, but sellers and buyers at different times of year or of a% of their sup-
plies/needs
• Most small fms in the region are hurt, not helped, by policies that increase local prices for staple grains
• “.. policymakers and many devel rschers continue to discuss devel policy for rural Africa as if all fmrs
were net sellers of the crops they produce and thus stood to benefit from increased prices. The evidence
against that popular belief is by now overwhelmg.” Aksoy and Isik-Dikmelik (2008)
– Based on:surveys for nine countries, agrees there are more poor net food buyers than sellers
– But suggests that half these households are marginal net food sellers, thus price increases will have
small impacts on their welfare
– Notes that the average incomes are net food buyers are higher than the average incomes of net food
sellers, so higher food prices transfer income from rich buyers to poorer sellers and thus are ‘pro-poor’.
– Note that policies of low food prices in developing countries (e.g. through rural taxation) penalised
ag to the detriment of overall economic growth
Household pov impacts – longer run
• What happens when substitution and behavioural responses are taken into account?
• Could +ve labour mkt effects (increased demand for labour) overcome the -ve impact of higher food
prices on the purchasg power of the rural poor?
– YES (Ravillion 1990 study for rice in Bangladesh)
• Can farm productivity increase in response to increase in price of food staples?
• How important are the multiplier effects of increased farm incomes for rural businesses?
• Methodology of choice is Computable General Equilibrium analysis but constrained by severe
methodological and data issues in linkg macro-micro models [Long run: Usg a partial equilibrium ap-
proach … policies leadg to higher food prices are likely to increase pov, even after factorg in countervailg
wage and productivity effects Christiaensen and Demery (2007) Down to Earth, WB]
Ivanic and Martin (2008)
– Study first-order welfare impacts (including wage effects) in ten countries for range of commodities
– Overall impact of higher food prices on pov is generally adverse
– Extrapolatg (heroically!) from the average%age point increase in pov rates in the sample, they conclude
that the actual incrse in fd prs 2005-early 2008 may have led to incrse in global pov of 105 mn
-- BUT in India Usg CGE approach, higher rice prices benefit most poor households, with labour mkts
playg a largely +ve role in transmittg price effects. Similar if more muted effects for wheat: Polaski
(2008)
Letter to Dana Dalrymple
1. People everywhere say much the same if asked what ‘beg very poor’ means: havg so little income as to
prevent access to the basic needs for a decent life. The pioneers of pov analysis and anti-pov policymakg
in Britain - and their successors in today’s low-income countries - msred the trends in numbers and sever-
ity of absolute pov, and asked: are the absolute poor young or old, female or male, farmers or factory
workers? What characteristics of people, and what policy options, cut absolute pov? We need much better
answers, though we have more facts on absolute pov, world-wide, than ever before.
2. Yet academics and policymakers have turned away from absolute pov - income too small to permit sat-
isfaction of basic needs. In developed countries they emphasise relative pov; in developing countries,
multi-dimensional msres of deprivn - of health, educn, self-esteem, gender rights, etc. as well as income.
These emphases, now the conventional wisdom, are harmful for two reasons. First, the goals of reducg
inequality, ill-health, social exclusion, oppression of women, etc. are so important that they deserve
msrement and policy analysis as such, not lumped together with absolute pov. Second, absolute income
pov in the harshest sense (dollar-a-day, normally too little to expect adequate nutrn) still affects well over
a bn people; in Africa the numbers are risg. With a slightly less harsh pov line, two dollars a day (below
which savg is normally zero), pov is also significant in the former Soviet Union and Eastern Europe, and

21
non-negligible even in OECD countries.
M. Rvln, ‘Growth, inequality and pov: lookg beyond averages’, WB PRWP#2558, Feb 2001, http://www-
wds.worldbank.org/servlet/WDSContentServer/WDSP/IB/2001/03/26/000094946_01031305310627/Ren
dered/PDF/multi0page.pdf
Some clues have been found by comparg rates of pov reduction across states of India, for which we can
compile a long series of reasonably comparable survey data back to about 1960. The analyses of these da-
ta confirm that economic growth has tended to reduce pov in India. Higher average farm yields, higher
public spending on development, higher (urban and rural) non-farm output and lower infln were all pov
reducg (Rvln and Datt, 1999). However, the response of pov to non-farm output growth in India has var-
ied significantly between states. The differences reflected systematic differences in initial condns. Low
farm productivity, low rural livg standards relative to urban areas and poor basic educn all inhibited the
prospects of the poor participatg in growth of the non-farm sector. Rural and human resource develop-
ment appear to be strongly synergistic with pov reduction though an expanding non-farm econ.
p. 608: per-person vs per-AE in measurg pove: [Scale ecs in cons and lower kid needs] led many analysts
to use some msre of ‘equivalent income’ as their welf indicator for each household. However, these vari-
ables turn out to be quite sensitive to the different assumptions made in identifyg specific equivalence
scales from observed demand behavior, and there is no agreement on which particular scale should be
used.7 There is likely to be more agreement, in fact, with the statement that different scales may be ap-
propriate for different settgs (such as, say, South Korea and Togo). All this implies that seekg to introduce
sensitivity to household size and composion in the context of internnal comparisons is, given the present
state of knowledge, likely to contribute to less, not more, clarity.
Inequality and pov: R.K. Eastwood and Michael Lipton, Asian Development Review, 2 (2000).… macro-
evidence that high inequality of assets, rather than incomes, slows down econ g; and that, though £1 of
extra GDP from ag usually does more to cut pov than £1 of ‘other’ g, this works far less in Latin America
due to its great ld inequality, even long after ag has become a small part of GNP. {note SEPARATE Ha-
zell-Fan qn of whether £1 more govt exp or inve does more fror pov, via g and via dist, in ag or else-
where}. [Unequal holdgs mean more ld in larger holdgs and hence less employment, and more capital,
per hectare.] See de Janvry on this, and the relevant parts of ‘Pro-poor g and pro-growth pov reduction:
meang, evidence and policy implicns’.
Ag, smlhldrs and pro-poor g
The case study on Zambia (The Role of Ag in Pro-Poor g: Lessons from Zambia: James Thurlow and Pe-
ter Wobst, in Determinants of Pro-Poor g: Analytical Issues and Findings from Country Cases by Stephen
Klasen (Editor), Michael Grimm (Editor), Andy McKay) aims to contribute in particular to the debate
whether ag should be favoured relative to ind when pro-poor g is the declared objective. Hence, the au-
thors analyse the ability of the food and export crop sectors to generate pro-poor g. Similar trade-offs
arose in the case studies on Burkina Faso, Ghana and Indonesia. The Zambian case is, however, particu-
larly interestg, first because it has more potential for agricultural g than many other countries, although
that potential is not evenly distributed within the country and has been periodically undermined by fluc-
tuns in weather patterns and world commodity prices. Secondly, Zambia has substantial mineral re-
sources, which offer also a potential for g outside ag. Thirdly, Zambia has low agricultural productivity
but a large rural populn and agricultural sector, although the sector is smaller than the SSAn av. Fourthly,
Zambia has a liberalized tradg regime but is ldlocked within central Southern Africa. Fifth, it is among
the SSAn countries with particularly high inequality (see Table 1.1). Finally, like many SSAn countries,
Zambia is politically stable but suffers from corruption and generally poor governance. Zambia’s initial
condns are therefore not biased in favour of either ag or ind, and reflect many of the opportunities and
constraints facg many other African countries. When lookg at the past the authors find that Zambia un-

22
derwent significant changes in the structure of econ g, with ag and ind playg important roles at different
stages. The rsltg shifts in the income distribn have had important implicns for the effectiveness of g in re-
ducg pov. Similar to the Bolivian case study, the authors then use a general equilibrium model combined
with household survey data to assess how acceleratg g in alternative sectors could influence the rate of
pov reduction in the future. The authors show that indl g in Zambia is not strongly pro-poor, implyg that
recent g may not generate broad-based pov reduction. Rather, it is agricultural g, especially in staple
crops, that would contribute most effectively to pov reduction.
Interacting pro-ag and pro-small in antipov policy
Smallholder income and ld distribn in Africa: implicns for pov reduction strategies T.S. Jayne, Takashi
Yamano, Michael T. Weber, David Tschirley, Rui Benfica, Antony Chapoto, Ballard Zulu
Food Policy 28 (2003) 253–275
Abstract
This paper provides a micro-level foundn for discussions of ld allocn and its reln to income pov within
the smallholder sectors of Eastern and Southern Africa. Rslts are drawn from nnally-representative
household surveys between 1990 and 2000 in five countries: Ethiopia, Kenya, Rwanda, Mozambique, and
Zambia. The paper shows that farm sizes are declg over time; that roughly a quarter of the agricultural
households in each country are virtually ldless, controllg less than 0.10 hectares per capita, including
rented ld; that non-farm income shares are below 40% even for the households in the bottom ld quartile;
and that because of this, there is a strong relnship between access to ld and household income, particularly
for farm sizes below 1.0 hectares per capita. Ld distribn within these small-farm sectors appears to be
becomg more concentrated over time, and their Gini coefficients are comparable to those of many Asian
countries at the time of their green revolutions. Lastly, the largest part of the varin in per capita farm sizes
within the small-farm sectors is, in every country, predominantly within-village rather than
betweenvillage.
Realistic discussions of pov allevin strategies in Africa need to be grounded in the context of these ld
distribn patterns and trends….
The findings presented in this paper hold several implicns for the design of pov reduction strategies. The
first relates to targetg the poor. While some areas experience significantly higher rates of pov than other
areas, the findings from these five countries—Ethiopia, Kenya, Mozambique, Rwanda, and Zambia—
suggest that income pov among smallholder households is not primarily a geographic phenomenon. Most
of the varins in smallholder incomes tend to be within-village rather than between village. This has
implicns for targetg vulnerable groups, assumg that income is the basis for targetg. Geographically-based
pov reduction strategies—e.g. focusg on marginal areas—are likely to miss a large fraction of the poor in
any particular country.12 Targetg of vulnerable, resource poor households requires greater emphasis on
intra-community targetg, as a complement to regional targetg. Within villages, households with small
farm sizes and low educn are especially likely to be at the low end of the income distribn.
In the long run, there is probably no substitute to broad based agricultural g in primarily agrarian societies
to appreciably lift the poor—who tend to be widely scattered geographically—out of pov… The bottom
25% of rural agricultural households are virtually ldless, havg access to 0.10 hectares per capita or less in
each country examined. Notwithstanding our earlier conclusion about the importance of agricultural
growth, under existi ng condns the ability of this bottom ld quartile to escape from pov directly through
agricultural productivity g is constrained by their limited access to ld and other resources. Viewed in a
static way, one could conclude that the only way out of pov for the severely ld-constrained rural poor is to
increase their access to ld. Viewed within a dynamic structural transformn framework, this group’s
brightest prospect for escape from pov may involve beg pulled off the farm into productive non-farm sec-
tors. Abundant evidence of the transformn process elsewhere indicates that g in non-farm sectors typically
starts from a robust stimulus to ag, which generates rural
purchasg power fo r goods and services. Durg this process, there will be high payoffs to educn, as the
most highly skilled households have the best access to the well-payg non-farm jobs. Therefore, while
greater equity in ld holdg is key to rural pov reduction in the short run, an important long run goal may be

23
to move the rural poor out of ag and into skilled off-farm jobs through investments and policies that sup-
port the processes of structural transformn (271-2)
p. 255: not only does the initial distribn of assets affect the rate of econ g, but it also affects the pov-
reducg effects of the g that does occur. For example, Rvln and Datt (2002) found that the initial%age of
ldless households significantly affected the elasticity of pov to non-farm output in India. In a sample of 69
countries (Gugerty and Timmer, 1999) found that, in countries with an initial “good” distribn of assets,
both agricultural and non-agricultural g benefitted the poorest households
slightly more in%age terms. In countries with a “bad” distribn of assets, however, econ g was skewed to-
ward wealthier households, causg the gap between rich and poor to widen. [not SA – Becker. Depends on
employment-income effects!] It is especially noteworthy that in this latter group of countries, agricultural
g was associated with greater increases in inequality than was non-agricultural g. This reverses what has
been considered the more typical pattern, wherein agricultural g is seen to contribute more to overty re-
duction than g outside the agricultural sector. These findings reinforce the idea that where access to ld is
highly concentrated and where a sizable part of the rural populn lack suffic ld or educn to earn a liveli-
hood, then special msres will be necessary to tackle the problem of persistent pov.
M. Ravallion, ‘Growth, inequality and pov: lookg beyond averages’, WB PRWP#2558, Feb 2001, http-
www.wds.worldbank.org/servlet/WDSContentServer/WDSP/IB/2001/03/26/000094946_0103130531062
7/Rendered/PDF/multi0page.pdf
Some clues have been found by comparg rates of pov reduction across states of India, for which we can
compile a long series of reasonably comparable survey data back to about 1960. The analyses of these da-
ta confirm that economic growth has tended to reduce pov in India. Higher average farm yields, higher
public spending on development, higher (urban and rural) non-farm output and lower infln were all pov
reducg (Rvln and Datt, 1999). However, the response of pov to non-farm output growth in India has var-
ied significantly between states. The differences reflected systematic differences in initial condns. Low
farm productivity, low rural livg standards relative to urban areas and poor basic educn all inhibited the
prospects of the poor participatg in growth of the non-farm sector. Rural and human resource develop-
ment appear to be strongly synergistic with pov reduction though an expanding non-farm econ.
Excluded: When we compare rel-pov and (some sort of) abs-pov data, we get very interestiong contrasts.
UK and Euro rel pov: Households Below Av Income An analysis of the income distribn 1994/95 –
2006/07 UK: Office of Nnal Stats June 2008, acsd 30 Apr 2009
http://www.dwp.gov.uk/asd/hbai/hbai2007/pdf_files/full_hbai08.pdf
Table 3.1tr, p. 40: very interestg compsion of trends in%s below 60% contemp median income (rel
povline) and <60% 1998-9 median equivalised household income (a sort of v generous abs pov line).
Relative poverty: below 60% of contemporary (each year’s) median inc per equivalised consumer unit:
Before housing costs 1979 13%, 1990-2 22%, 1998-9 19%, 2006-7 18%.
After housing costs 15% 25% 24% 22%
Below 60% of 1998-9 median inc per eqvlised cons unit@
Bhc 1979 33 (17.7m) 26 19 12 (6.9m)
Ahc 35 (18.8m) 28 24 14 (8.6m)
Thus the% in ‘relative pov’ is half as high again in 2006-7 as in 1979, but the% in (a very high standard
of) ‘absolute pov’ fell and in 2006-7 is far below half the 1979 level!