Embed Size (px)
Citation preview
YEARBOOK OF FOOD ND AGRICULTURAL STATISTICS 1955
Volume IX, Part 1 - PRODUCTION
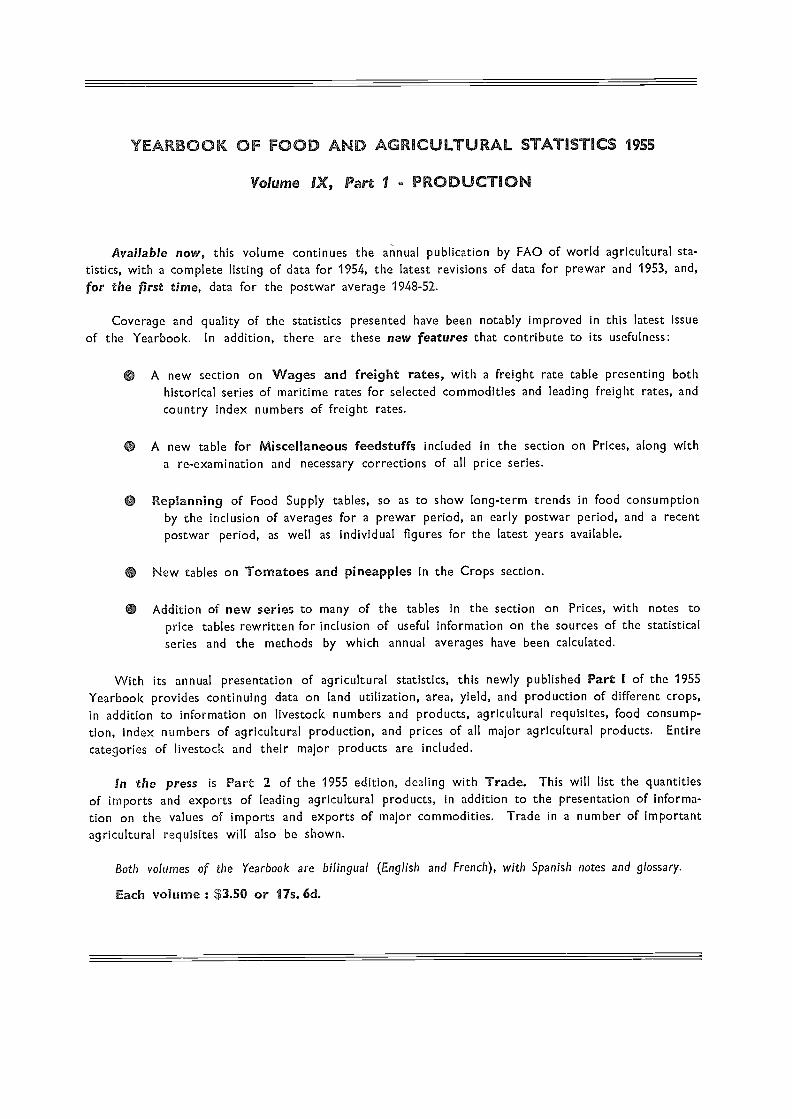
Available now, this volume continues the annual publication by FAO of world agricultural sta-tistics, with a complete listing of data for 1954, the latest revisions of data for prewar and 1953, and,for the first time, data for the postwar average 1948-52.
Coverage and quality of the statistics presented have been notably Improved in this latest issueof the Yearbook. In addition, there are these new features that contribute to its usefulness:
A new section on Wages and freight rates, with a freight rate table presenting bothhistorical series of maritime rates for selected commodities and leading freight rates, andcountry index numbers of freight rates.
A new table for Miscellaneous feedstuffs included in the section on Prices, along witha re-examination and necessary corrections of all price series.
Replanning of Food Supply tables, so as to show long-term trends in food consumptionby the inclusion of averages for a prewar period, an early postwar period, and a recentpostwar period, as well as individual figures for the latest years available.
New tables on Tomatoes and pineapples in the Crops section.
Addition of new series to many of the tables in the section on Prices, with notes toprice tables rewritten for inclusion of useful information on the sources of the statisticalseries and the methods by which annual averages have been calculated.
With its annual presentation of agricultural statistics, this newly published Part I of the 1955Yearbook provides continuing data on land utilization, area, yield, and production of different crops,in addition to information on livestock numbers and products, agricultural requisites, food consump-tion, index numbers of agricultural production, and prices of all major agricultural products. Entire
categories of livestock and their major products are included.
In the press is Part 2 of the 1955 edition, dealing with Trade. This will list the quantitiesof imports and exports of leading agricultural products, In addition to the presentation of informa-tion on the values of imports and exports of major commodities. Trade in a number of importantagricultural requisites will also be shown.
Both volumes of the Yearbook are bilingual (English and French), with Spanish notes and glossary.
Each volume : $3.50 or 17s. 6d.

THE STATE OF FOO.D A.IN1) A GRICUL»,-(i -H.
S ATF
FOOD AND AGTICUTTURE
FOOD AND AGRICULTURE ORGANIZATIO fOF THE UNITED NATIONS
Rome, 1956
NOTE
hutIcrial toblioalioo Ims
bccil mcpurcrl f/.(»n fliciolornialion, a2ail(01r lo
PI() /() 3() ,11()Ic 19.-íG
© FAO 1956
Printed in Italy
iv
CONTENTS
Page
Foreword
I. Summary 3
II. World Review and Outlook 9
PRODUCTION IN 1955/56Per Caput Food Supplies 1.0
Regional DevelopmentsPattern of Production 12Fisheries Production. 14Fore,stry Production 14The Production Outlook for 1950157 14
ECONOMIC A CTIVITY AND THE DENIAND FOR AG RIC ULTU RAI, PRO DUCTS . 15Short-term Outlook. 17
IN"I`ERNATIONAL TRADE IN AGRICULTURAL PRODUCTS 18Value of World Trade in Agricultural Products 20Price Trends in International Markets 20Trade in Agricultural Products of the U.S.S.R. and ( ,her Countries
in the Communist Group 22
CHANGES IN STOCK LEVELS IN 1955/56 ... . . 23Measures of Surplus Disposal 26
COMMODITY SURVEY AN D 0 UTLOOK 26Wheat 26Coarse Grains 28Rice 28Sugar 29Livestock Products 30Fishery Products 31.
Fats and Oils 32Fresh Fruit 33Dried Fruit and Wine 33Cocoa 34Coffee 35Tea 36Tobacco 37
Cotton 37Wool 38Jute 38
El ar(I hers
3
Rubber:Forest Products 4::31.09)
PRa CES A N THE 'FARMER 41
Agricultural Incomes 41
The Relative Level of Agricultural Income 43Prices Paid a,nd Received by Farmers 44
PRICES AN D THE CO NS U En 45Retail Food Prices 45Marketing Margins 50
Fool) CONSUMPTION LEVELS 50
A GRI U LTURAL POLICY AND DEVELOPMENT PLA NN IN (4 IN 1955/56 52North America 52
OceaniaWestern EuropeThe U.S.S.R. and Eastern Europe 55Far East 56
Latin America 57
Near East, 58
Africa 58
GENERAL APPR A IS AL AND OUTLOOK 59
III. Some Factors Influencing the Growth of International Trade inAgricultural Products 61
CHA.NGES IN THE TERMS 01? TRA DE FOR AGRICULTURAL PRODUCTS ASA WHOLE 62
Compa,risons with National Statistics . . 64Long-term Trends 65Comparison of Long-term Trends on international and Domestic
Markets 66
71'HE TERms OF TRADE FOR A GRICULTURAL PR OD ITCTS AND THE PATTERN01? WORLD TRADE 67
The Sha,re of Manufactures and Primary Products in World Trade 67
CHANCES IN THE UNIT VALUE, VOLUME AND TOTAL VALUE OF TRADEFOR INDIVIDUAL COMMODITIES. 71
Changes in T.Tnit Values for Individual Commodities 71
Changes in the Volume of Trade 73Changes in the Total Purchasing Power of Agricultural Exports 78
FA CTORS INFLUENCING THE INTERNATIONAL DEMAND FOR AGRICULTTJRALJ'TIODIJCTS 78
The, Relative Growth of Trade in Agricultural Products and Man-ufactured Goods 81.
Changes in the Composition of International Trade in AgriculturalProducts 82
The Decline in the Percentage of Agricultural Production EnteringInternational Tra,de 82
RELATIONS -BETWEEN CHANGES IN THE LEVEL 01? ECONOMIC ACTIVITYAND THE LEVEL OE INTERNATIONAL TRADE IN A 0 RICULTURAL PRODUCTS 83
Commodities Showing a Marked Expansion of Trade 84
GENERAL CONCLUSIONS AND LINES OE FURTHER WORK 96
vi
IV. World Fisheries : General Trends and Outlook with Examples fromSelected Countries loo
CHARACTERISTICS 01,' WORLD FISH PROD (Turf oN A N D Tnn.s I 00General 100Main Centers of Production 100Consumption 101Utilization 101Trade 102Technical :Development 103
GO VERNAI ENT POLICIES IN RELATION TO THE FISHERY- IN D USTRIES I 03Fishery Policies before World War II 104Government, Policies since World War II 104
TYPICAL CASES OF FISHERY DEVELOPMENT UNDER DIFFEri ENT ECON OM CINELVENCES 105
japan 105Norway and Iceland 107United Kingdom and Germany 109United States and Canaria 113The Union of South Africa and South West Africa 117
C URRENT DEVELOPMENT PROOR AM S AND OtrmooK 119Situation in the Developed Fisheries 110Underdeveloped Fisheries 123
Annex Tables 128
List of Figures
Indices of Estimated World Output of Major Commodities 13
Average Prices (Import Unit Values) of Agricultural Products in Inter-national Trade 21
Share of Major Exporters in World Wheat "E'r. de 27
World and Regional Consumption of Sugar 29
Price Index of Fats and Oils (excluding Butter) on the World Market1950-56 32
Cocoa Production 34
LE-7. Indices of Prices of Coffee, Tea and Cocoa 35
II-S. Coffee Production 30
Gross Agricultural Income, Expenses and Net Income 42
Farm and Non-farm Incomes in the U.S A 44
Farm Prices of Certain Commoditie 46
Indices of Retail Prices 49
III-1. Indices of Average Unit, Values of Agricultural and Other Products ininternational Trade, 1913-55 03
Indices of the Purchasing Power (Terms of Trade) of Agricultural Prod-ucts for Manufactured Goods in World Markets, 1913-55, in Compari-son with the Terms of Trade for the United Kingdom 63
vii
111-3. Indices of tite Purchasing Power of Agricultural Products in Interi ationalMarkets and on Domestic Markets in the United States, the United:Kingdom. and Sweden 66
Relation between Current Value of :\VO11(1 Trade in Agrieultural Productsand Manufactured Goods 68
Relative Growth of international Trade in Agricultural Products andManufactured Goods 69
111-6. Volume of World Trade in Manufactured Goods in Comparison withVolume and Real Value of World Trade in Agricultural Products Ti
"1-7. Indices of the Volume and Total Value (in Real Terms) of World Tradein Certain Agricultural Products, 1920-55 76
"I-8. Real 'Value and Volume of International Trade in Certain AgvieulturalProducts, 1954/55 as a :Percentage of 1920-38 Average 79
111-9. Changes in the Composition of World Trade in Agricultural Products 89
[II-lo. World Tracio in Cocoa in :Relation to Level of \Vorld Manufacturing Pro-duction Taken as an Indicator of Demand
Per Caput World Trade in Cofre, in Relation to Per Caput World Man-
ufacturing Production 86
111-12. International Trade in Rubber and Consumption (including Synthetic:Rubber) in Relation to Level of Manufacturing Production . . . 87
III-13. World Trade in Certain Forest Products in Relation to Level of WorldManufacturing Production 89
111-14. World Trade in Cheese, Sugar and Certain Fruits in R,elation to Levelof World Manufa,cturing Production
111-15. World Trade in Certain Cereals, Tea and Tobacco ir Relation to Levelof World Manufacturing Production
111-16. World Trade in Certain Fisheries Products and Industrial Fibers in Re-lation to Level of World Manufacturing Production 95
FOREWORD
The vo1.j.(1 food et ad (lyric/maul ,9ì/((ion, has recent( y 1e ailed to change le,'rapidly dui n 4UIilbq the yea' oI poway recovery. I t has therefore seemed fitting tomodi fy the f nc of the a an foil re port on the statc of food a nil agricultue, yirIe:>8 o pbo4.,; to the current itnation and short der m. on/look and more to longer-te rpoblems and 10 other 8pecial s tOb ¡eh in the past it has nof bee n pos8; bletreat in detail .
Lar! y 8 report consisted of a review of the de velopments of the whole postwadecide. Y'hin year (he' /00(1 and ay ricul and situation in !i/:5./.56 and the outlookfor 1956157 are re.vjewcd, .j sf flute chapter. The two following clot rs, the firstof !he new series of special ,sttidie. deal tvith some facto j n acing
th» fie vq0 »molt of i Ater national trade in. agricultural products, altd with ge neral tre nd,t,nd oUti0011c n t bo n:orld's lisherie8, (171e report is i Ittrod aced by the curto mar y sw in -wary.
It is hoped that the report, will be found use al in its new I or ot. and that inatare year8 it will be pos8ible io prc8e nt special studies of a number of the main
problems lacing the world's (lyrical, are and to cocer individual regions 'en'/ othersubjects more thorough, y tha .was possible in the former ti/pe o f re port.
E.R.13 Bin' ko I,E
Act i ng Di met or-Generll
Chapter II. World Review and Outlook
T.here vas no major change :in tito worldfood and agricultura] situation in 1955/56. Pro-duction continued to increase, and was some 3percent higher than 'in 1954/55. With demandat high levels, the -volume of agricultural traderose more s.harply than in most recent years.Pri.CCS of agricultural products generally con-tinued to decline, h.owever, and farm incomeshave fallen 'further in most countries. Totaladditions to stocks by the end. of 1.955/56 seemlikely to be fairly small, in spite of large in-ereases in stocks of coarse grains and cotton.
Productinn. .Production rose sharply in NorthAmerica and Oceania, the regions already mosttroubled by surpluses, but apart from a substan-tial gain in the "Par :Past, production in theother regions showed little change and in someeases declined. Frod'uction of cotton and grainsincreased from the low levels of 1954/55, andthere WaS a continuation of the tendency .forthe output of livestock 'products to increasemore rapidly than crop production in the moredeveloped countries. Fisheries production show-ed little change, but world output of mostforest products reached record levels.
In 1955/56 per caput food production in:Latin America., Oceania and th.e Far East wasstill some 5 to 10 percent less than before thewar, though 'in all other regions and in th.eworld as a wh.ole it was well above the prewarlevel. It appears, however, that because ofchanges in the pattern of trade actual pereaput supplies of food, allowing for importsand exports, are at approxim.ately the prewarlevel in Western Europe, Latin America andthe Far East, and appreciably above it in tireother regions.,
There will probably be a further small in,crease in world agricultural prodtictiQ11 ht. 19:j6/
Chapter I - SUVINIARY
1957. 'Preliminary estimates indicate that inNorth America and, in spite of frost damages,in most of Western Europe, harvests will gen-erally a.gain be large unless unfavora,ble weatherconditions occur later in the season. Such.indications as there are for tire rest of theworld also suggest generally larger harvests in1956/57.
Economic Activity and 1/re Demand /or Agri-cultural Products. 1955/56 saw a continuationof the improved economic conditions which inthe 'preceding year had followed time mild 1953/1954 recession. The boom in the industrializedcountries stimulated the demand for agricul-tural products throughout the world. Consumerdemand for foodstuffs and beverages was strong,but del-nand for fibers aun rubber has beenaffected by reduced output of textiles and,more recently, of automobiles.
The present economic situation seems like,lyto continue at least during the early part of1956/57. There may indeed be sbnie declinein e,conoinic activity under the influence ofanti-inflationary measures, though there are nosigns that the present lull in expansion willdeteriorate into a recession, while increasingpublic expenditure and private industrial in-vestment inay le,ad to some further expansionin tire latter part of the year. The demandfor agricultural products is likely to stay highbut not increase appreciably, and the pricemovements that began early in the secondhalf of 1955/56 are likely to continue into -tire coming crop year. Broadly speaking, theserilovements are characterized by a decrease inprices of agricultural raw materials (exceptperhaps wool) and some, stramgthening in theprices of foodstuffs.
International Trade in Agricultural ..ProductsThe boom conditions in the industrialized coun-tries led to an increase of about 5 percent in
the volume uf world trade in agricultural prod-ucts in 1955, so that it reach.ed the highestlevel since the war. More than half of theincrease WaS due to larger Western Europeanimports. "World trade in agricultural productswas still, however, only 5 percent above the1934-38 level, in contrast to a rise uf 70 per-cent in the volume of world trade as a whole.Because of the continuing fall in prices, thevalue of agricultural trade :increased by onlyabout i percent in 1955, but an index of aver-age import unit values suggests that the declinein agricultural .prices .was coming tu a halt inthe last quarter of 1955.
A feature, uf 1955 vas large imports uf grainsand sugar by the U.S.S.R. and the other East-ern European countries, though their importsof livestock products were reduced froin thehigh levels of the previous two years. "East-West" trade now appears to account for some3 to 4 percent, of world ti.ade in agriculturalproducts.
Changes in ,'S'locle.s. The total addition tostocks by the end of the 1955/56 season appearslikely to have been fairly modest. The accu-mulation of unsold stocks of grains and cotton,largely in North America, has still not beenhalted, but stocks of certain other productswere somewhat reduced.
More vigorous "United States surplus disposalmeasures are likely in the near future. Suchmeasures have, however, so far failed to effectany significant reduction of stocks of' the mainsurplus commodities, and their output is nowto be curtailed by means of' the "Soil Bank."
Commodity kS'urvey and Outlook. Supplies ofgrains were again lar!_rer in 1955/56. Whileworld trade in wheat vas at the same levelas in the previous season, the share of thefoto' major exporters increased. World tradein rice increased in 1955 and the pressure uf'stocks was lessened, with the main stocks nowthose of the United States government. Ex-
port prices of grains showed some decline, butamong the COaTSC grwins, barley and maize re-covered toward the end of the season. A newInternational Wheat Agreement was negotiat-ed in April 1956, with a slightly lower guaran-teed price range.
Although sup). production increased further,consumption also expanded and stocks declin-ed somewhat. The steady rise in consumptionhas prevented a serious decline in prices.
4
.Production and exports of most live,stock
products increased in 1955, though there was aslight fall in. milk output, mainly because ofunfavorable weather in Western Euro pe. Stocksof dairy 'products vere reduced. Increased out-put of m,eat should find ready markets in
1956/57.International trade fisheries products was
generally maintained in 1955, though there weresome sharp changes for individual products.There was a sharp decline in the canned salmonpack on the West Coast of North. America.Fish meal output increased in the United Statesand Denmark, but fell in some other countries.
Supplies of fats and oils -were a record. in1955 and even greater supplies are likely in1956. Prices, however, ha ve been rising andinternational trade increased in 1955 with strongimport demand in Europe and Japan. 'UnitedStates exports were large, and end-of-sea'onstocks are likely to be the lowest 'For five years.
Production of fresh fruit appears to haveincreased in 1955/56, except for apples andpears. Because of the severe winter, total ship-ments of citrus fruit from the Mediterraneancountries will probably fall in 1956/57. Of themajo!' dried fruits, only raisin production in-creased. Increased wine production in the Unit-ed States, Italy and France \ MS offset by lowyields in North Africa.
After the great Twice rise of 1954 the con-sumption of cocoa fell in 1955. In spite ofa lower crop in 1955/56 stocks have meneasenand prices declined further. Col/ce productionincreased sharply in 1955/56 and lower pricesstimulated demand. As a result, however, ofthe recavery uf consumption and of news ofsevere frost damage to the 1956/57 Braziliancrop, prices have recently been fumen than hadbeen anticipated. Although tea production in-creased in 1955/56, exports declined, while pricesalso fell. The world tobacco market remains'fairly stable, though United States stocks arehigher than ever before.
It is likely that cotton stocks, mainly in theUnited States, will show a 'further sharp in-crease by the end of 1955/56. Prices atul ex-ports fell during 1955/56. Prices and trade inthe coining season will depend mainly on theprojected sale of United States stocks at corn-petitive prices. The current woo/ clip is a record,but consumption also is high and markets haveremained fem. Prices of jute have also beenfirin, though. in .the 1956/57 season the supply/demand balance may exert some pressure on
prices. :Demand for hord fibers was buoyantin 1955'156. The price of natural rubbor in-creased sharply during 1955, but declincri inthe early months of 1956, when some reees-5100 in demand was caused, by reduced auto-mobile output in the United tates and UnitedKingdom. Tim increasing supply of lower pricedsynthetic rubber has also had a strong influenceon thc market.
.Demand for most forest products rose in 1955.Output of roundwood was a record and MaytrtereaSe flirther tn. 1956 heeause of the strongdemand for pulpwood. Europeadn consumptionof sawn-mood is yxpected io lie maintained in
spit( of a temporary slack! oss in the marketat 1,he beginning of 1956, 0:,,mand for wood
contitates very strong
pricep and the F ((TM(' . 'IT a rill incoinospear generally to have declined between 1954and 1955, or, a,t Iio in have made only verylimited gains. The (:eclinc in per caput incomes.which has ow-in-red in spite or further reductionsin the ittimin-rs of people dependent on agri-culture, con...ro-a,s sharply with the rising trendof incomes 1.:("IvranY,
Prices have continuod to move against thefarmer in most countries, though in Europeprices of products have been main-tained, Tin. Iirices of important input itemshave riSOLI li . nearly all countries, It aptacarsthat, incomes can be maitua'red only f
rise in the volume, of produci ion is si-
lo offset the adver,c price t.tovoment.
Price,,s. and flu:. 0,,;+-nmer. Where farni andinternatio:uil prices hay' Wien there has stillbeen no p ro 1101i1101 h ffeet on retail foodprices, though in some few countries food priceshave declined slightly in relation to the gen-eral retail p1-ice levo]. Marketing margins a,p-pear generally to have increased. .ril the Unit-ed States, the only country for which currentdata are available, the marketing margin forthe average family's "markct basket" rose I)3 percent between the uir quarter of 1955and the first quarter of 1956. tha,t its retailcost fell by ort/y 2 percent in spite of a fallof 10 percent in farm prices.
Food Consumption Levels. In contrast withthe rapid changes from year to year in theearlier postwar period, levels and patterns offood consumption have non- become much morestable. Becent progress in the more advanc-ed countries has been ma' tly in the quality
and variety of the diet. In the less developedregions improvements have shown themselveslargely in increased calorie intakes. though insome countries there have been small increasesin the consumption of livestock products andfish. Larger production aild lo-u-cr pri ces have.resulted in somy back from wheat to ricein the importin:: (-oil/Aries of the Far EaSt,
Policy and Decelopm(-nt Plan-niwg n 195506. The continued accumulationof surplus stooks of some commodities has ledto revisions of agricultural policies in a numberof countries. The most important new depar-ture 5 n the United Slates, where, under the,new Agricultural Act of 1956, a 'Soil Bank-is to be established in older to curtail produc-tion, Elsewhere changes ha ve been less radical.In some countries, mainly in Western Europe.there, have la-en changes in emphasis in farmprice policies. designed 1,0 adjust productionmore closely to pre,,en::: needs and make theiragricultures more coir.l.i.-titiVe. (hllarallteed pri-ces have rarely he- rtItge,d (Argentina is a
notable excLprion) and ;k.."e has bocil uil. in-
creasing treitI :oward farmers to le :licecosts by improving the farm structure rfi' suk-siclizing means of production.
At the same time. however, itt the less de-veloped parts of the world a continued rapidexpansion of agricultural production is still thechief need and remains the primary Hita ofnational policies. In 1955/56 several of themost important postwar development plans werecompleted and now plans Were prepared orimplemented to follow up the madein the earlier ones.
Goter,,' .1ppr((.17 and. Outlook. The mainproblem-, b.cing world's agriculture remainbroadly the same. The basic crlen.na of mostgovernments is how to reccmcile dual re-sponsibilities to maintain the economic positionof farmers and at the same time to provideconsumers with adequate food supplies at IOWprices. The deteriorating position of the farmpopulation continues to cause anxiety. in spiteof the added urgency caused by surplus stocks.only a beginning has so far been made towardreducinti production and marketing costs in or-der to bring more and better food within thereach of the poorer consumer.
Although some prog,ress bias been made inadjusting the production pattern more closelyto demand, there is little likelihood of a.ny
significant reductions in surplus stocks curing1956/57. ,Looking further ahead, ni uch dependson the success of the n.ew United States meas-ures in curtailing output of surplus commodi-ties. The relative stability of the present situa-tion provides a further breathing-space for theseand other n easures to adjust world agriculturalprod net i on.
Chapter III. Some Factors Influencingthe Growth of International Trade inAgricultural Products
In the first of the special chapters an analysishas been made of th.e development sinceof world trade in each of thc,s main agriculturalproducts and for agricultural products as awhole in the light of newly available statisticsof the volume, average unit value (price), andtotal value of Nvorld trade in these commodities.
Terms of Trade for Agricultural .Products. Itis shown that since World War IT there hasbeen an :increase of the order of 50 percent,compared with 1934-38, in the purchasing pOweron world markets of agricultural products asa whole for manufactured goods. Corresponding-ly- the purchasing power of manufactured goodsas a whole for agricultural products has fallenby about one third. This ch.ange in the "termsof trade," which on the one hand has contrilnit-ed largely to posti,var balance-of-paymentsproblems of agricultural i ni porting countries,and on the other, strengthened the economicposition of a,gricultural e,xporters, appears pri-marily to reflect the unusually low prices ofagricultural products between the wars, par-ticularly after the depression of 1930. Relativepm-ices of agricultural products since Wm.ld WarTI appear to have been about, the, same a8those ruling for the t \VO decades prior to WorldWar T, while earlier still price relatio.ni seemto have been even more fa,vorable to agricul-tural products.
Relations Between International '.Prode in Agri-cultural Products and Manufactures. Much ofworld trade consists of an exchange, of manu-factured goods against primal-y, products,.. ofwhich agricultural products form the largestpart, and it has been found that there is afairly constant relationship between the curre,nttotal -value of international trade in agricul-tural products and in manufactured goods 're-spectively. After World War II, however, the
6
relationship is somewhat less close and appearsto have shill:led in favor of manufactured goodS.
IFTence, marked changes in the relative pricesof agricultural products and manufactured goods,such as occurred a:fter the two work!. wars andthe depression of 1930, are associated withshifts in th.e relativo volume of these two sectorsof world trade. For example, the, sharp fallsin the relative prices of agricultural productsafter IVorld War I and the depression of 1930were accompanied by a :proportionate fall inthe volume of :world trade in manufactures inrelation to the level of world economic activi
After World War TI, however, the volumeof WOrld trade in manufactures cantinued moreor less unchanged in relation to the level ofNvorld CC011 omnie activity, and the recovery inthe purchasing power of agricultural. productswas reflected in. a relatively smaller volume ofagricultural trade which persisted even afte'rthe emergence of surplus stocks of some ag6-cultural commodities. Some factors which mayaccount for these different re-adjustments are.-suggested.
Orowtlt of International Trade. Differe,nt.Agricultural .Products. From 1913 until thedepression of 1930 the "real value" of inter-national trade .in nearly all agricultural com-modities increased :Fairly steadily, though atvarying rat es, in line :with th.e growth of worldeconomic activity, continuing the comparabledevelopment of trade for some decades prior toWorld War 1. The depression, however, broughtto an end this rather general expansion, andfrorit then on the various commodities :fall intotwo rather distinct categories.
Thus by 1954-55 world, trade in a numberof agricultural products, in general commoditiessuch as coffee, rubber, certain forest products,and bananas which are not readily producedin the industrialized countries where they findtheir main markets, showed increases in realvalue ranging from 50 to 300 percent comparedwith the average of the interwar years. Thisrate of growth is roughly comparable with theexpansion of :world trade in manufactures whichhas approximately doubled during the .saineperiod. The, volume of 'trade in some of theseagricultural products has shown little increase,but in such cases the strength of world demandhas been evident in a sharp rise in "real" prices:.
At the other extreme, the real value of in-ternational trade in a number of other products,all of which ean either be readily produced in
the main importing countries Or largely replac-ed by synthetic substitutes, was no greater in1954-55 than in the interwar period and oftensubstantially less. Most cereals and livestockproducts, as well as cotton. and certain fruits.e.g., apples, fall into this category. The realprices of many of these commodities had declin-ed so that the fall in the real value of inter-national trade was often greatet than the fallin the voluine of trade.
The wide differences in the Course of develop-ment of world trade in the main agriculturalproducts during the pa,st two tlecades thusseem to be largely accounted for by two con-trary iti.fluenees ; on th.e one hand expansionisteffects of the growing world economy, and onthe other the emergence of a riumber of factorstending to limit trade in agricultural products,notably postwar efforts in many countries toattain a greater degree of self-sufficiency, andthe substitution of synthetic for natural rawmaterials.
Statistical data o.n the rate of growth of th.evolume and real value of world trade of some10 agricultural, forest, and fisheries products,including those falling between the two extremes,are given in the section of this chapterheaded "Changes in the Unit Value, Volumeand Total Value, of Trade for Individual Com-modities."
Relationships between the Developmmt of In-tornational Trade in Agricultural Product8 andthe Level of W orld Economic Activity. A fairlyclose relationship Call be e,stablished betweentile "real" value of trade in the first groupof commoditie,s, in .which trade is expanding,and an index of world manufacturing produc-tion which has been taken as an indicator ofworld demand. There has not yet been timefor a detailed analysis of these relationships,but the first results obtained suggest, that itshould be possible to obtain useful indicationsof the likely future groWth of internationaldemand for these agricultural products on worldtrtarkets, and to apply in world trade th.e methodsof price analysis and price forecasting whichhave been found useful on domestic markets.
For commodities in which the increased worlddemand is met m.ainly from domestic produc-tion, and for which the level of internationaltrade is not expanding, little or no relationshipof this kind would be expected. While thelong-term trend must evidently be downward,however, the decline often seems to take place
7
in a series of steps. During the, interveningyears the level of international trade showsa, positive response to an increase in industrialproduction similar in kind to that shown inthe first group of products. The shifts to alower relative level of trade seem often to occurafter a period of very high prices or after achange in demand resulting from, e.g., techni-cal developments.
There are as yet no indications of any mark-ed change in the :factors governing postwartrends in the development of international tradein agricultural products. Apart from any majorpolicy change (e.g., of surplus disposal), it thusseems unlikely that in the immediate futurethere will be any major expansion in interna-tional tracio in the commodities whi.ch can bereadily produced in the main industrial coun-tries or which are being increasingly replacedby syntheti.c substitutes. On the other hand,international tracio in agricultural products forwhich an increased demand in the main in-dustrialized countries must be met by largerimports, seems likely to continue to expandin line with time growth of world economic ac-tivity, though thi.s (loes not, of course, meanthat their prices may not fall sharply if sup-plies temporarily outrun demand.
Chapter IV. World Fisheries : GeneralTrends and Out/ook, with Examplesfrotn Selected Countries
The second of the special chapters in thisreport discusses world fish production and trade.General trends are illustrated by developmentsin some of the larger fisheries.
The main characteristics of world fish produc-tion and trade are briefly described, includingthe main centers of production, the consump-tion and uti.lization of fish, and th.e influenceof technical developments on the industry.
The broad lines of government policies inrelation to the fishery industries, and thechanges in these policies since the war, aresummarized. More detailed accou.nts are givenof policies and developments in the followingcountries : Japan, where fish is the m,ain sourceof' animal protein ; Norway and Iceland, thetwo countries where fisheries are of the great-est relative importance in the national econ-omy ; the United Kingdom and Germany, fishimporting countries with largescale, fisheriesof their own ; the United States and Callada,
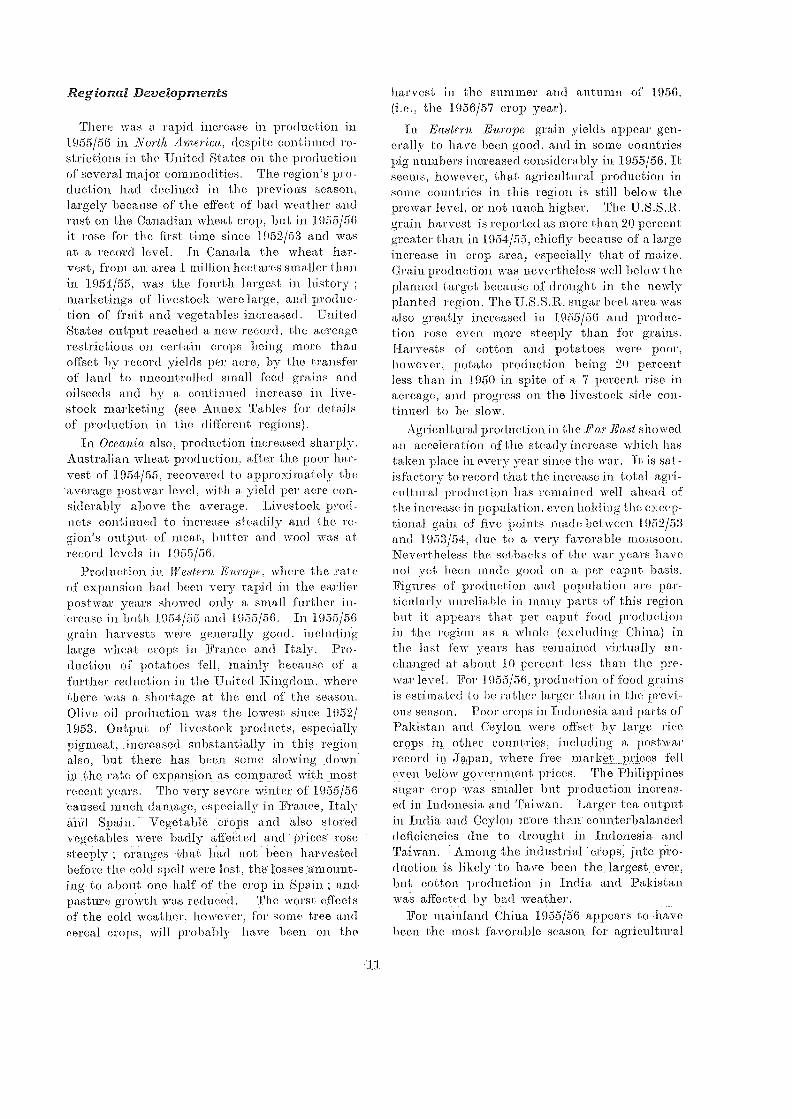
where fishing operations were less dislocated bythe war than in most of the other countriestinder consideration; and the Union of SouthAfrica and South West Africa, wh.ere the fish-eries have been particularly rapidly developedsi neo the war.
Current development 1.)rograins and the fish-eries outlook are reviewed, firstly in the moreadvanced economies, where fisheries have heensubject to a continuous process of adjustment,and secondly in the underdeveloped economies,where fisheries have been relatively stagnant.For the more developed fisheries, problems ofcosts and investment, the, investigation andmanagement of resources, and problems of
domestic and international trade are discussed,and it is concluded that the outlook is forcontinued steady consolidation, rather than forany immediate or sudden change. For theunderdeveloped fisheries, the improvement ofproduction methods; the stimulation of demandand problems of distribution, further investiga-tion of resources, and the influence of externalaid programs are considered. The outlook inthe underdeveloped fisheries is for more limit-ed local improvements, to be expected especiallyin the Indo-Pacific area, where fish i.s of muchgreater and more clearly recognized importancethan elsewhere.
Chapter II - WORLD REVIEW AND OUTLOOK
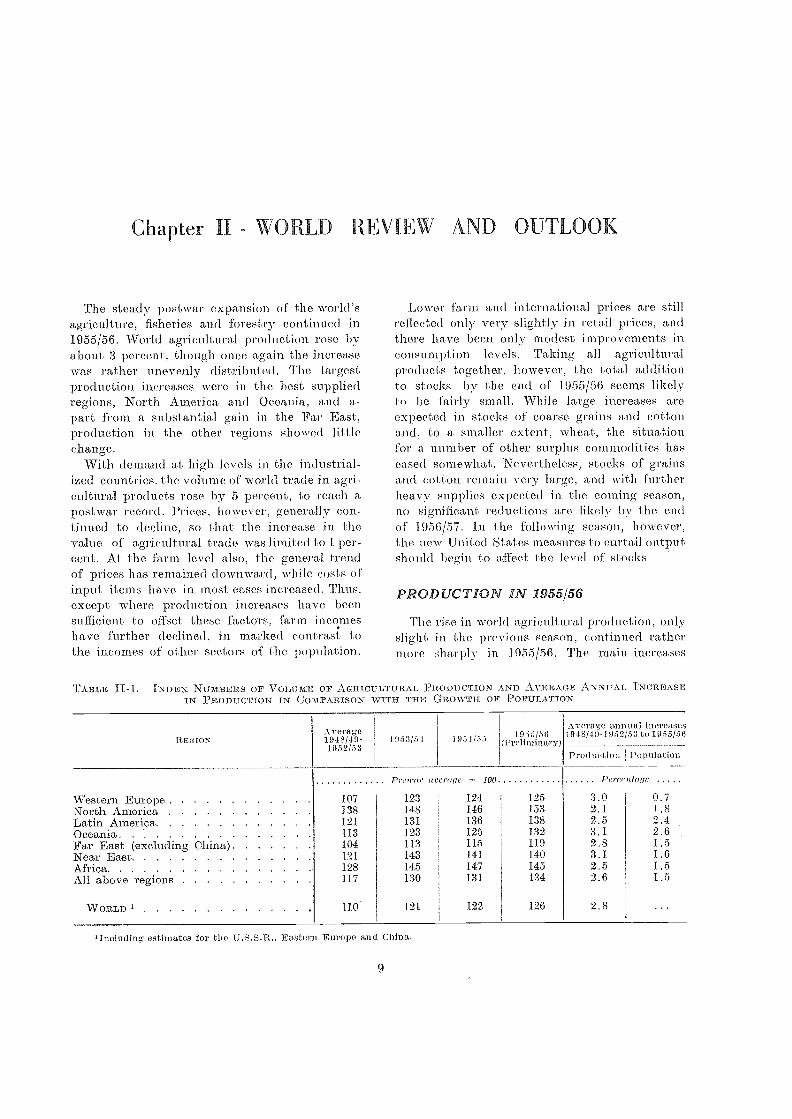
The steady postwar expansion of the world'sagriculture, fisheries and forestry continued in1955/56. World agricultural production rose byabout 3 percent, though once again the increasewas rather. unevenly distributed. The largestproduction increases were in the best suppliedregions, North America and Oceania, and a-part from a substantial gain in the Far East,prod.uction in the oth..er regions sh.owed littlechange.
W:ith demand at high levels in the industrial-ized countries, the volume of world trade in agri-cultural products rose. by 5 percent, to reach a.postwar record. Prices, however, generally con-tinued to decline, so that the increase in the.value of agricultural trade wa,s limited to 1 per-cent. At th.e farm level also, the general trendof prices has remained downward, -while costs ofinput items have in most cases increased. Thus,except where production increases have beensufficient to offset these, factors, farm incomeshave further declined, in marked contras tothe incomes of other sectors of the population.
'including estimates for the U.S.S.E.. F,astern Europe an( CiliIla.
9
.1....,ower farm and international prices are stillreflected only very slightly in retail prices, andthere, have been only modest improvements inconsumption levels. Taking all agriculturalproducts together, however, the total additionto stocks by the end of 1955/56 seems likelyto be fairly small. While large increa,ses areexpected in stocks of coarse grains and cotton.and, to a smaller extent, wheat, the situationfor a mtruber of other surplus commodities haseased somewhat. Nevertheless, stocks of grainsand cotton remain very large, and with furtherheavy supplies expected in th.e coming season,no significant reductions are likely by the, endof 1956/57. In the following season, however,the new United States measures to curtail outputshould begin to affect the level of stocks
PRODUCTION IN 1955/56
The riSe in world agricultural production, onlyslight in the previous season, continued rathermore sharply iii 955/56. The main increases
REGIONAverage1948/0-1952/53
19.53/54 1951(5ji 1955/56(Preliminary)
Average anual increases1918/49-1952/53 to 1955/56
Production I Population
Pre?var aterage 100 Percelifilge .....
Western Europe 107 123 124 195 3.0 0.7.North America 138 148 146 153 2.1 1.8Latin America ........ 121 131 136 138 2.5 2.4Oceania 113 123 125 132 3.1 2.6Far East (excluding China) 104 113 115 119 2.8 1.5Near East 121 143 141 140 3.1 1.6Africa 128 145 147 145 2.5 1.5All above regionq 117 130 131 134 2.6 1.5
WORLD ......... . 110 121 122 126 2.8
TABLE 1.1.-1. .INDEN NUMBERS OF VOLUME OF AGRICULTURAL PRODUCTION AND AVERAGE ANNUAL INCREASEIN PRODUCTION IN COMPA.RISON WITH, Ti-LE GROWTH OF POPULATION
were, however, in those regions already mosttroubled by the problem of surpluses. Produc-tion rose, considerably in North America, for thearst time since 1952/53 and th.ere was also ana,ppreciable rise in Oceania, but in the rest ofthe -world the increases were smaller and insonic regions production cl eclined slightly (TableH-1). Thus the long-standing inequalities inproduction between tire well-fed and underfedregions continued in 1955/56, while stocks ofsome products continued to accumulate.
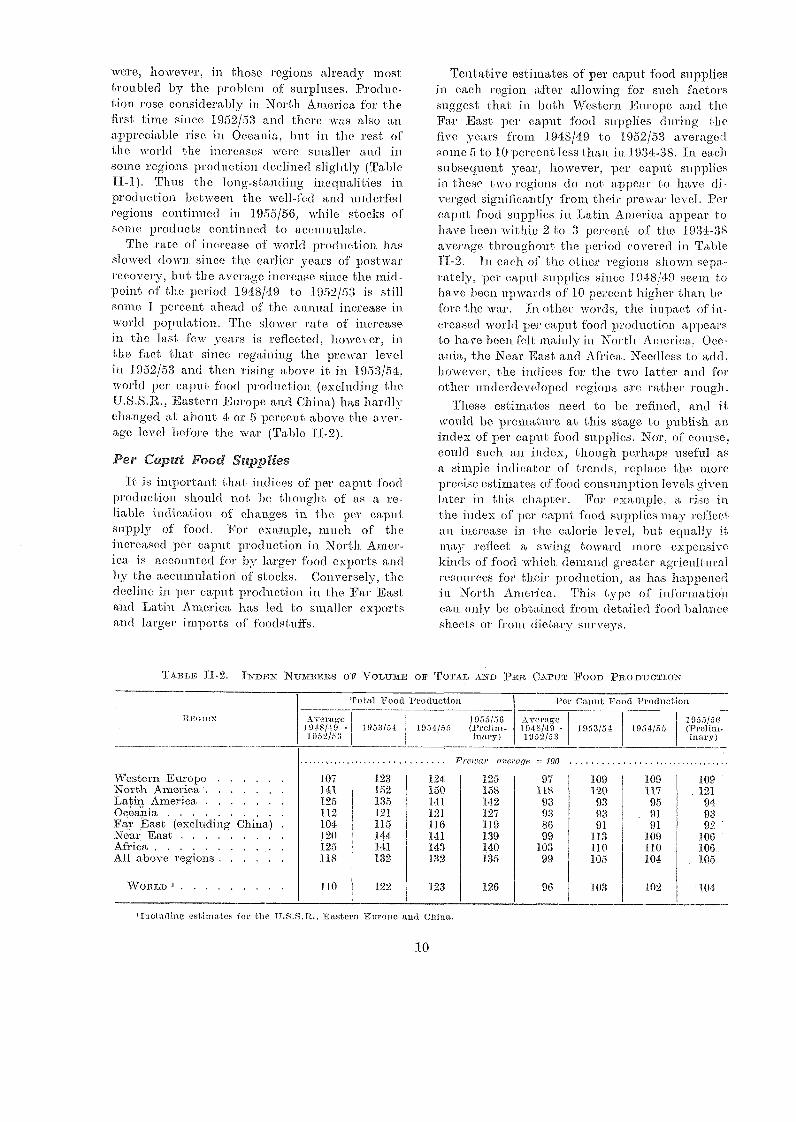
The rate of increase of world production hasslowed down since the earlier years of postwarrecovery, but the average increase since the mid-point of the period 1948/49 to 1952/53 is st:illsome 1 percent ahead of the, annual increase inworld population. The, slower rate of increase,in the last :few years is reflected, however, inthe :fact, that since regaining the prewar levelin 1052/53 and then rising above it in 1953/54,world per output food production (excluding theU.S.S.R., :Eastern Europe and China) has hardly(5.hanged ai ilt)out 4 or 5 percent above the aver-age level before th.e war (Table II-2).
Per Caput Food SuppliesTi :is important that indices of per ca,put food
production should not be thought of as a re-liable indieation of changes in the, per caputsupply of food. For example, much of tireincreased per caput production in North. Amer-ica is accounted for by larger food exports andby the accumulation of stocks. Conversely, thedecline in per caput production in. the Far Eastand Latin America has led to smaller exportsand larger imports of :Foodstuffs.
TABLE II-2. :[NDEX NUMBERS OF VOLUME OF TOTAL AND PER CAPUT FOOD PRODUCTION
'Including estimates for the 'U.S.S.R., Eastmn Europe and China.
10
Tentative estimates of per caput food suppliesin each region after allowing for such factorssuggest that in both Western Europe and theFar East per caput food supplies during thefive years from 1948/49 to 1952/53 averagedsome 5 to 10 percent less tiran in 1934-38. In eaclhsubsequent year, however, per caput suppliesin these tiro regions do not appear to have di-verged significantly from their prewar level. Percajun, food supplies in. :Latin America appear tohave been within 2 to 3 percent of tli.e 1934-38average throughout the period covered in TableII-2. In each of the other regions shown sepa-rately, per caput SUpplies since 1048/49 seem tohave been upwards of 10 percent :higher than be-fore the war. fn other words, the impact of in-crea,sed world per caput food tiroduction appearsto have been felt mainly in North. America, Oce-ania, the Near Ea,st and Africa. Needless to add,however, the indices for the two latter and forother underdeveloped regions are rather rough.
These estimates need to be refined, and itwould be pre-mature at this stage, to pnblish:index of per caput food supplies. Nor, of course,could such an index, though perhaps useful asa simple indicator of trends, replace the moreprecise; estimates of food consumption levels --eivenlater in this chapter. For example, a rise inthe, index uf per eaput food supplies may reflectan in crease in the calor-jo level, but equally itmay reflect a swing toward more expensive,kinds of food which demand greater agriculturalresources for their production, as has happenedin North America. This type of information.can only be obtained froni. detailed food balancesheets or from. (1 eta STU'VeyS.
ItnoloN
Total Food Production Pe' Caput Food Production
Average1948/49 -1952/53
1953/54 1954/531955/56(Prefini-inary)
VT:1f2,`191 :.149 -1952/53
1983/51 1954/551955/56(Prelim-luau)
PretVar 01,ei age --= 100
Western Europe 107 123 124 125 97 109 109 109North America 141 152 150 158 118 120 117. 121Latin America 195 135 141 142 93 93 95 94Oeeania 112 121 121 127 93 93 . 91 93Far East (excluding China) 104 115 116 119 86 91 91 92Neal: East 120 144 141 139 99 113 109 106AfriCa 125 141 143 140 103 110 110 106All above regions . . . .118 132 132 135 99 105 104 105
WORLD 1 110 122 123 126 96 103 102 104
Regional Developments
There was a rapid increase in production in1955/56 in North America, despite continued re-strictions in the United States on the productionof several majo] com.modities. The region's pro-duction had declined in the previous season,largely because of the effect of had weather andrust on the Canadian \vheat crop, but in 1955/56i.t rose for the first time since 11952153 and wasat a record level. In. Canada the wheat liar-vest, from an. area 1 million hect ares smaller thanin 1954/55, was the fourth largest in historymarketings of livestock I,N,ere large, and produc-
' tion of fruit and vegetables inereased. UnitedStates output reached a neW record, the acreagerest ri etiOnS on certain crops being inore t-lanoffset by record yields per acre, by the transferof land to uncantrolled small feed grains andoilseeds and by a cold jutted increase in live-stock marketing (see Anne:v.- Tal los for (letailsof production in the di frerent regious),
In Oce,ania also, production inercased sharply..Australian wheat production, after the, poor har-vest of 1954/55, recovered to approximately the
'average postwar level, -with a yield per acre con-siderabl3T above the a verage. Livestock prod-ucts continued to incre:se steadily and the re-gion's output of meat, 1)111 ter and wool was atrecord levels in 1955/56.
Production in 1Vestern Ith.crope, where the rateof expansion had been very raitid in the earlierpostwar years showed only a small further it i-crease in both 1954/55 and 1055/56. In 1955/56grttin harvests were generally good, includinglarge wheat crops in Fi-a nce and. Italy. Pro-duction of potatoes fell, :mainly because of afurther reduction in. the United Kingdom wherethere waS a shortage at the end of the season.Olive oil production was the lowest since. 1952/1953. Output, of livestock products, especial.lypigmeat, :increased substantially in this :regionalso, but there has been some slowing .down.
the rate of expansiou As compared with :most,recent years. The very severe winter of 1955/56*caused Mil di damage, especially in 'France, Italyand Spain. --Ve,geta ble -CrOps and alSO Storedvegetables were badly affeCted and - prices- rosesteeply ; oranges -that ha'd not been harvestedbefore the cold spell were lost, the losse,s:amount-ing: to about one half of the crop in Spain ; andpasture gro:wth was reducerl. The worst effectsof the cold. weatl_per, however. for so al e ti-ce andcereal crops, will probably have been on the
li
harvest in the summer and autumn of 1956,(i.e., the :1956/57 crop year).
In Eastern Europe grain yields appear gen-erally to have been good, and in some countriespig numbers increased considerably in 1955/56. Itseems, however, that agricultural production insomc countries in this region is still below theprewar leve!, or not much higher. The U.S.S.R.grain harvest i.s reported as more than 20 percentgreater than in .1 chiefly because of a largeincrease in crop area,, especially that of maize.Grain production was nevertheless well below t heplanned target becaus' e of drought in the newlyplanted region. The U.S.S.R. sugar beet area wasalso greatly increased in 1955/56 and produc-tion rose even more steeply than for grains.Illarvests of cotton and potatoes were poor,however, potato production being 20 percentless than in 1950 in spite of a 7 percent rise inaereage, and progress on the livestock side con-tinued to be slow.
Agricultural producticut in the Far Ea8t showedan acceleration of the steady increase which hastaken place in every year since the 'war. ift, is sat-isfactory to record that the increase:in total agri-cultural production has remained well'.1,1tead ofthe increase in population, even holding the excep-tional gil in of five points yawl° between 1952/53and 1953/54, due to a very favorable monsoon.Nevertheless the setbacks o.f the \\Tar years ha,venot yet been made, good on a per caput basis.Figures of production and population are par-ticularly unreliable in Many parts of this regionhut it a.ppears atat per caput productiOnin the, region as a .whole (excluding China) inthe last !few years has remained virtually un-changed at about 10 percent less than the pro-
u' level. Foi. 1955/56, Twoduction of' food grainsis estimated to be rather larger than in the previ-ous season. Poor crops in Indonesia and parts ofPakistan and Ceylon were offset by large ricecrops in other countries, including a postwarrecord in Japan, where free market "Ip1-iceseven belbw government prices. The Philippinessugar crop was smaller but production increas-ed in Indonesia and Taiwan. Larger tea outputin India-and Ceyloti rii:oro than- counterbalanceddeficiencies due to drought in Indonesia andTaiwan.. :.Among the industrial 'erops, jnte Pro.-dnetion is likely -to have been, the largest, ever,but cotton production in India and .Pakistanwas affected by bad weather.
For mainland China :1955/56 appears to -hayebeen the most favorable season for agricultural
production since 1949/50. It is re,ported thatproduction targets were achieved and in thecase of cotton, greatly exceeded. Improvedyields of food grains are attributed not onlyto favorable weather but also to the extensionof irrigation and flood control and the distribu-tion of 1111proved Seed.
In Latin America present indications are thatin 1.955/56 total production and food productionwere slightly above th.e level of the precedingyear. There was an .increase in pi..oduction inmost countries of the region, but in Argentinagrain output, except for maize, fell sharply, mainlybecause of unfavorable weather, so that theregion's total output of food crops did not show agreat increase. This .was to some extent counter-a,cted, however, by an increase in the region'slivestock production and some non-food prod-ucts. The production of beef increased rathermore than in most recent years, and coffee pro-duction exceeded the average 1934-38 level forthe first time since the wa,r.
Production in the Near East, after increas-ing rapidly, has 110W remained at approximatelythe same level for three seasons, even showing aslight declining trend. In 1955/56 grain outputincreased slightly, with larger wh.eat and barleycrops in Turkey and Iran, but wa,s below thepeak level of 1953/54 bocausi3 of poor crops inIraq, jordaff and Syria, and lower rice pro-duction. in ni ost of the region. The cotton areacontinued to expand, especially in Egypt, wherereduced support prices for wheat and the casingof acreage restrictions caused some transfer tocotton, and in Syria. These increases were offset byreductions in the region's output of a number ofmin.or crops, in.cluding pulses, olive oil, datesa,nd coffee.
The failure of production to expand in Africa,where the increase had been very rapid up to
1953/54, was largely the result of poor harvestsin North Africa. Production of grains, -wine andolive, oil in that area was very low, and someearly vegetables were affected by the severewinter. In the rest of the region .productionwas generally maintained or increased in 1955/56.The Union of South Africa appears likely tohave had another record year, with record pro-duction of a number of commodities, includingwheat, and a maize crop which, although su4-stantially below the last three seasons, is stillwell above the 1948-52 average level. In theregion as a whole production of sugar, citrusfruit and coffee ha,s continued its steady expan-sion, and groundnut production appears to havebeen almost as large as in 1953/54, but the output,of rice fell. The Gold Coa,st and Nigeria hadtheir best cocoa crops .for some years.
Pattern of Production
There were no very substantial changes inthe commodity pattern of world production dur-ing 1955/56 (Figure II-1 and Annex Table 1). Themain features of th.e year's production were in-creased harvests of grains and cotton after th.elower levels of 1954/55, and a continuation ofthe tendency for livestock products to increasemore rapidly than crop production in most ofthe more developed countries.
Grain harvests were generally good in 1.955/56.Canada and Australia had large wheat cropsafter their poor harvests in the previous season,so that world production resumed its rising trendin spite of pool- crops in Argentina and FrenchNorth Africa. IVIost other crops showed a smallincrease in 1955/56, though production of a fewcommodities declined, including potatoes (largelybecause of further reduction in some Western
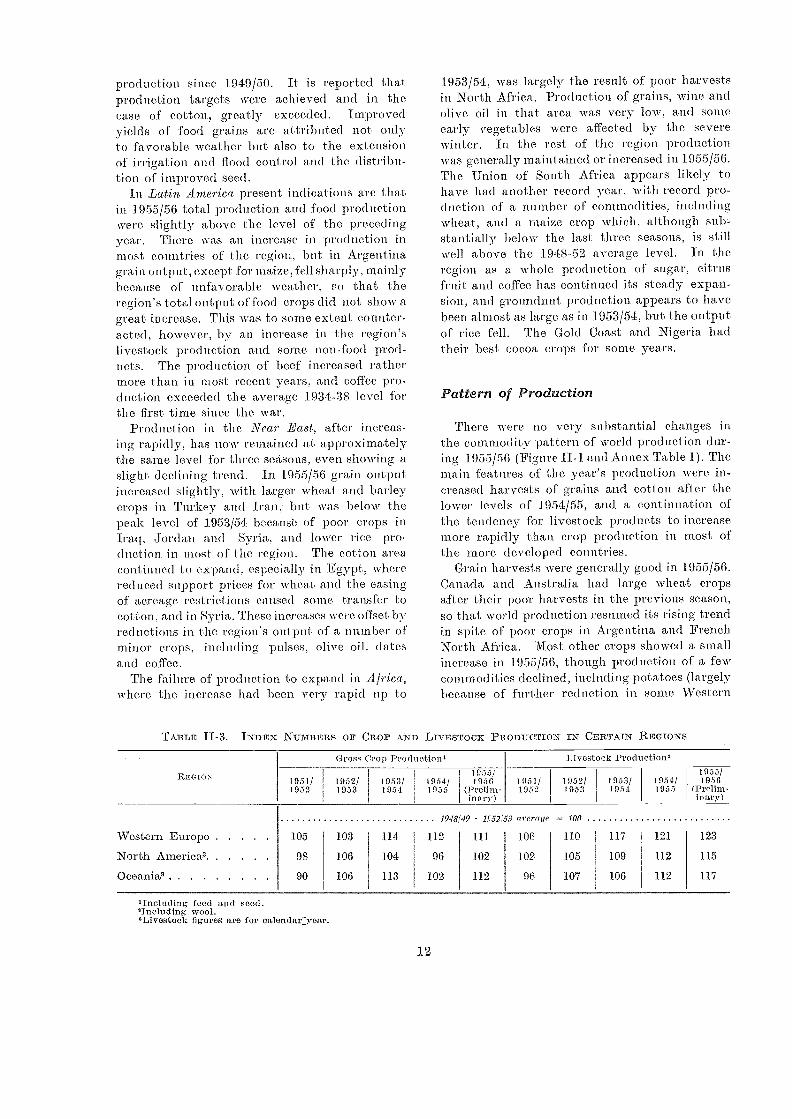
TABLE II-3. INDEx Ni7mBERS or CRor AND LivEsTOCK PRODUCTIoN IN CERTAIN REGIONS
iincluding feed and seed.,Ineluding wool.,Llyestoek figures are for ealendar:year.
1948 49 - 52;53 10011 average
12
Western Europe 105 103 114 112 111 106 110 117 121 123
North America' 98 106 104 96 102 102 105 109 112 115
Oceania' 90 106 113 102 112 96 107 106 112 117
REGION
Gross Crop Production, Livestock Production,
1951/ 1952/ 1953/ 1954/1933/1956 1951/ 1952/ 1953/ 1954/
1955/1956
1952 1953 1954, 1955 (Prelim-inary)
1952 1953 1954 1955 (Prelim-inary)
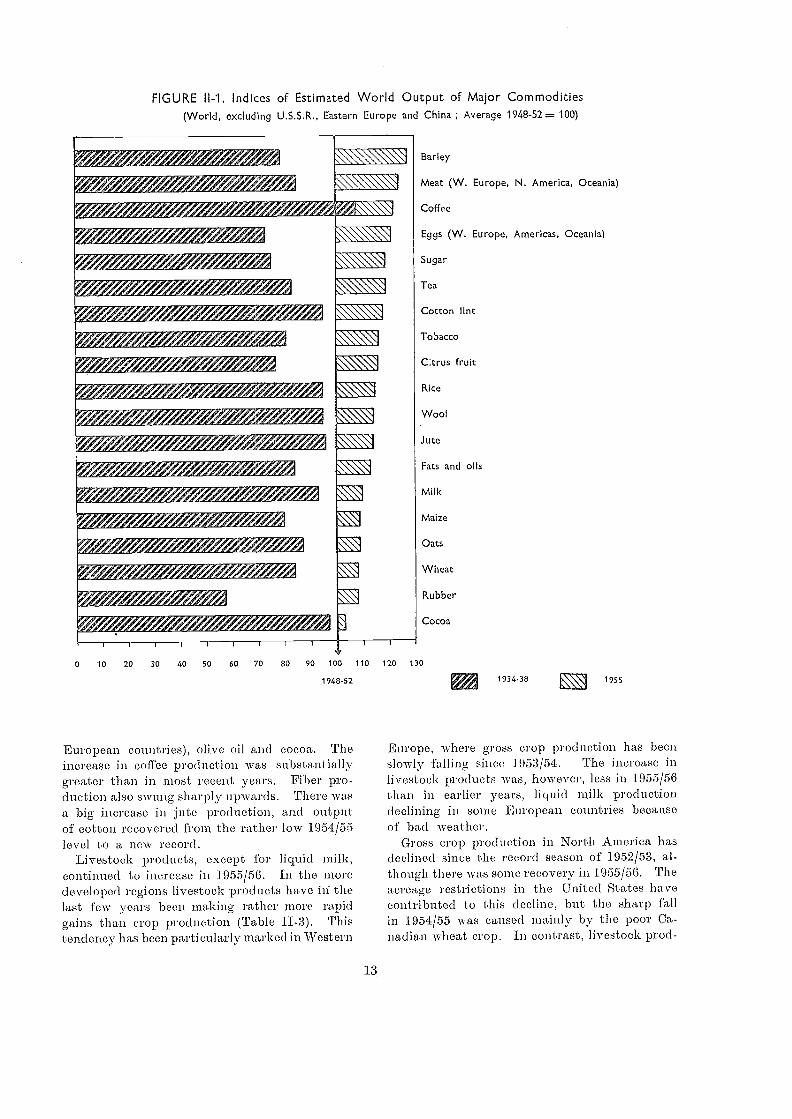
FIGURE 11-1. Indices of Estimated World Output of Major Commodities(World, excluding U.S.S.R., Eastern Europe and China ; Average 1948-52 100)
Wire/7/1.10"
e 0:11:172 ',422;;;! 1:7
,,,,,,=,-74,W,,,,a2/7,7?,??4:/
je"
42'2;o!Ks".,
-7/ e %/1
f,-,74?e
geae. /7/3
European countries), olive oil and cocoa. Theincrease in coffee production was substantiallygreater than in most recent ye,ars. Fiber pro-duction also swung shauly upwards. There wasa big increase in jute production, and outputof cotton recovered from the rather low 1954/55level to a new record.
Livestock products, except for liquid milk,continued to ineree,se in 1955/56. In the moredeveloped regions livestock products h.ave in thelast few years buen making rather more rapidgains than crop production (Table II-3). Thistendency has been particularly marked in Western
13
Barley
Meat (W. Europe, N. America, Oceania)
Coffee
Eggs (W. Europe, Americas, Oceania)
Sugar
Tea
Cotton lint
Tobacco
C;trus fruit
Rice
Wool
Jute
Fats and olls
Milk
Maize
Oats
Wheat
Rubber
Cocoa
Europe, where gross crop production has beenslowly falling since 1953/54. The increase inlivestock products was, however, le,ss in 1955/56than in earlier years, liquid milk productiondeclining in some European countries becauseof bad weather.
Gross crop production in North America hasdeclined since the record season of 1952/53, al-though there was some -recovery in 1955/56. Theacreage restrictions in the United States havecontributed to tisis decline, but the sharp fallin 1954/55 was caused .mainly by the poni' Ca-nadian wheat crop. In contrast, livestock prod-
0 10 20 30 40 50 60 70 80 90 100 110 120 130
1948-$2 1934-38 1955

TABLE IT-4. ESTIMATED PRECENTAGE OF LIVE-STOCK PRODUCTS IN TOTAL AGRICULTURAL
OTJTPUT
NeTs: These estimates are based on price-weighted aggregates.Including wool.
acts have shown a steady increase every yearduring this Saille perol. In Oceania, live-stock products have continued to increase fairlyrapidly. Crop production has fluctuated rathermore aryl is now illSt below the 1953/54 Peak.
..fn the three more developed regions, live-stock products make up a large proportion of'the total value of agricultural output, althoughin Europe the prewar p:roportion has mit yetbeen completely regained. On the other hand,livestock products occupy a much smaller placein the agricultures of the less developed regions,which contrasts with ale increased consumptionnecessary to improve the quality oh diets (Table111-4). In the underdeveloped :re,gions statisticsof livestock products are generally inadequateto give any reliable indication of year to year(dianges in production.
Fisheries Production
In 1955 production in most countries Ivas closeto the levels of 1952-54. There were a few install.ces oh increased output and rather more of' mod-erate declines. '..Ch.ese were due mainly to factorsoutside the control of th.e industry such as lesserabundance of fish on the grounds or un favorableweather, and not to any reduction of fisheryaotivities (Annex Ta,ble [2).
Forestry Production
Forest products have continued their steadyexpansion in response to strong detnan.d, andworld production of most of the principal catego-ries reached new record levels in 1955. NorthAmerica and the U.S.S.R. each accounted for
14
abont one third of the increase' in world pro-duction of industrial roundivood. World pro-duction of wood pulp rose by as much as 1.0pe,rcent, reflecting increased capacity for IICWS-print WWI paper and board manufacture. InNorth America a lafge, increase in the pro-duction of sawit softwood .was sti.01Ulated by thebuilding boom :in I. summ.er of 1955 andproduction of 'most other forest products alsorose very sharply. The region's production ofsawn hardwood fell, however, so that the in-creased outpnt of this commodity in th.e rest ofthe world was largely offset (see Annex Tables).
The Production Outlook for 1956/57
There will probably be a further small increasein .world agricultural production in 1956/57.Preliminary estimates for the Northern Hemi-sphere indicate that harvests 'will generally againbe large unless unfavorable weather conditionsoccur later in the season.
North A ni erican agricultural productionshould be near the record level of 1955/56. Inthe United States, the total acreage plantedto crops appears to be, slightly smaller, butoutput of most livestock 1.:iroditets is namingahead of last yea:.. Wheat 'production, on allunchanged acreage, is ext)ected to be only Veryslightly belo'W las year's crop, and the acreewcplanted to feed grains is smaller ; productionof rice, tobacco and cotton may be red-acedbecause of smaller acreage allotments and theprobability that yields will not reach last year'srecords. In Canada a slightly reduced acreageami less favorable soil moisture conditions pointto a sitial! .reduction in the wheat 'crop, *hut
coarse grain acreages appear to be somewhatincreased.
Good harvests are expected in most of WesternEurope, in spite of the severe winter. In someindividual countries, however, the effects of theeold weather will be considerable, especially inFrance and perhaps Spain. The olive cropis expected ti) be severely effected, also vinos,almonds and some tree fruits such as apricotsa.nd early peaches. The, hard winter also retard-ed the growth of pasture, which may reducelivestock produ.ction during 1956. "Damage towinter cereals appears to have been greatest inFrance, where the wheat harvest will be muchsmaller than normal, as the crop of some i to
million ha. is estimated to have been destroy-ed and much damage done on the remaiaing
Milo tos Prew"aeragev
A :wog,19 Is'.1!:-19:c,;.)g
Average1953/54 -1955/50
Oceania 85 84 84Western Europe 71 65 68North America GO oi 60Latin America 43 43 41
Near East 35 33 30
Africa 27 25 25
Far East (excluding China) 17 17 17
All aboyo regions 47 45 46
are,a. It is expected, however, that with thehelp of stocks the wheat crop will be sufficientfor domestic requireinents, though export saleshati to be suspended. Part of the -winter wheatarea -was re-seeded with barley; there may there-fore be either a surplus of barley for export,or a reduction of maize imports. In the U.S.S.R.spring sowings are reported to have been de-layed by the bad -weather, and this may be par-ticularly important in the case of sugar beet.Grain production seems likely to be reducedin some countries of Southeast Europe.
FCW precise indications are yet available for.the rest of the world. Such indications as thereare suggest generally larger harvests in 1956/57,but present expectations may of course be falsi-fied by the weather. In Oceania, so far as econom-ic conditions are concerned, farmers' intentionsappear to be to continue the rising trend ofproduction, and livestock products in particularshould continue to increase steadily. In LatinAmerica production should begin to rise again,though in Brazil the coffee crop is reported .tollave been severely damaged by frost. An in-crease in Argentina's agricultural output is an-ticipated as a result of the greater economicincentives to farmers provided under the newpolicy in that country, and in Chile also th.e prog-ress that has been achieved under the develop-ment plan should result in increased o-ut-put in1956/57, after several years of stagnation. Inthe, Near East moisture conditions for wintereereals are reported to have been good in mostcountries except Turkey. African agriculturalproduction should resume its rising trend in1-956/57. Better grain harvests are expectedthis year in French North Africa and the Unionof South Africa's steady expansion of outputshould continue,.
ECONOMIC ACTIVITY AND THEDEMANÌ FOR AGRICULTURALPRO lit UCT S
The 1955/56 crop year saw a continuationof the improved economic conditions which in thepreceding year had followed the mild 1953/54recession.. New heights in economic activityWere reached and the boom conditions in theindustrialized countries stimulated tlie demandfor agricultural products throughout the world.-In the United States, industrial production rose
sharply to a record height in October 1955 andremained aImoSt unchanged at this high level
15-
during the rest of 1955/56. This stability, how-ever, conceale,d contrary movements in variousindustries, an expansion in, e.g., metals andelaemicals offsetting a decline in production inautomobiles and related industries, agricultural.rnachinery and electrical appliances. Similarlythe expected decrease in IICAV private home con-struction was partly alleviated by greater publicand private commercial building. Personal in-come has been little affected by the appearanceof a few -weak spots in the economic picture,and personal consumption expenditures have con-tinued to rise, though at a slower rate,. Withgovernment expenditures increasing chiefly onthe side of State and local authorities, and witha great expansion in both industrial plant andinventories in spite of tighter credit, the grossnational product in 1955/56 was about 7 per-cent above the preceding fiscal year. Domesticdemand for agricultural products has remainedhigh and etxports of agricultural proditcts in-creas ed by about 10 percent, mainly because ofgreater efforts in surplus disposals. Agriculture,however, remained a -weak spot iii time nationalecono my. .
The economic boom was even greater inCanada. Industrial production rose throughout1 955/56, though it slowed down in the latterpart of the year, as virtually full employmentwas reached and 'bottlenecks in .the supply ofmaterials became more frequent. Real incomesincreased, ami so tits() did Ninsuiner's expendi-tures. Prices remained stable with the help ofgreatly expanded imports. Domestic investmentwas higher although inventory accumulationwas less pron.ounced than in the U.S.A. As inthe United States, however, the farm sector didnot share in the general economic gains.
fn. Oceania domestic demand for agriculturalproducts increased slightly and a somewhat high-er e,xport volume compensated for lower priceson international markets. Favorable crup con-ditions assured ample supplies for both the homeand foreign markets, 'totality a 1.0 percent biggeroutput of wool, and the increased foreign de-mand for 'butter permitted larger exports. Nev-ertheless the unfavorable balance of trade per-sisted in the first half of' 1955/56 and importrestrictions liad to be maintained while,Australia, because of excessive domestic demand,credit was tightened and consumir ption taxesincreased.
After an expansion CMn faster than in North.America a high plateau has established itself
in. the industrialized countries of Western Europe,tund the growth of industrial production hasslowed down as the expanding economies arereaching the limits of available resources in manysectors, particularly manpower. Import restric-tions and other measures limiting consumers'demand in some of the main markets outsideEurope have, however, led to difficulties in someinclustries (automobiles), while other industries,especially textiles, have been affected by grow-ing competition from exporters in other con-tinents. The high demand :for imports has createdbalance - of - payments difficulties, particularlyin the Scandinavian countries and the UnitedKingdom. In order to restrain domestic con-sumers' demand, and to coin:bat the inflationarytrend connected with over-full employment,most Western European governments havetried to limit demand by restricting commercialcredit, raising interest rat es, making conditionsfor installment buying 1-110rC severe, increasingpurchuse taxes, and reducing public expenditures.But the continued expansion of industrial in-vestment has to a great extent offset the effectsof limiting consumer demand. Measures to putbrakes on the boom have not yet caused signsof a genuine deflation ; while th.ey were fairlyeffective in the Scandinavian countries, stillstronger nwasures had to be adopted by theUnited Kingdom in early 1956. In the otherWestern European countries the pressure of fullemployment is only in its early stages. Underthe impact of the boom, domestic demand foragricultural Proftilets in Western :itidirePe WaSbllOyant, but due to the good harvest of 1955,import requirements of grains were 'reduced.
The picture for the economically more advanc-ed parts of the world is thus more or less similar.The rapid expansion of 1955 has overstrainedexisting productive facilities and necessitatedgovernmental action to damp down the boom.These measures and a declining demand for du-rable consumer goods, reinforced by some reduc-tion of exports, have slowed clown and sometimesstopped further expansion of economic activity.This remains, hONSTVer, on a very high level.Consumer demand for foodstuffs and beveragesis strong, but the demand for fibers and rubberhas been affected by the declining output of'textiles, and more recently of automobiles.
The big advances in time industrialized coun-tries liad favorable repercussions on som.e rawmaterial exporting areas among the more .under-developed countries, particularly those export-
16
.ing crude oil and nonferrous metals and, untilrecently, also rubber. At time same time, how-ever, exporters of fibers, tropical products, riceand grains found th.eir markets under pressure.
In :Latin America the old difficulties in foreignpayments, iinsiffficient investment capital andinflation persisted throughout 1955/56. The highrate of population increase, rising incomes andcontinuing industrialization, though at a consid-erably reduced pace, accounted for the highervalue of imports in spite of slightly lower importprices, while much greater declines in exportprices more than offset minor increases in thevolume of exports. The need to expand exportsas well as to restrict .imports has strengtheneda move away from programs of rapid indus-trialization toward greater emphasis on agricul-tural development. But although agriculturaloutput has risen by some 14 percent over thelast five years, on a per caput level it .is stillsome 5 percent below th.e prewar level. Somesuccess in liberalizing foreign trade lias beenachieved in Brazil, through a multilateral tradeand payments system with a group of Europeancountries, and exchange reforms have been car-ried out in Argentina, Chile, Colonfbia, Paraguayand Uruguay. Domestic demand for agricul-tural products i.s being maintained within thelimits of the relatively low purchasing power;the chances of achieving the required higherexport values are impaired by the growing com-petition on international markets, and by thepause in economic expansion of Latin America'smost important foreign markets.
While industrial production continued to rise,though at a somewhat slower mate, in the coun-tries of time For East, per caput agriculturalproduction remains 'below .prewar levels. Thisis reflected in the declining share of the region inworld agricultural exports, and in this region,too, many countries (India is a notable excep-(ion) are shifting the emphasis in their long-term development programs toward agriculture.in time meantime a favorable crop has enabledIndia to scale down further its food imports andto devote more of the scarce foreign exchangeto the import of machinery and industrial rawniaterials, while, as noted elsewhere, the secondIndian Five Year Plan proposes a considerablyfaster industrialization. Better prices and aslightly higher volume of exports after the de-valuation of the ellrrefley have somewhat im-proved the balance of trade of' Pakistan. japanis profiting in 1956 from greatly expanded ex-
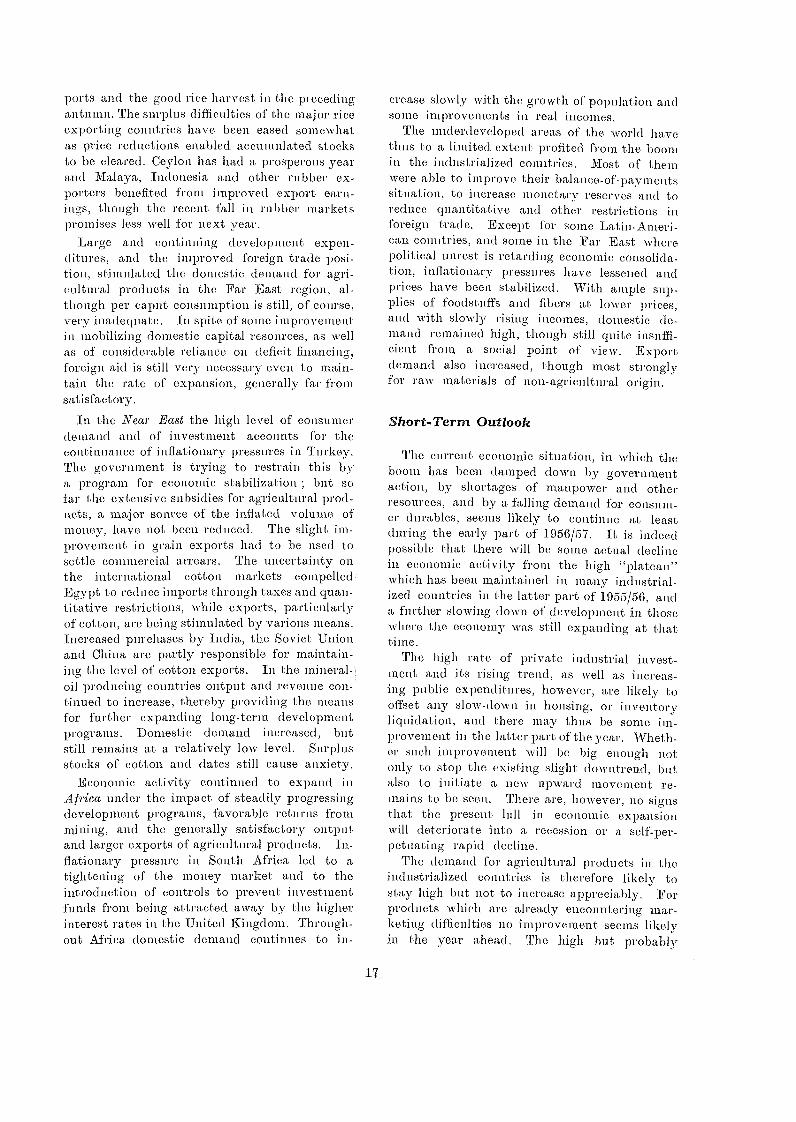
ports ami the good rice harvest n the pi ecedingautumn. The surplus difficulties of the major riceexporting countries have been eased somewhat,as price reductions enabled accumulated stocksto be cleared. Ceylon has had a prosperous yearand Malaya, Indonesia and other rubber ex-porters benefited from improved export earn-ings, though the recent, fall in rubber marketspromises less well t'or next year.
Large and continuing de,velopment expen-ditures, and the improved foreign trade posi-tion, stimulated the domestic demand for agri-cultural products in the Far -.East region, al-though per caput consumption is still, of course,very inadequate. In spite of soine improvement,in mobilizing domestic capital resources, as wellas of considerable reliance on deficit financing,foreign aid is still very necessary even to main-tain the rate of expansion, generally far fromsatisfactory.
In the Near East the high level of consumerdemand and of investment accounts for thecontinuance of inflationary pressures in Turkey.The government is trying to restrain this bya program for economic stabilization ; but sofar the extensive subsidies for agricultural prod-ucts, a .major source of the inflated volume ofmoney, have not been reduced. The slight im-provement in grain exports had to be used tosettle commercial arrears. The .uncertainty onthe international cotton markets compelled.Egypt to reduce imports through taxes and quan-titative restrictions, while exports, particularlyof cotton, are being stimulated by -various means.Increased purchases by India, th.e Soviet Unionand China are partly responsible for maintain-ing the level of cotton exports. In the mineral-oil producing countries output and revenue con-tinued to increase, thereby providing the meansfor further expanding long-term developmentprograms. Domestic demand increased, butstill remains at a relatively low level. Surplusstocks of cotton and dates still cause anxiety.
Economic activity continued to expand inAfrica under the impact of steadily progressingdevelopment programs, favorable returns frommining, and the generally satisfactory outputand larger exports of agricultural products. In-flationary pressure in South Africa led to atightening of the money market and to theintroduction of controls to prevent investmentfunds from being attracted away by the higherinterest rates in the United Kingdom. Through-out Africa domestic demand continues to in-
17
crease slowly with time growth of population andsome improvements in real incomes.
The underdeveloped areas of the world havethus to a limited extent profited from the boomin the industrialized countries. Most of themwere able to improve their balance-of-paymentssituation, to increase monetary reserves and toreduce quantitative and other restrictions inforeign trade. Except for some Latin-Ameri-can countries, and some in the Far East wherepolitical unrest is retarding economic consolida-tion, inflationary pressures have lessened andprices have been stabilized. With ample sup-plies of foodstuffs and fibers at lower prices,and with slowly rising incomes, domestic de-mand remained high, though still quite insuffi-cient from a social point of view. Exportdemand also increased, though most stronglyfor raw materials of non-agricultural origin.
Short-Term Outiook
The current economic situation, in which theboom has been damped down by governmentaction, by shortages of manpower and otherresources, and by a falling demand for consum-er durables, seems likely to continue at leastduring the early part of 1956/57. It is indeedpossible that there will be some actual declinein economic activity from the high "plateau"which has been maintained in many industrial-ized countries in the latter part of 1955/56, anda further slowing down of development in thosewhere the economy was still expanding at thattime.
The high rate of private industrial invest-ment and its rising trend, as well as increas-ing public expenditures, however, alT likely tooffset any slow-down in housing, or inventoryliquidation, and there may thus be some im-provement in the latter part of the year. Wheth-er such improvement will be big enough notonly to stop the existing slight-, downtrend, butalso to initiate a new upward movement re-mains to be seen. There are, however, no signsthat the present lull in economic expansionwill deteriorate imito a recession or a self-per-petuating rapid decline.
The demand for agricultural products in theindustrialized countries is therefore likely tostay high but not to increase appreciably. Forproducts which are already encountering mar-keting difficulties no improvement seems likelyin the year ahead. The high but probably
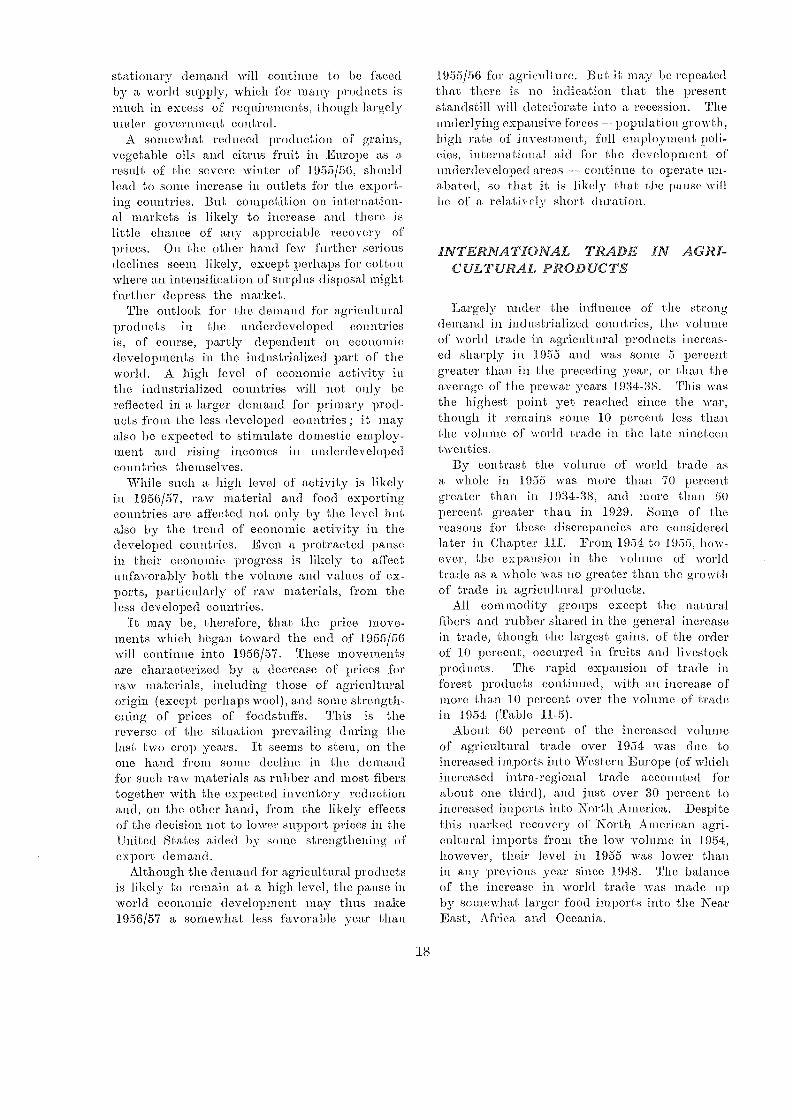
stationary demand will continue to be :facedby a lvorld supply, which for many products ismuch in excess of requirements, though largelyunder gavernment control.
A somewhat reduced production of grains,vegetable oils and citrus fruit in Europe as aresult of the severe winter of 1955/56, shouldlead to some increase in outlets Ifor the export-ing countries. But competition on internation-al markets is likely to increase and there islittle chance of any appreciable recovery ofprices. On the other hand few further seriousdeclines seem, likely, except perhaps for cottonwhere an intensification of surplus disposal mightfurther depress the market.
The outlook for the demand for agriculturalproducts in the underdeveloped countriesis, of course, partly dependent on economicdevelopments in the industrialized part of the,world. A high level of economi.c activity inthe industrialized countries will not only bereflected in a larger demand for primary prod-ucts from the less developed countries ; it mayalso be expected to stimulate domestic employ-ment and rising incomes in underdevelopedcountries themselves.
While such a high level of activity is likelyin 1956/57, raw material and food exportingcountries are affected not only by the level butalso by the trend of economic activity in thedeveloped countries. EVCI.1 a protracted pausein their economic progress is likely to affectunfavorably both the 'volume and values of ex-ports, particularly of raw materials, from theless developed countries.
It may be, therefore, that the price move-ments which began toward the end of 1955/56will continue into 1956/57. These movementsare characterized by a decrease of prices forraw materials, :including those of agriculturalorigin (except perhaps wool), and some, strength-ening of prices of foodstuffs. This i.s thereverse of the situation prevailing during thelast two crop years. It seems to stem, on theone hand from soine decline in the demandfor such raw materials as rubber and most fiberstogether with the expected inventory reductionand, on the other hand, from the likely effectsof the decision not to lower sup-part prices in th.eUnited States aided by some strengthening ofexport demand.
Although the demand for agricultural prod.uctsis likely to remain at a high level, the pause inworld economic development may thus make1956/57 a somewhat less favorable year than
18
1955/56 for agriculture. But :it may be repeatedthat there is no indication that the yresentstandstill will deteriorate into a recession. Theunderlying expansive forces population growth.,high rate of investment, full eurployment poli-cies, international aid for the (h.velopment ofunderdeveloped areas continue to operate un-abated, so that it is likely that the pause willbe of a relati \,ely short duration.
INTERiVATIONAL TRADE IN AGRI-CULTURAL PRODUCTS
Largely under the influence of the strongdemami iii industrialized countries, the volumeof world trade in agricultural products increas-ed sharply in 1955 and was some 5 percentgreater than in the preceding year, or than the,average of the prewar years 1934-38. This wasthe highest point yet reached since the war,though it 1..ernaitts some 10 percent less thanthe volume of world trade in the late nineteentwenties.
By contrast the volume, of world trade asa whole in 1955 was more than 70 percentgreater than in 1934-38, and more than 50percent greater than in 1929. Some of thereasons for these discrepancies are consideredlater in Chapter 111. From 1954 to 1955, how-ever, the exparision in the volume of worldtrade as a whole .was no greater than the growthof trade in agricultural products.
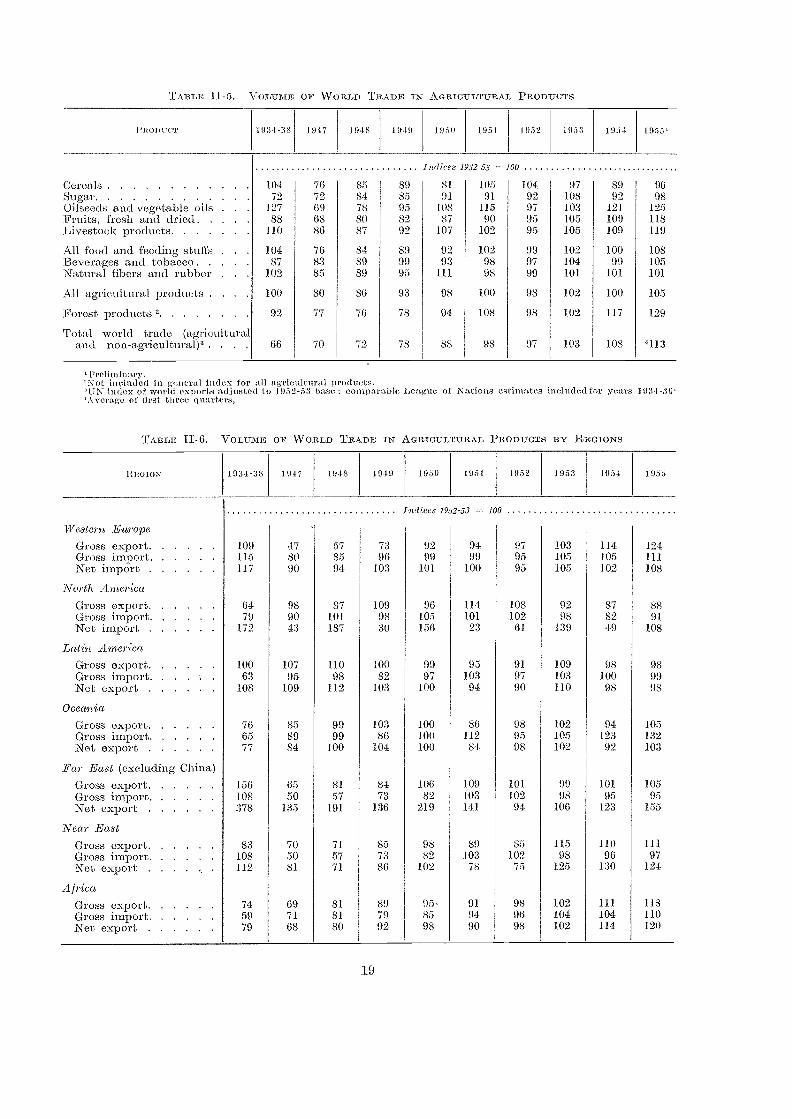
All commodity groups except the naturalfibers' and rubber shared in the general increasein trade, though the largest gains, of the orderof 10 percent, occurred in fruits and live,stockproducts. Time rapid expansion of trade inforest products continued, with ami increase ofmore than 10 percent over the volume of tradein 1954 (Table II-5).
About 60 percent of the increased volumeof agricultural trade over 1954 was due toincreased iraports into Western Europe (of whichincreased intra-regional trade accounted forabout one third), and just over 30 percent toincreased imports into North America. Despitethis marked recovery of North American agri-cultural imports from the low .volume in 1954,however, their level in 1955 was lower thanin any previous year since 1948. The balanceof the increase in world trade was made upby somewhat larger food imports into the NearEast, .Africa and Oceania.
TABLE, II-5. VoLIJMIC WORLD TR )E IN Au RICULTURAL PRODUCTS
19
I ?Nice 1952-53 = 100
JPreliminary.'Not ineluded in general index 'for all agricultural produc -s
TN index of world exports adj usted to 1952-53 base : comparable - cagne o f Nations esti mates included for ycais 1934-36-'Average of first three quarters,
TABLE 1.1-6. VoLumr OF 'W ORLD TRADE IN AGRICULTURAL PRODUCTS BY REGIONS
Western EuropeGross export-Gross irnportNet import
109115I 17
478090
578594
7396
103
9299
101
9499
100
979595
103105105
114105102
124111108
North, AmericaGross export 64 98 87 109 96 114 108 92 87 88Gross import 79 90 101 98 105 101 102 98 82 91Net import 172 43 187 30 156 23 61. 139 49 108
Latin AmericaGross export 100 107 110 100 99 95 91 109 98 98Gross import 63 95 98 82 97 103 97 103 100 99Net export 108 109 112 103 100 94 90 110 98 98
OceaniaGross export 76 85 99 103 100 86 98 102 94 105Gross import 65 89 99 86 100 112 95 105 123 132Net export 77 84 100 104 100 84 98 102 92 103
.lear East (excluding China)Gross export 156 65 81 84 106 109 101 99 101. 105Gross import 108 50 57 73 82 103 102 98 95 95Net export 378 1135 191 136 219 141 94 106 123 155
Near EastGross export 83 70 71 85 98 89 85 115 110 111
Gross import 108 50 57 73 82 103 102 98 96 97Net export 112 81 71 86 102 78 75 .1.25 130 124
AfricaGross export 74 69 81 89 95- 91 98 102 111 118Gross import 59 71 81 79 85 94 96 104 104 110Net export 79 68 80 92 98 90 98 102 114 120
PitopucT 1934-38 1947 1148 1919 1:1511 1951. 1952 1953 1054 19551-
1.ndices 1.152-53 loo
Cereals 104 76 85 89 81 105 104 97 89 96Sugar 72 72 84 85 91 91 92 108 92 98Oilseeds and vegetable oils 127 69 78 95 108 115 97 103 121 125Fruits, fresh and dried 88 68 80 82 87 90 95 105 109 118Livestock products 110 86 87 92 107 102 95 105 109 119
All food an.d feeding stuffs 104 70 84 89 92 102 99 102 100 108:Beverages and tobacco 87 83 89 99 93 98 97 104 99 105Natural fibers and rubber 102 85 89 95 98 99 101 101 101
All agricultural products . 100 80 86 93 98 100 98 102 100 105
Forest products 2 77 76 78 94 108 98 102 117 129
Total world trade (agriculturaland non-agricultural)' . . . . 66 70 79 78 88 98 97 103 108 '113
O 1934-38 1947 :1948 1949 1956 1 95 1 1952 1953 1954 1955
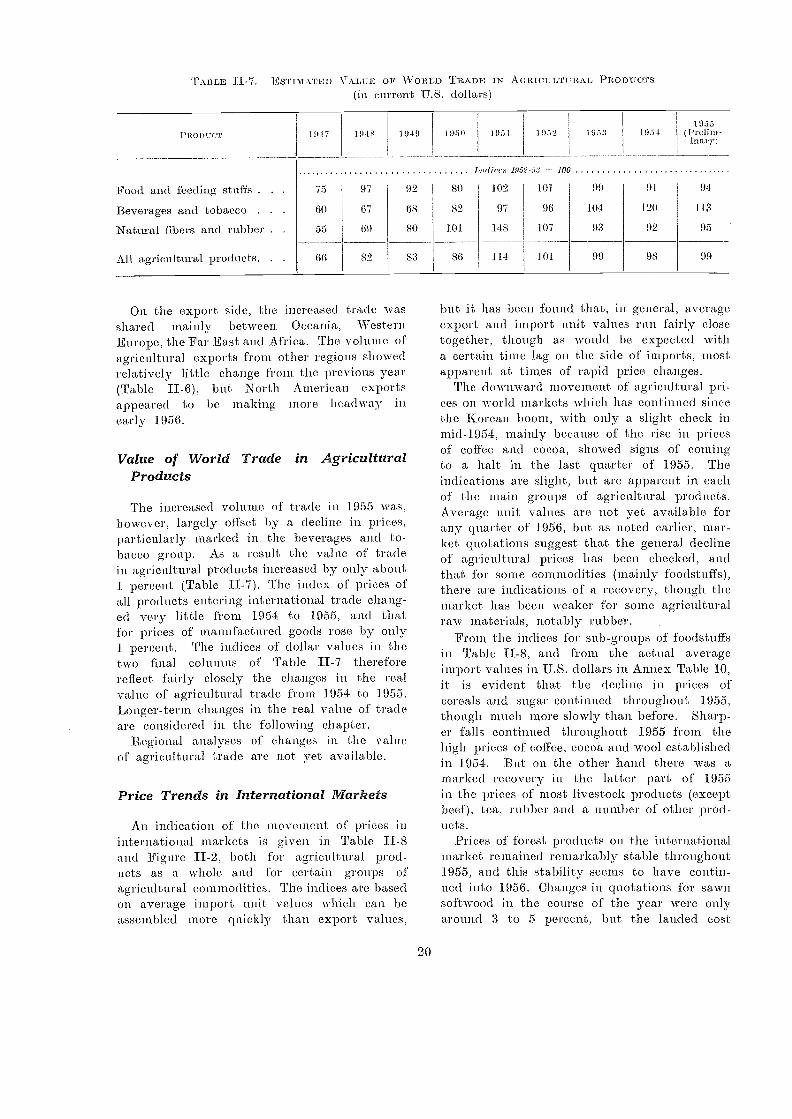
TABLE II-7. EsTIATATED VALUE OF WORL D TRADE IN AGRICULTURAL Paonuurs(in current, U.S. dollars)
PROD l7CT 1947 1048
On the export side, the .increased trade wasshared mainly between Oceania, WesternEurope, the Far East and Afrca. The volume ofagricultural exports froni other regions showedrelatively little change from the previous year(Table II-6), but North American exportsappeared to be making more headway inearly 1956.
Value of World Trade in AgriculturalProducts
The increased volume of trade in 1955 was,however, largely offset by a decline in prices,particularly marked in the 'beverages and to-bacco group. As a result the value of tradein agricultural products increased by only about1 percent (Table II-7). The index of prices ofall products entering international trade chang-ed very little from 1954 to 1955, aml thatfor prices of manufactured goods rose by only1 percent. The indices of dollar values in thetwo final columns of Table II-7 thereforereflect fairly closely the changes in the realvalue of agricultural trade from 1054 to 1955.:Longer-term ch.anges in the real value of tradeare considered in the following chapter.
Regional analyses of changes in the valueof agricultural trade are not yet available.
Price Trends in International Markets
An indication of the movement of prices ininternational markets is given in Table II-8and Figure II-2, both for agricultural prod-ucts as a whole and for certain groups ofagricultural commodities. The indices are basedon average import unit values which can beassembled more quickly than export values,
1949
20
1950 195'2 1953 1054.1955
(Prelim-inary)
but it has been found that, in general, averageexport and import unit values run fairly closetogether, though as would be expected witha certain time lag on the side of imports, mostapparent at times of rapid price changes.
The downward movement of agricultural pm-i-ces on world markets which has continued sincethe Korean boom, with only a slight check inmid-1954, mainly because of the rise in pricesof coffee and cocoa, showed signs of comingto a halt in the last quarter of 1955. Theindications are slight, but are apparent in eachof the main groups of agricultural products.Average unit values are not yet available forany quarter of 1956, but as noted earlier, mar-ket quotations suggest that the general declineof agricultural prices has been checked, andthat for some commodities (mainly foodstuffs),there are indications of a recovery, though themarket has been weaker for some agriculturalraw materials, notably rubber.
From the indices for sub-groups of foodstuffsin Table II-8, and from the actual averageimport values in U.S. dollars in Annex Table 10,it is evident that the decline in prices ofcereals and sugar continued throughout 1955,though much more slowly than before. Sharp-er falls continued throughout 1955 from thehigh pm-ices of coffee, cocoa and wool establishedin 1954. But on the other hand there was amarked recovery in the latter part of' 1955in the prices of most livestock products (exceptbeef), tea, rubber and a number of other prod-ucts.
Prices of forest products on the internationalmarket remained remarkably stable throughout1955, and this stability seems to have contin-ued into 1956. Changes in quotations for sawnsoftwood in the course of the year were onlyaround 3 to S percent, but the landed cost
.1,hrlices 1952-1,1 -- 100
Food and feeding stuffs . . 75 97 92 80 102 101 99 91 94
Beverages and tobacco . . . 60 67 68 82 97 96 104 120 113
Natural fibers and rubber . . 55 69 80 101 148 107 93 92 95
All agricultural products. . 66 89 83 86 114 101 99 98 99
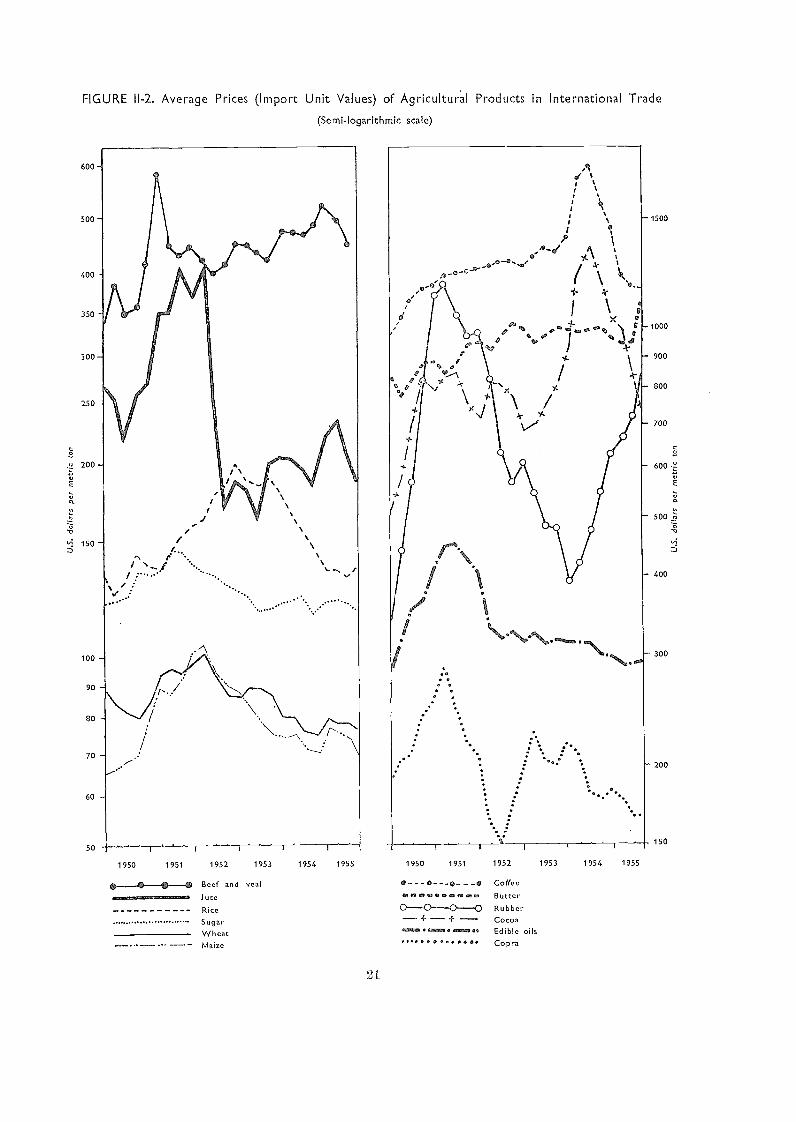
FIGURE 11-2. Average Prices (Import Unit Values) of Agricultural Products in International Trade
(Semi-logarithmic scale)
1 95 0 1951 1952 1953
0-- et Beef and veal
1115=016911.1.M.011100=2640 J ute
Rice
SugarWheatMaize
1954 1955
21
1950 1951 1952 1953 1954 1955
Coffee
f2141010941,002..., ButterRubber_4. Cocoa...moo Edible oils
e .. 00 Copra
E
6
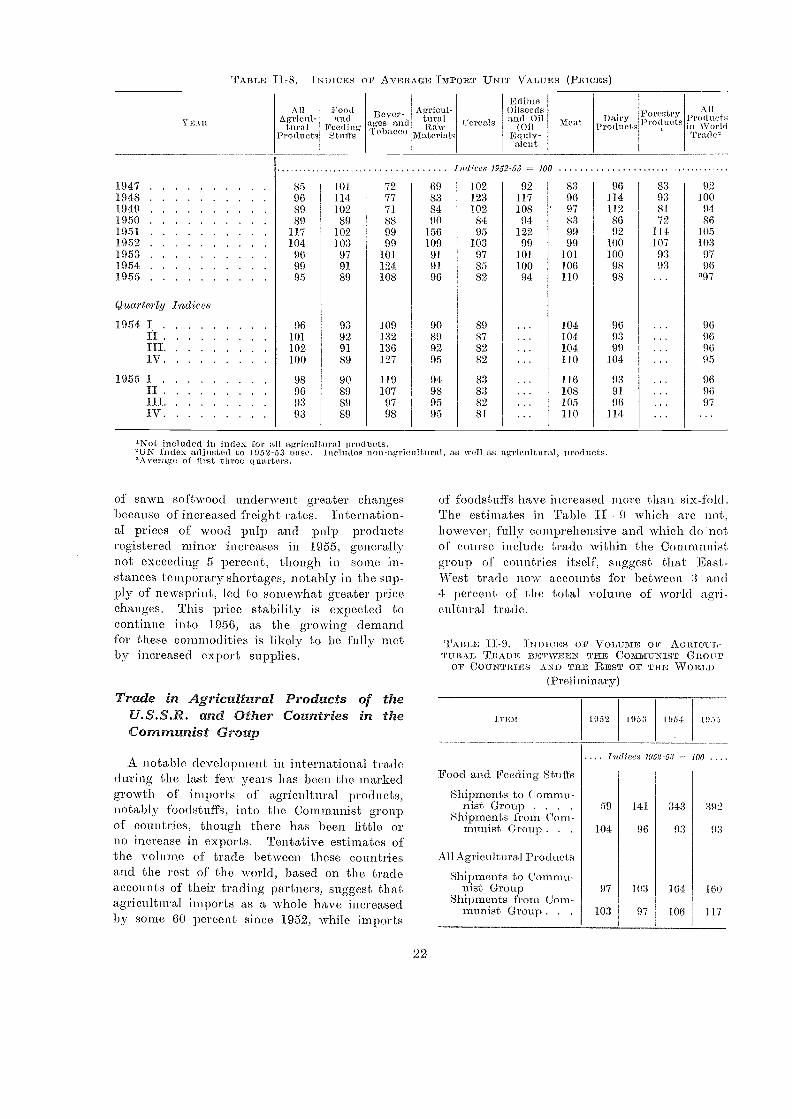
TABLE II-8. EN DICES OF AVERAGE hiroivr ITN-rx VALUES (PE ICES)
of sawn softwood .underwent greater changesbecause of increased freiglit rates. Internation-al prices of wood pulp and pulp productsregistered minor increases in 1955, generallynot exceeding 5 percent, though in some in-stances temporary shortages, notably in the sup-ply of newsprint, led to somewhat greater pricechanges. This price stability is expected tocontinue into 1956, as the growing demandfor these commodities is likely to be fully metby increased export supplies.
Trade in Agricultural Products of theU.S.S.R. and Other Countries in theComrnunist Group
A notable development in international tradeduring the last few years has been the markedgrowth of imports of agricultural products,notably foodstuffs, into the Communist groupof countries, though there has been little orno ilicrease in exports. Tentative estimates ofthe volume of trade between these countriesand the rest of the world, based on the tradeaccounts of their trading partners, suggest thatagricultural imports as a whole have increasedby some 60 percent since 1952, while imports
22
'Not included in index for a I agricultural products.°UN Index adjusted to 1952-53 base. Includes non-ligTicultural, as well as agricultural, products.'Average of first three quarters.
of foodstuffs liare increased more than six-fold.The estimates in Table it - .which. are 1.1.ot,
however, fully comprehensive and which do notof course include trade within the Communistgroup of countries itself, suggest that East-West trade HOW aCCOUlltS fOr between 3 and4 percent of the total volume of world agri-cultural trade.
TABLE f1-9. INnicEs oF .VoLumE OF AGRICUL-TURAL TRADE BETWEEN T FIE COMMUNIST GROUP
OF COUNTRIES AND THE REST OF THE WORLD(Prel iminary)
Indices 1952-53 100
1947 85 101 72 69 102 92 83 96 83 921948 96 114 77 83 123 117 96 114 93 1001949 89 102 71 84 102 108 97 112 81 941950 89 89 88 90 84 94 83 86 72 861951 117 102 99 156 95 122 99 92 114 1051952 104 103 90 109 103 99 99 100 107 1031953 96 97 101 91 97 101 101 100 93 971954 99 91 124 91 85 100 106 98 93 961955 95 89 108 96 82 04 110 98 397
Quarterly Indices
1954 I 96 93 109 90 89 104 96 96II 101 92 132 81) 87 104 93 96III 102 91 136 92 82 104 99 00IV 100 89 127 95 82 110 104 95
1955 I 98 90 119 94 83 116 93 96II 96 89 107 98 83 108 91 96III 03 89 97 95 82 105 96 07IV 93 89 98 95 Si 110 114
PrEn 1952 5 [954 1955
. Indices 1952-53 100 .
Food and Feeding Stuffs
Shipments tu Commu-nist Group . . . 59 141 343 392
Shipments from Corn-munist Group . . . 104 06 93 93
All Agricultural Products
Shipments to Commu-nist Group 97 103 164 I 60
Shipments from Com-munist Group . . 103 97 106 117
Edible
V EA
AllAgricul-
turalProducts
Foodand
FeedingStuffs
Bever-ages andTobacco
Agricul-turalRaw
MaterialsCereals
OilseedsSitu Oil
(OilE quiv-alent
Meat DairyProducts
ForestryProducts
AllProduct sin WorldTrade2
'In. 1054/55 global cereal exports by theU.S.S.R. were in the :region of 3.3 million tons,i.e., a reduction of 15 percent by comparisonwith those of the, preceding year. Althoughthere WaS an increase in the quantities sentto Eastern :Europe, there was a marked declinein those going to Western Europe, 0.8 milliontons as against 1.1 million tons in 1953/54,and during the second half of 1955 the reduc-tion was even :more 'narked. In particular,bread grains exported to this region were only209 thousand tons against 404 thousand tonsin the same period. in 1954. The Eastern Euro-pean countries had not only to reduce theircereal exports sharply, but also markedly in-crease their impon s. Important quantities ofcereals Were 'imported from France by Polandand -Hungary, in addition to cereals purchasedfrom the U.S.S.R.
For the current year, although. there areagreements which provide for :exports o:f cerealsby the U.S.S.R. to various countries, notablyFinland and Norway, at tire same time heavypurchases of cereals by the U.S.S.R. are alsoplanned. An agreement with Canada providesfor imports into the -U.S.S.R. of 1.2 milliontons of wheat in three years. The countriesof :Eastern Europe will buy cereals from France,Western Germany, Canada and Australia. Itseems necessary to con.clude that the 'U.S.S.R.and Eastern Europe, taken together, will be-come, net importers of wheat.
During 1955, imports of rice by the U.S.S..R.aild Other countries of Eastern Europe sho-wed.notable increases. Purchases t'if rice by'U.S.S.R. from Burma and Egypt reached 70'thousand tons, 'which represents a marked ex-pansion. A recent agreement with. Burma 'pro-vi(les :for animal purchases of 400 thousamtons of rice by the U.S.S.R., but some partof this may be resold elsewhere.
Imports of animal prod'ucts by the easternbloc, which :increased strongly in 11)53 and 1954,were reduced in 1955. IM.1)01!t8 Of blittCr andtdieese by the U.S.S.R. practically ceased ; forthe other countries of Eastern Europe they:fell :from, 61 thousand tons to 22 thousand forbutter and :from. 14 thousand tons to 10 thou-sand for cheese. In 1955 the U.S.S.R. import-ed 49 thousand tons of mal, against 87 th ou-sand iii 1954, only pork Imports showing anincrease. perhaps because of the sh.mv increaseout pig numbers in the U.S.S.R. during thepast year. Eastern Europea n. imports of meatfell from 37 to 22 thousand. tons. The only
23
significant exports of livestock products by thecountries of Eastern Europe are eggs, wherethere was a certain increase. In 1954/55 Polandexported 342 million eggs and :Hungary 183million.
The .U.S.S.:It . greatly increased its imports ofsugar, however, as its planned production in1955 was not achieved. Sugar imports MSCfrom 177 thousand tons to 652 thousand tons,:not including imports from Poland andCzechoslovakia., Quantities imported from coun-tries outside the eastern bloc were 65 thousandtons in 1954 and increased. to 620 thousandtons in 1955. The principal supplier was Cuba(465 thousand tons), which has already promis-ed delivery of 200 thousand tons in 1956. The-U.S.S.R. e,xported 207 thousand tons of sugarin 1955 as against 221 thousand in 1954,the chief reduction being in exports to China,which increased its purchases in Eastern Euro-pean countries. These countries have, in gen-eral, increased their sales within the bloc. Inconsequence, Poland and Czechoslovakia ha-vereduced their exports to the rest of the world,while Hungary, which increased them, had tohave recourse to a considerable import of sugar.
There are not yet adequate data on tradein other agricultural products, but generallyspeaking it seems that exports and importswere both reduced during 1955.
CHANGES IN STOCK LEVELS IN 1955156
In 1955/56 additions to stocks seem likelyto have been more modest than in previousveas, in spite of the rise of some 3 percentin -world agricultural production, and of 5 t)er-cent in production in North America wherethe main surpluses are located. The accu.mula-tion of stocks of cotton and grains has stillImt been halted, but stocks of certain otherproducts were somewhat reduced during 1955/56.
To some extent, the smaller additions tostocks in 1955/56 reflect a gradual change inthe :firoduction pattern. Time shift toward in-creasing livestock production in the more devel-oped countries continued, as discussed above,while the demand fui livestock products is stillgrowing. Partly, too, they may reflect the :re-
o in 1955, Poland is esthna ted to 'have solo) 215thousand tons of sugar to the U. S.S. R. 'rho quan-tity exported in 1954 is not known.
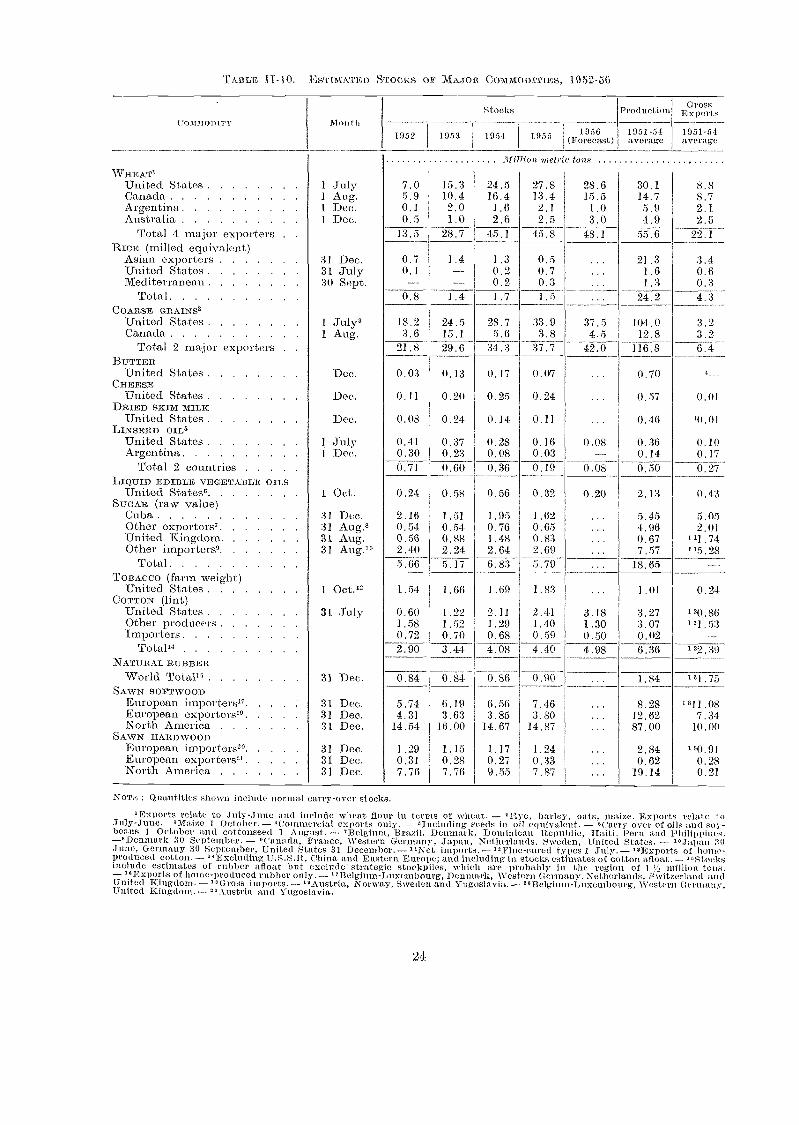
Commoorrv
WHEAT1United St, tesCanadaArgentinaAustralia
Total 4 major exportersRICE (milled equivalent)
Asian exportersUnited States1V1,editerran.ean
TotalCOARSE GRAINS2
United StatesCanada
Total 2 major exportm.sBUTTER
United StatesCHEESE
United StatesDRIED SKIM MILIC
United StatesLINSEED OIL'
United StatesArgentina
Total 2 countriesLIQUID EDIBLE VEGETABLE OILS
United States'SUGAR (raw value)
CubaOther exporters'United KingdomOther importers'
TotalTOBACCO (farm weight)
United StatesCOTTON (lint)
United StatesOther producersImporters
Total"NATURAL RUBBER
World Total"SAWN SOFTWOOD
European importers"European exPorter "North America
SAWN HARDWOODEuropean importers":European exporters"North America
TABLE U 10. ESTIMAI D STOCKS OF MAJOR COMMODITIES, 1952-56
24
1956(Forecast)
Production
1951-54average
GrossExports
1951-54average
NOTE : Quantities shown include nornullcarry-over stocks,
ports relate to July-June and include wheat flour in terms of wheat. - 211ye, barley, oats, maize. 'torts relate toJuly-June. 21VDtize I October. - 2Com mereial exports only. - 2Inc1uding seeds in oil equivalent. - 2Cari,y-over of oil s and soy-beans 1 October and cottonseed. I A ug,ust. - 213elgium, Brazil, Denmark, Dominican Republic, Haiti, Peru and Philippines.-2Denmark 30 September. - OCanada, France, Western Germany, Japan, Netherlands, Sweden, United States. - "japan 30June, Germany 30 September, -United States 31 December.- I /Net imports. - 22Flue-eured types 1 July. - 22Exports of home-Produced cotton. - 22Excluding U.S.S. , China and Eastern Europe; and including in stocks estimates of cotton afloat.- 22Stoeksinclude estimates of rubber afloat but exclude- strategic stockpiles, IS are probably in the region of 1 V.2 million tons.- "Exports of home-pioduced rubber only. - "Belgium-Luxembourg, Denmark, Western Germany, Netherlands, Switzerland andUnited Kingdom. - 0Gross imports. - 22Austria, Norway, Sweden and Yugoslavia.- "Belgium-Luxembourg, Western Germany,United Kingdom.- 22Austria and Yugoslavia.
lf Mica metric tons
i ;fitly 7.0 15.3 24.5 27.8 28.6 30.1. 8.81 Aug. 5.9 10.4 16.4 13.4 15.5 14.7 8.71 Dec. 0.1 2.0 1.6 2.1 1.0 5.9 2.11 Dec. 0.5 1.0 2.6 2.5 3.0 4,9 2.5
13.5 28.7 45.1 45.8 48.1 55.6 22.1
31 Dec. 0.7 1.4 1.3 0.5 21.3 3.4Si july 0.1 -- 0.2 0.7 1.6 0.630 Sept, -- -- 0.2 0.3 1.3 0.3
0.8 1.4 1.7 1.5 94.2 4.3
1 July3 18.2 24.5 28.7 33.9 37.5 104.0 3.2I. Aug. 3.6 15.1 5.6 3.8 4.5 12.8 3.2
21.8 29.6 34.3 37.7 42.0 116.8 6.4
Dec. 0.03 0.13 0.17 0.07 0.70
Dec. 0.11. 0.20 0.25 0.24 0.57 0.01
Dec. 0.08 0.24 0.14 0.11 0.46 40.01
I july 0.41 0.37 0.28 0.16 0.08 0.36 0.10E Dee. 0.30 0.23 0.08 0.03 -- 0.14 0.17
0.71 0.60 0.36 0.19 0.08 0.50 0.27
1 Oct. 0.24 0.58 0.56 0.32 0.20 2.13 0.43
31 Dec. 2,16 1.51 1.95 1.62 5.45 5.0531 Aug.' 0.54 0.54 0.76 0.65 4.96 2.0131 Aug. 0.56 0.88 1.48 0.83 ... 0.67 111.7431 Aug." 2.40 2.24 2.64 2.69 7.57 '15.28
5.66 5.17 6.83 5.79 18.65 --
I Oct." 1.54 1.66 1.69 1.83 ... 1.01. 0.24
31 juky 0.60 1.22 2.11 2.41 3.18 3.27 130.861.58 1.52 1.29 1.40 1.30 3.07 '31.530.72 0.70 0.68 0.59 0.50 0.02 _.....
2.90 3.44 4.08 4.40 4.98 6.36 "2.39
31 Dec. 0.84 0.84 0.86 0.90 1.84 161.75
31 Dec. 5.74 6.19 6.56 7.46 ... 8.28 "11.0831 Dec. 4.31 3.63 3.85 3.80 ... 12.62 7.3431 Dec. 14.54 16.00 14.67 14.87 ... 87.00 10.00
31 Dec. 1.29 1.15 1.17 1.24 2.84 180.9131 Dec. 0.31 0.28 0.27 0.33 0.62 0.2831 Dec. 7.76 7.76 9.55 7.87 19.14 0.21.
StocksMont h
1952 1953 1951 1955
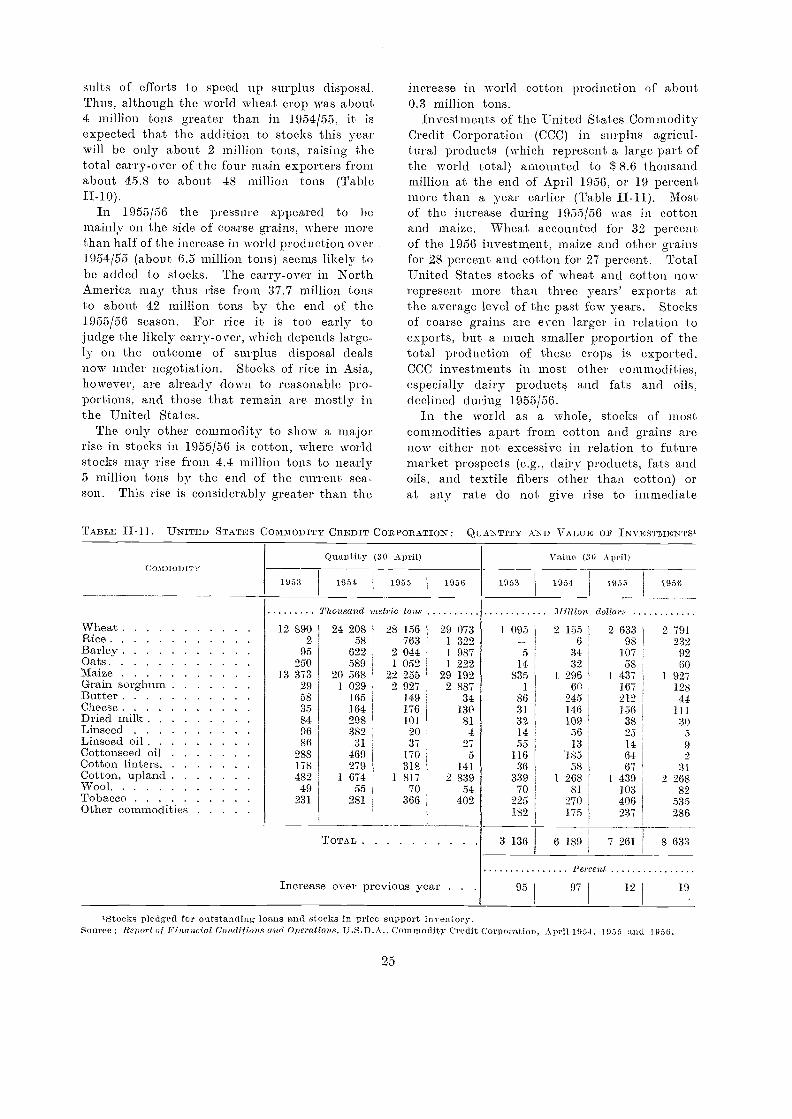
sults of efforts to speed up surplus disposal.Thus, although the world wheat crop was about4 million tons greater than in 1954/55, it isexpected that the addition to stocks this yearwill be only about 2 million tons, raising thetotal carry-over of th.e four main exporters fromabout 45.8 to about 48 million tons (Table
In 1955/56 the pressure appeared to bemainly on the side of coarse grains, where morethan half of the increase in world production OVer1954/55 (about (3.5 million tons) seems likely tobe added to stocks. The carry-over in NorthAmerica may thus rise from 37.7 million tonsto about 42 million tons by the end of the1955/56 season. For rice it is too early tojudge the likely carry-over, which depends large-ly on the outcome of surplus disposal dealsnow under negotiation. Stocks of rice in Asia,however, are already clown to reasonable pro-portions, and those that remain are mostly inthe United States.
The only other commodity to show a majorrise in stocks in 1955/56 is cotton, where worldstocks may rise from 4.4 million tons to nearly5 million tons by the end of the current sea-son. This rise is considerably greater than the
TABLE II- 11. Uls.TITED STATES COMMODITY CREDIT CORPORATION : QUANTITY Al.sTD VALUE OF Ls:VESTMENTS'
c ommou rr v
TOTAL
Increase over previous year .
25
increase in world cotton production of about0.3 million tons.
Investments of the United States CommodityCredit Corporation (CCC) in surplus agricul-tural products (which represent a large part ofthe world total) amounted to $ 8.6 thousandmillion at the end of April 1956, or 19 percentmore than a year earlier (Table II-11). Mostof the increase during 1955/56 was in cottonand maize. Wheat accounted for 32 percentof the 1956 investm.ent, maize and other grainsfor 28 percent and cotton for 27 percent. TotalUnited States stocks of wheat and cotton DOWrepresent more than three years' exports atthe average level of the past few years. Stocksof coarse grains are even larger in relation toexports, but a much smaller proportion of thetotal production of these crops is exported.CCC investments in most other commodities,especially dairy products and fats and oils,declined during 1955/56.
In the world as a whole, stocks of mostcommodities apart from cotton and grains arenow either not excessive in relation to futuremarket prospects (e.g., dairy products, fats andoils, and textile fibers other than cotton) orat any rate do not give rise to immediate
Thousand metric tons
156 29763 1
044 1
052 1
255 29927 2149176101
9037
170318817 2
70366
'Stocks pledged for outstanding loans and stocks in price support inventory.Source : Report of Financial Conditions and Operations, U.S. DA., Commodity Credit Corporation, April 1951, 1955 and 1956.
Million dollars
073 1 095 2 155 2 633322 6 98987 5 34 107222 14 32 58192 835 1 296 1 437887 1 60 167
34 86 245 212130 31 146 156
81 32 109 384 14 56 25'
27 55 13 145 116 *185 64
141 36 58 67839 339 1 268 L 439
54 70 81 103402 925 270 406
182 175 237
3 136 6 189 7 261
Percent
. 95 97 12
Wheat 12 890 21 208 28Rice 2 58Barley 95 692 2Oats 250 589 1
Maize 13 373 20 568 22Grain sorghum 29 1 029 9Butter 58 165Cheese 35 164Dried milk 84 298Linseed 96 382Linseed oil 86 31Cottonseed oil 288 469Cotton linters 178 '279Cotton, upland. 482 1 674 1Wool 49 55Tobacco 931 281Other commodities
Quantity (30 April) Value (30 A pril)
1953 1951 1955 1956 1953 1954 1955 1956
2 791.9329260
1 92712844
11130
599
312 268
82535286
8 633
19
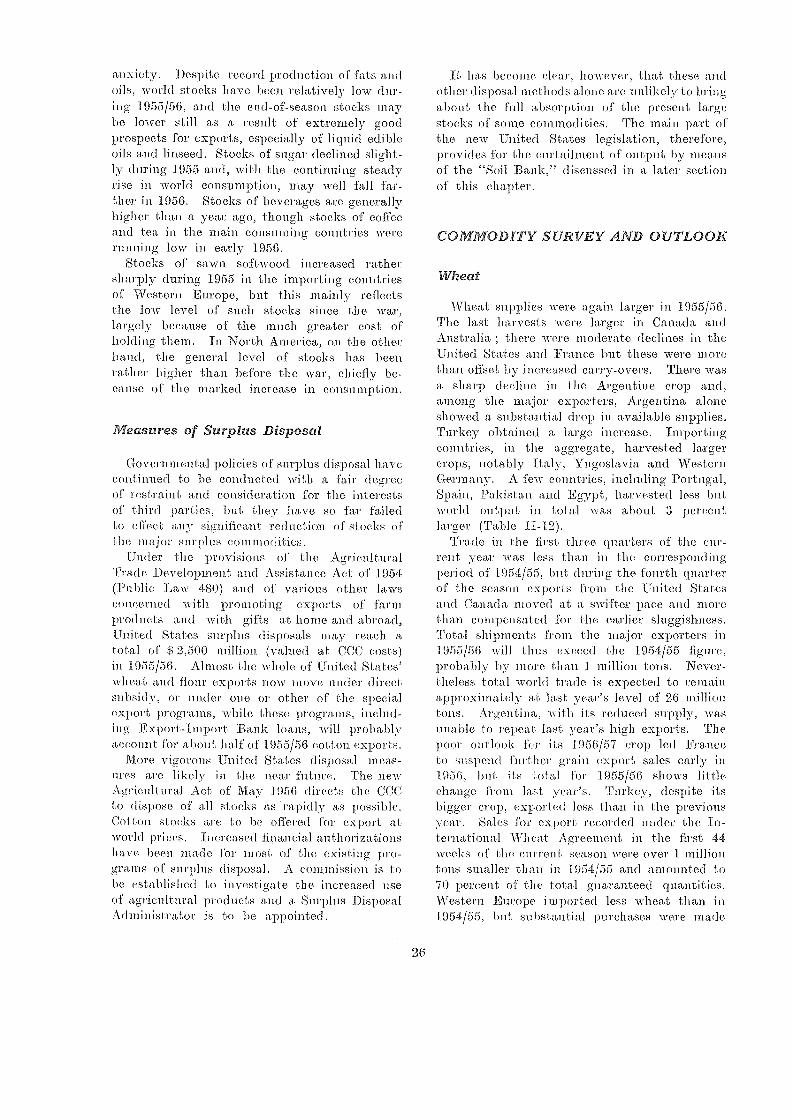
anxiety. Despite record production of fats amioils, world stocks have been relatively low dur-ing 1955/56, and the end-of-season stocks maybe lower still as a result of extremely goodprospects for exports, especially of liquid edibleoils and linseed. Stocks of sugar declined slight-ly during 1955 and, with the continuing steadyrise in world consumption, may well fall far-ther in 1056. Stocks of beverages are generally.higher than a year ago, though stocks of coffeeand tea in tin-) main consuming countries wererunning low in early 1956.
Stocks of sawn softwood increased :rathersharply during 1955 in the importing countriesof Western Europe, but this mainly reflectsthe lolv level of such stocks since the war,largely because of the much greater cost ofholding them. In North America, on the otherhand, the general level of stocks has beenrather higher than before the war, chiefly be-cause of the marked increase in consumption.
Measures of Surplus Disposal
Governmental policies of surplus cl isposal havecontinued to be conducted with a fair degreeof restraint and consideration for the interestsof third parties, but they have so far failedto effect any significant reduction of stocks ofthe major surplus commodities.
'Under the provisions of the AgriculturalTrade Development and Assistattee Act of 1954(I 'ti Law 480) allri Of various other lawsconcerned with promoting exports erf -farin.products and with gifts at home and abroad,-Urtited States surplus disposals may reach atotal of i 2,500 million (valued at CCC costs)in 1955/56. Al ni the whole of United States'wheat and flour ex-ports 1101V MOVE', under directsubsidy, or under one Or other of the specialexport programs, while the,se itrograms, includ-ing Export-Import Bank loans, will -jwobablyaccount :for about half of 1955/56 cotton exports.
More vigorous United States disposal meas-ures are likely in the near future. The newA.gricultural Act of 'May 1956 directs the CCCto dispose, of all stocks as rapidly as possible%tiotton stocks are to be offered :for export atworld prices. "Increased financial authorizationshave heen made for most of the existing pro-grams or surplus disposal. A commission is tohe established to investigate th.e increased useof agricultural products and a Surplus 1)isposalAdministrator is to be a,ppoirtted.
26
It has become clear, however, that these andother disposal methods alone are unlikely to bringabout the full absorption of the present largestocks of some commodities. The main part ofthe IleW United States legislation, therefore,provides fui' the curtailment of output by ni eansof the "Soil Bank," discussed in a later sectionof this chapter.
COMMODITY SURVEY AND OUTLOOK
Wheat
Wheat supplies were again larger in 1955/56.The last harvests :Were larger in Canada andAustralia ; there, Were moderate declines in theUnited States and France but these were morethan offset by increased carry-overs. There wasa sharp decline in the Argentine crop and,among the major exporters, Argentina aloneshowed a substantial drop in available supplies.Turkey obtained a large increase. Importingcountries, in the aggregate, harvested largercrops, notably Italy, Yugoslavia and WesternGermany. A few countries, including Portugal,Spain, Pakistan ami Egypt, harvested less butworld output in total was about 3 percentlarger (Talle II-12).
Trade in the first three, quarters of the cur-rent year was less than in the correspondingperiod of 1954/55, but during the fourth quarterof the season exports from the 'United Statesand Canada moved at a swifter pace and morethan compensated for the earlier sluggishness.Total shipments front the major exporters in1955/56 will thus exeeed the 1954/55 :figure,probably by more than 1 million tons. Never-theless total world trade, is expected to remainapproximately at last year's level of 26 milliontons. Argentina, .with its reduced supply, wasunable to .repeat last year's high exports. Thepoor outlook -:For its 1956/57 crop led Franceti) suspend further grain export sales early in1956, but, iits total for 11955/56 shows littlecharige f.'roitt last year's. Turkey, despite itsbigger crop, exported less than in tile previousyear. Sales ,Cor expeut recorded under the In-ternational Wheat Agreement in the first 44weeks of the current season were over 1 milliontmis smaller than in 1954/55 and amounted to70 percent of the total guaranteed quantities.Western Europe imported less wheat than in1954/55, but substantial purchases were rnade
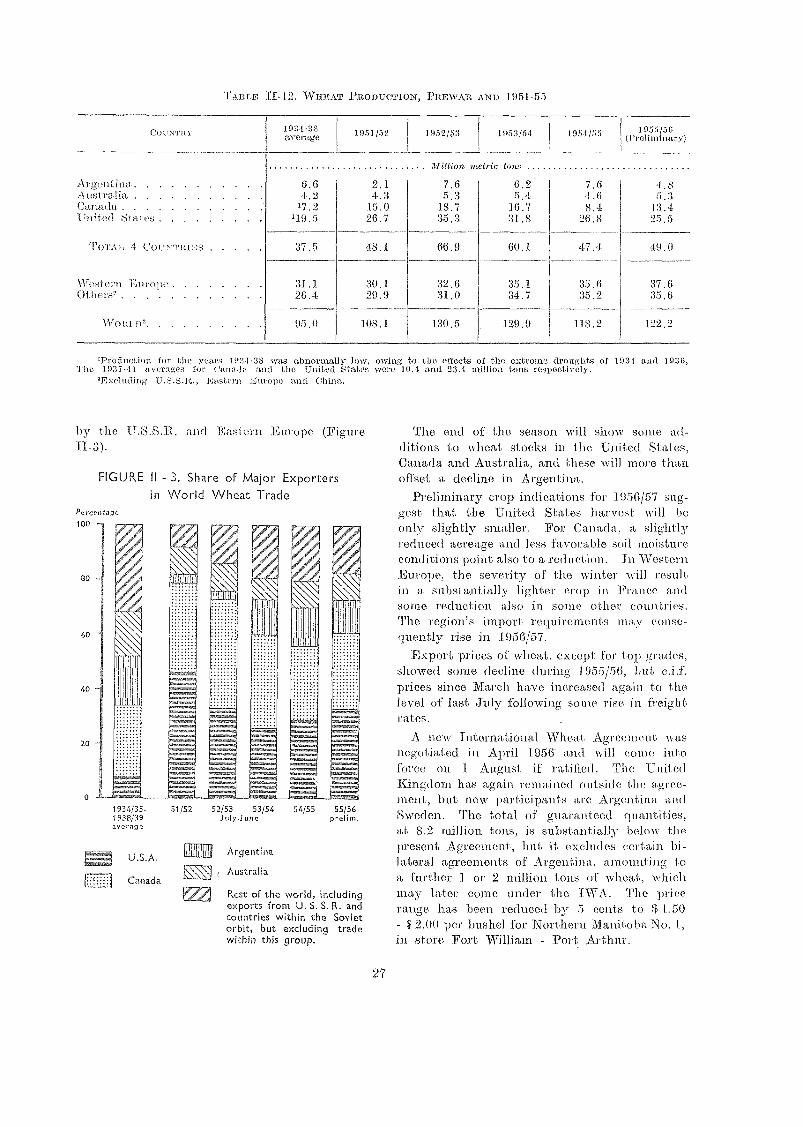
J r i he years 1931 -38 WaS ahnormet ly low, owing to the effects ot the extreme tiro ug I its or 1931 and 1936,The 1: -.! z - fir Canada and the United Stettet were 10.1 and 23.4 million tons respectively.I I I ,': 11., :E eistern Europe :14.ird
by the U.S.S.R. and Eastern Europe (Figure
Percentage100
FIGURE II - 3. Share of Major Exportersin VVorld Wheat Trade
1934/35-1938/39,iwer,gc
U.S.A.
Canada
s 4
I II
4-
TABLE FI- 12. WHEAT P.RODUCTION, PREWAR AND 1951-55
.4' 1,orr
/j
Rest of the world, includingexports from U. S. S. R. andcountries vvithin the Sovietorbit, but excluding tradevvithin this group.
27
The end of the season will show some ad-ditions to wheat stocks in the United States,Canaria and Australia, and these Avill more thanoffset a decline in Argentina.
Preliminary crop indications for 1956/57 sug-gest that the United States harvest will .be
only slightly smaller. For Canada, a slightlyreduced acreage and less favorable soil moistureconditions point also to a reduetion. In Western,Europe,, the severity of the winter will resultin a substantially lighter crop in Franee andsome reduction also in some other countries.The, region's import requirements may conse-quently rise in 1956/57.
Export prices of wheat, except for top grades,showed SOIlle decline during J955/50, hut c.i.f.prices since March have increased again to thelevel of last July following some rise. in freightrates.
A 11 eiso international Wheat Agreement wasnegotiated in April 1956- and conic, intoforce on 1 August if ratified. The -UnitedKingdom has again remained outside the agree-ment, but new participants are Argentina andSweden. The total of guaranteed quantities,at 8.2 million t0118, is substantially below, thepresent Agreement, but it excludes certain bi-lateral agreements of Argentina, amounting toa further 1 or 2 million tons of wheat, whichmay later come under the TWA. The pricetango has been reduced by 5 cents to $ 1..50- S 2.00 per bushel for Northern Manitoba No. 1,in store Fort WilijaIn - Port Arthur.
O UN TR Y.1934-38average 1951/52 1952/53 1953/51: 1951 /55 1955/56
(Ftreliminary)
Jliillion metete (ons
..\ l7101( inn 6.6 2.1 7.6 6.2 7.6 4.8Ali:11.o I 4,2 4.3 5.3 5.4 4.6 5.3
17.2 15.0 18.7 16.7 8.4 13.4Stat es 119,5 26.7 35.3 31.8 26.8 25.5
ToTAI, 4 (01`.NTRINS 37.5 48.1 66.9 60.1 47.4 49,0
\Vc:-3.1 ern 1:0,ur)pe 31.1 30.1 32.6 35.1 35.6 37.6Others2 26.4 29.9 31.0 34.7 35.2 35.6
lAroui 95.0 108.1 130.5 129.9 118.2 122.2
51/52 52/53 53/54 54/55 55/56July-June
HIM Argentina
, Australia
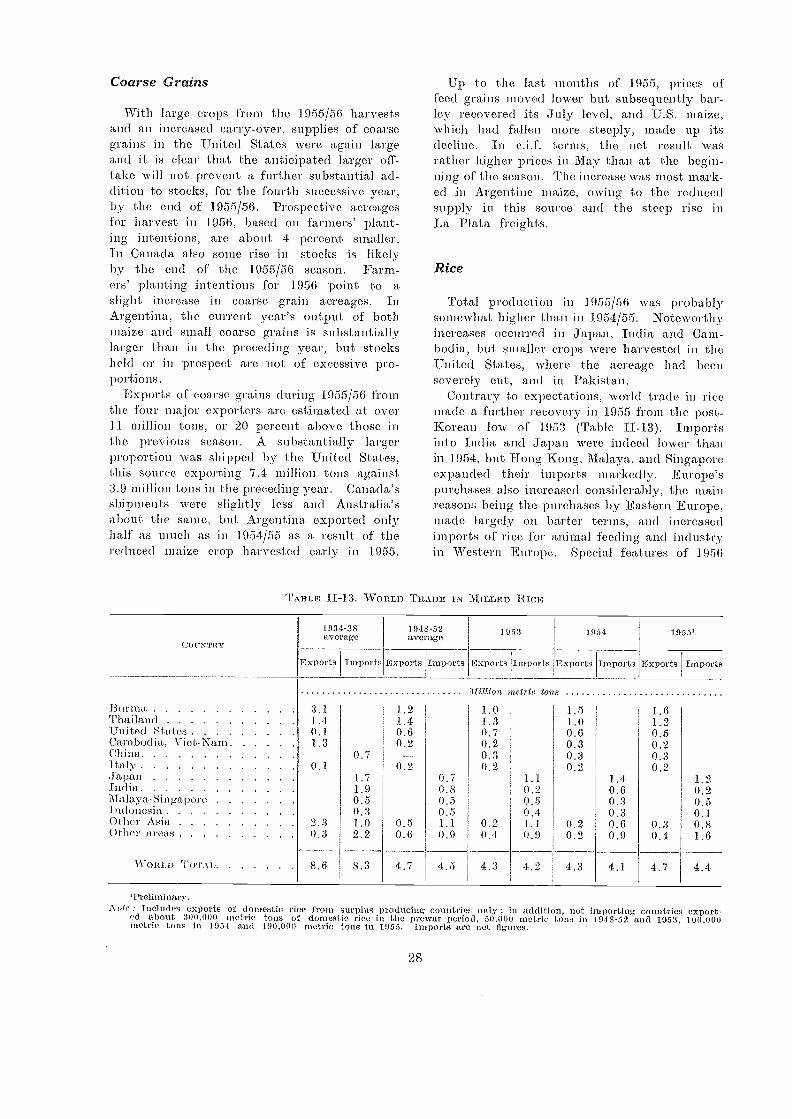
Coarse Grains
With large crops feo ni the 1955/56 harvestsand an increased carry-over, supplies of coarsegrains in the United States were again largeand it is clear that th.e anticipated larger off-take will not prevent a further substantial ad-dition to stocks, for the :fourth successive year,by the end of 1955/56. Prospective acreagesfor harvest in 1956, based on farmers' plant-ing intentions, are about 4 percent smaller.In Canada also some rise in stocks is likelyby the end of the 1955/56 season. Farm-ers' planting intentions for 1956 point to aslight increase in coarse grain acreages. InArgentina, the current year's output of bothmaize and small coarse grains is substantiallylarger th.an in the preceding year, but stocksheld or in prospect are not of excessive pro-portions.
Exports of coarse grains during 1955/56 fromthe four major exporters are estimated at over11 million tons, or 20 percent above those inthe previous season. A substantially largerproportion was shipped by the United States,this source exporting 7.4 million tons against3.9 million tons in the preceding year. Canada'sshipments were slightly less and Australia'sabout the same, but Argentina exported onlyhalf as much as in 1954/55 as a result of thereduced maize crop harvested early in 1955.
COUNTRY
r[ABLE 11-13. WORLD TRADE IN MILLED 11 GE
1934-38average
1948-52average
28
'Up to the iast months of 1955, prices offeed grains moved lower but subsequently bar-ley recove,red its july level, ami U.S. maize,which had fallen more steeply, made up itsdecline. In c.i.f. terms, the net result wasrather higher prices in May than at the begin-ning of the season. The increase was most mark-ed in Argentine maize, owing to th.e reducedsupply in this source and the steep rise inLa Plata freights.
Rice
Total production in 1955/56 was probablysomewhat higher than in 1954/55. Noteworthyincreases occurred in Japan, India and Cam-bodia, but smaller crops were harvested in theUnited States, where th.e acreage had beenseverely cut, and in Pakistan.
Contrary to expectations, world trade in ricemade a further recovery in 1955 from the post-Korean low of 1953 (Table II-13). Importsinto India and japan WC:Ie indeed lower thanin 1954, but Hong Kong, Malaya, and Singaporeexpanded their imports markedly. Europe'spureh.ases also increased considerably, the mainreasons being thee purchases by Eastern Europe,made largely on barter terms, and increasedimports of' rice for animal feeding and industryin Western :Europe. Special features of 1956
1953 1954 1955'
' Preliminary.Note : Includes exports of domestic rice from surplus producing countries only ; in addition, net importing countries export-
ed about 300,000 metric tons of domestic rice in the prewar period, 50,000 in etl'ic tons in 1948-52 and 1553, 100,000metric tons in 1951 and 190,000 metric tons in 1955. Imports are not figures.
Imports Exports Imports Exports Imports Exports Imports
'metric tons
1.0 1.5 1.61.3 1.0 1.20.7 0.6 0.50.2 0.3 0.20.3 0.3 0.30.2 0.2 0.2
0.7 1,1 1.4 1.20.8 0 , 9 0.6 0.20.5 0.5 0.3 0.50.5 0,4 0.3 0.11.1 0.2 1.1 0.2 0.6 0.3 0.80.9 0.4 0.0 0.2 0.9 0.4 1.6
4.5 4.3 4.2 4.3 4.1 4.7 4.4
Exporta Imports Exports
Burma 3.1 1.2Thailand 1.4 1.4United States 0.1 0.6Cambodia, Viet-Nam 1.3 0.2
0.7Italy 01 0.2Japan 1.7India 1.9Alalaya-Singapore 0.5Indonesia 0.3Other Asia 2.3 1.0 0.5Other :Arens 0.3 2.2 0.6
\VoRt. D ToTN1, 8.6 8.3 4.7
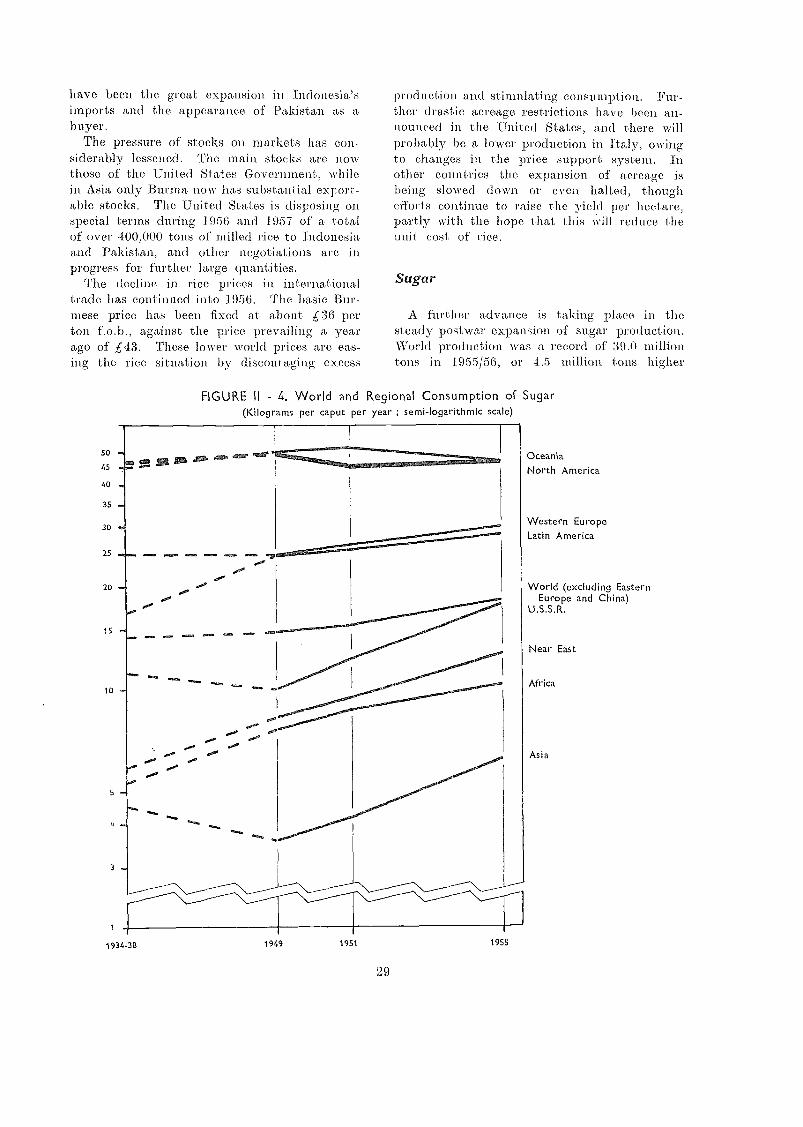
have been the great expansion in Indones a simports and the appearance of Pakistan as abuyer.
The pressure of stocks on markets has con-siderably lessened. The main stocks are 110Wthose of the United States Government, \\Ili lein Asia only Burma 110W haS substantial export-able stocks. The United States is disposing unspecial terms during 1956 and 1957 of a totalof over 400,000 tons of .1-tailed rice to Indonesiaand Pakistan, and other negotiations areprogress for further large quantities.
The decline in rice prices in internationaltrade has continued into 1956. The basic BUY -mese price has been fixed at about £36 perton f.o.b., against the, price prevailing a yearago of £43. These lower world prices are cas-ing the rice situation by discout aging excess
29
-production and stimulating consumption. Fur-ther drastic acreage restrictions have been an-nounced in the United States, and there willprobably be a lower production in Italy, owingto changes in the price support system. Inother countries the expansion of acreage isbeing slowed down or even halted, thoughefforts continue to raise the yield -per hectare,partly with the hope that this will reduce theunit cost of rice.
Sugar
A further advance is taking place in thesteady postwar expansion of sugar production.World production was a record of 39.0 milliontons in 11.955/56, or 4.5 million tons highe,r
FIGURE II - 4. World and Regional Consumption of Sugar(Kilograms per caput per year ; semi-logarithmic scale)
OceaniaNorth America
Western EuropeLatin America
World (excluding EasternEurope and China)
U.S.S.R.
Near East
Africa
As
193 4-3 8 1949 1951 1955
than in 1952/53, and. about 14 million tonsabove the prewar average. These increases areto be attributed largely, not to favorable weath-er, but to long-term :factors, including ex-pansion of planted areas and increases in yieldsas a result of improvements in agricultural andfactory techniques, higher-yielding varieties,better transportation and handling, etc. How-ever, in the 'U.S.S.R., Eastern Europe and mostof Asia, the long-term forces of rising produc-tivity, which llave been so important in WesternEurope, the Americas and Oceania have beenmuch weaker, and the relative product ion ex-pansion has not been as great.
Consumption has kept pace with the produc-tion increase. Indeed, stocks declined some-what during 1955 and it is highly probablethat there will be a further decline in worldstocks by the end of the current season. Inrecent years consumption has increased in par-ticular in Near Eastern, African and Asiancountries. In 1955, total consumption in the,Near Ea,st and Africa was almost three timesas high as during 1934-38. The percentageincrease in Asian countries has Leen amongthe most rapid in the world in the last fewyears, the estimated total consu-naption in 1955being 55 percent above 1951. Indications arethat this trend will continue, probably with:increasing momentum (Figure 11-4).
The steady rise in consuinption has prevent-ed a serious decline in prices. Although mostconsumption increases were provided by do-mestic production, the volume of internationaltrade has not declined. During the currentyear the international market was supportedby imports by the Soviet bloc.
It is likely that, barring extremely unfavor-able weather conditions, production will be stilllarger during the coming year, and the outlook:for the next few years points to continuousgrowth. Consumption, too, will continue, toexpand. As in the past, the rise of incomesin low- and medium-income countries will havea marked elfect on sugar. consumption. How-ever, price and market developme,nts duringthe balance of this year ma,y be profoundlyinfluenced by the out come of the internationalSugar Conference,.
Livestock Products
World meat production and trade increasedin 1955 and th.e expansion has continued into1956. In 1955 exports were a,bout 7 percent
30
larger iban the year -before, almost all themajor exporters recording increases. As a resultof the lieW agricultural policy in Argentina, itsexports of carcass meat Were about 50 percentabove the level of 1954 and they expandedfurther at the beginning of 11056.
Following marked production increases, meatprices in the 'United States declined substan-tially ti uring 1955 , aru:l producer price,s formeat animals during January-April 1956 aver-aged 17 percent below the correspom.ling 1955period. In the United Kingdom also, beefprices are well below 1955, mainly due tolarger imports ; but in most other Europeancountries in price levels compare faVorablywith last year. "Tinted Kingdom price guar-antees for 1956/57 Were increased for fat cattleand sheep and reduced for pigs. To check the,decline in pig prices, the United States Depart-ment of Agriculture purchased during the fivemonths from November 1955 about 90 thousandtons of pork aun lard ; the pork has been u.sedfor domestic school-lunch and welfare pro-grams. Sizeable meat experts from the UnitedStates may d.evelop under :Public Law 480Agreements ; thus far, a total of 37 thousandtons of beef and pigmeat has been sold toIsrael, Spain, Chile and Korea.
The volume of world milk production in 1955is estimated to have been slightly less than inthe preceding year, mainly because of a declinein Western Europe clue to unfavorable weather.Butter production declined about 4 percent andcheese production was also reduced slightly, butoutput of preserved milk was above the 1954level. World butter exports were larger, be-cause of heavily increased shipm.ents from Oce-ania and North America. Imports into the Unit-ed Kingdom and 'Western Germany ivere sub-stantially above 1954, but purchases by theU.S.S.R. and Ea,stern Europe declined by nearlytwo-thirds. In Europe, prices of dairy productswere in many ilsrances higher than in 1954,while in the Unii id States they remained atsupport levels. World butter stocks :in the firstquarter of this year were on the average nearlyone-third less than the year before. By March1956, the -United States Commodity Credit Cor-poration had almost entirely disposed of the400 thousand tons of butter purchased since1952 ; in April, hater was withdra-wn from the:foreign donations program., because of limitedsupplies. On the other hand, non-com.mittedholdings of eliee,se Were still more than 100thousand tons.
It is expected that in the current year, pro-duction of' milk and dairy products will begenerally larger than in 1955. United ilKingdom1)11 II imports in the first quarter vere 16percent above the correspontiing 1955 figures.As consumption >id not increase, larger suppliesresulted in a considerable growth of stocks mindsubstantial reductions of pri ces in recent inontlis.'United States support prices for butter amicheese or 1956/57 are about 3 pereent highertitan in the preceding s:upport year ; the sup-port price Lo r dried skim milk remained unchang-ed. The volume of price smi fmort purchasesthe, 'United States may not change greatly incomparison with 1955.
World (Ty production is estimated to haveincreased slightly in 1955, and a further smallexpansion is expected in 1956. Tice volume oftrade in eggs :in the shell 'WM larger also, butincreased .rather less than in I he preceding years.Western Germany, which sinee 1951 has bee>>.the largest importer of eggs :in the shell, im-ported last year 18 percent more than the yearbefore. On the other hand, :United .Kingd.omimports have been declining recently and thedownward movement continueil in 1956.
As world livestock numbers are at recordlevels and feed supplies ample, the outlook isfor a continued expansion of livestock produc-tion in 1956/57. Some difficulties may be en-countered in the marketing of dairy products,as import requirements of some of the majorimporters of continental Europe are likely tobe smaller. Strong efforts to increase UnitedStates exports of government-owned stocks ofdtviry products may be another factor with. adepressing effect on prices. Increased worldoutput of meat should, however, find readymarkets because of continuecl firm del/land,although the growth in exportable supplies inthe Southern Hemisph.ere, with the United'Kingdom as main outlet, inay tend to keepexport prices down.
Fishery Products
In general, international trade iii fresh andfrozen fish has been maintained and so me sin all:increases were recorded. Imports into the Unit-ed States, :the :United. Kingdom and WesternGerma,ny were slightly higher in 1955. TheUnited States imported more frozen tuna, 'whileimports of groundfish fillets were a little lowerthan in 1.954 but still 40 percent higher than
in 1953. Norway's exports of frozen herring:increased in 1955, especially to Czechoslovakia,-which, together with Eastern Germany, :Poland,and U.S.S.R. took 70 percent of' the exports.
Dried, sal ied and smoked fish. The importsof salted herring lilt° 'Western. Germany andBelgium m. wore out the sauce levels as in 1954,while Sweden, imported. 40 percent more. TheNetherland's exports of salted herring show' a,decline caused mainly Jr a drop in exportsto the U.S.S.R. ; Norway's exports Were aboutthe same as in 1954, and Icelaiill's markedlyincreased, especially to the 'U.S.S.R., Su-echenmc:1 Finland.
Iceland's stockfish exports dropped to abouthalf the record level of 1954, to return to the1953 level. Salted fish_ production and exports,however, expanded through a strengthened de-mand and good prices. In Norway, exports ohsalted cod show an increase of more than :10percent, Brazil remaining by far the biggestimporter, but exports of stockfish remained cutthe same level as in 1954. Italy's stockfishì.imports increased slightly, while there was aslight drop in those of West Africa.
Canned fish. There was a decline in thecanned salmon pack on the West coast of.North America and the United States packwas the lowest since, 1906. Declines were alsoexperienced in tuna and the Maine sardine.United States imports of canned salmon fromjapan and Canada increa,sed sharply. The dap-anese canned sahnon pack showed a spectac-ular increase in 1955, being three times largerthan in 1954 and eight times larger than in1953. In Norway the brisling pack was quitesmall due to the poor catch, and certain ofNorway's exports of canned herring and otherfish show slight declines in 1955. Portugueseexports of camted fish increased about 30 per-cent in 1955. Western Germany was the mainMarket, followed by Italy, the United Kingdomand the 'United States. Imports of canned her-ring and sardines imito France, Western Germanyand Italy remained at 1951 levels. In Fra,ncea significant drop in sartline landings causedthe canneries to utilize more -Irma.
Fish meal. In the United States a recordoutput of menhaden meal was produced. Den-mmirk's catches increased, mainly through heav-ier fishing for reduction pulToses, with a cor-responding increase in fish meal production.'In the 'Union of South Africa, where quotas
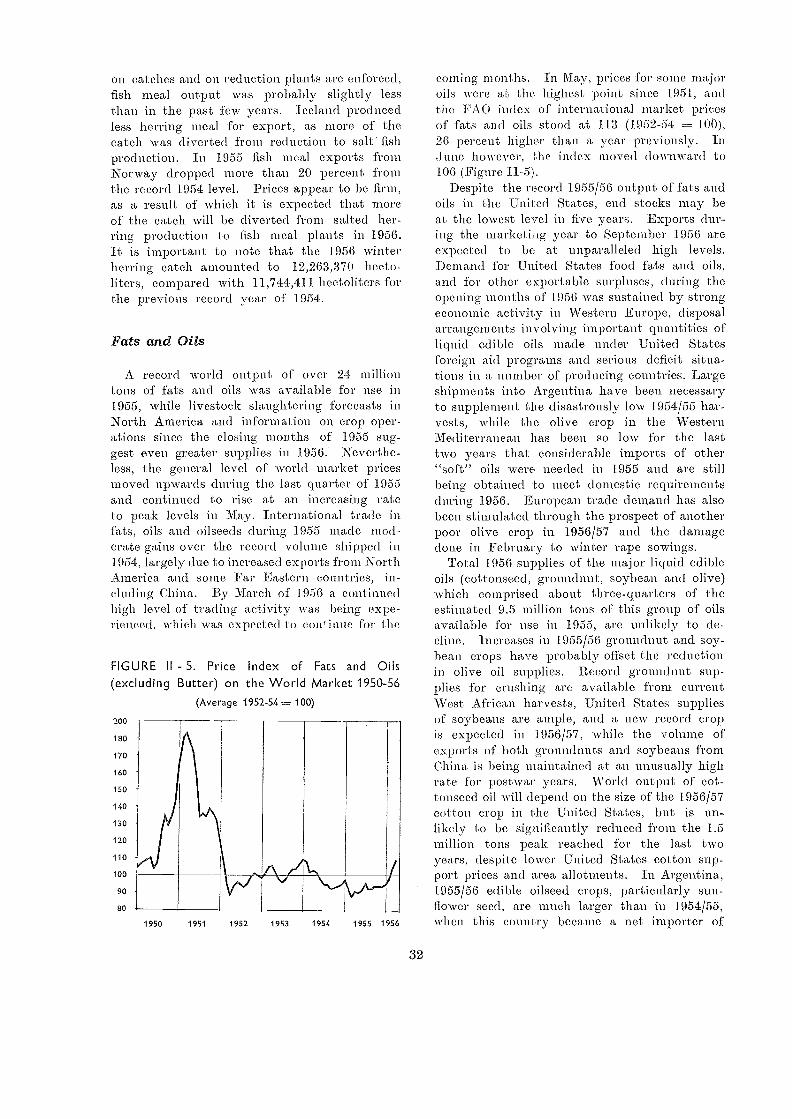
on catches and on reduction plants are enforced,fish meal output was probably slightly lessthan in the past few years. Iceland producedless herring meal for export, as more of thecatch was diverted from reduction to salt fishproduction. In 1955 fish meal exports fromNorway dropped more than 20 percent fromthe record 1954 level. Prices appear to be firm,as a result of which it is expected that moreof the catch will be diverted from salted her-ring production to fish meal plants in 1956.It is important to note that the 1956 winterherring catch amounted to 12,263,370 hecto-liters, compared with 11,744,411 hectoliters forthe previous record year of 1954.
Fats and Oils
A record world output of over 24 milliontons of fats and oils was available for use in1955, while livestock slaughtering forecasts inNorth America and information on crop oper-ations since the closing months of 1955 sug-gest even greater supplies in 1956.- Neverthe-less, the general level of world market pricesmoved upwards during the last quarter of 1955and continued to rise at an increasing rateto peak levels in May. International trade in.:Fats, oils and oilseeds during 1955 made mod-erate gains over the record volume shipped in1954, largely due to increased exports from NorthAmerica and some Far Eastern countries, in-cluding China. By March of 1950 a continuedhigh level of trading activity was being expo-:rienced, :whicli. was expected lo con' blue for the
FIGURE II - 5. Price Index of Fats and Oils(excluding Butter) on the World Market 1950-56
(Average 1952-54 100)
200
180
170
160
150
140
130
120
110
100
90
80
1950 1951 1952 1953 1954 1955 1956
32
coming months. In May, prices for so me :majoroils were at the highest point since 1951, andthe .UAO index of international market pricesof fats and oils stood at 113 (1952-54 = 100),20 percent higher than a year previously. Indune IIONVCVer, the index moved downward ti)106 (Figure II-5).
Despite the record 1955/56 output of :fats andoils in the 'United States, end stocks may beat the lowest lev:el in five years. Exports dur-ing the marketing year to September 1956 areexpected to be at unparalleled high levels.Demand for 'United States food fats and oils,and for other exportable surpluses, during theopening months of 1956 was sustained by strongeconomic activity in Western Europe, disposalarrangements involving important quantities ofliquid edible oils made under United Statesforeign aid programs and serious deficit situa-tions in a number of producing countries. Largeshipments into Argentina have been necessaryto supplement the disastrously low 1954155 har-vests, while the olive crop in the WesternMediterranean has been so low for the lasttwo years that considerable imports of other"soft" oils were needed in 1955 and are stillbeing obtained to meet domestic requirementsduring 1956. European trade demand has alsobeen stimulated through the prospect of anotherpoor olive crop in 1956/57 and the damagedone in February to winter rape sowings.
Total 1956 supplies of the major liquid edibleoils (cottonseed, groundnut, soybean and olive)which comprised about three-quarters of theestimated 9.5 million tons of this group of oilsavailable for use in 1955, are unlikely to de-cline. Increases in 1955/56 groundnut an.d soy-bean crops have probably offset the reductionin olive oil supplies. Record groundnut sup-plies for crushing are available from currentWest African harvests, United States suppliesof soybeans are ample, and a new record cropis expected in 1956/57, while the volume ofexports of both. groundnuts and soybeans fromChina is being maintained at an unusually highrato for postwar years. World output of cot-tonseed oil will depend on the size of the 1956/57cotton crop in the United States, but is un-likely to be significantly reduced from the 1.5million tons peak reached for the last twoyears, despite lower -United. States cotton sup-port prices and arca allotments. In Argentina,1955/56 edible oilseed crops, particularly sun-flower seed, are much larger than in 1954/55,when this country became a net importer of
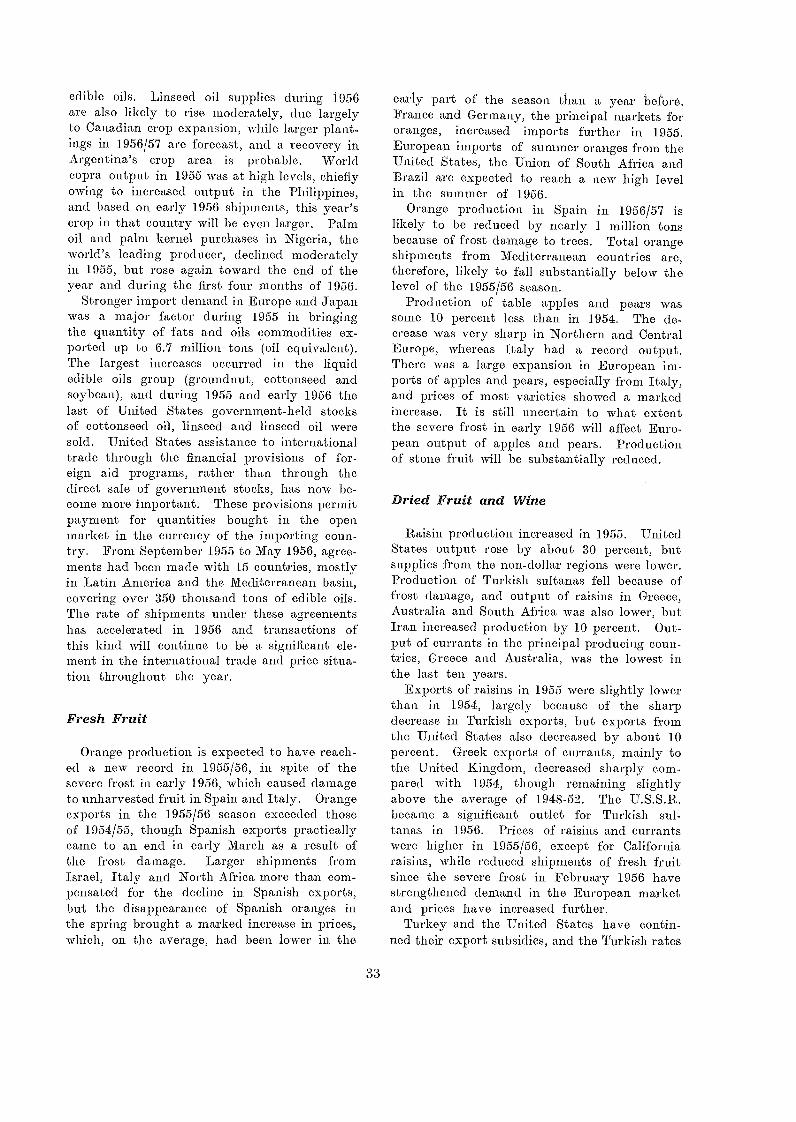
edible oils. Linseed oil supplies during 1956are also likely to rise moderately, due largelyto Canadian crop expansion, while larger plant-ings in 1956/57 are forecast, ami a recovery inArgentina's crop area is probable. Worldcopra output in 1955 was at high levels, chieflyowing to increased output in the Philippines,and based on early 1956 shipments, this year'scrop in that country will be even larger. Palmoil and palm kernel purchases in Nigeria, theworld's leading producer, declined inoderatelyin 1955, but rose again toward the end of theyear and during the first four :months of 1956.
Stronger import demand in Europe and Japanwas a major factor during 1955 in bringingthe quantity of fats and oils commodities ex-ported up to 6.7 million tons (oil equivalent).The largest increases occurred in the liquidedible oils group (groundnut, cottonseed andsoybean), and during 1955 and early 1956 thelast of United States government-held stocksof cottonseed oil, linseed and linseed oil weresold. United States assistance to internationaltrade through the financial provisions of for-eign aid programs, rather than through thedirect sale of government stocks, has now be-come more important. These provisions permitpayment for quantities bought in the openmarket in the currency of the importing coun-try. From September 1955 to May 1956, agree-ments had been made with 15 countries, mostlyin Latin America and the Mediterranean basin,covering over 350 thousand tons of edible oils.The rate of shipments under these agreementshas accelerated in 1956 and transactions ofthis kind will continue to be a significant ele-ment in the international trade and price situa-tion throughout the year.
Fresh Fruit
Orange production is expected to have reach-ed a new record in 1955/56, in spite of thesevere frost in early 1956, which caused damageto unharvested fruit in Spain and Italy. Orangeexports in the 1955/56 season exceeded thoseof 1954/55, though Spanish exports practicallycarne to an end in early March as a result ofthe frost damage. Larger shipments fromIsrael, Italy and North Africa more than com-pensated for the decline in Spanish exports,but the disappearance of Spanish oranges inthe spring brought a marked increase in prices,which, on the average, had been lower in the
33
early part of the season than a year before.France and Germany, the principal markets fororanges, increased imports further in 1955.European imports of summer oranges from theUnited States, the Union of South Africa andBrazil are expected to reach a new high levelin the summer of 1956.
Orange production in Spain in 1956/57 islikely to be reduced by nearly 1 million tonsbecause of frost damage to trees. Total orangeshipments from Mediterranean countries are,therefore, likely to fall substantially below thelevel of the 1955/56 season.
Production of table apples and pears wassome 10 percent less than in 1954. The de-crease was very sharp in Northern and CentralEurope, whereas Italy had a record output.There was a large expansion in European im-ports of apples and pears, especially from Italy,and prices of most varieties showed a markedincrease. It is still uncertain to what extentthe severe frost in early 1956 will affect Euro-pean output of apples and pears. Productionof stone fruit will be substantially reduced.
Dried Fruit and Wine
Raisin production increased in 1955. UnitedStates output rose by about 30 percent, butsupplies from the non-dollar regions were lower.Production of Turkish sultanas fell because offrost damage, and output of raisins in Greece,Australia and South Africa was also lower, butIran increased production by 10 percent. Out-put of currants in the principal producing coun-tries, Greece and Australia, was the lowest inthe last ten years.
Exports of raisins in 1955 were slightly lowerthan in 1954, largely because of the sharpdecrease in Turkish exports, but exports fromthe United States also decreased by about 10percent. Greek exports of currants, mainly tothe United Kingdom, decreased sharply com-pared with 1954, though remaining slightlyabove the average of 1948-52. The U.S.S.R.became a significant outlet for Turkish sul-tanas in 1956. Prices of raisins and currantswere higher in 1955/56, except for Californiaraisins, while reduced shipments of fresh fruitsince the severe frost in February 1956 havestrengthened demand in the European marketand prices have increased further.
Turkey and the United States have contin-ued their export subsidies, and the Turkish rates
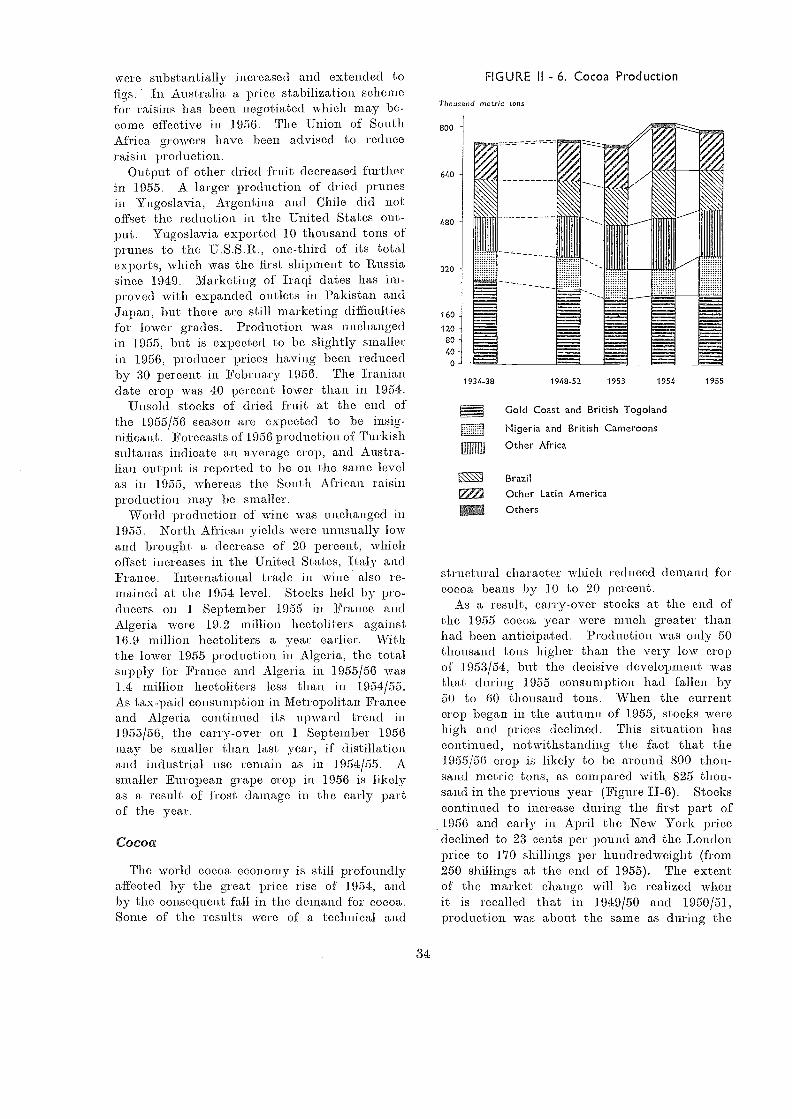
were substantially increased and extended tofigs. In Australia a price stabilization schemefor raisins has been negotiated which may be-come effective in 1956. The Union of SouthAfrica growers have been advised to reduceraisin production.
Output of other dried fruit decreased further:in 1955. A larger production of dried prunesin Yugoslavia, Argentina and Chile did notoffset the reduction in the United States out-put. Yugoslavia exported 10 thousand tons ofprunes to the U.S.S.R., one-third of its totalexports, which was the first shipment to Russiasince 1949. Marketing of Iraqi dates has im-proved with expanded outlets in Pakistan andJapan., but there are still marketing difficultiesfor lower grades. Production was unchangedin 1955, but is expected to be slightly smallerin 1956, producer prices having been reducedby 30 percent in February 1956. The Iraniandate crop was 40 percent lower than in 1954.
Unsold stocks of dried fruit at the end ofthe 1955/56 season are expected to be insig-nificant. Forecasts of 1956 production of Turkishsultanas indicate an average crop, and Austra-lian output i.s reported to be 011 the same levelas in 1955, whereas the South African raisinproduction may be smaller.
World production of wine was unchanged in1955. North African yields were unusually lowand brought a decrease of 20 percent, whichoffset increases in the United States, Italy andFrance. International trade in Wine also re-mained at the 1954 level. Stocks held by pro-ducers on 1 September 1955 in France andAlgeria were 19.2 million hectoliters against16.9 million hectoliters a year earlier. Withthe lower 1955 production in Algeria, the totalsupply for France and Algeria in 1955/56 was1.4 million hectoliters less than in 1954/55.As tax-paid consumption in Metropolitan Franceand Algeria continued its upward trend in1955/56, the carry-over on 1 September 1956may be smaller than last year, if distillationand industrial use remain as in 1954/55. Asmaller European grape crop in 1956 is likelyas a result of frost damage in the early partof the year.
Cocoa
The world cocoa economy is still profoundlyaffected by the great price rise of 1954, andby the consequent fall in the demand for cocoa.Some of the results were of a technical and
34
320
160-120
80
40-0
1934-38
FIGURE II - 6. Cocoa Production
Thousand metric tons
Gold Coast and British Togoland
Nigeria and British Cameroons
Other Africa
Brazil
Other Latin AmericaOthers
structural character which reduced demand forcocoa beans by 10 to 20 percent.
As a result, carry-over stocks at the end ofthe 1955 cocoa year were much greater thanhad been anticipated. Production was only 50thousand tons higher than the very low cropof 1953/54, but the decisive development wasthat during 1955 consumption had fallen by50 to 60 thousand tons. When the currentcrop began in the autumn of 1955, stocks werehigh and prices declined. This situation hascontinued, notwithstanding the fact that the1955/50 crop is likely to be around 800 th.ou-sand metric tons, as compared with 825 thou-sand in the previous year (Figure II-6). Stockscontinued to increase during the first part of
.1956 and early in April the New York pricedeclined to 23 cents per pound and the Londonprice to 170 shillings per hundredweight (from250 shillings at the end of 1955). The extentof the market change will be realized whenit is recalled that in 1949/50 and 1950/51,production was about the same as during the
1951 1 9551948-52 1953
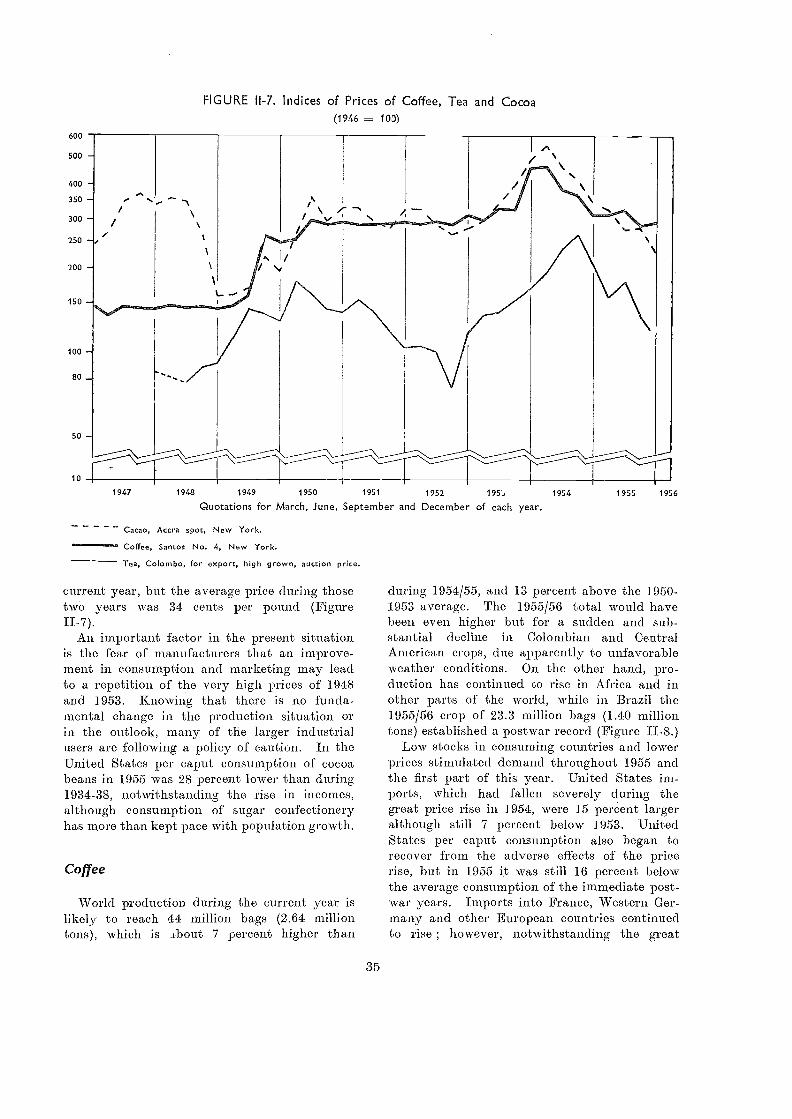
10
FIGURE 11-7. Indices of Prices of Coffee, Tea and Cocoa(1946 =. 100)
current year, but the average price during thosetwo years was 34 cents per pound (FigureII-7).
An important factor in the present situationis the fear of manufacturers that an improve-ment in consumption and marketing may leadto a repetition of the very high prices of 1948and 1953. Knowing that there is no funda-mental change in the production situation orin the outlook, many of the larger industrialusers are following a policy of caution. In theUnited States per caput consumption of cocoabeans in 1955 was 28 percent lower than during1934-38, notwithstanding the :rise in incomes,although consumption of' sugar confectioneryhas more than kept pace with population growth.
Coffee
World production during the current year islikely to reach 44 million bags (2.64 milliontons), which is _tbout 7 percent higher than
35
1947 1948 1949 1950 1951 1952 195, 1954
Quotations for March, June, September and December of each year.
- Cacao, Accra spot, New York.""*"""""*". Coffee, Santos No. 4, New York.
Tea, Colombo, for export, high grown, auction price.
1955 1956
during 1954/55, and 13 percent above the 1950-1953 average. The 1955/56 total would havebeen even higher but for a sudden and sub-stantial decline in Colombian ami CentralAmerican crops, due apparently to unfavorable-weather conditions. On the other hand, pro-duction has continued to rise in Africa and inother parts of the world, while in Brazil the1955/56 crop of 23.3 million bags (1.40 milliontons) established a postwar record (Figure II-8.)
Low stocks in consuming countries and lowerprices stimulated demand throughout 1955 andthe first part of this year. United States im-ports, which had fallen severely during thegreat price rise in 1954, were 15 perCent largeralthough still 7 percent below 1953. UnitedStates per caput consumption also began torecover from the adverse effects of the pricerise, but in 1955 it was still 16 percent belowthe average consumption of the immediate post-war years. Imports into France, Western Ger-many and other European countries continuedto rise ; however, notwithstanding the great
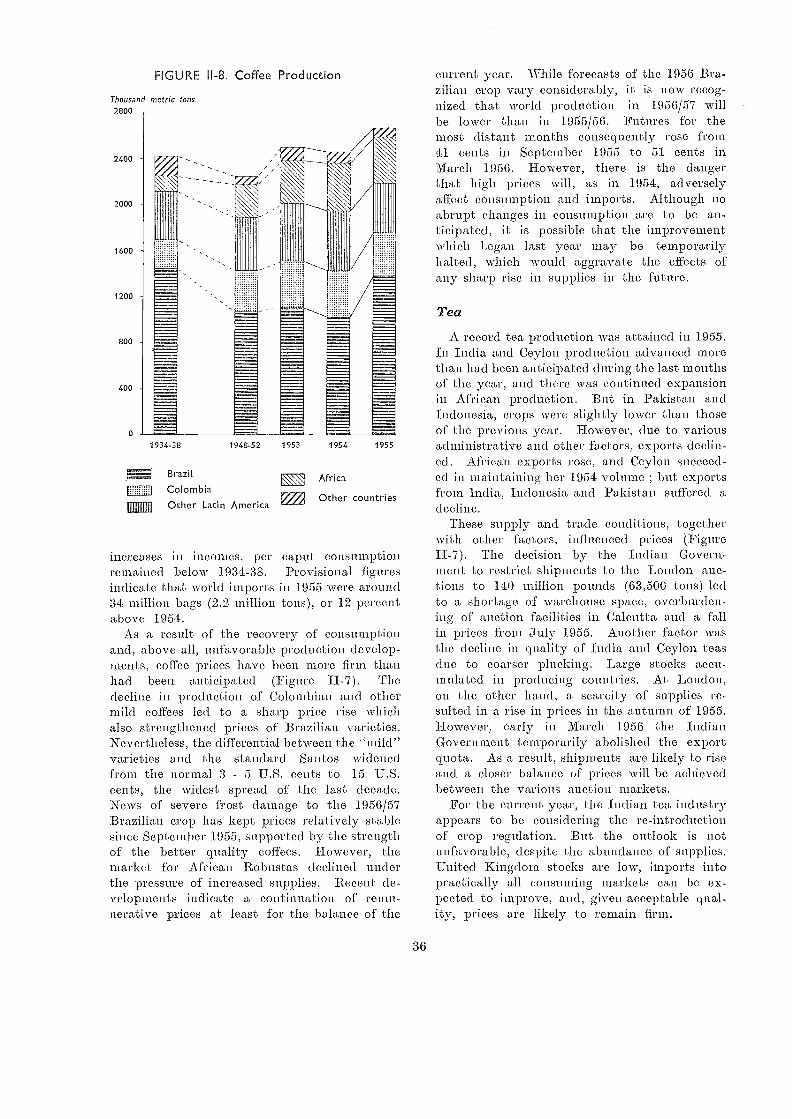
Thousand metric tons2800
F:773
IIWUIIII
FIGURE 11-8. Coffee Production
1934-38
Brazil Africak
increases in incomes, per caput consumptionremained below 1934-38. Provisional figuresindicate that world imports in 1955 were around34 million bags (2.2 million tons), or 12 percentabove 1954.
As a result of the recovery of consumptionand, above all, unfavorable production develop-nAents, coffee prices have been more firm thanhad been anticipated (Figure II-7). Thedecline in production of Colombian and othermild coffees led to a sharp price rise whichalso strengthened prices of Brazilian varieties.Nevertheless, the differential between th.e "mild"varieties and the standard Santos widenedfrom the normal 3 - 5 U.S. cents to 15 U.S.cents, the widest spread of the last decade.News of severe frost damage to the 1956/57Brazilian crop has kept prices relatively stablesince September 1955, supported by the strengthof the better quality coffees. However, themarket for African Robustas declined underthe pressure of increased supplies. Recent de-velopments indicate a continuation of remu-nerative prices at least for the balance of the.
36
current year. NAThile forecasts of the 1956 Bra-zilian crop vary considerably, it is now recog-nized that Avorld production in 1956/57 willbe lower than in 1955/56. Futures for themost distant months consequently rose from41 cents in September 1955 to 51 cents inMarch 1956. However, there is the dangerthat high prices will, as in 1954, adverselyaffect consumption and imports. Although noabrupt changes in consumption are to be an-ticipated, it is possible that the improvementwhich Legan last year may be temporarilyhalted, which \yould aggravate the effects ofany sharp rise in supplies in the future.
Tea
Colombia MI Other countriesOther Latin America
A record tea production was attained in 1955.In India and Ceylon production advanced morethan liad been anticipated during the last monthsof the year, and there was continued expansionin African production. But in Pakistan andIndonesia, crops were slightly lower than thoseof the previous year. However, due to variousadministrative and other factors, exports declin-ed. African exports rose, and Ceylon succeed-ed in maintaining her 1954 volume ; but exportsfrom india, Indonesia and Pakistan suffered adecline.
These supply and trade conditions, togetherwith other factors, influenced pajees (FigureII-7). Tire decision by the Indian Govern-ment to restrict shipments to the London auc-tions to 140 million pounds (63,500 tons) ledto a shortage o-f warehouse space, overburden-ing of auction facilities in Calcutta and a fallin prices from July 1955. Another factor wasthe decline in quality of India and Ceylon teasdue to coarser plucking. Large stocks accu-mulated in producing countries. At London,on the other hand, a scarcity of supplies re-sulted in a rise in prices in the autumn of 1955.However, early in March 1956 the IndianGovernment temporarily abolished tire exportquota. As a result, shipments are likely to riseand a closer balance of prices will be achievedbetween the various auction markets.
For the current year, the Indian tea industryappears to be considering the re-introductionof crop regulation. But the outlook is notunfavorable, despite the abundance of supplies.United Kingdom stocks are low, imports intopractically all consuming markets can be ex-pected to improve, and, given acceptable qual-ity, prices are likely to remain firm.
1954 19551948-52 1953
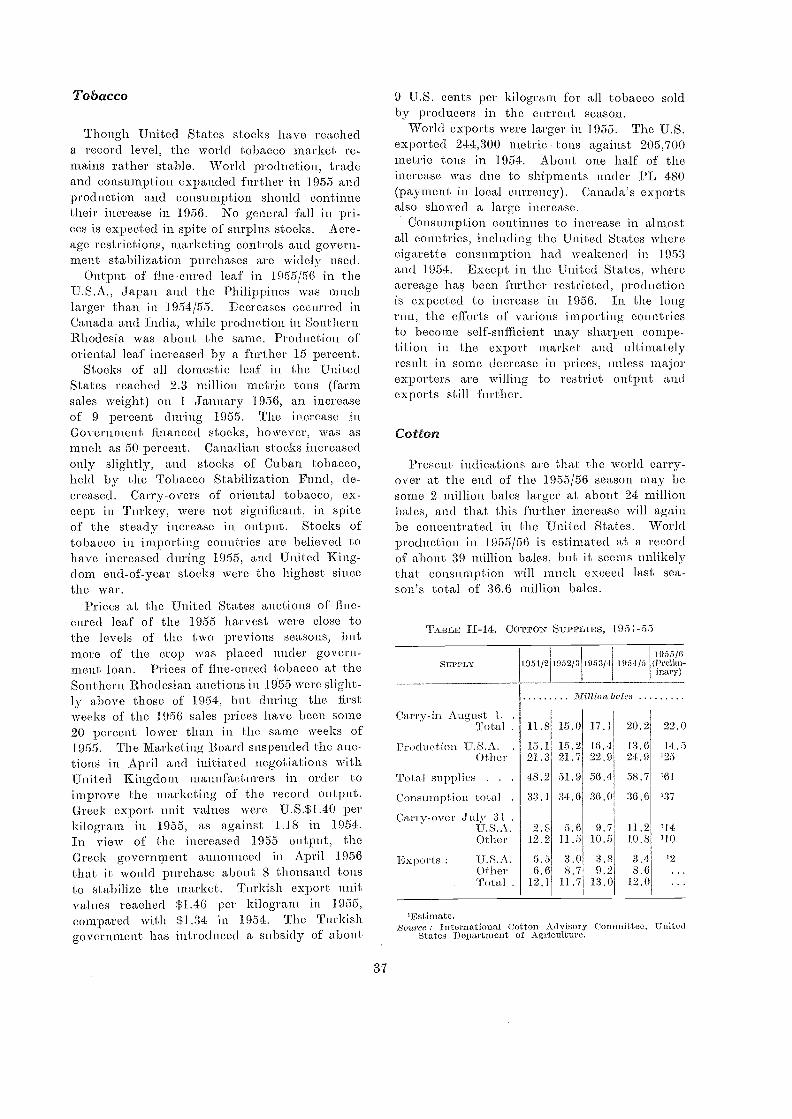
Tobacco
Though United States stocks have reacheda record level, the world tobacco market re-mains rather stable. World production, tradeand consumption expanded further in 1955 andproduction and consumption should continuetheir increase in 1956. No general fall in pri-ces is expected in spite of surplus stocks. Acre-age restrictions, marketing controls and govern-ment stabilization purchases are widely used..
Output of flue-cured le,af in 1955/56 in th.eU.S.A., japan and the Philippines was muchlarger than in 1954/55. Decreases occurred inCallada and India, while production in Southern:Rhodesia was about th.e same. Production oforiental leaf increased by a further 15 percent.
Stocks of all domestic leaf in the UnitedStates reached 2.3 million metric tons (farmsales weight) on 1 January 1956, an increaseof 9 percent during 1955. The increase inGovernment financed stocks, h.owever, was asmuch as 50 percent. Canadian stocks increasedonly slightly, and stocks of Cuban tobacco,held by the Tobacco Stabilization Fund, de-creased. Carry-overs of oriental tobacco, ex-cept in Turkey, were not significant, in spiteof the steady increase in output. Stocks oftobacco in importing countries are believed tohave increased during 1955, and United King-dom end-of-year stocks were the highest sincethe war.
Prices at the United States auctions of flue-cured leaf of the 1955 harvest Wel7C ClOSC tothe levels of the t-wo previous seasons, butmore of the crop WaS placed under govern-ment loan. Prices of flue-cured tobacco at theSouthern Rhodesian auctions in 1955 were slight-ly above those of 1954, but during the firstweeks of the 1956 sales prices have been some20 percent lower than in the same weeks of1955. The Marketing Board suspended the auc-tions in April and initiated negotiations with-United Kingdom manufacturers in order toimprove the marketing of the record output.Greek export unit values were U.S.$1.40 perkilogram in 1955, as against 1.18 in 1954.In view of the increased 1955 output, theGreek government announced in April 1956that it would purchase about S thousand tonsto stabilize the market. Turkish export unitvalues reached $1.46 per kilogram in 1955,compared with $1.34 in 1954. The Turkishgovernment has introduced a subsidy of about,
37
9 U.S. cents per kilogram for all tobacco soldby producers in the current season.
World exports were larger in 1955. The U.S.exported 244,300 metric , tons against 205,700metric tons in 1954. About one h.alf of theincrease was due to shipments under PL 480(payment in local currency). Canada's exportsalso showed a large increase.
Consumption continues to increase, in almostall countries, including the United States wherecigarette consumption had weakened in 1953and 1954. Except in the United States, whereacreage has been further restricted, productionis expected to increase in 1956. In the longrun, the efforts of various importing countriesto become self-sufficient may sharpen compe-tition in the export market and ultima,telyresult in some decrease in prices, unless majorexporters are willing to restrict output andexports still further.
Cotton
Present indications are that the world carry-over at the end of the 1955/56 season may besom.e 2 million bales larger at about 24 millionbales, and that this further increase will againbe concentrated in the United States. Worldproduction in 1955/56 is estimated at a recordof about 39 million bales, but it seems unlikelythat consuniption will much exceed last sea-son's total of 36.6 million bales.
TABLE II-14. COTTON SUPPLIES, [951-55
'Estimate.Source : International Cotton Advisory Committee, United
States Department of Agriculture.
SUPPLY 1951/2 1952/3 1953/4 1954/519515/6
(Prelim-inary)
Million bales
Carry-in August I. .
Total . 11.8 15.0 17.1 20.2 92.0
Produetion U.S.A. . 15.1 15.2 16.4 13.6 14.5Other 21.3 21.7 22.9 24.9 125
Tot al supplies . . 48.2 51.9 56.4 58.7 '61
Consumption total . 33.1 34.6 36.0 36.6 '37
Carry-over ,fuly 31 .
U. S. A. 2.8 5.6 9.7 11.2 114Other 12.2 U.S 10.5 10.8 '10
'Exports U.S.A. 5.5 3.0 3.8 3.4 12
Other 6.6 8.7 9.2 8.6Total . 12.1. 11.7 13.0 12.0
During the first half of 1955/56 a major fallin the export prices of non-U.S. growths tookplace in anticipation of the release at competi-tive prices of a million bales of CCC stocks.By December discounts for these growths var-ied up to 20 percent and more. Prices of' longerstaple cottons as well as those of 15/16 inchor less (comparable to the U.S. cotton to besold on bid by the CCC) were affected but toa rather smaller extent. Meanwhile cottonprices in the United States showed increasedfirmness with the heavy movement of cottoninto CCC stocks and this tendency is continuingas the supply of free cotton tightens. Theactual sale of the million bales of CCC cottonbegan in January and was completed by thebeginning of March at prices for Middling 15/16inch as much as 23 percent below the offi-cial support level while prices of other growths,especially the longer staples, recovered somepart or all of their earlier losses.
Exports from the United States up to mid-March were running at less than half last season'srate, and while some improvement may beexpected as shipment of the million bales iscompleted and as commitments under PL 480are implemented, total exports are likely to besubstantially below last season's. On the otherhand, exports from other countries, except Bra-zil and Turkey, have increased and it is ex-pected that most of the new crop cotton avail-able for export will be shipped this season.In total, world trade may be 1 million balesless than last season.
However, the trend of prices and trade inthe near future will depend mainly on theimplementation of an extended program, an-nounced in March, for the offer of CCC cottonstocks of all staples and grades at competitiveprices, for delivery next season. This, togeth-er with the initial program of one millionbales, is a major development in the U.S. ex-port policy intended to re-establish the tradi-tional share of U.S. cotton in world markets.By mid-July 3 million bales of CCC stocks liadbeen disposed of at prices until mid-May in theregion of 27.50 cents per pound for Midd/ing15116 inch staples ; but thereafter in accordancewith new legislation providing for the acceptanceof prices ranging down to 25.5 cents dependingon the competitive situation. Such prices willbe effective for exports of manufactured as wellas raw cotton.
The extent to which the drop in prices willdiscourage production cannot be readily gang-
38
ed. The support level for the 1956/57 uplandcrop in the United States has been reducedfrom 90 to 821/2 percent of parity - the sup-port price for Middling 15/16 inch staple fall-ing from 33.50 to 31.10 cents per pound, arelatively small reduction. Acreage restrictionsare the severest which legislation permits. Else-where, prices have dropped more steeply andmay provide a greater disincentive, particularlyamong the cotton producing countries of Cen-tral and South America and the man-madefiber producers in Europe.
Wool
Since the resumption of auctions in time
Southern Dominions in 1956, wool markets haveremained firm at a little above quotations inthe first half of the season. Labor troublesin Australia may have contributed to this firm-ness.
The current world clip is estimated at therecord figure of 1.2 million metric tons (cleanbasis). Available supplies exceed this quantityby over 40,000 tons of old clip wool in SouthAmerica at the beginning of this season andsome 30,000 tons of U.S. wool in the hands ofthe CCC. Since the introduction of the newexchange regulations in Argentina in December1955, market activity has increased and it ap-pears that a good part of the old clip wools,in Argentina at any rate, may be cleared.About 20 percent of the CCC stocks of U.S.wool were sold in time six months from Novem-ber 1955.
Although more wool is being offered thisseason than ever before, consumption is alsoat a comparatively high level. It is estimatedthat 1.2 million tons of wool (clean basis) havebeen consumed in 1955, an increase of 3 per-cent over the previous year. The proportiOnalincrease in the output of wool textiles has beensomewhat greater, as there has been a rela-tively large expansion in the use of materialsother than virgin wool. Following the fall inwool prices in September, ho-wever, the pro-portion of virgin wool textiles has risen again.
Jute
Prices have been firm in 1955/56, partly dueto the maintenance in Pakistan of last season'sminimum export price schedule on a sterlingbasis, notwithstanding devaluation, and partly
to the slowness of arrivals in upcountry mar-kets. Moreover, Indian and overseas mills ap-pear to have bought rather heavily in the firsthalf' of the 1955/56 season; purchases may there-fore slacken off in the closing months of theseas on.
Production probably exceeded 2 million tonsin 1955/56, of which some 1.3 million tons inPakistan and 900 thousand (including kenaf)in India. Local mill consumption plus exportstotaled 1.83 million tons in 1954/55, but en-tailed some drawing down of consiune,r stocks.Requirements in 1955/56 may be larger andare unlikely to leave an appreciable supply inproducing countries unsold at the end of theseason. The outlook for 1956/57 is more un-certain. In Pakistan sowings are believed tohave increased by 25 percent, but floods arereported to have affected the outturn. Tradecircles expect a Pakistani crop of 1.45 milliontons and an Indian crop of 800 thousand tons.On the other hand, :jute goods markets, al-though increasingly competitive, are 'unlikelyto show any very marked. expansion. Calcuttahas not shipped the whole, of' its increasedoutput and activity in Dundee has slackenedlately. With stocks replenished, this is likelyto reflect itself' in th.e demand for raw juteby the mills. It may well be, therefore, thatthe supply/demand balance in the 1956/57 sea-son will exert SOIT1C pressure on prices.
Hard Fibers
Hard fiber production rea,ched a record levelof 740 thousand metric tons in 1955, but itwas outstripped by a rise in ()Make. Most ofthe increase in output was in sisal, which to-taled about 450 thousand tons, with all themajor producers cutting more fiber than in theprevious year. Slightly more abaca was pro-duced in the Philippines, but so me of the CentralAmerican estates are being closed down. Theoutput of henequen in. 'Yucatan dropped sharply.The local cordage mills have, however, beenkept working to capacity by drawing on stocksaccumulated in previous years. This year theyha,ve contracted for the entire output in ad-vance.
In view of the buoyant dema,nd which re-flects among other things larger grain and haycrops, and increased shipbuilding and construc-tion activity, stocks of hard liber in producingcountries were virtually cleared. In Brazil and
39
Mexico, monetary 'factors gave a special impetusto supply stock clearance. Internationally,prices of hard fibers have been rather firm inrecent months, but any marked tendency ofprices to rise is being strongly resisted bybuyers. Prospects are for a larger output ofliard fibers.
Rubber
World consumption of natural and syntheticrubber reached a 1.e,cord in 1955 and was 15percent higher than in the previous year.Almost every rubber manufacturing countryincreased its consumption. The expansion Watigreatest (24 percent) in the United States,where consumption liad been at a relativelylow level in the preceding year. The upswingin demand began in the third quarter of 1954,but, in view of its more competitive price, thedemand for natural rubber had already beenrising for some time, while that for syntheticrubber had been declining.
The, price of* natural rubber increased rapidlyduring 1955, reaching a ma,xiinum in Septem-ber. The average for time yero' was 70 percenthigher than in 1954. In spite of these veryhigh prices, world production of natural rub-ber, although reaching a peak volume, expand-ed by only 6 percent, the response being greateramong time small holders tiran on tiro estates.
The advance in natural rubber prices even-tually took them to a point WhCre they wereabout double that of synthetic rubber, produc-tion of which expanded by 52 percent in 1955to 'near the limit of present capacity. A signifi-cant feature of the rise in synthetic rubberconsumption was the threefold increase in Unit-ed States exports and, consequently, tire verysharp expansion in time small quantities consum-ed in the non-producing countries.
In the early months of 1956, some recessionin demand became evident following cutbacksin automobile output in the -United States andthe United Kingdom. Moreover, the increas-ing supply of lower-priced synthetic rubber, a,ndthe prospect of capacity under construction inEurope and North America coming into usefurther ahead, were excercising a strong in-fluence on tire natural 'libber market. 'Pricesconsequently declined in time first half of 1956,though they remained higher than those ofequivalent synthetic rubbers.
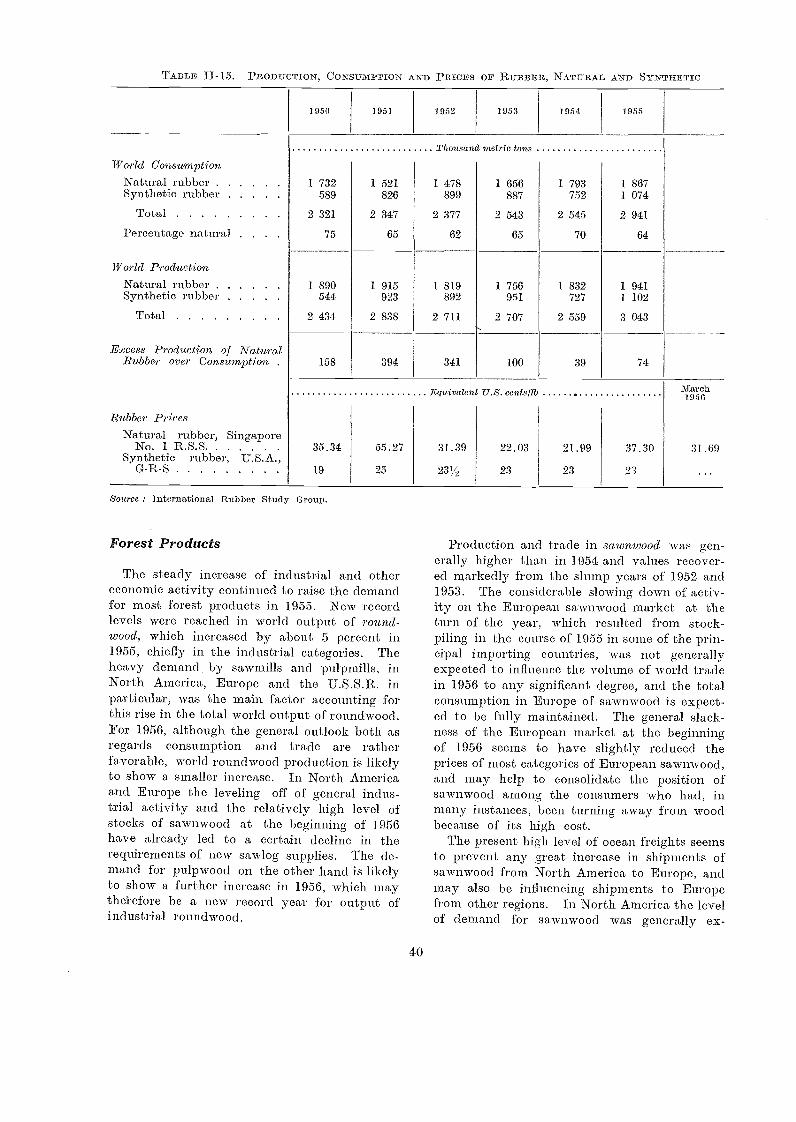
TABLE II-15. PRODUCTION, CONSUMPTION AND PRICES OF RUBBER NATURAL AND SYNTHETIC
Forest Products
The steady increase of industrial and othereconomic activity continued to raise the demandfor most forest products in 1955. New recordlevels were reached in world output of round-wood, which increased by about 5 percent in1955, chiefly in the industrial categories. Theheavy demand by sawmills and pulpmills, inNorth America, Europe and the U.S.S.R. inparticular, was the main factor accounting forthis rise in the total world output of roundwood.For 1956, although the general outlook both asregards consumption and trade are ratherfavorable, world roundwood production is likelyto show a smaller increase. In North Americaand Europe the leveling off of general indus-trial activity and the relatively high level ofstocks of sawnwood at, time beginning of 1956have already led to a certain decline in therequirements of new sawlog supplies. The de-mand for pulpwood on the other hand is likelyto show a further increase in 1956, which maytherefore be a new record year for output ofindustrial roundwood.
Source : International Rubber Study Group.
40
Production and trade in sawnwood was gen-erally higher timan in 1954 and values recover-ed markedly from the slump years of 1952 and1953. The considerable slowing clown of activ-ity on the European sawnwood market at timeturn of the year, which resulted from stock-piling in the course of 1955 in some of th.e prin-cipal importing countries, was not generallyexpected to influence time volume of world tradein 1956 to any significant d.egree, and the totalconsumption in Europe of sawnwood is expect-ed to be fully maintained. Time general slack-ness of the European market at the beginningof 1956 seems to have slightly reduced timeprices of most categories of European sawnwood.,and may help to consolidate time position ofsawnwood among the consumers who had, inmany instances, been turning away from woodbecause of its high cost.
The present high level of ocean freights seemsto prevent any great increase in shipments ofsawnwood from North America to Europe, andmay also be influencing shipments to Europefrom other regions. In North America the levelof demand for sawnwood was generally ex-
1950 1951 1952 1953 1954 1955
Thousand metric tons
World ConsumptionNatural rubber 1 732 1 521 1 478 1 656 1 793 1 867Synthetic rubber 589 826 899 887 752 1 074
Total 2 321 2 347 2 377 2 543 2 545 2 941
Percentage natural . 75 65 62 65 70 64
World ProductionNatural rubber 1 890 1 915 1 819 1 756 1 832 1 941Synthetic rubber 544 923 892 951 727 1 102
Total 2 434 2 838 2 711 2 707 2 559 3 043
Excess Production of NaturalRubber over Consumption . 158 394 341 100 39 74
Equivalent U.S. centsllb march1950
Rubber PricesNatural rubber, Singapore
No. 1 R.S.S. 35.34 55.27 31.39 22.03 21.99 37.30 31.69Synthetic rubber, U.S.A.,
G-R-S 19 25 231/2 23 23 23
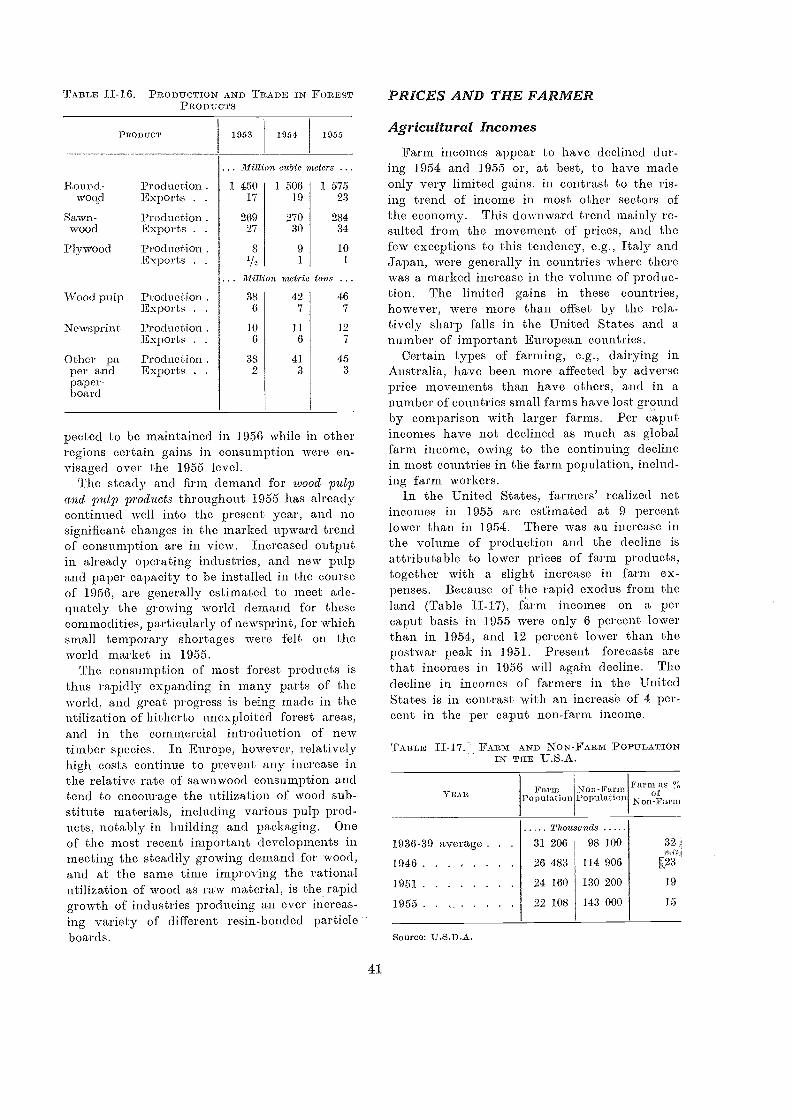
TABLE II-16. PRODUCTION AND TRADE IN FORESTPRODUCTS
pected to be naaintained in 1956 while in otherregions certain gains in consumption were en-visaged over the 1955 level.
The steady and firm demand for wood pulpand pulp products throughout 1955 has alreadycontinued well into the present year, and nosignificant changes in the marked upward trendof consumption are in view. Increased outputin already operating industries, and new pulpand papel' capacity to be installed in the courseof 1956, are generally estimated to meet ade-quately the growing world demand for thesecommodities, particularly of newsprint, for whichsmall temporary shortages were felt on theworld market in 1955.
The consumption of most forest products isthus rapidly expanding in many parts of theworld, and great progress is being made in theutilization of hitherto unexploited forest arcas,and in the commercial introduction of newtimber species. In Europe, however, relativelyhigh costs continue to prevent any increase inthe relative rate of sawnwood consumption andtend to encourage the utilization of wood sub-stitute materials, including various pulp prod-ucts, notably in building and packaging. Oneof the most recent important developments inmeeting th.e steadily growing demand for wood,and at the same time improving the rationalutilization of wood as raw material, is the rapidgrowth of industries producing an ever increas-ing variety of different resin-bonded particleboards.
41
PRICES AND THE FARMER
Agricultural Incomes
Farm incomes appear to have declined dur-ing 1954 and 1955 or, at best, to have madeonly very limited gains, in contrast to the ris-ing trend of income in most other sectors ofthe economy. This downward trend mainly re-sulted from the movement of prices, and thefew exceptions to this tendency, e.g., Italy andJapan, were generally in countries where therewas a marked increase in the volume of produc-tion. The limited gains in these countries,however, were more than offset by the rela-tively sharp falls in the United States and anumber of important European countries.
Certain types of farming, e.g., dairying inAustralia, have been more affected by adverseprice movements than have others, and in anumber of countries small farms have lost groundby comparison with larger farms. Per caputincomes have not declined as much as globalfarm income, owing to the continuing declinein most countries in the farm population, includ-ing farm, workers.
In the United States, farmers' realized netincomes in 1955 are estimated at 9 percentlower than in 1954. There was an increase inthe volume of production and the decline isattributable to lower prices of farm products,together with a slight increase in farm ex-penses. Because of the rapid exodus from theland (Table 11-17), farm incomes on a percaput basis in 1955 were only 6 percent lowerthan in 1954, and 12 percent lower than thepostwar peak in 1951. Present forecasts arethat incomes in 1956 will again decline. Time
decline in incomes of farmers in the UnitedStates is in contrast with an increase of 4 per-cent in the per caput non-farm income.
TA13LE II-17. FARM AND NON-FARM POPULATIONIN THE U.S.A.
YEAR
1936-39 average.
1946
1951
1955
Source: U.S.D.A.
Font:.Population
Non-FarmPopulati OD
Farm as %of
Non-Farm
Thousands
31 206 98 100 32
26 483 114 906 23
24 160 130 200 19
22 108 143 000 15
PRODUCT 1953 1954 1955
Milton:, cubic meters . .
Round- Production 1 450 1 506 1 575woctd Exports . . 17 19 23
Sawn- Production 269 270 284wood Exports . . 27 30 34
Plywood Production . 9 10Exports . . 112 1
Million metric tons ...
Wood pulp Production . 38 42 46Exports . . 6 7 7
Newsprint Production . 10 11 19Exports . 6 6 7
Other pa- Production . 38 41 45per and Exports . . 2 3 3paper-board
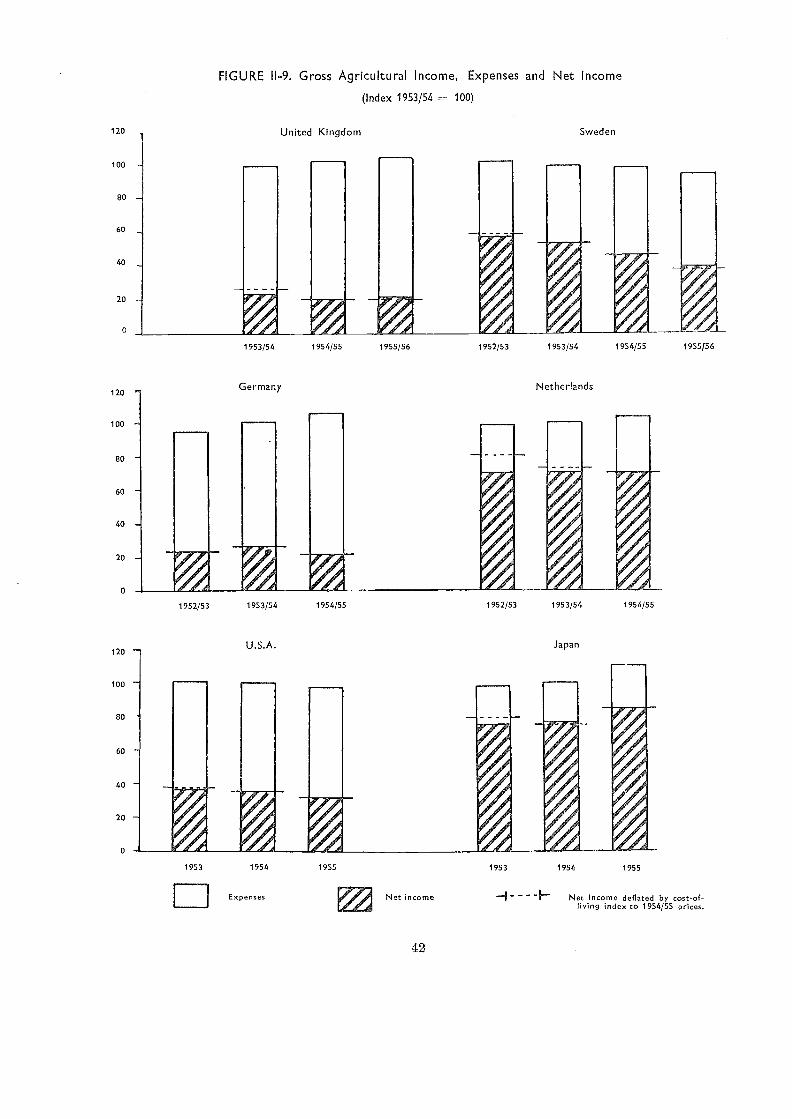
FIGURE 11-9. Gross Agricultural Income, Expenses and Net Income
(Index 1953/54 = 100)
1953/54
Germany
pi Expenses
United Kingdom Sweden
195 4/5 5 1955/56
Net income
42
1952/53
- - -
1953/54
Netherlands
195 4/5 5 1955/56
Net income deflated by cost-of-ving index to 1954/55 prices.
1952/53 1953/54 1954/55 195 2/5 3 1953/54 1954/55
1953 1954 1955 1953 1954 1955
In Canada the farm cash income in 1955was slightly less than in 1954, but higher in-ventories more than offset a slight increase inoperating expenses and depreciation, resultingin an increase in total net income.
Full data are not yet available for Oceania,but it seems probable that farmers' incomeswere fairly stable, comparing 1955 with 1954.The gross receipts of agriculture in Australiawere affected by the fall in prices of highquality wool, wheat and dairy products during1955, but the decline in prices was offset bya rise in the general volume of production.In New Zealand, prices received by farmershave remained fairly stable, while the risingtrend in output continued. In both countriesexpenses are understood to have remained fairlysteady, and it is thus probable that there wasno great change in farm incomes from the pre-ceding year.
For Europe, a general feature was a fairlysubstantial increase in total expenses between1954 and 1955, but the effect on incomes wasnot uniform, as a result of variations in outputdue to the weather, and different approachesto price and income control, described in alater section of this chapter. In the UnitedKingdom the strongest influence on income dur-ing 1954/55 was the bad weather, -which revers-ed the rising trend in output for the first timesince the early postwar years. Despite thehigher prices agreed in recent years, the grossfarm income in 1954/55 rose only slightly incomparison with 1953/54. Expenses continuedto rise, and the net farm income thus fell byabout 15 percent. In Sweden similar factorshave operated and net incomes fell by 12 percent.Preliminary estimates suggest that in 1955/56 thedecline may have continued in Sweden, buthave been reversed in the United Kingdom.
In Germany and the Netherlands the salesvalue of agricultural output increased between1953/54 and 1954/55. In Germany, however,expenses rose even faster and net income declin-ed by nearly 20 percent, while in the Netherlandsexpenses rose by about the same amount, asthe value of agricultural production and netincome remained stable. In Italy, the grosssaleable value of agricultural output increasedby about 6 percent. This increase was almostentirely due to a rise in the volume of output,as prices received by farmers remained station-ary. Expenses also rose, but the net returnto agriculture was about 5 percent higher in1955 than in 1954.
43
It is perhaps worth noting that as a rulewhere expenses have increased in Europeancountries, there is some evidence that this wasdue in part to a rise in volume of inputs, andonly partly to an increase in the price of farmrequisites. Thus the tendency noted in lastyear's issue of this report toward increasinginputs and intensity of production seems tohave been maintained.
In Africa there are data for only two coun-tries - the Union of South Africa and SouthernRhodesia. In Southern Rhodesia, the gross in-come of European farmers increased by about3 percent, whereas operating expenditure in-creased by about 6 percent. The realized netincome of farm operators declined very slightly.In the Union of South Africa the net incomeof agriculture fell slightly between 1953/54 and1954/55 ; no information is available on thevalue of output or on expenses.
Besides these areas, the only country forwhich information is available is Japan, wherefarm incomes were higher in 1955/56 (year end-ing in March) than in 1954/55. Cash incomeincreased by about 14 percent, mainly due tobumper crops, especially of rice. Farm expens-es were up by about 5 percent and the netgain in income received by farm operators fromagricultural and non-agricultural occupationswas about 7 percent.
The Relative Level of Agricultural Income
Previous issues of this report have publishedestimates, based on population projections andglobal incomes by industrial origin, of per caputincome in agriculture compared with otheroccupations. These estimates only go to 1954and are admittedly weak, but they remain thebest possible internationally comparable indica-tor for the purpose.
In only a few countries are the trends suf-ficiently pronounced to exceed the possibilitiesof error in the data. Nevertheless, there canbe small doubt that, in, e. g., Canada, Japan, theUnited Kingdom, the United States and, pos-sibly, Norway, people dependent on agriculturehave become steadily less prosperous in relationto other sectors of the population than theywere at the peak of the postwar period. Atthe same time, no countries show evidence ofpersistent rising trends. So far as this ratherscanty evidence goes, it seeras to lead to theconclusion that, although on the whole actualincomes in agriculture have not fallen very
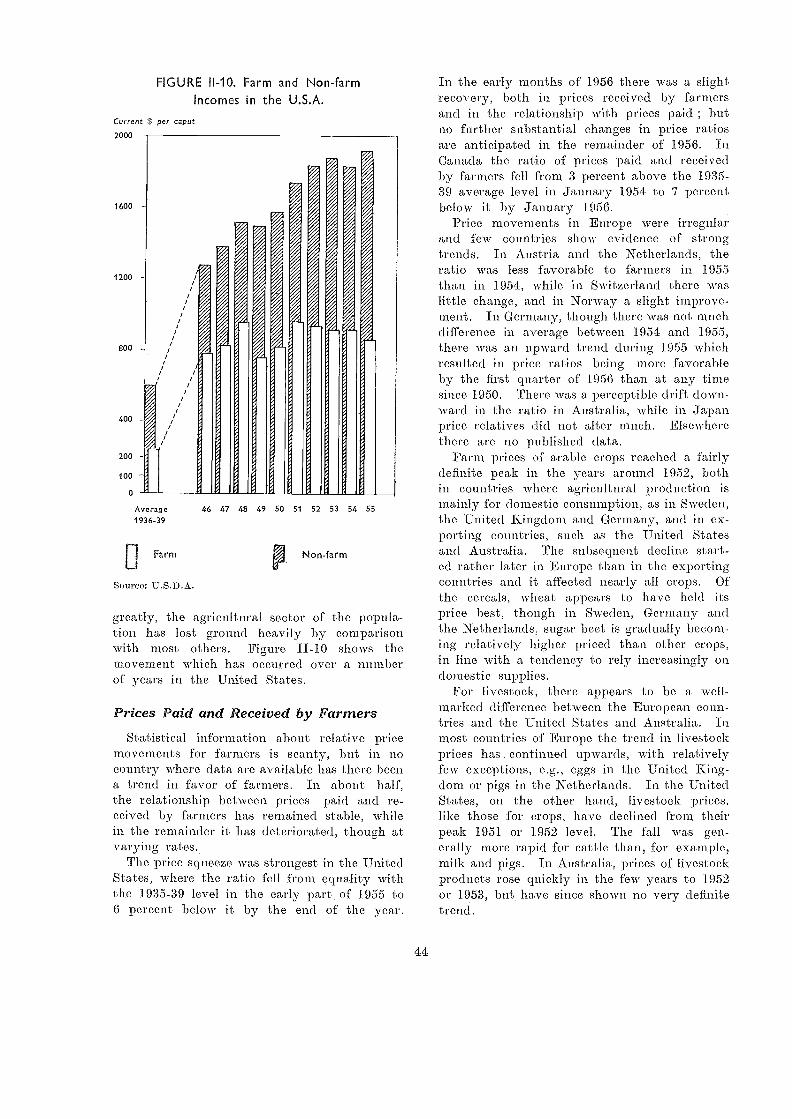
Current $ per caput
2000
1600
1200
800
400
200
100
o
FIGURE 11-10. Farm and Non-farmIncomes in the U.S.A.
44
In the earl3r months of 1956 there was a slightrecovery, both in prices received by farmersand in the relationship with prices paid ; butno further substantial changes in price ratiosare anticipated in the remainder of 1956. InCanada the ratio of prices paid ami receivedby farmers fell from 3 percent above the 1935-39 average level in January 1954 to 7 percentbelow it by January 1956.
Price movements in Europe were irregularand few countries show evidence of strongtrends. In Austria and the Netherlands, theratio was less favorable to farmers in 1955than in 1954, while in Switzerland there waslittle change, and in Norway a slight improve-ment. In Germany, though there was not muchdifference in average between 1954 and 1955,there was an upward trend. during 1955 whichresulted in price ratios being more favorableby the first quarter of 1956 than at any timesince 1950. There was a perceptible drift down-ward in the ratio in Australia, while in Japanprice relatives (lid not alter much. Elsewherethere are no published data.
Farm prices of arable crops reached a fairlydefinite peak in the years around 1952, bothin countries where agricultural production ismainly for domestic consumption, as in Sweden,the United Kingdom and Germany, and in ex-porting countries, such as the United Statesand Australia. The subsequent decline start-ed rather later in Europe than in the exportingcountries and it affected nearly all crops. Ofthe cereals, wheat appears to have held itsprice best, though in Sweden, Germany andthe Netherlands, sugar beet is gradually be,com-ing relatively higher priced than other crops,in line with a tendency to rely increasingly ondomestic supplies.
For livestock, there appears to be a well-marked difference between the European coun-tries and the United States and Australia. Inmost countries of Europe the trend in livestockprices has . continued upwards, with relativelyfew exceptions, e.g., eggs in the United King-dom 017 pigs in the Netherlands. In the UnitedStates, on the other hand, livestock prices.like those for crops, have declined from theirpeak 1951 or 1952 level. The fall was gen-erally more rapid for cattle than, for example,milk and pigs. In Australia, prices of livestockproducts rose quickly in the few years to 1952Or 1953, but have since shown no very definitetrend.
Average 46 47 48 49 50 51 52 53 5/ 55
1936-39
Farm Non-farm
Source: U.S.D.A.
greatly, the agricultural sector of the popula-tion has lost ground heavily by comparisonwith most others. Figure II-10 shows themovement which has occurred over a numberof years in the United States.
Prices Paid and Received by FarmersStatistical information about relative price
movements for farmers is scanty, but in nocountry where data are available has there beena trend in favor of farmers. In about half,the relationship between prices paid and re-ceived by farmers has remained stable, whilein the remainder it has deteriorated, though atvarying rates.
The price squeeze was strongest in the UnitedStates, where the ratio fell from equality withthe 1935-39 level in the early part of 1955 toO percent below it by the end of the year.
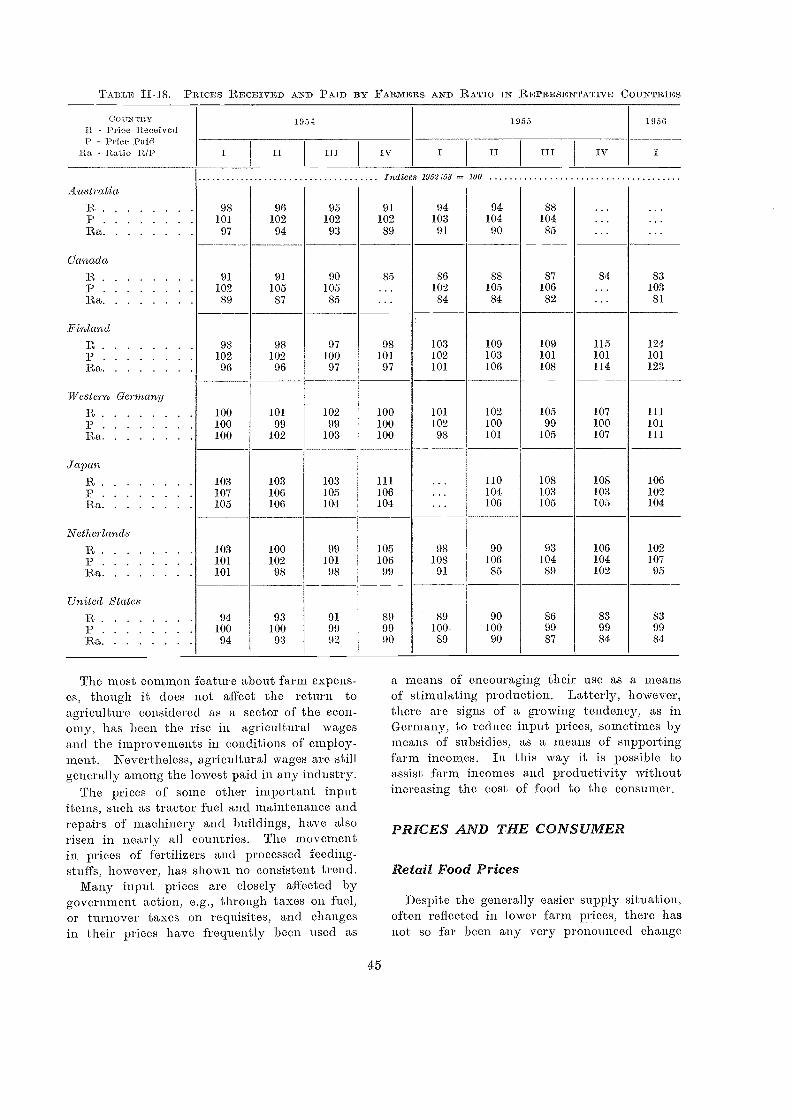
TABLE PRICES RECEIVED AND PAID BY FARMERS AND RATIO IN REPRESENTATIVE COUNTRIES
The most common feature about farrn expens-es, though it does not affect the return toagriculture considered as a sector of the econ-omy, has been the rise in agricultural wagesand the improvements in conditions of employ-ment. Nevertheless, agricultural wages are stillgenerally among the lowest paid in any industry.
The prices of some other important inputitems, such as tractor fuel and maintenance andrepairs of machinery and buildings, have alsorisen in nearl3r all countries. The movementin prices of fertilizers and processed feeding-stuffs, however, has shown no consistent trend.
1V1any input prices are closely affected bygovernment action, e.g., through taxes on fuel,or turnover taxes on requisites, and changesin their prices have frequently been used as
45
a means of encouraging their use as a meansof stimulating production. Latterly, however,there are signs of a growing tendency, as inGermany, to reduce input prices, sometimes bymeans of subsidies, as a means of supportingfarm incomes. In this way it is possible toassist farm incomes and productivity -withoutincreasing the cost of food to the consumer.
PRICES AND THE CONSUMER
Retail Food Prices
Despite the generally easier supply situation,often reflected in lower farm prices, there hasnot so far been any very pronounced change
COUNTRY'R - Price ReceivedP - Price Paid
Ra - Ratio R/P
105,1 1055 11)56
II IV II III IV
Indices 1952153 = 100Australia
98 96 95 91 94 94 88101 102 102 102 103 104 104
Ra 97 94 93 89 91 90 85
Canada91 91 90 85 86 88 87 84 83
102 105 105 102 105 106 103Ra 89 87 85 84 84 82 81
:Finland98 98 97 98 103 109 109 115 124
102 102 100 101 102 103 101 101 101Ra 96 96 97 97 101 106 108 114 123
'Western Germany100 101 102 100 101 102 105 107100 99 99 100 102 100 99 100 101
Ra 100 102 103 100 98 101 105 107
Japan103 103 103 111 110 108 108 106107 106 105 106 104 103 103 102
Ra 105 106 104 104 106 105 105 104
Netherlands103 100 99 105 98 90 93 106 102101 102 101 106 108 106 104 104 107
Ra 101 98 98 99 91 85 89 102 95
United States94 93 91 89 89 90 86 83 83
Ra10094
10093
9992
9990
100,89
10090
9987
9984
9984
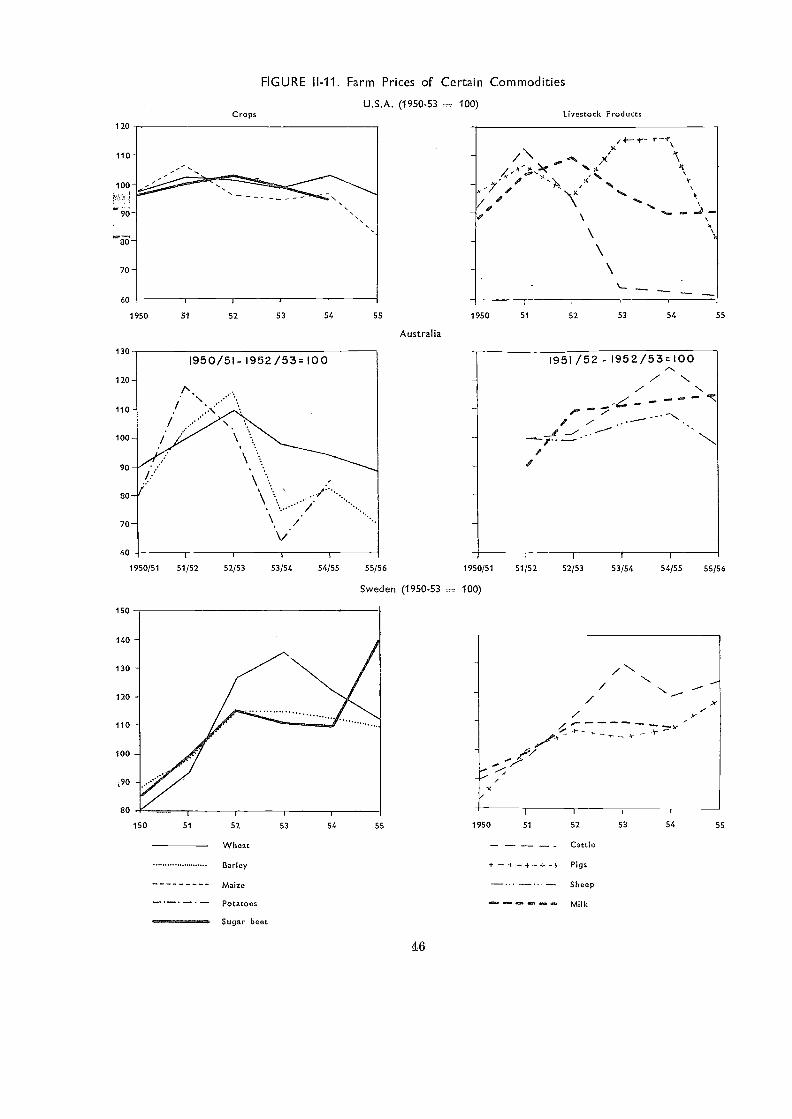
130
120 -
110 -
100 -
90
80
70-
60
1950/51 51/52
150
140
130
120
110
100
,90
80
52/53
FIGURE II-11. Farm Prices of Certain Commodities
53/54
U.S.A. (1950-53 = 100)
55/56
Australia
46
1951 /52 - 1952/53=100N
"#.""/ .
---._ -
I
Sweden (1950-53 = 100)
./ >e/ 4- -
1950 51 52 53 54 55
Crops Livestock Products
55/561950/51 51/52 52/53 53/54 54/55
51 52 53 54
Cattle
+ - + - -F - + - f Pigs
Sheep
/MAD OM 16,0 POP PP
1950 55150 51 53 54 5552
Wheat
Barley
Maize
Potatoes
Sugar beet
Milk
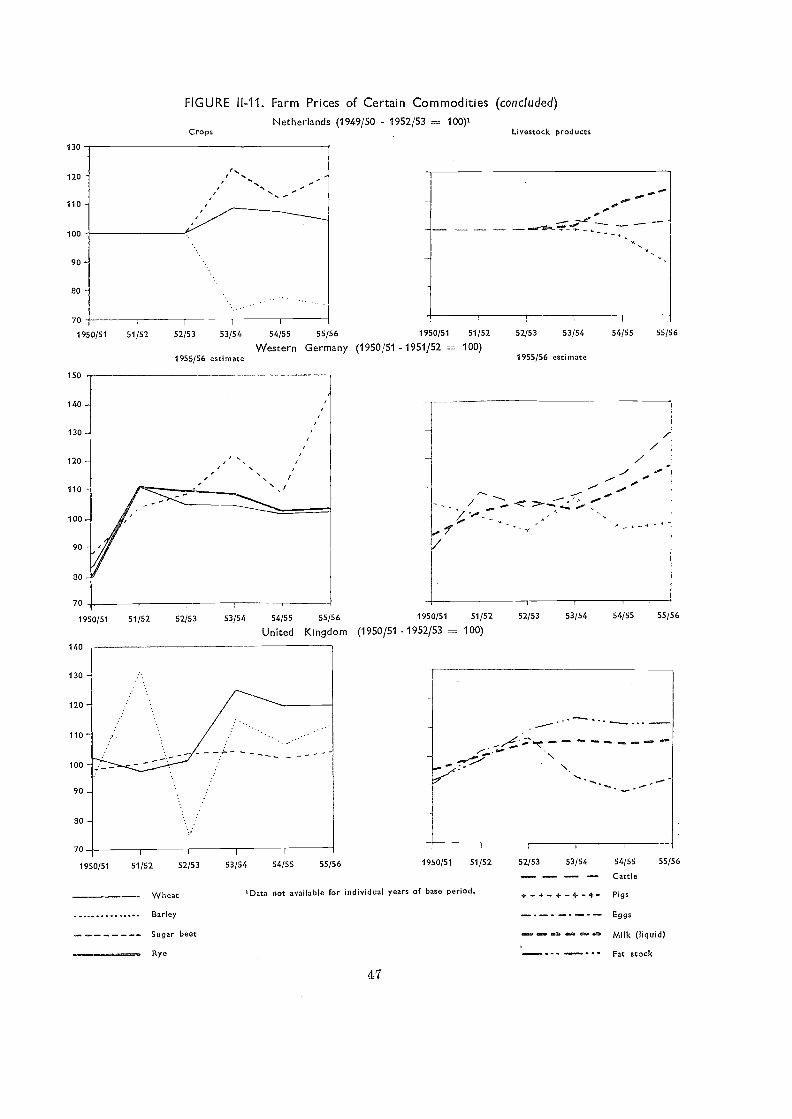
130
120
110
100
90
80
FIGURE 11-11. Farm Prices of Certain Commodities (concluded)Netherlands (1949/50 - 1952/53 = 100),
Crops
70 . r I
1950/51 51/52 52/53 53/54 54155 55/56 1950/51 51/52
Western Germany (1950/51 - 1951/52 = 100)1955/56 estimate
150
140
130
120 -
110 -
100
90
80
70
1950/51
140
130
120
110 -
100
90
80
70
Wheat
Barley
Sugar beet
Rye
47
51/52 52/53 53/54 54/55 55/56 1950/51 51/52
United Kingdom (1950/51 - 1952/53 = 100)
1950/51
'Data not available for individual years of base period.
Livestock prod ucts
51/52
52/53 53/54 54/55
52/53 53/54 54/55
Cattle
- - - - Pigs
Eggs
0160 411026 41110D MY OD Milk (liquid)
Fat stock
55/56
55/56
52/53 53/54 54/55 55/56
1955/56 estimate
1950/51 51/52 52/53 53/54 54155 55/56
in retail food prices, either absolutely or inrelation to the general retail price level.
Retail food prices have fallen slightly in somecases, but much less than farm prices. In mostcountries retail prices have been fairly stable,though they have sometimes continued to risebecause of changed policies, while in a fewcountries inflation still persists. Where retailfood prices have changed in their relation withgeneral retail prices, the movement has usuallybeen downward, but it has not been very mark-ed (Figure II-12).
In the United States, average food prices in1955 were about 2 percent lower than in 1954,while farm prices were down by 5 percent.The total fall in food prices since theyreached a peak in 1952 has only been about4 percent, compared with a decline in farmprices of about 20 percent. In Callada retailfood prices have changed very little since1953, though there was a slight decline in thefirst quarter of 1956. In both these countriesgeneral retail prices have remained stable, sothat food prices have fallen slightly in relationto general prices, though U.S. retail food pricesbegan to rise again in March 1956.
The European countries fall into three groups.First, there are countries like Denmark andthe United Kingdom, where there has been afairly pronounced and continuing rise in gener-al retail prices and food prices have increasedeven faster. Second, there are countrieswith only a slow increase in prices, with foodprices keeping pace with the others ; intothis group fall Italy, Sweden, Spain and theNetherlands. Third, in most of the remainingcountries prices have remained more or lessstable. It is difficult to see any general setof causes for this pattern, developments insingle countries resulting from the interplay ofspecific price policies and general economicpolicies. Undoubtedly in the first group muchmust be ascribed to the influence of changingfood price policies, e.g., in the United Kingdom,where food subsidies have been reduced. Atany rate, it seems clear that in the UnitedKingdom and Denmark the relationship be-tween food and other prices is undergoing achange, at the end of which food prices willbe relatively much higher than they were inthe years 1950-53. In the other countriesthe stability of this relationship so far appearsto have been unaltered.
Outside Europe, also, government price andsupply policies have mainly determined whether
48
the impact of larger supplies or surpluses hasbeen felt on retail prices. There are, however,very few countries where food prices have be-come relatively higher than other.prices, whilethere are some countries where food prices havebecome relatively lower. In the Near East,Turkey and Iran are examples of countrieswhere food prices have increased less thanothers in a general inflationary price increase.In Egypt and Iraq prices and price relationshipshave remained stable, while in Lebanon theyhave varied irregularly without a definite trend.In the Far East, as in Japan, India andPakistan, there appears to have been a slightdownward tendency of prices in general, withfood prices leading the way, though from thesecond half of 1955 in India and Pakistan, andsomewhat later in Japan, prices showed signsof recovery. This downward tendency was pri-marily due to the decline in bread grain andrice prices. In some other Far Eastern coun-tries, such as Ceylon and the Philippines, whereconsumer prices of some basic foods are insulat-ed from international prices, consumers do notyet appear to have benefited to any large ex-tent from lower food prices.
In Latin America, in those countries witha structural excess of food demand over sup-plies, and the impossibility of sufficient imports,because of shortage of foreign exchange, therapid inflation continued, as in Bolivia, Chileand, to a lesser extent, in Brazil. In Chile awage-price freeze was decreed at the beginningof 1956 in an attempt to stabilize the economy.Neither in these countries, nor in those withmore stable prices, has there been, however,any perceptible change in food prices relativeto other pices over the last four years, withthe possible exception of Argentina. In thiscountry, which is in a somewhat different posi-tion, as a food exporting country, the averagefood price level for 1954 was about 5 percentlower, relative to other prices, than in 1953,and this relative decline was accentuated dur-ing 1955.
These rather minor changes in food pricesrelative to other prices, have been insufficientto alter the trends in consumer expenditurecommented on in last year's report. In mostcountries there is a great degree of stabilityin expenditure on food as a percentage of totalpersonal expenditure, though there seems to besome rising tendency in the United Kingdom,Denmark and possibly Ireland, where food priceshave increased relative to the cost of living.
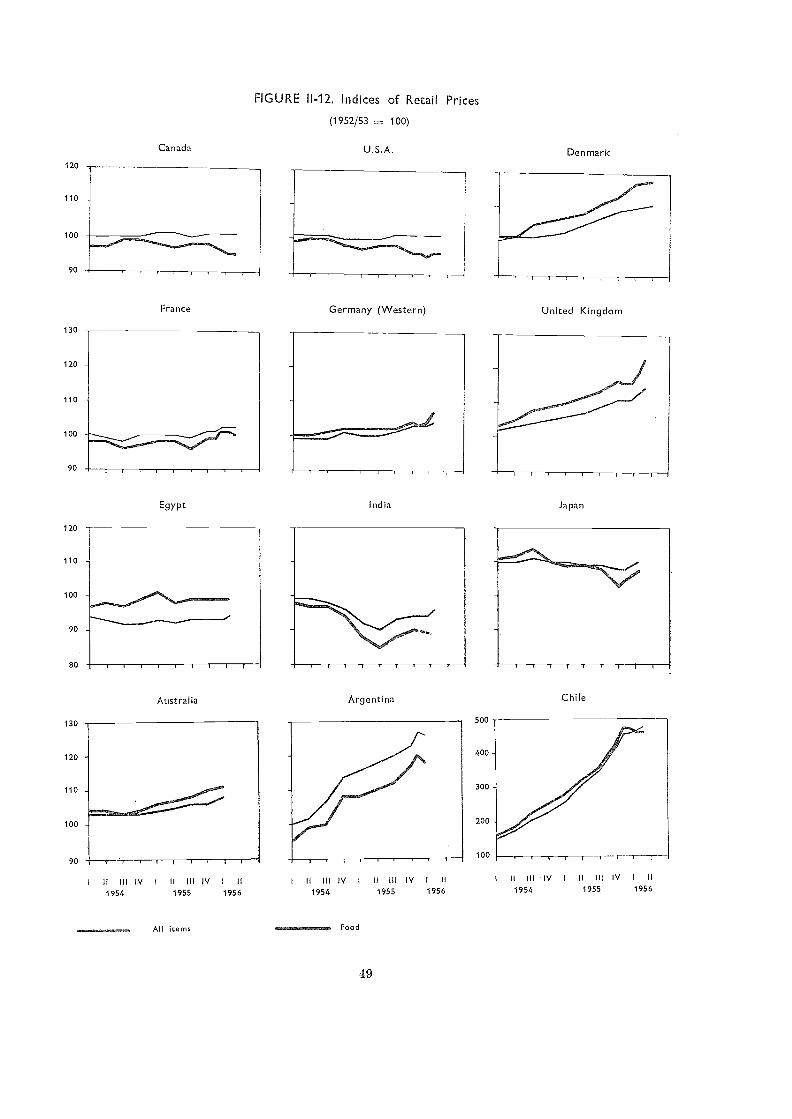
130
120 -
110 -
100 -
90
120
110
100
90
80
130
120
110
100
90
FIGURE 11-12. Indices of Retail Prices
(1952/53 100)
Canada U.S.A. Den mark
49
500
400
300
200
100
France Germany (Western) United Kingdom
Egypt India Japan
Australia Argentina Chile
II III IV I II III IV I II II III IV I II Ill IV I II I II Ill IV I II Ill IV I II
1954 1955 1956 1954 1955 1956 1954 1955 1956
All items Food
120
110
100
90
In Japan, oil the other hand, where food priceshave fallen, the percentage of expenditure onfood fell very sharply for a number of years,though there are signs that this trend has nowbeen checked.
Marketing Margins
The fact that, where farm and internationalprices have fallen, they have been reflectedonly partially, if at all, in retail food prices,indicates that marketing costs have generallycontinued to in.crease. Only for the 'UnitedStates, however, are current data available fromwhich this rise in marketing costs can be meas-ured. For other countries very little 11CW dataare available beyond that published in the 1954and 1955 issues of thi.s report.
In the United States the marketing marginfor the average family's "market basket" offarm foods increased from $564 in the firstquarter of 1955 to $580 in the first quarterof 1956, an increase of about 3 percent (TableII-19). Over the same period -the farm valueof the market basket fell by as much as 10percent, but the retail cost fell by only 2 per-cent.
Prices of meat products were the main in-fluence on these changes, farm prices fallingby as much as 27 percent, while the market-ing margin rose by 10 percent. The fall inretail prices of meat products was thus only12 percent.
The marketing margin measures the cost ofmarketing a fixed quantity of food and
TABLE II-19. UNITED STATES : COST OF MARKETBASKET OF FARM FOODS,1 JANUARY TO MARCH 1955
AND 1956
'Average quantities of farm food products purchased perwage-earner and clerical-worker family in 19; 2.
50
influenced chiefly by changes in wages, trans-port charges and profits. The total food market-ing bill paid by the United States consumerhas, .however, increased even faster, as it re-flects also increased services to the consumerand the larger volume of food marketed. Ithas been estimated that in the period 1940-1955 the marketing bill increased from $9 thou-sand million to $32 thousand million. Of this$23 thousand million increase, the rise in costsand profits accounted for $13 thousand millionand the, added vol unte handled for $4 thousandmillion, while the remaining $0 thousand million,or one quarter, represents payments .for addi-tional or improved marketing services, includingincreased use of restaurants. In other word.s,the increased marketing bill the United Statesconsumer has to pay is partly recompensed bybetter and more up-to-date services in pack-aging, processing, etc., provided in large partin response to th.e demand of consuniers withincreased incomes. This is probably also tru.e,though to a smaller extent, in other countries.
FOOD CONSUMPTION LEVELS
In contrast with the more rapid changesfrom year to year in the earlier postwar period,the levels and patterns of food consumptionin all regions and in most countries have be-come much more stable, .reflecting time substan-tial and steady gains in food output recordedsince time low levels of the immediate postwarperiod.
In the more advanced countries, especiallythose in which the calorie requirements ofnearly all sections of the population are fullymet, progress in recent years has concentrated.on quality and variety of the diet, especiallyon more livestock products and other protectivefoods, including fruit and vegetables. A simi-lar tendency is noticeable in the case of highlyprocessed foodstuffs of a luxury or semi-luxurynature. Increasing mastery of' techniques offood preservation is making possible a fullerutilization throughout the year of many sea-sonal and highly perishable food products.Technical developments in the food processingand packing industries have made it possibleto provide food products to the consumer inan abundant variety of new and more .hygienicforms. In some cases, as discussed above, these
Retail Cost 974 949 250 221
Farm Value 410 369 144 105
Marketing Margin . 564 580 106 117
Ail Products Mead Products
1955 1955
additional services to the consumer have th.eeffect of maintaining or increasing food market-ing costs.
In the less developed region.s, especially theFar East, improvements in the diet have largelyreflected an increased calorie intake, chieflythrough larger consumption of staple foods likerice, other, cereals and starchy roots. A steadyincrease in the consum.ption of sugar is alsonoticeable. In some of these countries, thereltas also been a tendency to increase the con-sumption (.4 livestock products and fish. How-ever, such changes are difficult to measure oreven detect by food balance sheet methods.Comprehensive and repeated household food.consumption surveys are needed to disclosesignificant changes both in the levels and qual-ity of food consumption in a country as awhole, or among the differe,nt sections of thepopulation. Only in a very few countries, suchas Japan, are surveys of this kind being regu-larly undertaken.
It would appear that the main trends infood consumption referred to above continuedin 1955. With full employinent accompaniedby rising illCOMO in most countries, demandfor foodstuffs was sustained. Larger food sup-plies were available from increased food pro-duction in 1955 compared with the previousyear. Various special measures taken to dis-pose of food from accumulated surpluses alsohelped to provide some foods to some needygroups who could not otherwise have obtainedthem. On the other hand, the larger food sup-plies were rarely reflected in declines in retailprices, while fiscal policies aimed at reducinginflationary pressure and countering balance ofpayments difficulties, also tended to restrict thepurch.asing power available for consumptionfrom higher money income. In these circum-stances, changes in the pattern of consumptionappear to have reflected changes in the retailprice relationships between different foods, withfew significant changes in national averagecalorie levels (Annex Table 11).
For example, larger rice production and lowerrice p1-ices were probably responsible generallyfor a somewhat higher per caput consumptionof rice, especially in the rice-importing coun-tries in the Far East, and thus facilitated areduction in rice stocks held by Asian exportersby the end of 1955. Some countries, previouslyrelying heavily on supplementary -wheat im-ports to meet the earlier rice shortage, tendedto replace wheat by rice to some extent. It
51
is difficult to judge how far this reversed move-ment will be carried in the future. Worldstocks of wheat and coarse grains remain verylarge, and ample supplies have been offeredon the world market, sometimes on terms par-ticularly favorable to importers. Moreover, inspite of lower rice prices, it must be borne iiimind that rice is still nearly twice as expensiverelative to wheat and other cereals on importmarkets as it was before the war. For thesereasons, the place of wh.eat in the diet in mostof the main rice-consuming countries still re-mains much more important than in the prewarperiod.
Per caput meat consumption in the UnitedStates in 1955 was the highest recorded duringthe last half century. In most countries ofNorthwestern Europe, consumption has alsocontinued to rise. From 1953 tu 1954, forexample, the increase was of the order of 3kilograms in Western Germany and 5 kilo-grams in th.e United Kingdom, but consump-tion as a rule still fell short of the prewar level.From 1954 to 1955 the increase continued inthese countries though at a slower rate. Inmost of the other important meat-consumingcountries consumption also increased. In Cana-da, for instance, meat consumption in 1954/55Ivas about 4 kilogra,ms higher than a
year,'earlier, while in Argentina, where a slight de-crease liad taken place since 1952, the prewarlevel was regained.
The consumption uf milk and dairy productshas continued tu increase at a slow pace inmost European countries, equaling and in manycases surpassing prewar levels. Consumption ufliquid milk, however, remains more or less sta-tionary, the greater part of the increased pro-duction being used for the manufacture uf dairyproducts. In the United States and Canadaper caput consumption of milk and dairy prod-ucts appears tu be stabilized at a level higherthan that of the prewar period. In most ofthe Far Eastern countries there is a slightupward trend in the average per caput con-sumption.
Consumption of butter in most Europeancountries has tended to increase, although thereare sume indications that the trend toward apartial substitution uf margarine still continues.In general it appears that the increase in con-sumption of other fats and oils exceeds thatof butter, especially in the West Europeancountries where consumption has risen by about1 kilogram per caput since 1953/54.
AGRICULTURAL POLICY AND DEVEL-OPMENT PLANNING IN 1955156
The continued accumulation of surplus stocksof some cominodities and their effects on worldtrade and prices have caused S01110 changes inagricultural policies during the year under re-view. The major new departure has been inthe United States, where it has been becomingmore and more apparent that surplus stockswill not be liquidated, under prevailing marketconditions, by domestic consumption or exportswhile production of surplus commodities con-tinues at its present level. Legislation has there-fore been introduced for the curtailment ofoutput beyond th.e restrictions already exist-ing, notably on cotton and wheat. In someother countries, mainly in Western Europe, thelower world prices for some commodities havecaused changes in farm price policies designedto adjust the pattern of' output to the presentsituation and to improve the competitivenessof those countries' agricultures.
Elsewhere, however, a continued rapid ex-pansion of agricultural production is still thechief need, and remains the primary aim ofnational policies. The growth of national plan-ning as a major factor in the postwar d.evelop-ment of agriculture was described in the 1955issue of this report, and the year 110AV underreview was a particularly significant one in thisfield. It saw the completion of several of themost important of' the postwar developmentplans and the preparation or beginning of IICAWplans to follow up the progress made in theearlier ones.
While the chief aim of many of the newdevelopment plans is rapid industrialization,further substantial increases in agricultural pro-duction are also planned. In India, for in-stance, the success of the first five-year planin raising agricultural production has enabledmore emphasis to be placed on basic industriesin the second plan. On the other hand, anumber of countries at a rather earlier stageof economic development, such as some Africanterritories, whose initial programs were concern-ed mainly with providing the foundations offuture progress, in the form of basic publicworks such as transport facilities, are IIOAV ableto pay more attention in their new plans toagriculture and other directly productive de-velopment.
52
Another noteworthy feature of the new agri-cultural development plans, especially in theFar East and Latin America, is the increasingrecognition of the importance of orienting themtoward the nutritional neecls of time people.Even in those countries -where agricultural planshave been operating for some years, the needsof the consumer .were often not adequatelytaken imito account.
The trend taward the centralized co-ordina-tion of planning in different sectors has con-tinued in 1955/56, and a number of new centralplanning bodies have been set up, or the exist-ing ones re-organized, for example, in Brazil,Japan, Malaya, Pakistan and Syria. There is,on the other hand, little IleAV progress to reporton time regional or international co-ordinationof planning. The EC011.01111C COMIlliSSI011 forAsia and the Far East (ECAFE) has recentlyset up a working party on economic develop-ment and planning ; in November 1955 it heldits first meeting, to which FAO contributed.
The main events in 1955/56 in the fields ofagricultural policy and development planningin the different regions are discussed below.
North America
The main part of time IICAW Agricultural Actof 1956 in time United States concerns theestablishment of the so-called "Soil Bank" bymeans of two programs : the Acreage Reserveand the Conservation Reserve.
Tlic Acreage Reserve Program is designed tomeet the immediate need to reduce productionof the four crops 110AA% most seriously in excesssu.pply, i.e., wheat, cotton, maize and rice, aswell as groundnuts and tobacco. During thenext three crop years, farmers are voluntarilyto reduce their acreage of these crops in returnfor compensation based on the potential yieldof the retired acreage, in the form of certificatesredeentable in cash or, for cereals only, in kind.nvrticipation in the programmi will not affect timefarmer's normal acreage allotment for futureyears, but he must agree not to graze or harve,stany crop from, time land put into reserve. It ishope,d that a good part of the cost of this pro-gram (about $750 million anntially) will befinanced by commodities already owned andpaid for by the government, which will be with-drawn from storage and turned over to farmersto use or sell, in payment for withdrawing theland frwn, cultivation.
The Conservation Reserve Program is morelong-term in nature. This program applies toall farm crops, and farmers are to contract,voluntarily with th.e government to shift theircultivated land most in need of conservationinto green manure crops, tices and water stor-age for from 3 to 10, o exceptionally, 15 years.This land i.s to be neither harvested 1101' grazed.In return the farmer is to receive from the govern-ment 'part of th.e cost of establishing the conserva-tion use, a,F.3 well as an annual subsidy to indem-nify him for lost income until the reconditionedland again yields a return. The cost to thegovernment of this program -was estimated tobe about $450 million annually.
It is hoped that stocks can be reduced tonormal levels in three or four years if, underthe Acreage Reserve 1?rogram, the acreage ofwheat is reduced by some 4.9 million hectares(one fifth of the area 1101V permitted), of cottonby 1.2 million hectares (one sixth), and of maizelyy 2 million hectares. In addition, by meansof the Conservation Reserve, i.t is hoped toretire an additional 10 million hectares fixmiproduction, thus securing on a longer-term basisa substantial reduction in the output of feedgrains and other crops.
The success of these two programs in reduc-ing stocks will, of course, depend on the extentto which farmers co-operate in them.. Anotherfactor, howeve,r, is the extent to which thereductions in acrea,ge niay be offset by risingyields, as were acreage allotments in the past.It is likely that the best land, not placed inreserve, may be cropped more intensively, sothat yields front the restricted acreage will rise.If there were smaller participation than i.s hop-ed for, together with increased yields, it wouldbe necessary to operate the _Acreage ReserveProgram for longer than is now intended. Theprovisions in the Act for reinforcing measuresof surplus disposal were discussed earlier in
this chapter.An important, question inay turn out to be
the level of United States agricultural outputwhen the present large, stocks have been brought,down to normal levels and the Acre,age ReserveProgram terminated. It appears that undercurrent production conditions, including exist-ing price supports and with average weather,the potential agricultural output in the UnitedStates is likely to remain well above the op-timum foreseeable demand, so that there isthe danger of new surpluses arising after thepresent ones have been worked down. 'Thus
53
it was recently estimated' that while totaldomestic and export demand for United Statesa,gricultural products might increase by 17 per-cent in the next ten. years, agricultural pro-duction could be expanded by about 50 percent.
In Canad,a, although stocks of wheat andcoarse grants remain large, no basic change inpolicy has been considered necessary. A majormeasure of assistance is, however, to be extend-ed to farmers for the storage of wheat, for-which facilities are limited and costs thereforehigh. The government will defray the cost ofstorage by the Wheat Board of stocks in excessof 178 million bushels at the end of the season.As end-of-season stocks of wheat are at presentestimated to be likely to amount to about 580million bushels, this subsidy w.ill probably costsome $32 million in 1056.
Oceania
There have been no major changes in agri-cultural policy in Oceania during the courseof 1955/56. In Australia th.e continued empha-sis on higher prod.uction and exports was un-derlined by raising time 1957/58 production tar-gets adopted in 1952, some of which h.ad al-ready been exceeded. The aim i.s now a 27percent increase over the pre-war level by 1957/1958. In the case of wheat, however, the Chair-man of the Australian Wheat Board has ad-vocated a policy of reduced production in viewof the large stocks that have accumulated.Another change in Australia is that a separate'Ministry of Trade has been set up. On the agri-cultural side, this Ministry will attempt to main-tain and extend export markets and will also beconcerned with questions of trade policy. In_Neu; Zealand the main change in 1955/56 wasthe introduction of a :floor price scheme formeat, following the termination of the long-termagreements with the United Kingdom.
Western Europe
With rising wages and other costs, farmersin a num.ber of European countries have re-cently been pressing for measures to increasefarm prices. Most governments, although in-clined to raise the level of farm income, havebeen unwilling to allow a rise in food prices
John D. Black and James T. Bonnen, A Bal-anced U.S. Agriculture, in 1965, National 'PlanningAssociation., Washington, D.C., April 1956.
which would set off further demands for higherwages, as in Finland, where a general strikefollowed the raising of guaranteed farm prices.Some governments have found the burden offarm subsidies becoming too great, and alsothat guaranteed prices tended to encouragefarmers to increase produ.ction of commodities\,.hich, with lower -world prices, could moreeconomically be imported.
Fixed o guaranteed prices for certain prod-ucts have been raised in soin,e cases, but ingeneral there has been an increasing trendtoward helping farmers to reduce costs by im-proving the farm structure or subsidizing meansof production, rather than raising the generallevel of agricultural prices. Some governmentshave made their price schemes more flexibleor have reduced their guaranteed prices forsome commodities in order to encourage a moreselective expansion of production.
In TY estern Germany a ileW law of September1955 obliges the government to report annuallyon the state of agriculture, and to take meas-ures to raise farm income to the same levelas that of persons in a 'comparable occupation.The first report, issued in February 1956, indi-cated that incomes in agriculture were lowerthan for any comparable population group. Inaddition, the loss of manpower to industry liadimposed the need for a high rate of investmentin labor-saving machines, so that short-termcredits had increasingly been used for long-term investments. Nearly 1,000 million marks($240 million) have therefore been earmarkedto improve the situation of agriculture in 1956/1957. Except for an increase in the price ofmilk, agreed earlier, the assistance to agricul-ture i.s not to take the form of increased prices.Consumption is to be encouraged by the abo-lition of the turnover tax in certain cases onproduce sold by farmers and expenditure re-duced by the conversion of short-term debts toreduce interest payments. The efficiency ofproduction and distribution is to be inereasedby subsidies for fertilizers and high qualityseeds, the consolidation of unprofitable dairies,help in the construction of silos, distributionof milk in schools, premiums for cutting outlow-yielding fruit trees, time co-operative use ofmachinery, the establishment of industry indistricts where the farm population i.s under-employed. Farms are to be consolidated, bet-ter working conditions are to be provided bythe installation of water supplies and improvedhou.sing, the labor force is to be increased by
54
the employment of immigrant seasonal workers,and more professional training and extensionservices are to be made available.
Both the -United Kingdom and Sweden, where:farmer's incomes are more or less assured havetaken steps to improve the competitive posi-tion of their agricultures. In Sweden a newsystem of price-fixing will become effective, on1 September 1956. Agricultural prices will bedetermined for three, years, during which timethey may fluctuate between an tippet' and lowerlimit around certain average prices, calculatedto give income parity to the apiculturalpopulation relative to other groups. :Domesticproduction is protected by fixed import duties,equal to the difference between the averageprices and world pm-ices at the beginning of thethre,e-year period, so that domestic prices willadapt themselves to international prices, buton a higher level, determined by the importduty, which., however, will generally not e,xceed25 percent of the international price. :Duringthe three-year period, adjustments may be madeto average prices and import duties if the cost-of-living index moves up Or clown by moretiman 5 percent or if the new price index ofagricultural products, based on prices at 1 Sep-tember 1956, moves by more than 6 percent.
In the LI nited K ingdom the ne,w guaranteedprice levels, supported by means of a deficiencypayments system and production grants, willgive some increase in farm, receipts to com-pensate for increased costs, although it has onceagain been assumed that greater efficiency willpartially offset :increased costs. The presentpolicy is to maintain a large arable area withemphasis on saving imports of feeding-stuffs,to increase beef and mu Utt011 production, tolimit the increase in milk production but pro-duce more from domestic feed resources, andto reduce the costs of pigs and eggs. Guaran-teed prices for pigs have been reduced, whilethe le:vel of price support has been raised forbarley and oats but lowered for wheat andrye. Even if the wheat area is reduced, :how-ever, production will not necessarily decrease,as the subsidies on nitrdgen and phosphaticfertilizers ha-ye, been raised. The small rise inthe guaranteed price of milk will not compen-sate for increased costs except on the moreefficient, farms, and it is hoped th.at less effi-
cient producers may switch to beef production,at a time when it is considered that no rea-sonably economic outlets exist for higher milkproduction..
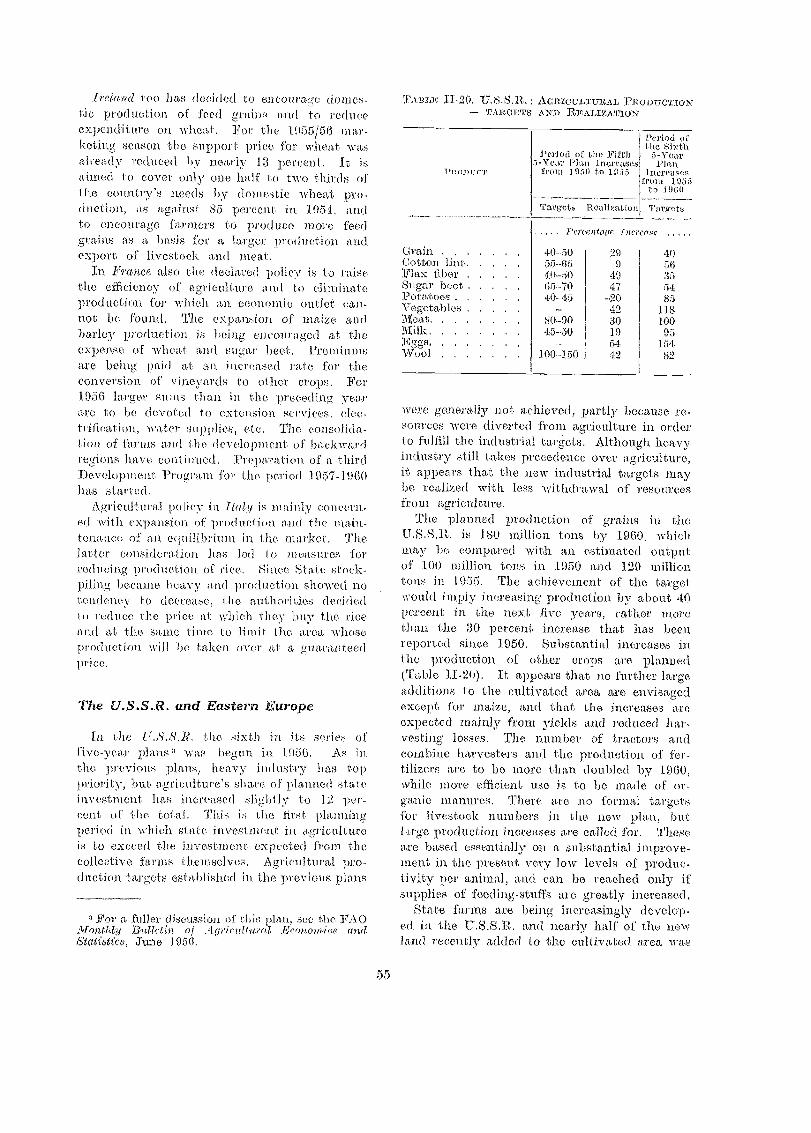
J13I((fl.l t 00 has decided to encourage domes-tic, production of feed grains and to reduceexpenditure on wheat. For the "h155/56 mar-keting SeaS011 the support priec f'or Avhcat wasalready reduced by nearly 13 percent. It isaimed to cover only one half to two thirds ofthe country's needs by domestic wheat pro-duction, as against 85 percent in 1054, andto encourage farmers to produce more feedgrains as a basis for a larger production andexport of livestock and mtn,tt.
In France, also the declared policy is to raisethe efficiency of agriculture and to eliminateproduction for Whieh an economic outlet can-not bc found. The expansion of maize andbarley p.roduCti011 is being encouraged at theexpense of wheat ;Anil sugar beet., premiumsare being paid at an increased rate for theconversi 021 Of vineyards to oilier crops. For1056 largor sums than in the preceding yearare to be devoted to extension services. elec-trification, water supplies, etc. The consolida.tion of farms an./1 tho devolopmcnt, of backwardregions have continued. Preparation of a thirdDevelopment Program for the period 1057-1960has started.
Agricultural policy in hall/ is mainly co ern-ed With eXpanSi011 Of prOdUei ion and t he Maim.femme.° of ait equilibrium in t;fie market. Thelatter consideration has Jed to measures forreducing production of rice. Since State stock-piling became heavy and production showed notendency to deo.ease the authorities decidedto reduce the price at Which they buy the, riceand at the same timo lo limit. the area whoseproduction will he taken over at a guaranteedprice.
The U.S.S.R. and Eastern Europe
In the U.S.S.R. the sixth in its series offive_yoar plans 3 was begun. in 1956. As inthe previous plans, heavy industry has toppriority, but agriculture's share of planned si atoinvestment has increased slightly to 12 per-cent of time total. This is the _first planningperiod in which si ato investment in agricultureis to exceed the investment expected from thecollective furias themselves. Agricultural pro,duction targets established in the previous plans
3For a runer discussion of this plan, soe tbo FAOitfonti4y Build in o f Agricultural E canal ajc8 andStatiatics, Ame 1956.
'YABLE 20. U.S.S.R.: A o nictiwruitAx. PRODUCTION-- TA R OETS AND REALIZATION'
rT
Period tittire Sixth
:1'0104 01 tho Fiftb 5-roor5 -Year Plait Incr(-ases Ilan
front Ithiti to 1535 inerogsesfrom 105)
to 1960
Target$ 111eolizotion irorm.16
wore geilerally not achieveci, partly beealiSe re-sources re diverted from agriculture in arderto fulfill the industrial targets. Although heavyindustry still talcos precedence over agriculture,it appears that the neNV industrial targets maybe reali'zecl with less withdrawal of resourc,esfrom agriculture.
r_rho planned production of grains in theU.S.S.R. is 180 million tons by 1900, whichmay be oompared with an estimated outputof 100 million tons in 1950 and 129 milliontons in 1955. The achievement of the targetwould imply increasing production by about 40percent in the next live years, rather morethan the 30 percent increase that has beenreported since 1050. Substantial increases inthe production of other crops are plaitnedCrable 11-2(r). It appears that no further largeadditions to the cultivated area are envi5agedexcept for maize, and that the increases areexpected mainly from yields and reduced har-vesting losses. The num.bet of tractors amicombine harvesters aryl the production of' for-tilizers are lo be more than doubled by 1960,while more efficient use is to be made of or.ganic manures, There are no formal targetsfor livestock numbers in tlie now plan, but1.trge production incienses are called for. Theseare based essentially on a substantial improve-ment in the present very low levels of produc-tivity per animal, and can be reached only ifsupplies of feeding-stuffs ar0 greatly increased.
State farms are being increasingly develop-ed in the, S.S.E. and nearly half of the newland recently added to the cultivated arca wa8
Pere('>tfiÎiC f nerca qc
Grain 10-50 29 40Cotton lint 55-65 9 59:Flax fibe,r 10-50 49 35Sugar beet 65.-70 47 54Potatoe 40-45 -.20 85-Vegetables _ 12 118Mo,at 80-90 30 100Milk 45-50 19 95Eggs - 54 154,Wool 100-150 42 82
opened up by state farms. The importance ofthe machinery and tractor stations has alsobeen increased, and although the collectivefarms are now allowed to plan part of theiroutput themselves, these plans are subject tothe approval of th.e machinery and tractorstation. to which each collective farm is attach-ed. Collective farmers have recently been en-coura,ged to produce More on their inetividualplots, but the policy now appears to be toreduce the size of these holdings and the timespent on them.. Conipulsory delivery quotashave been reduced and pri ces both for compul-sory deliveries and :for sales to the state havebeen raised, in order to provide incentives forincreased output and to reduce the attrac-tiven.ess of sales OR the free market.
The countries of E astern Europe , with theexception of Bulgaria, also began ne-w five-year plans in 1956. The increases planned in
crop and livestock production are not yet knownin detail, but as in the U.S.S.R. they are basedmainly on improved yields. ,In these countriesindividual holdings still occupy a large part ofthe cultivated area, and it appears that rapidcollectivization by means of .rural co-opera,tiveshas been resmned. The rate of agricultural in-vestment has recently increased, the numberof tractors rising by about 25 percent between1953 and 1955.
Far East
In the Far East several important IleWdevelopment plans Were begun in 1955/56.ndia' s first five-year plan was completed with
the harvesting of the 1955/56 crop, and asecond plan covering the period 1956/57-1960/61.has now gone into operation. Many of thetargets for agricultural production under thefi.rst plan were reached ahead of schedule, andwhen the final outcome of the 1955/56 harvestis known, it is likely that all will have beenexceeded, except possibly for jute aild sugarcane. A measure of the success of the planas a -whole is that the real national income.vas raised by 17 percent instead of the plan-ned 11 percent, and per caput real incomesincreased by some 10 percent.
The new plan aims to increase the real na-tional income by a further 25 percent and percaput real income by 18 percent. The totaloutlay in the public sector is scheduled to betwice as great as in the first plan. While a
56
primary aim of the first plan was to increaseagricultural production, its success has enabledthe emphasis to be shifted to basic industryin the new plan. Agriculture i.s to receive 12percent of the total investment, as comparedwith 16 percent earlier, but in absolute termsthe investment in agriculture is to be lunchlarger than before. NeW targets have beenestablished for most crops, including a 15 per-cent increase for food grains and 25 to 30 per-cent for cotton, sugar cane, oilseeds and jute.Emphasis is also to be placed On improvingthe quality of the diet, by increasing livestockand poultry production and by a,n increase of32 percent in fish. production. The number ofregulated farm markets is to be doubled. A
large increase) in fertilizer production is plan-ned, but lvith the rapid growth of consumption,imports will still be needed.
Since the publication of the new plan it hasbeen decided to raise the targets for food pro-duction because of the increased demand forfoodstuffs and difficultie,s in arranging for theimport of surplus foodstuffs from abroad. Therevised targets are likely to be established dur-ing the S11111.11101! of 1956.
New development plans have also been begunin a num.ber of other Far -.Eastern countries.C eylon' s second six-year plan, for 1954/55-1959/60, was announced in July 1955. It .is
in part a continuation of projects begun underthe first plan and the basic objectives for a,gri-culture are unchanged. In Pakistan, where aNational Economic Council at ministerial level,with the Prime Minister as Chairman, was set,up in early 1956, a draft of a neW five-yearplan has just been presented. Expenditure isto be approximately $870 million in the publicand private sectors, and it is hoped to increa,senational income by 20 percent by 1960. Aboutone third of the, expenditure in the public sectoris to be devoted to various agricultural pro-grams. Inapan a BOW economic plan for1955-60 was submitted in February 1956, -witha target of ami annual increa,se in agricultural,forestry and fisheries production of 3.2 percent.Indonesios draft five-year plan for agriculturewas announced in May 1955 and is understoodto be in the process of final revision. In Burmaand Viet-Euro IleW draft plans for agricultureare reported to aini at increasing and diversify-ing agricultural production and improving paddyyields.
The first five-year plan of mainland Chinawas adopted in July 1955. The plan covers
the years 1953-57, the delay in its completionbeing officially attributed to the lack of dataand ine,xperience in. long-range planning. Themain aim is rapid industrialization, and only8 percent of the planned expenditure goes toagriculture. While agricultural producti011 ¡S tobe increased by 23 percent, the target forindustry is 98 percent and for handicrafts 61
percent. Production of foil grains is to beincreased by 18 percent, cotton 25 percent,sugar cane nearly doubled and sugar beet MOTTthan quadrupled. An increase of only 7 per-cent is planned in the SOW11 area, and most ofthe production inerease is to be achieved byimproved yields, though the supply of chemical:fertilizers is likely to prove :inadequate for therealization of some of th.e targets, in spite ofthe planned trebling of fertilizer production.As a first step toward mechanization, thenumber of tractor stations and mechanizedstate farms on the U.S.S.R. model is to beincreased. The extension of co-operati ves andcollectivization has recently been speeded: up.
The remaining two years of this agriculturalprogram are 11.0W to be embodied in a twelve-year plan for agriculture, as part of a .fifteen-year plan for the Chinese economy as a whole.The draft of the new twelve-year plan callsfor the doubling of grain yields, even greaterincreases iii cotton yields, and increases in areaof 20 million hect ares for rice, :1.0 million hec-tares :for maize and 7 million hectares For po-tatoes. "Emergency stocks of grains are to beset up, the quality of co-operati ves improvedand the number of state holdings COnsiderablyincreased.
Latin America
There have been extensive ohanges in_ agri-cultural and allied policies in Latin Americaduring the course of the year. Argentina isin the process of transit ion from, a controlledto a freer economy and a set of measures hasbeen adopted, including curre.ncy devaluation,.intended to achieve a better balance betweenagricultural and industrial expansion and en-courage agricultural exports. Some other Latin-American countries also modified their foreignexchange rate systems during 1955/56, whichwill increase incentives :for agricultural exports.
In Argentina one of the major objectives ofthe devaluation was to give a new incentivelo crop prodUction, which had buen depressed
57
-under the former regime, and to ease the mar-keting of the major agricultural export products.With the IleW exchange rate it became possibleto raiSe producer prices for crops to more at-tractive levels and to compete in foreign mar-kets without loss to the government. To avoidinflationary pressure and to make sure that theincreased profits go into necessary investment,a special lower exchange rate applies tempo-rarily to crop exports and profits derived fromthis device are being deposited in a NationalEconomic Recovery Fund, tu be used partly foragricultural developme.nt and partly for sub-sidies to alleviate the effect on th.e cost oflivirtg of the higher agricultural prices. 'Pro-ducer prices for grains and oilseeds have beenraised by from 20 to 117 percent, the largestincentives being given to oilseeds, which werein such short supply it) 1955 that imports werenecessary. Cattle and ltog prices Were raisedby 14 to 18 percent. Further price increases,mainly for livestock products, WerC announcedal the end of May.
Argentina's foreign tra,de in agricultural prod-ucts, which was largely controlled by stateenterprises, is to be rettfrned to private hands.Of the .major state enterprises, the ltA.PI (Ar-gentine Trade Promotion Institute) is in liqui-dation, while th.e INGE (National Grain Insti-tute) and INC (National Meat Institute) nowset official export prices, and receipts up tothis level must be surrendered at the officialexchange rate. Earnings in excess of theseprices can be exchanged in the free market,.
The second five-year program, of Argentinahas been rendered obsolete, by these policychanges. Work is therefore being started ona new development plan, and technical assist-ance has been requested -from internationalorgani zations.
In most other Latin-American. countries thedevelopment plans still have sume years to run,but in a few instances 110W plans are beingprepared. A report surveying possibilities forthe agricultural development of Colombia, pie-pared by the International Bank Mission, wassubtuitted ti) the government in April 1956,
and an FAO mission is .now assisting in theformulation of a comprelteitsive agricultural pro-gram. In Paraguay a new agricultural programhas been prepared and awaits o:fficial approval.The, :110W Development Council in Brazil is pre-paring two plans, one -for the development of:food production, transport and power over fouror -five years, and the other fOr the immediate
provision of rural credit and the constructionof silos and warehouses. Programs for the de-velopment of specific areas, such as the SanFrancisco River Valley and the Amazon Basinare being considered.
In Mexico an interesting feature, because of.its novelty in Latin America, was the establish-ment of a government-sponsored crop insurancescheme for fire, pest and climatic risks, cover-ing up to a maximum of 5 million hectares,principally under cotton, wheat and maize. Itis hoped that this measure will encourage pri-vate investment in Mexican agriculture and awider adoption of modern methods of farming.
Near East
In th.e Near East too, most of the formerdevelopment plans are still in operation, buta few 11C1V plans have been begun during theperiod under review. In Iran, with the re-sumption of oil activities, the partially imple-mented investment program for 1949-55 hasbeen replaced by a second seven-year plan,which, in addition to the completion of projectsalready begun, includes new litigation and otherschemes. The plan is to cost $840 million, butit is possible that it may be modified, on theadvice of the International Bank, in order toallow the peak level of investment to cometoward the end of the planning period, whenoil revenues are expected to be at their highest.Iraq's second five-year development plan wasbegun in 1955. It wa's modified in April 1956and planned expenditure will now be I.D.488million ($1,370 million), or ID. 184 million morethan originally announced, because of increasesexpected in oil revenue. The plan includ.esmajor projects of irrigation, drainage and landsettlement. Syria has launched a five-year in-vestment program, under which 28 percent ofthe total expenditure is allocated to irrigationand power and another 29 percent to transportand communications. Afghanistan has conclud-ed a financial and technical assistance agree-ment with the U.S.S.R. for development in th.efields of agriculture, pOWer, irrigation, etc.
The potentially most important agriculturaldevelopment in the Near East is, ilOWOVet',
outside the framework of a specific develop-ment plan. The High. .Aswan Dam, the totalcost of -which is estimated at $1,300 million,
58
would, if implemented, increase Egypt's culti-vable area by as much_ as one third.
Government intervention in the marketing ofEgyptian cotton is being gradually reduced.The Alexandria Cotton Exchange was re-openedin September 1955 and trading in cottonfutures resumed. Cotton growers are again freeto dispose of their crop to private exporters,and the functions of the Egyptian Cotton Com-mission are now limited to price support opera-tions. Export duties on cotton have been great-ly reduced.
Africa
In some parts of Africa, including the Unionof South Africa, where the producer price formaize has again been loNvered, efforts are beingrnade to persuade maize growers to divert someof their land to other crops. Another effectof the lower world prices for certain productsis that in some British Colonial Territories guar-anteed producer prices for some export cropshave been reduced, in order to prevent furtherwithdrawals from the reserves of the StatutoryMarketing Boards. In some 'French OverseasTerritories, Caisses de, stabilisation des prix havebeen established for certain export products.
In the Union of South Africa the long-a-waitedTomlinson Report on the Development ofthe Native Reserves was published in 1956.The Commission recommended the expenditureof £104 million over ten years on the develop-ment of agriculture and industry in the reserv-es, in order to make them capable of support-ing a much denser population. The govern-ment has not been able to accept all of theCommission's major recommendations, but itwas announced recently that through the NativoTrust Fund money will be made available toaccelerate afforestation, soil conservation andirrigation.
Following time announcement in early 1955of a further grant from Colonial Developmentand Welfare Funds for the period 1955-60,some British Colonial 'Territories have begunnew development plans for this period or haverevised their previous ones. A characteristic ofsome of the new plans is that they emphasizeagricultural and industrial development, where-as the earlier ones generally concentrated onthe development of the infrastructure, and inparticular, transport.
GENERAL APPRAISAL AND OUTLOOK
The world food and agricultural situation wasbasically unchanged during 1955/56. The, ex-pansion of production continued and once againthe increase was rather unevenly distrilmted.Although, for some commodities, the surplussituation eased a little in 1955/56, the largeststocks, those of grains and cotton, increasedfurther. The volume of world tracio in agrieul-tural products rose fairly sharply in 1955 for thefirst time for some years, but there .vas still nosign of a continuing upward trend and pricedeclines made the ncrease in the value of agri-cultura] trade relatively small. 1?rices have,in fact, generally continued to move againstthe farmer, and his position in relation to therest of the population has been further .weak-ened. Lower prices have, however, still beenbut little reflected at the retail level, and therehave been only modest improvements in_ con-sumption.
It appears that supplies will again be largerin 1956/57 and that the present lull in econom-ic expansion will continue, with demand main-tained but not increasing appreciably. Thereis little likelihood, therefore, of any significantreductions in sur.plus stocks during 1.056/57,while the price trends noted toward the beginningof 1956 will probably continue. In some casesthese trends may be accentuated by more -vig-orous surplus disposal measures.
Thus the main problems facing the -world'sagriculture, remain broadly the same. Thebasic dilemma of most governments is how toreconcile th.eir dual responsibilities to main:fainthe economic position of farmers and at thesame time to provide consuMers with adequatefood supplies at low prices. The deterioratingeconomic position of the farm population con-tinues to cause anxiety. In spite of a steadydecline in the number of people engaged inagriculture, per caput incomes in farming arewell below those in other occupations in nearlyall countries, and in most continue to fall or atbest to stagnate in the face of a steady risein real incomes in the economy as a .whole.In the year under review an increasing tend-ency iras noted to support :farm incomes bymeans of reductions in the prices of farm re-quisites, sometimes through direct subsidies,thus encouraging greater productivity by theuse of fertilizers, etc., -while avoiding further.rises in retail prices.
59
While per caput food supplies now appear tohave re,gained the prewar level in all regions,futther considerable improvements, especiallyin the quality of the diet, are still needed in theless developed parts of the world. Apart fromthe human need to improve diets, increasedconsumption is also the most effective andbeneficial method, side by side with a realisticand selective approach to the expansion of pro-duction, of overcoming the present problemof surpluses and avoiding their recurrence inthe -future. In spite, however, of the addedurgency caused .by surplus stocks, only a be-ginning has so far been made toward .reducingproduction and marketing costs in order lo bringmore and better food within the reach of thepoorer consumer. At the same time, while itis generally accepted that surplu.s stocks shouldwhere possible be used to promote economicdevelopment and raise standards of living, anda number of schemes have been proposed forthis purpose, very little has yet been done inthis direction, except for a few cases of faminerelief and assistance to needy groups.
SOMC progress has already been made, how-ever, in adjusting the production pattern moreclosely to demand, For example, the expan-sion of livestock production, for which demandis strong, is outstripping crop production in mostof the, more developed countries. Again, inIndia ami some other underdeveloped countries,more attention is being paid to the nutritionalneeds of the .population in. the new agriculturald evel opulent programs.
Looking further ahead, -much will depend onthe SlIOCCSS of the 11CW -United States me,asuresto reduce stocks by means of a curtailment ofproduction. The Soil Bank proposals shouldbegin to take full effect with the 1957/58 crop.It is as yet too early to judge whether the largeacreage reductions hoped .for will be achievedand how far lower acreages will, as in th.e past,be offset by high.er yields It may be neces-sary to operate .the Acreage Reserve Programfor longer than is at present intended. Themeasure of its success will be how far it enablestime liquidation of the surplus stocks to be carriedout without recourse to disposal measures thatwould be damaging to world markets.
The relative stability of the food and agri-cultural situation experienced in 1955/56 andexpected to continue in the coming season al-lows a further breathing space for these and.other measures to adjust world agri cultural pro-duction and bring it more in line with changing
demand. It also allows a breathing spaceless widely appreciated and hardly utilized so far
to attack the problem of underconsumption.In both these ways the emergence of wastefulsurplus situations in the future ni ay be prevent-ed. Perhaps the most encouraging feature of
60
1 955/56 is the evidence it pro vides, in the shapeof the many important 110W development plansbegun during the year, that agricultural expan-sion in the underfed parts of the .workl is notbeing held back because of fears of the conse-quences of unsold stocks elsewhere.
ChapLer III - SOME FACTORS INFLUENCING THE GROWTH
OF I\ TERNATIONAL TRADE IN AGRICULTURAL PRODUCTS
Since the end of World War II the purchas-ing powcT on international markets of agricul-tural products as a Ivhole for manufacturedgoods has averaged some 50 percent more thanin 1934-38. Correspondingly, the purchasingpower of manufactured goods as a whole foragricultural products has fallen by about onethird. These changes in price relationships,.usually referred to as the "terms of trade,"have greatly influenced postwar economic de-velopments. On the one hand they have addedto the balance-of-payments difficulties of theagricultural importing countries of Western Eu-rope. On the other, they have eased the prob-lems of some primary exporters in paying forimports of inanufactured goods, .including capitalgoods., at a time when these were badly neededfòr economic development.
The changes in relative prices have been somarked that it is of interest to enquire whetherthey are likely to continue, and what theirinfluence has been on the development of in-ternational trade. Whether, for example, theincreased purchasing power of agricultural prod-ucts was primarily a result of the postwarshortages, though since somewhat artificiallyprolonged by agriculturad price supports orgovernment measures to control internationaltrade ; whether there have been any long-termtrends in the terms of trade for agriculturalproducts ; or whether the changes in relativeprices are connected with the slow postwargrowth of agricultural trade compared with, therapid expansion of world trade in manufactur-ed goods.
Such questions, which concern agriculturalproducts as a whole, are discussed in the firsttwo sections of this chapter. Later sections
(leal with the development of the volume andvalue of international trade in individual agri-cultural products. These sections may haveFireater possibilities of practical application.An attempt is made to establish some of theunderlying reasons why trade in some agricul-tural products has stagnated or declined, whiletrade in other commodities has sh.own a rapidgrowth ; and to see whether any useful indi-cations may be obtained of the likely futurecourse of demand for the main agriculturalproducts on international markets.
These questions are of significance to allcountries enga,ged in international trade. In-dustrialized countries are concerned by therelatively high cost of agricultural products interms of manufactured goods since th.e end ofthe war, which necess.itates constant efforts toexpand their export markets. Underdevelopedcountries, though anxious to increase theirdomestic food supplies, must nevertheless main-tain or expand certain food and agriculturalexports to earn essential foreign exchange foreconomic development.
The present study (loes not attempt to putforward solutions to these probleins. It is nomore than a preliminary sketch, a first broadanalysis on a world scale of the main develop-ments during the first half of the century. Itprovides, however, a foundation on .which itis hoped to build further. More detailed an-alyses and, where necessary, revisions of thebasic statistics will be undertaken in the yearsahead. Thus the situation in each región, orin each of the main exporting and importingcountries, or for each main commodity, mightall form the subject of' further analySes. Thework is presented in summary form, without
all the basic statistics which have been drawnon,' and raises a number of questions amicontroversial issues in the, hope of evokingcomments from other workers engaged in thisfield.
A few brief comments may be ad.ded on themethods of analysis. In the first place th.eglobal approach, at least for agricultural prod-ucts, is perhaps less broaxl and imprecise thanit may appear at first sight. Main reliancehas been placed on import data, and for mostagricultural products by far the greater partof world trade is covered by imports intoperh.aps a dozen highly industrialized. countries.Careful comparisons have been made, 110 WOVOTwith comparable export statistics, and the con-clusions -which emerge from each set of data,are found to be in close agreement.
For some agricultural commodities interna-tional trade has been greatly affected by bound-ary changes. The separation of Eastern Ger-many, for example, has greatly increased theimport requirement of Western Germany forcereals. The statistics of international tradein jute have been greatly affected by the par-tition of India and Pakistan, and in th.is in-stance trade between the two countries has beenexcluded from the estimates for the sake ofcomparability. FOr the same reason shipmentsof rice prior to 1939 from former ;Japanese ter-ritories to Japan have been treated as pattof international trade in this commodity.Though important for individual products, how-ever, for international trade in agriculturalproducts as a whole, the boundary changes ofthe last decades seem to have had less influencethan might have been expected.
Although the analysis has been made through-out in economic terms, there, is no implica-tion that international trade in agriculturalproducts is subject only to economic influencesand is unaffected by social or political factors.For example, one of the main influences onthe development of trade, the trend towardgreater agricultural self-sufficiency, is to a largeextent the outcome of such factors, thoughinfluenced also by economic necessities such asdifficulties of external payments. Again, therecent shift in international trade toward man-
'The detailed statistical data are too voluminousfor publication in the present report. Th.ey are,however, being assembled in mimeographed form,together with a description of the statistical meth-ods employed, and may be obtained on appli-cation to FAO, Rome.
62
.ufactures and away from agricultural produ.ctsseems, as is suggested below, to stem in partfrom changes in social values. If economicfactors are mainly stressed in the sections whichfollow it is largely because other influences arenot yet susceptible to quantitative measure-ment.
CHANGES IN THE TERMS OF TRADEFOR AGRICULTURAL PRODUCTSAS A WHOLE
A useful starting point, is to consider brieflythe broad movement of prices in internationalmarkets during the past few (tocados. Two ma-jor wars and t-wo major recessions have madethis a period of unusually wide fluctuations and,not unexpectedly, agricultural prices showedgreater variations than prices of manufactur-ed goods. Developments since 1913 are showngraphically in Figure III - 1 which charts annualindices of average unit values2 of all productsmoving in world tratle, together with compar-able indices for two sub-grou.ps : agriculturalproducts as a whole and manufactured goodsas a whole.3
Since World War II the three price indiceshave kept :fairly well in step, the only majordivergence bein.g the short-lived gain in agri-cultural prices during the Korean boom. In1913 the three indices (base period 1952-53)also lie close together. Throughout the inter-war period, however, average prices of agricul-tural products are seen to have been muchlower in relation to prices in general, and stillmore so in relation to prices of manufacturedgoods, than they were either in 1913 or inany year from 1947 onwards. The discrepancywas most marked during the two recessions of
2" Uni.t values " are the weighted average valueper ton (or other unit) of the total supply of a prod.-uct or group of products exported (or importedas the case may be) during the period indicated.In some respects they are therefore more represent-ative than prices, which reflect only the marketvalue of a certain grade or quality (not necessarilythe grade in largest su.pply) at a given point of time.
'The indices :in Figure III-1 for all productsmoving in world trade and also for manufacturedgoods are based on those published by the UnitedNations and the earlier indices of the League ofNations. The indices for agricultural products arethose of FAO, a,nd are the same series as thoseshown on a quarterly basis for the postwar periodin Figure II-2. The indices do not include for-est and fisheries products although data are in-cluded below on some individual forest and 'fisheriesprod:ucts.
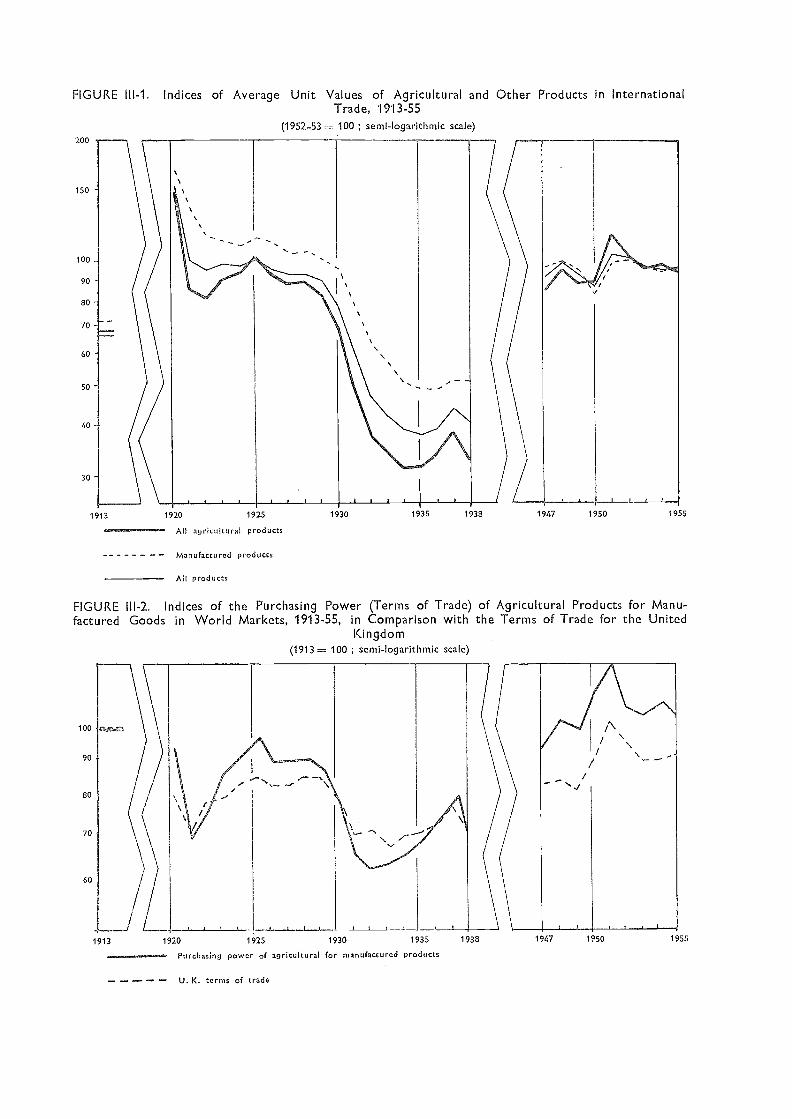
FIGURE III-1. Indices of Average Unit Values of Agricultural and Other Products in InternationalTrade, 1913-55
(1952-53= 100 ; semi-logarithmic scale)
100
90
80
70
60
All agricultural products
Manufactured products
All products
FIGURE III-2. Indices of the Purchasing Power (Terms of Trade) of Agricultural Products for Manu-factured Goods in World Markets, 1913-55, in Comparison with the Terms of Trade for the United
Kingdom(1913= 100 ; semi-logarithmic scale)
t
1913 1920 1925 1930
Purchasing power of agricultural for manufactured products
^^. a° U. K. terms of trade
1935 1938 1947 1950 1955
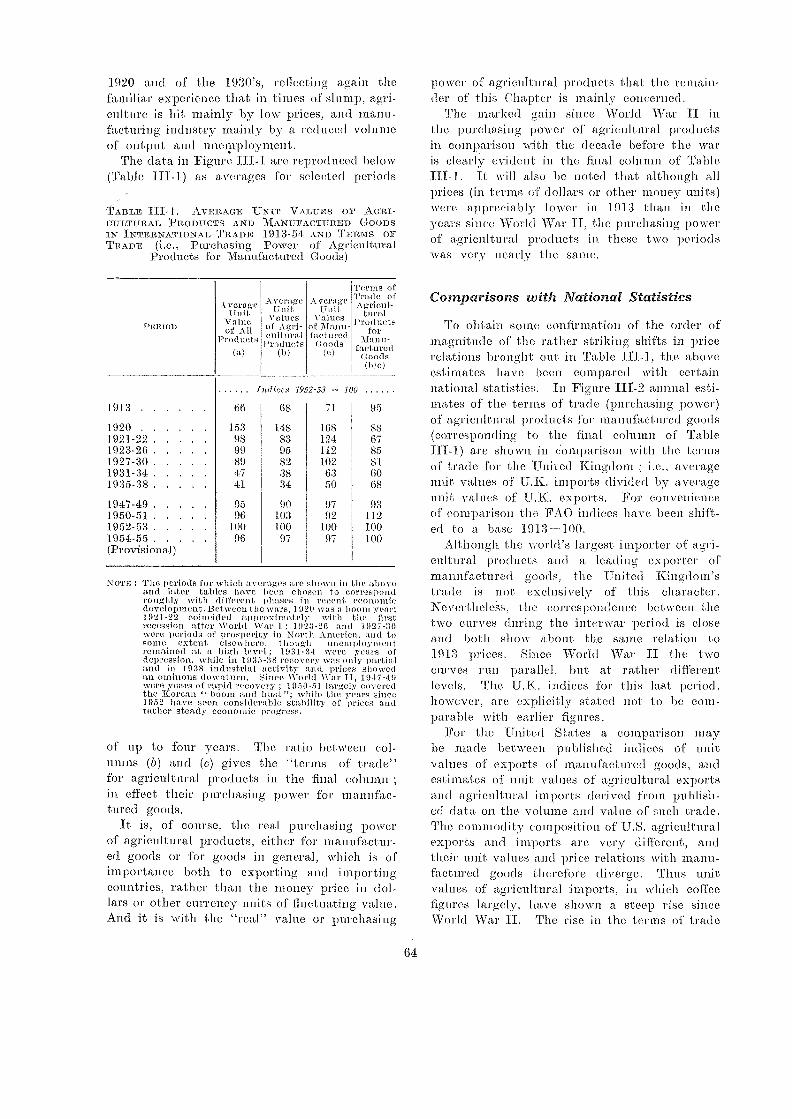
1920 and of the 1930's, reflecting again thefamiliar experience that in times of slump, agri-culture is hit mainly by low prices, and manu-facturing industry mainly by a reduced volumeof output and unemployment.
The data in Figure III-1 are refuodueed below(Table 1II-1) as avera,ges for selected periods
TABLE III- 1. AVERAGE UNIT VALUES OF AGRI-CULTURAL PRODUCTS ANO MANUFACTURED GOODSIN INTERNATIONAL TRADE 1913-54 AND 'Dorms OFTRADE (i.e., Purchasing :Power of A.gri cultural
Products for Manufactured Goods. )
Kurt,. : The periods for which averages are in the aboveand later Labios have been rilinsen t o correspondroughly wit h clilïiiis t yam,: ti ii iii (.,-Romiedevelopment. Bet ween1 T i wti is i i It t t i lioiei year;1921-22 coincided appreN ileat cly wit h firstrecession after Werld \Val. I ; 19.23-26 i917-30were periods of pre,-,peril 3 in 'X ert h .\Solffit extent 015,101.de. th.11!.;'h 1111Plilphlyin,mtreaTaineil at a high h`Vld ; 19d I -3I were ye:1r,-; erdepression, while T11 1935-38 reeevery \vie; onlyand in 1938 indir-ittial r and price,: ,-*i.Nveilall ominous iluwtit i Slime NV;Ir II I !I 17- I!)Were Vears of GI ii recovery ; 1950-51 11 eevereilthe Korean " boo in :Ind bust "; while il a year;1952 ha ve Seell cOlisiderable stabilitT of prices andrather steady economic progyess.
of up to four years. Th.e ratio bet \Veen col-umns (b) and (e) gives the "terms of trade"for agricultural products in the final columnin effect th.eir purchasing power for manufac-tured goods.
It is, of course, the real purchasing powerof agricultural products, either for 1nanufactur-ed goods or :for goods in general, which .is ofimportance both to exporting and .importingcountries, rather than the money twice in dol-lars or other currency units of fluctuating value.And it is with the "real" value or purchasing
64
power of agricultural products that the remain-der of this Chapter is mainly concerned.
The marked gain since World War II in
the purchasing po.wer of agricultural productsin comparison with the decade before the waris clearlY evident in the final column of TableITI-1. It will also be noted that although allprices (in terms of (bollars 011 other money units)were appreciably lower in 191:3 than in theyears sin cc World War II, the purchasing powerof agricultural products in these two periodswas very nearly the same.
Comparisons with National Statistics
To obtain some confirmation of the order of'Magnitude of the rather striking, shifts in pricerelations brought out in Table III-1, the aboveestimates have been compared with certaillnational statistics. In Figure ITI-2 annual esti-mates of the terms of trade (purchasing power)of agricultural pro(lucts for manufactured goods(correspondin)! to the final column of ',TableIII-1) are sho WU ill Comparison. with the termsof trade for the 'United Kingdom ; i.e., averageunit values of U.K. imports divided by averageunit values of 'U.K. exports. For convenienceof comparison the FAO indices have been shift-ed to a base 1913--100.
Although the world's largest importer of agri-cultural products atol a leading exporter ofmanufactured goods, the United Kingdom'strade is not exclusively of this character.Nevertheless, the correspondence between thet, WO Curves durin.g the interwar period is closeand both show u) out the same relation to1913 prices. Sin ce World War II the twocurves run parallel, lmt at rather differentlevels. The U.K. indices for this last period,however, are explicitly stated not to be com-parable with earlier figures.
For the 'United S t ates a comparison maybe made between published indices of unitvalues of exports of manufacturen goods, andestimates of unit values of agricultural exportsand agricultural imports derived from publish-ed data out t,I1C VOIUTIlle and value of such trade.The commodity composition of U.S. agriculturalexports and imports are very different, andtheir unit values und price relations with inanu-factured 0:oods therefore diverge. Thus unitvalues of agricultural imports, iut which_ coffeefigures largely, have shown a steep rise sinceWorld War il. 'The rise in the terms of trade
Indices 1952-53 100
1913 60 68 71. 95
1920 153 148 168 881921-22 98 83 124 671923-26 . 99 95 112 851..927-30 89 82 102 81
1931-34 47 38 63 601935-38 41 34 50 68
1947-49 95 90 97 931950-51 96 103 92 1121952-53 100 100 100 1001954-55 96 97 97 100(Provisional)
A VeritUnit
Yerage['Hit
veiaptit
`revel", (If
.\griitd-
r>E1000 Valueof All
Products\
euh tira IPI'od
moni-riiethl'ed(:ootts
Prod
1 1111-;1
hill 111,d(a) (b) (0) himk
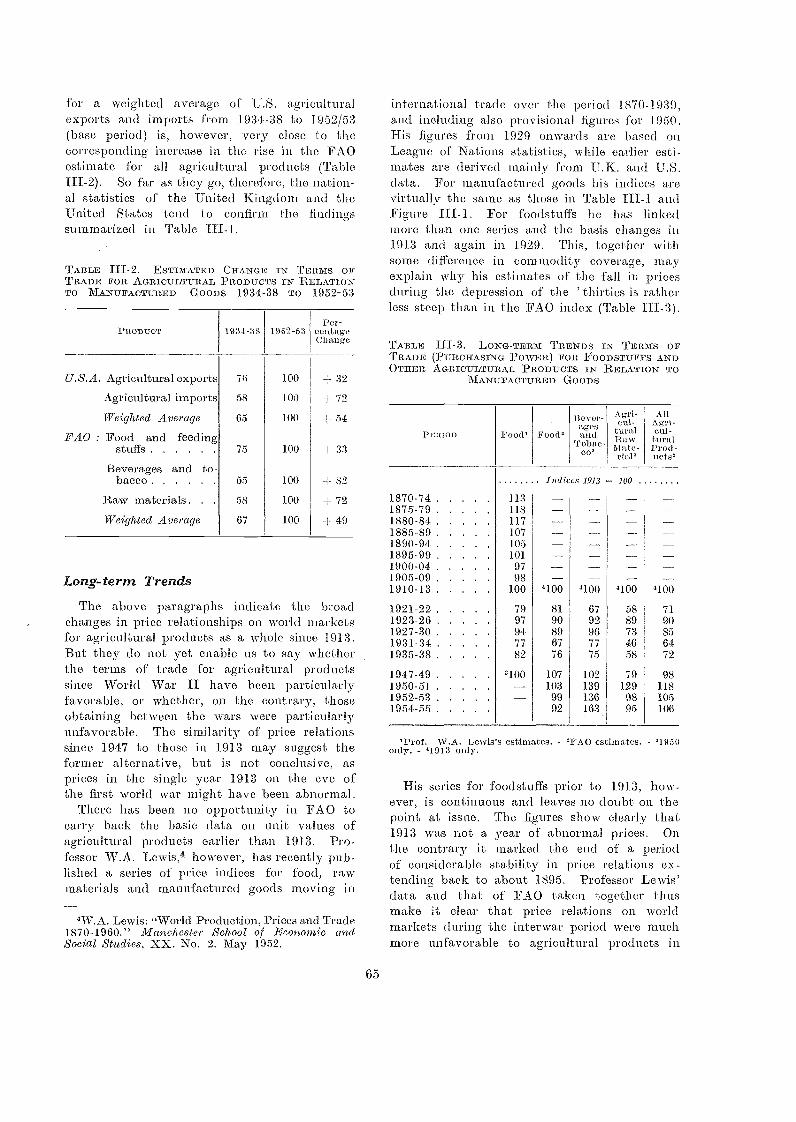
fui a weighted average of *U.S. agriculturalexports and imports from 1934-38 to 1952/53(base period) is, however, very close to thecorresponding increa,se in the 1.ise, in the FAOestimate for all agricultural products (TableIII-2). So far as they go, therefore, the nation-al statistics of the United Kingdom and theUnited States tend to confirm the findingssummarized in Ta,ble
TABLE III-2. ESTIMATED CHANGE IN TERMS OFTRADE FOR AGRICULTURAL PRODUCTS RELATIONTO MANUFACTURED GOODS 1934-38 TO 1952-53
Long-term TrendsThe above paragraphs indicate the broad
changes in price relationships on world marketsfor agricultural products as a whole since 1913.But they do not yet, enable us to say whetherthe terms of trade for agricultural productssince World War II have been particularlyfavorable, or whether, on the contrary, thoseobtaining between the wars were particularlyunfavorable. The similarity of price relationssince 1947 to those in 1913 may suggest theformer alternative, but is not conclusive, asprices in the single year 1913 on the eve ofthe first world war might h.ave been abnormal.
There has been no opportunity in FAO tocarry back the basic data on unit values ofagricultural products earlier than 1913. Pro-fessor W.A. Lewis,4 however, has recently pub-lished a series of price indices for food, rawmaterials and manufactured goods moving in
W.A. Lewis: "World Production, Prices and Trade1870-1960." Manchester School of Economic andSocial Studies, XX. No. 2. May 1952.
65
international trade over time 'period 1870-1030,and inchuling also provisional figures for 1950.His figures from 1920 onwards are based onLeague of Nations statistics, while earlier esti-mates are derived mainly from ILK. and U.S.data. For manufactured goods his indices arevirtually the same as those in Table a,ndFigure FOT fOOdSIUffS he has linkedin.ore than one series and the basis changes in1913 and again in 1929. This, togethe,r withsome difference in commodity coverage, mayexplain why his estimates of the fall in pricesduring the depression of the ' thirties is ratherless steep than in the FAO index (Table III-3).
TABLE III-3. LONG-TERM '117nENDs IN TERMS OFTRADE (PURCHASING POW:ER) FOR FOoDSTHEFS ANDOTHER AGRICULTURAL PRODUCTS IN RELATION TO
MANTJFACTURED GOODS
'Prof. W.A. Lewis s estimates. - 'FAO estimates. - 31950only. - 41913 only.
His series for 'foodstuffs prior to 1913, h.ow-ever, is continuous and leaves no doubt on thepoint at issue. The figures show clearly that1913 was not a year of abnormal prices. Onthe contrary it marked the end of a periodof considerable stability in price relations ex-tending back to about 1895. Professor Lewis'data and that of FAO taken together thusmake it clear that price relations on worldmarkets during the interwar period were muchmore unfavorable to agricultural products in
Indices 1913 100
1870-74 1131875-79 1181880-84 1171885-89 1071890-94 1051895-99 1011900-04 971905-09 981910-13 100 '100 4100 4100 4100
1921-22 79 81 67 58 711923-26 97 90 92 89 901927-30 94 89 96 73 851931-34 77 67 77 46 641935-38 82 76 75 58 72
1947-49 3100 107 102 79 981950-51 103 139 129 1181952-5 99 136 OS 1051954-55 92 163 95 106
PR0DUCT 1931-38 1952-53Per-
eentageChange
U.S.A. Agricultural exports 76 100 + 32
Agricultural imports 58 100 + 72
Weighted Average 65 100 +54FAO : Food and feeding
stuffs 75 100 + 33
Beverages and to-bacco 55 100 + 82
Raw materials. . . 58 100 + 72
'Weighted Average 67 100 +49
PERIOD Food' Food°Bever-agesand
Tobac-co°
gri-cul-tnralRawMate-rial'
All
cul-turalProd-neln°
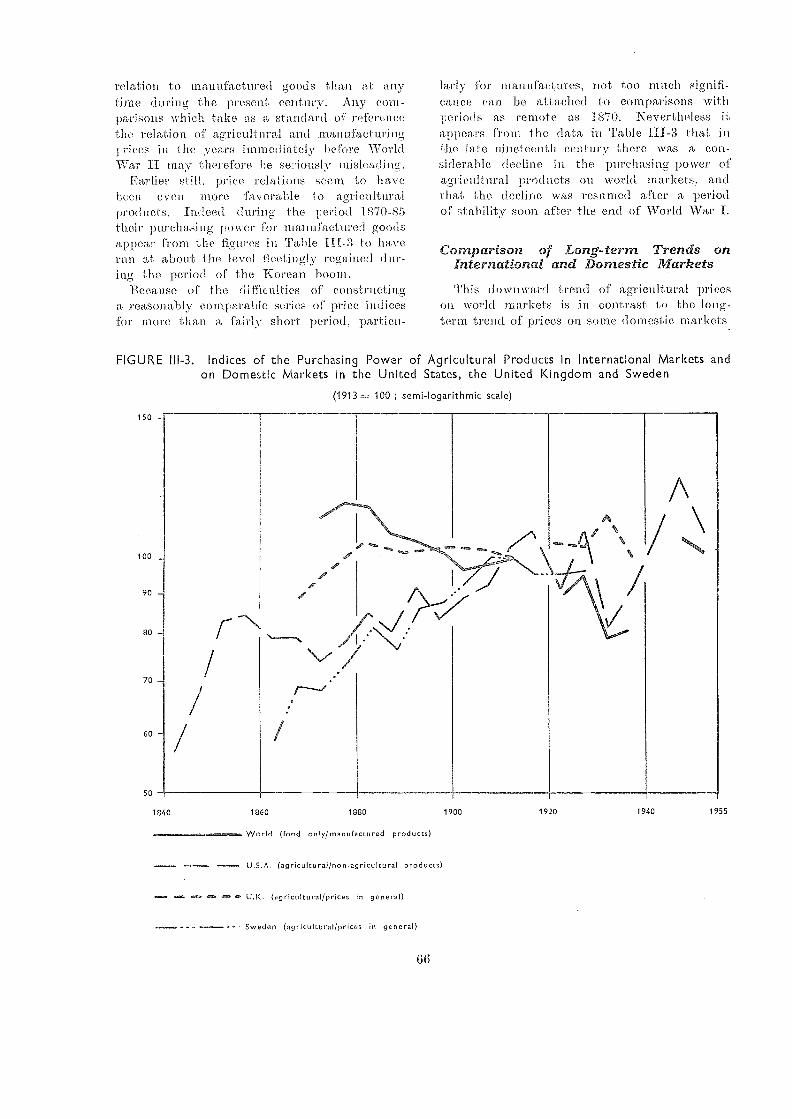
relation to manuf:actured gooes than al anytime during the present centur . Any com-parisons wldell take as a standard of referencethe relation of agricultura! and manufacturing.1 vi ces in the years :immediatel efore WorldIVar II may therefore he se7:iouslv misleading.
Earlier sfill. price relations seem to havebeen even :more favorahle 10 agri(nlIturalproducts. Indeed during the period 1870-85their purchasing power for manufactured goodsappear from the figures in Table tf.f.-3 to haverun at about the level fleetingly re,gained dur-ing the period of the Korean boom.
flecause of the difficulties of constr ictinga reasonably comparahle series of price indicesfor more than a fairly short period, partiou-
lar] *or iìiannfaet ni es, not too much signifi-cance can be attached to comparisons vithperiods as remote as 1870. Nevertheless itappears from the data itt 'Pal& III-3 that inthe late nineleenth century there was a con-siderable decline itt the purehasing power ufagricultural products on world markets, andthat (he decline was resumed after a periodof stability soon after the end. of World War I.
Comparison of Long-term Trends onInternational and Domestic MarketsThis downward trend of agricultural prices
on world ma,rkets is in contrast to the long-term trend of' pt..ices on some domestic markets
1840 1860 1880 1900 1920 1940 1955
World (food on (y/ manufactured products)
- U.S.A. (agricultural/non-agricultural products)
4..U.K. (agricultural/1)Hr in general)
Sweden (agricultural/prices in general)
66
FIGURE III-3. Indices of the Purchasing Power of Agricultural Products in International Marke s andon Domestic Markets in the United States, the United Kingdom and Sweden
(1913 _ 100 ; semi-logarithmic scale)
More than one American wrstei5 has notedthat over the, past century agricultural pricesin the United States have visen to a consider-ably greater extent than prices in general.The same trend has been observed in Swedenand to some extent also in the United King-dom.8 The apparerd divergence between_ thelong-term trend of price relations on interna-tional and domestic markets (Figure TI[-3) maybe of more than historical interest and meritsfurther study.
The probability is that there is not so much.a continuing long-term trend as a series ofrelatively short-term effects. In the interna-tional market, for example, there appears tohave been a period of relative stability inprice relations from 1870-85, a marked declinein the relative value of agricultural productsfrom 1885-95, leading to another period ofstability which lasted -until 1913. After thatyear the influence of wars and recessions becamedominant.
THE TERMS OF TRADE FOR AGRI-CULTURAL PRODUCTS AND THEPATTERN OF WORLD TRADE
The next step is to consider how changosin the relativo prices of agricultural productsand manufactured goods influence the develop-ment of international trade. In general thelevel of world trade appears to be determinedprimarily by the level of world economic activ-ity. Professor W.A. Lewis, for example, us-ing an index of world manufacturing produc-tion as an indicator of world economic activityand demand, has shown that from 1881 to1929 there was a rather constant relation be-tween this index and the volume of world tradein primary products. The, relation is closestif the largely self-sufficient U.S. economy isomitted from the index of manufacturing pro-duction, when an increase of percent inworld manufacturing production was found onaverage to be associated with an increase of
'See, for example, F. Strauss and L. H. iBean" Gross Farm Income and Indices of Farm Produc-tion and Prices in the -United States, 1869-1937,"U.S.D.A. Technical Bulletin 703, 1940 ; and S. E.Ronk : " Prices of Farm Products in New YorkState, 1841-1935," C000ll University AgriculturalExv3riment Station Bulletin No. 643, 1935.
uE.M. Ojala. Agriculture and .Econornic ProgressOxford University Press, 1950.
67
0.87 percent in worlt1 trade hn nimary prod -ucts.7
If the United States is included in the indexof manufacturing production there is a breakin the .relationship after World War I, thesubsequent level of interriational trade in pri-mary products being lower timan before the.war for a given level of ec(momic activity.The United States produces most of its ownraw materials, so that indusIrial expansionthere has less effect On the growth of inte,rna-tional trade th.art expansion in less self-sufficienteconomies, and the break thus reflects the greatincrease in time relative importance of Americanindustry during and si ice World War I.
The depression of 1930 upset the relationshipbetween world economic activity and the growthof international trade in primary products, butthe latter was .resumed from 1934 to 1938,though at a lower level th.an before for anygiven level of industrial activity.
A similar long-terin relation can be shownfrom Professor Lewis's data to hold good notonly for the volume of international trade inprimary products, but also for the volume ofinternational trade as a -whole. In this casetoo, there is a break to a lower level of tradeafter World War I, refle,cting time greater rela-tive importance of the American economy, anda second break, again to a lower level of trade,after the depression of 1930. As a result ofthese breaks the growth of international tradehas tended to lag behind the growth of Ivorldindustrial prod u cti on.
The Share of Manufactures and PrimaryProducts in World Trade
Changes in relative prices of agricultuvalproducts and manufactured goods might beexpected to be related to at least the relativeshare of these two groups of products in timetotal, if not to time level of world fraile as awhole.
Much of international trade consists of amiexchange of manufactured goods against primaryproducts, of which foodstuffs and other agri-cultural products are time largest component.According to estimates by the secretariat ofthe General .Agreement on Trade and Tariffs(GAT1')8 in both 1952 and 1953 non-industrial-
'Prof. W.A Lewis. op. cit.8 Inte.rnation 1 Trade 1954. oATT, Genera, 1955
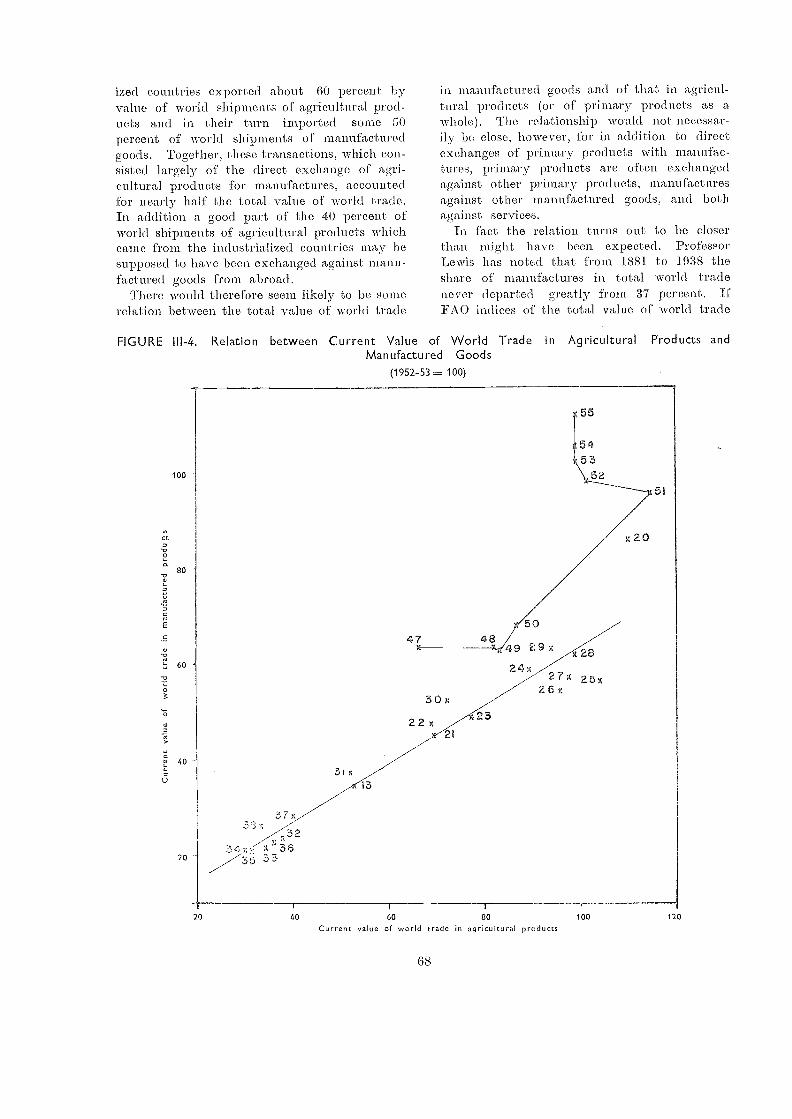
ized countries exported about 60 percent byvalue of world shipnlents of agricultural prod-ucts and in their turn imported some 50percent of world shipments of manufacturedgoods. Together, these transactions, which con-sisted largely of the direct exchange of agri-cultural products for manufactures, accountedfor nearly half the total value of world trade.In addition a good part of the 40 percent ofworld shipments of agricultural products whichCaMe from tire industrialized countries may besupposed to have been exchanged against manu-factured goods from abroad.
There would therefore seem likely to be smilerelation between the total value of world trade
FIGURE III-4. Relation between Current Value of World TradeManufactured Goods
(1952-53 = 100)
100
80
60
40
20 -
68
in manufactured goods and of that in agricul-tural products (in of primary products as awhole). The relationship would not necessar-ily be close, however, for in addition to directexchanges of primary products with manufac-tures, primary products are often exchangedagainst other primary products, manufacturesagainst other manufactured goods, ami both.against services.
In fact the relation turns out to be closertiran might have been expected. ProfessorLewis has noted that from 1881 to 1038 theshare of manufactures in total world tradenever departed greatly :from 37 percent. IfFAO indices of the total valu.e of world trade
in Agricultural Products and
r"20 40 60 80 100 120
Current value of world trade in agricultural prc>ducts
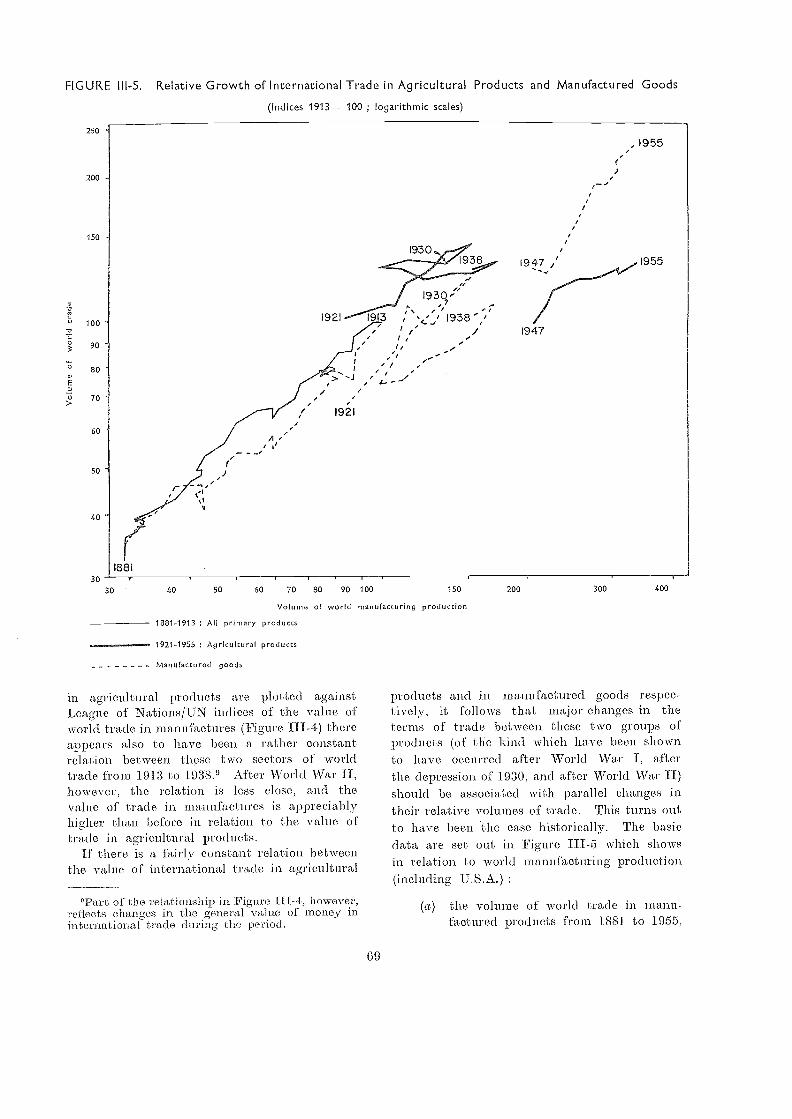
FIGURE III-5. Relative Growth of International Trade in Agricultural Products and Manufactured Goods
(Indices 1913 100 ; logarithmic scales)
Manufactured goods
in agricultural products are plotted againstLeague of NationsfUN indices of the value o-fworld trade in manufactures (Figure III-4) thereappears also to have been a :rather constantrelation between these tWO SeCtOrS Of worldtrade from 1913 to 193-8.9 After World War II,however, the relation is less close, and thevalue of trade in manufactures is appreciablyhigher than before in relation to the value oftrade in agricultural products.
If there i.s a fairly constant relation betweenthe value of international trade in agricultural
'Part of the relationship in. Figure III-4, however,reflects chancres in the general value of money ininternationartrade during the period.
69
products and in manufactured goods respec-tively, i.t follows that major changes in theterms of trade between these two groups ofproducts (of tlie kind which have been shownto have oceurred after World War I, afterthe depression of 1.930, and. after World War H)should be associated with parallel changes intheir relative volu.mes of trade. This turns outto have been the case historically. The basicdata are set out in Figure III-5 which showsin relation to world manufacturing production(including U.S.A.)
(a) the volume of world trade in manu-factured products from 1881 to 1955,
30 40 50 60 70 80 90 100 150 200 300 400
Volume of world manufacturing production
1881-1913 : All primary products
.------- 1921-1955 : Agricultural products
the volume of 'world trade in primaryproducts from 1881 to 1.913,
the volume of world trade :in agricul-tural products from 1921 to 1955.
he points c».1 the chart prior to 1913 are basedon the I..,eague of Nations data utilized by"Professor Lewis. Those after 1913 are basedoil the League of Nations and UN :indices,with the exception of (c) which are based onFAO estimates of the volume of trade in agri-cultural products.
It is evident that before .1913 internationaltrade in primary products and manufactureseach developed at approximately th.e same rate(at least in the long term) and bore much thesame relation to time level of :world industriala cti vity.
From 1921, until the depression of 1930, timecurve for the volume of trade in agriculturalproducts continued more or less unchangedfrom the, curve prior to World War I for pri-mary products as a :whole. In other :words,during this period the volume of world agri-cultural trade at any given le:vel of worldindustrial activity WaS about what would havebeen expected from prewar experience.
The volume of world trade in manufactures,on the other hand, is seen to lia,ve shiftedto an appreciably lower level, in relation towolid industrial activity from 1921 to 1930,than that obtaining before World War I. Thisdiscrepancy persisted, and was even intensified,when a regular relationship was re-establishedin about 1034 after the disturbances to thecurves at the time of the 1930 depression.
Rough estimates indicate that the percentagedecline in the volume of trade in manufactures,in comparison with what would ha:ve beenexpected if the pre:war :relationship had con-tinued, was about the same in each, period asthe percentage decline in the purchasing powerof agricultural products for manufactured goods.Since the balance was maintained by a declinein the volume of trade in manufactures, itappears that th.e import demaml of the indus-trialized countries was relatively unaffected bythe fall in agricultural prices, but that theyobtained their import requirements of agricul-tural products in exchange for smaller exportsof manufactures than before.'m
'The volume of tunde in primary products as awhole (not included to avoid overloading the chartjalso showed a downward shift to a position inter-
70
The reverse adjustment appears to .1tave oc-curred after World War II. In this case the:recovery in the relative prices of agriculturalproducts Ivas reflected, not so much in a changein the volume of trade in manufactures (thiscontinued to show about the same relation tothe level of world economic activity as in theimmediate prewar years), as by a decline inthe voltune of trade of agricultural productsrelati.ve to the level of world economic activity.
Th.e lower volume of international trade con-tinued even after the emergence of agriculturalsurpluses, and from 1949 onward cannot beaccounted for by the postwar food shortages.
The reasons :for this different reaction arenot yet clear. They may, however, reflect th.emuch increased importance of ni anufacturingindustry in the Ivorld economy, and in partic-ular the resolve of governinents to maintainthe highest possible level of 'imports of certaincategories of .inanufactures, notably capitalgoods, in order to expedite economic recoveryand development, even at the cost of some,shortaue of food.stuffs, etc.
Yet another difference may be noted betweenthe reactions after AVorld War I and WorldWar II. After the second war th.e shift intile relative volumes of agricultural and manu-facturing trade was considerably greater thanwas necessary to compensate for the shift inprice relations. So much is evident from thedata in Figure It thus appears thatother factors also played a part. For-example,some forms of economic aid may have enabledsome countries to raise their imports of manu-factures, including capital goods, well abovethe level which :would have been possible fromtheir unaided earnings of foreign currency.
It would be an over-simplification to concludefrom these findings that (apart from such spe-cial economic aid) the le:vel of earnings (in realterms) from agricultural exports mainly deter-mines the level of trade in manufactures, oralternatively, that the relative volume of tradein manufactures mainly determines the priceof agricultural products in foreign trade. Nodoubt the level of trade in each sector reactsupon time other, while both would be stimulatedby a high level of economic activitv.
mediate to those for agricultural products and man-ufactures. It appears therefore that the volumeof irade in primary products of' non-agriculturalorigin declined in the same' way as the voluine of0)0 t) tifo et I 'res.
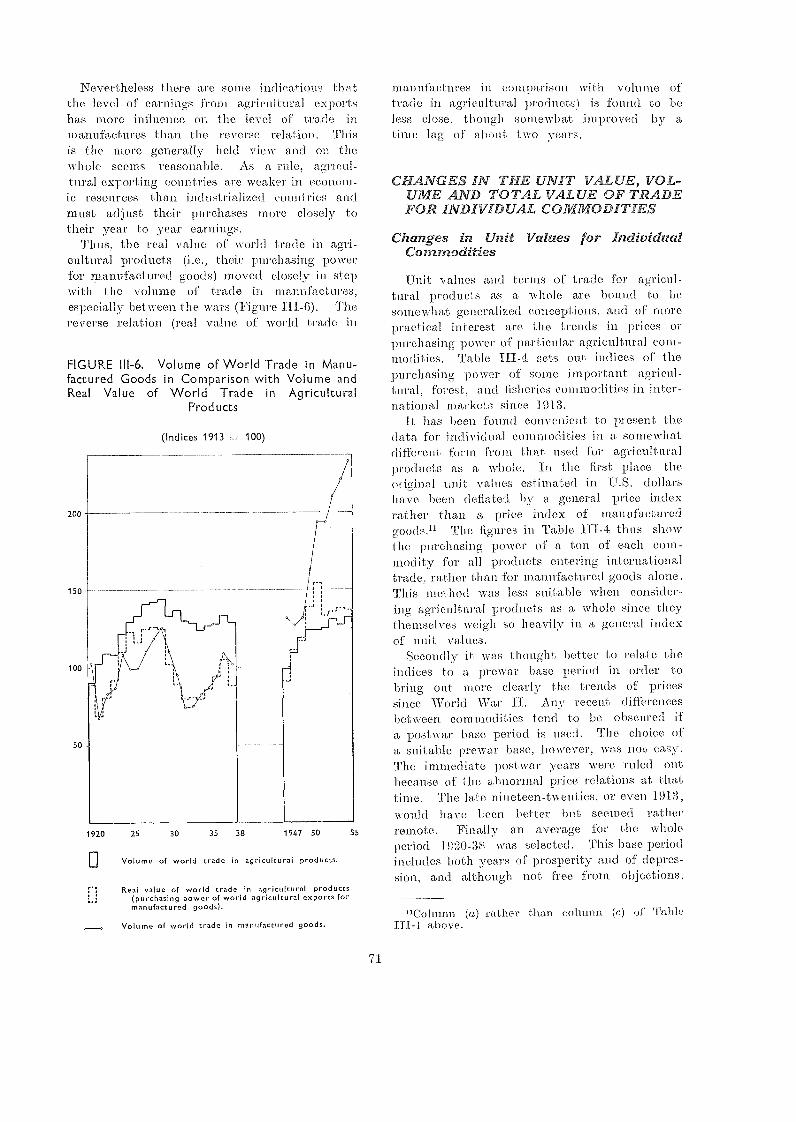
Nevertheless there are some indications thatthe level of earnings from agricultural exportshas more influence ot, the level of trademanufactures than the reverse relation. Thisis the more generally he.k1 view and on thewhole seems reasonable. As a rule, agricul-tural exporting countries arc Weaker in econom-ic resources than industrialized coral-ivies andmust adjust their purcha.ses more closely totheir year to year earnings.
Thus, the real value of world trade in a,gri-cultural products (i.e., their purchasing powerfor manufactured goods) moved closely in stepwith the volume of trade in mantrfactures,especially between the wars (Figure T11-6). Thereverse relation (real value of world. trade itr.
FIGURE III-6. Volume of World Trade in Manu-factured Goods in Comparison with Volume andReal Value of VVorld Trade in Agricultural
Products
(Indices 1913 100)
Volume of world trade in agricultural products.
Real value of world trade in agricultural products(purchasing power of world agricultural exports formanufactured goods).
Volume of world trade in manufactured goods.
infactures in comparison with volume oftrade ill agricultural products) is found to beless close, though somewhat improved by a.
time lag of abont two years.
CHANGES IN THE UNIT VALUE, VOL-UME AND TOTAL VALUE OF TRAD.EFOR INDIVIDUAL COMMODITIES
Changes in Unit Values for IndividualCommodities
'Unit values and ter ns of trade for agricul-tural products as a :whole are bound to besomewhat, generalized conceptions, and of morepractical interest, are the trends in prices orpurchasing power of particular a?.ricultural com-modities. Table sets out indices of thepurchasing po\Ver of some important agricul-tural, forest, and fisheries commodities in inter-n at 10n al m. ark eto sin ce I 913.
It h.as been found convenient to t/Iesent, thedata for iriclividual commodities in a somewhatdifferent form from th.at used for agriculturalproducts as a whole. In the first place theoriginal unit valties estimated in U.S. dollarshave Peen deflated by a general price indexrather than a price index of manufacturedgoods» '!he figures in Table III-4 thus showthe purchasing pnwer of a ton of each com-modity for all products ente ring internationaltrade, rather than :for mauttractured goods alone.This method Nvas less suitable Avlien consider-ing agricultural products as a who/e sitice theythemselves weigh so heavily in a general :indexof unit values.
Secondly it was thought better lo relate theindices to a pre Wai.' baSe period in order tobring out MOM clearly the trends of pricessince World War II. Any recent differencesbetween commodities tend to be obscured ifa postwar base period is used. The choice ofa Sllit able prewar base, however, was not easy.The immediate postwar years were ruled outbecause of the abnormal price relations at thattime. The, late nineteen-twenties, Or even 1 913.would have Leen better hut seenteni ratheriremote. Finally an average for the .whole
period 1620-38 .was selected. This base periodlneludes both years of prosperity and of depres-sion, and although. not :free from objections,
"Column (a) rather than column (c) of 'FableIII-1 above.
1920 25 30 35 38 1947 50 55
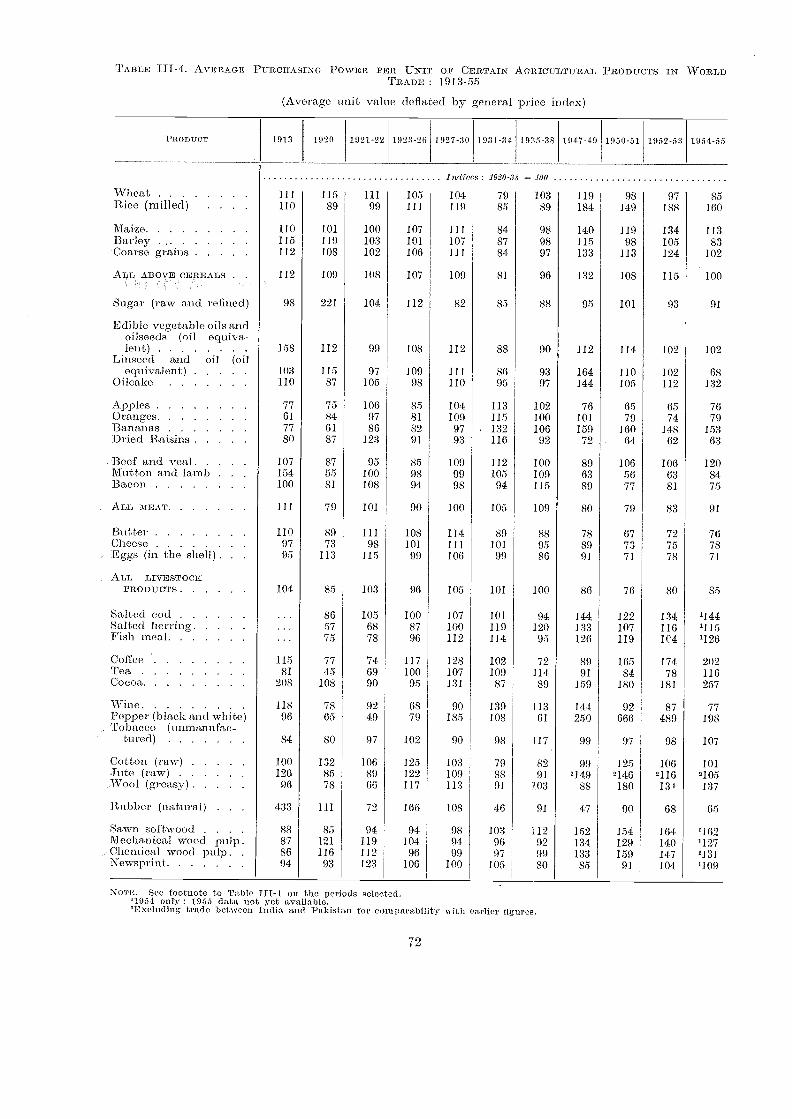
TABLE HT-4. AVERAGE PURCHASLNG POWER PER UNIT OF CERTAIN AGRICULTURAL PRODUCTS IN WO LDTRADE : 1913-55
(Average unit value deflated by general price index)
NOTE. See footnote to Table III-1 or the periods selected.'1954 only : 1955 data not yet available.2Exeluding trade between India and Pakistan for comparability with earlier figures.
72
PRODUCT 1913 1920 1921-22 1923-26 1927-30 1031-34 1935-35 1947-19 1950-51 1052-53 1051-55
Indic s: 1920-3 = 100
Wheat 111 115 111 105 104 79 103 119 98 97 85Rice (milled) . . 110 89 99 111 119 85 89 184 149 188 160
Maize 110 101 100 107 111 84 98 140 119 134 113Barley 115 119 103 101 107 87 98 115 98 105 83
'Coarse grains 112 108 102 106 Ill 84 97 133 113 124 102
ALL Al3OVE CEREALS . 112 109 108 107 109 81 96 132 108 115 100
Sugar (raw and refined) 98 221 104 112 82 85 88 95 101 93 91
Edible vegetable oils andoilseeds (oil equiva-lent) 158 112 99 108 112 88 90 112 114 102 102
Linseed a.n.d oil (oilequivalent) 103 115 97 109 111 86 93 164 110 102 68
0 ilcake 110 87 105 98 110 95 97 144 105 112 132
Apples 77 75 106 85 104 113 102 76 65 65 76Orange's 61 84 97 81 109 115 100 101 79 74 79Bananas 77 61 86 82 97 132 106 159 160 148 153Dried Raisins 80 87 123 91 93 116 92 72 64 62 63
Beef an.cl veal 107 87 95 85 109 112 100 89 106 106 120Mutton and lamb . 154 55 100 98 99 105 109 63 56 63 84Bacon 100 81 108 94 98 94 115 89 77 81 75
ALL MEAT Ill 79 101 90 100 105 109 80 79 83 91
Butter 110 89 111 108 114 89 88 78 67 72 76Cheese 97 73 98 101 111 101 95 89 73 75 78Eggs (in the shell) . . 95 113 115 99 106 99 86 91 71 78 71
ALL LivEsTocKPRODUCTS 104 85 103 96 105 101 100 86 76 80 85
Salted cod 86 105 100 107 101 94 144 122 134 '144Salted herring 57 68 87 100 119 120 133 107 116 '115Fish meal ... 75 78 96 112 114 95 126 119 1C4 '126
Coffee * 115 77 74 117 128 102 72 89 165 174 202Tea 81 45 69 100 107 109 114 91 84 78 116Cocoa 208 108 90 95 131 87 89 159 180 181 257
Wine 118 78 92 68 90 139 113 144 92 87 77Pepper (black and white) 96 65 49 79 185 108 61 250 666 489 198Tobacco (unmanufac-
tured) 84 80 97 102 90 98 117 99 97 98 107
Cotton (raw) 100 132 106 125 103 79 82 99 125 106 101,Tute (raw) 126 85 89 122 109 88 91 2149 2146 2116 2105Wrool (greasy) 96 78 66 117 113 91 103 88 180 131 137
Rubber (natural) . . . 433 111 72 166 108 46 91 47 90 68 65
Sawn softwood . . . . 88 85 94 94 98 103 112 152 154 164 '162Mechanical wood pulp . 87 121 119 104 94 96 92 134 129 140 '127Chemical wood pulp . . 86 116 112 96 99 97 99 133 159 147 '131.Newsprint 94 93 123 106 100 105 80 85 91 104 1109
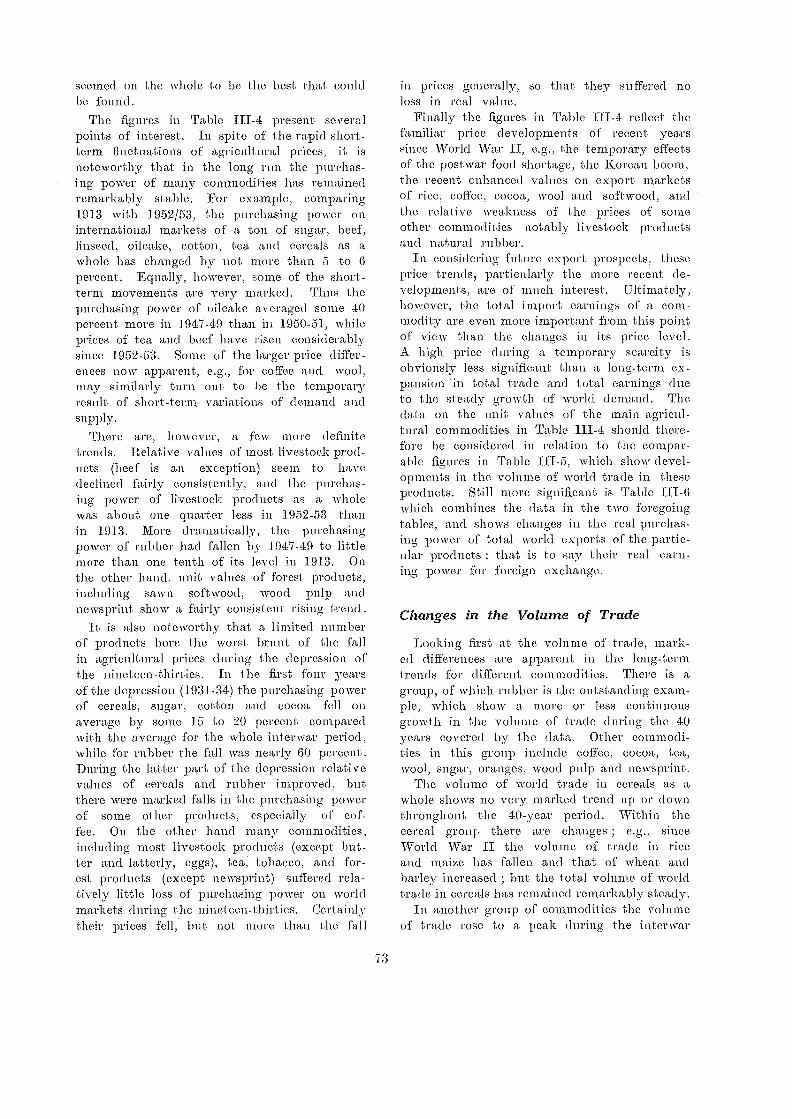
seemed on the whole to be the best that couldbe found.
The figures in Table III-4 present severalpoints of interest. In spite of the rapid short-term fluctuations of agricultural prices, it isnoteworthy that in th.e long run the purchas-ing power of many commodities has remainedremarkably stable. For exam.ple, comparing1913 with 1952/53, the purchasing power oninternational markets of a ton of sugar, beef,linseed, oilcake, cotton, tea and cereals as awhole has changed by not more than 5 to 6percent. Equally, however, som.e of the short-term movements are very marked. Thus thepurchasing power of oilcake averaged some 40percent more in 1947-49 than in 1050-51, whileprices of tea and beef have risen considerablysince 1952-53. Some of the larger price differ-ences 1101V apparent, e.g., for coffee and wool,may similarly turn out to be the, temporaryresult of short-term variations of demand andsupply.
There are, however, a few more definite,trends. Relative values of most livestock prod-ucts (beef is an exception) seem to havedeclined fairly consistently, and the purchas-ing power of livestock products as a wholewas about one quarter less in 1952-53 thanin 1913. More dramatically, the purchasingpower of rubber had fallen by 1047-49 to littlemore than one tenth of its level in 1913. Onthe other hand, unit values of forest products,including sawn softwood, wood pulp andnewsprint show a fairly consistent rising trend.
It is also noteworthy that a limited numberof products bore the worst brunt of the fallin agricultural prices during the depression ofthe nineteen-thirties. In the first four yearsof the depression (1931-34) th.e purchasing powerof cereals, sugar, cotton and cocoa fell onaverage by some 15 to 20 .percent comparedwith the average for the whole interwar period,while for rubber the fall was nearly 60 percent.During the latter part of the depression relativevalues of cereals and rubber improved, butthere were marked falls in the purchasing powerof some other products, especially of cof-fee. On the other hand many commodities,including most livestock products (except but-ter and latterly, eggs), tea, tobacco, and for-est products (except newsprint) suffered rela-tively little loss of purchasing power on worldmarkets during the nineteen-thirties. Certainlytheir prices fell,. but not more than the fall
73
in prices generally, so that they suffered noloss in real value.
Finally the figures in Table III-4 reflect thefamiliar price developments of recent yearssince World. War II, e.g., the temporary effectsof the postwar food shortage, the Korean boom,the recent enhanced values on export marketsof rice, coffee, cocoa, wool and softwood, andthe relative weakness of the prices of someother commodities notably livestock productsand natural rubber.
In considering future ex.port prospects, theseprice trend.s, particularly the more recent de-velopments, are of much. interest. Ultimately,however, th.e total import earnings of a com-modity are even more important from this pointof view than the changes in its price level.A high price during a temporary scarcity isobviously less significant than a long-term ex-pansion in total trade and total earnings dueto the steady growth of world demand. Thedata on the unit values of the main agricul-tural commodities .in Table III-4 should there-fore be considered in relation to the compar-able figures in Table which show devel-opments in the volume of world trade in theseproducts. Still more significant is Table III-5which combines the data in th.e two foregoingtables, and shows changes in the real purchas-ing power of total ,,vorld exports of the partic-ular products : that is to say their real earn-ing power for foreign exchange.
Changes in the Volume of Trade
Looking first at the volume of trade, mark-ed differences are apparent in the long-termtrends for different commodities. There is agroup, of which rubber is the outstanding exam-ple, which show a more or less continuousgrowth in the volume of trade during the 40years covered by the data. Other commodi-ties in this group include coffee, cocoa, tea,wool, sugar, oranges, wood pulp and newsprint.
The volume of world trade in cereals as awhole shows no very marked trend up or clownthroughout the 40-year period. Within thecereal group there are changes ; e.g., sinceWorld War II the volume of trade in riceand maize has fallen and that of wheat andbarley increased ; but the total volume of worldtrade in cereals has remained remarkably steady.
In another group of commodities the volumeof trade rose to a peak during the interwar
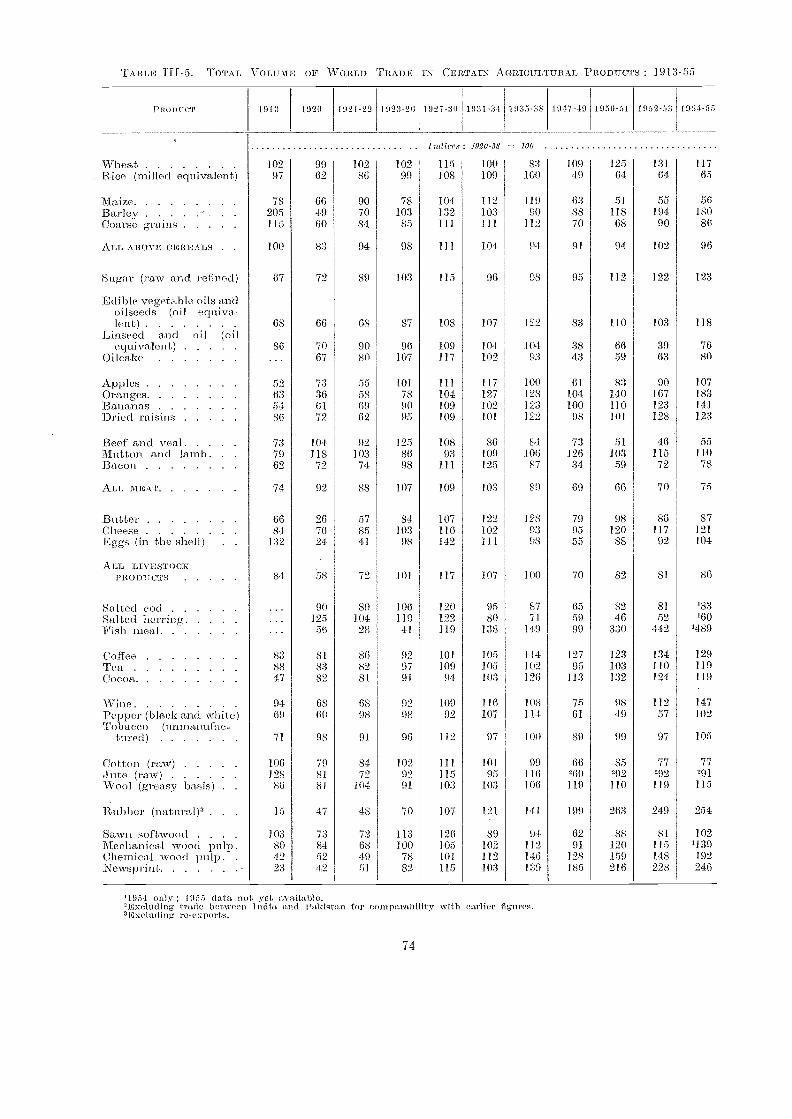
Al3L E 111- 5. '1110TAL VOLUME OF WORLD TRAD E IN CERTAIN A altICAJLTURAL PRODUCTS : 1913-55
'1.954 only ; 1955 data not yet available.'Excluding trade between 1 ridikI and Pakistan tor comparability with earlier figures.3E xclu ding re-exports.
74
Ilno prcT 1913 1920 1921-22 1923-29 1927-30 1931-31 1935-138 1947-49 1950-51 1952-53 1954-55
hulicos : 1920-38 100
Wheat 102 99 102 102 115 100 83 100 125 131 117Rice (milled equivalent) 97 69 86 99 108 109 100 49 64 64 65
Maize 78 66 90 78 104 112 119 63 51 55 56Barley ----------- 205 49 70 103 132 103 90 88 118 194 180Coarse grains 115 60 8.4 85 111 111 112 70 69 90 86
ALL ABOVE CE BEALS 100 83 94 98 111 104 94 91 94 102 96
Sugar (raw and relined) 67 72 89 103 115 96 98 95 112 122 123
'Edible vegetable oils andoilseeds (oil equiva-lent) 68 66 68 87 108 107 122 83 110 103 118
Linseed and oil (oilequivalent) 86 70 90 96 109 104 104 38 66 39 76
Oi lealtv . . . 67 80 107 117 102 93 43 59 63 80
Apples 52 73 55 101 111 117 100 61 83 90 107Oranges 63 36 58 78 104 127 128 104 140 167 183Bananas 54 61 69 90 109 102 123 100 110 123 141Dried raisin r 86 72 62 95 109 101 122 98 101 128 123
Beef and veal 73 104 92 125 108 86 84 73 51 46 55Mutton and lamb . . 79 118 103 86 93 109 106 126 103 115 110Bacon 69 72 74 98 111 125 87 34 59 72 78
ALL MEAT 74 99 88 107 109 103 89 69 66 70 75
Butter 66 26 57 84 107 122 128 79 98 86 87Cheese 84 76 85 103 116 102 93 95 120 117 121Eggs (in the shell) . . 132 24 41 98 142 111 98 55 88 92 104
Art, tu vEorro el:raw, uerro 84 ' 58 72 101 117 107 100 70 82 81 86
Salted cod ... 90 89 106 120 95 87 65 82 81 183
Salted herring ... 125 104 119 122 80 71 59 46 52 '60Fish ineal ... 56 98 41 119 138 149 99 330 4-42 1489
Coffee 83 81 86 92 101 105 114 127 123 134 129Tea 88 83 89 97 109 105 102 95 103 110 119Cocoa 47 89 81 91 94 103 126 113 132 124 119
Wine 94 68 68 92 109 116 108 75 98 112 147Pei)1 ii or (black and \VII i to) 69 60 98 98 92 107 114 61 49 57 102Tobacco (unman ufac-
tu red) 71 98 91 96 112 97 100 89 99 97 105
Cotton (raw) 106 79 84 102 111 101 99 66 85 77 77jute (raw) 128 81 79 92 115 95 116 260 292 292 291Wool (greasy basis) . . 86 81 104 91 103 103 106 119 110 119 115
Rubber ( natural )3 . . . 15 47 48 70 107 121 141 199 263 249 254
SaWil Sat-AVM/CI . . . . :103 73 72 113 126 89 94 62 88 81 102Mecho-ji ical wood pulp . 80 84 68 100 105 102 112 91 120 115 1139Chemical wood pulp . . 42 7-9o..., 49 78 101 112 146 128 159 148 192Newsprint . ,-)9.., 49 51 82 115 103 139 185 216 228 246
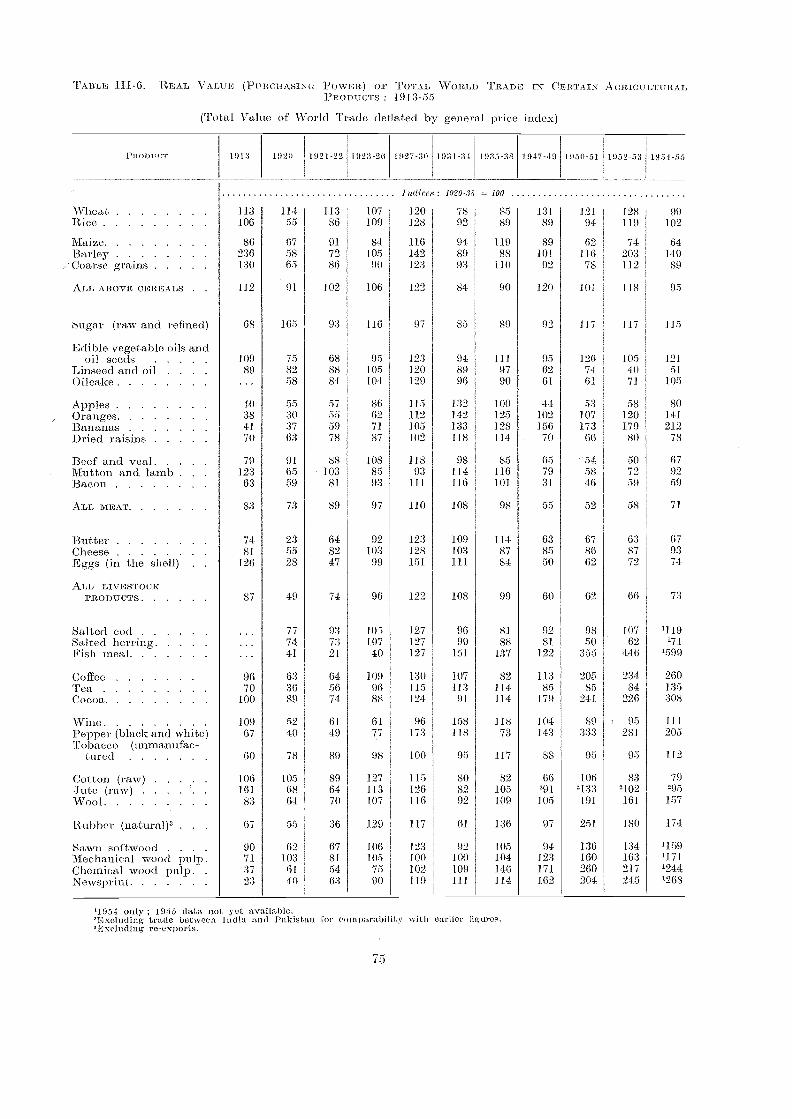
TABLE 6. REAL VALUE (P IW1IAsTN(; PON\ 1,31.) OE TOTAL WORLD TRAD E IN CERTAIN A O BICULTURALPROD UCTS I 913-55
(Total Value of World Tiade deflated by general price index)
'1954 only ; 1955 data not yet available.2Excluiling trade between India and I'akistan for comparability with earlier figures...Excluding re-exports.
75
PRODUCT D,I3 1950 1921-22 192:1-211 1927-30 1931-34 1935-38 1917-49 1950-51 11152-53 1954-55
1 IOW 1920-38 -= 100
Wheat 113 114 113 107 120 78 85 131 121 128 99Rice 106 55 86 109 128 92 89 89 94 119 102
Ma i ze 86 67 91 84 116 94 119 89 62 74 64Barley 236 58 72 105 142 89 88 101 116 203 149Coarse grain ' 130 65 80 90 123 93 110 92 78 112 89
ALL ABOVE CEREALS . . 112 ' 91 102 106 122 84 90 120 10/ 118 95
l.7ittgar (raw and refined) 68 165 93 116 97 85 89 92 117 117 115
Edible vegetable oils andoil seeds 109 75 68 95 123 94 111 95 126 105 121
Linseed and oil . . . 89 82 88 105 120 89 97 62 74 40 51Oilcake ... 58 84 104 129 96 90 61 61 71 105
Apples 40 55 57 86 115 132 100 44 53 58 80Oranges 38 30 55 62 112 142 125 102 107 120 141Bananas 41 37 59 71 105 133 128 156 173 179 212Dried raisins 70 63 78 87 102 118 114 70 66 80 78
Beef and veal 79 91 88 108 118 98 85 65 - 54 50 67Mutton and lamb . . 123 65 103 85 93 114 116 79 58 79 92Bacon 63 59 81 93 111 116 101 31 46 59 59
ALL MEAT 83 73 89 97 110 108 98 55 52 58 71
Butter 74 93 64 92 123 109 114 63 67 63 67Cheese 81 55 82 103 128 103 87 85 86 87 93Eggs (in the shell) . 126 28 47 99 151 111 84 50 62 79 74
ALL LIVESTOCKPRODUCTS 87 49 74 96 122 108 99 60 62 66 73
8 alted cod . . . 77 93 105 127 96 81 312 98 107 1119Salted herring . . . 74 73 107 127 99 88 81 50 62 171
Fish meal . . . 41 21 40 127 151 137 122 355 446 1599
Coffee 96 63 64 .109 130 107 82 113 205 234 260Tea 70 36 56 96 115 113 114 85 85 84 135Cocoa 100 89 74 88 124 91 114 179 241 226 308
Wine 109 52 61 61 96 158 118 104 89 ; 95 111
Pepper (black and white) 67 40 49 77 173 118 73 143 :333 281 205Tobacco (unmanufac-
tured GO 78 89 98 100 95 117 88 95 05 112
Cotton (raw);Jute (raw)
106161
[0568
8964
127113
115126
8082
82105
66291
1062133
832102
79295
Wool 83 64 70 107 110 92 109 105 191 161 157
Rubber (natural)2 . . 67 55 36 129 117 61 136 97 251 180 174
S aW/1 softwood 90 62 67 106 123 02 105 94 136 134 '159Mechanical wood pulp . 71 103 81 105 1.00 100 104 123 160 163 '171Chemical wood pulp . . 37 61 54. 75 102 109 146 171 260 217 '244;Newsprint 23 40 63 90 119 IA 1 114 162 204 245 '268
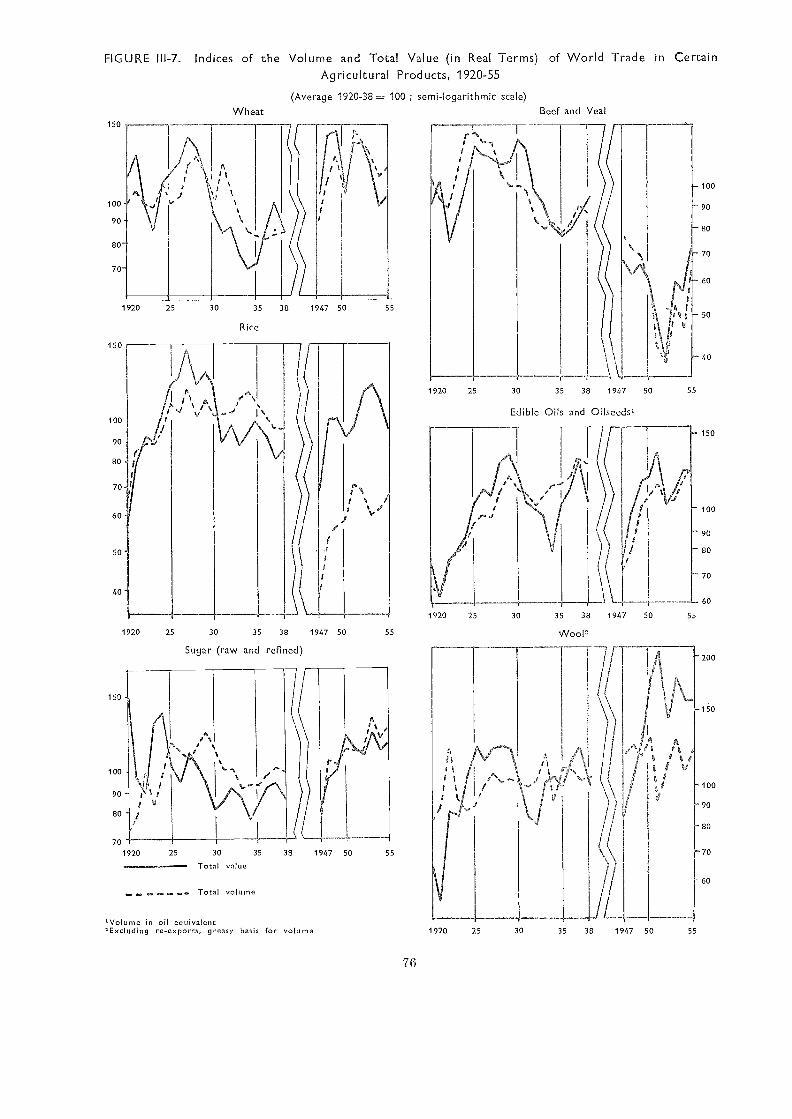
FIGURE III-7. Indices of the Volume and Total Value (in Real Terms) of World Trade in CertainAgricultural Products, 1920-55
(Average 1920-38= 100 ; semi-logarithmic scale)
150
100
90
80
70
Rice
Total volume
Sugar (raw and refined)
'Volume in oil equivalent'Excluding re-exports, greasy basis for volume
76
Edible Oils and Oilseeds,
00
90
80
70
60
1920 25 30 35 38 1947 50 55
Wheat Beef and Veal
1920 25 30 35 38 1947 50 55 VVoor-
38 1947 50 551920 25 30 35
Total value
1920 25 30 35 38 1947 50 55
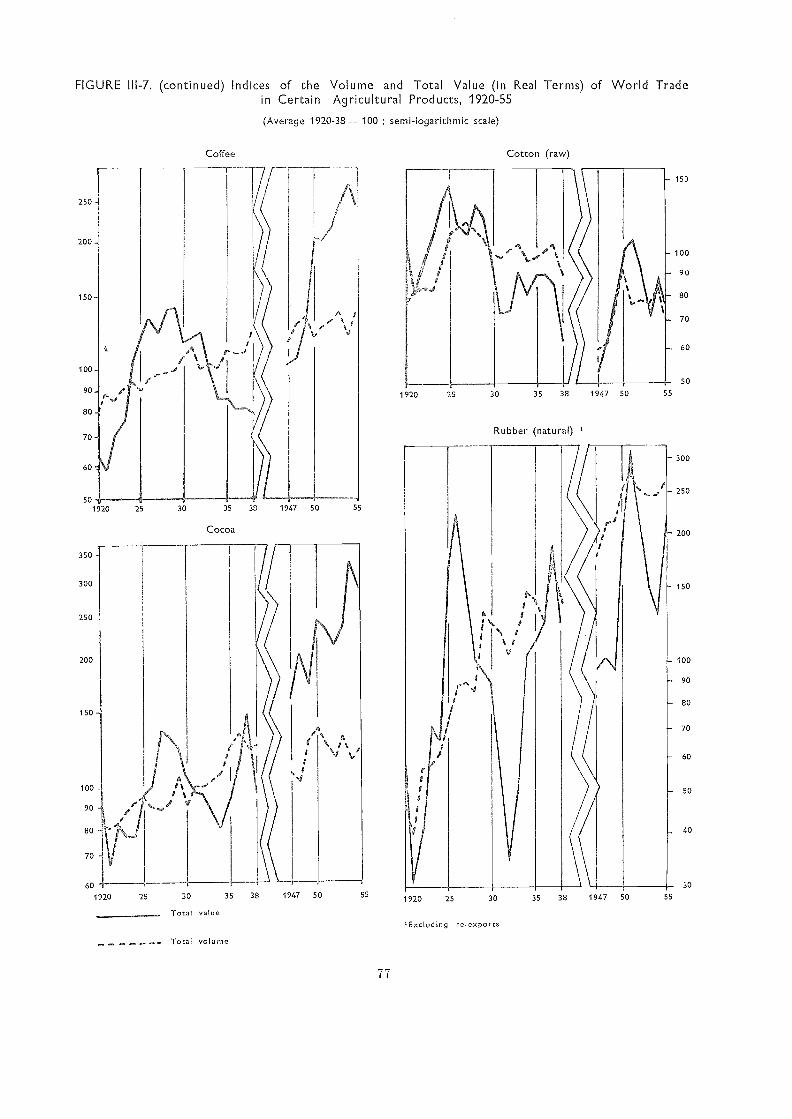
FIGURE III-7. (continued) Indices of the Volume and Total Value (in Real Terms) of World Tradein Certain Agricultural Products, 1920-55
(Average 1920-38= 100 ; semi-logarithmic scale)
250
200
150
100
90
80
70
60
50
30 35
Total value
Total volume
77
Excluding re-exports
Cotton (raw)
Rubber (natural) 1.
100
90
80
70
60
o
300
250
200
150
00
90
80
70
60
50
40
30
1920 25 551947 5038
1 920 25 30 35 38 1947 50 55
1920 25 30 35 38 1947 50 55
years which has barely been regained, as inthe case of cheese, mutton and Iamb, wine,dried raisins and possibly tobacco. Finally fora considerable number of uroducts, includingbeef, eggs, bacon, butter, oilcake, apples, andcotton the volume of world trade since WorldWar TI has remained well below the peak :reach-ed during the interwar years.
Changes in the Total Purchasing Powerof Agricultural Exports
Changes in the volume of trade give a valu-able, but incomplete picture of the trend ofworld import demand. Thus if we take thegroup of commodities for which time volumeof trade has shown a fairly continuous increase,there are some, e.g., coffee, cocoa, wool, and\mod pulp, for which unit values currentlystand well above their average level. The real"export earnings" of these products on .worldmarkets (or the real cost of world imports,according to the point of view) has thereforeincreased 'much more sharply than would beapparent from consideration of time volume oftrade done. Pepper is a striking example. Al-though the volume of world trade in pepperwas somewhat lower in 1952-53 than in 1913,because of increased import demand the unitvalue per ton (in real terms) had increasedby about five times and the total value of alltrade more than four times.
On the other hand, an increased volume oftrade has been partly offset in other cases bya fall in real price levels. This is true of sugar,mutton and, until recently, of tea. The "exportearnings" of these commodities has in fact beenlower since World War II than the averagebetween the wars, in spite of the greater volumeof trade. The most striking case of all is thatof rubber. Between 1913 and 1949 the volumeof world trade in natural rubber (net of re-exports) increased by more than 14 times, butthe real value of these exports increased byless than 50 percent, for in th.e meantime theaverage price per ton compared with otherproducts had fallen to one tenth of its 1913level. This is obviously an extreme example,for rubber was still only at the beginning ofits industrial utilization in 1913.
Similarly, when time volume of .world tradehas contracted, the decline has sometimes beenoffset by increased real prices, as for rice, for
78
which the volume of trade in 1954 was 38percent below the interwar average while thereal value of trade was 9 percent higher. Con-versely a low volume of trade is sometinaesintensified by a low level of real prices, as forapples, where the volume of world trade in,e.g., 1952 was 12 percent below the interwaraverage and the real value of trade 40 percentbelow, because of a decline of 30 percent inunit value. Examples of' the development since1913 of both time volume and total value ofworld trade in certain representative commodi-ties are shown in Figure III-7.
The relation between the curves of volumeand real value will of course be largely govern.-ed by the price elasticity of demand on inter-national markets of the particular commodity.Caution is needed, however, in drawing anyconclusions on price elasticity from the datapresented. It should be borne in mind thatwhile for som,e products, e.g., cocoa or rubber,they embrace practically the whole world mar-ket, for others, e.g., rice, coarse grains, eggs,apples, only a small percentage of the worldoutput enters export markets. Internationaltrade is therefore to some extent of a marginalcharacter, even though some individual coun-tries depend heavily on imports, both the volumeof trade and the level of prices being largelyinfluenced by the main bulk of supplies trad-ed on domestic markets in the countries wherethey are produced.
FACTORS INFLUENCING THE INTER-NATIONAL DEMAND FOR AGRICUL-TURAL PRODUCTS
In order to bring out more clearly recenttrends in international trade, th.e data in thefinal column of Table III-6 are grouped belowin order of magnitude. ID effect they showthe total (real) value of world trade in eachcommodity during the period 1954-55 as a per-centage of the average during time interwarperiod (Table III-7). Th.e same data are shownin Figure III-8 which includes also the volumeof trade.
A certain pattern appears to emerge fronathis grouping. Most of the commodities in thefirst column of Table III-7 are seen to be com-modities which ar2 largely for export, and whichin general cannot be produced economically inthe main industrialized countries. Conversely
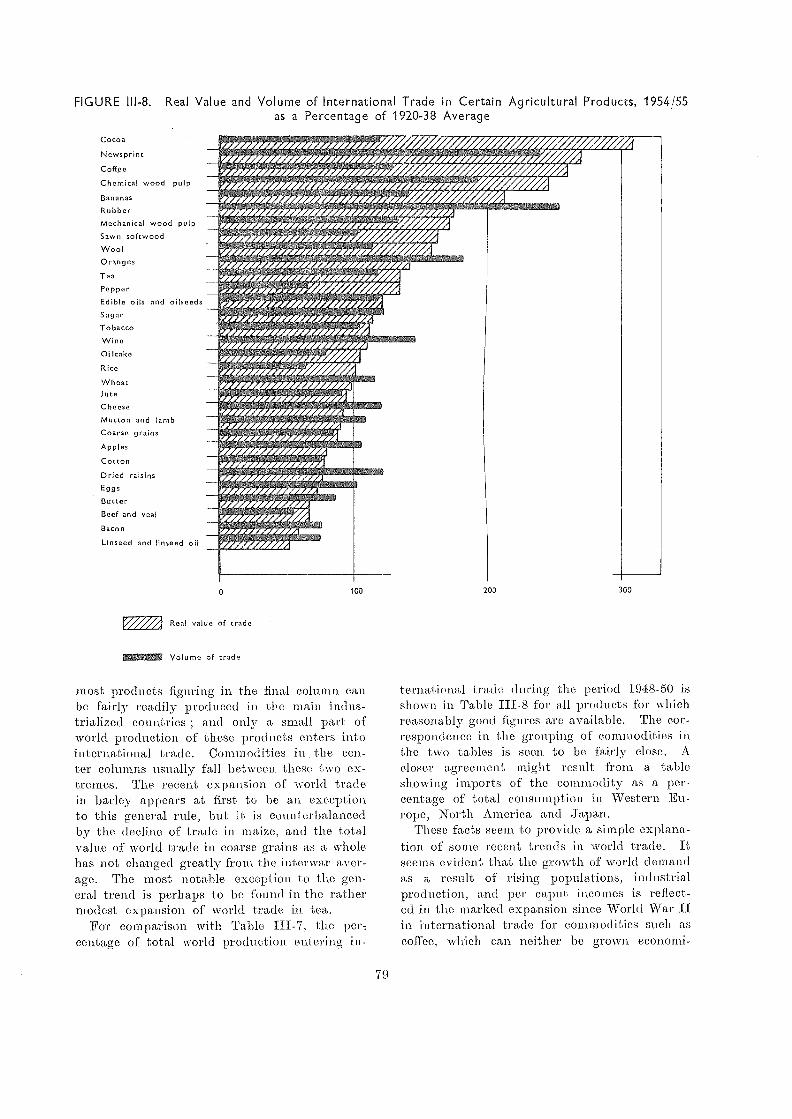
FIGURE III-8. Real Value and Volume of International Trade in Certain Agricultural Products, 1954/55as a Percentage of 1920-38 Average
Cocoa
Newsprint
Coffee
Chemical wood pulp
Bananas
RubberMechanical wood pulpSawn softwoodWoolOranges
Tea
Pepper
Edible oils and oilseedsSugar
Tobacco
WineOi !cake
Rice
WheatJute
Cheese
Mutton and IambCoarse grains
Apples
Cotton
Dried raisinsEggs
ButterBeef and veal
Bacon
Linseed and linseed oil
440°
41:.$o
,17
.1
44'4
jirAU, l Z./ 4,24
I ' Z. 4,.
EZZ:72 Real value of trade
Volume of trade
most products figuring in the final column canbe fairly readily produced in the main indus-trialized countries ; and only a small part of'world production of these products enters intointernational trade. Commodities iii. th.e cen-ter columns usually fall between these two ex-tremes. The recent expansion of world tradein barley appears at first to be an exceptionto this general rule, but it is counterbalancedby the decfine of trade in maize, and the totalvalue of world trade in coarse grains as a wholehas not changed greatly from the interwar aver-age. The most notable excel-9 ion to the gen-eral trend is perhaps to be fou.nd in the rathermodest expansion of -world trade in tea.
For comparison with Table the per,centage of total world production entering in-
70
ternational trade during the period 1948-50 isshown in Table III-8 for all products for whichreasonably good figures are available. The cor-respondence in the grouping of commodities inthe two tables is seen to be fairly close. Acloser agreement might result from a tablesluiwing imports of the commodity as a per-centage of total consumption in Western Eu-rope, North America and Tapan.
These facts seem to provide a simple explana-tion of som,e recent trends in world trade. Itseems evident that the growth of .world demandas a result of rising populations, industrialproduction, and per caput incomes is reflect-ed in the marked expansion since World -War IIin international trade for conunodities such ascoffee, which can neither be grown economi-
o 100 200 00
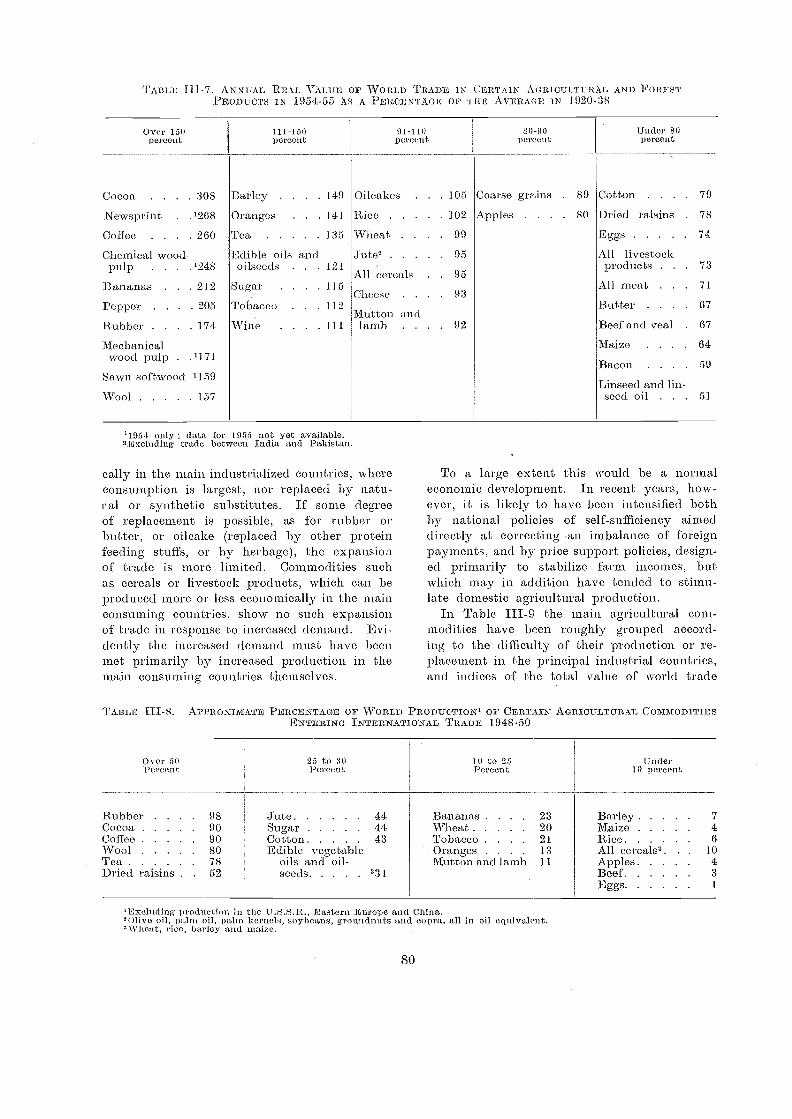
TA BLE 111-7. ANN GAT. REAL VALUE OF WO ItLD TRADE IN CERTAIN A o:RICU-LT 1. R 'AL AND FORESTPROD UCTS IN :1954-55 As A PERCENTAGE OF T LEE AVERAGE IN 1920 - 38
11954 only ; data for 1955 not yet available.2Exeluding trade between. India and Pakistan.
cally in the main industrialized countries, whereconsumption is largest, nor replaced by natu-ral or synthetic substitutes. If some degreeof replacement is possible, as for rubber orbutter, or oilcake (replaced by other proteinfeeding stuffs, or by herbage), the expansionof trade is more limited. Commodities suchas cereals or livestock products, which can beproduced more or less economically in the mainconsuming countries, show no such expansionof trade in response to increased demand. Evi-dently the increased demand inust have beenmet primarily by increased production in themain consuming countries themselves.
TABLE 111-8. APPROXIMATE PERCENTAGE OF WORLD PRODUCTION' OF CERTAIN AGRICULTURAL COMMODITIESENTERING INTERNATIONAL TRADE 1948-50
Over 50:Percent
JuteSugarCottonEdible vegetable
oils and oil-seeds
80
To a large extent this would be a normaleconomic development. In recent years, how-ever, it is likely to have been intensified bothby national policies of self-sufficiency aimeddirectly at correcting ,an imbalance of foreignpayments, and by price support policies, design-ed primarily to stabilize farm incomes, butwhich may in addition have tended to stimu-late domestic agricultural production.
In Table 111-9 the main agricultural com-modities have been roughly grouped accord-ing to the difficulty of their production or re-placement in the principal industrial countries,and indices of the total value of world trade
l'Excluding production in the -U.S.S.R., Eastern Europe ami China..0live oil, palm oil, palm kernels, soybeans, groundnuts and copra, all in oil equivalent.3Wheat, rice, barley and maize.
Over 150percent
111450percent
91-110pereeat
80-90percent
Under 80percent
COCOR . . .
Newsprint .
Coffee . . .
Chemical wood-pulp . . .
Bananas . .
Pepper . . .
Rubber . . .
Mechanicalwood pulp .
Sawn softwood
Wool
308
.1268
. 260
.124.8
. 212
. 205
. 174
.1171
1159
157
Barley . . . .
Oranges . .
Tea
Edible oi Is andoi Iseeds . . .
Sugar . . . .
Tobacco . . .
Wine . . . .
149
141
135
121
115
112
111
Oilcakes . .
Rice
Wheat
Jute2
All cereals .
Cheese . . .
Mutton andlamb . . .
. 105
102
99
95
. 95
. 93
. 92
Coarse grains
Apples . . .
. 89
. 80
Cotton . . . .
Dried raisins .
Eggs
All livestockproducts . . .
All meat . . .
Butter . . . .
Beef and veal .
Maize . . . .
Bacon
Linseed and lin-seed oil . . .
79
78
74
73
71
67
67
64
59
51
44 Bananas 23 Barley 744 Wheat 20 Maize 443 Tobacco 21 Rico 6
Oranges . . . 13 All cereals2. 10Mutton and lamb 11 Apples 4
231 Beef 3Eggs 1
Rubber 98Cocoa 90Coffee 90Wool 80Tea 78Dried raisins . . 52
25 to 30 10 to 25 UnderPercent Percent 10 percent
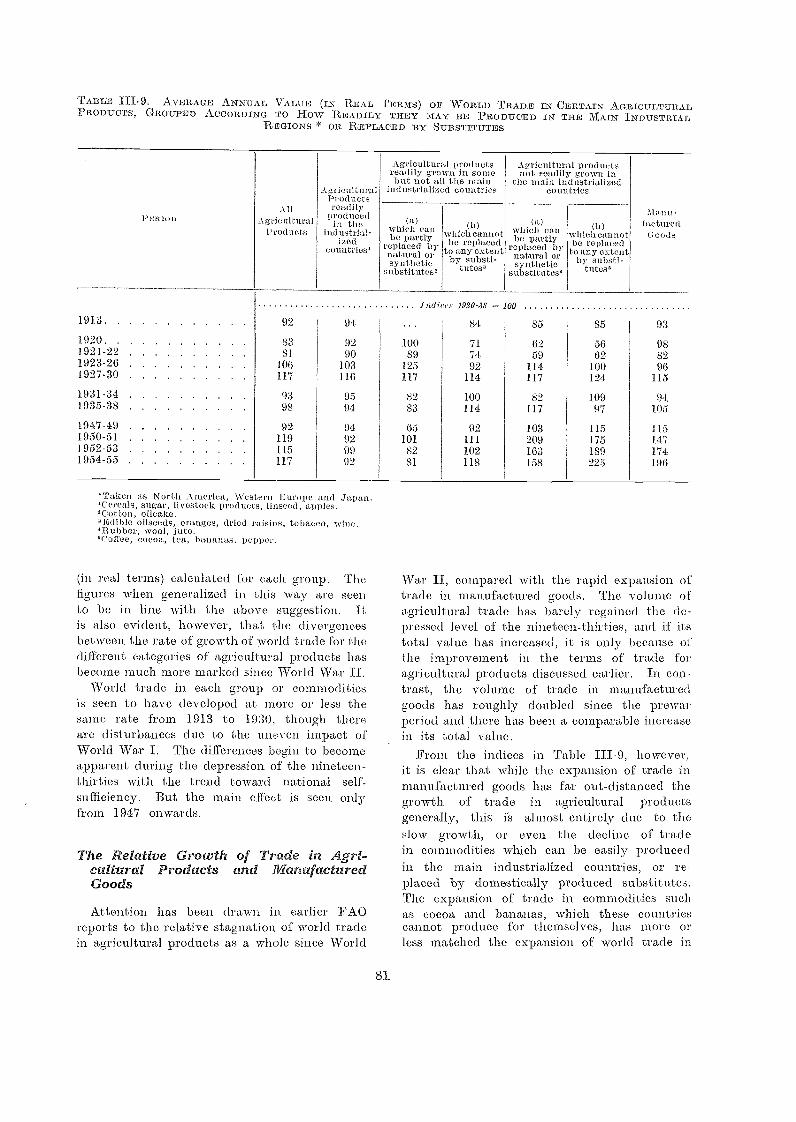
TABLE 111-9. AVERAGE ANN UAL NTALUE N REAL TERMS) OF WORLD TRADE IN CERTAIN AGRIC ULT URALPRODUCTS, GROUPED ACCORDING TO How READILY THEY MAY RE PRODUCED IN THE MAIN INDUSTRIAC.
*Taken as North America, Western Europe and japan.]Cereals, sugar, livestock products, linseed, apples.2Cotton, oilcake.3Edible oilseeds, oranges, dried raisins, tobacco, wine.]Rubber, woo], jute.,Colfee, cocoa, tea, bananas, pepper.
(in real terms) calculated for each group. Thefigures when generalized iii this way are seento be in line with the above suggestion. Itis also evident, however, that the divergencesbetween the rate of growth of world trade for thedifferent categories of agricultural products hasbecome much more marked since 'World War II.
World trade in each group or commoditiesis seen to have developed at more or less thesame rate from 1913 to 1930, though thereare disturbances due to the uneven impact ofWorld War I. The differences 'begin to 'becomeapparent during the depression uf the nineteen-thirties with the trend toward national self-sufficiency. But the main effect is seen onlyfrom 1947 onwards.
The Relative Growth of Trade in Agri-cultural Products and IdanufacturedGoods
Attention has been drawn in earlier FAOreports to the relative stagnation of world tradein agricultural products as a whole since World
Si
War II, compared with the rapid expansion oftrade, in manufactured goods. The volume ofagricultural trade has barely regained the de-pressed level of the nineteen-thirties, and if itstotal value has increased, it is only because ofthe improvement in the terms of trade foragricultural products discussed earlier. In con-trast, the volume of trade in manufacturedgoods has roughly doubled since the prewarperiod and there has been a comparable increasein its total value.
From the indices in Table III-9, however,it is clear that while the expansion of trade inmanufactured goods has far out-distanced thegrowth of trade in agricultural productsgenerally, this is almost entirely due to theslow growth, or even the decline of tradein commodities which can be easily producedin the main industrialized countries, or re-placed by domestically produced substitutes.The expansion of trade in commodities suchas cocoa and bananas, which these countriescannot produce for themselves, has more orless matched the expansion of world trade in
Indices 1920-38 100
1913 92 94 84 85 35 93
1920 83 92 100 71 62 56 981921-22 81 90 89 74 59 62 821923-26 106 103 125 92 114 100 961927-30 117 116 117 114 117 124 115
1931-34 93 95 82 100 82 109 941935-38 93 94 83 114 117 97 105
1947-49 92 94 65 92 103 115 1151950-51 119 92 101 111 209 175 1471952-53 115 99 82 102 163 139 1741954-55 117 92 81 113 153 225 196
REGIONS * OR REPLA.CED BY SUBSTITUTES
Agricultural productsreadily gTown in SOMCbut not all the main
Agricultural productsnot readily gTown
the main industrializedAgricultural industrialized countries countries
PiutionA 11
Agricultural1,10(111et s
Productsreadily
producedin the
industrial-ized.
countries'
Manu-factured
Goods(a)
which canbe partly
replaced bynatural orsynthetic
substitutes2
(b)which cannotbe replaced
to any extentby substi-
tutes3
(a)which canbe partlY
replaced bynatural os'synthetic
substitutes*
(b)which cannotbe replacedto any extent
by substi-tutes,
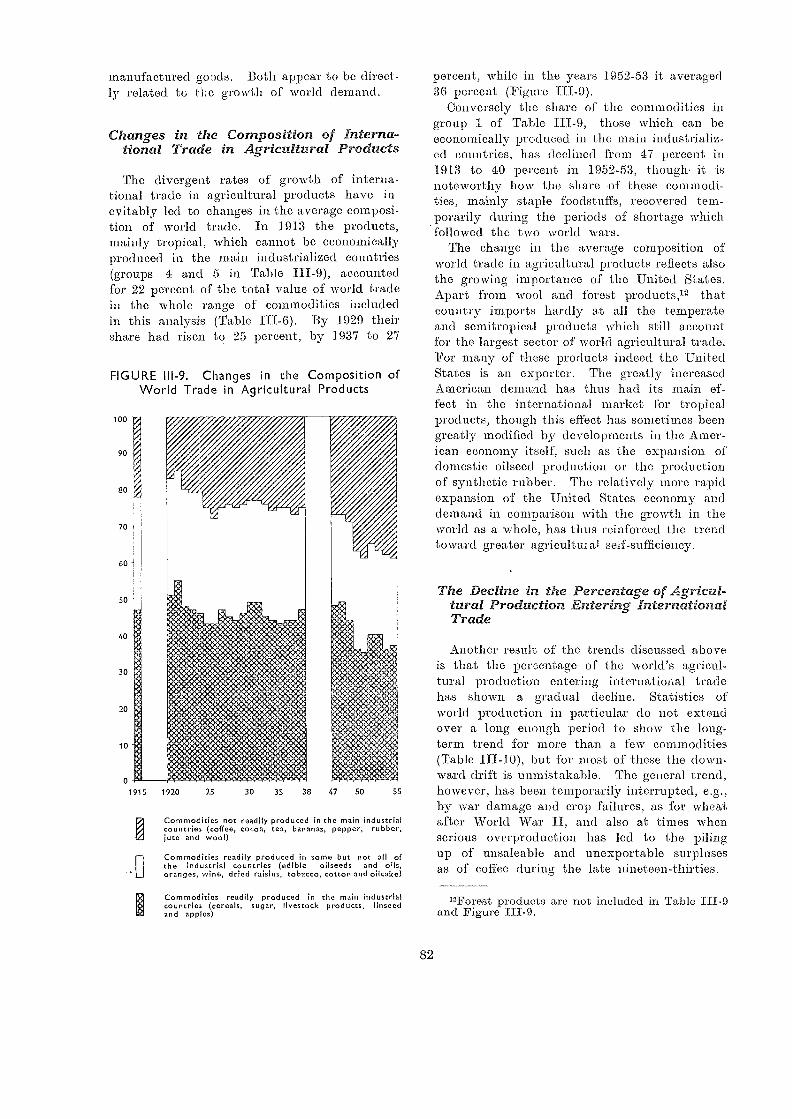
manufactured goods. Both appear to be direct-ly related to tle growth of world demand.
Changes in the Conzposition of Interna-tional Trade in Agricultural Products
The divergent rates of growth of interna-tional trade in agricultural products have in-evitably led to changes in the average composi-tion of world trade. In 1913 the products,mainly tropical, which cannot be economicallyproduced in the main industrialized countries(groups 4 and 5 in Table III-9), accountedfor 22 percent of the total value of world tradein the whole range of commodities includedin this analysis (Table III-6). By 1929 theirshare had risen to 25 percent, by 1937 to 27
FIGURE III-9. Changes in the Connposition ofWorld Trade in Agricultural Products
N
Oti0:4
Commodities not readily produced in the main industrialcountries (coffee, cocoa, tea, bananas, pepper, rubber,jute and wool)
Commodities readily produced in some but not all ofche industrial countries (edible oilseeds and oqs,oranges, wine, dried raisins, tobacco, cotton and oilcake)
Commodities readily produced in the main industrialcountries (cereals, sugar, livestock products, linseedand apples)
82
percent, while in the years 1952-53 it averaged36 percent (Figure III-9).
Conversely the share of the commodities ingroup 1 of Table III-9, those which can beeconomically produced in the main industrializ-ed countries, has declined from 47 percent sill1913 to 40 percent in 1952-53, though- it isnoteworthy how the share of these commodi-ties, mainly staple foodstuff's, recovered .tem-porarily during the periods of shortage which
'followed the two world wars.The change in the average composition of
world trade in agricultural products reflects alsothe growing importance of the 'United States.Apart from wool and forest products,1-2 thatcountry im.ports hardly at all the temperateand semitropical products which still accountfor the largest sector of world agricultural trade.For many of these products indeed the UnitedStates is an exporter. The greatly increasedAmerican demand has thus had its main ef-fect in the international market for tropicalproducts, though this effect has sometimes beengreatly .modified by developments in the Amer-ican economy itself, such as the expansion ofdomestic oilseed production or the productionof synthetic rubber. The relatively more rapidexpansion of the United States economy anddemand in comparison with the growth in theworld as a 'whole, has thus reinforced the trendtoward greater agricultmal seif-sufficiency.
The Decline in the Percentage of Agricul-tural Production Eniering InternationalTrade
Another result of the trends discussed abovei.s that the percentage of the world's agricul-tural production entering international tradehas sh.own a gradual decline. Statistics ofworld production in particular do not extendover a long enough period to show the long-term trend for more than a few commodities(Table III-10), but for most of these the down-ward drift is unmistakable. The general trend,however, has been temporarilY interrupted, e.g.,by war damage and crop failures, as for wheatafter World War II. and also at times whenserious overproduction has led to the pilingup of unsaleable and unexportable surplusesas of coffee during the late nineteen-thirties.
"Forest products are not included in Table 111-9and Figure III-9.
1915 1920 25 30 35 38 47 50 55
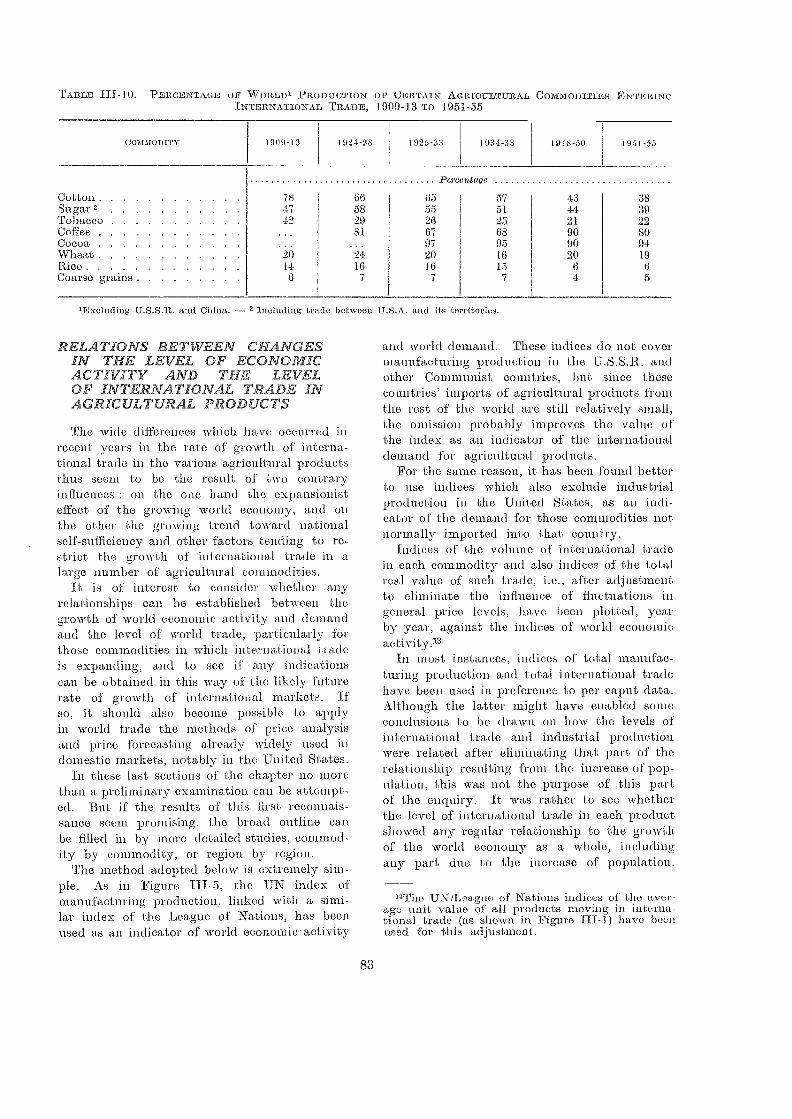
TABLE IH-10. PERCENTAGE Or WORLD' PRODUCTION OP CERTAIN AGRICULTURAL COMMODITIES INTERINOINTERNATIONAL TRADE, 1909-13 TO 1951-55
RELATIONS BETWEEN CFIANGESIN THE LEVEL OF;ECONOMICACTIV. 'a TY AND THE LE, V ELOF INTERNAT ION AL TR AD.42: INAGRICULTURAL PRODUCTS
The vide differenceo which have occurred inrecent years in the rate of growth of interna-tional trade in the various agricultural productsthus seem to be the result of two contraryinfluences on the one hand the expansionisteffect of the growing world economy, and onthe other the growing trend toward nationalself-sufficiency and other 'factors tending to re-strict the growth of international trade in alarge number of agricultural commodities.
It is of interest to consider -whether anyrelationships can be established between thegrowth of world economic activity and demandand the level of -world trade,, particularly forthose commodities in which international tradeis expanding, and to see if any indicationscan be obtained in this way of the likely futurerate of growth of international markets. Ifso, it should also become possible to applyin world trade the methods of price analysisand price forecasting already widely used indomestic markets, notably in the United States.
In these last sections of the chapter no morethan a preliminary examination can be attempt-ed. But if the results of this first reconnais-sance seem promising, the broad outline canbe filled in by more detailed studies, commod-ity by commodity, or region by region.
The method adopted below is extremely sim-ple. As in Figure 111-5, the UN index ofmanufacturing -production, linked with a simi-lar index of the League of Nations, has beenused as an indicator of world CC01101111C activity
83
'Excluding U.S.S.R. [tail China. -- 2 Including, trade betwoeu U.S.A. and Its torritorie.
and world demand. These indices do not covermanufacturing production in the 'U.S.S.R. amiother Communist countries, but since thesecountries' imports of agricultural products fromthe rest of the world are still relatively small,the omission probably improves the value ofthe index as an indicator of the internationaldemand for agricultural products.
For the same ieason, it has been found betterto use indices which also exclude industrialproduction in the 'United States, as an indi-cator of the demand for those commodities notnormally imported into that country.
Indices of the volume of international tradeha each commodity and also indices of the totalreal value of such trade, i.e., after adj-ustmentto eliminate the influence of fluctuations ingeneral price levels, have been plotted, yearby year, against the indices of -world economicactivity»
In most instances, indices of total manufac-turing production and total international tradehave been used in preference to per caput data.Although the latter might have, enabled someconclusions to be drawn on 'how the levels ofinternational trade and industrial productionWere related after eliminating that part of therelationship resulting from the increase of pop-ulation, this was not the purpose of this partof the enquiry. It was rather to se,e whetherthe level of international trade in each productshowed any regular relationship to the growthof the world economy as a whole, includingany part due to the increase of population.
"The UN/League of Nations indices of the aver-age unit value of all products moving in interna-tional trade (as shown in Figure III-1) have beenused for this adjustment.
COMMODITY 1909-13 1924-28 1925-33 1934-38 1948-50 1951-55
Percentage
Cotton 78 66 65 57 43 38Sugar 2 47 58 55 51 44 39Tobacco 42 29 26 25 21 22Coffee . . SI 67 68 90 80Cocoa,Wheat 20
. .
949720
9516
9020
9419
Rice 14 16 16 15 6 oCoarse grains o 7 7 7 4 5
Nevertheless, for a number of commodities wherecomparisons were made using per caput datathe same general conclusions emerged.
As a, rule, the clearest relationships wereobtained between the indicator of demand andthe real value of international trade, thoughin some :instances a closer relation was foundwith the volume of trade. This appears todepend mainly on the price elasticity of theparticular products, but partly also on theelasticity of the supply available for export.The pi oduction of some commodities, notablyannual crops, can be varied fairly rapidly inaccordance with changes in demand, 'while forother commodities, including tree crops andsoine livestock products, the time lag in produc-tion is considerable, so that the current supplytends to reflect the demand some years earlier.Again, for some commodities the quantity ex-ported can be adjusted to short-term fluctua-tions in dernand by storage, by changes indomestic prices and consumption in the export-ing countries, or where production is not essen-tially seasonal, as for rubber, tea or beef, byadjusting th.e level of harvesting or market-ing. For other commodities no such adjust-ment of supplies is possible, because of theirperishability, of a lack of resources or of facil-ities for storage on the part of the exporters,or because of the small size of the domesticmarket in exporting countries. In such casesthere is a correspondingly greater fluctuationof world prices for the same degree of priceelasticity.
Yet another factor is the end use of theparticular commodity. For example, since rub-ber tires account for only a small part of thetotal cost of automobiles and since jute pack-ing material is norm.ally inexpensive comparedwith the valu.e of the goods it protects, theconsumption of these raw materials appears inthe short run to be relatively unaffected byprice changes. The volume rather than thevalue of trade thus tends to show the closerrelationship with the level of industrial activity.
Commodities Showing a Marked Expan-sion of Trade
Cocoa. Cocoa, as the commodity showingthe greatest postwar expansion in the real valueof international trade, may be taken as a firstexample. There was a rather steady rise inthe volume of trade in cocoa throughout the
84
interwar period (Figure III-7), and this risingtrend is apparent also in Figure III-10A, whereindices of the volume of world trade are plot-ted against indices of world manufacturing pro-duction. The break in the curve between 1930and 1932 reflects the sh.arp decline in manufac-turing production during the depression, vhilethe volume of' world trade in cocoa continuedto rise.
After World 'War II there was little furtherincrease in the volume of world trade in cocoa,but the growth of world demand was reflectedin a sharp rise in prices. In consequence thereal value of world trade continued to bearabout the same relation to the index of worldmanufacturing activity as before the war (Fig-ure III-10B). The points from 1920 to 1955group themselves fairly closely about the sameregression line, and the fit is still closer ifmoving two-year averages are used instead ofdata for single calendar years, in order to'minimize the effect of inventory changes. De-viations from the regression line can be shownto be due mainly to changes in per caput sup-plies, and by such means an average worldprice has been calculated year by year whichagrees rather closely with the actual level.
Coffee. Similar comparisons of the 'volumeand real value of world trade in coffee withthe index of world manufacturing productionare shown in Figure III-11A and 11B. Thedata in this instance are shown on a per eaputbasis, but charts based on total rather thanper caput figures show closely similar relation-ships.
The growth in the volume of trade in coffeebetween the wars was slower than for cocoa,and on a per caput basis rose by only 13 per-cent from 1920-22 to 1935-38, compared with30 percent ftir cocoa. Since World War IIthe per caput volume of trade has shown noexpansion. The chart relating the per caputvolume of world trade with per caput worldmanufacturing production thus shows littletrend up or down.
As with cocoa, however, the growth of worlddemand since World War II has been reflect-ed in a marked increase in the real price asidhence the total value of trade. A fairly regularrelation is apparent between indices of the percaput real value of trade and per caput worldmanufacturing production from 1920 to 1930,and, again, (though at a lower level) afterWorld War II. From 1931 to 1933 the value
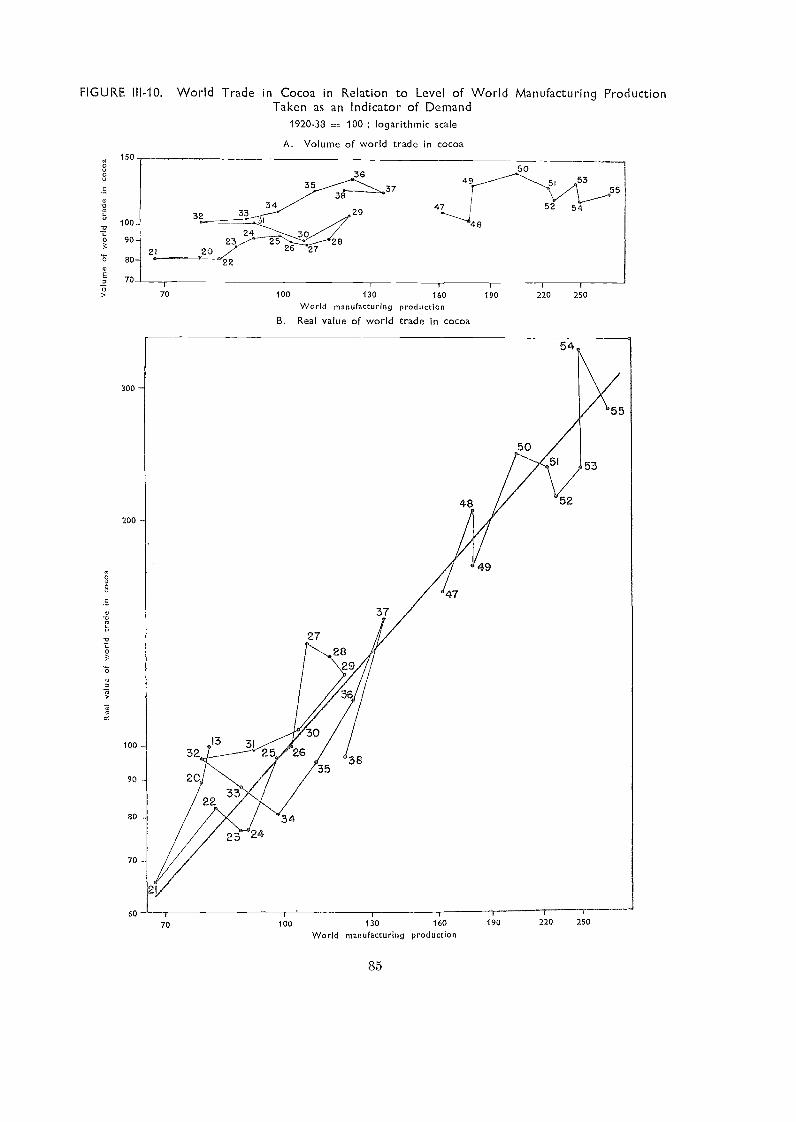
FIGURE III-10. World Trade in Cocoa in Relation to Level of World Manufacturing ProductionTaken as an Indicator of Demand
1920-38 100 ; logarithmic scale
150
100
9
BO-
70
60
';0
70
A. Volume of world trade in cocoa
100 130 160 12 10 220 250
World manufacturing production
B. Real value of world trade in cocoa
36
100 130 160
World manufacturing production
85
504 51 53
52 5 4
46
190 220 2'50
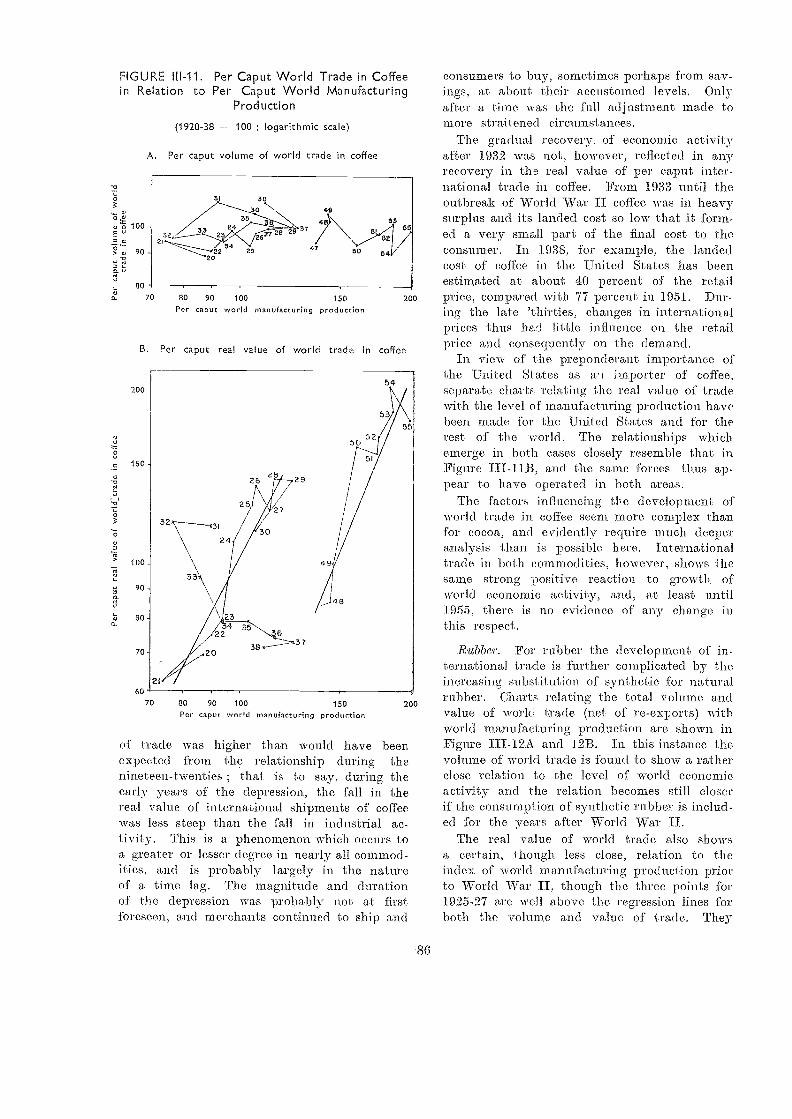
FIGURE III-11. Per Caput World Trade in Coffeein Relation to Per Caput World Manufacturing
Prod uction
(1920-38 100 ; logarithmic scale)
A. Per caput volume of world trade in coffee
of trade was higher than would have beenexpected from the relationship during thenineteen-twenties ; that is to say, during theearly years of the depression, the fall in thereal value of international shipments of coffeevas less steep than the fall in industrial ac-tivity. This is a phenomenon which occurs toa greater or lesser degree in nearly all commod-ities, and is probably largely in the natureof a time lag. The magnitude and durationof the depression was probably not at firstforeseen, and merchants continued to ship and
86
consumers to buy, sometimes perhaps .from sav-ings, at about, their accustomed levels. Onlyafter a time wa,s the full adjustment made, tomore straitened circumstances.
The gradual recovery of e,conomic activityafter 1932 vas not, howeve,r, reflected in anyrecovery in the real value of per caput inter-national trade in coffee. From 1933 until theoutbreak of World War II coffee WaS in heavysurplus and its landed cost SO low that it form-ed a very small part of the final cost to theconsumer. In 1938, for example, the landedcost of coffee in the United States has beenestimated at about 40 percent of the retailprice, compared with 77 percent in 1951. Dur-ing the late 'thirties, changes in internationalprices thus had little influence on the retailprice and consequently on the dema,nel.
In view of the preponderant importance ofthe United States as a', importer of coffee,separate charts relating the real value of-tradewith the level of manufacturing production havebeen ¡nade .for the United States and for therest of the world. The relationships whichemerge in 'both cases closely resemble that inFigure III-11B, and the same forces thus ap-pear to have operated in both areas.
The factors influencing the development ofworld trade in coffee seem more, complex thanfor cocoa, and evidently require much deeperanalysis than is possible here. Internationaltrade in both commodities, however, shows thesame strong positive reaction to growth ofworld economic activity, and, at least until1955, there is no evide,nce of any change inthis respect.
Rubber. For rubber the development of in-ternational trade is further complicated by theincreasing substitution of synthetic for naturalrubber. Charts relating the total volume and.value of world trade (net of re-exports) withworld manufacturing production are shown inFigure III-12A and 12B. In this instance thevolume of world trade is found to show a ratherclose relation to the level of world economicactivity and the relation becomes still closerif the consumption of synthetic rubber is includ-ed for the years after World War II.
The real value of world trade also showsa certain, though less close, relation to theindex of world manufacturing production priorto World War II, though the three points for1925-27 are well above the regression lines forboth the volume and value of trade. They
20070 80 90 100 150Per caput world manufacturing production
B. Per caput real value of world trade in coffee
200
70 80 90 100 150Per caput world manufacturing production
200
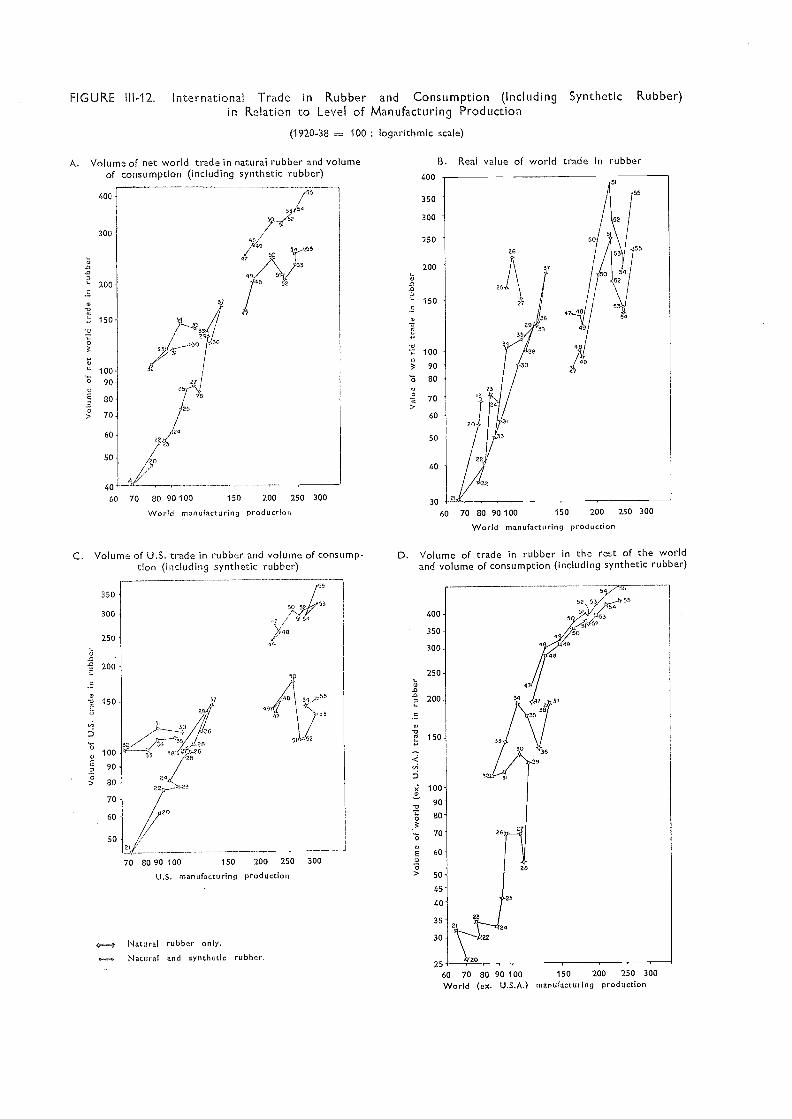
FIGURE III-12. International Trade in Rubber and Consumption (Including Synthetic Rubber)in Relation to Level of Manufacturing Production
A. Volume of net world trade in natural rubber and volumeof consumption (including synthetic rubber)
40C
300
150
o
100.6 90
80o> 70
60
50
C. Volume of U.S. trade in rubber and volume of consump-tion (including synthetic rubber)
350
300
250
200E
70
60
50
40
60 70 BO 90 100 150 200 250 300
World manufacturing production
"(3100 381
9024
> 80
20
23
68
6
37
Natural rubber only.Natural and synthetic rubber.
(1920-38 100 ; logarithmic scale)
55
70 80 90 100 150 200 250 300
U.S. manufacturing production
400
350
300
250
200
i" 150.F.
-o
-07 100o
90
.13 80o
70
D. Volume of trade in rubber in the rest of the worldand volume of consumption (including synthetic rubber)
.0
60
50
40
30
X 100
90
80
70
B. Real value of world trade in rubber
World manufacturing production
25
60 70 80 90 100 150 200 250 300
World (ex. U.S.A.) manufacturing production
200 250 30015060 70 80 90 100
correspond to the period of the Stevenson rub-ber restriction scheme. After World War IIthe real value of international trade in rubberfell to a much lower level than before, relativeto world economic activity, though with somerecovery at the time of the Korean boom.This decline reflected mainly a fall in the realprice of rubber. It cannot be fully accountedfor by the growing consumption of syntheticrubber, at least if this is valued at the sameprice as natural rubber.
Separate charts have been drawn for theUnited States and for the rest of the world(Figure III-12C and 12D), comparing the volumeof imports with the level of industrial activity.The mud:, greater share of synthetic rubber inUnited States consumption is clearly evident.It may be noted also that in the rest of the.world there has been no marked break in therelation between net impofts of rubber (espe-cially if the consumption of synthetic rubberis added) and the level of manufacturing activ-ities. The data for the United States, whichhave been adjusted for stockpiling, give someindication, however, of a lower level of rubberconsumption in relation to th.e level of manu-facturing activities from 1951 to 1954, thoughthe earlier relation was restored in 1955 whenthere -was a record production of automobiles.If the indications of a relative decline in rub-ber consumption are borne out, for example,because of economies in the use of rubber andperhaps also a decline in the share of auto-mobile,s in total United States nfanufacturingproduction, the implications would be of con-siderable importance in evaluating future pros-pects for rubber. This appears to be anotherfield where a more detailed analysis may prove'fruitful.
Forest Products. Forest products compriseanother group of commodities for which inter-national trade is expanding rapidly (FigureIII-13). For example, :both the volume (Fig-ure 13A) and value of world trade in Sawnsoftwood showed a marked rising trend, ratherclosely related to the growth of world indus-trial activity, during the first part of the inter-war period. The -volume of trade shifted, how-ever, to a lower relative level after 1934 andagain after World War II. Moreover, th.e re-sponse to an increase in economic activity wasapparently less than before, primarily becauserequirements .have been increasingly met byhigher domestic production in many of the
88
traditional sawnwood importing countries, butalso because of th.e increasing use of substitutematerials, e.g., steel :in building. Because ofan increase of sorne 50 percent in average realprices of sawn softwood (Table III-4), the de-cline after World War II in the real value ofworld .trad.e, relative to the level of industrialactivity, has been considerably less than therelative fall in volume.
Figure III-13B shows the volume of inter-national trade in mechanical and chemical wood-pulp, taken together, in relation to the levelof world manufacturing production. Here, too,a fairly regular relation is apparent. SinceWorld War II there has been, as for sawnsoftwood, a marked decline in the volume oftrade, relative to world economic activity, butthis has been largely compensated by increasesin real prices of some 30 to 50 percent compar-ed with the interwar years (Table III-4). Therelative value of trade has therefore contin-ued much as before the war, except for theperiod of exceptionally high prices during theKorean boom.
The relative decline in the volume of tradesince World W. II may be explained by theincreased concentration on integrated pulp andpaper plants producing ne-wsprint and paperfor export, rather than wood pu.lp. In conse-quence, the proportion of wood pulp movingin international trade declined from about 29percent of world production in the years follow-ing World War I to 17 percent in 1948-50.Even so, the volume of international trade inwood pulp is 110W some three times greaterthan in 1950, chiefly because of the growth oftrade in chemical wood pulp.
International trade in newsprint (Figure [II-13C and I.3D) has thus increased even morerapidly than trade in wood pulp. The bulkof the expansion in world newsprint capacityhas been concentrated in Canada and NorthernEurope, where, raw materials are available, andthe greater part of the increased world deinandhas been met through international trade. Thegrowth in the volu.me of Canadian exports ofnewsprint to the United States, which increas-ed nearly eight times from. 1920-21 to 1955,has been particularly great. Unlike those ofsa-wn softwodd and wood pulp, real pu-ices ofnewsprint on world markets have not changedgreatly since the interwar period, th.at, is tosay, they have risen at about the same rateas prices generally. Both the volume and realvalue of world trade in newsprint thus show
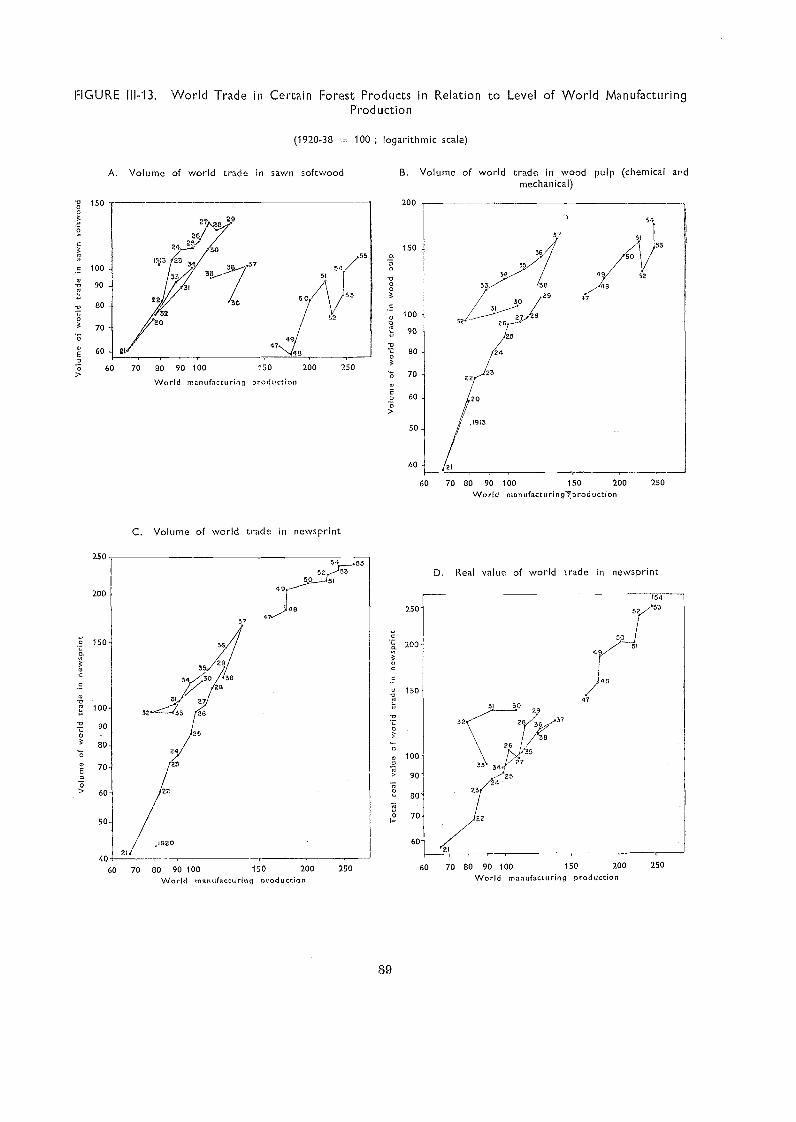
FIGURE III-13. World Trade in Certain Forest Products in Relation to Level of World ManufacturingProduction
(1920-38 100 ; logarithmic scale)
A. Volume of world trade in sawn softwood B. Volume of world trade in wood pulp (chemical andmechanical)
-ra 150 200oo4 ,
'9:
I.5 100
aiso.
9
-cl 80 .5.t2 1003 70
oó48 90
E 60 21 1: 80o
-5 60 70 80 90 100 150 200 250`6 70
World manufacturing production60
o
o
40
'
250
200
90
o60
0
40
C. Volume of world trade in newsprint
80 90 100 150 200 250
World manufacturing production
89
.1919
55
34 49
3 38 4829
150
D. Real value of world trade in newsprint
60 70 80 90 100 150 200
World manufacturing production250
25060 70 80 90 100 150 200
World manufacturing7production
7060
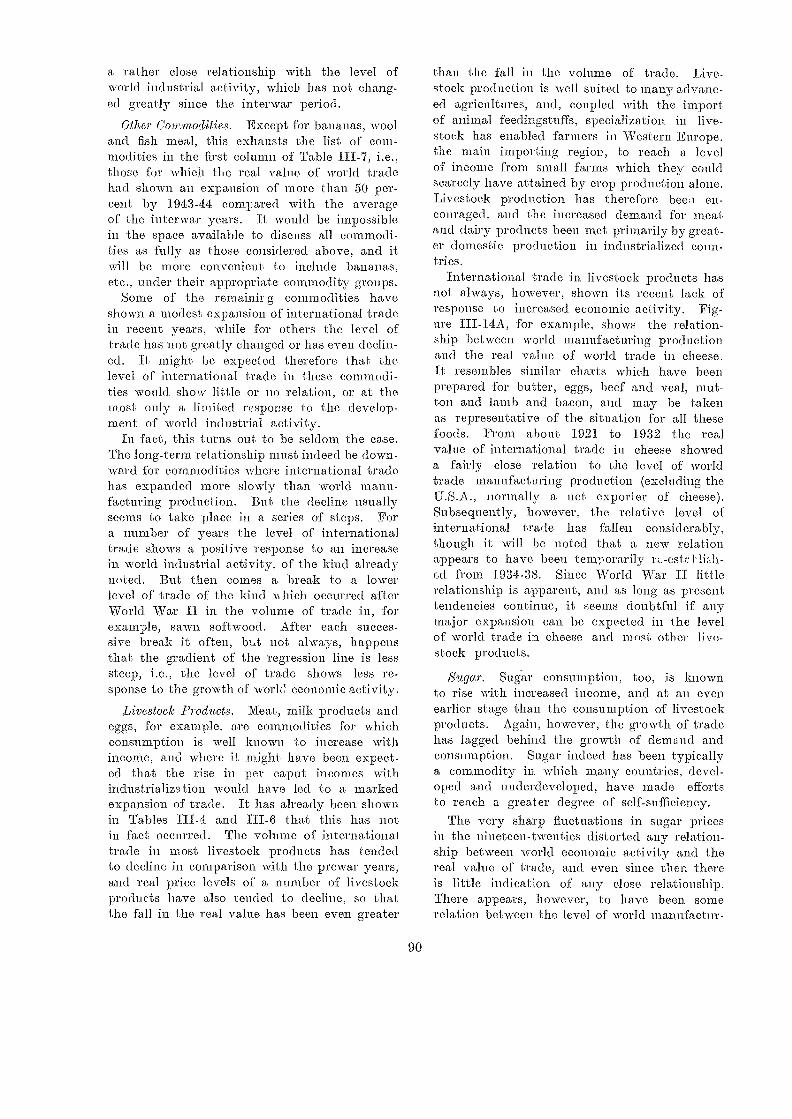
a rather close relationship with the level ofworld industrial activity, which has not chang-e,d greatly since the interwar period.
Other Corrrmodities. Except for bananas, wooland fish meal, this exhausts the list of com-modities in the first column of Table 111-7, i.e.,those for which the real value of world tradehad shown an expansion of more than 50 per-cent by 1943-44 compared with the averageof the interwar years. It would be impossiblein the space available to discuss all commodi-ties as fully as those considered above, and itwill be more convenient to include bananas,etc., under their appropriate commodity groups.
Some of the remainit g conimodities haveshown a modest expansion of international trade,in recent years, while for others the level oftrade has not greatly changed or has even declin-ed. It might be expected therefore that thelevel of international trade in these commodi-ties would show little 017 no relation, or at themost only a limited response to the develop-ment of world industrial activity..
In fact, this turns out to be seldom the case.The long-term relationship must indeed be down-ward for commodities where international tradehas expanded more slowly than world manu-fa,cturing production. But the decline usuallyseems Lo take place in a series of steps. Fora number of years the level of internationaltrade shows a positive response to an increasein world industrial a,ctivity, of the kind alreadynoted. But then comes a break to a lowerlevel of trade of the kind which occurred afterWorld War IT in the volume of trade in, forexample, sawn softwood. After each succes-sive break it often, blit not always, happensthat the gradient of the regression line is lesssteep, i.e., the level of trade shows less re-sponse to the growth of workl economic acti.vity.
Livestock Products. Meat, milk products andeggs, for example, are commodities for whichconsumption is well known to increase withincoMe, and where it might have been expect-ed that the rise in per caput incomes withindustrialization would have led to a markedexpansion of trade. It has already been shownin Tables III-4 and 111-6 that this has notin fact occurred. The volume of internationaltrade in most livestock products has tendedto decline in comparison with the prewar years,and real price levels of a number of livestockproducts have also tended to decline, so thatthe fall in the real valu.e has been even greater
90
than the fall in the volume of trade. Live-stock production is well suited to many advanc-ed agricultures, and, coupled with the importof animal feedingstuffs, specialization in live-stock has enabled farmers in Ilrestern Europe,the main importing region, to reach a levelof income from small farms which they couldscarcely have attained by crop production alone.Livestock production has therefore been en-couraged, and the increased demand for meatand dairy products been met primarily by great-er domestic production in industrialized coun-tries.
International trade in livestock products hasnot always, however, shown its recent lack ofresponse to increased economic activity. Fig-ure III-14A, for example, shows the relation-ship *between world manufacturing productionaun the real value of world trade in cheese.It resembles similar ch.arts which have beenprepared for butter, eggs, beef and veal, mut-ton and lamb and bacon, and may be takenas representative of the situ.ation for all thesefoods. From about 1921 to 1932 the realvalue of international trade in cheese showeda fairly close, relation to the level of worldtrade manufacturing production (excluding theU.S.A., normally a net exporter of cheese).Subsequently, however, the relative level ofinternational trade has fallen considerably,though_ it will 'be noted that a new relationappears to have been teim)orarilyed. from 1934-38. Since World War II littlerelationship is a,pparent, and as long as presenttendencies continue, it seems doubtful if anymajor expansion can be expected in Use levelof world tra,de in cheese and m.(,st, other live-stock products.
Sugar. Sugar consumption, too, is knoivnto rise with increased income, and at an evenearlier stage than the consumption of livestockproducts. Again, however, the growth of tradehas lagged behind the growth of demand andconsumption. Sugar indeed has been typicallya commodity in which many countries, devel-oped and underdeveloped, have made effortsto reach a greater degree of self-sufficiency.
The very sharp fluctuations in sugar pricesin the nineteen-twenties distorted any relation-ship between world economic activity and thereal value, of trade, and even since then thereis little indication of' any close relationship.There appears, however, to have been somerelation between the level of world manufactur-
FIGURE III-14. VVorld Trade in Cheese, Sugar and Certain Fruits in Relation to Level of WorldManufacturing Production
(1920-38 -0 100 ; logarithmic scale)
V
.E
f! 100
90o
80
70
62.1
C. Real value of world trade in edible oils and oilseeds
200
A. Real value of world trade in cheese
.20
2
1913
60 --r-60 70 80 90 100
.9. o52
'101'S
o
'5 1 OC :34
90no
ro 8025
60 2a1'7
47
World manufacturing production
E. Real value of world trade in bananas
4
7
7
70 80 90 100 150 200
World manufacturing production
52
o
150 200 250 300
48
"
91
.E
6-0E 100
Z 90o
80o
o
150
90
BO
o
70 -
60
6' 50
o
701915
40
B. Volume of world trade in sugar
2.0
D. Real value of world trade in apples
49
60 70 80 90 100 150 200 250 300
World manufacturing production
F. Volume of world trade in oranges
53r-
71, 70o
60
29
250 300 60 70 80 90 100 150 200 250 380
World (ex. U.S.A.) manufacturing production
60 70 80 90 100 150 200 250 300
VVorld (ex. U.S.A.) manufacturing production
60 70 80 90 100 150 200 250 300
VVorld manufacturing production
ing production and the volume of internationaltracio during the decade from 1921 (FigureIII-14B). Since 1933 both the total and percaput volume of international trade have showna much more limited, though fairly regular,response to the growth. of economic activity.More detailed analysis would be needed toshow how far the slower growth. of trade insugar (as also of livestock products) since thenineteen-thirties has been du.e to the slowgrowth of consumption and how far to increas-ed domestic production in importing countries.There are as ye,t, however, no indications ofany marked change in recent trends.
Vegetable Oils and Oilseeds. The main ediblevegetable, oils and oilseeds14 have been group-ed in view of the large element of interchange-ability wit hin this group, and the aggregatereal value of international trade in these prod-ucts is charted in relation to world manu-facturing production in Figure III-140.
Th.e pattern -which emerges is of a fairlyregular relationship with the level of 'worldmanufacturing production from 1920 to 1930Or 1931 ; a delayed reaction to the decline ine,conomic activity during the depression, anda re-establishment of a new relationship from1934 to 1938. After World War II there wasa further downward shift in the level of worldtrade in relation to world economic activity,though no great change in the slope of theregression line until 1952. Since that year, therelative level of trade has been lower thanbefore, and there are indications of a 11CW rea-t ion with a smaller response to the growth ofindustrial activity. It is likely that more de-tailed analysis could establish ho-w far thesesuccessive declines have resulted from suchfactors as the greatly increased domestic pro-duction of soya and groundnut oil in the UnitedStates and the great expansion of detergentsat the expense of soap.
Of the nonedible oils, data are available onlyfor linseed and linseed oil. There was a con-stant relation between the real value of worldtrade and the level of world manufacturingproduction from 1920 to 1929. Since then,however, the relative level of international tradehas declined in a series of steps to only a frac-tion of its former value.
"Coconut, groundnut, soybean, palm kernel, palmoil and olivo oil together with the correspondingoilseeds.
92
Fruit and Fruit Products. There have beenmarked differences in the development of in-ternational trade within this group of commod-ities. For example, time real value of inter-national trade in bananas has shown an expan-sion, comparable to those for coffee and cocoa,(except during the nineteen-thirties) and closelyrelated to the level of world economic activity.As with the two latter commodities, the volumeof trade has grown rather slowly since WorldWar H, and the increased -world demand hasshown itself mainly in a level of real pricessome 50 to 60 percent above the interwaraverage (Figure III-14E).
The real value of international trade in oran-ges has grown more slowly and shows a lessconstant relation to the level of world econom-ic activity, OVCn excluding the United Statesas an exporte,r of oranges. Curiously enough,.however, there appears to be a rather constantrelation between the volume of trade and theindicator of demand from 1921 to 1955, exceptfor the period of the depression and the SpanishCivil War (Figure III-14F). The real price oforan.ges since World War II has been some20 to 25 percent below the average of theinterwar period, and the real value of worldtrade has therefore lagged behind the growthin tlie Arolume of trade.
Apples, dried raisins and wine were also in-cluded in the analysis. For apples, recent de-velopments in international trade have some-what resembled those for cheese and otherlivestock products. The period during whichthe real value of trade increased in line withthe growth of world industrial production cameto an end with the depression of 1930. Inter-national trade in apples did not at once decline,but from 1936 onwards, and especially sinceWorld -War II, the volume, and still more,the real value of international trade, have beenmuch lower than before in relation to the levelof world economic activity.
The development of international trade indried raisins has been generally similar to thatof apples. The volume of international tradehas been fairly well maintained since WorldWar II, but the fall in real prices has beensomewhat greater than for apples, so that therehas been little expansion in total value. This.is true also of international trade in wine,where a postwar increase in the volume ofinternational trade has been largely offset bythe fall in real prices. Over-all figures of world
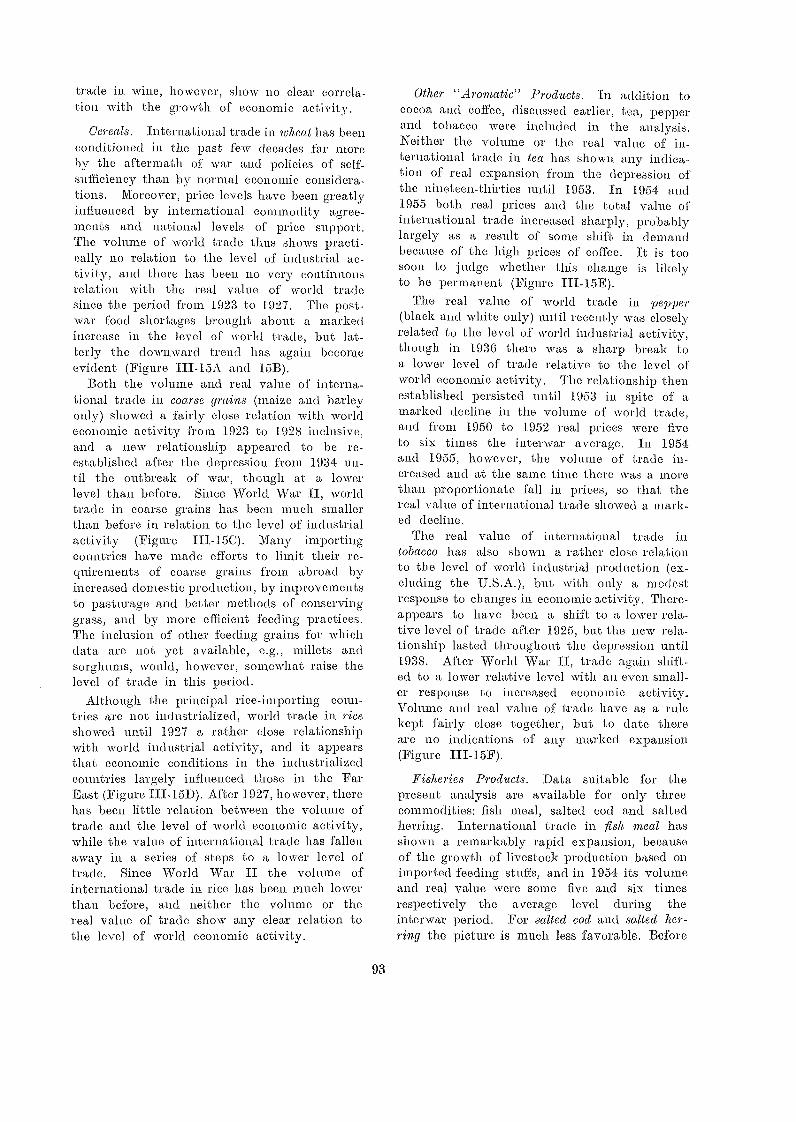
trade in wine, however, show no clear correla-tion with the growth of economic activity.
Cereals. International trade in wheat has beenconditioned in the past few decades far moreby the aftermath of war and policies of self-sufficiency than by normal economic considera-tions. Moreover, price levels have been greatlyinfluenced by international commodity agree-ments and national levels of price support.The volume of world trade thus shows practi-cally no relation to the level of industrial ac-tivity, and there has been no very continuousrelation with the, real value of lvorld tradesince the period from 1923 to 1927. The post-war food shortages brought about a markedincrease in the level of world trade, but lat-terly the downward trend has again becomeevident (Figure III-15A and 15B).
Both the volume, and real value of interna-tional trade in coarse grains (maize and barleyonly) showed a fairly close relation with worldeconomic activity from 1923 to 1928 inclusive,and a new relationship appeared to be re-established after the depression from 1934 un-til the outbreak of war, though at a lowerlevel than before. Since, World War II, -worldtrade in coarse grains has been much smallerthan before in relation to the level of industrialactivity (Figure II1-15C). -Many importingcountries have made efforts to limit their re-quirements of coarse grains from abroad byincreased domestie production, by improvementsto pasturage and better methods of conservinggrass, and by more efficient feeding practices.The inclusion of other feeding grains for which.data are not yet available, e.g., millets andsorghums, would, however, somewhat raise thelevel of trade in this period.
Although the principal rice-importing coun-tries are not industrialized, world trade in riceshowed until 1927 a rather close relationshipwith world industrial activity, an.d it appearsthat economic conditions in the industrializedcountries largely influenced those in the FarEast (Figure III-15D). After 1927, however, therehas been little relation between the volume oftrade and the level of world economic activity,while the value of international trade has fallenaway in a series of steps to a lower level oftrade. Since World War II the volume ofinternational trade in rice has been much lower.than before, and neither the volume or thereal value of trade show any clear relation tothe level of world economic activity.
93
Other "Aromatic" Products. In addition tococoa and coffee, discussed earlier, tea, pepperand tobacco were included in the analysis.Neither the volume or the real value of in-ternational trade in tea has shown any indica-tina of real expansion from the depression ofthe nineteen-thirties until 1953. In 1954 and1955 both real prices and the total value ofinternational trade increased sharply, probablylargely as a result of some shift in demandbecause of the high prices of coffee, It is toosoon to judge whether this change is likelyto be permanent (Figure III-15E).
The real value of world trade in pepper(black and white only) until recently MS closelyrelated to the level of world industrial activity,though in 1936 there was a sharp break toa lower level of trade relative to tire level ofworld economic activity. The relationship thenestablished persisted .until 1953 in spite of amarked decline in the volume of world trad.e,and ftom 1950 to 1952 real prices were fiveto six times the interwar average. In 1954and 1955, however, the volume of trade in-creased and at the same time there was a morethan proportionate fall in prices, so that thereal value of international trade showed a mark-ed decline.
The real value of .international trade intobacco has also shown a rather close relationto the level of world industrial production (ex-cluding the U.S.A.), but with only a modestresponse to changes in economic activity. There-appears to have been a shift to a lower rela-tive level of trade after 1925, but th.e IleW rela-tionship lasted throughout the depression .until1938. After World War II, trade again shift-ed to a lower relative level with an even small-er response to increased economic activity.Volume and real value of trade have as a rulekept fairly close together, but to date thereare no indications of any marked expansion(Figure III-15F).
Fisheries Products. Data suitable for thepresent analysis are available for only threecommodities: fish meal, salted cod and saltedherring. International trade in fish meal hasshown a remarkably rapid expansion, becauseof the growth of livestock production based Onimported feeding stuffs, and in 1954 its volumeand real value were some five and six timesrespectively the average level during theinterwar period. For salted cod and salted her-ring the picture is much less favorable. Before
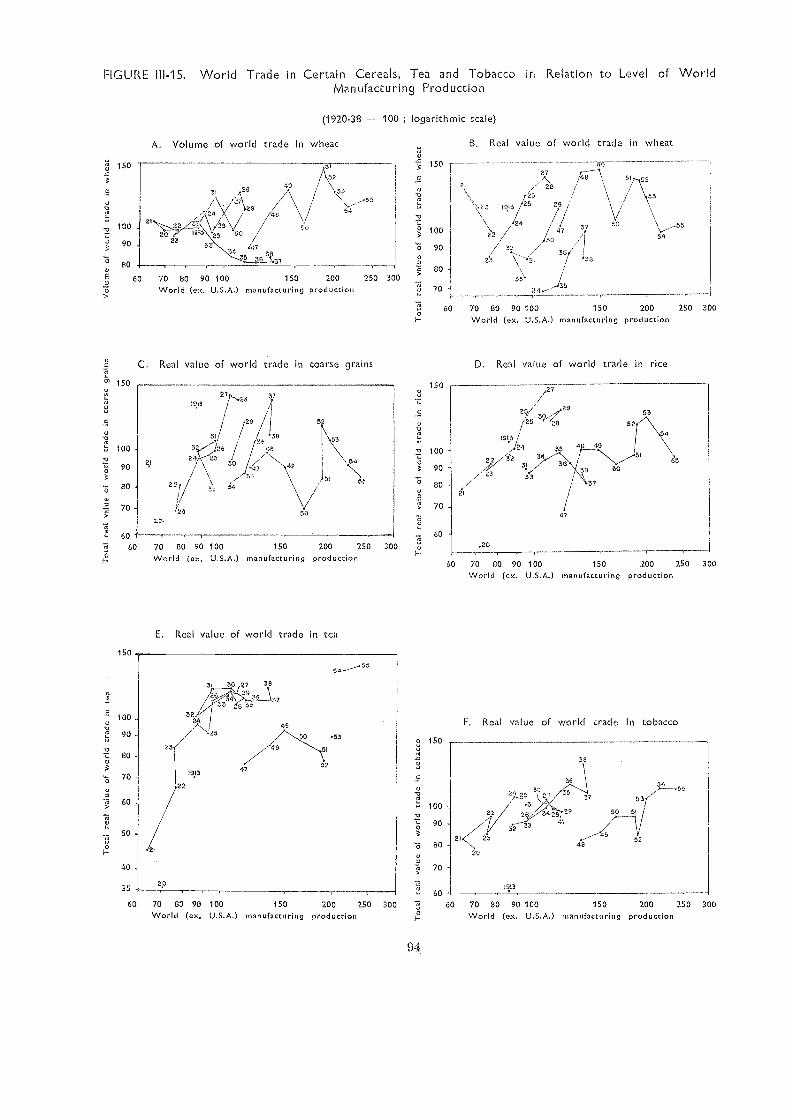
FIGURE III-15. World Trade in Certain Cereals, Tea and Tobacco in Relation to Level of WorldManufacturing Production
(1920-38 100 ; logarithmic scale)
41
c' 150
o
-o
g 100
"O.90
80
° o
14?. 60
o
A. Volume of world trade in wheat
150
Pla's43 / \
3.1429
E'r
5.4
100
C. Real value of world trade in coarse grains
E. Real value of world trade in tea
z-0 100
90
80
70
o, 150
o
94
150
B. Real value of world trade in wheat
r
60
60 70 80 90 100World (ex. U.S.A.)
D. Real value of world trade in rice
47
53
55
F. Real value of world trade in tobacco
.E
-0
-o
71
7l!".
150
100
90
80 -
70 -
2,1
y
/9.13
24
32
3
27
28
29 /
//
47o
307
37
133
4-1
5, 52
50
53
54
250 300
60 70 80 90 100 150 200 250 300o
World (ex. U.S.A.) manufacturing production
7,3
60
o
60 70 80 90 100 150 200 250 300
World (ex. U.S.A.) manufacturing production
60 70 80 90 100 150World (ex. U.S.A.) manufacturing
200
production
200 250 30060 70 BO 90 100 150
World (ex. U.S.A.) manufacturing production
7.;o
60 70 83 90 100 150 200 250 300
World (ex, U.S.A.) manufacturing production200 250 300
production150
manufacturing
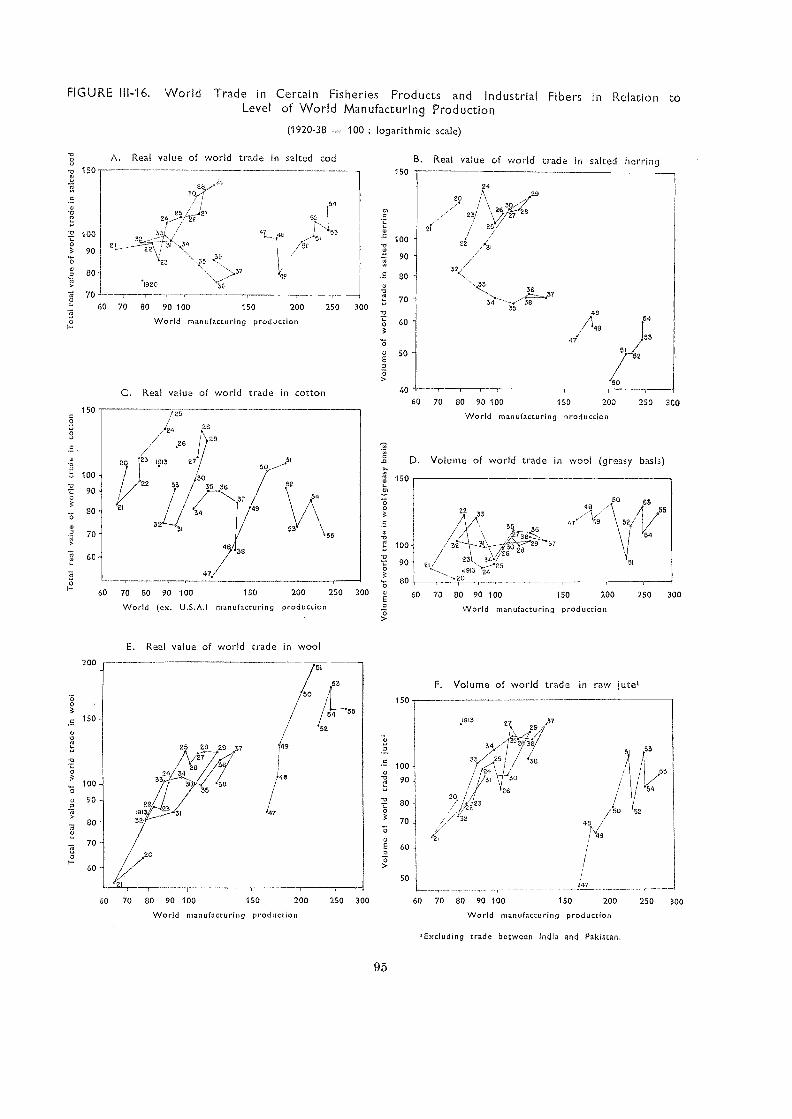
FIGURE III-16. World Trade in Certain Fisheries Products and Industrial Fibers in Relation coLevel of World Manufacturing Production
(1920-38 = 100 ; logarithmic scale)
100O3 90o
150
.E.
b 100
90O
80o
70
6C
o
22
2 2',
30,
24r.--971rè'"?
3332
an
23 43,5
>57
.192C 36
60 70 80 90 100
World manufacturing production
C. Real value of world trade in cotton
150 200
E. Real value of vvorld trade in wool
250 300
95
150
100
90
70 -
50
60 70 80 90 100
F. Volume of world trade in raw jute,
World manufacturing production
D. Volume of world trade in wool (greasy basis)
o
60 70 80 90 100 150 200 250 300 60 70 80 90 100 150 200 250 300
World manufacturing production World manufacturing production
,Excluding trade between India and Pakistan.
A. Real value of world trade in salted cod B. Real value of world trade in salted herring
150 200 250
manufacturing production
30090 100
(ex. U.S.A.)
60 70 80
World60 73 80 90 100 150 200 250 300
World manufacturing production
the depression of the nineteen-thirties interna-tional trade in both commodities showed sometendency to expand with world economic ac-tivity, but from then until 1949-50 there wasa more or less continuous fall in the absolutevolume and real value of international trade.The salted cod trade was diminished chiefly bythe greater self-sufficiency of the Iberian coun-tries, while salted herring suffered particularlyfrom the interruption of trade between Westernand Eastern Europe. Since 1951 there are SOMeindications of a partial recovery of internationaltrade, especially for salted cod (Figure III-16Aand 16B).
Industrial fibers. The volume of interna-tional trade in cotton has tended to declinesince the mid-nineteen-twenties and showslittle relation to the level of world industrialactivity. A similar decline has occurred in thereal value of international trade, and is a goodexample of the tendency of such falls to occurin a series of ste,ps (Figure 111-16C). Thus, astraight line relation is apparent between thereal .value of international trade in cotton andindustrial activity from 1920 to 1925 inclusive,a similar relation was established at a lowerlevel of trade from 1927 to 1933, and a thirdat a still lower level from 1947 to 1951. Be-tween these periods and since 1951 the realvalue of international trade has either fallenor at least remained static in spite of an in-crease in world economic activity.
Closer analysis could probably evaluate therelative importance, in bringing about the de-cline in trade, of such factors as increasedcotton preduction outside the main exportingcountries, the establishment of textile indus-tries in underdeveloped countries, and the in-creased use of rayon and other synthetic fibers.It might also give some indications of -whythe decline took place not continuously, butin a series of three steps. The first shift, forexample, occurred after three years of unu-sually high average prices, and the third afterthe sharp increase in prices during the Koreanboom. Cotton pibes and general economicactivity, however, were both beginning to re-cover from the depression when the second shifttook place in 1933, and in this instance thedecline came first in the volume of trade andonly later in the price level.
The volume of trade in wool has grown slowlyand, as with cocoa, there has been a markedprice response to the relative shortage of sup-
96
plies in relation to world economic activityand demand since World War II. Averagereal prices from 1952 to 1954 were nearly 40percent above the internar average and, ofcourse, much higher still during the Koreanboom. The volume of trade shows very littlerelationship to changes in world economic ac-tivity and in most years since World War IIhas been only 10 to 20 percent greater thanbetween. the \vars. The real value of worldtrade in recent years has been some, 60 percenthigher, and until the Korean boom was fairlyclosely related to the level of world manufactur-ing production. Nevertheless, there are someindications that the factors which have limit-ed world trade in cotton are beginning alsoto operate, in wool, and since World Warthe real value of international trade has beenlower than before in relation to the level ofworld economic activity (Figure III-16D and16E).
Between the wars, both the volume and valueof international trade in raw jute were ratherclosely related to the level of world industrialactivity, except in the years 1925 to 1929 whenthe value of' trade was appreciably higher thanthe usual relationship (Figure III-16F).
Since World War II the level of interna-tional trade (excluding for comparability tradebetween India and Pakistan) has been loweriban be,fore in relation to world industrial ac-tivity. The volume of trade has shown lessj.esponse to increases in world industrial activ-ity, while the real value of trade has showna continuous decline since the, peciod of highprices during the Korean boom. Much of thedecline of -world trade in raw jute is probablyclue to such factors as the increased use ofpaper sacks and the growing move towardthe bulk storage and transport of grain.
GENERAL CONCLUSIONS AND LINESOF FURTHER WORK
The commodity analyses in the previous sec-tion bring out in a striking way the extentto which the depression of the nineteen-thirtiesmarked a turning point in the development ofinternational trade in agricultural products.From 1913 until 1930 world trade in nearlyall the agricultural products discussed showeda rather steady expansion in harmony with thegeneral growth of world economic activity,continuing the comparable growth for some
decades prior to World War i (Figure, III-5).After 1930, however, there was little or nofurther expansion of agricultural trade, exceptin a limited number of tropical products andindustrial raw materials which cannot be readilyproduced in the industrial countries which. pro-vide their main markets.
Thus, from 1913 to 1927-30 the volume ofworld Maim:tactful ng 1»..c.a1uction increased by 40percent (29 percent excluding the U.S.A.), whilethe volume of world trade in agricultural com-modities also increased by 40 percent,Th though.because of the relative 'fall in prices of agri-cultural products the increase in real valuewas only 17 percent.
From., 1927-30 to 1954-55 the growth of worldmanufacturing production was much faster,
ringby 130 percent, or by 106 percent if theUnited States is excluded. But by 1954-55the real value of world trade in agriculturalproducts liad only just regaine,d the 1927-30level, while the volume of agricultural tradeWaS nearly 10 percent less.
It is revealing to compare the developmentof international tracio commodity by commodityin these two periods. From 1913 to 1927-30only tour of the commodities included in theanalysis -failed to show an increase in the realvalue of trade, and many of the largest gainswere made by commodities whose consumptiontends to increase with a rise in income, e.g.,fresh fruit, meat asid dairy products. From1927-30 to 1954-55, on the other hand, rathermore than half the com-m.odities included inthe analy.,;is showed a decline in the real valueof trade, ami the fall was particularly markedfor livestock products and some fruit (TableIII-11).
There, are as yet no indications of any changein the factors, already discussed, which appearto determine recent trends in the developmentof international trade in agricultural products.Apart from any majo' policy change, e.g., ofsurplus disposal, it thus seems unlikely thatin the immediate future there will be anymajor expansion in international tracio in thecommodities which can be readily produced inthe main industrial countries or which are beingincreasingly replaced by synthetic substitutes.On the other hand, international trade in agri-cultural products, for which an increased de-mand in th.e main industrialized countries must
15A11 estimates in this paragraph of the level ofinternationat trade in agricultural products excludeforest and fisheries products.
97
he niel by larger imports, seems likely to con-tinue to expand in line with the growtIm. of worldeconomic activity.
If:increased domestic production in the mainimporting countries is a major reason for thefailure of international tfade in many agricul-tural products to expand, it might be expect-ed that th.e level of world production of suchcomm.odities, rather than the level of worldtrade in them, would be related to the growthof world industry and world demand, exceptof course to the extent that the world marketis diminished by the development of syntheticsubstitutes. The same should be true of anysmaller but reasonably self-contained economy.
A preliminary comparison suggests that thereis in fact a moderately close relation betweenper caput world production of cotton and ofsogas' and per caput world manufacturing pro-duction. The relative level of per caput pro-duction of both commodities, was lower afterWorld War II than before,, and in the caseof cotton the apparent response to the growthof industrial activity was smaller. There hasbeen so far no opportunity to examine tisisaspect further, but it suggests another possibleline of work, which could be followed up oneither a global or a regional basis, and whichmight, -inter alia, perhaps throw some lighton, e.g., the emergence of agricultural sur-pluses.
The -whole approach in the proceding sec-tion is, however, as was said before, essentiallya first reconnaissance of new ground. As suchit has been nessary to adopt a rather broadapproach and to leave many loose ends. untied.Enough emerges, however, to indicate some ofthe main factors influencing the developmentof international trade in agricultural products,and to give a firmer 'basis than before for judg-ing future export prospects for the main agri-cultural products.
Clearly the analyses for each commoditycould be misiderably refined and worked outin much greater detail ; for example, by break-ing down the international market imito itscomponent sectors, as has been done abovefor rubber and coffee, by including a similaranalysis of the trend of eXport supplies, or byattempting to evaluate (e.g., by means of mul-tiple correlation analysis) the relative impor-tance of time various factors tending to raiseor to restrict the level of international trade,in the particular product.
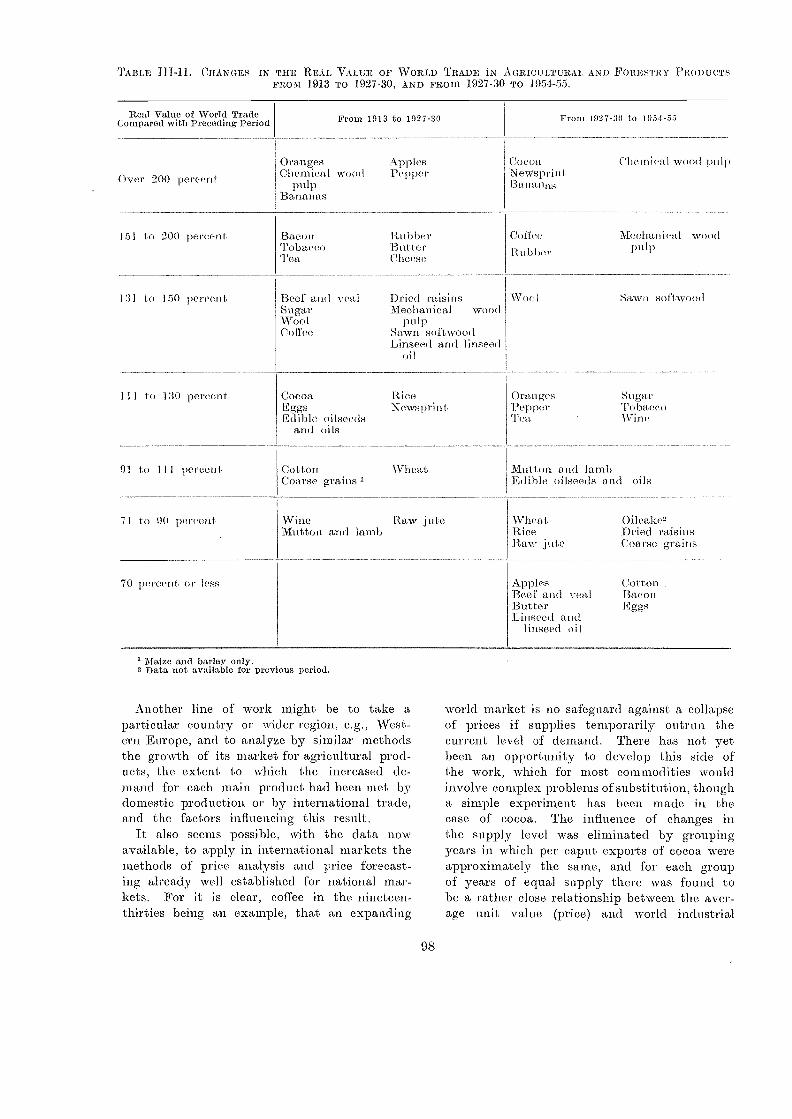
TABLE 1I1-11. emiNGEs IN TI-LE REAL VALUE OF WORLD TRADE iN .AGRICULTURAL AND FORESTRY PRODUCTSFttom 1913 TO 1927-30, AND mom 1927-30 TO 1954-55.
Maize and barley only.2 Data not available for previous period.
Another line of work might be to take aparticular country or vider region, e.g., West-ern Europe, and to analyze by similar methodsthe growth of its market for agricultural prod-ucts, the extent to which the increased de-mand for each main product had been met bydomestic production or by international trade,and the factors influencing this result.
It also seems possible, with the data nowavailable, to apply in international markets themethods of price analysis and price forecast-ing already well established for national mar-kets. For it is clear, coffee in the nineteen-thirties being an example, that an expanding
98
world market is no safeguard against a collapseof prices if supplies temporarily outrun thecurrent level of demand. There has not yetbeen an opportunity to develop this side ofthe work, which for most commodities wouldinvolve complex problems of substitution, thougha simple experiment has been made in thecase of cocoa. The influence of' changes inthe supply level was eliminated by groupingyears in which per caput exports of cocoa wereapproximately the same, and for each groupof years of equal supply there was found tobe a rather close relationship between time aver-age unit value (price) and world industrial
Real Value of World TradeI lompared with Preceding Period From 1913 to 1927-30 Fro 1927-30 to 1954-53m
Dyer 200 percentOranges ApplesChemical wood Popper
pulpBananas
Coctoa Chemical wood pulpNewsprintBananas
151 to 200 percent Bacon RubberTobacco FlutterTea Cheese
Coffee Meehan ica I woodpulpRu h her
131 Co 150 percent Beef and veal Driecl raisinsSugar Mechanical woodWool pulpCoffee Sawn softwood
Linseed and linseedoil
Vool Simi softwood
111 lo 130 poreent Cocoa RiceiEggs N OWS printEdible oilseeds
and oils
Oranges SugarPe p/ er To bu-ceo'rea Wine
91 to 111 percent Cotton 'WheatCOarse grains 1
Mutton and IambEdible oilseeds and oils
71 to 90 percent Wine Raw jut eMutton and lainh
Wheat Oileake2Rice Dried raisinsRaw jute Coarse graiits
70 percent or less Apples CottonBeef and veal BaconButter EggsLinseed and
linseed oil
activity, taken as an indicator of world de-mand. By measuring deviations from the re-gression lines it .was found possible to calculate"expected" price levels year by year whichshowed rather close agreement with actual pricelevels, except in the early years of the depres-sion of the nineteen-thirties. In particular thecalculated prices reflected almost exactly thesharp rise in values after World War II. Thisanalysis could undoubtedly be considerably hn-proved by more refined methods, especially ifdata were available on the level of stocks.
One difficulty in utilizing the analysis forprice .forecasting is the frequency with whichmore or less abrupt shifts seem to occur inthe general level of international trade in rela-tion to world economic activity. Many exam-ples have been noted in the charts in the pre-vious section of a sharp break in one year,or in the course of two or three years, to atleW level of trade in relation to industrialproduction. This is often associated with dif-ferent, and usually smaller response to changesin the level of industrial activity. Such shiftsappear to represent a sudden change in the"magnitude" of the market, and it is of in-terest that similar sharp breaks have been foundto occur in the domestic United States marketwhere they appeared to reflect changes in Con-SU met. tasteJG
99
In a few cases the shift is in an upwarddirection. Most of these occurred at the begin-ning of the depression of the nineteen-thirties,when they may have reflected a tinte lag inadjusting consumption and trade to a lowerlevel of economic activity and income.
Much more frequently, however, the shift isto a lower level of trade. And while the rea-sons for the decline are usually fairly plain,the reasons why it should so often take place,not continuously, but in a series of steps arenot clear. In some instances these abruptdownward shifts in the apparent level of de-mand appear to follow a period of unusuallyhigh prices, but by no means all can be ex-plained in this way. They obviously introducean additional element of uncertainty, mid untilmore is known of their genesis time data cannotbe fully utilized for forecasting the probablefuture course of international trade or of priceson world markets. A cautious approach is thusnecessary. Nevertheless. the preliminary analy-ses in the preceding section appear to openpossibilities of a more systematic study of international trade in agricultural products. Thisit is hoped to develop fmther as opportunityoccurs.
"See, for example HI. Stachle. " Relative Pricesand. Postwar Markets for Animal Food Products.Quarterly journal of .Econonties, Feb. 1945.
Chapter IV - WORLD FISHERIES : GENERAL TRENDS
AND OUTLOOK WITH EXAMPLES
FROM SELECTED COUNTRIES
CHARACTERISTICS OF WORLD FISHPRODUCTION AND TRADE
General
Any historical review of world fisheries andany forecast of development in the foreseeablefuture must take into account the predominat-ing influence of two main factors on by farthe greater part of the world's production offish.
One of these factors is the essentially hunt-ing character of the process of taking fish.Most of the commercially important fish stocksare wild their movements are unrestrainedby man's intervention and they occur mainlyin oceanic areas over which no rights of indi-vidual ownership can be exercised exclusively.This characteristic of the fishing industry makesiit extremely difficult to forecast productiontrends and the possible outcome of any partic-ular fishing season.
The second factor is the extreme perishabilityof fish as a commodity which has largely de-termined the utilization of catches and theirdistribution in time and space.
The effect of these two factors is cumulative,since the perishability of the product magnifiesth.e problems of seasonal or sporadic fluetua-tions in the catch, and the difficulty of forecast-ing production levels enha,nces the difficultiesrelated to sudden peaks Or depressions in thesupply of the perishable raw fish.
The main developments, therefore, havetaken place where the influence of these factorswas minimized, to some extent at least, either
100
because of natural advantages or through tech-nical
Main Centers of Production
The estimated world catch of fish, crustaceans.mollusks and other aquatic fauna and flora,except whales, has increased from 20 milliontons in 1947 (compared with 22 million tonsin 1938) to a level ranging between 27 millionand 29 million tons in the years 1952-55.
A very small number of countries accountsfor a high proportion of the world.'s total catch .The six biggest producers (China, Japan, Nor-way, United Kingdom, United States andU.S.S.R.) accounted annually during the 1950'sfor a total of 14,000,000 tons, i.e., 50 percentof the world total. Seven fairly large produc-ers (Canada including Newfoundland, France,India, Indonesia, Germany, Spain, the, Unionof South. Africa including South West Africa)accounted -for approximately 4,500,000 metric,tons, which represented 16 percent of time worldtotal. The catch of the remaining 17 of the30 countries producing annually more than100,000 tons, aggregated annua,lly 4,000,000tons, or 14 percent of the world total. Thesefigures indicate that the fish output of the 30largest producers (i.e., those catching annuallymore than 100,000 tons) amounted to 22.5 mil-lion tons or 80 percent of the world's grandtotal ; all the other countries produced as anannual aggregate 5,500,000 metric tons, :i.e.,20 percent of the world total.
Certain species of characteristic shoalinghabits, which permit them to be taken in large
numbers, form a great part of these countries'catches. One quarter of the world grand total,017 between 0 million and 7 million tons, is
represented by herrings, sarclines, anchovies,menhadens, pilchards, etc., while the cods,hakes, haddocks, etc., account for approximate-ly 4,000,000 tons, i.e., about one sixth of thetotal.
.An analysis of the catch of the biggest pro-ducers indicates that their large-scale produc-tion is based, to an appreciable degree, on theafore-mentioned tv() groups of species whichpredominate in the world picture. In many ofthese main fishing countries, activities are basedalmost entirely ou . these two groups.
Norway's large production, from 1.5 to 2.0 mil-lion tons annually, i.s based chiefly on twospecies (hdying and co(1) occurring in abun-dance close to its shores. Similarly, the UnitedKingdom produces about 1 million tons a year,with herring and cod predominating. Even insuch varied fisheries as those of the U.S.A.,yielding about 2.5 million toas annually, com-paratively few species predominate, i.e., men-haden, tuna, herring, haddock, redfish, salmonand shrimp; menhaden, for example, accountst:or 40 percent of the 'United States' total catch.In the Canadian catch which is also over 900,000tons annually, Atlantic cod and Pa,cific salmon andherring are prominent. The fisheries of the Unionof South Africa (including South West Africa), ac-c,ounting for SOITIO 600,000 tons, are based large-ly on pilchards, maasbankers and Cape hake;similar species figure prominently in the catchesof Angola. The marine fisheries of Moroccoare dependent virtually on sardines alone.A number of other important producing coun-tries might be mentioned, e.g., Denntark, France,Germany, Iceland, the Netherlands, 'Portugaland Spain, where production is similarly basedon a few predominant species (cod, herring,sardines, rosefish, etc.) in well-defined areaswhich can, be fished in large quantities. Bycontrast, marine fish production in great areasof South and 'East Asia, tropical Africa andILatin America, is scattered and based on largenumbers of different species.
It is also relevant to refer here tti th.e im-portance of inland fresh -waterfisheries Avhiellaccount for some 10 percent of total supplies,since these, by comparison with some marinefisheries, can be harvested comparatively easily.
It may be noted that the greatest marinefishery yields occur mainly in the watersmore or less adjacent to the land masses of the
101
Northern Hemisphere. The potentiality of the fishin the Southern Hemisphere on the grounds ofthe continental banks and areas with great up-welling should not be ignored, e.g., the rapiddevelopment of the fisheries between the Capeof Good Hope and the mouth of the CongoRiver, and off the Chilean and Peruvian coasts.
Consumption
Fish products provide only a small 'propor-tion (possibly less than 10 percent) of the\vorld's total consumption of animal protein,but there are enormous 'variations between thelevels of fish consumption in different areas.Many of these differences are, in part, due tothe variations in prices of fish relative to otherfoods. These differences are only in part areflection of the relative importance of fish inthe national diets. In many cases they simplyrepresent differences in the average consump-tion of animal protein in general.
Even a low level of fish consumption repre-sents the main part of animal protein intakein Indonesia, the Philippines, part of India.,Thailand and other countries, while even arelatively high level represents only a smallpart of the animal protein intake in the 'UnitedKingdom, Germany, Norway, :Denmark, etc.Japan and Iceland are exceptional cases -wherethe the main part of a substantial animalprotein intake is supplied from fish.
Perishability has always been an overridingconsideration, and present levels of consump-tion mainly reflect habits conditioned by theavailability, regularity and form of fish sup-plies over a very long period. Consumptionvaries greatly within even very small areas,for example as between coastal and inlanddistricts, between cultural, religious and socialgroups, as well as between income classes, andis also characterized by preferences, e.g., fordifferent species of marine and freshwater fish,cru.staceans and mollusks as well as for different'ways of icing, 'freezing, drying, salting, enring,marinating and canning and packing fisheryproducts.
Utilization
:Different forms of fish products have beendeveloped in order to OVCYCOMe problems ofdistribution and storage, and each of these nowserves a more or less distinct and specialized
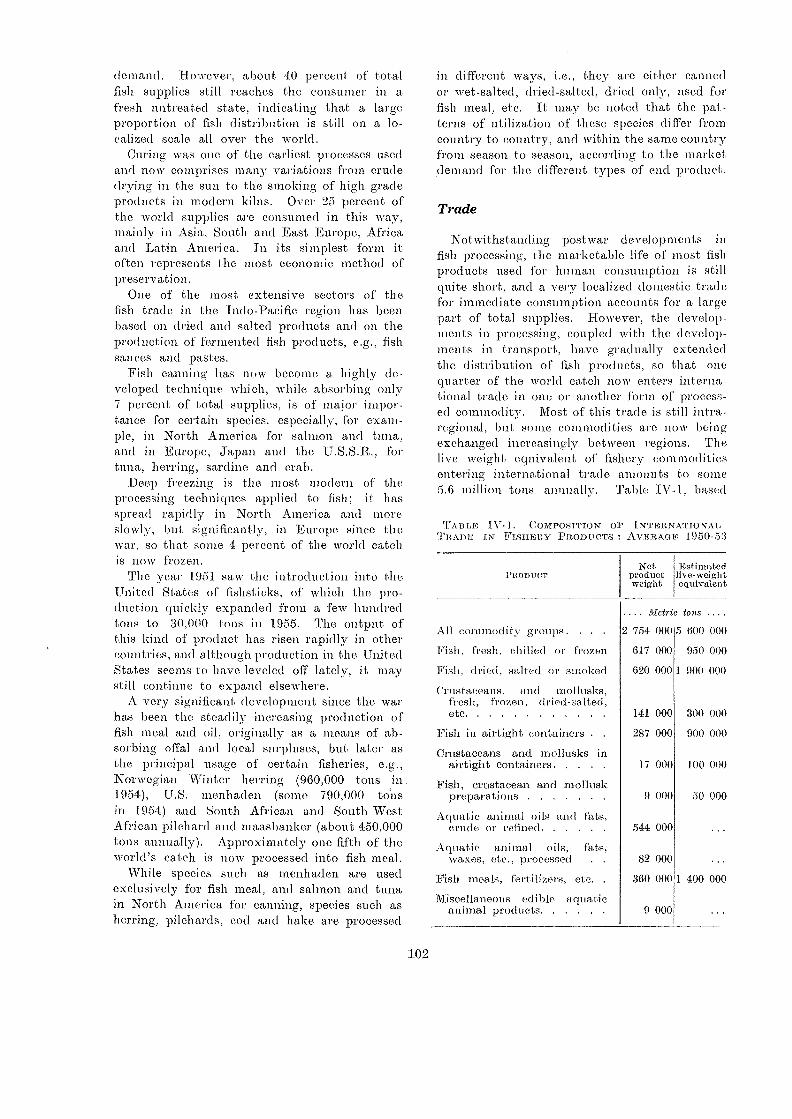
demand. However, about 40 percent of totalfish supplies still reaches the consumer in afresh untreated state, indicating th.at a largeproportion of fish distribution is still on a lo-calized scale all over the world.
Curing was one of the earliest processes usedand now comprises many variations from crudedrying in the sun to the smoking of high gradeproducts in modern kilos. Over 25 percent ofthe world supplies are consunted in this way,mainly in Asia, South. and East Europe, Africaand Latin America. In its simplest form itoften represents the most economic method ofpreservation.
One of the most extensive sectors of thefish trade in the Indo-Pacific region has beenbased on dried and salted products and on theproduction of fermented fish products, e.g., fish.sauces and pastes.
Fish canning has DOW become a highly de-veloped technique which, :while absorbing only7 percent of total supplies, is of :major impor-tance for certain species. especially, for exam-ple, in North America for salmon and tuna,and in Europe, Japan and the U.S.S.R., fortuna, herring, sardine and crab.
Deep freezing is the most modern of theprocessing techniques applied to fish; it hasspread rapidly in North Am.erica and moreslowly, but significantly, in Europe since the\vat., so that some 4 percent of the world catchis 110 W fV07.011.
The year 1951 saw the introduction into theUnited States of fishsticks, of which the pro-duction quickly expanded from a few hundredtons to 30,000 tons in 1955. The output ofthis kind of product has risen rapidly in othercountries, and although production in the UnitedStates seems to have leveled off lately, it maystill continue to expand elsewhere.
A very significada development since the warhas been the steadily increasing production offish meal and oil, originally as a means of ab-sorbing offal and local surpluses, but later asthe principal usage of certain fisheries, e.g.,Norwegian Winter herring (960,000 tons in1954), U.S. menhaden (some 790,000 tonsin 1954) and South African and South WestAfrican pilchard and maasbanker (about 450,000tons annually). Approximately one fifth of theworld's catch is now processed into fish meal.
While species such as :menhaden are usedexclusively for fish meal, and salmon and tunain North America for canning, species such as'herring, pilchards, cod and hake are processed
102
in different ways, i.e., they are either cannedor wet-salted, dried-salted, dried only, used forfish meal, etc. It may be noted that the pat-terns of utilization of these species differ fromcountry to country, and within the same countryfrom season to season, according to the marketdemand for the different types of end product.
Trade
Notwithstanding post war devel op meats infish processing, the marketable life of most fishproducts used for human consumption is stillquite short, and a very localized domestic tradefor immediate consumption accounts for a largepart of total supplies. HO IV ever, the develop-ments in processing, coupled with the develop-ments in transport, have gradually extendedthe distribution of fish products, so that onequarter of the world catch DO W enters interna-tional trade in one or another form of process-ed commodity. IVIost of this trade is still intra-regional, but some commodities are DOW beingexchanged increasingly between regions. Thelive weight equivalent of fishery commoditiesentering international trade amounts to some5.6 million tons annually. Table IV-1, based
TAM. E [V- . COMPOSTTIO N OF [NT RN AT 10 SALTRAD N FISH Y PROD U CTS : AVERAGE 1 950- 53
PRODUCTNet
productweigqlt
Estimatedive-weightequivalent
. Metric tons . .
All commodity groups. . . . 2 754 000 5 600 000
fresh, chilled or Frozen 617 000 950 000
dtiecl, salted. cu; smoked 620 000 1 900 000
Crustaceans, and mollusks,fresh, frozen, dried-salted,etc 141 000 300 000
Fish in airtight, containers . 287 000 900 000
Crustaceans and mollusks inairtight containers 17 000 100 000
Fish, crustacean and molluskpreparation 9 000 50 000
Aquatic; animal oils and fats,crude or refined 544 000
Aquatic an imal ni Is, fats,waxes, etc., processed . . 82 000
Fish meats, fOrtilizers, etc. . 360 000 1 400 000
Miscellaneous edible aquaticanimal products 9 000
on trade, during the years 1950-53, shows howthis trade is composed by different types offishery products.
Technical Development
The great differences of technical develop-ment between the most advanced and the mostbackward fishery industries are so striking asto divert attention from the very significantdifferences which exist in this respect amongthe more efficient fishery undertakings them-selves. It .is generally true that, even in manyof the most developed economies, adoption oftechnical innovation ami investment in the fish-ery industries has lagged behind that in otherindustries, .including agriculture. For exam-ple, the :introduction of steam and diesel pro-pulsion and freezing was on the whole surpris-ingly late, in spite, of their obvious greatadvantages.
This may be explained, at least partly, bythe great riskiness of investment in the fisheryindustries which in turn derives largely fromthe general characteristics of fisheries mention-ed in the introductory section of this chapter,viz., the lack of control over the resource andthe extreme perishability of the product. Othercontributory factors cannot be discussed in thisbrief outline. According to time prevalence ofone or other of these factors, innovations ofdifferent kinds, a,nd investment in different de-gree, are appropriate, to various fisheries.
Some of th.e important fisheries in th.e worldare conducted in coastal waters by immerMissmall units, and even by manual techniques.In those short-range operations, technical prog-ress has consisted mostly in the improvementof small boat design, construction and propul-sion ; the introduction of improved fishing gearsand the application of power in working thesegears, like the purse-seine ; the use of moredurable synthetic materials like nylon yarn, the\vide application of searching aids, especiallyecho-sounding and Asdic equipment. By con-trast, the cod fisheries of the Arctic and NorthAtlantic, time tuna fisheries of the Pacific, andAntarctic whaling, involve operations rangingover thousands of miles from home, ports. Heme
technical progress has been more conspicuous,with the construction of larger, :faster, andbetter equipped trawlers, tuna clippers, motherships and factory ships, CM bodying time latestimprovements in mod.ern merchant shipping and
103
navigation, such as echo-sounders, radar, dieselpropulsion, refrigeration and higher standardsof crew accommodation.
In support of these fleets, extensive sho.refacilities have been developed, comprising deep-water docks, power-operated landing equip.ment,slipways, engineering workshops, ice factories,and a multitude of ancillary industries. itfollows that the long-range operations are basedon a comparatively limited number of ports-where essential sh.ore facilities can be providedeconomically, whereas short-range operationsmay be, and in ma,ny areas are, conductedfrom a large number of small harbors, havens,or even 'from the open beaches themselves.
Similarly there are marked differences oftechnical progress in fish distribution. Wherecatches are mainly distributed over a fairlylengthy fishery season in fresh condition, de-velopments have rnainly consisted in the im-provement of road and rail transport, e.g., bythe use of insulated Or refrigerated cars andtrucks, more protective and hygienic containers,short-term cold storage facilities, ice factories,etc. The changes have not been very markedor -widespread and have been based more onmethods than on equipment, the most notableprobably being the increased use of road trans-port in Europe.
Where catches, in particular when landedover a short season, have to be processed, thexvhole technology, h.owever, has been the subjectof continuous research and improvement, es-pecially in deep-freezing, canning and reduc-tion. These processes lend themselves readilyto large_-'scale factory organization. In NorthAmerica, Western Europe, Southern Africa and,Lapan, canneries, deep-freezing plants and re-duction plants have been progressively improv-ed in accordance with the most modern indus-trial practices. In the case of deep-frozen prod-ucts, especially in North America, this hasbeen accompanied by time introduction of specialrefrigerated rail and road transport, a networkof low temperature cold storages and refriger-ated retail display cabinets and lockers.
GOVERN1VIENT POLICIES IN RELA-TION TO THE FISHERY INDUSTRIES
To be Seen in perspective, national fisheryprograms and policies must be reviewed againstthe background of the general economic poli-
cies of which they form ,part. Like in otherindustries; fisheries have been strwigly influenc-ed by the transition from laissez-faire, and thetentative interventions of prewar policies inmany countries, to the high degree of activegovernment intervention in national economieswhich characterizes postwar policies almosteverywhere.
Fishery Policies before World War II
ith a few exceptions, the fishing industriesare relatively insignificant sectors of their re-spective national economies. In a time of eco-nomic depression, such as occurred before WorldWar JI, these industries there,fore found them-selves in a particulatiy disadvantageous posi-tion. While the general decline in food priceshad its full effect on the market for fish prod-ucts, governments were under much. greaterpressure to assist agriculture than to help fishproducers, and such assiStance as was givenmainly benefited the strongest sectors of thefish industry, especially where th.ese were en-gaged in international trade or WerC particu-larly important in the domestic food economy.It is true that during the interwar period,credit institutions were developed in a fewcountries and some attempts were made tostabilize or protect the, trade by means ofquotas and tariffs, but in general little atten-tion WaS g.iven to th.e economic and socialproblems which were particularly acute amongumerou s scattere,d and small-scale producers.
Outside the large-scale undertakings, such asth.ose based on cod and salmon, -which to someextent were able to invest in cost-reducingtechniques and equipment to meet the declinein prices, the effects of the depression fell fullyon producers' incomes. Low returns furtherimpeded the flow of capital to the industry,and in many undertakings equipment andmethods had become outmoded or obsolescentby the beginning of World War II. The wide-spread poverty of fishermen was further inten-sified by the redueed 'productivity uf fishinggrounds in a number of areas, including partic-itlarly the North Sea, on which. Many Under-takings in Northwest Europe depended.
This aspect of the problem directs attentionto the large body of legislation introduced inmalty countries over a very long period, whichwas designed to protect fishery resources. Muchof it wa,s, and still is, applied to inland and
104
territorial waters, but there was also some at-tempt to reach agreement internationally as tothe regulation of high seas fisheries. The lat-ter was one of the outstanding matters whichengaged the serious attention of governments,and for centuries the conflicting claims of' dif-ferent national fishing fleets have been ener-getically contended by the governments con-cerned. In relation to the mass of legislationand the volume of gov,ernmental effort in thesematters of conservation and fidting rights, there'was at first surprisingly little systematic re-search on the 'biological evidence for the needfor conservation measures and o:f their effect,and virtually no attention Nvas given to theireconomic repercussions on dependent fisheryindustries. Other legislation enacted before thewar was mainly regulatory or fiscal in charac-ter and was concerned with such matters assafety of navigation, licences, dues, standardsand certain elementary statistics.
Government Policies since World War II
The abrupt changes in the economic envi-ronment during the war period .h ad sharp re-percussions on the fishing fleets which, whilesuffering disastrous destruction and the dis-ruptive effects of requisition and blockade inthe areas of military operations, became criti-cally important as a source of food suppliesin time siege econonties of the belligerents. Al-most everywhere the fi.sh.ery industries, in com-mon with other food itulustries, were subjeetto extensive government controls, which appliedto almost every aspect of fl.sh production aun lfiado. Apart :from time fact that the suddenremova,1 of these controls after the war wouldhave been likely to lead to equally sud [en andpainful readjustments in the fisheries, they pro-vided a ready means for the pursuit of coo-nomic policies which, in many countries, place,dnew emphasis on the promotion of foodindustries in the interests of greater self-suf-ficiency, improved nutrition as regards hothquantity and quality, and certain social objec-tives. Moreo el', the application of controlsduring wartime caused many governments toacquire a much wider knowledge and under-standing of fisheries than had existed before.There was thus inore recognition of the prob-lems of the industry and a small but growingnumber of officia,ls better qualified by trainingand experience to deal with them. At the
same time, while fisheries figured more promi-nently in postwar national economic pro-grams, the objectives of the latter varied con-siderably and, in reviewing the economi.c de-velopment of fisheries, it is convenient to groupcountries in accordanee .with these objectives.which depended not only on the social andeconomic structures of the countries concern-ed, but to a large extent on the effects of thewar itself.
01le large group of countries, inainly in Eu-rope and the Far ...East, liad suffered consider-able physical :war damage, and their productiveapparatus had also lost capacity through beingrun down. The principal aim of postwar eco-nomic policy in these countries WaS a rapidrestoration of production and subsequently ofstandards uf living. In trying to achieve theseobjectives, countries in this group almost Nvi th outexception vere confronted with serious prob-lems of inflation and of maintaining theirbalance of payments. The 'fact th.at quite afew of the countries had embarked on ambi-tious programs of social improvement addedto their problems.
A second group of countries, mainly outsidethe immediate scene of Ivar operations, enter-ed the postwar period with a greatly expandedproductive apparatus, which had been develop-ed to meet wartime .needs.
The third group of countries occupies an in-termediate position, having be,en affected bythe war inainly through chang,es in the patternand the terms of international trade,. Such.countries often suffered simultaneously fi..om
shortages of some goods and surpluses of others,mostly accompanied by balance-of-paymentsdifficulties. Their economic policies tended inthe directiim of reducing dependence on importsand sometimes simultaneously consolidating ex-port gains aml further expanding their exporttrade. Such a grouping is, of course, only asimplifying device, and within the groups thereare important differences of policy, accordingto the economic importance of the fisheries andthe extent to which they depend on or couldsupply domestic and export markets. Wherethere are, so many variations of policy and ofmeasures applied to industries of such rela-tively minor economic importance as fi-sheries,it may be more instructive to review fisherydevelopments in a number of selected coun-tries under different but characteristic economicand social influences.
105
TYPICAL CASES OF FISHERYDEVELOPMENT UNDER DIFFERENTECONOMIC INFLUENCES
Japan
Fish production in. Japan has 110 \l' been re-stored to its highest prewar level which reacheda peak of about 4.5 million tons annuallyduring the period 1931-3S, representing a three-fold increase over the preceding 20 years. Threefactors operated to promote such a rapid rateof increase.
Firstly, the waters surrounding th.e islandssupported prolific fish stocks. Secondly, :fish
provided the main source of animal proteinfor a population which increased 'from 55 mil-lions in 1920 to over 70 millions in 1940. Fi-nally, agricultural production was inadequate,for the dense population., a large part of theland area being too mountainous for permanentcultivation. The pressure of population andfood needs bore directly and heavily on thenumerous small-scale operations in coastal wa-ters, production :from which increased fV01.11
about 1 million tons in 1910 to about 4 mil-lion tons in 1933, or nearly 70 percent of pre-war fish supplies in metropolitan japan. Atthe same time the rapid industrialization ofthe Japane,se economy had provided the essen-tial teclmical means and economic incentivesfor the world-wide extension of the opera-tions which occurred between time wars. 'Longdistance fi3hing em.braced not only the .whole,of the Western Pacific, but sprea,d also to timeIndian Ocean and the waters off South. andCentral America. -Vessels and equipment, in-creased in number and efficiency; factory shipswere introduced for the catching and process-ing of salmon and crab; land bases were ac-quired in a number of countries; processingestablishments were set up, and " colonialfisheries were developed notably in Korea,as a source of food or foreign exchange. A
vigorous government export drive supportedthese ventures, exploring and exploiting all pos-sible openings in the foreign. markets.
The structure of the Japanese economy itselfat that time had an important bearing on theproliferation of these ventures which, of course,required heavy capital investment and, in in,anyother countries, would have appeared exces-sively speculative. This structure favored theamalgamation of the smaller undertakings and
the :formation of large monopolies w1ìich. couldspread their risks and could operate, withminimum competition on the fishing grounds orin domestic markets. Thus the industrializa-tion and expansion of the fisheries was accom-plished mainly by four large com.panies andtheir subsidiaries. For example, before the warone company controlled 87 percent of all trawl-ing, 98 percent of crab processing in floatingcanneries, 40 percent of deep-sea, and 76 per-cent of the coastal whaling, 50 percent of theice output, 60 percent of the refrigeration ca-pacity, and 20 percent of all marine fish ex-ports, 'while i.ts subsidiaries operated in Argen-tina, Formosa (Taiwan), Borneo, Philippines,Manchuria and. Korea. In this connection theGovernment, in pursuit of its policy of foster-ing the development of th.e pelagic fisheries,provided strong encouragement by heavily sub-sidizing the, large companies; by granting andprote,cting fishing rights in home Avaters; byobtaining concessions abroad in the form offishing rights and land bases and also, as hasbeen said, by its vigorous export policy.
As a result of the war, the overseas COJICOS-sions aun land bases were lost, including theparticularly important salmon industry in theKtrril Islands and Kamchatka. Productiondropped by half to about 2 million tons in1945. Fishing operations were strictly controlledby the Supreme Commander for the Allied.Powers in Japan (SCAP) and inunediately af-ter the WaV N-ere confined to the coastal waters.Under the direction of SCAP a far-reachingpostwar fishery program was developed withthe twofold objective of rehabilitating the fish-ery industries and of reforming their struc-ture, so as to bring their activities under moredemocratic control. To this end the NationalFisheries Agency was set up in 1948 ; it hasbeen the main instrument for the rapid restora-tion a,nd development Nvhieh. has occurred since.Although there was strong resistance to theextension of fishing operations on the prewarscale, the critical food situation in Japan anddeclining yields from the, intensively e,xploitedcoastal stocks, brought about SOIlle relaxationin re,strictions and, in particular, enabled apanto participate in Antarctic whaling and mother-ship tuna fishing in the Pacific. .Although se-verely curtailed in their scope, the fishery indus-tries became even more important than beforethe 'war, both in the domestic food economyand as a source of foreign exchange. A con-siderable programa of financial aid, education
106
and 17esearelt, lvas launched with the adviceand assistance of foreign specialists. The inter-vention of the Government has been of para-mount importance, not only in the re-organ-ization and technical improvement of the in-dustry itself, but also in securing abroad theconditions under which th.e export trade couldbe revived. The Government has also takena lively interest in the exploitation of IleWresources an.d in international discussions bear-ing on the investigation and management ofresources.
The postwar record has been impressive and,by 1952, fish production han been increasedto over 130 percent above its 1945 level. Thiswas due largely to the very rapid resum.ptionof coastal fishing on its former scale, to theexploitation of new grounds, and to the highdegree of technical efficiency attained in theoperations. Over 90 percent of this produc-tion, excluding whales, .i.s absorbed on the homemarket, wh.ere prices WOVe C0111T011ed 1111111 1950,after which the urban demand slackenedsomewhat, with some shifts of preference which,in turn, led to more diversification of fish prod-ucts. Fish consumption is m.uch lower in therural markets, which have therefore become thepotential domestic outlets for further increases
production. At the same time the charac-ter of the export trade changed considerably,reflecting world-wide changes in the pattern ofinternational trade. About 10 percent of totalfish production is exported, as compared with20 percent in 1938. Exports of tuna to theUnited States and Canada have reach.ed a levelnever attained before, but the trade in salmonherring and shellfish is considerably reduced, Inthe 1930's almost one half of Japanese fish exportswent to Europe and about one quarter to theUnited States. Now OVer 55 'percent is ex-ported to the United States and only some7 percent to Europe. Despite the reduced tradewith China, the trade with Asia as a wholehas increased, and accounts now for 35 pm.-cent of' fish exports, as compared with about25 percent in the 1930's. Here, too, the Gov-ernment has intervened actively in the matterof 'both_ formal and informal agreements as toprices and the re,gulation of shipments.
Meanwhile the Government continues to fol-low a policy of powerful support to, and ex-tensive regulation of, the fishery industries. Theoutstanding importance of the coastal stockshas widespread social and economic implicationsfor the large fishing population, throwing em-
'phasis on the rational management of theseresources, on the structural reformation Of theindustry to secure an adequate share of theearnings or the primary producers and, at thesame time, on th.e exploitation of all otheraccessible marine resources, taking full advan-tage of the considerable tech.:Rical capacity ofthe Japanese ee,onom.y. For some time, there-fore, the policy will continuo to require con-siderable activity in education., extension, andt'esearch, as well as world-wide internationalnegotiations in matters of' trade and fishingareas, and long-term. investments from public:funds.
Norway and Iceland
Although there are many differences betweenthe economies of these two countries, they havein common apart from their balance-of-pay-ments problems -- the fact that they are thet wo countries where the fisheries are of mostimportance in the respective national econo-mies. Both are endowed with rich natural re-sources in the 'form of dense stocks adjacentto th.eir shores -- of cod and herring..Both countries place considerable dependenceon these resources and, in both cases, fishingis a traditional, firmly established occupation ofconsiderable social and political importance inthe community. In each case the level of do-mestic fish. consumption is high, (Iceland : 50kilograms per caput ; Norway : 53 kilograms'per ca,put) although., of course, th.e smallerpopulation of Iceland 'provides a very limitedmarket. In Iceland, however, fish exports ac-count for 90 percent of total export e,arnings,while in Norway they represent, almost 25 per-cent.
FOr these obvious ,reasons, therefore, the.tishery industries in both countries demandserious consideration in economic planning. Inthe interwar period fish production in Icelandwas more than trebled, from about SO thousandtons in 1920 to about 260 thousand tons in1939, and pro(luction increased steadily throughtire war, reaching a peak of over 450 th.ousandtons in 1944 in response, of course, to theurgent demands of countries engaged in thewar, especially the United Kingdom. In NOFway before the war, production increased fromabout 650 thousand tons in 1919 to over amillion tons in 1939. However, in Norway,the industry suffered much destruction, dislo-
107
(nation and restriction during the occupa,tion,and production fell to about 650 thousand tonsin 1944.
Iceland emerged from the War with a greatlyincreased fishing capacity and substantial ster-ling credits, which provided one ready meansof rebuilding and modernizing the fishing fleetsand processing plants after the stresses of con-tinuous wartime fishing. There was a readymarket for their catches, mainIy irr the UnitedKingdom, but it was evident that the regulan'disposal of such. a greatly expanded productionwould become a serious problem when the fish-ing capacity of importing countries was re-stored, especially where balance-of-paymentsproblems arose. Accordingly, iinmediately afterthe war, there was considerable investment 'inincreased reduction and freezing capacity withan eye to promoting alternative export, outlets.In fact, since 1944, production has fallen some-what to about 360 thousand tons annually, andit is indicative of Iceland's special difficultiesth.at herring meal and oil productiffil capacityhas been doubled since 1945, wh'ile the her-ring cat ches Ir ave repeatedly faile(I during timesame period (1944: 220 thousand tons; 1953:70 thousand tons).
The, suspension of direct landings in. the Unit-ed Kingdom accelerated tire movement to di-versify fish products in an attem,pt, to promotealternative markets. The sharp fall ,in, time ex-port of fresh, iced fish mainly to time UnitedKingdom and Germany, has been accompa,niedby an increase in exports of frozen fish to tireU.S.S.R. and the U.S.A. However, the gen-eral picture of Iceland's fish export trade sincethe 'war shows a number of shifts and changesin response to instabilities in export marketsand the main endeavor has been, to employ,full productive fishing capacity on the basis ofa more flexible system of utilization.
In Norway, fish. 'producticm was airead y atits prewar level by 1947 and by 1951 h.ad.
increased to over 1,000,000 tons.,Cod and he,rring represent the bulk, but
whereas time increase imme,diately a'fter theoccupation represented the restoration of pre-war catches of cod and herring, the increasessince consist almost, entirely of h.errin.g, catchesof which have i'eached around. 1 million tonsannually. This gives prominence to the pro-duction of fish meals and oil which absorbsmost of the herring catch., and which has grownin response to the steady postwar demand forfish meals through.out Entupe and in the U.S.A..
This development has brought a measure ofstability to the Norwegian herring fisheries whichhas greatly encouraged the modernization andexpansion of the industry to its present highlevel of efficiency. Meanwhile favorable post-war markets for Norwegian fresh, froten anddried products have encouraged increased invest-ment in the white fish in.dustry, although re-cently high price levels in Norway have creat-ed some difficulties.
In both countries the governments have had.a decisive influence, and it is also characteristicthat development pla,ns have been executed inclosest consultation with the industry. Thefrequently expressed anxiety of the fishermenin regard to the protection of fish resourceswas :reflected in the intensification of govern-ment fi.shery research, and in endeavors tonegotiate wider areas -within which the twocountries' nationals could enjoy exclusive fish-ery rights. The latter raised the difficult andcomplex problem of reconciling the undoubteddependence of the Norwegian and Icelandic fish-ermen on their coastal fisheries with the im-portance attached by the long-distance trawl-ing fisheries of other European countries, to:fishing grounds immediately outside the terri-torial waters of these two countries.
This led to protracted negotiations and dis-putes concerning the Emits of the territorialwaters and the fishing within those limits. Inthe case of Norway, the International Courtof Justice WaS invoked in order to .reach asettlement: in that of Iceland, the, disputeproved very intra,ctable and has not yet beenfinally settled.
In the matter of research, both countrieshave figured prominently in the sustained post-war efforts to achieve better co-ordination ofresearch activities, mainly under the aegis ofthe International Council for the Explorationof the Sea (ICES) and the International Com-mission for North Atlantic Fisheries (ICNAF).Norway has been particularly successful in her-ring investigations which have enabled the fish-ermen to locate the, all-important Winter her-ring shoals witlA more certainty and prompti-tude and have undoubtedly contributed muchto the spectacular increase :in the productionof this species since the war (1947: about 600,000tons; 1955/56: over I million tons).
The 1.-econstruction and modernization of the:fishing fleets was accomplished under the closesupervision of the governments and with ex-tensive financial aid. In Norway the construe-
108
tion of 11.011, craft, had continued to some extentduring the war, but supplies of gear :were cutto almost 25 percent of prewar supplies. War-time losses and deterioration of craft liad beenmade good by 1949, after which the fleet con-tinued to ex:pand in both number and capacity,with some sli!,,ht shift toward the use of largervessels, including trawlers. The wartime cen-tralized import of raw material for the manu-facture of fishing gear continued after th.e warand culminated in the formation of a publiccorporation for this purpose in 1954. The equip-ment of the :fleet has been rapidly and progres-sively modernized with the introduction of echo-sounding, radio and oth.er aids to the locatingand reporting of fish.
These developments have been extensivelyfinanced by mortga,ge loans from the NationalFishery Bank which in some cases cover -upto 95 percent of the costs of construction..Credit facilities have also covered the purchaseof new gear and equipm.ent.
In Iceland reconstruction was based muchti iore on large ocean-going trawlers which. be-tween 1945 and 1948 doubled in number aun ltrebled in tonnage, while the smaller motorizedfleet fell slightly in :number, but increased incapacity. Grants and loans fi.-ony the Nationaland Fisheries Banks provided much of the fi-nance required, while the Currency RetentionScheme has also assisted the motorboat owners.;Recently government help has been direct andnow provides substantial subsidies to trawleroperators and crews.
The seasonal concentration oh' landings, es-pecially in the case of Norwegian Winter her-ring, created special problems of utilization anddisposal, including- the provision of adequatefacilities for the treatment of large catchesover a short period, the seasonal employmentof labor and regularity of earnings. In bothcases this situation gave rise to the formationof po:werful government-sponsored professionalassociations having extensive powers in the mat-ter of prices and trade agreements. In Norwaythe fishermen's sales associations have playeda decisive, part in the negotiation and sta-bilization of prices at agreed levels which aremaintained tlyrough the operation of ,price-equalization funds. Some exporters' associa-tions have effected the centralized control ofexport trading, and semi-official boards ofexperts have been made responsible for thenegotiation of contracts for the export ofcertain fish products. Similarly, in Iceland the
Herring Board has exercised strict COTitrol overthe utilization and marketing of herring.
The investment required in shore installa-tions for the freezing, curing, canning and re-duction of heavy seasonal catches has beenlargely financed by the government and inboth countries capacity has increased in accord-ance with well-defined government plans. Atthe same time, a steady flow of advice hasbeen supplied froto technological research in-stitutions and, characteristically, in -Norway thecanning and in .industries finance their ownresearch. In Iceland, techitological research .is
financed from a small duty on fish exports.'Meanwhile, the stability of these fisheries
continues to depend heavily on export markets.The governments have done ntuch to promotethe latter and keep .in close touch with pres-ent and potential market requirements abroad.On this basis the governments and industriesin both countries are making continual effortsto adjust and diversify their products to meetall foreseeable changes of demand. 11.0WOVel',
any major and substantial recession in theexport markets for iish meals and frozen andcured products would have very serious con-sequences, while some difficulties have arisendue to costs of production and insufficientflexibility in price formation. In this situationthe promotion of -markets in Eastern Europein recent years is of particular interest.
United Kingdom and Germany
In contrast ti, Norway and Iceland, these twocountries are primarily fish-consuming and im-porting countries -which have, at the same time,developed large-scale highly -industrialized fish-eries of th.eir OW11. They have a nu.mber offeatures in comM011. Ball have highly inten-sified and industrialized OCOI1Omies in the de-velopment of which the growth of 'populationcaused increasing dependence on imported food.The development of the domestic fishing indus-tries was another aspect of this process.Both border on the North Sea which beforeWorld War I WaS one of the richest fishingateas in the world, and which still supportslarge stocks of herring. -.Both liad, pre-emi-nently, the sea-faring experience and technicalmeans to prosecute deep-sea fishing and, asthe North Sea fisheries became less profitable,to extend their operations to th.e North. Atlan-tic and .Arctic Oceans. Both are heavy im-
109
porters a,nd, before World War -were thelargest fish importers in the world.
Both were heavily engaged in two worldwars in each of -which the fishing fleets andancillary industries suffered much destructionand restriction. Both, therefore, emerged froun.the last war with the problem of reconstruct-ing and rehabilitating large-scale, heavily capi-talized fishery u.ndertakings during a particu-larly difficult period of restriction on materiais,halm]. and capital. Filially, in both countriesthe main current problems are those of reduc-ing high costs of production and of maintain-iing or increasing demand in domestic markets.
The growth of the two countries' fishing in-dustries, however, occurred during different pe-riods' and to some extent followed different pat-terns. United Kingdom trawle,rs pioneered theintensive exploitation of the North Sea which,until after World War I, supplied the bulk ofthe white fish catches. At the same time athriving herring industry was based on prolificseasonal occurrences of herring which .foundready market in Germany and Eastern Euro-pebefore World War I. Although the UnitedKingdom is insular and has a long coastline,the early predominance of' the East Coast trawland herring fisheries promoted the growth ofone or two East Coast ports which became andremained th.e key centers of the industry evenafter the .rise of long-distance fishing in -whichtheir geographic position was no longer advan-tageous.
By 1913 United Kingdom production liadreached 1,200,000 tons annually and in .factthis level has not been exceeded since, annualproduction both before and since World Warrunning at about 1,000,000 tons. _However,thi.s superficial comparison of annual produc-tion figures conceals the almost revolutionarychanges which occurred in this period. In 19.13,as 110W, cod and herring predominated, butwhereas the 1913 catch included over 600,000tons of herring and 400,000 tons of cod andsimilar species, the 1955 catch included some165,000 tons of herring and 640,000 of cod andsimilar species. The decline of the herring in-dustry after 1911 was sharp and re-fleeted shrink-ing markets in continental Europe. Reducedearnings led to reduced investtnent in new equip-ment, and the fleets steadily deteriorated throughthe interIvar period, with serious economic andsocial repercussions on those fishing communi-ties, especially in Scotland, which had no al-ternative occupation locally. This trend, while
it points to the weak domestic demand for thelow-priced herring, emphasizes perhaps evenmore the problem of rapid utilization and pres-ervation of heavy searonal supplies. Dee,p-freezing and reduction processes liad not thenbeen developed in the -United Kingdom, thehard salty cures favored in export marketsxvere unpalatable at heme, and the market forfresh and mild-cured herring vas necessarilylimited in time. At the same time there WaSa strong domestic demand for cheap 'white fish,especially in the fried fish trade supplying cheapready-cooked meals in industrial and urbanareas. The low incomes of the interwar de-pression sustained the demand for fish, andparticularly fried fish, as an alternative to themore expensive meat products.
Parallel to this economic trend -went a changein the nature of the fishery resources. Betweenthe wars the yields from. the North Seagradually declined under the heavily increasedpressure of fishing. At the sante time thedeclining yie,ld s comprised the most popular.higher -priced prime varieties like plaice, soles,turbot, etc., for which demand al,so decreasedunder the pressure of lower incomes. Thedemand for cheap protein food, coupled withdecreasing yields from the North Sea, broughtabout the extension of operations to the richstocks of cod off the shores of Iceland, Norway,Bear Is/and and the Murman Coast. From theearly 1930's the distant cod fisheries of theNorth Atlantic and Arctic began to dominatethe United Kingdom fishery industries, attract-ing heavier investments in larger, faster trawl-ers and the formation of larger trawler-owningcompanies and larger merehanting enterprisesto handle heavier catches. This also increasedthe predominance of the main ports, especiallyof the two Humber ports iyhich now handleabout 75 percent of the total domestic whitefish landings. A salient factor in the wholeevolution of the United Kingdom white fishindustries has been The relative regularity oflandings, with seasonal fluctuations muchless marked than in the case of herring, andthe existence of a network of railways alongwhich fish supplies from a small number ofmajor ports could be rapidly distributed to allparts of the country, simply protected by ice,.which itself could be cheaply produce,d in largequantities at the main ports. Moreover, theconcentration of landings and facilities at afew main ports permitted many economies ofscale in ancillary undertakings. By 1939 the
110
'United. Kingdom fishing industry consistedessentially of a modern distant-water trawlingfleet supplying mainly cod in bulk, a largeobsolescent near-water trawling fleet, and anequally obsolescent herring drift-net fleet, ofwhich, the two latter Were in serious straits,one 'because 'of reduced catches and the otherbecause of weak export markets.
Production was se,verely curtailed during thewar -- the best units of the fleet and many(WOWS vere requisitioned, and operations wereconfined to small areas under close protection.Production fell by 75 percent to about 250,000tons in 1941, and the country relied heavilyOil imports from Iceland and Canada. Thepostwar recovery was greatly assisted by thewartime recuperation of North Sea stocks ; pro-duction had already risen to 500,000 tons in1945, and by 1947 had recovered its prewarlevel. This level has been more or less main-tained since, with increasing emphasis on theproduction of distant-water cod, as the NorthSea yields fell back to prewar levels, and morenear-water trawlers Vere scrapped, with onlylimited replacements. Immediate postwar trawl-er building was mainly confined to distant-water trawlers. The main trend has been forthe trade to stabilize at about the 1947 leveland the main effort in the, white fish :industryhas gone into the disposal of short-term sur-pluses by voluntary regulation of distant-watercatches, by intensified a,dvertising on the homemarket, by the extended use of deep-freezing,and the development of export markets forcertain specialized products. The mainstay oftrade has continued to be the home marketfor fresh 'white fish. Postwar herring catcheshave fluctuated between 200,000 and. 250,000tons annually and th.e uncertain be,havior ofthe vital East Anglian herring stocks is caus-ing much anxiety ill the industry. The mainefforts here have been to revive the exporttrade, to rationalize and reduce the costs ofcatching and to promote all-the-year-round fish-ing. Here the problems of shortage and sur-plus have been serious and the use of deep-freezing and reduction facilities is increasingin an attempt to introduce more stability.
The development of the German fishery in-dustries occurred somewhat later and followeda different pattern. Like the United Kingdom,Germany depends mainly on the North Seaand North Atlantic and Arctic, but the geo-graphical background is quite different and hashad an important bearing on the character of
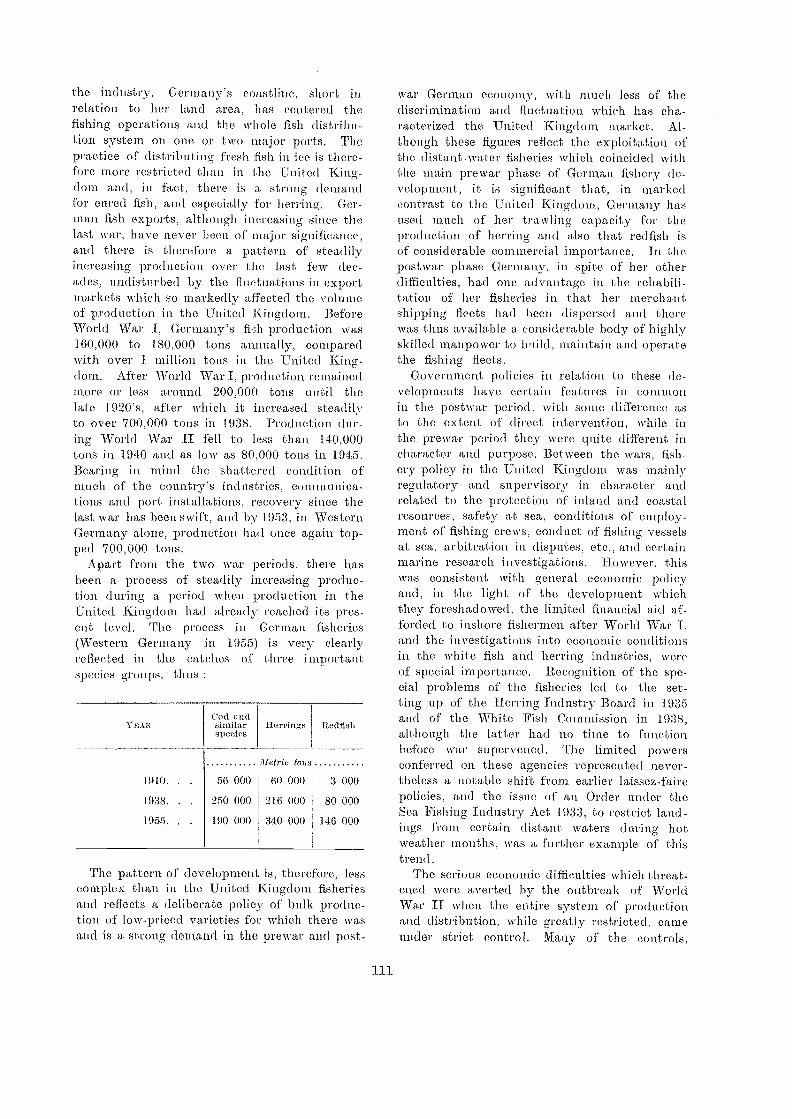
the industry. Germany's coastline, short inrelation to her land area, has centered thefishing operations and the whole fish distribu-tion system . on one or two major :ports. Thepractice of distributing fresh fish in ice is there-fore more restricted than in the 'United King-dom and, in fact, there is a strong demandfor cured fist", and especially for herring. Ger-Juan fish exports, although increasing sin ce thelast War, have :never been of major significance,and there is therefore a pattern of steadilyincrea,sing production over the last few dec-ades, undisturbed by the fluctuations in exportmarkets which so markedly affected the volumeof production in the United Kingdom. BeforeWorld War I, Germany's fith production. was160,000 to 180,000 tons annually, comparedwith. over 1 million tons in time United King-dom. After World War I, production remainedmore or less around 200,000 tons until thelate 1920's, after :which it increased steadilyto over 700,000 tons in 1938. Production dur-ing World War II fell to less than 140,000tons in 1.940 and as low as 80,000 tons in 1945.Bearing in mind the shattered condition ofmuch of the country's industries, communica-tions and port :installations, recovery since thelast war has been swift, and by 1953, in WesternGermany alone, production had once again top-ped 700,000 tons.
Apart from th.e two :war periods, there hasbeen a process of' steadily increasing produc-tion during a period when production in th.eUnited Kingd.om had already reached its pres-ent level. The process in German fish.eries(Western Germany in 1955) is very clearlyreflected in the catches of three importantspecies groups, thus
The pattern of development is, therefore, :lesscomplex than in the United Kingdom fisheriesand reflects a deliberate policy of bulk produc-tion of low-priced varieties for which there wasand is a strong demand in the prewar and post-
111
kvar German economy, with much less of thediscrimination and fluctuation wh.ich has cha-racterized the United Kingdom market. Al-though. these figures reflect th.e e,xploitation oftime distant-water fisheries which coincided NVi thlime main prewar phase of German fishery de-velopment, it is significant that, in markedcontrast to the United Kingdom., Germany hasused much of her trawling capacity for theproduction of h.erring and also that redfish isof considerable coinmercial importance. In thepostwar phase Germany, in spite of her otherdifficulties, had one advantage in the rehabili-tation of her fisheries in that her merchantshipping fleets had been dispersed and therewas thus available a, considerable body of highlyskilled manpower to bnild, maintain and operatethe fishing fleets.
Government policies in relation to these de-velopments have certain :Features in commonin the postwar period, with some difference asto the extent of direct intervention, while inthe prewar period they were quite different incharacter and purpose. Between the \ vars, fish-ery policy in the United Kingdom was mainlyregulatory and supervisory in character andrelated to the protection of inland and coastalresources, safety at sea, conditions of employ-ment of fishing crews, conduct of fishing :vesselsat sea, arbitration in disputes, etc., and cc-It:ail"marine research investigations. :However, thiswas consistent with general economic policyand, in the light of the development whichthey foreshadowed, th.e limited financial aid af-forded to inshore fishermen after World Warand the investigations into economic conditionsin the -white fish and herring industries, Wereof special importance. Recognition of the spe-cial problems of the fisheries led to the set-ting up of time :Herring Industry Board in 1935and of the White Fish Commission in 1938,although the latter had no tinte to functionbefore war supervened. The limited powersconferred on these agencies t.epresented never-theless a notable shift from earlier laissez-fairepolicies, and the issue of an Order under theSea Fishing Industry Act 1933, to restrict land--ings from certain distant waters during hot,weather months, was a further example of thistrend.
The serious economic difficulties which threat-ened were averted by the outbreak of WorldWar II when the entire system of productionand distribution, while greatly restricted, cameunder strict control, iViany of the controls,
1910. . . 56 000 60 000 3 000
1938. . . 250 000 216 000 80 000
1955. . . 190 000 340 000 146 000
Cod andsimilarspecies
YEAR Herrings Redlish
Metric tons
and particularly price controls, were maintain-ed during the postwar food stortage. At thesame time, financial aid in the form of grantsand loans was provided for the building andmodernization of inshore craft; in practice thisaid accelerated the development of the grow-ing seine-net fishing fleet in the North Sea.Trawler building was mainly confined to distant-water vessels and was financed from pri-vate sources, although the government helpedbv the allocation of priorities in the usage ofcontrolled materials and facilities. The Her-ring Industry Board was revived \vial extendedpowers and larger financial resources, and pro-moted a comprehensive and continuing program.for the rationalization of operations and thepromotion of wider market outlets oil the basisof trade agreements abroad and increasedfacilities for utilization at home. It providedconsiderable financial help for the replacementof obsolete vessels, and also instituted a sys-tem of minimunt prices which has continu.edsince.
White fish prices were decontrolled in 1950,but marketing problems and rising costs ofproduction liad already become evident, andwere .intensified in the following months. Theproblems were complicated by the highly sec-tionalized character of the industry and thelarge number of undertakings. In 1951 theWhite Fish Authority was set up with powersand resources to reorganize, regulate and de-velop the white fish industry and has been inoperation since. In 1950 direct subsidies were:introduced, providing flat-rate payments on eachstone of inshore vessels' catches, and deficiency.payments to guarantee minimum daily earn-ings to near- and middle-water vessels. Thishas continued ever since, with periodical adjust-ments, of which the most important was theextension of the flat-rate payments to near-and middle-water vessels in addition to thedeficiency payments. The authority's programhas included the administration of the govern-ment's arrangements for modernizing the near-and middle-water and inshore fleets, of whichmany units Were obsolete to the poi.nt of scrap-ping, by grants and loans toward the cost of.110W vessels and engines. It has also engagedin market promotion, vocational training andhas financed experimental ventures. Concur-rently the government has intensified researchin processing technology and in marine fisherybiology. It has been especially active in thepromotion of the Permanent Commission for
112
th.e North Sea Overfishing Convention, whosesignatory countries have agreed to apply cer-tain conservation measures in the North Sea,middle and distant .waters. It is hoped thatthe restoration of stocks in commercial quan-tities in the North Sea and more certain knowl-edge of the movement of cod on the distantgrounds will contribute materially to the reduc-tion of fishing costs.
In Germany the fisheries were subject tomuch more direct governmental interventionbefore World War II. Faced with th.e famil-iar problems of declining yields, uneconomicreturns and an aging fleet, the governmentin 1936 decided on the syste,matic replacementof fishing vessels which could no longer paytheir way. A four-year plan was introducedfor the m.odernization of the fleet and the in-troduction of new vessels, cheaper to run. Con-currently with this "scrap and build." programthe government investigated market conditions,forecast supply and demand and establishedfixed prices for the principal commercial spe-cies.
At the end of World War II, the govern-ment was faced not only with the rebuildingof shore installations and the reconstruction ofthe fleets which had suffered a loss of 75 per-cent, but also problems arising from the parti-tion of Germany with its consequent effects onmarkets. Much of the reconstruction was ac-complished with public funds. The large land-ing centers in Bremerhaven, Cuxhaven and Ham-burg were rebuilt on modern lines and consid-erable financial help was provided to financenew vessel construction, with much of the em-phasis on large trawlers, of which about 100have been built since the War. The Wholemarketing system came under strict supervisionand prices have been stabilized by the intro-duction of price equalization arrangements.Meanwhile, in response to the strong demandfor cheap fish supplies, especially processedherring, Germany has continued to importfairly heavily, with imports rtinning at about75 percent of the prewar level.
In Germany, therefore, the trend continuestu be one of expansion, although two mainproblems are HOW causing anxiety, namely, therising costs of production and the distributionof fish in the more distant inland markets.
In the United Kingdom, with the possibleexception of herring, the trend is rather to-ward stabilization and rationalization of th.etrade consistent with fishing capacity. Both
government and industry are seriously concern-ed also with rising costs and how these canbe reconciled with the loiv prices prevailingduring periods of heavy supply an.d with aliberal import policy. So far the niain sector,the distant- watertrawling industry, has man.-aged without financial help and, if ways andmeans can be found to absorb or avoid te,m,-porary surpluses, will probably be able to con-tinue operations on a commercial basis. Theinshore and near-water prod-ucers, however,continue to receive substantial help towardconstruction and operation. Eventually the re-placement of the obsolete by more economicunits, possibly with some reduction of totalcapa,city, may lead to higher sustained earning,but in the meantime, it is proving increasinglydifficult to retain an adequate force of man-power under conditions of full employment.
United States and Canada
While there are important differences be-tween the fisheries of these two countries, theUnited States ami Canada have in commontheir hard currency economies and their g,eo-graphical position which spared them from thephysical impact of military operations and fromthe destruction and damage inflicted by two'world wars. The effects of 'war were, therefore,reflected in the t..equisitioning of manpower andfishing craft, scarcities of materials and facili-ties, changed patterns of trade, control of pri-ces, etc., rather than in the severe losses ofproductive capacity, and exclusion from tradi-tional fishing grounds suffered by the, Euro-pean fisheries. Over the past few de,cades,therefore, levels of production and trade havebeen consistently maintained, or raised, withoutviolent wartime breaks in the continuity of theoperations.
Certain basic natural features are commonto the fisheries of both countries, which occupylarge land masses with coastlines on two oceans,the Atlantic and time Pacific. Large stocks ofprime commercial importance occur off bothcoasts cod, haddock, heiTing, menhaden,redfish, lobster and shrimp in the Atlailticsalmon, halibut, herring, mackerel and tuna inthe Pacific. In both cases the extent to whichthese resources could be profitably exploitedhas depended on the facility with which thesupplies could be moved over large distancesthis consideration has, in turn, led to much
113
emphasis on processing and distribution fromthe earliest stages of development. In bothcountries, but especially in the United States,the fisheries, although they have attained veryhi.gh levels of technical efficiency in l.n,any sec-tors, are not of major economic importancegenerally, but are of social, political, and eco-nomic importance locally in certain areas .wherethey are firmly established as an industry sup-porting considerable capital investment. Fishconsumption is generally low in both countries,but the total intake in the United States is,by reason of its population and intensity ofdistribution, high in relation to supplies, whilethe reverse is true in Callada. This points toone critical difference between the two indus-tries, namely, that the bulk of the UnitedStates fish production is directed to the do-mestic market, which also absorbs a large vol-ume of imported fish products, while the Ca-nadian fisheries are heavily dependent on export,outlets. Other differences reflect different lev-els and periods of economic progress and willemerge from a brief review of fishery develop-ments in the two countries.
In the United States, fish production increas-ed fairly steadily from about 1 million tonsill 1921 to just over 2 million tons in 1936, alevel which has been more or less maintained.This trend reflects not so much the spon-taneous pressure of demand, since individualfish consumption in time 'U.S.A. is quite lowat about 22 pounds (live weight) annually, asthe gradual expansion and consolidation of tliedomestic fliarket on the basis of increased proc-essing and distribution facilities. At the sametime some remarkable changes occurred in timeexploitation of certain stocks, showing time re-markable flexibility of' the industry and timerapid adjustments made possible by the coun-try's great technical capacity. Tliese changesalso provide some pointers to the rather spe-eialized markets which the U.S. fisheries serve.Thus the catch of Atlantic shrimp increasedfrom just under 50,000 tons in 1929 to approx-imately 120,000 tons in 1954. In fact in re-cent years the value of the shrimp catch hasbeen higher than that of any other single species.
This emphasizes the importance of fish prod-ucts as a supplementary, or even luxury, food.item on which the costs of consumer-appeal inthe form of treatment and packaging can moreeasily be carried than they can on cheaperstaple food items. Time catch of redfish, pre-viously regarded as virtually a trash fish (as
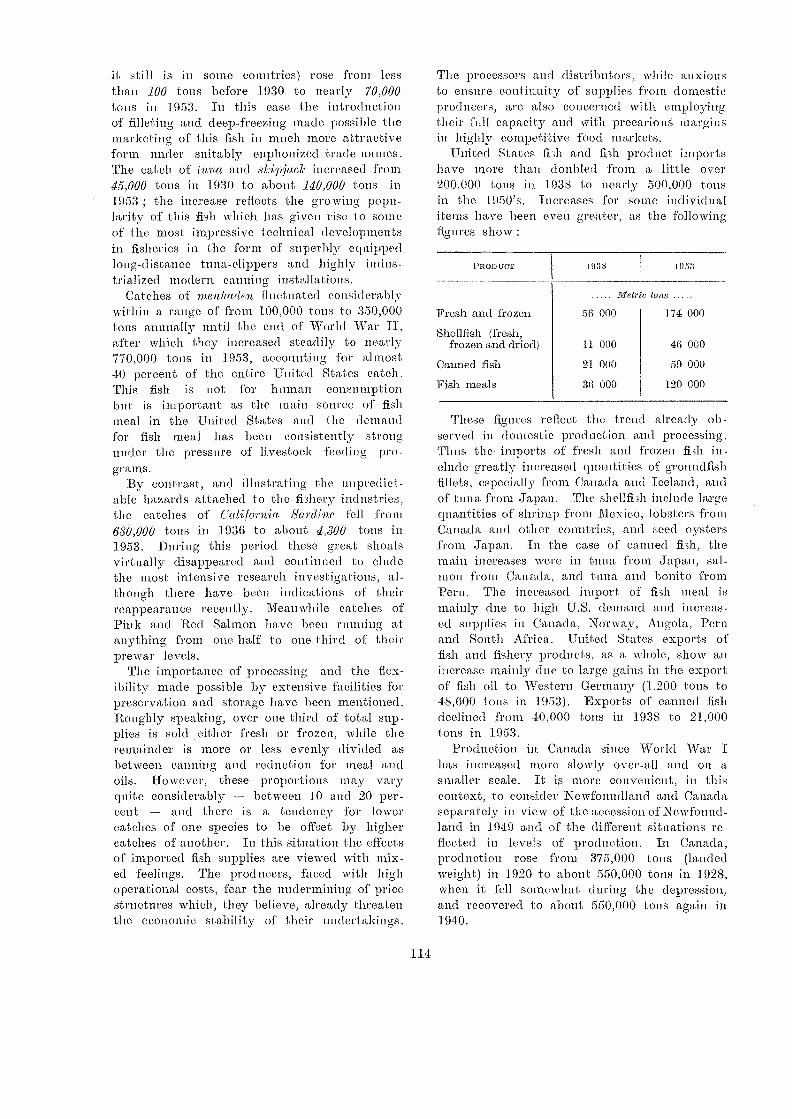
it, still is in some countries) rose, from lessthan 100 tons before 1930 to nearly 70,000tons in 1953. In this case the introductionof filleting and deep-freezing made possible themarketing of this fish in much more attractiveform under suitably euphonized trade names.The catch of tuna and slcipjack increased from45,000 tons in 1930 to about 140,000 tons in1953 ; the increase reflects the growing popu-larity of this fish which has given rise to someof the most impressive technical developmentsin fisheries in the form of superbly equippedlong-tlistance tuna-clippers and highly indus-trialized modern canning installations.
Catches of 'menhaden fluctuated considerablywithin a range of from 100,000 tons to 350,000tons annually until the end of World Warafter which they increased steadily to nearly770,000 tons in 1953, accounting for almost40 percent of the entire United States catch_This fish is not for human consumptionbut is important as the main source of fishmeal in the United States and the demandfor fish meal has been consistently strongunder the pressure of livestock :feeding pi:o-
grams.By contras t, and illustrating the unpredict-
able hazards atta,ched to the fishery industries,the ca,tches of California Sardine fell .from680,000 tons in 1936 to about 4,300 tons in1953. During this period these great shoalsvirtually disappeared and continued to eludethe most intensive research investigations, al-though there have been indications of th.eirreappnarance recently. Meanwhile catches of'Pink and Red Sahnon have been running atanything from one half to one third of theirprewar levels.
The importance of processing and the 'flex-ibility made possible by extensive facilities forpreservation and storage have been mentioned.Rou.ghly speaking, over one third of total sup-plies is sold either fresh or frozen, while theremainder is more or less evenly divided asbetween canning and reduction for meal andoils. However, these proportions may varyquite considerably between 10 and 20 per-cent and there is a tendency for lowercatches of one species to be offset by highercatches of another. In this situation the effectsof imported fish supplies are viewed with mix-ed feelings. The producers, faced with highoperational costs, fear the undermining of' pricestructures which, they believe, already threatenthe economic stability of their undertakings.
114
The processm:s and elistributtirs, Ivld/e anxiousto ensure continuity of supplies from domesticproducers, are also concerned with employingtheir full capacity and with precariouS marginsin highly competitive food markets.
United States fi di and fi di product, imports1/ave more than doubled fi:om a little over200,000 tons in 1938 to nearly 500,000 tonsin the 1950's. Increases for some individualitems have been even greater, as the followingfigures show
These figures :reflect the, trend already oh-served in domestic production and processing.Thus the- imports of fresh and :frozen fish in-clude greatly increased quantities of groundfishfillets, especially :from Canatla and Iceland, andof tuna from. Jargen. The shellfi3h. include largequantities of shrimp from Mexico, lobsters fromCana da and other comaries, awl seed oystersfrom Japan. In the case of canned fish, themain increases were in tuna from ,Tapan, sal-mon from Canada, and tuna and bonito from.:Peru. The increased import of fish meal ismainly due to high 'U.S. demand and .increas-ed supplies in Canada, Norway, Angola, Perua,nd South Africa. 'United States exports offish and fishery products, as a whole, show anincrease; mainl3r due lo large gains in the exportof fish oil to Western Germany (1,200 tons to48,600 tons in .R)53). Exports of canned fishdeclined fi:om 40,000 tons in 1938 to 21,000tons in 1953.
Production in Callada since World War Ihas increased more slowly over-all and on asmaller scale. It is more convenient, in thiscontext, to consider Newfoundland and Canadaseparately in view of the accession of Newfound-land in 1949 and of the different situations re -fleeted in levels of production. In Canada,production rose from 375,000 tons (landedweight) in 1920 to about 550,000 tons in 1928,when it fell somewhat during the depression,and recovered to about 550,000 tons again in1940.
PROD OCT 19:3 8 19;53
Metric ions
Fresh and frozen 56 000 174 000
Shellfish (fresh,frozen and dried) 11 000 46 000
Canned fish 21 000 59 000
Fish meals 36 000 120 000
The volume fluctuated around this levelthrough World War II and then increased toove'. 675,000 tons in 1950 from which it hasfallen back to about 600,000 tons. The catchesof individual species show few major changessufficient to influence total production, exceptin the case of herring, production of whichWaS 90,000 tons in 1920, had risen to 250,000tons i.n 1948 and .was over 200,000 tons in1953. In Newfoundland the trend is -very dif-ferent, production declining .from a peak ofnearly 440,000 tons in 1918 until after WorldWar II when, following a short period of heav-ier catches, it fell to less than 190,000 tonsin 1953. Most of this decline is reflected indecreasing catches of cod, the staple productof the Newfoundland fisheries.
These figures reflect marked differences in.the entire structure and development of fish-eries on the two coasts. On the Pacific Coastthe concentrations of salmon and herring havelent themselves to modern industrialized proc-esses, i.e., canning, freezing and reduction formeal and oil, to more centralized storage anddistribution arrangements, requiring and at-tracting greater investments. The foundationof the industries here was the well-establishedexport trade in canned salmon, although thishas suffered some disturbance since the lastwar owing to the payment problems of import-ing countries, especially the United Kingdom.The natural abundance of a high-priced fi31-1
like salmon provided; therefore, an obviousincentive for the technical development of thePacific Coast fisheries, and the latter increasedunder the pressure of -wartime and immediatepostwar food demands. It has been calculatedthat the number of fishermen increased bysome 25 percent between 193S and 1955, whilethe investment per man in primary industrymore than doubled This mainly representslarger and more powerful craft fitted withmodern navigational and searching equipment.Comparable figures are not available for theprocessing and distribution industries, but itis evident that hefe too the process of con-solidation and mechanization of operations hascontinued. The number of plant workers isreported at less than 4,000 in 1955 comparedwith 6,000 in 1945 while production has beenmaintained and its value increased fromless than 45 million Canadian dollars in 1945to about 70 million Canadian dollars in 1954.
On the Atlantic Coast, however, productionis much more dispersed and based on numerous
115
small-scale operations conducted from remoteand scattered fishing centers, including a num-ber of islands where the absence of good com-munications has discouraged centralization am .Ifortified rigidities in the social and economicstructure. For many years the operations havefollo-wed a simple traditional pattern, and mar-keting has been mainly based on dried-saltedproducts prepared locally on a "cottage-indus-try" scale. Under such conditions, which of-fered few opportu.nities for alternative employ-ment, the fi3hermen have from time to timesuffered considerable hardship when marketswere weak, while their resultant poverty (lidnot permit investment in cost-reducing instal-lations and techniques which might strengthentheir position in competitive markets. In New-foundland, especially, these problem,s have oc-curred in their most acute form.
l'he decline in production noted above con-trasts with the abundance of the resourcesoff these shores which are fished by large linersand trawlers from as far away as Spain, Por-tugal, France and the United Kingdom.
Nevertheless, in the Atlantic provinces, ex-cluding Newfoundland, some notable improve-ments h.ave been effected since the last war.The fleet of large sea-going vessels on theAtlantic Coast has steadily grown and modernfish processing capacity has increased in re-sponse to the demand for frozen fillets in NorthAmerica. Even in the small-boat fisheries manyimprovements have been achieved, the valueof craft increasing threefold to over 20 "pillionCanadian dollars 'between 1945 and 1954. Thenumber of processing plants has increased, homecanning has been largely replaced by factorymethods and the traditional salt and picklecures have given way increasingly to chilledand ftozen products.
Even in Newfoundland; where the problemsare more complex, since they involve not onlymodernization and concentration of the opera-tions, diversification of products, etc., but alsosubstantial transfers of population and alter-native means of employment, some importantchanges have occurred. Many technical diffi-culties have been overcome, the production ofsalted cod fish has been reduced and the num-ber of men engaged_ in the salt cod industryhas fallen from 25,000 in 1945 to 14,000 in1954. However, the production of salt cod isstill ami industry of prime importance in theeconomy of Newfoundland which, because ofits outmoded structure, can no longer compete
successfully with its competitors, including otherCanadian provinces. Its loss would further re-duce diversification which is so important toCanada as a fish-exporting country.
The volume of these exports increased froiii.less than 170,000 tons in 1938 to over 270,000tons in 1953. Much of this is accounted forby the :increased export of fresh and frozenproducts from about 50,000 tons :in 1938 tonearly 120,000 tons in 1953, and of cured fishfrom 43,000 tons in 1938 to 74,000 tons in195:3, (exports from Newfoundland includedin the latter year). Th.ese increases reflectgrowing dependence on the United. SI atesmarket as compared with the soft-currencycountries in Europe to which much of Canada'sprewar fish trade WitS directed. The UnitedStates 110W takes about 70 percent of Canada'stotal fish exports which themselves representtwo thirds of total catches. In 1951 thisincluded 50,000 tons of fish meal alone,representing over 200,000 tons of raw material.HOWeVer, th.e marked decline after 1950 indi-cated the uncertainties in export markets andCanada's difficulties outside the hard-currencyarea, in competition with other exporters.
In relation to fishing developments in thesecountries, both_ governments have -promotedlarge-scale programs, but with important dif-ferences, reflecting the different needs of theindustries. Both countries have federal govern-Incas whose programs have been designed tosupplement the activities of state and provin-cial governments and to undertake others ofa nation-wide character.
In the United States, fishery developmenthas proceeded without financial aid or directintervention by government, drawing on theample resources and technical and commercialexperience of private industry. Wartime con-trols were quickly relaxed and the governmentconcentrated its efforts on supervisory, :regu-latory, representative and research functions,both at federal and state level. The range ofthese has been wide, especially in the field ofbiological exploratory fishing, and marketingresearch. Since the -war much greater impor-tance has been attached to the resources asthe basis of a modern food industry carryino-considerable investments in the :form of craftand, especially, processing and distributive fa-cilities. Where such concentrations of capitalare concerned, instabilities represented by fluc-tuations in the resource are costly, and theindustry itself has strongly supported the
116
government in its intensified research programsalong both coast-,s. At the same time, in re-sponse to the very competitive marketing situa-tion, widespread market intelligence serviceshave been developed further since World WarII, incorporating :information as to catches, uti-lization, stocks, prices, etc., and forecasts ofdemand. In 1951, the program received a greatimpetus with the passing of the Saltonstall-Kennedy Act under which 30 percent of cus-toms duties on fish imports, subject to anannual ceiling of 53,000,000, were appropriatedfor three years for conducting an education-al servi ce, expanding technological, biologi.caland related research and services, and develop-ing markets for fishery products of domesticorigin. A :wide range of projects has now beeninitiated, in. close co-operation with universitiesand other institutions, and includes not onlythe intensification of established research in-vestigations, hut special .programs of consumereducation, school feeding, etc. In contrast toagriculture there are no subsidies of any kindand no measures of price stabilization, althoughu.in this connection it may be noted that thestrengthening of fishermen's organizations hasbrought prices much more under tito :influenceof collective negotiations and contracts. Thegeneral aim of policy is, by national and in-ternational action, to safeguard and promotebetter management of the natural resources byappropriate investigation and regulation, to en-sure that fishery :interests are adequately rep-resented at the political level, especially inregard to imports and, thnoimghu ad Visoryservices, to assist the fishery industries to pro-duce and fiado within the freely competitivestructures of which they form part.
In Canada, whose econoinyr likewise dependson pri vate competitive enterprise, the govern-ment has found it necessary to intervene .inoredirectly in response to the economic hardshipand attendant social pro blenis experienced incertain sectors, particularly in the Eastern prov-inces. High domestic prices and shortages inexport markets brought about some temporaryimprovement in earnings during and immediatelyafter World War II, but not sutil diem to inducepermanent changes in the social and economicstructures of the scattered fishing communitieson time Atlantic sea :board. The more compre-hensive program of social relief and economicdevelopment on which Callada is 110W embark-ed was to some extent envisaged in the price-support legislation enacted in 1944 and pro-
claimed in 1947. :However, wherea.s this Watioriginally designed to affect slumps :in fi1i. pri-ces, it has tended to 1:wcome a :means of sup-plementing incomes in certain segments of thefishing population. Accordingly More directmeasures were introduced to encoura!ie, themodernization of the .A.tlantic Coast fi.sheries.A federal subsidy for the construction of newcraft of approved design was introduced andadministered in conjunction with provincial low-interest loans and other aids to new construction.The provincial governments provided assistancefor the installation of processing establishmentsin order to encourage th.e shift -From handicraftto factory production methods. SO MC Sll COC3ti
has been achieved ,but in several important sectorsof the, .Atlantic Coast fisheries, the indus-try is still retarded and, in 1949, the federalgovernment announced a policy of co-operationwith provincial aaintinistrathms to devise andimplement a positive proy-rain Of mpderniza-tion. .11fluch has been done in the analysis ofspecific problems awl the drawing up of detail-ed :plans for dealing with them and a fewprojects are 110 W under way. In Newfound-land, as has been said, the problems are,much more difficult, but are being tackled inaccordance with a detailed plan with the helpof a specially appointed Fisheries DevelopmentAuthority.
In the Pacific Coast fisheries, developmentwas mainly spontaneous and self-financing andthe modernization and centralization of the
. proce,ssing and marketing operations encour-aged the :formation of strong fishermen's andplant workers' associations to promote theirmembers' interests. However, these have sharedin the benefits of the spe,cial insurance ofcraft and gear :introduced by the governmentin 1953. They have also profited froui thecompreh.ensive program of biological and tech-nological research co-ordinated and directedunder the Fishery Research Board. They stand.to gain much from continued investigation andconservation.. of salmon stocks as also from de-velopments in canning and freezing technologyand, in particular, were greatly assisted by thelarge public works involved in the, 'U.S.-Cana-dian scheme for the by-passing of the Hell'sGate obstruction to the migratory passage ofthe salmon.
In doinestic markets, increased efforts arenow being made ti) popularize fish productsand to reduce, in part, the dependence on ex-ports. Overseas, commercial attachés provide
117
a valuable service to the trade by their regularinvestigation of current marketing trends andpotential export outlets.
In general, Canadian poli.cy recognizes the,inherent instability and lack of flexibility whichput the fishery industries at some disadvan-tage in a fast-, developing economy, and is re-flected in measures designed to provide, on theone hann . incentives for more rapid develop-ment and, on the other, temporary relief tosafeguard social and eeonomic security in thepoorer fishing communities.
The United States and Canaria have a corn-!non interest not only in rivers running throughthe territories of both countries, and in thefisheries of the Great Lakes, but also in themarine stocks of the :Pacific and Atlantic oceans.Both countries took ami active part in the set-ting up of the North Pacific Fisheries Conven-tion, the International Pacific 'Halibut Com-mission, the International Pacific Salmon Fish-eries Commission, and the International Com-mission for the Northwest Atlantic Fisheries,under which research investigations are co-ordinated and ;joint conservation programsadministered.
The Union of South Africa and SouthWest Africa
The fisheries of the Union of South Africaand South West Africa are remarkable for theirextremely rapid development during the post-War decade, in particular after 1947. In 1938the South African catch anaounted to 64,000metric tons compared with 95,000 tons in 1947and over 400,000 tons by 1952, while the SouthWe,st African catch increased from an annuallevel of less than 10,000 tons in 1938 and 1947to approximately 275,000 tons in 1953. Thegovernment has instituted as a precaution aconservation policy entailing the limitation ofthe annual catches of pilchards and Inaasbank-ers. This policy of both the Union and SouthWest Africa precludes, until scientific researchm.proves that the stocks of these species can bemore extensively exploited, further increases inthe annual production which, since 1950, hasleveled off.
The prewar structure of the South African:fishing industries comprised the following majorbranches : (a) an off-shore trawling fleet of 26trawlers operated by two companies based 01Afour commercial ports, landed annually be-
tween 15,000 a,nd 20,000 tons of fish to providethe bulk of the supplies of fresh and iced fishfor the domestic market, as well as for exportsto the Rhodesias ; (b) a deep-sea snoeking fleet,based on Cape Town but operating also offSouth West Africa, provided a salted productfor the domestic 170 arkots as yell as for ex-ports to Mauritius, in particular ; (e) a rocklobster fishing industry, delivering catches tocanneries exporting, since the first decade ofthe century, the !At& of their packs to prin-cipally the French ma;rket, and also to pa,ckersexporting frozen tails, since 1930, to the -UnitedStates ; (d) an inshore fishery industry, usinghand-lines, beach-seines, and miscellaneoustypes of gear, sometimes operated froni beaches,hut mostly from small craft going out fordaily trips. Apart ftom the motorized inshorecraft al the major harbors, mechanization atthe comparatively isolated inshore fishing cen-ters occurred rapidly during the 1930's afterthe initiation of a government program of COE -
struction of fishing hat-bors at several of theselocalities.
On the out break of 'WM', the trawler :fleetwas seriously depleted by requisitions; but theremainder of the trawlers WaS used in a vigor-ous effort to maintain annual landings. Thewar also created a demand for vitamin liveroils and thereby brought into existence a sharkfishery to supply a liver-processing and oil-extracting industry which also used livers fromthe trawl catches. Maritime transport, diffi-culties and factors caused by the hostilitiesreduced imports of canned and cured fish, andwith the increased domestic demand, the can-neries, which vere 110W packing tbeir cannedrock lobster for the United Kingdom's Ministryof Food, began to turn their attention to othertypes of .fish.
Various goveinMent commissions during the1920's and 1930's had highlighted time impov-erishment of the 'inshore fishermen and therewas a possibility that they might relapse backto the prewar levels after the war-induced pros-perity has passed by. To meet this situation,together with the desire to utilize unexploitedfish stocks and increase the supply of fish, theFisheries Development Corporation was createdin 1944.
Although brought into existence by a par-liamentary enactment and with the capital pro-vided by the government, the corporation isadministered along business lines. Its sharesare of two kinds, one kind being used for
lis
housing and oth.er social services, research andfinancial aid to fishermen for the acquisitionof craft and gear, a,nd the other for the pro-motion of industrial and commercial activities.
The corporation has constructed housingschemes, some of which were later sold to theprivate fishing companies, :for all groups offishermen in various localities. It introduceda scheme to assist fishermen to have craftbuilt and engines 'installed. Co-operatives havebeen initiated at one 017 tWO localities. Tech-nological and biological research has beenfinanced and the corporation played a majorpart in the establishment, in 1946, of a Fish-ing Industry :Research Institute, which is:financed 'partly by the government and partlyby 'virtually all the pri vate conipanies in the,fishing industry, to undertake joint, technolo-ical research. To enable th.e Division of Fish-eries of the Department of C011111101700 Of the'Union of South Africa, and the Fisheries Sec-tion of the Administration of South. West A:fticato expedite the crucially important joint pro-gram of pilchard research, the corporation i.s
providing the, capital for three research vesselsand other :facilities, in addition to those al-ready operated by the governm.ent bodies con-cerned. A levy ou th.e catches is to enablethe corporation to finance this investment inbiological research.
The application of technical standard.s for:fishery products intended :for export, originallyundertaken by the Fishing Influstry Research,:Institute, has, since Match 1953, been operatedby an inspectorate servic,e, of: time :Bureau ofStandards.
After a slight leveling off during the waryears in the construction and improvement ofinshore fishing harbors, the development pro-gram was again resumed, but in view of re-trenchment in the field of government expend-iture, has tapered off during the 1950's.
As the general policy of the government isto encoura,ge, guide, supervise and assist pri-vate enterprise, the fishing industry has expe-rienced g0 A701.0111011t interference mainly in termsof conservation poli cies limiting lime quantitiesof rock lobster, pilchards and maasbankers thatmay be taken during a given season, togetherwith a prescribed minimum mesh size for trawlnets and minimull.1 size limit for different com-mercial species, as well as close seasons in dif-ferent ateas for particular species. Further-more, through. the Bureau. of Standards, thegovernment is imposing on producers compul-
sory quality standards for products, and hasalso been continuing after the war the policyof general price controls, which included untilI 956 also :fresh fish. The domestic price for fishmeal has been controlled at a lower level thanthe OVCrSeaS price and producers had to satisfyli-te internal demand first before exporting.
Although. the State does not actually par-ticipate in fishery production activities, it has,through the Fisheries Development Corporation,been taking up a c,ertain percentage of theshare capital of certain companies. The cor-poration has only a minor vote and control inthese associated companies, as the bulk of theinvestment in the .fishery industry, whether inthe companies closely associated with the cor-poration or in those not financially related, hascome .from private sources. The availabilityof private capital to the South African amiSouth. West African fishing industry at a timewhen the other sectors of the national economywere also booming and competing- for capital,re,flects its prosperous atid profitahle conditionduring the .past :few years.
While the government policy to assist re-
search and prov.ide capital through the corpo-ration, lo develop fishing harbo.rs, etc., mostdefinitely contributed to the prosperity of theindustry, the key to prosperity liCS in theavailability of maaets, not only domestically,but also overseas.
Originally, the war shortages and the crea-tion of demands for new fishery products ena-bled the South African fishermen and producersto extend their existing experience to neWfields. When war controls of imports disap-peared, the imposition of currency control in1948 prevented an inflow of canned productsfrom overseas countries. The devaluation ofth.e South African in September 1949 bene-fited the local producers in various ways ; NorthAmerican im.ports, if available, became inereas-ingly expensive, while the returns received forSouth African and South West Africanexportsto the United States markets increased. appre-ciably. The currency difficulties strengthenedthe South African exporters' competitive positiontoward other producers in soft-currency markets.The disappearance of the California pilchardeliminated an im.portant supply of canned fishon the .international market at a time whenanoth.er importamt exporter, japan, was in theinitial stages of rehabilitating its fisheries afterthe war.
119
The postwar expansion of the South African,as well as the European and North Americanm.arkets for fish meal for livestock feeding isthe key to the establishment of the large re-duction plants on the South African west coastami in South West Africa, and the output ofthe product was maintained even with falls inthe prices of the joint product, fish body oils.
C URRENT DEVELOPMENT PROGRAMSAND OUTLOOK
In reviewing present programs and prospects,it is useful to distinguish those in the moreadvanced economies, which have been subjectto a continuous process of' adjustment, andthose in underdeveloped economies, in whichno major evolutionary changes have occurredover long periods of time. The degree of tech-nical deve/opment alone may not be the mostuseful criterion and in some cases, e.g., in cer-tain inshore operations, differences may not bevery conspicuous, but the more fundamentaldistinction is between relatively flexible and.virtuallv stagnant conditions.
Situation in the Developed Fisheries
Co8ts of Production. The operation of sea-going fishing vessels and shore establishmentsand facilities involves a wide range of costfactors. A few of these are specific to fish-eries, but the greater part are common to anumber of industries, among which the fish-ing industry is not imp .rtant. Almost withoutexception these costs h ve risen steadily sinceWorld War II, and such economies as .h.avebeen effected in specific costs have liad onlya limited impact on the total costs of produc-ing and marketing fish supplies.
Shipbuilding costs have increased greatly inmany places with the postwar. rise in .the costof labor and materials, especially steel, timberand machinery. The spectacular increase in thecost of cordage, especially sisal and manila,reacted sharply on fisheries, where consumptionis heavy. There is a prospect of cordage costsbeing reduced with the gradual introductionof synthetic fibers, but the initial investmentsnecessary are considerable. Similarly the costsof coal, oil, ice, provisions and consumable hulland engine-room stores have increased, and in
most cases these contribute appreciably to costs,especially in trawling. Of the capital cost ofport and harbor installations the fishery indus-tries usually contribute only a small share,except in connection with large-scale processingestablishm.ents, but the increased cost of main-tenance and operation ha,s been reflected inhigher wh.a,rfage and ground rents in manyplaces.
Handling, processing and marketing costs gen-erally have continued. to rise everywhere and,in the case of fish products, there are almostalways additional costs because of their perish-ability. Freight charges, in particular, havecome to representa higher proportion of thecost, of fish products. Again, post war improve-ments in quality whichin the long-term aree,xpected to improve the market, have mean-while increased costs, for instance, in the sub-stitution of more hygienic .materials like alu-minum and plastics and in the overhead costsof inspection and grading.
Finally, the increasing costs of labor are re-flected in every phase of fish production anddistribution and are due not only to thegenerally rising scales of remuneration but alsoto the postwar efforts to improve conditionsof labor in some industries by the introductionof statutory working h ours, overtime, minimumwage scales and other guarantees against lossof earnings due to fluctuations in turnover.
In Europe and North America therefore theproblem of rising costs of production has be-come one of critical importance which iis hav-ing notable effects on the structure of the in-dustries. IVIany measures have been introducedboth publicly and privately, in an attemptto keep costs down. The more successful haveinvolved collective organization of some kind..Producers' associations have achieved somesubstantial economies of scale in the supplyof fuel, ice, cordage, provisions, landing equip-ment, containers, fishing equipment, etc., andin the provision of repair, maintenance andother services. Similarly, on a smaller scale,fishermen's co-operatives have organized collec-tive supplies on a non-profit-making basis.Governments have given encouragement, es-pecially through the promotion of co-opera-tives, which in most countries enjoy certainprivileges and sometimes' financial help in theirpromotion and management. In many cases,governments have offe-ed special concessionsto time fishery industry, e.g., remission of taxeson fuel and certain imported supplies, special
120
freight mates, etc., and, sometimes, e.g., inIceland and the -United Kingdom they paydirect subsidies to offset high costs in the lessprofitable sectors of the industry.
Invesintela. Reference has already been_ madeto certain obvious deterrents to investment infishery undertaking,s. The isks associated withuncertain catches and excessive perishability,and time absence of ownership over the resourceexcept in special cases, have been mentionedin this connection. It is not, therefore, unex-pected to find that most of the investment in:fisheries has, in the past, come :from a rela-tively small number of people having special-ized experience of fisheries and, in most cases,has derived from savings accumulated duringperiods of profitable fishety operations. Manyhighly developed fislie,ries are still character-ized by a very large number of individuallyowned small firms, many of which are man-a,ged by successful fishing skippers or theirfamilies. It is only comparatively recently thatthe heavy requirements of capital and the in-troduction of vertical integration. have promot-ed the growth of larger public companies, par-ticularly in the most poweitul and successfulsectors of the trade. Apart front this develop-ment, investment in the fishing industries be-tween time wars WaS low with consequences indi-cated in the section above on fishery policiesbefore World War II.
The general rise in food prices during andparticularly just, after World War If producedincreased profits in many fishery industries andattracted other capital to some extent. Thiswas badly needed to inake up for insufficientmaintenance and improvement of capital equip-ment, both before and during the war. In timecase of the more powerful and long-establishedproducers, processors and merchants, e.g., thosedealing in distant- watercod, tuna, salmon, can-ned and frozen products, etc., much of the mod-ernization and reconstruction was accomplishedfrom private resources and from bank loansfor which the enhanced value of prewar assetsprovided adequate collateral -- especially inthe U.S.A., Western Callada and the -UnitedKingdo ni.
Tn most developed fisheries the moderniza-tion of equipment and facilities and the promo-tion of new large-scale undertakings has de-pended on government credit and subsidy. Thishas applied particularly to boat construction,for which old credit schemes have been extend-
et] or IleW' ones introduced in Canada, Belgium,the Netherlands, France, Germany, Norway,Sweden, Japan, the United Kingdom, Italy andDenmark. To some extent thi.s dependence oncredit has permitted a certain degree of ration-alization ba,sed on the restriction of invest-ments to craft of approved design and eco-nomic operation. In most cases the schemes com-prise some form . of subsidy by way of low:interest charges or direct grant. In many casesthese schemes have the additional objective ofencouraging ownership of craft and gear by the.working fishermen and of increasing thereby thelatter's economic independence and social se-curity.
Most postwar processing and distribution fa-cilities have been privately financed except inspecial cases, as in Norway and Iceland, wherethe government has financed the constructionof large-scale processing plants to absorb sea-sonal landings from large numbers of small-scale undertakings. This applies also to icefactories and cold storage and, in a number ofcountries, port installations and ti'ansport areunde,r public ownership of some kind.
It is still early, even now, to assess the re-sults of postwar investment policies in the longterm. Immediate benefits have undoubtedlybeen conferred on a large number of undertak-ings and the industries are much better equip-ped and more efficient as a result. However,ultimate success will de,pend on a process ofselective investment and consequent rational-ization of production and marketing which willbe largely determined by developments in otherdirections, especially by accurate knowledge andprediction of the behavior of commercially im-portant fish stocks, and the promotion of morestable markets.
Investigation of Resources and Management oftheir Exploitation,. The period since World WarII has seen a striking development of fisheriesbiology :virtually a sudden flowering of aplant of which the seed was planted in thesecond half of the nineteenth century. Formore than fifty years many nations had beengathering facts about fish of economic impor-tance, about th.e waters in which they livedand about the catches taken from them. Themain fe,atures of the biology of the importantspecies were described, and certain importantcharacteristics of the fisheries were re,cognizedas having their origin in biological phenomenain particular it was recognized that the flue-
121
tuations that appeared in the catches WM inlarge part due to variations in the real abun-dance of the stocks of fish.. H.owever, despitethe evidence in the North Sea that relaxationof fishing during World War I had allowed a:restoration of the stocks there, and that re-sumption of fishing had again reduced thosestocks, it had not been :fully established beforeWorld War II that the characteristics of astock of fish, notably its abundance, could beaffected by the characteristics of the fishingoperations brought to bear upcm it. A repeti-tion of this experience during aun after World'NVar II coincided with other experiences and:with the successful development of importantsectitms of the theory of fishing, and broughtthe conviction that human activities couldsignificantly influence natural stocks of fish. Thespread of this conviction has h.ad two impor-tant consequences ; firstly, governments are nowpersuaded of the importance of having moreand better information concerning the resour-ces exploited by and accessible to their fish-ing fleets ; secondly, it has become acceptedthat there must be positive international col-laboration both in the investigation of resour-ces and in the formulation and implementa-tion of controls of fishing activities. The latterconsequence is :m.anifest in the establishmentof several 11CW international fishery councilsand commissions, and, more importantly, inthe nature and scope of the activities of thesebodies. .Examination of the reports of themeetings of these bodies, and of the steadilygroWing volume of fisheries literature, revealsthat fisheries science is being developed withconsiderable vigor ; it is not over-optimistic tosay that there are signs that this science willpermit a measure of effective and useful con-trol in a field where hitherto it has been thoughtthat no control was possible.
Problems of Donlestic and International Trade.Almost without exception time advanced fisheryindustries have been facing increasingly diffi-cult marketing situations since the disappear-ance of th.e immediate postwar food shortages.It is true that rationing persisted for soineyears, and that fish prices were controlled insome countries, especially time United Kingdom,but even before these restrictions Wel!C lifted,fish consumption was already falling from theinvoluntarily high levels which prevailed dur-ing periods of meat shortage. However, it WaSnot only the falling-off in the over-all demand
for fi,sh., but the discrimination on the part ofconsumes, which compelled certain adjustmentsin the pattern of fish production and trade,and some industries have been less able thanothers to diversify their products. In Europeparticularly this has liad an important influenceon recent programs. In order to maintain de-mand in competitive food markets it has beennecessary to improve the quality and appear-ance of fish products and to meet the grow-ing preference for easily prepared dishes, es-pecially in communities here there is a highlevel of employment among housewives. How-ever, (Wei* 50 ,percept of catches in Western'Europe are 10 to 15 days old when landed,and the problem of maintaining quality at thisstage is acute. Much of the catch is still dis-tributed -Fresh, and some limited improvementshave been introduced in the form of bettercontainers and more e-fficient transport. Fishfillets, which developed as an economy in thedistrilmtion of bulk snpplies of white fiSh, havebecome firmly established now on the groundsof consumer preference. They are particularlyimportant in the freezing trade, which hasslowly develope,d in :Europe since the war, and'which is gradually building up demand on thebasis of quality, attractiveness and diversityof preparation. In contrast to North. AIileriea,development has been slow in Europe, due tothe lack of cold storage and refrigeration facil-ities in the wholesale and retail network and,in part at least, to a consumer resistance tofrozen products which is gradually being over-come. However, the problem of' improving thequality of distant-water catches is still acuteand one which is the, subject of 'inuch researchand experimentation.
"By contrast the near-water fisheries fromwhich catches can be taken quickly have beenable to support a relatively profitable trade invarieties Tfor which th.ere is a fairly consistentdemand, e.g., plaice, soles, turbot.
In North America the technical problems ofmarketing .have been much less difficult thanin Europe, and a very wide, range of productsranging 'from fresh to precooked preparations,in various -Forms from whole fish to fish sticks,have been 'marketed with the assistance of thehighly developed selling techniques of the dis-tributive trade. However, competition in foodmarkets is intense, fish consumption is tradi-tionally rather low and the trade has had todisplay great flexibility in both creating andmeeting deinand.
122
Internationally the problems of consumer dis-crimination are aggravated by balance-of-pay-ments difficulties which have operated, not onlyto restrict in some cases, but also to admitimports to competitive markets in the 'interestsof liberalized trading in accordance with eehl-mitments under the General Agreement, onTrade and Tariffs (GATT) or time Organi-zation for European Economic Cooperation(OEEC).
Most government fishery programs 'in :Europeand North America have placed much empha-sis on the resolution of marketing difficultiesby way of market promotion, marketing regula-tion and reorganization and price support or'regulation. Government-sponsored developmentauthorities, marketing boards, sales associationsor comparable agencies having specific functionsin relation to th.e sale and distribution of fishproducts, have been set up in Norway, theNetherlands, Germany, Swedcn, the UnitedKingdom and, in all cases, price equalization,'price support or minimum price arrangementsare operating for particular species of specialimportance. CODSUmer education, advertising,and school-feeding programs have been promot-ed in most Northwest European countries andNorth America. A steady sequence of bilater-al trade agreements have been ratifie,d, notably,in .recent years, between Northwest Europeanexporters and the U.S.S.R. and EasternEurope in an attempt to promote wider exportoutlets. Internationally OEEC has studied theproblems of fish marketing in Western Europeand some measures of liberalization have result-ed. However, the difficulties of domestic pro-ducers in the main consumer markets are re-flected in the continuation of a wide and com-plex range of quotas and tariffs. The problemsof raising consumption at economic levels ofprice, and of absorbing seasonal surpluses inboth domestic and international tracio, stilldominate the fishery situation in virtually allthe a.dvanced fishing countries.
There is, however, one notable exception totime foregoing observations which apply to thehuman consumption of fish products. The post-war market for fish meals has remained firmand apparently unaffected by the spectacularincrease in postwar fish-meal production. Inthose countries where large quantities of fishare produced exclusively for the manufactureof fish meal, especially Norway, this marketrepresents ami element of stability in the un-certain conditions described above.
Outlook. Little immediate or sudden chainreis foreseen in th.e highly developed fisheries,but rather the continuation of a trend towardthe rationalization of operations on the basisof increasing technical efficiency, a closer ap-preciation of investment prospects and widerknowledge of resources. The perfection oftechniques of location and capture and theimprovement of boat design and propulsion Willcertainly increase the speed, efficiency and econ-omy of the fishing operations themselves. Thetwogress already achieved in food processingtechniques indicates the fairly early possibilityof' preserving fish products over longer periodsand in more varied forms. This should leadto much more stability in the trade and permita heavier investment in fish marketing whereone of the main problems is that of fluctuationsin supply. In this connection, it seems inevi-table that, as a matter of economic necessity,the fresh fish trade will gradually gi.ve way todeep-frozen products in Europe, as in North.America, and that consumption may respondto a wider range of easily prepared fish products.
These developments will involve more con-centration and centralization of the operations,more mechanization and more efficient use ofmanpower. In some places the process willbe encouraged by the shortages of manpoweralready apparent. The natural trend there-,fore will be for the more powerful concernsto consolidate their posit ion and to extendtheir interests, probably at the expense of small-er undertakings, except where these are engag-ed in some localized or specialized small-scaletrade, or where they are protected and assist-ed by governments on general economic andsocial grounds. For some time governmentprograms of financial aid and relief to theweaker sectors of the industry will continueuntil the latter can be absorbed into othereconomic activities 0.r their operations broughtinto line with modern industrial practice. Im-mediate efforts will work toward the consolida-tion of production and marketing at presentlevels, with some reduction due to the scrap-ping of obsolete equipment without replacement
possibly in the North Sea and certain coast-al fisheries and SOMO increases based 011 thedemand for fish meals.
Underdeveloped Fisheries
In contrast to the situations described in the,foregoing, the situation in time underdeveloped
123
fisheries shows very few changes over a verylong period. They have many features in C0111-111011 with agriculture which simply connoteconditions of general economic underdevelop-ment and which are sufficiently well knownto :require little comment here, beyond notingthat poverty, ignorance and structural -weak-nesses are particularly potent factors in fish-eries. The purpose of this brief review is torefer to such changes as have occurred andwhich could occur in the, iforeseeable; future.
Production, Method8. Almost everywhere thefishing operations, hokvever complicated anddexterous they in ay be, are conducted in nar-row coastal strips of water and employ simpleequipment and local materials. Moreover, theoperations are scattered over long stretches ofcoastal and inland waters, involving large popu-lations of fishermen in. numerous but isolatedcommunities. The problem of training fish-ermen. in the use of improved methods andequipment can only be tackled, therefore, onthe basis of localized pilot projects where other:Factors such as deinand and communicationsare favorable. In particular the me,chanizationof the marine c.)perations, resulting in fastertrips, extended range, increased fishing time,and IlealdCr catches, has proved to offer oneof the readiest means of improvement, andsome local successes have been achieved invarious countries, especially .in Bombay, HongKong and Singa,pore. However, the problemsof adapting local craft, introducing new craftand installing suitable engines are very oftenclosely related to those of training the fisher-men themselves. if the benefits uf improvedmethods are to spread, extensive vocationaltraining facilities will be required and few coun-tries are equipped to provide them at present.Nevertheless, some remarkable progress has beenachieved since the war.
Obviously the financing of these improve-ments is quite 'beyond the resources of localfishernien and, apart from a few sectors of thetrade, e.g., in the Philippines and Indonesia,where mechanization occurred earlier, has de-pended on government credit and subsidy.Again, most of this has been on a localizedscale, e.g., in India, Pakistan, Ceylon, Hong.Kong, Singapore, the Gold Coast, Barbados,and the amounts involved are very small inrelation to the widespread need. In manycases there is a large element of subsidy, andit still remains tu) be seen whether loans can
be repaid and, more important, whether boats,engines and gear can be replaced out of in-creased earnings. However, the fact that mostpost \liar government programs on underdevel-oped :fisheries contain some provision, albeitsmall, for the provision of credit represents asignificant development of fishery policy.
Demand. Early post Nvar fishery programs intlICSO arety.; were dominated by a desire toincrease fish production in accordance with cer-tain nutritional targets. The demand factorwas eith.er overlooked, or at least disregarded,and to some extent this imbalance has pre-vailed, encouraged to some extent by this ear-lier l)ias 11'hich is reflected in the, staffing ofgovernment fishery services. HOWCVOY, thesmall changes and slow progress achieve,dthe production processes gradually directedattention to the fact that traditional facilitiesand channels for fish distribution are inade-quate and entirely unsuited to an increasedficiii of production in most areas. Moreover,nutritional needs provide no :reliable index ofCOnStilller demand which is limited, fundamen-tally by poverty but also by unfamiliarity,prejudices and religious bans.
There are thus two main aspects to the prob-lem of demand, firstly the reform of the struc-ture and practices of the fish trade itself inth.e interests of increased availability at re-duced cost, and secondly, the mobilization ofdeinand through appropriate educational meas-ures. In the case of marketing, the critical fac-tor is the .irregularity and extreme perish.a,bilityof fish supplies which, in many areas, is ag-gravated by problems of climate and distance.In the absence of facilities for holding, preserv-in.g or transporting supplies, the trade is highlyspeculative, and the merchants have tradition-ally protected themselves by operating on highmargins such_ as can be imposed where themerchant has control over supplies and catersfor a restricted market. In particular the frag-mentation and diffusion of primary produc-tion, and often of retailing, have permittedthe merchants to acquire a virtual monopolyin their particular areas, and have also en-couraged the formation of long, tortuous chainsof distribution.
Most governments have DOW become awareof the limitation imposed on any fishery de-velopment schemes by such rigid monopolisticstructures but, so far, very little has beendone to determine the precise functions of the
124
intermediaries in .the fish trade or the factorswhich promote such inflexible structures. Manygovernments have resorted to co-operative or-ganization as a means of reducing the powerof the merchants and increasing the earningsof fishermen, in order to induce increased pro-duction. It is extremely difficult to evaluatethe success of the movement so far in under-developed fisheries but, with a few notable ex-ceptions, it would appear that the main .resulthas been to replace the private merchantwithout influencing the, structure of the trade.Where such organizations have succeeded, e.g.,in Bombay and Hong Kong, other favorablemarketing factors operated, especially the pres-sure of demand in large urban communities.Nevertheless, the movement is quite stronglyestablished politically, and a relatively largenumber of co-operative fish-marketing organi-zations are operating, notably in India, Ceylon,Burma, Indonesia and some dependent territo-ries. Their weakness lies mainly in the fieldof management, and conimercial operation andthe ill-preparedness of many fishermen for di-rect participation in such activ.ities.
In the matter of facilities, governments ha vebeen able to accomplish . a little more, e.g., byprovision of ice factories, cold storage, curingyards, wholesale and retail pre,mises, etc., againon a very limited scale in a few selected fish-ing centers.
In the field of education and training vir-tually nothing significant has so far been ac-complished by way of consumer education andvocational training in the industry. Some lo-calized campaigns have been conducted withguidance provided under the ili]xpanded Tech-nical Assistance, Program, e.g., in Chile andMexico. In the underdeveloped arcas as awhole, there have been .few efforts to promoteincreased consumption by means of school andadult education, communal feeding and nutri-tion programs, etc., and in many cases suchefforts would be premature until iiegular fish.
stipplies can be ensmed. A few governmentofficers have been trained in fish processingand distribution in some countries, but so farsuch training has not been transferred to thetrade itself.
In the general sense therefore, there havebeen few successful efforts since the war towiden the bottleneck between fishermen andconsumers and this, perhaps, is one of th.emain weaknesses of postWalr government fisheryprograms, due, in part no doubt, to the scar-
city of qualified personnel and the degree ofdependence on developments in other fields,e.g., transport, health, education and industrialdevelopment generally.
ReSOUrGCS. In the period immediately follow-ing World War H considerable attention wasdirected to the need for rehabilitating the fisheryindustries of the underdeveloped countries thatliad suffered war damage, and to the possibilityof securing increased production from fisheriesgenerally in all underdeveloped countries. Thestrength of the .interest derived in part fromthe fact that fish was a staple item of the dietof the countries of Asia, and in part from thearguments that more animal protein should beavailable to th.e peoples of underdeveloped coun-tries, that fish vas one, of the most readily ac-cessible resources and its industry one of themost easily developed. While some steps weretaken toward immediate industrial rehabilita-tion and development, notably in the massivefishery rehabilitation operations of the UnitedNations Relief and Rehabilitation Administra-tion (UNRRA) there \'as also considerable in-terest in the speculations and problems sug-gested by the resources. Attention was directedto the vast oceanic areas of the SouthernHemisphere and to the great and complexinland water systems of Asia, Africa and LatinAmerica. It was argued that these presentedgreat, untapped fishery 'resources, but this ar-gument led to the need for exploration of theseareas and investigation of the resources. Itwas an historical coincidence that at this timefishery science was tepresented almost exclu-sively by biologists, and it is probable that itis a consequence of th.is th.at governmentalprograms for fisheries gave considerable em-phasis to resources research. In many coun-tries the chief manifestation of governmentalinterest in this industry was the establishmentof research laboratories, and it is probably notunjust to say that the work of these institu-tions was hampered by the fact th.at th.ey wereestablished without the necessary contact withindustry. Such contact is indispensable to th.eapplied science of fisheries as a source of in-formation conce,rning the industry and its oper-ations, and as a means of ensuring that re-search is oriented to the needs and capacitiesof the existing industry. However, both na-tionally and internationally there has been asteady broadening of the scope of the fisheriesprogram. For example, the functions of the
125
Indo-Pacific Fisheries Council COVer all phasesof the industry, mobilize all research disciplinesand relate to comprehensive developmental pro-grams. Attention has been paid by this counciland other similar bodies to problems of sta-tistical collection, improvement of craft ilidgear, development and improvement of market-ing, to the socio-economic problems of fishery'industries, to increasing the consumption of'fish, and to many other similar problems.Training centers have been conducted for thetraining of governmental officials in generalfisheries science, and in particular aspects ofthe subject. By these means the fishery pro-grams in these countries are being brought intobalance, with the consequence that resourcesresearch is being put into correct perspec-tive.
The fishery resources within the boundariesof the undexdeveloped countries, and accessibleto them, are undoubtedly considerable. Whilevery large catches of fish are taken from inlandwaters it is obvious that these can be greatlyincreased. At present there is considerable ac-tivity in research on these resources and in thedevelopment of their exploitation. Th.ese ac-tivities relate to the open systems of rivers,lakes and irrigation systems occupied by wildstocks of fish, to irrigated agricultural lands,and to time closed systems of ponds, dams, etc.In marine waters there are important stocksunder steady exploitation with respect to whichthere is a need for intensive research along timelines developed in northern countries; this needhas been recognized and steps are being takento bring the research to the required level.There are also extensive areas in which ex-ploitation is negligible or nil ; fundamentaloceanographic research and fishery explorationare being developed to furnish the basic descrip-tion of the resources of these areas.
External Aid Programs. It will not be pos-sible hiere to review in detail the many formsof international and bilateral assistance render-ed in the execution of fishery development pro-grams. However, this action can be regarded.in a better perspective if the problems of de-velopinent in fisheries can be summarized asfalling within three ntain groups, viz., unco-ordinated planning, lack of capital and inef-ficiencies at the managerial and operationallevel. This also permits a convenient group-ing of the activities of the agencies mainlyconcerned.
The International Co-operation Administra-tion (ICA) and its predecessor agencies concern-ed with the administration of -United Statesassistance for technical development, has Leenmainly concerned with the last two groups,namely the acquisition of facilities and equip-ment and the provision of specialized ad-vice at the operational level. Under thisprogram, embracing a large number of coun-tries throughout the underdeveloped areas,fishing craft, engines, nets and cordage, icefactories, cold storage, transport, processinginstallations, etc., have been su.pplied and insome cases experts have been assigned to h.elpgovernments in the use of such facilities, e.g.,in :fishing operations, fishery research and fishprocessing. In. a few countries general fisheryadvisers have been appointed mainly to assistthe governments to determine their needs inthe way of equipment, to examine the justi-fication for and a,ssist in the execution of cer-tain projects. With its large financial resour-ces and widespread area of activity, this agencybas become a powerful factor in many nationaldevelopm.ent programs, especially in fisherieswhere local financial resources are slender evenin relation to other national programs.
The Colombo Plan is of course confined toSoutheast Asia and its main effort in fisherieshas been concentrated so far in Ceylon. Herea substantial program has been launched underwhich deep-sea trawlers, cold storage and anumber of small marine engines have beensupplied, while a team of experts has beenworking for several years in connection withthe operations and in the promotion of fisher-men's co-operatives. At present, arrangementsare in progress for th.e extension of this assist-ance to other countries in the region.
Mention must also be made of the agree-ment between Norway, India and the UnitedNations under which a team of Norwegian ex-perts is engaged in the social and economicdevelopment of an entire fishing communityin a fishing village in Travancore-Cochin. Thisprogram is unique in fisheries and the assistanceprovides for equipment and expert aid in allaspects of the village life, e.g., in fishing, mar-keting, co-operatives, health, housing, roads, etc.
In all.of the foregoing th.e provision of finan-cial ai.d in the form of equipment and facili-ties is an essential element. In this importantrespect these programs differ from that of FAOwhich is mainly concerned with the planningand co-ordination of food development pro-
126
grams and with the provision of expert advicein the planning and execution of national de-velopment projects. There is no provision forequipment or facilities beyond the limited needsof a particular project or for demonstrationpurposes. In contrast to other agencies, it isan essential function of FAO to establish apermanent consultative body at the service ofits member countries, to maintain continuousliaison with them and to keep their programsunder review. In the case of fisheries thishas liad a considerable impact on developmentprograms over the last ten years. In manycountries very little indeed was known of thefisheries, their potentialities or their problems,and there were no trained observers availableto 'make, the, preliminary evaluation essentialto planning. These countries therefore lookedto FAO for consultation and advice. The ne,edfor regional intergovernmental consultation onproblems of common interest has been partlymet through the formation of the FAO Re-gional Councils in th.e Indo-Pacific and Medi-terranean regions, and these have since becomequite significant policy-forming instruments ofthe Member Governments concerned. In addi-tion to consultation and investigations underits :Regular :Program, FAO has also, under itsExpanded 'Technical Assistance Program, under-taken fishery surveys, the appraisal of develop-ment projects and the drawing up of plans.At the operational level again, its work hasdepended mainly on local resources of person-nel and equipment and, especially, in the con-duct of training and demonstration at the levelof existing industry.
This, in turn, has thrown emphasis on theweakness of counterpart support generally,which is particularly weak in fisheries in com-parison with other fields. In addition to fel-lowships, normally awarded as part of the fol-low-up of individual field projects, a numberof training centers have been arranged, accord-ing to regional needs, in fishery administra-tion, biology, statistics, marketing and inlandfisheries.
It would be premature to evaluate such ex-ternal aid as has been supplied but clearly theimpact on small fishing programs has Leen con-siderable and, apart from any successes achiev-ed locally, has had a permanent infinence onthe direction of 'fishing policy in these areas.
There have been promising indications ofcloser co-operation between the agencies con-cerned and, clearly, the value of external aid
'would be greatly enhanced if, as a re-sult of permanent consultation and advice atplanning level, capital investment programsand assistance in the field could be co-or-dinated.
Out/ook. It i.s almost a truism to state thatwidespread radical changes are not expectedto occur in underdeveloped fisheries in thenear future, but this needs to be explained byreference to the fact that fishery polici.es arestill far from being co-ordinated with generaleconomic and food policies, th.at the availablepublic services are weak and inadequately staff-ed by comparison with agriculture, and thatth.ese are often more limiting factors than theintrinsic technical difficulties of introducing im-provements. Naturally any over-all and signi-ficant increase of fish production and consump-tion must depend on economic developmentsoutside the industry which will release demandfrom i.ts present restraints. On a local scale,however, some continuing improvements canbe expected. Marine fishery research i.s ne-cessarily long-term in its execution, but, ne-vertheless, on the basis of existing appraisals,some success may be achieved by exploratoryand experimental fishing on the fringe ofpresent operations. The 'progress of mechanize,-
127
tion and gear improvement will continue, espe-cially in India, and should receive some impetusfrom the improvement of marketing facilitiesin the form of better communications andmodest facilities for storage and processing. In-stitutionally, the marketing situation will con-tinue to prove a limiting factor, but it seemscertain that many more governments will giveattention to this problem now, aun soine in-crease and expansion of co-operative market-ing arrangements can be anticipated.
The more significant improvements will prob-ably occur in the Indo-Pacific region wherefish is of much greater and more clearly recc.ig-ttized importance than elsewhere. FC W chan-ges can be foreseen in the Near East, but theprograms already well under way in Africa giveevery indication of satisfactory progress, espe-cially in inland fisheries and the improvementof fishing methods. In Latin America, develop-ment is more closely associated with balance-of-payment problems ami while the produc-tion of certain popular exportable commoditieslike fish meal and tuna can be expected toincrease, it will be more difficult to increaseproduction of cheaper species for domestic con-sumption, and considerable efforts will be re-quired to establish channels of distribution ondomestic markets.
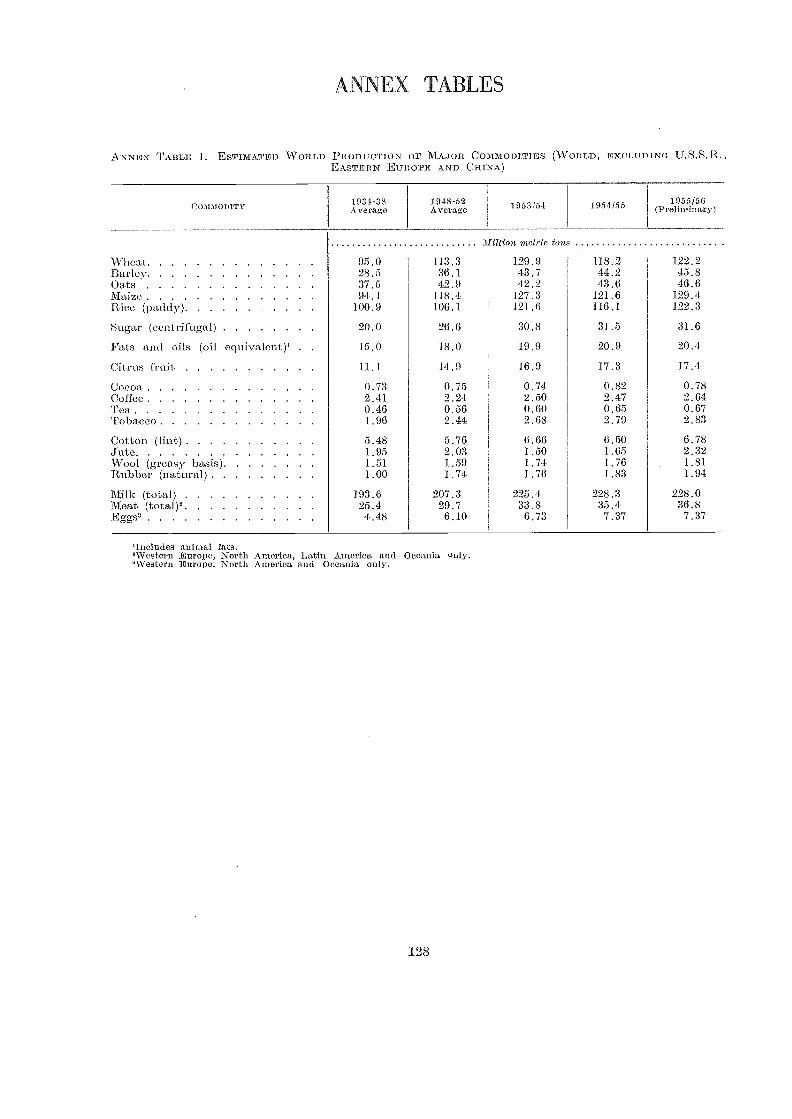
AN\
ANNEX TABLE 1. ESTIMATE D WORLD PRODUCTION OF -MAJOR COMMODITIES (WORLD, EXCLUDING U.S.S.R.,EASTERN ELTB4OPE AND CHINA)
EX TABLES
128
'Includes animal fats.'Western Europe, North America, Latin America and Oceania only.'Western Europe, North America a nd Oceania only.
COAMHBMTY1934-38Average
1948-52Average 1953/54 195,1/55 1955/56
(Preliminary)
7V1illion metric ton
WrIleat 95.0 113.3 129.9 118.2 122.2Barley 28.5 36.1 43.7 44.2 45.8Oats 37.5 42.9 42.2 43.6 46.6Maize 94.1 118.4 127.3 121.6 129.4.Rice (paddy) 100.9 106.1 121.6 116.1 122.3
Sugar (centrifugal) 20.0 26.6 30.8 31.5 31.6
Fats and oils (oil equivalent)' 15.0 18.0 19.9 20.9 20.4
Citrus fruit 11.1 14.9 16.9 17.3 17.4
COCOa 0.73 0.75 0.74 0.82 0.78Coffee 2.41 2.24 2.50 2.47 2.64Tea 0.46 0.56 0.60 0.65 0.67Tobacco 1.96 2.44 2.68 2.79 2.83
Cotton (lint) 5.48 5.76 6.66 6.50 6.78jute 1.95 2.03 1.50 1.65 2.32lArool (greasy basis) 1.51 1.59 1.74 1.76 1.81Rubber (natural) 1.00 1.74 1.76 1.83 1.94
Milk (total) 193.6 207.3 225.4 228.3 228.0Meat (total)" 25.4 29.7 33.8 35.4 36.8Eggs' 4.48 6.10 6.73 7.37 7.37
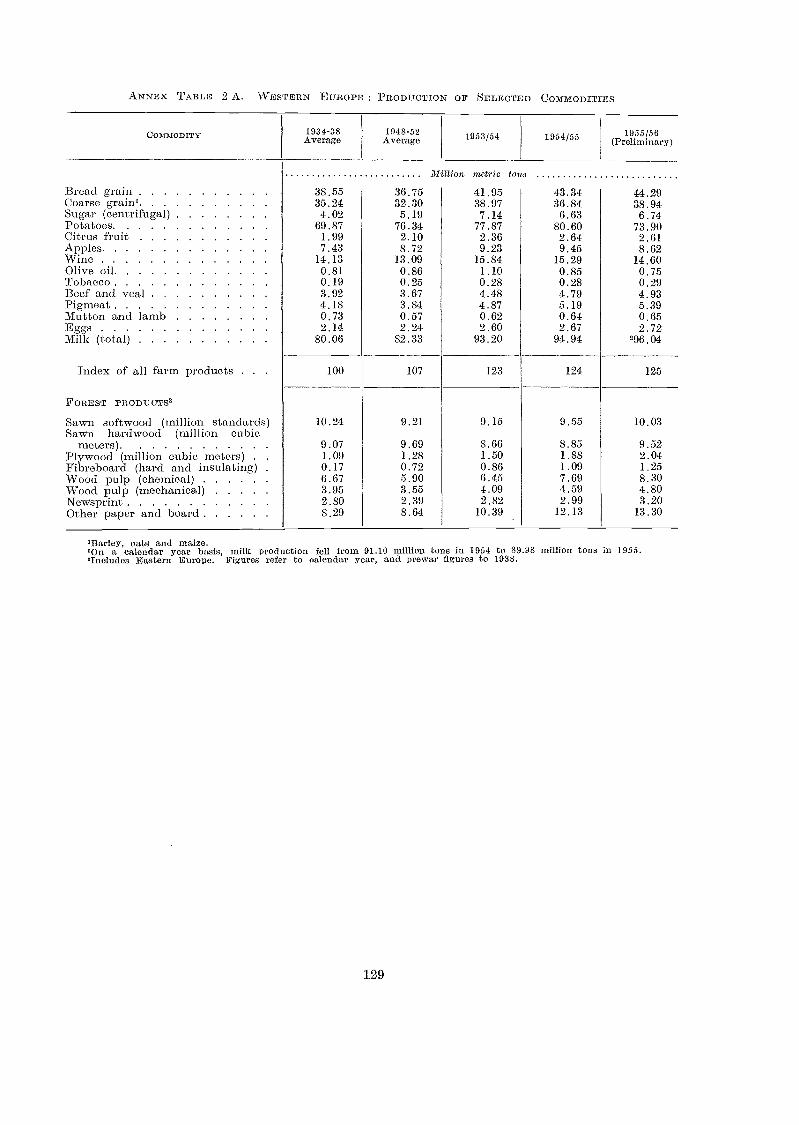
ANNEX TABLIT,' 2 A. WESTERN EUROPE : PRODUCTION OP SELECTED COMMODITIES
129
'Barley, oats and maize..Ori a calendar year basis, milk production fell from 91.10 million tons in 1054 to 89.98 million tons in 1955.aIncludes Eastern Europe. Figures refer to calendar year, and, prewar figures to 1938.
COAIMODITY 1934-38Average
1948-52Average 1953/54 1954/55 1955/56
(Preliminary)
21'llion metric tons
Bread grain 38.55 36.75 41.95 43.34 44.29Coarse grain, 35.24 32.30 38.97 36.84 38.94Sugar (centrifugal) 4.02 5.19 7.14 6.63 6.74Potatoes . 69.87 76.34 77.87 80.60 73.90Citrus fruit 1.99 2.10 2.36 2.64 2.61Apples 7.43 8.72 9.23 9.45 8.62Wine 14.13 13.09 15.84 15.29 14.60Olive oil 0.81 0.86 1.10 0.85 0.75Tobacco 0.19 0.25 0.28 0.28 0.29Beef and veal 3.92 3.67 4.48 4.79 4.93Pigmeat 4.18 3.84 4.87 5.19 5.39Mutton and lamb 0.73 0.57 0.62 0.64 0.65Eggs 2.14 2.24 2.60 2.67 2.72Milk (total) 80.06 82.33 93.20 94.94 296.04
Index of aH farm products . . . 100 107 123 124 125
FOREST PRODUCTS3
Sawn softvvood (million standards) 10.24 9.21 9.15 9.55 10.03Sawn hardwood (million cubic
meters). 9.07 9.69 8.66 8.85 9.52Plywood (million cubic meters) . . 1.09 1.28 1.50 1.88 2.04Fibreboard (hard and insulating) . 0.17 0.72 0.86 1.09 1.25Wood pulp (chemical) 6.67 5.90 6.45 7.69 8.30Wood pulp (mechanical) 3.95 3.55 4.09 4.59 4.80Newsprint 2.80 2.39 2.82 2.99 3.20Other paper and board 8.29 8.64 10.39 12.13 13.30
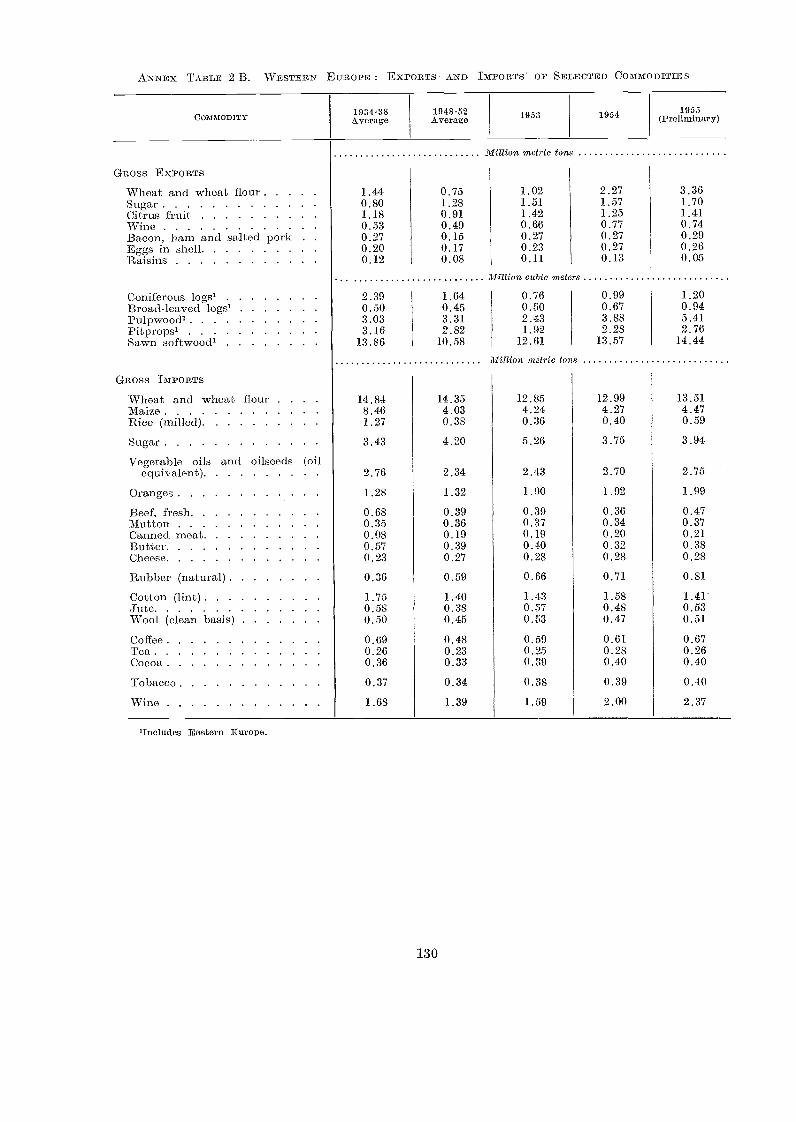
ANNEX TABLE 2 B. WESTERN EUROPE : EXPORTS AN.D IMPORTS' OP SELECTED COMMODITIES
'Includes Eastern Europe.
130
COMMODITY1934-38Average
1948-52Average 1953 1954 1955
(Preliminary)
Million metric tons
GROSS EXPORTS
Wheat and wheat flour 1.44 0.75 1.02 2.27 3.36Sugar 0.80 1.28 1.51 1.57 1.70Citrus fruit 1.18 0.91 1.42 1.25 1.41Wine 0.53 0.49 0.66 0.77 0.74Bacon, ham and salted pork 0.27 0.15 0.27 0.27 0.29Eggs in shellRaisins
0.200.12
0.170.08
0.230.11
0.270.13
0.260.05
lillion cubic meters
Coniferous logs' 2.39 1.64 0.76 0.99 1.20Broad-leaved logs' 0.50 0.45 0.50 0.67 0.94Pulpwood' 3.03 3.31 2.43 3.88 5.41Pitprops, 3.16 2.82 1.92 2.28 2.76Sawn softwood' 13.86 10.58 12.61 13.57 14.44
Million metric to, s
GROSS IMPORTS
Wheat and wheat flour . 14.84 14.35 12.85 12.99 13.51Maize 8.46 4.03 4.24 4.27 4.47Rice (milled) 1.27 0.38 0.36 0.40 0.59
Sugar 3.43 4.20 5.26 3.75 3.94
Vegetable oils and oilseeds (oilequivalent) 2.76 2.34 2.43 2.70 2.75
Oranges 1.28 1.32 1.90 1.92 1.99
Beef, fresh 0.68 0.39 0.39 0.36 0.47Mutton 0.35 0.36 0.37 0.34 0.37Canned meat 0.08 0.19 0.19 0.20 0.21Butter 0.57 0.39 0.40 0.32 0.38Cheese 0.23 0.27 0.28 0.28 0.28
Rubber (natural) 0.36 0.59 0.66 0.71 0.81
Cotton (lint) 1.75 1.40 1.43 1.58 1.41'Jute 0.58 0.38 0.57 0.48 0.53Wool (clean basis) 0.50 0.45 0.53 0.47 0.51
Co-flee 0.69 0.48 0.59 0.61 0.67Tea 0.26 0.23 0.25 0.28 0.26Cocoa 0.36 0.33 0.39 0.40 0.40
Tobacco 0.37 0.34 0.38 0.39 0.40
Wine 1.68 1.39 1.59 2.00 2.37
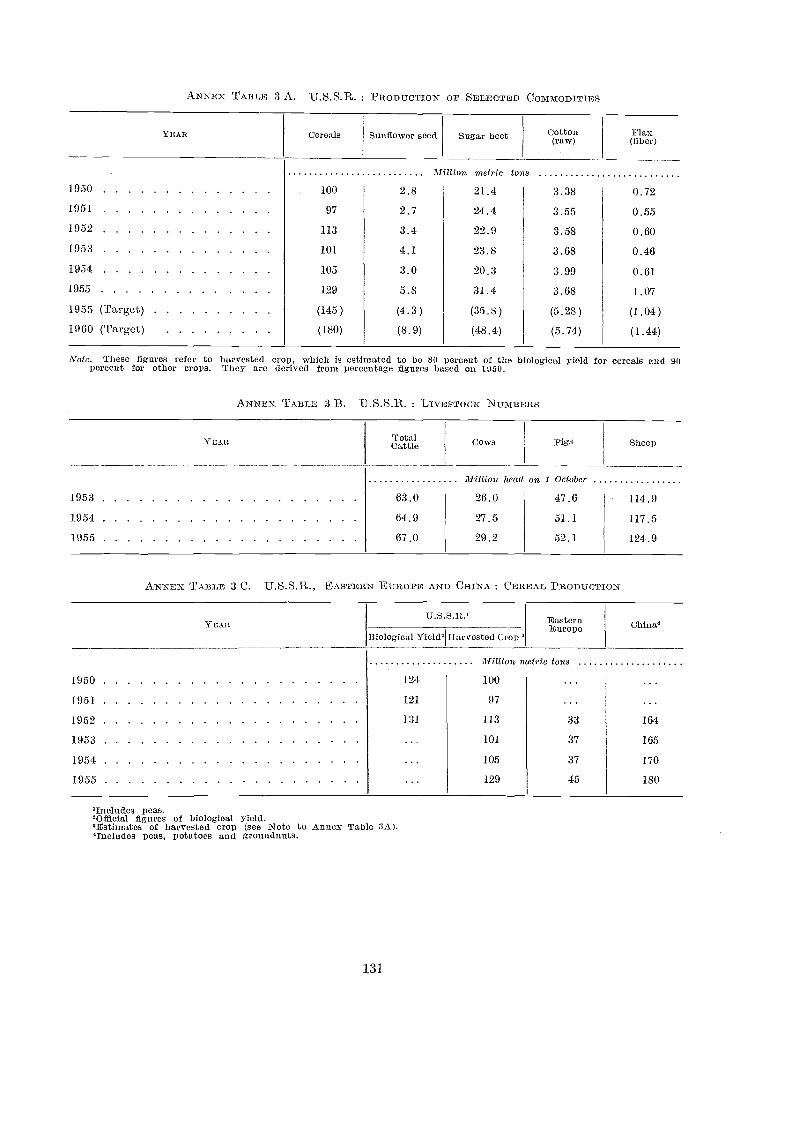
ANNEX TABLE 3 A. U.S.S.R. PRODUCTION OF SELECTED COMMODITIES
YEAR
'Includes peas.20fficial figures of biological yield.'Estimates of harvested crop (see Note to Annex Table 3A).'Includes peas, potatoes and groundnuts.
131
Note. These figures refer to harvested crop, which is estimated to be 80 percent of the biological yield for cereals and 90percent for other crops. They are derived from percentage figures based on 1950.
ANNEX TABLE 3 B. U.S.S.R. : LIVESTOCK NUMBERS
TotalCattle
ANNEx Tr ABLE 3 C. U.S.S.R., EASTERN i',UROPE AND CHINA: CEREAL PRO.DUCTION
Cows pigs Sheep
YEAR Cereals Sunflower seed Sugar beet Cotton(raw)
Flax(fiber)
Million metric tons1950 100 2.8 21.4 3.38 0.721951 97 2.7 24.4 3.55 0.551952 113 3.4 22.9 3.58 0.601953 101 4.1 23.8 3.68 0.461954 105 3.0 20.3 3.99 0.61
1955 129 5.8 31.4 3.68 1.07
1955 (Target) (145) (4.3) (35.8) (5.28) (1.04)
1960 (Target) (180) (8.9) (48.4) (5.74) (1.44)
YEARU.S.S.R.' Eastern
Europe China.4Biological Yield'I Harvested Crop
Million metric tons
1950 124 100
1951 121 97
1952 131 113 33 164
1953 101 37 165
1954 105 37 170
1955 129 45 180
Million head on I October
1953 63.0 26.0 47.6 114.9
1954 64.9 27.5 51.1 117.5
1955 67.0 29.2 52.1. 124..9
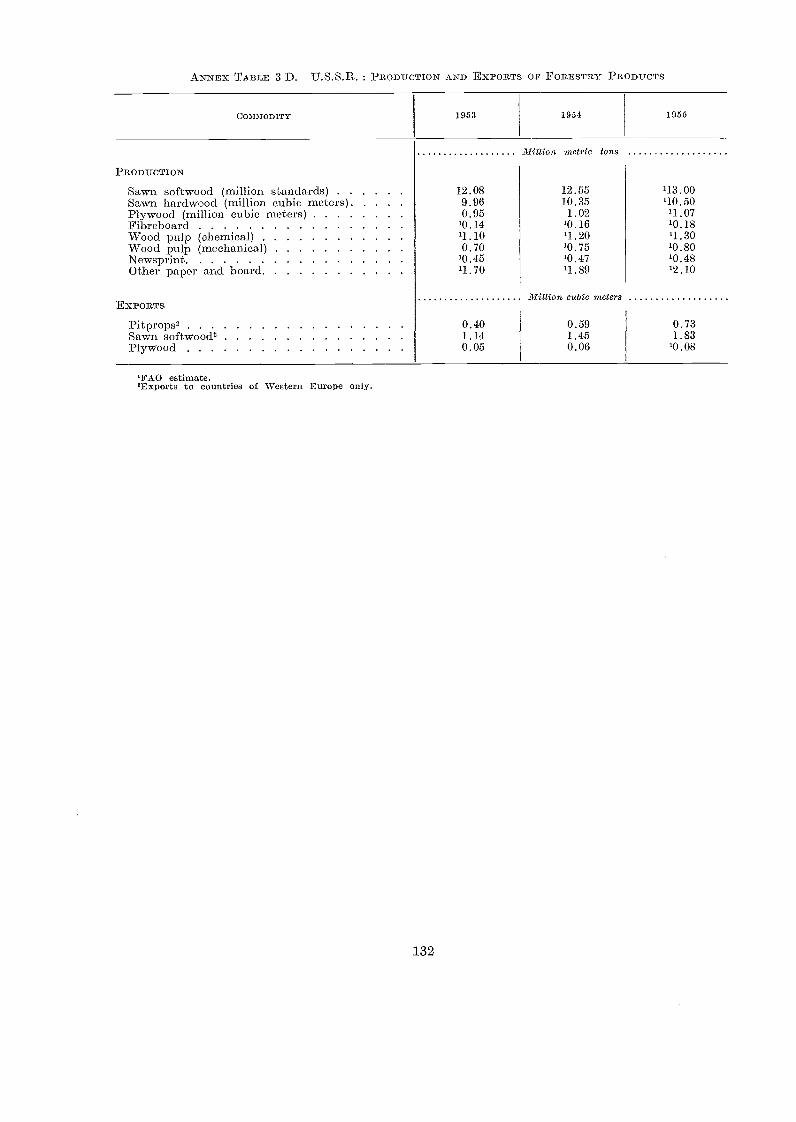
ANNEX TABLE 3 D. U.S.S.R. : PRODITCTION AND EXPORTS OP FORESTRY PRODUCTS
'FAO estimate.'Exports to countries of Western Europe only.
132
COMAIODITY 1953 1954 1955
Million metric tons
PRODUCTION
Sawn softwood (million standards) 12.08 12.55 '13.00Sawn hardwood (million cubic meters) 9.96 10.35 110.50Plywood (million cubic meters) 0.95 1.02 11.07Fibreboard 10.14 10.16 10.18Wood pulp (chemical) 11.10 11.20 '1.30Wood pulp (mechanical) 0.70 10.75 '0.80Newsprint . 10.45 10.47 10.48Other paper and board '1.70 '1.89 12.10
Million cubic metersEXPORTS
Pitprops2 0.40 0.59 0.73Sawn softwood' 1.14 1.45 1.83Plywood 0.05 0.06 10.08
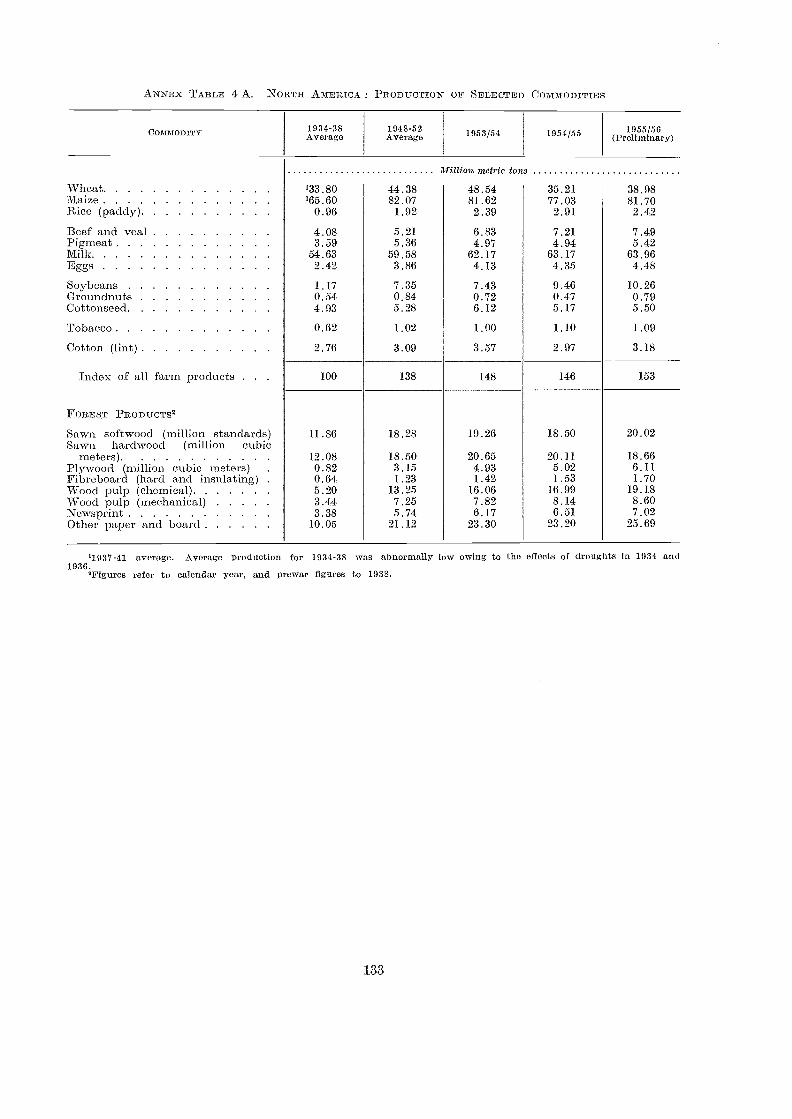
ANNEX TABLE 4 A. NO 1TH AMERICA : PRODUCTION OF SELECTED COMMODITIES
133
'1937-41 average. Average production for 1934-38 xvas abnormally low owing to the effects of droughts in 1934 and1936.
'Figures refer to calendar year, and prewar figures to 1938.
COMMODITY 1034-38Average
1948-52Average 1953/54 1954/55 1955 /5 6
(Preliminary)
Million metric Loas
Wheat 133.80 44.38 48.54 35.21 38.98Maize '65.60 82.07 81.62 77.03 81.70Rico (paddy) 0.96 1.92 2.39 2.91 2.42
Beef and \Teal 4.08 5.21 6.83 7.21 7.49Pigmeat 3.59 5.36 4.97 4.94 5.42Milk 54.63 59.58 62.17 63.17 63.96Eggs 2.42 3.86 4.13 4.35 4.48
Soybeans 1.17 7.35 7.43 9.46 10.26Groundnuts 0.54 0.84 0.72 0.47 0.79Cottonseed 4.93 5.28 6.12 5.17 5.50
Tobacco 0.62 1.02 1.00 1.10 1.09
Cotton (lint) 2.76 3.09 3.57 2.97 3.18
Index of all farm products . 100 138 148 146 153
FOREST PRODUCTS2
Sawn softwood (million standards) 11.86 18.28 19.26 18.50 20.02Sawn hardwood (million cubic
meters). 12.08 18.50 20.65 20.11 18.66PITwood (million cubic meters) . 0.82 3.15 4.93 5.02 6.11Fibreboard (hard and insulating) . 0.64 1.23 1.42 1.53 1.70VVood pulp (chemical) 5.20 13.25 16.06 16.99 19.18VVood pulp (mechanical) 3.44 7.25 7.82 8.14 8.60Newsprnat 3.38 5.74 6.17 6.51 7.02Other paper and board 10.05 21.12 23.30 23.20 25.69
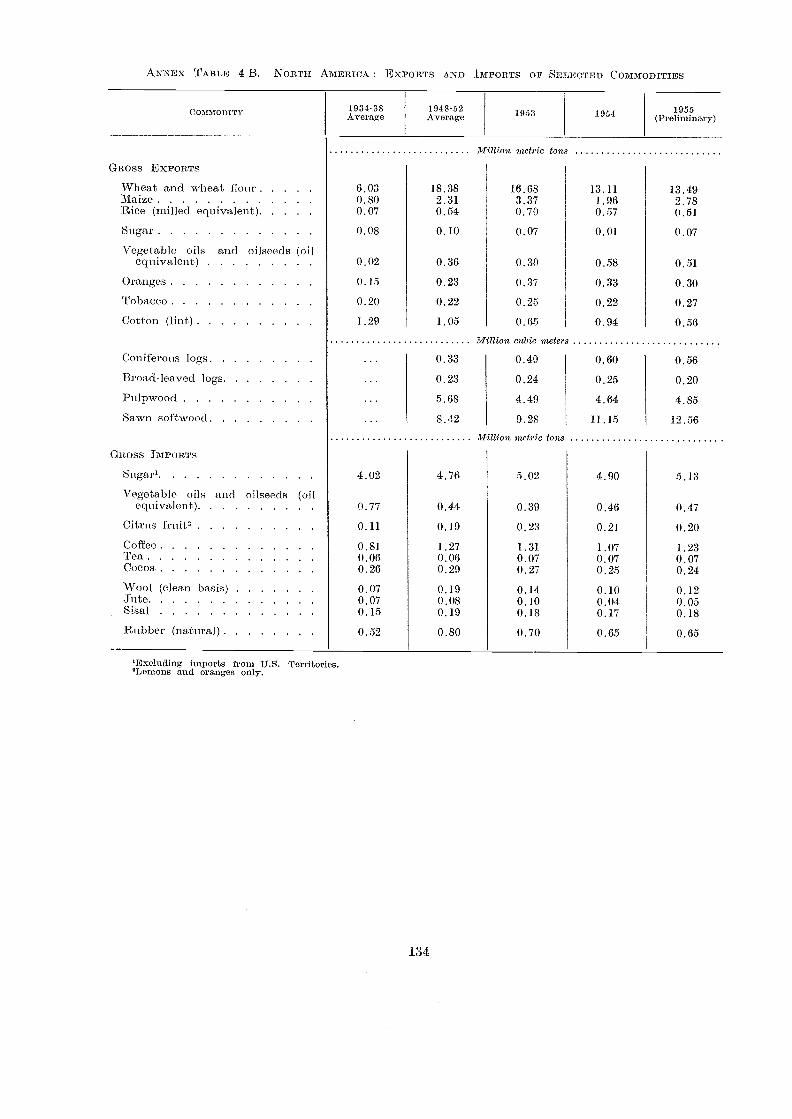
ANNEX TABLE 4 B. NORTH AMERICA : EXPORTS AND IMPORTS OF SELECTED COMMODITIES
'Excluding imports from U.S. Territories.'Lemons and oranges only.
134
COMMODITY 1934-38Average
1948-52Average 1953 1954 1955
(Preliminary)
Gaoss EXPORTS
Million metric ton
Wheat and wheat flour 6.03 18.38 16.68 13.11 13.49Maize 0.80 2.31 3.37 1.96 2.78Rice (milled equivalent) 0.07 0.54 0.70 0.57 0.51
Sugar 0.08 0.10 0.07 0.01 0.07
Vegetable oils and oilseeds (oilequivalent) 0.02 0.36 0.30 0.58 0.51
Oranges 0.15 0.23 0.37 0.33 0.30Tobacco 0.20 0.22 0.25 0.22 0.27
Cotton (lint) 1.29 1.05 0.65 0.94 0.56Million cubic meter
Coniferous logs 0.33 0.49 0.60 0.56
Broad-leaved logs 0.23 0.24 0.25 0.20Pulpwood 5.68 4.49 4.64 4.85
Sawn softwood 8.42 9.28 11.15 12.56%Union metric tons
Cuoss ImPowrs
Sugar' 4.02 4.76 5.02 4.90 5.13
Vegetable oils and oilseeds (oilequivalent) 0.77 0.44 0.39 0.46 0.47
Citrus .fruit2 0.11 0.19 0.23 0.21 0.20
Coffee 0.81 1.27 1.31 1.07 1.23Tea 0.06 0.06 0.07 0.07 0.07Cocoa 0.26 0.29 0.27 0.25 0.24Wool (clean basis) 0.07 0.19 0.14 0.10 0.12Sute 0.07 0.08 0.10 0.04 0.05Sisal 0.15 0.19 0.18 0.17 0.18Rubber (natural) 0.52 0.80 0.70 0.65 0.65
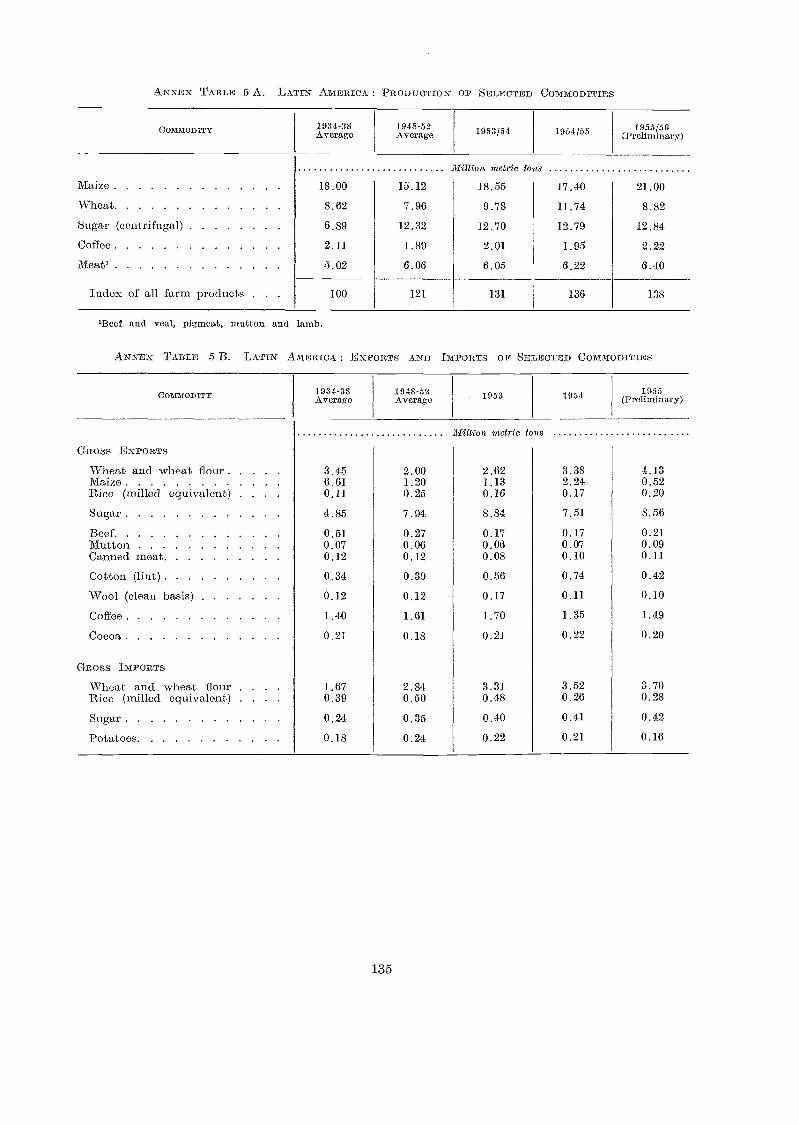
ANNEX TABLE 5 A. LATIN AMERICA PRODUCTION OF SELECTED COMMODITIES
'Beef and veal, pigment, mutton and lamb.
ANNEX TABLE 5 B. LATIN AMERICA : EXPORTS AND IMPORTS OE SELECTED COMMODITIES
135
COMMODITY 1031-38Average
1949-52Average 1953 1054 1955
(Preliminary)
llillion metric tons
GROSS EXPORTS
Wheat and wheat flour 3.45 2.00 2.62 3.38 4.13Mai7e 6.61 1.20 1.13 2.24 0.52Rice (milled equivalent) 0.11 0.25 0.16 0.17 0.20
Sugar 4.85 7.94 8.84 7.51 8.56
Beef 0.51 0.27 0.17 0.17 0.21Mutton 0.07 0.06 0.06 0.07 0.09Cmmed meat 0.12 0.12 0.08 0.10 0.11
Cotton (lint) 0.34 0.39 0.56 0.74 0.42
Wool (clean basis) 0.12 0.12 0.17 0.11 0.10
Coffee 1.40 1.61 1.70 1.35 1.49
Cocoa 0.21 0.18 0.21 0.22 0.20
Catoss IMPORTS
Wheat and wheat flour . 1.67 2.84 3.31 3.52 3.70Rice (milled equivalent) . 0.39 0.50 0.48 0.26 0.28
Sugar 0.24 0.35 0.40 0.41 0.42
Potatoes 0.18 0.24 0.22 0.21 0.16
COMMODITY 1934-38Average
1949-.52Average 1953/54 1954/55 1955/56
(Preliminary)
Trillion metric toms
Maize 18.00 15.12 18.55 11.40 21.00
Wheat 8.62 7.96 9.78 11.74 8.82
Sugar (centrifuga]) 6.89 12.32 12.70 12.79 12.84
Coffee 2.11 1.89 2.01 1.95 2.22
Meat' 5.02 6.06 6.05 6.22 6.40
Index of all farm products . . 100 121 131 136 138
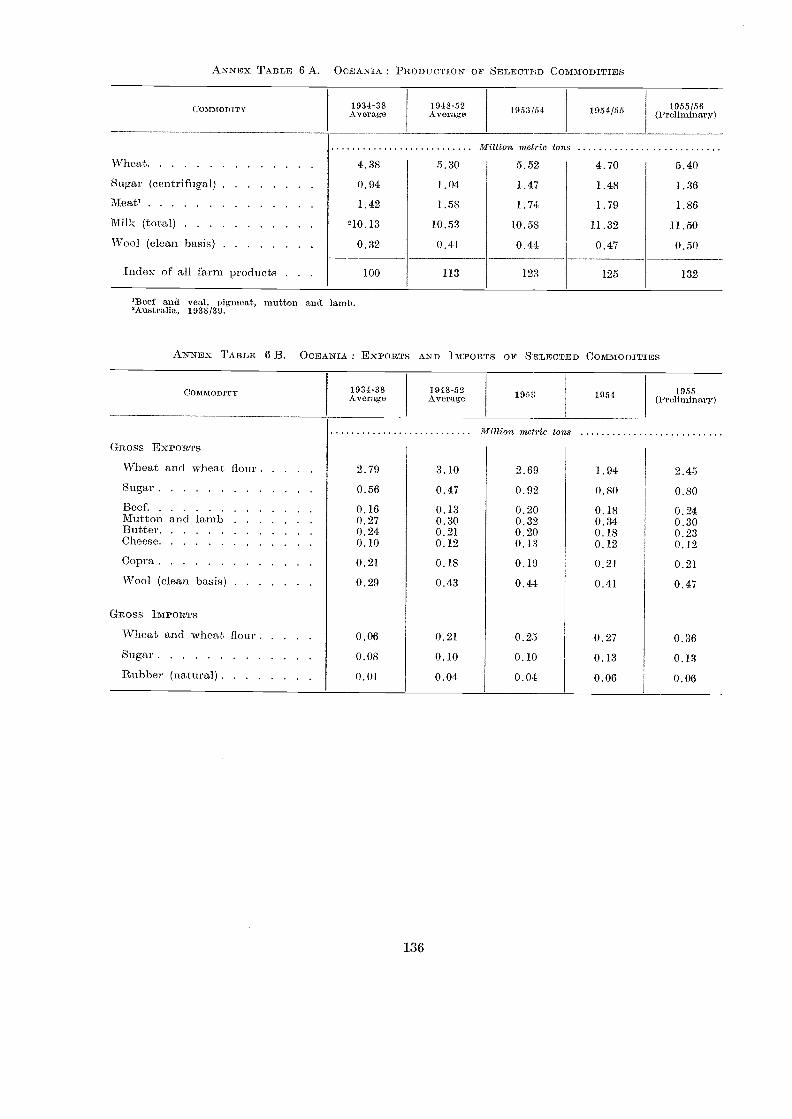
'Beef and veal, pigmeat, mutton and lamb.'Auetralia, 1938/39.
ANNEX TABLE 6 B. OCEANIA : EXPORTS AND IMPORTS OF SELECTED COMMODITIES
ANNEX TABLE 6 A. OCEA.NIA : PRODUCTION OF SELECTED COMMODITIES
136
COMMODITY 1934-38Average
1948-62Average 1953 1954 1955
(Preliminary)
GROSS EXPORTS
Million metric tons
Wheat anA wheat flour 2.79 3.10 2.69 1.94 2.45Sugar 0.56 0.47 0.92 0.80 0.80Beef 0.16 0.13 0.20 0.18 0.24Alutton anA. larnb 0.27 0.30 0.32 0.34 0.30Butter 0.24 0.21 0.20 0.18 0.23Cheese 0.10 0.12 0.13 0.12 0.12Copra 0.21 0.18 0.19 0.21 0.21
VVool (clean. bask) 0.29 0.43 0.44 0.41 0.47
GROSS IMPORTS
VVheat and wheat flour 0.06 0.21 0.25 0.27 0.36Sugar 0.08 0.10 0.10 0.13 0.13Rubber (natura) 0.01 0.04 0.04 0.06 0.06
COMMODITY 1934-38Average
1948-52Average 1953/54 1954/55 1955/56
(Preliminary)
Minion metric tons
Wheat 4.38 5.30 5.52 4.70 5.40
Sugar (centrifugal) 0.94 1.04 1.47 1.48 1.36
Meat' 1.42 1.58 1.74 1.79 1.86
Milk (total) 210.13 10.53 10.58 11.32 11.50
Wool (clean basis) 0.32 0.41 0.44 0.47 0.50
Index of all farna products 100 113 123 125 132
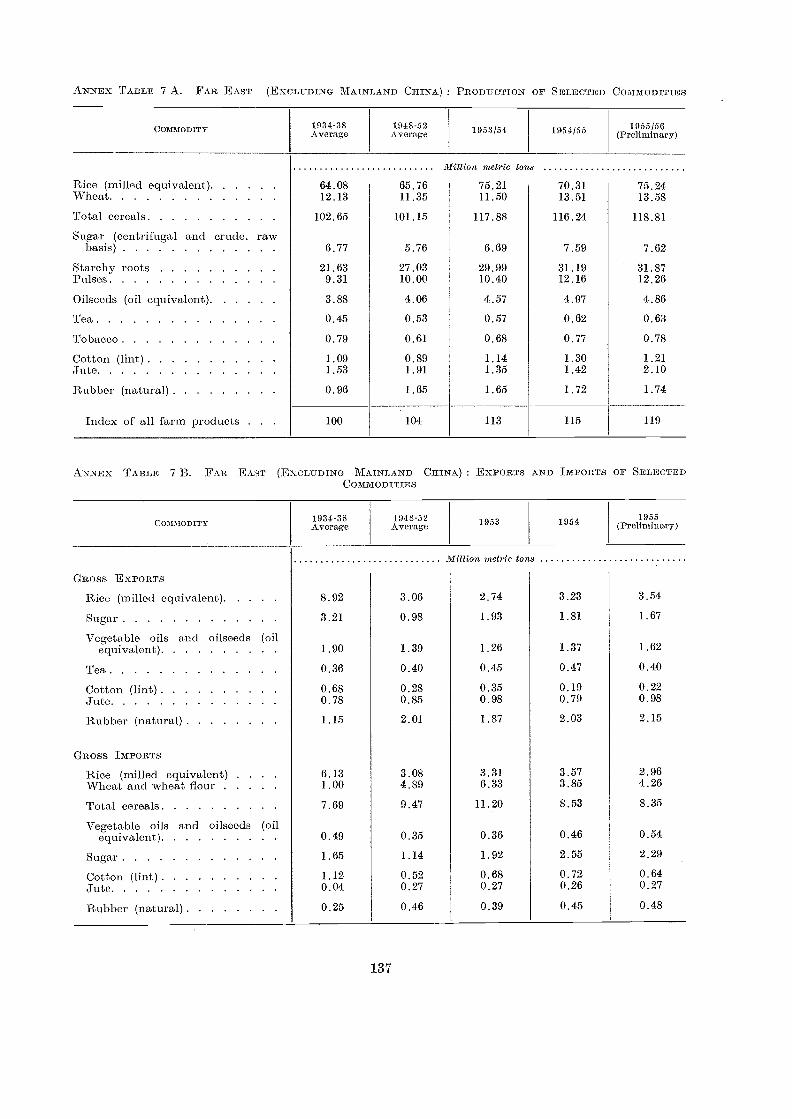
ANNEX TABLE 7 A. FAR EAST (EXCLUDING MAINLAND CHINA) . PRODITCTION OF SELECTED COMMODITIE'S
137
COMMODITIES
COMMODITY 1934-38Average
1948-52Average 1953 1954 1955
(Preliminary)
21iltion metric tons
GROSS ExPORTS
Rice (milled equivalent) 8.92 3.06 2.74 3.23 3.54
Sugar 3.21 0.98 1.93 1.81 1.67
Vegetable oils and oilseeds (oilequivalent) 1.90 1.39 1.26 1.37 1.62
Tea 0.36 0.40 0.45 0.47 0.40
Cotton (lint) 0.68 0.28 0.35 0.19 0.22Jute 0.78 0.85 0.98 0.79 0.98
Rubber (natural) 1.15 2.01 1.87 2.03 2.15
GROSS IMPORTS
Rice (milled equivalent) . . 6.13 3.08 3.31 3.57 2.96Wheat and wheat flour 1.00 4.89 6.33 3.85 4,26
Total cereals 7.69 9.47 11.20 8.53 8.35
Vegetable oils and oilseeds (oilequivalent) 0.49 0.35 0.36 0.46 0.54
Sugar 1.65 1.14 1.92 2.55 2.29
Cotton (lint) 1.12 0.52 0.68 0.72 0.64Jute 0.04 0.27 0.27 0.26 0.27
Rubber (natural) 0.25 0.46 0.39 0.45 0.48
COMMOD ITY 1934-38Average
1918-52Average 1553/54 1554/55 1955/56
(Preliminary)
Million metric tons
Rice (milled equivalent) 64.08 65.76 75.21 70.31 75.24Wheat 12.13 11.35 11.50 13.51 13.58
Total cereals 102.65 101.15 117.88 116.24 118.81
Sugar (centrifugal and crude, rawbasis) 6.77 5.76 6.69 7.59 7.62
Starchy roots 21.63 27.03 29.99 31.19 31.87Pulses 9.31 10.00 10.40 12.16 12.26
ffilseeds (oil equivalent) 3.88 4.06 4.57 4.97 4.86
Tea 0.45 0.53 0.57 0.62 0.63
Tobacco 0.79 0.61 0.68 0.77 0.78
Cotton (lint) 1.09 0.89 1.14 1.30 1.21Jute 1.53 1.91 1.35 1.42 2.10
Rubber (natural) 0.96 1.65 1.65 1.72 1.74
Index of all farm products . 100 104 113 115 119
ANNEX TABLE 7 B. FAB, EAST (EXCLUDING MAINLAND CHINA) : EXPORTS AND IMPORTS OF SELECTED
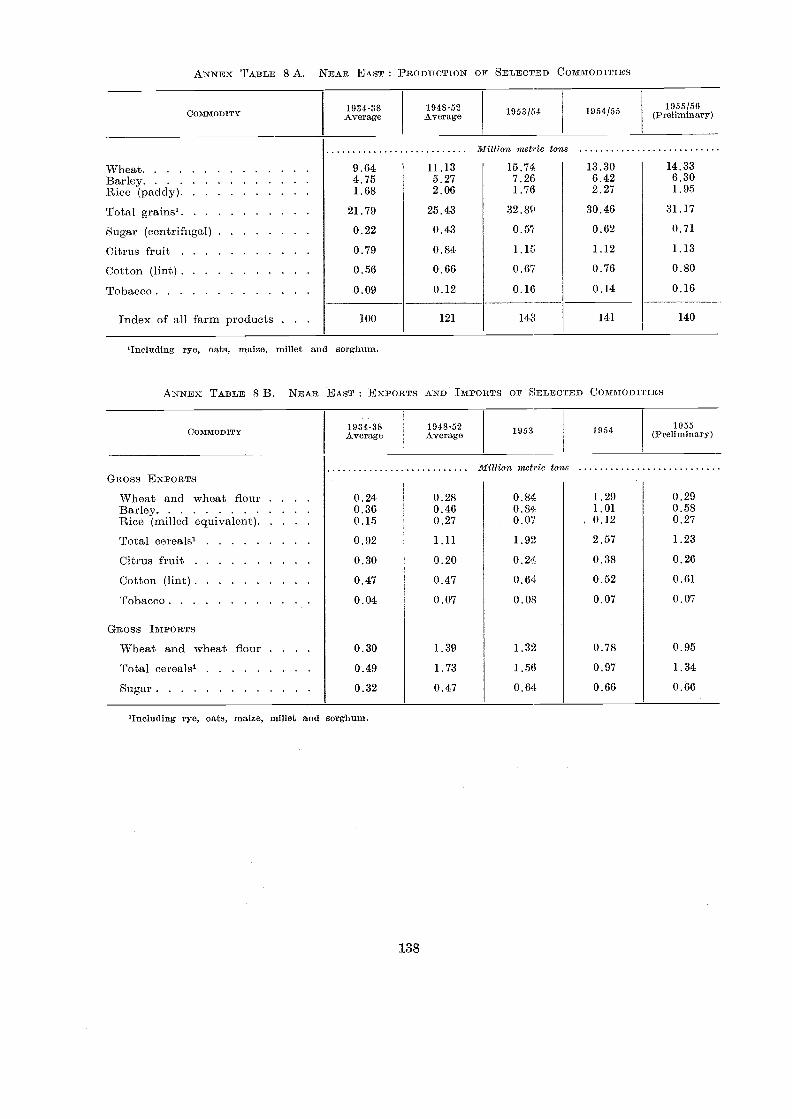
ANNEX TABLE 8 A. NEAR EAST : PRODUCTION OF SELECTED COMMODITIES
'Including rye, oats, maize, millet and sorghum.
ANNEX TABLE 8 B. NEAR EAST : EXPORTS AND IMPORTS OF SELECTED COMMODITIES
'Including rye, oats, maize, millet and sorghum.
138
COMMODITY1934-38Average
1948-52Average 1953/54 1954/55 1955/56
(Preliminary)
COMMODITY1934-38Average
1948-52Average 1953 1954 1955
(Preliminary)
Million metric to?GROSS EX:PORTS
VVheat and wheat flour 0.24 0.28 0.84 1.29 0.29Barley 0.36 0.46 0.84 1.01 0.58Rice (nadled equivalent) 0.15 0.27 0.07 . 0.12 0.27
Total cereals' 0.92 1.11 1.92 2.57 1.23
Citrus fruit 0.30 0.20 0.24 0.38 0.26
Cotton (lint) 0.47 0.47 0.64 0.52 0.61
Tobacco 0.04 0.07 0.08 0.07 0.07
GROSS ImPonTs
Wheat and wheat flour 0.30 1.39 1.32 0.78 0.95
Total cereals' 0.49 1.73 1.56 0.97 1.34
Sugar 0.32 0.47 0.64 0.66 0.66
Million metric tons
Wheat 9.64 11.13 15.74 13.30 14.33Barley 4.75 5.27 7.26 6.42 6.30Rice (paddy) 1.68 2.06 1.76 2.27 1.95
Total grains' 21.79 25.43 32.89 30.46 31.17
Sugar (centrifugal) 0.22 0.43 0.57 0.62 0.71
Citrus fruit 0.79 0.84 1.15 1.12 1.13
Cotton (lint) 0.56 0.66 0.67 0.76 0.80
Tobacco 0.09 0.12 0.16 0.14 0.16
Index of all farm products . . 100 121 143 141 140
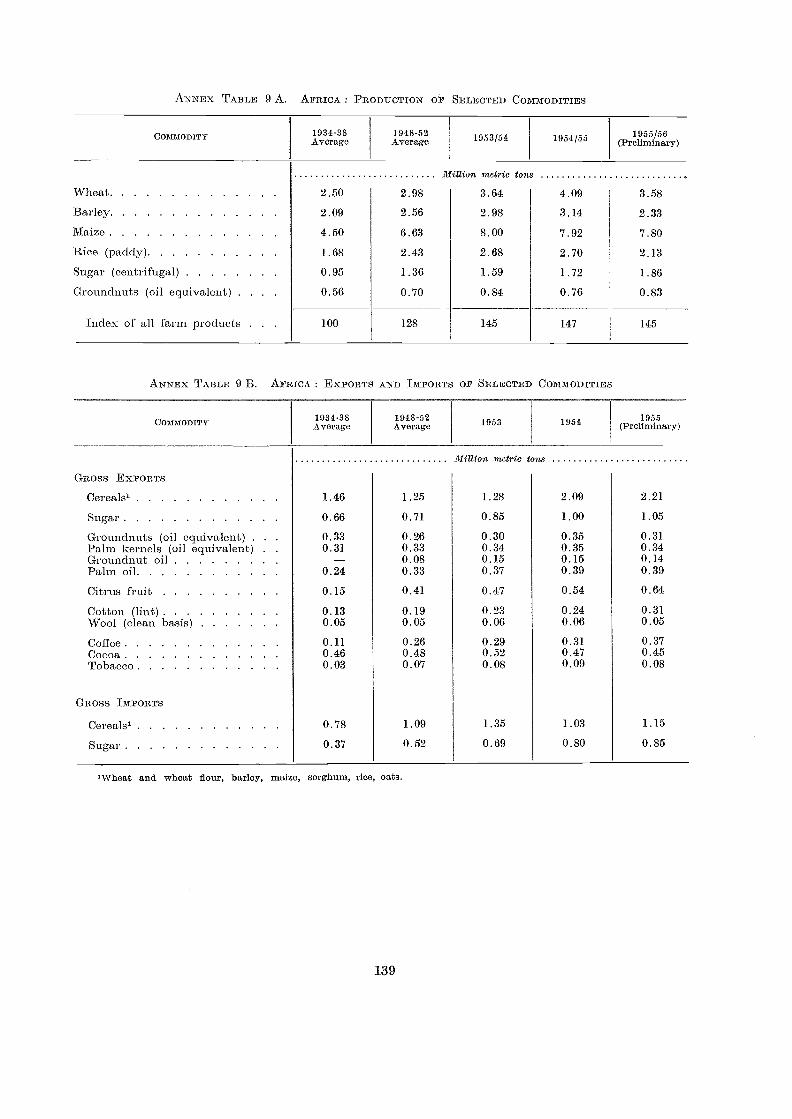
ANNEX TABLE 9 A. AFRICA : PRODUCTION or SELECTED COMMODITIES
COMMODITY 1934-38A verage
'Wheat 8,nd wheat flour, barley, maize, sorghum, rice, oats.
139
1948-52Average 1953
ANNEX '1.7ABLE 9 B. AFRICA : EXPORTS AND IMPORTS OF SELECTED COMMODITIES
1954 1955(Preliminary)
Million metric tons
3ROSS EXPORTS
Cereals'
Sugar
Groundnuts (oil equivalent) . .
1.46
0.66
0.33
1.25
0.71
0.26
1.28
0.85
0.30
2.09
1.00
0.35
2.21
1.05
0.31Palm kernels (oil equivalent) . . 0.31 0.33 0.34 0.35 0.34Groundnut oil - 0.08 0.15 0.15 0.14Palm oil 0.24 0.33 0.37 0.39 0.39
Citrus fruit 0.15 0.41 0.47 0.54 0.64
Cotton (lint) 0.13 0.19 0.23 0.24 0.31Wool (clean basis) 0.05 0.05 0.06 0.06 0.05
Coffee 0.11 0.26 0.29 0.31 0.37Cocoa 0.46 0.48 0.52 0.47 0.45Tobacco 0.03 0.07 0.08 0.09 0.08
Gaoss IMPORTS
Cereals" 0.78 1.09 1.35 1.03 1.15
Sugar 0.37 0.52 0.69 0.80 0.85
COMMODITY 1934-38Average
1948-52Average 1953/54 1954/55 1955/56
(Preliminary)
Million metric Ions
Wheat 2.50 2.98 3.64 4.09 3.58
Barley 2.09 2.56 2.98 3.14 2.33
Maize 4.50 6.63 8.00 7.92 7.80
Rice (paddy) 1.68 2.43 2.68 2.70 2.13
Sugar (centrifugal) 0.95 1.36 1.59 1.72 1.86
Groundnuts (oil equivalent) . . 0.56 0.70 0.84 0.76 0.83
"Index of all farm products . 100 128 145 147 145
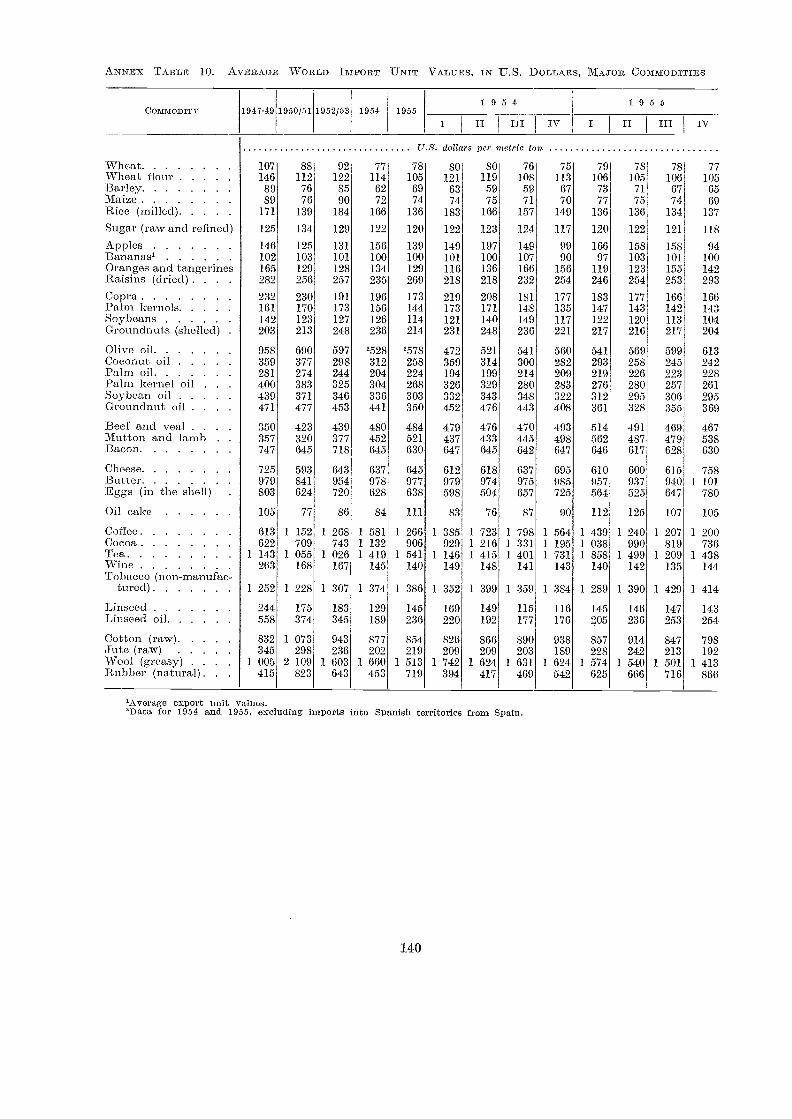
ANNEX TABLE 10. AVERAGE WORLD IINIPORT UNIT VALTJES, IN U.S. DOLLARS, MAJOR COMMODITIES
COMMODITY 1917-49 1950/51 1952/53 1954 1955
U.S. dollars per metric ton
'Average export unit values.'Data for 1954 and 1955, excluding imports into Spanish territories from Spain.
140
VVheatVVheat flourBarley
10714689
8811276
92122
85
77114
62
78105
69
80121
63
8011959
76108
59
75113
67
79106
73
78105
71
78106
67
7';1W
6EAlaize 89 76 90 72 74 74 75 71 70 77 75 74 6[Rice (milled) 171 139 184 166 136 183 166 157 149 136 136 134 13Sugar(rawand refined) 125 134 129 122 120 122 123 124 117 120 122 121 11E
Apples 146 125 131 156 139 149 197 149 99 166 158 158 9Bananas' 102 103 101 100 100 101 100 107 90 97 103 101 10(Oranges asid tangerines 165 129 128 134 129 116 136 166 156 119 123 155 14Raisins (dried) 282 256 257 235 269 218 218 232 254 246 254 253 29::
Copra 232 230 191 196 173 219 208 181 177 183 177 166 16(Palm kernnls 161 170 173 156 144 173 171 148 135 147 143 142 14ESoybeans 142 123 127 126 114 121 140 149 117 122 120 113 109Groundnuts (shelled) 203 213 248 236 214 231 248 236 221 217 216 217 209
Olive oil 958 690 597 2528 2578 472 521 541 560 541 569 599 611Coconut oil 359 377 298 312 258 359 314 300 282 293 258 245 24iPalm oil 281 274 244 204 224 194 199 214 209 219 226 223 22EPaNn kernel oil . . 400 383 325 304 268 326 329 280 283 276 280 257 261Soybean oil 439 371 346 336 303 332 343 348 322 312 295 306 29Grounchlut oil . . . . 471 477 453 441 350 452 476 443 408 361 328 355 36f
Beef and veal . . . . 350 423 439 480 484 479 476 470 493 514 491 469 46Mutton and lamb . 357 320 377 452 521 437 433 445 498 562 487 479 53EBacon 747 645 718 645 630 647 645 642 647 646 617 628 63(
Cheese 725 593 643 637 645 612 618 637 695 610 600 615 75EButter 979 841 954 978 977 979 974 975 985 957 937 940 1 101Eggs (in the shell) 803 624 720 628 638 598 504 657 725 564 525 647 78(
Oil cake 105 77 86 84 111 83 76 87 90 112 125 107 101
Cofine 613 1 152 1 268 1 581 1 266 1 385 1 723 1 798 1 564 1 439 1 240 1 207 1 20(Cocoa 622 709 743 1 132 906 929 1 216 1 331 1 195 1 038 990 819 73ETea 1 143 1 055 1 026 1 419 1 541 1 146 1 415 1 401 1 731 1 858 1 499 1 209 1 43EWine 263 168 167 145 140 149 148 141 143 140 142 135 144Tobacco (non-manufac-
tured) 1 252 1 228 1 307 1 374 1 386 1 352 1 399 1 359 1 384 1 289 1 390 1 429 1 414
Linseed 244 175 183 129 145 169 149 115 116 145 146 147 14Elinseed. oil 558 374 345 189 236 220 192 177 176 205 236 253 254
Cotton (raw) . 832 1 073 943 877 854 826 866 890 938 857 914 847 79EJute (raw) 345 298 236 202 219 209 209 203 189 228 242 213 19'z'Wool (greasy) . . . . 1 005 2 109 1 603 1 660 1 513 1 742 1 624 1 631 1 624 1 574 1 540 1 501 1 4E3Rubber (natural). . . 415 823 643 453 719 394 417 469 542 625 666 716 86E
1954 1955II III IV II III IV
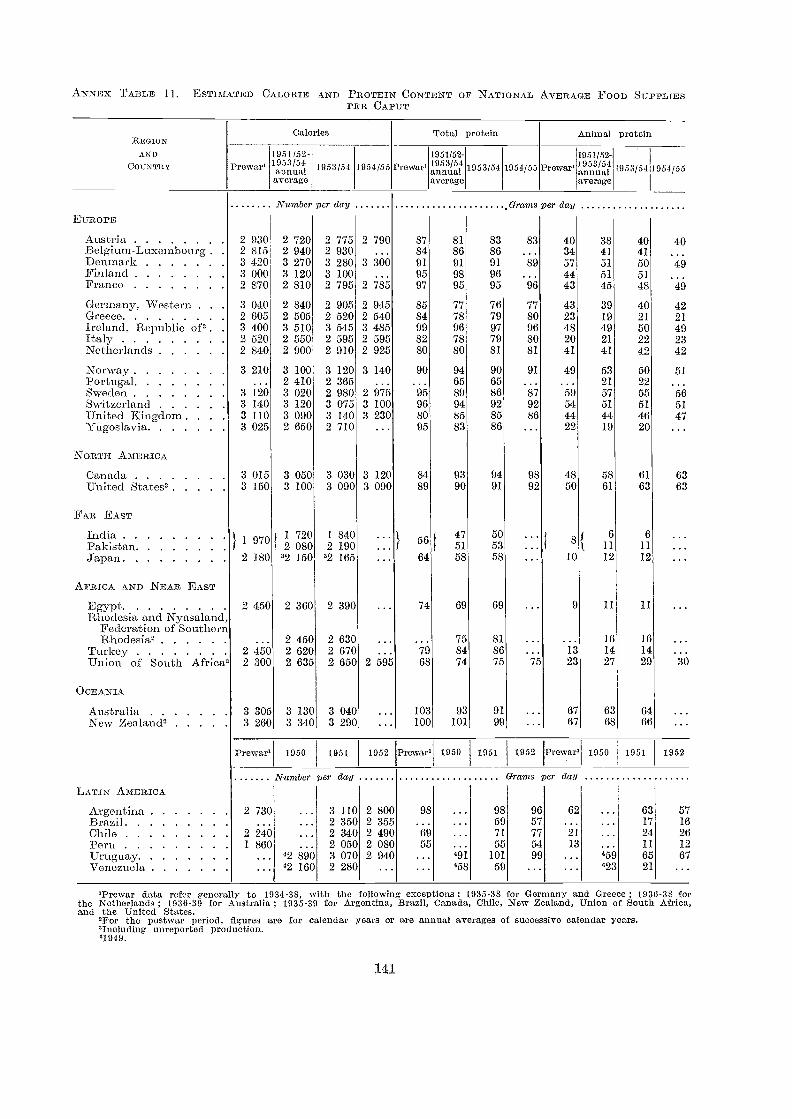
ANNEX TABLE 11. ESTIMATED CALORIE AND PROTEIN- CONTENT OF NATIONAL AVERAGE FOOD SUPPLIESPER CAPUT
EIJ.ROPE
REGION
AND
COUNTRY
AustriaBelgium-Luxembourg .DenmarkFinlandFrance
Germany, Western . .
GreeceIreland, Republic of".ItalyNetherlands
NorwayPortugalSwedenSwitzerlandUnited KingdomYugoslavia
NORTH AMERICA
CanadaUnited States'
FAR. EAST
IndiaPakistanJapan
AFRICA AND NEAR EAST
EgyptRhodesia and Nyasaland,
Federation of SouthernRhodesia'
Turkey . . . . . .
Union of South Africa'
OCEANIA
AustraliaNew Zealand'
LATIN AMERICA
ArgentinaBrazilChilePeruUruguayVenezuela
Prewar'
2 9302 8153 4203 0002 870
3 0402 6053 4002 5202 840
3 210
3 1203 1403 1103 025
3 0153 150
} 1 9702 180
2 450
2 ,i(*)2 300
3 3053 260
Prewar'
2 730
2 2401 860
.
1951 /52 -1953/54annualaverage
Calories
Numbe2 per day
2 7202 9403 2703 1202 810
2 8402 5053 5102 5502 900
3 1002 4103 0203 1203 0902 650
3 0503 100
1 720/ 2 080
'2 150
2 360
2 4502 6202 635
3 1303 340
1950
1953/54
2 7752 9303 2803 1002 795
2 9052 5203 5452 5952 910
3 1202 3652 9803 0753 1402 710
3 0303 090
1 8402 190
'2 165
2 390
2 6302 6702 650
3 0403 290
1951
Number per day
1954/55
2 790
3 iòò
2 78
2 9452 5403 4852 5952 925
3 140
2 9753 1003 230
3 1203 090
2
3 110 2 8002 350 2 355
... 2 340 2 490. 2 050 2 080
cl2 890 3 070 2 94042 160 2 280
Prewar'
8784919597
8584998280
90
95968095
8489
} 56
64
74
7968
103100
1952 Prewar'
98
6955
Total protein
1951/52-1953/54annualaverage
8186919895
7778967880
946589948583
9390
47} 51
58
1950
69
758474
93101
491458
1953/54
8386919695
7679977981
906586928586
9491
505358
1951
69
818675
9199
1954/55
,Grams per day
83
89
67780968081
91
879286
9892
1952
98 9659 5771 7755 54
101 9959
Prewar'
4034574443
4323482041
49
59544422
4850
810
9
1323
6767
Prewar'
Grams per day
62
2113
Animal protein
1951/52-1933/54annualaverage
3841515145
3919492141
532157514419
5861
1950
6 611 1112 12
16 1614 1427 29
63 6468 66
459
423
1953/54
4041505148
4021502242
502255514620
6163
1951
1959/55
40
49
49
4221492342
51
565147
6363
30
1952
63 5717 1624 2611 1265 6721
'Prewar data refer generally to 1934-38, with the following exceptions : 1935-38 for Germany and Greece ; 1939-38 Sorthe Netherlands ; 1930-39 for Australia ; 1935-39 Sor Argentina, Brazil, Canada, Chile, New Zealand, Union of South Africa,and the United States.
For the postwar period, figures are for calendar years or are annual averages of successive calendar years.'Including unreported production.'1949.
141
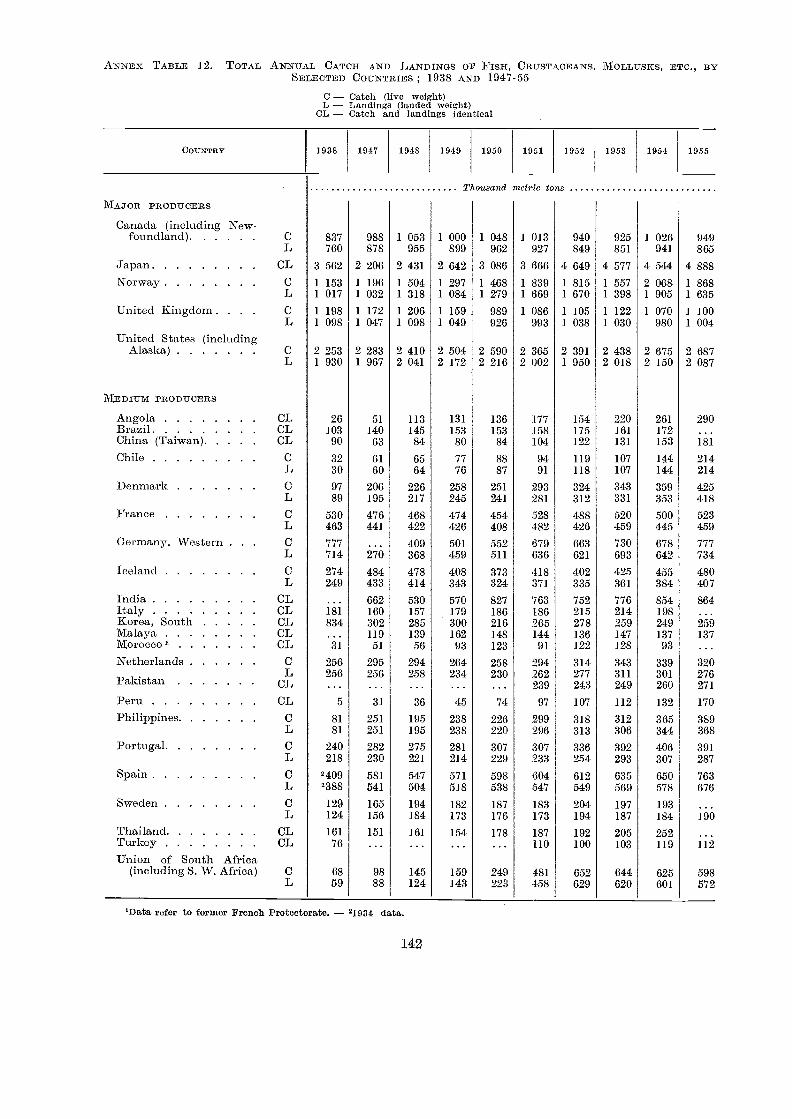
ANNEX TABLE 12. TOTAL ANNUAL CATCH AND LANDINGS OF FISH, CRUSTACEANS, MOLLUSKS, ETC., BYSELECTED COUNTRIES; 1938 AND 1947-55
C Catch (live xveight)L Landings (landed weight)
CL Catch and landings identical
'Data refer to former French Protectorate. 21934 data.
142
COUNTRY 1938 1947 1948 1949 1950 1951 1952 1953 1954 1955
Thousand metric tons
MAJOR PRODUCERS
Canada (including New-foundland) . c 837 988 1 053 1 000 1 048 1 013 940 925 1 026 949
L 760 878 955 899 962 927 849 851 941 865
Japan CL 3 562 2 206 2 431 2 642 3 086 3 666 4 649 4 577 4 544 4 888
Norway C 1 153 1 196 1 504 1 297 1 468 1 839 1 815 1 557 2 068 1 868L 1 017 1 032 1 318 1 084 1 279 1 669 1 670 1 398 1 905 1 635
-United Kingdom. . . . C 1 198 1 172 1 206 1 159 989 1 086 1 105 1 122 1 070 1 100L 1 098 1 047 1 098 1 049 926 993 1 038 1 030 980 1 004
-United States (includingAlaska) C 2 253 2 283 2 410 2 504 2 590 2 365 2 391 2 438 2 675 2 687
L 1 930 1 967 2 041 2 172 2 216 2 002 1 950 2 018 2 150 2 087
MEDIUM PRODUCERS
Angola CL 26 51 113 131 136 177 154 220 261 29013razil CL 103 140 145 153 153 158 175 161 172 ..China (Taiwan)Chile
ca,c
90
32
63
61
84
65
80
77
84
88
104
94
122
119
131
107
153
144
181
214L 30 60 64 76 87 91 118 107 144 214
Denmark C 97 206 226 258 251 293 324 343 359 425L 89 195 217 245 241 281 312 331 353 418
France C 530 476 468 474 454 528 488 520 500 523L 463 441 422 426 408 482 426 459 445 459
Germany, Western . . . C 777
.
409 501 552 679 663 730 678 777L 714 '76 368 459 511 636 621 693 642 734
Iceland c 274 484 478 408 373 418 402 425 455 480L 249 433 414 343 324 371 335 361 384 407
India CL ... 530 570 827 763 752 776 854 864ItalyICorea, South
CLCL
181
834160302
157
285179
300186216
186265
215278
214259
198249
...
259Malaya CL ... 119 139 162 148 144 136 147 137 137Morocco' CAL 31 51 56 93 123 91 122 128 93 ...
Netherlands C 256 295 294 264 258 294 314 343 339 320L 256 256 258 234 230 262 277 311 301 276Paldstan CL ... ... ... ... ... 239 243 249 260 271
Peru CL 5 31 36 45 74 97 107 112 132 170
Philippines C 81 251 195 238 226 299 318 312 365 389L 81 251 195 238 220 296 313 306 344 368
Portugal C 240 282 275 281 307 307 336 392 406 391L 218 230 221 214 229 233 254 293 307 287
Spain C 2409 581 547 571 598 604 612 635 650 763L '388 541 504 518 538 547 549 569 578 670
Sweden c 129 165 194 182 187 183 204 197 193L 124 156 184 173 176 173 194 187 184 166
ThRiland CL 161 151 161 154 178 187 192 205 252Turkey CL 76 ... ... ... ... 110 100 103 119 112
Union of South Aftica(includingS. W. Africa) C 68 98 145 159 249 481 652 644 625 598
L 59 88 124 143 223 458 629 620 601 572
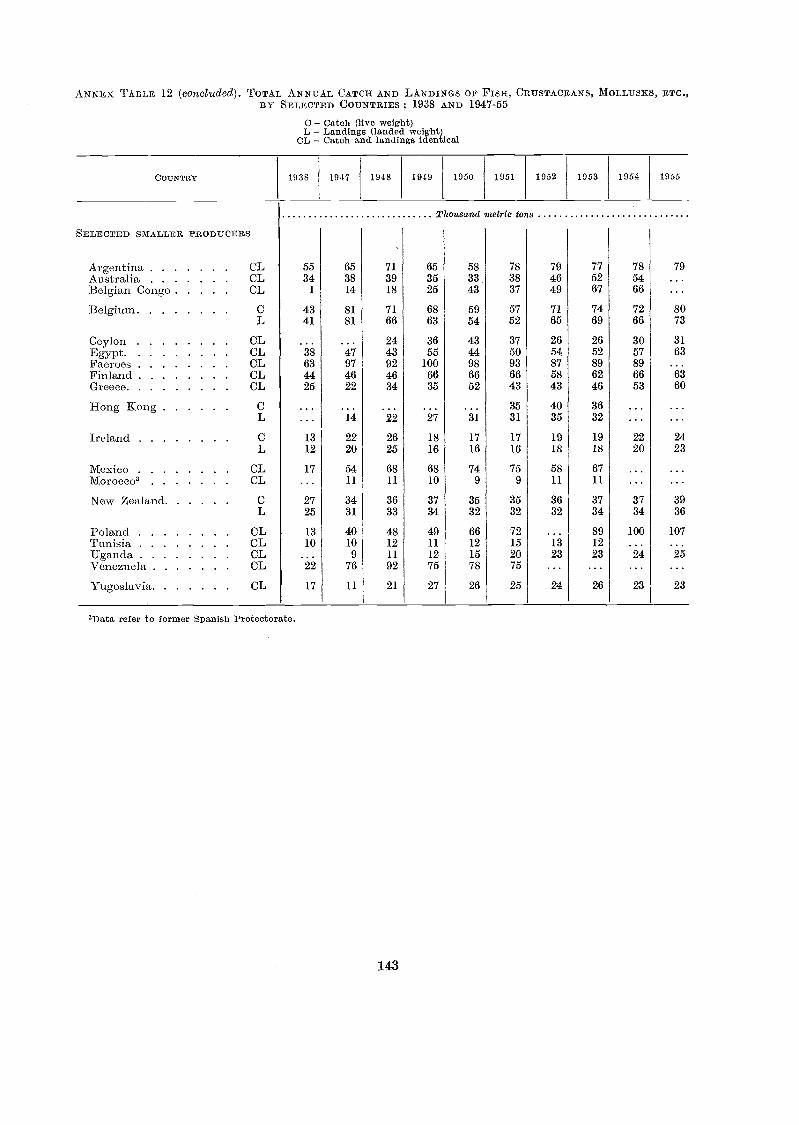
ANNEX TABLE 12 (concluded). TOTAL ANNTJAL CATCH AND LANDINGS OE FISH, CRUSTACEANS, MOLLUSKS, ETC.,BY SELECTED COUNTRIES; 1938 AND 1947-55
C Catch (live weight)L Landings (landed weight)
CL Catch and landings identical
,Data refer to former Spanish Protectorate.
143
Thousand metric tons
3ELECTED SMALLER PRODUCERS
Argentina CL 55 65 71 65 58 78 79 77 78 79
Australia CL 34 38 39 35 33. 38 46 52 54 ...
Belgian Congo CL 1 14 18 25 43 37 49 67 66 ...
Ekdgiuin c 43 81 71 68 59 57 71 74 72 80L 41 81 66 63 54 52 65 69 66 73
Ceylon CLEgYPt ca,
...38
...
472443
3655
4344
3750
2654
2652
3057
3163
Famroes cif, 63 97 92 100 98 93 87 89 89 ...
Finland ca, 44 46 46 66 66 66 58 62 66 63
Greece ca,
Hong Kong CL
25
'"...
22
14
34
22
35
27
52
31
43
3531
43
4035
46
3632
53
...
...
60
Ireland C 13 22 26 18 17 17 19 19 22 24L 12 20 25 16 16 16 18 18 20 23
Mexico ca,Moroceo3 ca,
New Zealand C
17
...
27
5411
34
6811
36
6810
37
749
35
759
35
5811
36
6711
37 37
...
39
L 25 31 33 34 32 32 32 34 34 36
Poland CL 13 40 48 49 66 72 .. 89 100 107
Tunisia (1.Uganda CLVenezuela CL
10...22
10
9
76
12
11
92
11
12
75
12
15
78
15
20
75
1323...
1223...
. .
...
24 25...
...
Yugoslavia ca, 17 11 21 27 26 25 24 26 23 23
COUNTRY 1938 1947 1948 1919 1950 1951 1952 1953 1954 1955

STAI3ILIMENTO TIPOGRAFICO FAUSTO FAILLI - ROMA
SALES AGE!'-7TS 70R FAO PLMICATIONS
Argentina : Editorial Sudamericana, S. A. Alsina 500, Buenos Aires. - Australia : H. A. Goddard Pty. Ltd., 255a GeorgeStreet, Sydney. - Austria : Wilhelm Frick Buchhandlung, Graben 27, Vienna 1. - Belgium : Agence et Messageries dela Presse, 14-22 rue du Persil, Brussels. - Brazil : Livraria Agir, Rua Mexico 98-B, Rio de Janeiro.- Burma: Wholesale:
Orient Longmans Ltd., 17 Chittaranjan Avenue, Calcutta 13, India. - Canada : The Ryerson Press, 299 Queen Street West
Toronto 2, Ontario ; Periodica, 5112 Av. Papineau, Montreal 34. - Ceylon : Whoiesafe: Orient Longmans Ltd., 17 Chitta-
ranjan Avenue, Calcutta 13, India. - Chile : Sala y Vila Ltda., Bandera 140-F, Casilla 180D, Santiago. - Colombia : " Agri-
cultura Tropical," Carrera 13, No. 13-17, Bogotá ; Libreria Central, Calle 14, No. 6-88, Bogotá. - Costa Rica : Trejos Her-
manos, Apartado 1313, San José. - Cuba : René de Smedt, La Casa Belga, O'Reilly 455, Havana. - Cyprus : Marcos E.
Constantinides, P. O. Box 473, Nicosia. - Denmark s Einar Munksgaard, Norregade 6, Copenhagen K. - Ecuador : " LaHacienda," Esobedo No. 1003 y P. lcaza, Casilla No. 3983, Guayaquil ; Libreria Muñoz Hnos. y Cía., Apartado 522, Quito.
- Egypt : Librairie de la Renaissance d'Egypte, 9 Sh. Adly Pasha, Cairo. - El Salvador : Manuel Naves y Cía., la Ave-nida Sur 35, San Salvador. - Finland : Akateeminen Kirjakauppa, 2 Keskuskatu, Helsinki. - France : Les Editions A.Pedone, 13 rue Soufflot, Paris 5e. Germany : Paul Parey, Lindenstrasse 44-47, Berlin SW 68. -Greece: " Eleftheroudakis
Constitution Square, Athens. - Guatemala : Sociedad Económico Financiera, Edificio Briz, Despacho 207, 6a Av., 14-33,
Zona 1, Guatemala. - Haiti : Max Bouchereau, Librairie " A la Caravelle", B.P. 111B, Port-au-Prince. - Iceland : Halldor
Jonsson, Mjostraeti 2, Reykjavik ; Jonsson and Juliusson, Garöastraeti 2, Reykjavik. - India : Whoiesale : Orient Longmans
Ltd., 17 Chittaranjan Avenue, Calcutta 13 ; Nicol Road, Ballard Estate, Bombay; 36A Mount Road, Madras ; 17/60 Sanya-
siraju Street, Gandhinagar, Vijawada 2 ; Kanson House, Delhi-Ajmeri Gate Scheme, New Delhi. Retal! agent : Oxford Bookand Stationery Co., Scindia House, New Delhi; 17 Park Street, Calcutta. - Iraq : Mackenzie's Bookshop, Baghdad. -Ireland : The Controller, Stationery Office, Dublin. - Israel : Blumstein's Bookstores Ltd., P. 0. Box 4154, Tel Aviv. -Italy : Libreria lnternazionale U. Hoepli, Galleria Piazza Colonna, Rome ; A.E.I.O.U., Via Meravigli 16, Milan. - Japan:Maruzen Company Ltd., 6 Tori-Nichome, Nihonbashi, Tokyo.- Lebanon: Librairie Universelle, Avenue des Français, Beirut.
- Mexico : Manuel Gómez Pezuela e Hijo, Donceles 12. Mexico, D.F. - Netherlands : N.V. Martinus Nijhoff, Lange Voor-
hout 9, The Hague. - New Zealand : Whitcombe and Tombs Ltd., Auckland, Wellington, Hamilton, Christchurch, Dune-
din, Invercargill, Timaru. - Norway : Johan Grundt Tanum Forlag, Kr. Augustsgt 7a, Oslo. - Pakistan : W. F. JeffreyLtd., 254 Ingle Road, Karachi. - Panama : Agencia Internacional de Publicaciones, J. Menendez, Plaza di Arango No. 3,
Panama. - Paraguay : Agencia de Librerias de Salvador Nizza, Calle Pte. Franco No. 39-43, Asunción. - Peru : Libreria
Internacional del Perú, S.A., Casilla 1417, Lima. - Philippines: The Modern Book Company, 518-520 Rizal Avenue, Manila.- Por-tugal : Livraria Bertrand S.A.R.L., Rua Garrett 73-75, Lisbon. - Spain : Libreria Mundi-Prensa, Lagasca 38, Madrid; José
Bosch Librero, Ronda Universidad 11, Barcelona. - Sweden : C.E. Fritze, Fredsgatan 2, Stockholm 16 ; Gumperts A.B.,Göteborg ; Lindstahls Bokhandel, Odengatan 22, Stockholm. - Switzerland : Librairie Payot, S.A., Lausanne and Geneva;Hans Raunhardt, Kirchgasse 17, Zurich 1. - Syria : Librairie Universelle, Ave. Fouad ler, B.P. 336, Damascus. - Taiwan:
The World Book Company Ltd., 99 Chungking South Road, Section 1, Taipei. -Thailand: Requests for FAO Publications should
be addressed to : FAO Regional Office for Asia and the Far East, Maliwan Mansion, Bangkok. - Tunisia : Victor Boukhors,4 rue Nocard, Tunis. - Turkey : Librairie Hachette, 469 Istiklal Caddesi, Beyoglu, Istanbul. - Union of South Africa:Van Schaik's Book Store, Pty., Ltd., P.O. Box 724, Pretoria. - United Kingdom : H.M. Stationery Office, P.O. Box 569,London S.E.1. - United States of America : Columbia University Press, International Documents Service, 2960 Broad-
way, New York 27, N.Y. - Uruguay : Hector d'Elia, Oficina de Representación de Editoriales, 18 de Julio 1333, Monte-video. - Venezuela : Suma, S.A., Sabana Grande 102, " El Recreo," Caracas. - Yugoslavia : Drzavno Preduzece, Jugo-
slovenska Knjiga, Terazije 27/11 Belgrade; Cankarjeva Zalozba, P.O.B. 41, Ljubljana. - Other countries : Requests from
countries were sales agents have not yet been appointed may be sent to : Distribution and Sales Section, Food and Agri-
culture Organization of the United Nations, Viale delle Terme di Caracalla, Rome, Italy.

11
1111
1111
i
'1:1111 n
11
wut
ninon,
111111111111111
111111111111
Prim : U.S.$1.50
II 111111 `d.
11111111


![Jambalaya [yearbook] 1920 plus Medical yearbook 1920](https://img.pdfslide.net/doc/110x75/586cd4c31a28ab0b6b8bf18e/jambalaya-yearbook-1920-plus-medical-yearbook-1920.jpg)