Embed Size (px)
Citation preview

Yorkshire Rail Network Study
Conditional Output Statement
Report
March 2012
Prepared for: Prepared by:
Metro, SYPTE and Leeds City Region
Steer Davies Gleave
West Riding House
67 Albion Street
Leeds LS1 5AA
+44 (0)113 389 6400
www.steerdaviesgleave.com


Conditional Output Statement
Contents
CONTENTS
EXECUTIVE SUMMARY....................................................................................I
This Study’s Purpose and Key Conclusion ......................................................i
Study Context ..................................................................................... ii
Challenges and Opportunities.................................................................. iii
The Conditional Output Statement ............................................................ v
The Conditional Outputs........................................................................ ix
Next Steps ........................................................................................ xi
1 INTRODUCTION ................................................................................... 1
Context ............................................................................................ 1
Study Objectives ................................................................................. 1
Study Governance ................................................................................ 2
Study Area ......................................................................................... 3
The Conditional Output Statement ............................................................ 7
2 STRATEGIC EVIDENCE ........................................................................... 9
Introduction ....................................................................................... 9
The Government's Vision for Transport........................................................ 9
Regions, City Regions and the Economy ......................................................10
Connectivity and the Economy ................................................................11
Connectivity and the North's City Regions ...................................................12
Connectivity between the City Regions ......................................................13
Connectivity within City Regions ..............................................................15
International Links ..............................................................................18
How Enhancing Connectivity Leads to Economic Growth ..................................22
Supporting City Region Growth ................................................................26
Concluding Remarks.............................................................................27
3 STAKEHOLDER ASPIRATIONS ................................................................. 29
Stakeholder Group ..............................................................................29
Stakeholder Event ...............................................................................29
Stakeholder Aspirations for Improvements ..................................................29
4 MODELLING APPROACH ....................................................................... 31
Introduction ......................................................................................31
Defining the Do Minimum and the Test Timetable ..........................................31

Conditional Output Statement
Contents
Allocation to Corridors ......................................................................... 31
Economic Growth Scenarios ................................................................... 32
Passenger Modelling Overview ................................................................ 32
Rates of Benefit ................................................................................. 34
Passenger Demand Growth .................................................................... 36
Forecast Passenger Demand ................................................................... 39
Passenger Economic Benefits .................................................................. 41
Impact on Jobs .................................................................................. 45
Performance ..................................................................................... 50
Freight Modelling Approach ................................................................... 51
Freight Benefits ................................................................................. 52
5 DISAGGREGATED RATES OF BENEFIT........................................................55
Introduction...................................................................................... 55
Guidance on Interpreting the Rates of Benefit ............................................. 56
Capacity Benefits ............................................................................... 56
Connectivity Benefits ........................................................................... 57
Freight Benefits ................................................................................. 61
6 CONDITIONAL OUTPUT STATEMENT.........................................................63
1) Connectivity............................................................... 63
2) Capacity ................................................................... 66
3) Freight ..................................................................... 66
4) Performance .............................................................. 66
5) Journey Quality ........................................................... 67
6) Access to the Network ................................................... 67
7) Growth Centres ........................................................... 67
8) North-South Links ........................................................ 68
9) Links to Airports .......................................................... 68
10) Carbon Reduction ........................................................ 69
Strategic Gap Analysis .......................................................................... 69
Test Timetable Economic Benefits ........................................................... 81
Disaggregated Rates of Benefit ............................................................... 81
FIGURES
Figure 1.1 Passenger Corridors ....................................................... 5

Conditional Output Statement
Contents
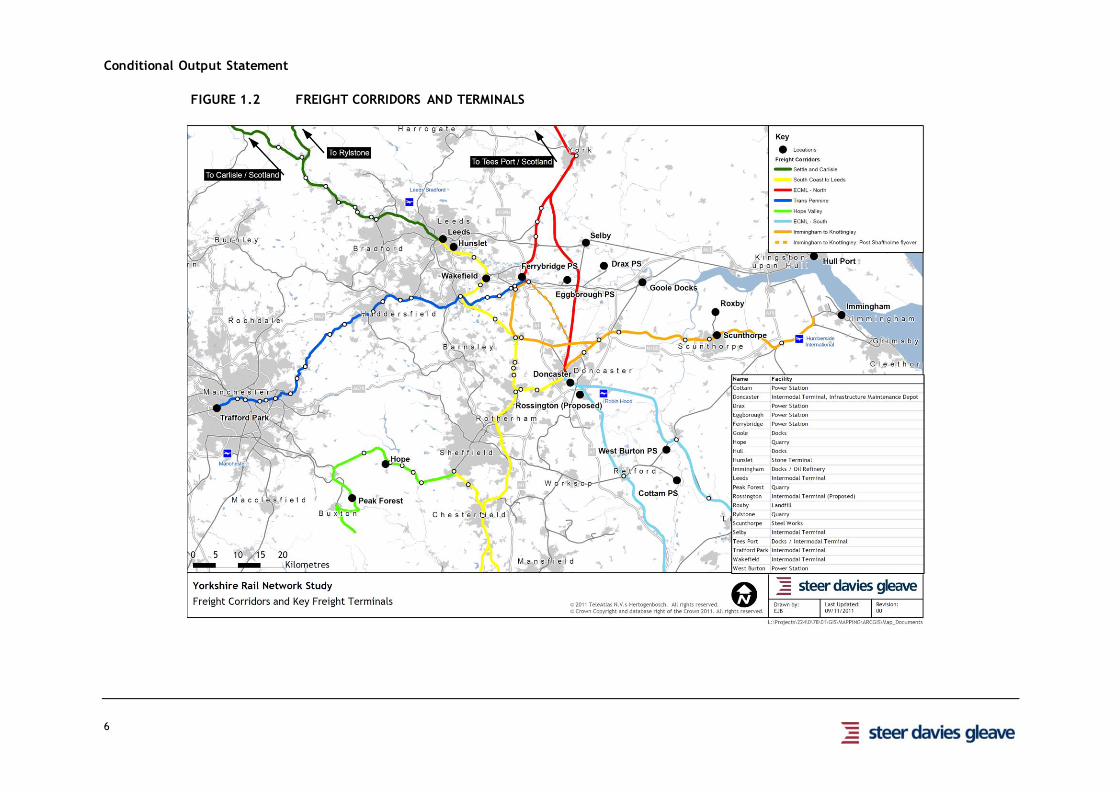
Figure 1.2 Freight Corridors and Terminals ......................................... 6
Figure 2.1 Wider Economic Impacts .................................................23
Figure 4.1 Passenger Benefit Modelling Overview.................................34
Figure 4.2 Average GJT Change – Do Minimum v Test Timetable ...............35
Figure 4.3 Incremental Peak Seats - Do Minimum v Test Timetable - Trend ..35
Figure 4.4 Incremental Peak Seats - Do Minimum v Test Timetable – Trend
Plus .........................................................................36
Figure 4.5 Forecast GDP and Employment Growth, 2011 to 2027 ...............36
Figure 4.6 2011 to 2019 Demand Growth – Trend .................................37
Figure 4.7 2011 to 2019 Demand Growth – Trend Plus ...........................38
Figure 4.8 Historic and Projected Demand Growth ...............................39
Figure 4.9 Do Minimum Demand Growth By Origin - Trend ......................39
Figure 4.10 Do Minimum Demand Growth By Origin – Trend Plus.................40
Figure 4.11 Test Timetable Induced Demand By Origin - Trend ..................41
Figure 4.12 Test Timetable Induced Demand By Origin – Trend Plus ............41
Figure 4.13 Total Benefits By Type - Trend .........................................42
Figure 4.14 Total Benefits By Type – Trend Plus ....................................43
Figure 4.15 Connectivity Benefits By Destination - Trend .........................44
Figure 4.16 Connectivity Benefits By Destination – Trend Plus ...................44
Figure 4.17 GDP ‘Jobs Equivalent’ - Trend ..........................................46
Figure 4.18 GDP ‘Jobs Equivalent’ – Trend Plus ....................................46
Figure 4.19 ‘Jobs Equivalent – Labour Market Impacts’ - Trend ..................47
Figure 4.20 ‘Jobs Equivalent – Labour Market Impacts’– Trend Plus .............48
Figure 4.21 UDM Tests – Potential Job Impact ......................................49
Figure 5.1 Normalised Crowding Benefits – Trend Plus ...........................57
Figure 5.2 Normalised Connectivity Benefits by Type – Trend Plus .............58
Figure 5.3 Normalised Connectivity Benefits By Destination – Trend Plus .....59
Figure 5.4 Normalised Connectivity Benefits By Destination and Number of
Stations – Trend Plus .....................................................60
Figure 5.5 Proportion of Test Timetable Benefit by Flow Type – Trend Plus ..61
TABLES
Table 1 Conditional Output Summary............................................ ix

Conditional Output Statement
Contents
Table 1.1 Steering Group Members ................................................. 3
Table 3.1 Stakeholder Aspirations v Conditional Outputs ....................... 30
Table 4.1 Forecast Direct Freight Benefits ....................................... 52
Table 6.1 Conditional Output Summary ........................................... 70
APPENDICES
A EVIDENCE REVIEW REFERENCES
B DISAGGREGATED ECONOMIC BENEFITS
C NORTHERN RAIL PPM MAA
D UDM JOB DISTRIBUTION MAPS

Conditional Output Statement
i
Executive Summary
This Study’s Purpose and Key Conclusion
To make the greatest possible contribution to economic growth, Yorkshire’s rail
network needs a sustained programme of planned investment. The rail industry is
currently finalising its plans for investment in the five year period from 2014 to
2019 (known as ‘Control Period 5’). The first purpose of this study is to reinforce
the investment case for proposed near-term enhancements benefitting Yorkshire.
The second purpose is to set the foundation for an assessment of the medium term
investment needs for rail routes in Yorkshire. This will support the identification,
for phased implementation beyond 2019, of preferred options that have been
costed, are affordable and provide value for money.
Specifically, the Yorkshire Rail Network Study establishes an evidence base that
allows targeted proposals to enhance the rail network to be developed with the
goal of maximising economic returns. This is especially important in a time where
resources for investment are limited.
Using industry-standard demand forecasting models to look at passenger services
within and between the Leeds and Sheffield City Regions and the connections to
other cities in the North, the study has identified the scale of potential benefits
that can be achieved from improved connectivity and greater capacity: £10.5bn to
£12.2bn. The challenge to the railway industry is now to work with local partners
to identify the most cost effective, value for money and affordable ways of
delivering as much of these benefits as feasible, and then to ensure the timely
delivery of the most appropriate solutions. In particular:
I The study reiterates the benefits that could be delivered from capacity and
journey time enhancements to the Hope Valle and Calder Valley routes, for
which funding was announced in the March 2012 Budget subject to a value for
money investment case being confirmed;
I This study provides further evidence of the case for full delivery of the
remaining elements of the Northern Hub Strategy, specifically improvements in
the Castlefield Corridor through Manchester that will benefit journeys to and
across Manchester, and to Manchester Airport, particularly from Bradford. The
study also supports the case for implementation of plans for Control Period 5
(2014-19) to increase freight capacity to the South Humber Bank, as well as
improvements that will benefit passenger services between Leeds and Sheffield
via Barnsley and capacity enhancements at Leeds and Sheffield stations.
I Working with the Leeds and Sheffield City Regions and the Department for
Transport, the rail industry should undertake work to develop an affordable and
value for money package of investments for the national strategic corridors
between Leeds and Sheffield and Doncaster and Sheffield for implementation in
Control Period 6 (2019-2024).

Conditional Output Statement
ii
I To complement and add to the benefits of investment planned to 2019, the
Leeds and Sheffield City Regions should work with their rail industry partners to
develop an affordable and value for money strategy for enhancing rail travel
within the two city regions beyond 2019. This should include proposals for
resolving the remaining capacity bottlenecks around Leeds and Sheffield
stations which have not been fully addressed in Control Period 5.
The study has been funded by Metro, SYPTE and Leeds City Region. Passenger and
freight train operators, Network Rail and the Department for Transport have been
part of the study's Steering Group.
Study Context
1. Yorkshire’s railways deliver substantial economic benefits and offer a sustainable
alternative to road travel. They do this by providing connectivity for passengers
and freight within Yorkshire, and between Yorkshire and the rest of the country.
However, across Yorkshire the ability to accommodate more passengers and a
greater volume of freight is increasingly constrained.
2. This means there are now limited opportunities to enhance connectivity – more
trains, quicker and more reliable journeys, better connections - to and between
Yorkshire’s most important economic centres. Trains in the commuting peaks and
at other times of the day experience overcrowding. For additional demand to be
accommodated and the economic and environmental benefits associated with
that growth secured, then enhancements to the rail network in Yorkshire will be
needed.
3. The past 15 years have seen significant growth in passenger and freight use of the
rail network across the UK. In Yorkshire specifically, passenger numbers increased
by 65% between 1998 and 2011. Providing there is available capacity, passenger
numbers are expected to continue to grow for the foreseeable future - by up to
37% by 2027. Accommodating this projected increase in passenger numbers will
support further economic growth. Freight traffic is also forecast to grow, in
particular the movement of intermodal containers to and from ports which is
forecast to increase threefold by 2030. On top of this, the evidence is that
improving connectivity – making journey times shorter and operating more
frequent services – can also deliver significant economic returns.
4. There remains a marked contrast between economic performance in the North of
England and the South East. Revitalisation of the economy in the Leeds and
Sheffield City Regions will require coordinated action to enhance rail connectivity
and capacity, as part of a wider targeted programme looking at transport and
other sectors.
5. Already very beneficial investment is planned for Yorkshire. The first phase of
Network Rail’s Northern Hub package and electrification of the route between
Manchester and York via Leeds are both planned to be implemented by 2018 and
will lead to more frequent trains and quicker journeys on the North Trans Pennine
route. Funding for a second Northern Hub phase including capacity and journey
time improvements on the Hope Valley and Calder Valley routes has also been
identified. In addition, Metro and SYPTE continue to improve existing stations and
are building new ones. A nationwide initiative to introduce a Strategic Freight

Conditional Output Statement
iii
Network will increase the capacity available for freight to, from and through
Yorkshire, as well as making more routes available to the latest generation of
intermodal containers hauled on standard wagons. Nonetheless, even with this
investment there will remain constraints that will inhibit the improvement of
rail’s connectivity and the expansion of its capacity.
6. The objective of this study for stakeholders in the Leeds and Sheffield City
Regions is therefore twofold. First, it is to reinforce the case for the timely
delivery of investment proposed for the rail industry for implementation in the
five year funding period to 2019 (‘Control Period 5’) and so secure the benefits
that this investment will bring. Second, it is to secure further investment (through
to 2019 and beyond) that will be needed if the economies of the Leeds and
Sheffield City Regions are to grow to meet their full potential.
7. This study has identified benefits that could be generated as a result of changes
to connectivity – journey time and train frequency – as well as reduction in on-
train crowding. It does not consider the potential impact of changes in rail policy
or regulatory processes. It specifically excludes changes in fares policy.
8. The study geography focuses on improvements to rail services within Leeds and
Sheffield City Regions and links to neighbouring centres such as Hull, Nottingham
and Manchester.
Challenges and Opportunities
9. Rail passengers in Yorkshire currently experience on-train crowding in the
traditional peak periods and at other times of the day on some routes. Current
capacity will not be sufficient to accommodate all forecast demand. Without
enhancement, train and in some cases, network capacity will constrain future
demand growth which will, in turn, limit economic benefits and encourage car
commuting. Crowding on trans-Pennine services and on Leeds and Sheffield
commuter corridors has previously been identified as a problem that should be
addressed.
10. Frequency and journey times on some routes are comparatively good. For
example between Leeds and Manchester at present there are four express trains
per hour and committed and planned improvements will deliver frequency and
journey time enhancements to the North Trans Pennine service. However, other
city to city links are comparatively poor - Leeds to Sheffield for example. As set
out in this report, there is strong evidence that good transport links can support
economic interaction between city regions, which in turn supports a stronger
regional and national economy. There is also established evidence that the
current capability of the rail network in terms of capacity, journey times, and
reliability is restricting the potential for additional and faster services.
Committed Enhancements
11. Network Rail has identified a compelling case for enhancements to unlock
capacity in central Manchester and facilitate faster and more frequent services
across the North of England. This is the package of enhancements known as the
Northern Hub. The first phase of the Northern Hub, the Ordsall Curve, will deliver
additional capacity in Manchester, allowing more and faster North Trans Pennine
services between Leeds and Manchester and beyond. Funding for this phase was

Conditional Output Statement
iv
committed in the March 2011 Budget. A second phase, delivering capacity and
journey time improvements on the Hope Valley and Calder Valley routes was
committed in the March 2012 Budget, subject to a value for money investment
case. North Trans Pennine electrification received Government endorsement in
the 2011 Autumn Statement. These committed improvements will benefit both
passenger and freight journeys between Yorkshire and the North West and are
planned to be implemented by 2018.
12. As part of the Strategic Freight Network, works are being undertaken to extend
the routes over which the latest generation of intermodal containers can be
carried on standard wagons – this is known as ‘gauge clearance’. The East Coast
Main Line as well as routes to the Tees and Humber ports and a route between
Yorkshire and the East and West Midlands are all being gauge cleared as part of
the Strategic Freight Network initiative.
High Speed Rail
13. In January 2012, following consultation the Government announced its intention
to construct by 2026 a high speed rail line (known as HS2) between London and
Birmingham, extending to Manchester and Leeds by 2033. The line to Leeds will
have stations that will serve both the Leeds and Sheffield City Regions. As well as
leading to a significant reduction in journey time, HS2 will increase the capacity
for journeys between the Leeds and Sheffield City Regions and the Capital.
Importantly, constructing HS2 will also release capacity on the East Coast and
Midland Main Lines that can be used for new inter-regional and freight
connections.
Further Enhancement will be Needed
14. Phase 1 of the Northern Hub, along with the proposed trans-Pennine
electrification, will deliver benefits to all rail travellers using the Manchester –
Leeds corridor. Phase 2 of the Northern Hub will benefit passengers travelling
between Sheffield / Bradford and Manchester. The Strategic Freight Network will
support growth in rail freight. High speed rail will increase capacity and reduce
journey times to London, but not until 2032. Responding to Network Rail’s
Northern Route Utilisation Strategy (RUS), the rail industry has made further
enhancement proposals for the five year period to 2019 and these are contained
in the Initial Industry Plan (IIP).
15. However, further enhancement to network capacity and capability will still be
needed to support future economic growth and maximise the returns from
planned investment in rail. In particular:
I There are further important benefits to be gained from the full delivery of the
Northern Hub package. Further proposed Northern Hub phases delivered by
2019 would release additional capacity in central Manchester and allow
increases in frequency and new destinations to be served, for example from
Bradford to Manchester Airport via Rochdale.
I While the Northern Hub work considered capacity constraints on the corridors
connecting Manchester with Bradford, Leeds and Sheffield, it did not address
constraints on the approaches to and at those stations. Even with full delivery
of the proposed Northern Hub package and trans-Pennine electrification as well

Conditional Output Statement
v
as proposals from Network Rail set out in the Yorkshire & Humber and Northern
Route Utilisation Strategies, there will remain constraints in the rail network
that will inhibit expansion of rail capacity. Most notably these include the
approaches and platform capacity at Leeds and Sheffield stations, affecting
east-west and north-south long distance as well as commuter services. There is
not yet a long term strategic plan beyond 2019 to address these two significant
constraints on the development of passenger and freight rail services to, from
and within the Leeds and Sheffield City Regions.
I The currently planned rolling stock programmes, such as the Intercity Express
Programme (IEP), Thameslink and subsequent cascades do not encompass a
strategy to replace much of the unreliable, uncomfortable, and slow rolling
stock serving the North.
I The ability for rail freight to serve effectively the ports of the North, the
growing inter-modal container market, the electricity supply industry and to
offer a viable and more environmentally sustainable alternative to road
transport is inhibited by a lack of capacity and functionality of the rail network.
The works associated with North Trans Pennine electrification is an opportunity
to create a gauge cleared route across the Pennines for inter-modal freight.
I Revitalisation of the economy in the Leeds and Sheffield City Regions will
require co-ordinated action to address the long-term imbalance between the
North and the South East. This will need to include a sustained programme to
enhance the connectivity to and between their economic centres; increase
capacity at Leeds and Sheffield stations; and improved network capability in
the rail corridors linking the economic centres.
16. If the economies of the Leeds and Sheffield City Regions are to meet their full
potential, it is essential that the rail network continues to support their growth.
To achieve this it will be necessary to invest in the rail network to provide the
capacity needed to accommodate future growth in passenger and freight demand
and deliver improved connectivity.
17. There is now an important window of opportunity to inform and influence how the
rail industry responds to the Government’s High Level Output Statement (HLOS)
and Statement of Funds Available (SOFA) for the next five year period of rail
investment (Control Period 5 2014-19), as well as set the challenges for the
subsequent five year period (2019-2024).
The Conditional Output Statement
18. The primary purpose of this study has been to develop a “Conditional Output
Statement”. With the goal of supporting economic growth in the Leeds and
Sheffield City Regions, the Conditional Outputs codify what the rail industry
should strive to deliver. The Conditional Outputs have been developed considering
the established evidence base complemented by bespoke analysis of the potential
economic benefits of enhancing current train capacity and facilitating more
frequent services with lower journey times. They are described as “conditional”
because realisation of each output will be subject to an affordable and value for
money solution being identified and delivered by the rail industry. Taken as a
whole, the Conditional Output Statement provides an evidence base that will help

Conditional Output Statement
vi
the industry to establish the key priority network improvements in the Yorkshire
region.
How Rail Enhancements will Support Economic Growth
19. Recent years have seen a substantial research effort to develop the understanding
of how transport systems and the economy interact. Consideration of this
evidence has been an integral part of the development of the Conditional
Outputs. What this evidence tells us is that enhancing links between the city
regions will support and facilitate future economic growth. The evidence also
shows that for city regions to enjoy balanced economic growth, an approach that
enhances links within city regions and between city regions is required.
Furthermore, emerging evidence suggests that transport investments that are
anticipated to have a structural impact on the economy can have an impact far
greater than conventional transport cost benefit analysis would suggest.
20. Specifically, the wider evidence base shows that enhancing the trans -Pennine rail
corridors would support growth of Leeds and Manchester, the North's two largest
city region economies. It would also strengthen the economic links between the
Sheffield and Manchester city regions - rail is especially important in this corridor
given the comparatively poor road links across the South Pennines. The Leeds -
Sheffield corridor links the two largest city region economies in Yorkshire and its
enhancement would contribute to their balanced growth. The Leeds and Sheffield
focussed commuter rail networks have facilitated sustainable economic growth by
supporting growth in city centre employment. However, on-train crowding and
the current scope and reach of the network limits the scope for future growth.
21. The available evidence also identifies the role that rail can have in expanding the
scale and scope of labour markets while at the same time facilitating spill-over
effects into the economically underperforming areas. The Leeds and Sheffield city
regions have each identified spatial priorities for development and regeneration.
Enhanced connectivity could support these priorities and cost effective rail
enhancement will be an option to support some of these priorities, particularly
where there is already connection to the rail network, for example Barnsley town
centre. The available evidence also highlights the key role that rail can play in
securing economic benefits from serving the growing demand from Yorkshire’s
international air and sea gateways.
An Innovative but Proven Approach
22. This Conditional Output Statement turns on its head the usual approach to
scheme development. Conventionally, a scheme is developed and this is then
subject to economic analysis to see whether it provides a value for money
solution and consideration is given to its affordability. At the same time fit with
wider objectives is assessed. Sometimes schemes are shown to provide good value
for money, other times there is a need to recast the proposal or return to the
drawing board. For the development of the Conditional Outputs set out here,
along with consideration of the wider evidence base on how transport and the
economy interact, bespoke modelling has been undertaken to allow the potential
of a rail corridor to deliver economic benefits to be identified. Mindful of this
potential, the rail industry can now go on and develop proposals that best release
the identified potential.

Conditional Output Statement
vii
23. This approach does not guarantee that identified solutions will have a good value
for money case or that they will be affordable, but it does set a framework for
this to be the case. This was the experience of the Northern Hub. Following an
approach very similar to the one applied in this study, a set of Conditional
Outputs was defined. These were informed by the benefit potential of each
corridor into Manchester and the wider evidence base. Responding to these
Conditional Outputs, Network Rail then developed a set of interventions that
were intended to release as much as possible of these benefits while at the same
time being implementable and affordable and realising a high as possible value
for money case. This led to their recommended Northern Hub strategy, a £530m
package of investment that returned a benefit cost ratio of 4:1. In 2011 the
Government committed to fund the first phase of the Northern Hub package, less
than five years after the Northern Way identified the importance to the whole of
the North of unlocking Manchester rail capacity. The success of this approach is
therefore clear.
The Potential Benefits for Yorkshire
24. Analysis undertaken as part of the Yorkshire Rail Network Study suggests that
delivering more capacity and improved connectivity for passenger services could
yield a benefit potential of between £10.5bn to £12.2bn over a 60 year period.
Potential benefits are those that would arise from a network wide uplift in
frequency, reduction in journey time and increase in on-train capacity. They are
not the benefits that would come from any one scheme or package of schemes,
rather they are an indication that if a strategy of affordable and value for
investments can be identified then significant benefits would result. The benefits
are expressed as a range to reflect the low and high demand forecasts applied in
this study.
25. Some of these potential benefits are generated by trips to and from Manchester
and are in corridors that were included in the Northern Hub study. This report’s
analysis shows that further enhancement, beyond those that will come from the
committed enhancements that will be delivered by 2018, will lead to additional
potential benefits. Further journey time enhancements and frequency increases
in the trans-Pennine corridors could deliver an additional £1.8bn to £2.1bn
benefit. A proportion of these benefits would be secured by the recently
announced second phase the Northern Hub strategy, although funding for this is
subject to a value for money investment case being identified, and other as yet
uncommitted parts of the strategy including the Castlefield Corridor and other
capacity enhancements in the Manchester area.
26. At least £8.7bn to £10.1bn of the total potential benefit are net additional
potential benefits to those identified in the earlier Northern Hub work. It is
therefore clear that improvements to the rail network in the Leeds and Sheffield
City Regions could yield worthwhile economic benefits and time and effort should
be invested by the rail industry to identify and then implement solutions to
achieve the Conditional Outputs.
27. Over a quarter of the potential journey time benefits (excluding benefits from
crowding relief) identified by this study, between £2.6bn and £3.0bn, could be
delivered by enhancing connections between the key regional and sub-regional

Conditional Output Statement
viii
centre stations. These could be achieved by improvements to just four key rail
corridors:
I York to Manchester, via Leeds and Huddersfield;
I Leeds to Manchester via Bradford and Halifax (the Calder Valley route);
I Leeds to Sheffield, and beyond; and
I Doncaster to Manchester via Sheffield.
28. Increasing the network’s ability to cater for freight traffic is also a source of
potential benefit, for example running just one additional container train per day
between Leeds and the Haven Ports could be generate £60m to the economy.
29. To make the case for investment it is necessary to identify interventions that
provide value for money and are affordable. When assessing value for money,
looking alone at the benefit potential on a particular rail corridor is not sufficient
to say that investment in that corridor is worthwhile. The likely costs of
enhancement to deliver those benefits have to be considered too. Typically, to
realise higher benefits more money needs to be invested. When considering
affordability, as well as consideration of the capital costs of any intervention, the
impact on operating costs when compared with any additional revenue that may
be gained also needs to be assessed.
30. It is important, therefore, that any future study to identify possible solutions to
deliver the Conditional Outputs considers possible enhancements across the Leeds
and Sheffield City Regions. To focus solely on those corridors returning the highest
rates of benefit may omit possible low cost/high value for money enhancements
elsewhere. This said, taken together the wider evidence base and the modelling
undertaken for this study suggests that:
I for the Yorkshire economy to function effectively there is a need to provide
quicker journey times, more frequent services and adequate on-train capacity
between the key locations for economic activity: Bradford, Leeds, Sheffield and
York, along with Manchester. The modelling for this study shows that
enhancements for rail trips between these regional centres typically attract
comparatively high rates of economic benefits per unit of journey time
improvement
I there are worthwhile rates of economic benefits to be gained by enhancing rail
connectivity between the regional centres which are well served by rail
(Bradford, Leeds, Sheffield, York and Manchester) and sub-regional centres
(Halifax, Harrogate, Huddersfield and Wakefield in the Leeds City Region and
Barnsley, Rotherham, Doncaster and Chesterfield in the Sheffield City Region).
I each city region also has a number of routes which offer within city region
connectivity, serving predominantly journey to work trips but also providing
opportunities to interchange to longer distance services. The analysis shows
that enhancements to such routes will also generate worthwhile rates of
economic benefit per unit of journey time improvement.
I enhancements just targeted at journeys between sub-regional centres will
deliver benefits, but typically at a lower unit rate than enhancements focussed

Conditional Output Statement
ix
on journeys between the regional centres of Bradford, Leeds, Sheffield and
York and commuting journeys to these centres.
I any strategy focussed on enhancing connectivity for just one of these four
groups of movement – between regional centres, from sub-regional centres to
the regional centres, within city region journeys and between sub-regional
centres – would potentially contribute to an unbalanced growth trajectory
across Yorkshire. What is needed is a targeted strategy that supports enhanced
connectivity for each of these groups of movements.
The Conditional Outputs
31. The Conditional Outputs identified by the study are summarised in the following
table. Full details of the Conditional Outputs can be found in Chapter 6.
Delivering these outputs will contribute towards achieving the potential economic
benefits identified by the study. The table also summarises the current network
constraints that may need to be addressed by the rail industry working with local
stakeholders to facilitate achievement of the Conditional Outputs.
TABLE 1 CONDITIONAL OUTPUT SUMMARY
Conditional Output Current Constraint
1.Connectivity Rail journey times that are
quicker than off peak car
journeys
A minimum frequency of two
trains per hour (up to six trains
per hour in some corridors) all
day operating on a clockface
timetable with additional peak
services as required to meet
demand.
Capability of the network
and provision of sufficient
and appropriate rolling
stock to operate faster
services
Network capacity and
availability of rolling stock
to deliver increased
frequency
2. Capacity Sufficient capacity, by
providing longer or more
frequent trains, to
accommodate forecast demand
growth to 2027
Seating capacity currently
exceeded on peak and
inter-regional off peak
services.
Limited availability of
rolling stock and
infrastructure capability
(track capacity, depot
capacity and platform
length) prevents longer or
more frequent services

Conditional Output Statement
x
Conditional Output Current Constraint
3. Freight Sufficient network capacity and
capability to maintain the
region’s electricity generating
capacity and deliver forecast
growth in rail freight,
particularly inter-modal
container traffic
Availability of trans-
Pennine and North–South
freight paths
Network currently restricts
operation of longer freight
trains and the routes that
are available for trains
transporting the latest
generation of inter-modal
containers on standard
wagons
4. Performance Reduce the variation in
performance on different
corridors by improving
performance of the relatively
poor performing corridors.
Any enhancements to meet
these Conditional Outputs
should not worsen performance
Variability in performance
of services in different
corridors caused by track
capacity, rolling stock
reliability and delivery of
planned capacity
5. Journey
Quality
New and/or refurbished rolling
stock to offer an improved
passenger experience
Variability in the quality of
rolling stock across
different corridors
6. Access to
the Network
Sufficient car parking capacity
and high quality access by
sustainable modes to
accommodate future demand
and consistent station quality
Insufficient car park
capacity to cater for all
day demand
Poor quality walk / cycle
routes to stations and lack
of capacity in high quality
public transport
Variability in station
facilities
7. Growth
Centres
Connectivity to rail connected
growth centres should benefit
from delivering the
Connectivity Output
Appropriate fast and frequent
connectivity is required from
rail hubs to growth centres that
are not directly connected to
the rail network
While many growth centres
are well connected to the
rail network, a number of
growth centres are not, so
there is a need is to
consider access services to
these.

Conditional Output Statement
xi
Conditional Output Current Constraint
8. North-South
Links
Service improvements should
not preclude HS2
implementation or vice versa.
In the interim the development
of services on the Midland and
East Coast Main Lines are
supported
Local rail services should
maximise the distribution of
HS2 benefits around the region
To be considered following
HS2 Phase 2 consultation
in 2014
9. Links to
Airports
Ensure fast, frequent and
reliable connectivity between
rail hubs and airports
Direct hourly connectivity to
Manchester Airport (during the
period of 90% of passenger
throughput) via South Trans
Pennine and Calder Valley
corridors and half hourly via
North Trans Pennine corridor
No current rail links to
Leeds Bradford Airport and
Robin Hood Airport
Doncaster Sheffield.
Improved connectivity
from the Calder Valley and
South Yorkshire to
Manchester Airport is not
yet committed
10. Carbon
Reduction
Support the achievement of the
overall reduced carbon
trajectory for transport sector
as adopted by Government
Not all rolling stock meets
contemporary emissions
standards
Next Steps
32. Taking account of the evidence from this study, the challenge for the rail industry
is to work with the Leeds and Sheffield City Regions and find affordable and cost
effective ways of delivering as much as possible of the potential benefits
identified by this study. In particular:
I Account should be taken of the evidence developed by this study when
considering the investment case for rail enhancements benefitting Yorkshire in
the next investment period from 2014 to 2019 (known as ‘Control Period 5’). In
particular, this study provides further evidence on the case for the delivery of
improvements to the South Trans Pennine and Calder Valley routes as part of
the second phase of the Northern Hub and for the full delivery of remaining
elements of the Northern Hub Strategy. This will benefit access to and across
Manchester, and to Manchester Airport, from Leeds, Bradford and Sheffield.
This study also supports the case for increased freight capacity to the South
Humber Bank, as well as improvements that will benefit passenger services
between Leeds and Sheffield via Barnsley and delivering additional capacity at
Leeds and Sheffield stations in Control Period 5.

Conditional Output Statement
xii
I The rail industry should undertake work together with the Leeds and Sheffield
City Regions and the Department for Transport to develop an affordable and
value for money strategy for the national strategic corridor between Leeds and
Sheffield and Doncaster and Sheffield also for rail travel within the two city
regions for implementation in Control Period 6 (2019-2024). This should include
proposals for resolving the remaining capacity bottlenecks around Leeds and
Sheffield stations which have not been fully addressed in Control Period 5.

Conditional Output Statement
1
1 Introduction
Context
1.1 Yorkshire’s railways deliver substantial economic benefits and offer a sustainable
alternative to road travel. They do this by providing connectivity for passengers and
freight within Yorkshire and between Yorkshire and the rest of the country. However,
across Yorkshire the ability to accommodate more passengers and a greater volume of
freight is increasingly constrained. There are now limited opportunities to enhance
connectivity to and between Yorkshire’s most important economic centres. Trains in the
commuting peaks and at other times of the day experience over-crowding. For additional
demand to be accommodated and the economic and environmental benefits associated
with that growth secured, then enhancements to the rail network in Yorkshire will be
needed.
1.2 The past 15 years have seen significant growth in passenger and freight use of the rail
network across the UK and in Yorkshire specifically. Providing there is available capacity,
growth in rail demand is expected to continue for the foreseeable future, which in turn
will support further economic growth. On top of this, the evidence is that improving
connectivity – making journey times shorter and operating more frequent services – can
also deliver significant economic returns.
1.3 Already very worthwhile investment is planned that will benefit Yorkshire. The first phase
of Network Rail’s Northern Hub package and electrification of the route between
Manchester and York via Leeds are both planned to be implemented by 2018 and will lead
to service improvements on the North Trans Pennine route. Funding has also been
committed for the second phase of the Northern Hub, including capacity and journey time
improvements to the Hope Valley and Calder Valley routes, subject to a value for money
investment case being confirmed. In addition, Metro and SYPTE continue to improve
existing stations and are building new ones. A nation-wide initiative to introduce a
Strategic Freight Network will increase the capacity available for freight to, from and
through Yorkshire, as well as make more routes available to the latest generation of
intermodal containers hauled on standard wagons. Nonetheless, even with this investment
there will remain constraints that will inhibit improving rail's connectivity and the
expansion of its capacity. Further enhancement to network capacity and capability is
needed to support future economic growth and maximise the returns from planned
investment in rail.
Study Objectives
1.4 The goal for this study is twofold. First, it is to reinforce the case for the timely delivery
of investment proposed for the rail industry for implementation in the five year funding
period to 2019 (‘Control Period 5’) and so secure the benefits that this investment will
bring. Second, it is to set the foundation for an assessment of medium term investment
needs for rail routes in Yorkshire leading to the identification of preferred options for
phased implementation beyond 2019 that have been costed, are affordable and provide
value for money.

Conditional Output Statement
2
1.5 To support these two goals, study objectives were agreed by the Steering Group at its
meeting on 5th October 2011 and presented to the Stakeholder Meeting on 7th October. The
objectives for the Yorkshire Rail Network Study are to:
I Identify evidence-based rail outputs that will maximise the economic benefits that
enhancements to rail’s capability and capacity can deliver to Yorkshire;
I Support the realisation and maximisation of the economic benefits to Yorkshire of the
Northern Hub capacity and capability enhancements;
I By providing the economic rationale, contribute to the on-going rail investment
planning processes to secure investment that would benefit Yorkshire in Control Period
5; and
I Make the economic case for further longer term enhancements benefiting the Yorkshire
rail network’s capacity and capability.
1.6 To achieve these objectives this study provides the evidence base for the potential
benefits that improvements to the rail network could generate. There are two sources for
this evidence base. One source is the extensive evidence base that has been developed in
recent years on how transport and the economy interact. The second source is specific
analysis that has been undertaken to quantify the potential benefits that enhancements to
rail services across the City Regions could generate in terms of additional revenue,
reduced journey time, reduced crowding, non-user benefits and wider economic impacts.
1.7 This evidence has been drawn together to inform the development of a set of Conditional
Outputs, the principal output of this study. With the goal of supporting economic growth in
the Leeds and Sheffield City Regions, the Conditional Outputs codify what the rail industry
should strive to deliver and also provides an evidence base that will help the industry to
establish the key priority network improvements in the Yorkshire region. The outputs are
described as conditional because achieving the outputs is dependent on an affordable and
value for money solution being identified.
1.8 This Conditional Output Statement presents those outputs and the evidence (both existing
and modelled) that is used to justify these outputs. The supporting Benefit Forecasting
Report sets out in detail the analytical evidence that has been developed specifically as
part of this study.
1.9 At this stage the study does not consider the cost implications of enhancements to the rail
network. Instead the study identifies the corridors and type of services that might return
the greatest rates of benefit. This allows those developing future enhancements to the
network to focus on areas that might generate the greatest return on investment. It is
anticipated that the rail industry will undertake a further study to identify economically
viable and affordable solutions to deliver the Conditional Outputs, although the scope of
this study has yet to be confirmed.
Study Governance
1.10 The Yorkshire Rail Network Study has been managed by Metro on behalf of the study
funders; Metro, SYPTE and Leeds City Region. To maximise the value of the study within
the rail industry and ensure support from wider stakeholders, two support groups were
established: a Steering Group and a Stakeholder Group.
1.11 The study’s Steering Group was responsible for advising on the strategic context within
which the study was delivered and, from a senior stakeholder perspective, challenging the

Conditional Output Statement
3
study’s approach and outputs to ensure that relevant issues were appropriately
considered. The study’s Steering Group comprised senior manager and director
representation from Metro and SYPTE, the DfT, Network Rail and passenger and freight
operating companies. The Steering Group was independently chaired by John Jarvis, who
was latterly Transport Director for the Northern Way and led the Phase 1 Northern Hub
Study. Table 1.1 summarises the Steering Group attendees:
TABLE 1.1 STEERING GROUP MEMBERS
Chair: John Jarvis
Members:
Ben Still, Director of Strategy, SYPTE Richard Thompson, Network Rail
David Hoggarth, Director Development,
Metro
Rob Warnes, Performance and Planning
Director, Northern Rail
Brian Welch, DfT Nick Gibbons, National Planning Manager, DB
Schenker
1.12 The Stakeholder Group comprised representatives from local authorities, development
agencies, business representatives and the rail industry. Consultation with the Stakeholder
Group has sought to confirm the wider aspirations for development in the rail network.
Feedback from stakeholders on the Conditional Outputs was sought before final
publication.
Study Area
1.13 The study has considered rail routes within Leeds and Sheffield City Regions and on routes
between the two city regions and other regional and sub-regional centres including Hull,
Cleethorpes, Lincoln, Nottingham, and Manchester. The study has not considered
enhancements to services to London, Birmingham and north of York. The potential
benefits of improvements to such services are already well established and the strategy
for their future development is considered at a national level.
1.14 The study has monetised the potential economic benefits that could be generated by
improved connectivity (from quicker journeys, more frequent rail services and better
connections) and reduced crowding in terms of increased revenue, user journey time
savings, non-user benefits and wider economic impacts.
1.15 The size of the study area and nature of services means that it is desirable to identify from
which parts of the network and which types of service these benefits are generated. To
achieve this, the potential benefits presented in Chapters 4 and 5 have been disaggregated
by either stations or corridors. In disaggregating the benefits those where the origin is a
regional centre station (Leeds, York, Sheffield, Bradford (Forster Square and Interchange
combined), along with Manchester and London) or a sub-regional centre station
(Harrogate, Halifax, Huddersfield, Wakefield stations, Barnsley, Doncaster, Rotherham and
Chesterfield) are shown separately. The underlying rail demand data combines Pontefract
Baghill and Monkhill stations as well as Thorne North and South, although in each case the
stations are in different corridors. Therefore the benefits as a result of improvements to
these stations are also shown separately from the corridor results.

Conditional Output Statement
4
1.16 The remaining stations have been split into the following corridors and are also illustrated
in the map in Figure 1.1. Figure 1.2 illustrates the key freight terminals and corridors in
the study area.
I Leeds CR Corridors:
5 Towns;
Bradford FS;
Bradford Interchange;
Calderdale;
Harrogate – York;
Huddersfield;
Hull;
Ilkley;
Leeds – Harrogate;
Leeds – York;
North Trans-Pennine;
Skipton;
I Inter CR Corridors:
Barnsley;
Leeds – Doncaster;
Penistone;
Pontefract Baghill;
Bolton - Moorthorpe;
I Sheffield CR Corridors
Doncaster – Cleethorpes;
Goole;
Lincoln;
Midland Main Line;
Sheffield – Doncaster;
South Trans-Pennine;
York – Doncaster;
I Other:
Blackpool;
ECML North;
ECML South;
Rochdale;
Scarborough;
Yorkshire Dales; and
Other.

Conditional Output Statement
5
FIGURE 1.1 PASSENGER CORRIDORS
Conditional Output Statement
6
FIGURE 1.2 FREIGHT CORRIDORS AND TERMINALS

Conditional Output Statement
7
The Conditional Output Statement
1.17 This document is structured to present the Conditional Outputs alongside the
strategic and numeric evidence that has supported the development of the
Outputs. This document is structured as follows:
Chapter 2 – Strategic Evidence
1.18 Considers the existing evidence base, presented in various studies, strategies and
plans, of the economic benefits that improved transport can provide, specifically
considering improvements in Yorkshire and the North of England.
Chapter 3 – Stakeholder Aspirations
1.19 Presents an overview of the consultation with the Stakeholder Group. The chapter
summarises the aspiration for improvements to the rail network identified by
stakeholders and shows how these aspirations have been reflected in the
Conditional Outputs.
Chapter 4 – Modelling Overview
1.20 Provides an overview of the analytical work undertaken and used to derive the
disaggregated rates of benefit, including the absolute benefits forecast. The
analysis of benefits is based on a theoretical Test Timetable that is used to test
the potential economic benefits that could be generated from improvements to
the rail network. The Test Timetable includes a range of challenging, but
plausible, improvements to services in the study area reflecting the stakeholders’
aspirations for future network development.
1.21 A more detailed Benefit Forecasting Report is available.
Chapter 5 –Disaggregated Rates of Benefit
1.22 In this chapter the rates of benefit have been calculated as a £ benefit divided by
the generalised time change or number of incremental peak seats. This allows
those developing solutions as part of future studies to consider the relative
benefits on different corridors while acknowledging that the absolute benefits of
the Test Timetable may not be achievable.
Chapter 6 – Conditional Output Statement
1.23 Presents the Conditional Outputs set by the study with reference to the supporting
evidence.


Conditional Output Statement
9
2 Strategic Evidence
Introduction
2.1 There is extensive evidence on how the economic performance of the North of
England is affected by transport links in general and rail links in particular. Within
this context, there is an extensive and growing evidence base on the importance to
Yorkshire's economy of road and rail links within Yorkshire, between Yorkshire and
its neighbouring regions, between Yorkshire and London and the South East, and
Yorkshire's international connections for both people and goods using air and sea.
The available evidence explores the economic gains that can be enjoyed through
enhancing these links. Here we review this evidence and identify what it tells us
about the economic gains that can be had through enhancing the capacity and
capability of Yorkshire's passenger and freight railway.
2.2 The relationship between transport investment and economic growth has been the
subject of much research over many years. While our understanding of this inter-
relationship is improving, there remains, however, scope to argue both the
generalities and the specifics of particular pieces of evidence. Nonetheless, this
uncertainty does not affect the core conclusions drawn here on the importance of
connectivity to the future scale and shape of Yorkshire's economy.
The Government's Vision for Transport
2.3 The economic importance of transport was acknowledged by the Coalition
Government when establishing its vision for the nation's transport system in the
November 2010 Business Plan for the Department for Transport (DfT). This vision
has since been reaffirmed in the January 2011 Local Transport White Paper (DfT,
2011a) and the May 2011 revision of the DfT Business Plan:
"Our vision is for a transport system that is an engine for economic growth but one
that is also greener and safer and improves quality of life in our communities. By
improving the links that help to move goods and people around, and by targeting
investment in new projects that promote green growth, we can help to build the
balanced, dynamic and low-carbon economy that is essential for our future
prosperity."
DfT (2011b)
2.4 In the 2010 Spending Review, capital and revenue transport spending was reduced.
However, the DfT's reduction in capital spend was lower than the average across
all government departments. This was because the contribution that investment in
the transport system can make to both the scale and distribution of economic
growth was explicitly recognised in the 2010 Spending Review, which states
"High quality transport links are essential to underpin a successful economy.… The
Spending Review prioritises capital spending on transport projects which can offer
high economic returns when compared to investment projects in other sectors. By
focusing on projects that deliver greater benefits in return for their costs, the
positive impact of capital spending on the wider economy can be maximised."

Conditional Output Statement
10
HMT (2010: 22)
2.5 The 2011 National Infrastructure Plan which was published at the end of November
alongside the Chancellor's Autumn Statement also identifies the importance of
investment in transport infrastructure to the economy:
"Evidence shows that investing in economic infrastructure is important for growth
and that, for example, building better transport links and energy generation
capacity can have a stronger positive effect on GDP per capita than other forms of
investment."
HMT & IUK (2011: 13)
Regions, City Regions and the Economy
2.6 The importance of the contribution of Britain's city regions to regional and national
economic prosperity has become widely recognised. They are the drivers of
economic growth, which means that the economic growth of our cities, regional
economic growth and economic growth of the country as a whole are inextricably
linked. Consequently in recent years supporting the sustainable economic growth
of cities has become a centrepiece of urban and transport policy (ODPM (2000),
Northern Way (2004), Eddington (2006), Northern Way (2006), Parkinson (2006a),
Parkinson (2006b), Northern Way (2007), Department for Transport (DfT) (2007)).
2.7 However, it is also well established that the North's city regions while making a
substantial contribution to the national economy, on a per capita basis under
perform the national average and city region economies in the South East. Per
capita Gross Value Added (GVA) in the North is 80% of the South East. Using pre-
recession data GVA was 17% lower than the national average in the Leeds City
Region (LCR, 2010) and in the Sheffield City Region it was 23% lower (SCR, 2010).
The North's city regions are not meeting their full potential (Parkinson (2006a)).
While manufacturing in the North remains an important part of the economy and
the service sector has been growing, the North has a greater than average
proportion of workers in public sector employment.
2.8 During the recession, between Q1 2008 and Q3 2009 the UK economy shrunk by
6.4%. Centre for Cities (2011) identifies that the impacts of the recession have
been felt differentially across the country. Using the percentage increase in Job
Seekers Allowance claimants as a proxy measure of the state of local economies,
cities across the North of England have on average fared worse through the
recession than cities in the South. Of the 64 towns and cities considered in the
Centre for Cities review, Hull, Grimsby, Doncaster and Sheffield are all in the list
of the ten cities with the highest percentage increase in JSA claimants.
2.9 Before the recession, taken together the North's city regions were underperforming
economically when compared with the national average. The North's cities
including those in Yorkshire have been more severely affected by the recession and
the impact of this is that the economic performance gap has widened.
2.10 The policy imperative of supporting growth across the country was recognised by
the Coalition Government in its Programme for Government.

Conditional Output Statement
11
"We want to create a fairer and more balanced economy, where we are not so
dependent on a narrow range of economic sectors, and where new businesses and
economic opportunities are more evenly shared between regions and industries."
HM Government (2010:9)
2.11 This position has been reinforced by the Prime Minister. Speaking in Yorkshire in
May 2010 in his first major speech as Prime Minister, David Cameron said :
"Today our economy is heavily reliant on just a few industries and a few regions -
particularly London and the South East. This really matters. An economy with such
a narrow foundation for growth is fundamentally unstable and wasteful - because
we are not making use of the talent out there in all parts of our United Kingdom.
We are determined that should change."
City region economies drive regional and national growth. Yorkshire's city
regions perform below the national average and are not meeting their full
potential. They have been more affected by the recession than town and
cities in the South East. The Government has set out its vision for a fairer and
more balanced economy where economic opportunities are more evenly
shared.
Connectivity and the Economy
2.12 The importance of connectivity in sustaining local economies and supporting
economic growth is widely recognised. Eddington (2006) argued that the UK is
already well connected and that the key economic challenge is to improve the
performance of existing networks. He argued that to meet its economic goals of
supporting sustainable growth, Government should prioritise "action on those parts
of the system where networks are critical in supporting economic growth and that
there are clear signals that these networks are not performing" (Eddington
(2006:6)). To Eddington, this means concentrating on the capacity and
performance of existing links. However, while arguing that the nation is broadly
well connected, he recognised that there could be a case for "the addition of new
links to support the growth and performance of the labour market in growing and
congested urban areas" (Eddington (2006:13)). This led to a policy prescription
from Eddington that:
"[t]he strategic economic priorities for transport policy should be: congested and
growing urban areas and their catchments; together with key inter-urban corridors
and key international gateways that are showing signs of increasing congestion and
unreliability."
Eddington (2006:32)
2.13 Eddington's policy prescription has recently been re-considered by the House of
Commons Transport Committee. A key question that the Committee considered
was whether in the light of the recession the approach put forward by Eddington
remained sound or whether an alternative approach is now needed. The
Committee noted that:

Conditional Output Statement
12
"Despite changes in economic conditions and transport demand, the predominant
view of our witnesses, including the DfT, academics, business groups, local
authorities and transport professionals was that Eddington's broad analysis of the
linkages between transport and the economy held true. The DfT's conclusion was
that, despite the lower rates of GDP and transport growth, Eddington's analysis
that well-targeted investment in transport remained an important contributor to
[economic growth] remained valid."
Transport Committee (2011:9)
2.14 The Committee went on to conclude, "despite GDP, traffic volumes and public
spending being at levels somewhat lower than Eddington envisaged, it is clear to
us that investment in the transport system remains a high priority in order to
support economic growth. Congestion on road, rail and air networks remains a
major constraint on growth" (Transport Committee (2011:11))
To support economic growth there needs to be adequate network capacity
and capability, so that journeys can be made reliably and with reasonable
journey times:
I within city regions;
I between city regions; and
I to access international gateways.
Not all city regions are equally well connected. Facilitating economic growth
may require provision of new network capacity and capability.
Connectivity and the North's City Regions
2.15 The Northern Way (2004) in its Growth Strategy identified a number of reasons
why there is a differential economic performance between the North and the
South, and between the city regions of the North. Each is strongly influenced by
the historic legacy of the Northern economy which was largely dependent on
manufacturing and extractive industries, but since the 1970s has experienced a
significant shift away from these traditional industries to a more service-based
economy (although manufacturing remains an important industry in the North, for
example the steel industry continues to be a key component of the Sheffield city
region economy).
2.16 To address the underperformance of the North's economy, the Northern Way
Growth Strategy identified the importance of enhancing the North's skill base,
supporting the development of a more entrepreneurial culture, supporting greater
innovation by firms in the North, promoting more sustainable communities, raising
the international profile of the North and enhancing the North's connectivity.
2.17 The Northern Way Growth Strategy echoed the findings of others that while good
connectivity alone is not a sufficient condition to support economic growth it is a
necessary one. Similar conclusions were made by Parkinson et al (2006a, 2006b)
and the Institute of Political and Economic Governance (IPEG) et al (2008), who in
particular found that, "whilst it is not an absolute truth to claim that places

Conditional Output Statement
13
become economically successful because they are well connected, [we] found
powerful evidence of correspondence between the two" (IPEG (2008:18)).
2.18 While pre-dating Eddington, with regard to connectivity the Growth Strategy
identifies a policy prescription almost identical to that later piece of work,
namely:
I enhancing links within the North's city regions, particularly by public transport
I enhancing links between the North's city regions, notably the Leeds Manchester
corridor which plays a fundamental role linking the North's city region
economies; and
I enhancing links to port and airport international gateways, both in the North
and elsewhere in the UK.
There is strong evidence to support the contention that enhancing
connectivity within the North's city regions, between the North's city regions
and to international gateways needs to be an integral part of any strategy to
accelerate the North's economic growth.
Connectivity between the City Regions
2.19 Ensuring appropriate and adequate connectivity within and between city regions,
and to and from international gateways is an integral part of the policy
prescription from Eddington. Looking at the North overall, the Northern Way
identified that existing connectivity between the North's city regions is an
impediment to maximising the rate of economic growth in the North. Focussing on
Yorkshire, this suggests a need to consider connectivity between the Leeds and
Sheffield city regions, as well as the connectivity between these city regions and
city regions in the North West, East Midlands and North East.
2.20 Moving beyond the general prescription of Eddington that links between and within
city regions are important to economic growth, how the city regions in the North
interact and the importance of linkages between them has been explored in some
depth as part of a North-wide analysis by IPEG et al (2008) for the Northern Way.
The IPEG study used a mixture of targeted surveys, analyses of econometric data
and analyses of secondary data sources. It explores three themes: the roles and
economic functions of the North's city regions, connectivity within and between
city regions and how the North's city regions stand within a national hierarchy.
2.21 IPEG et al concluded:
"the prosperity of the North as a whole will be increasingly driven by the economic
performance of the Manchester and Leeds city regions and the putative growth
belt that connects them to the Sheffield and Liverpool city regions, the smaller
outlying growth centres around York, Chester and Preston and the Tyne and Wear
city region in the North East"
IPEG et al (2008:35)
and:

Conditional Output Statement
14
"This invites…a strategic approach to inter-city connectivity focused upon
prioritising interaction between relative 'equals' (for instance Manchester and
Leeds) or between centres which vary in their economic specialisms (for instance
Liverpool and Manchester) which would also improve the labour market between
them. There would appear to be particular value in developing this approach to
promoting cross-Pennine links - including better access to Manchester Airport from
Leeds - given that the Pennines continue to act as a barrier to realising the joint
agglomeration potential of the North's largest and most dynamic city regions"
IPEG et al (2008:37)
2.22 Building from the work by IPEG et al, as part of its Research Programme, the
Northern Way sponsored work by the LSE's Spatial Economics Research Centre
(SERC) that has extended further the evidence base on the relationship between
transport supply and economic links between Leeds and Manchester. A primary
finding of this work (SERC, 2009) is that when compared with other city pairs in
Great Britain, commuting between the Manchester and Leeds City Regions is 40%
lower than expected given the physical proximity of the two cities. This is
explained by overall transport costs and travel time between the two city-regions.
SERC go on to say that tackling factors which hamper integration between the two
cities, such as transport costs and skills, could have economic benefits which
extend across the wider North. Using a model that considers the interaction
between the two city region economies (a heterogeneous firms model) SERC
concluded that:
I A 20 minute reduction in train journey times between Manchester and Leeds
would be worth £6.7 billion across the whole of the North of England;
I £2.7 billion of this would be captured within the two city regions; and
I The same reduction in journey time could increase wages in the two cities by
between 1% and 3%.
2.23 When considering these figures it is important to note, however, that they are not
directly comparable with the estimates of welfare benefits captured by a
conventional DfT-style transport cost benefits analysis. In particular, the SERC
work does not adopt the transport cost benefit analysis assumptions that the
patterns of land use and employment and the structure of the economy is not
significantly changed by the transport intervention under study.
2.24 SERC go on to conclude that that securing these benefits will require a structural
change affecting industrial structure and skills-mix alongside enhancements to
transport links.
2.25 To support the development of its Strategic Direction for Transport, the Northern
Way commissioned work that examined the potential economic benefits of
enhancing links within and between the Leeds and Sheffield city regions. Steer
Davies Gleave (2006) used a model of South and West Yorkshire which simulates
how the rate of growth of the economy is affected by transport supply and its use
to examine the impact of different intervention strategies on the economic growth
of the two city regions. This work found that a strategy focussed on improving links
wholly within a city region resulted in economic growth in the largest of the two
city region economies under study at the expense of the smaller one. A strategy of

Conditional Output Statement
15
improving links between city regions leads to more balanced growth, with both the
larger and the smaller city region economies growing.
2.26 In a study undertaken for Manchester and Sheffield City Councils that explored the
economic linkages between the Manchester and Sheffield city regions, Ekosgen
found that both the Manchester and Sheffield economies could benefit from
greater economic interaction but that at present this is less than would be
expected for city regions of such proximity. Poor transport connectivity is a key
factor in this lower than anticipated level of economic interaction. Ekosgen
(2008:4) concluded that "it is important in the context of city competiveness that
physical connections between the cities improve. Addressing constraints on rail
connectivity and developing a strategy for the future would deliver significant
benefits." In addition, Ekosgen highlighted the particular importance of links from
the Sheffield city region to Manchester Airport.
Enhancing links between the city regions will support and facilitate future
economic growth. Enhancing the trans-Pennine corridor will support growth of
Leeds and Manchester, the North's two largest city region economies and will
also benefit the wider North. The Leeds - Sheffield corridor links the two
largest city region economies in Yorkshire and its enhancement will support
balanced growth in the region. Enhancing the Sheffield - Manchester corridor
would support greater interaction between these two city regions.
Connectivity within City Regions
2.27 As has already been highlighted, city regions are seen as the engines of economic
growth. The importance of connectivity within city regions to support economic
growth has been identified by the Northern Way Growth Strategy (Northern Way,
2004), the Northern Way's Strategic Direction for Transport (2006) and by
Eddington (2006). Both the Leeds and Sheffield city regions have identified the
importance of enhancing connectivity within city regions to support future
economic growth. In this context, the Manchester Independent Economic Review
(2009) has identified that in general transport enhancements have the potential to
give greater economic returns than capital investments in other sectors within a
city region.
2.28 Prior to the recession road networks across the North were operating at or close to
their operational capacity in peak hours (Steer Davies Gleave, 2008b). During the
recession many areas experienced a reduction in traffic volumes and this is most
notable when looking at goods vehicle flows on the motorway network.
Nonetheless congestion remains and it should be anticipated that a period of
sustained economic growth would result in traffic levels returning to their pre-
recession levels. Even with the recession-induced reduction in traffic levels,
congestion remains a facet of inter-urban and city region road networks in
Yorkshire.
2.29 Congestion leads to extended journey times and unreliable journeys. This has an
economic cost. Significantly, there is little capacity for peak hour trip growth by
road, with growth in trip making accommodated by either peak spreading (which

Conditional Output Statement
16
in turn results in congestion being experienced in other time periods) or by
increasing public transport use.
2.30 This is the experience of Leeds, the most significant city economy in Yorkshire.
Pre-recession, Leeds city centre experienced employment growth without a
commensurate growth in peak hour car commuting. However, Leeds did
experience a significant growth in peak hour rail travel (Metro (2008)). This led to
the conclusion that it is public transport which facilitated the growth in city centre
employment. Much of this growth occurred at a time when rail had a degree of
excess capacity and was able to accommodate growth. However, pre-recession on-
train crowding was becoming significant (Network Rail (2009)) and the absence of
capacity to accommodate further growth in peak period rail trip making had been
identified as a threat to the city's future economic growth. This finding is
supported by more recent work for ATOC which indicates that additional rolling
stock that has been introduced to some lines in Yorkshire in recent years has
facilitated continuing growth which otherwise would not have occurred due to
crowding (Mott MacDonald, 2011). Overall capacity is a function of train capacity
and the capacity and capability of the network. While similar detailed analysis is
not available for Sheffield, Network Rail (2009) identifies peak on-train crowding
as a constraint for services to Sheffield too.
2.31 Data from the Office of Rail Regulation (Delta Rail (2011)) suggests that total
annual demand at Leeds City Station decreased by 2% between 2008/09 and
2009/10, while demand at Sheffield station increased by around 3% in the same
period. While a degree of caution needs to be expressed when considering what
this means for peak hour crowding, it is safe to say that the recession has had no
tangible impact on the level of on-train crowding on services to these two
principal stations and that moving forward there is limited capacity to
accommodate any additional employment-driven growth in rail demand into the
two city centres.
The Leeds and Sheffield focussed commuter rail networks have facilitated
sustainable economic growth by supporting growth in city centre employment.
However, on-train crowding and the current scope and reach of the network
limits the scope for future growth.
2.32 By comparing the economic interactions between Reading and London, and Burnley
and Manchester, Centre for Cities (2008) focussed on the links between large city
region economies and smaller towns and cities that fall within their economic
influence. They found that towns such as Burnley are not integrated within the
Manchester labour market despite being close in terms of distance. This was in
marked contrast to the situation observed between Reading and London where
Centre for Cities identified a strong economic interaction. They went on to
identify the strong transport links between Reading and London and the poor
transport links between Burnley and Manchester as explanatory factors. They
conclude "the issues of connectivity between core cities and their neighbouring
areas play a key role in explaining differences in regional economic performance

Conditional Output Statement
17
between the North and Greater South East" (Centre for Cities (2008:18)) leading to
a prescription that enhanced links between core cities in the North (such as Leeds
and Sheffield) and smaller nearby towns would increase the spill-over effects from
the larger economy and boost economic growth.
2.33 Supported by the Northern Way's Research Programme, further work has been
undertaken to look at the spill-over effects from stronger to weaker economies
identified by Centre for Cities. This work (The Work Foundation et al, 2009)
identified a typology of links between towns and the dominant city centre within a
city region. This work looked at the Leeds and Sheffield city regions, as well as
other city regions in the North. It concluded that it is clear that different places
have different economic roles within a city region depending on a number of
factors including skills, transport, firm links, the 'pull' of economic centres,
industrial history, and quality of place and housing.
2.34 The Work Foundation et al went on to conclude that a deeper appreciation of
different roles and influencing factors can support policy makers in maximising
benefits from city relationships. Promoting growth in the economic core has the
potential to benefit other cities and towns of a city region, provided there is
investment in links to the economic centre. The way in which cities and towns can
benefit from this relationship and link to the economic centre will vary depending
on whether their role is dependent, interdependent, independent or isolated, on
the type of city region and on the firm links within the city region.
Linking areas of economic need such as the southern parts of the Leeds City
Region and the Dearne Valley with locations with stronger economic growth
like Leeds and Sheffield city centres supports the stronger areas by extending
labour markets, while at the same time facilitating spill over effects into the
weaker areas.
The Work Foundation City Linkage Typology
Independent: Labour market B independent from Economic Centre A but with
strong labour market of its own (City B has strong economy and weak labour
market links with Economic Centre A)
Isolated: Labour market B independent from Economic Centre A and with weak
labour market of its own (City B has weak economy and weak labour market links
with Economic Centre A)
Dependent: Labour market B dependent on Economic centre A (City B has a
variable economy and strong labour market links with Economic centre A)
Interdependent: Labour market B interdependent with Economic Centre A (City B
has strong economy and strong labour market links with Economic Centre A)
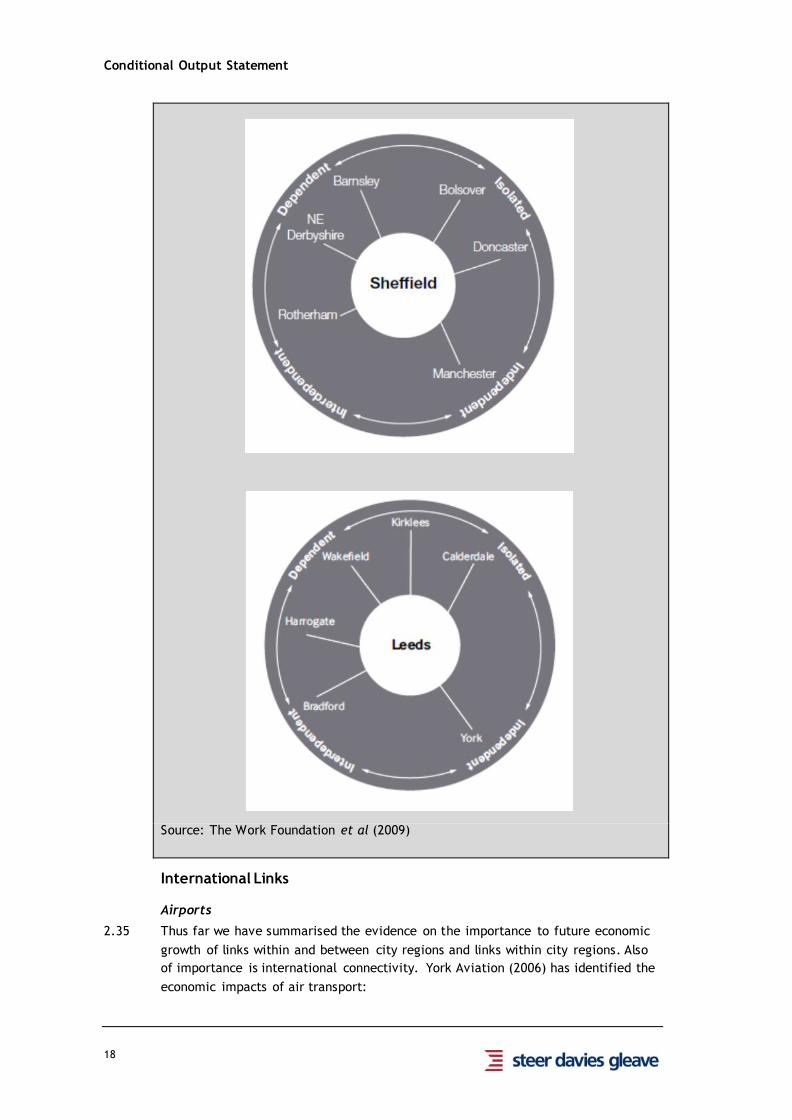
Conditional Output Statement
18
Source: The Work Foundation et al (2009)
International Links
Airports
2.35 Thus far we have summarised the evidence on the importance to future economic
growth of links within and between city regions and links within city regions. Also
of importance is international connectivity. York Aviation (2006) has identified the
economic impacts of air transport:

Conditional Output Statement
19
I Direct impacts: employment, income or outputs that are wholly or largely
related to the operation of an airport and are generated either on-site or in the
surrounding area
I Indirect impacts: employment, income or outputs that are in the chain of
suppliers of goods and services to the direct activities
I Induced impacts: employment, income or outputs that are due to household
spending resulting from direct and indirect employment
I Catalytic impacts: employment, income or outputs that are generated by new
businesses locating to the region, inward investments and inbound tourism; and
I Productivity/competitive advantage impacts: employment, income or outputs
gains amongst existing businesses in the economy due to increased export
volumes and productivity improvements.
2.36 As York Aviation highlight, while challenging to quantify, the consensus is that the
catalytic impacts and the productivity and competitive advantage impacts of air
transport greatly outweigh the direct, indirect and induced impacts. These
significant impacts come about because provision of international air services:
I is an important element in company location decisions. The presence of an
international airport can be an important factor in:
attracting new investment from outside the area, and especially companies
from overseas;
retaining existing companies in the area, whether they had previously been
inward investors or indigenous operations;
securing the expansion of existing companies in the face of competition with
other areas;
I promotes the export success of companies located in the area by the provision
of passenger and freight links to key markets;
I enhances the competitiveness of the economy, and the companies in it,
through its fast and efficient passenger and freight services;
I attracts inbound tourism, including both business and leisure visitors, to the
area.
2.37 As the Northern Way (2008) shows, Manchester Airport is the most significant
airport in the North, catering for more passengers than all the other northern
airports combined. It is the only airport in the North with a network of inter-
continental scheduled services and the only airport in the North that caters for a
substantial volume of air freight. It is the largest airport in the UK outside the
South East.
2.38 The Northern Way (2008) also identifies the important roles played by Leeds
Bradford and Robin Hood Doncaster Sheffield airports. Leeds Bradford has
experienced strong rates of growth anchored by expansion of services offered by
low cost carriers. Robin Hood Doncaster Sheffield has also become established in
recent years.
2.39 Manchester Airport (2007) has identified that surface access capacity is the most
significant constraint on its future growth and therefore the economic benefits
that it can help deliver to the Northern economy. It has identified increasing

Conditional Output Statement
20
public transport mode share as the most effective and efficient way of overcoming
these constraints.
2.40 Unpublished market research undertaken in 2005 for Trans Pennine Express (ORC
International, 2005) has demonstrated that air passengers have a high awareness
of rail as an access option to Manchester Airport, but rail's operating hours does
not allow them to arrive at the airport in time for their departing flight or to use
rail for the return journey. The same research also shows that for those air
passengers who consider using rail the three most significant deterrents were the
frequency of service, journey reliability and lack of a direct service.
2.41 The importance of direct services has been quantified by Lythgoe and Wardman
(2002), who demonstrated that air passengers using rail to access an airport have a
greater values of time and that they place a greater penalty on interchange than
other types of rail passenger. Interestingly, Lythgoe and Wardman also showed
that the elasticity to GDP of air travellers is greater than for other rail passengers
(this means that the number of air passengers using rail grows at a faster rate for
each unit of GDP growth than other rail passengers). The finding on interchange
has been reinforced by work by consultants LEK (2003). This work reported
statistical analysis which showed that whether or not locations were linked by
direct services to Manchester Airport was a significant explanatory variable for rail
mode share, with those locations with direct services having a higher mode share.
Sheffield and Doncaster have direct rail services to Manchester Airport (1 tph), as
do Huddersfield, Leeds and York (2 tph).
2.42 The importance of direct rail services to airports has also been demonstrated in
DfT-commissioned qualitative research on air passengers' journey experiences by
Sykes and Desai (2009:17) which reported, "where available, trains were regarded
as a good alternative to road travel by some respondents, especially where the
train route was straightforward and services frequent and reliable. However,
participants also worried about unscheduled cancellations of train services, delays
and missed connections over which they had little control."
2.43 While the evidence on rail access to Northern airports has focussed on Manchester
Airports, the evidence that direct and reliable rail services maximise rail mode
share is very strong and is consistent with findings from across the world. Also
needed are train services with operating hours that make rail an attractive option
for the departure and arrival leg of a passenger's journey. It is safe to generalise
these findings when considering if rail could play a worthwhile role in serving the
surface access needs of the two Yorkshire airports
Through its international connectivity Manchester Airport delivers substantial
economic benefits to Yorkshire. These benefits will grow as the Airport grows.
Surface access capacity is the most significant constraint to Manchester
Airport's future growth. Increasing rail mode share for journeys between
Yorkshire & Manchester Airport will support the Airport's growth which in
turn will deliver economic benefits to Yorkshire business and leisure
travellers.

Conditional Output Statement
21
Surface access to Leeds Bradford and Robin Hood Doncaster Sheffield airports
is primarily affected by road connectivity and congestion. For rail to play a
worthwhile role the available evidence identifies the importance of direct
services at an attractive frequency operating over much of the day.
Ports
2.44 As the Northern Way (2008) identifies, the three estuarial port complexes in the
North around the Humber, the Tees and the Mersey serve national roles. Measured
by tonnes lifted in 2010, Grimsby and Immingham on the Humber is the largest
port in the country, Tees and Hartlepool is ranked fifth and the Port of Liverpool
seventh. These northern ports are national assets. The Mersey ports are the
principal national gateway port for short sea shipping to Ireland and deep sea
shipping to North America. The Tees and Humber ports are best located to serve
the Scandinavian, Baltic and North European markets. The hinterland of the
North's ports extends well beyond the three northern regions into the Midlands and
Scotland, and into the South East for some traffic.
2.45 These ports play a significant role in the economy of each of the regions within
which they sit. This is through their direct contributions to employment, and
through associated benefits that are opened up by the linkages created and that
attract investment and business to the area. As MDS Transmodal (2006) identify, in
a similar way to airports there are direct, indirect and induced economic impacts
of ports, as well as catalytic impacts. Given that the vast majority of imported and
exported goods arrive and depart by sea, these wider impacts are clearly
substantial and are likely to be far greater in magnitude than the direct impacts
which can be quantified.
2.46 Before the recession, in 2007 together the North's ports catered for 34% of the
tonnes handled at all UK ports. In the decade to 2007 the North's ports grew at a
faster rate than those in the South and consequently their market share increased
(from 30% in 1999). However, port throughput has fallen during the recession and
the North's market share has fallen back. In 2010, national port throughput was
13% lower than in 2005. Overall throughput is now growing again.
2.47 Already rail is an important mode for moving goods to and from the North's ports.
As Network Rail (2009:30) notes ''some of the busiest freight corridors in the UK are
to be found within the Yorkshire and Humber area, particularly on the south bank
of the Humber and the area represents a key element in the UK rail network for
the movement of bulk freight".
2.48 As MDS Transmodal (2006) highlights, the growth prospects of the Northern ports
are strong and given road and rail congestion in the south and the Government's
desire to rebalance the economy, this remains the case. The strongest growth is
expected in the market for inter-modal containers (nationally, inter-modal
container traffic grew by 5% between 2009 and 2010). Given increasing congestion
on the North's motorway network, provided there is sufficient capacity and
capability this will result in increased demand for movement of containers by rail
to and from the North's ports, including on the trans-Pennine corridor. Growth will

Conditional Output Statement
22
also increase demand for containers being carried by rail between the South Coast
ports (the Haven ports and Southampton) and the North.
2.49 The Northern Way identified the lack of physical capability of the rail network to
cater for maritime containers on standard wagons as a constraint to the growth of
the North's ports. As the Northern Way (2010) sets out, enhancing the capability of
the rail network to address this connectivity gap requires 'gauge clearance' work on
the existing rail lines. The East Coast Main Line as well as routes to the Tees and
Humber ports and a route between Yorkshire and the East and West Midlands are
all being gauge cleared as part of the Strategic Freight Network initiative.
The North's ports provide substantial economic benefits to the North which
will grow as the throughput grows. Growth in throughput of inter-modal
containers combined with increasing congestion on the strategic roads
network will increase the demand to move containers by rail, both to/from
the North's ports and between the South Coast ports and the North.
Gauge clearance of the links between the North East and Humber ports to
markets in the Midlands and Scotland is being advanced, but the absence of a
gauge cleared route across the Pennines is a constraint. Planned
electrification of the North Trans Pennine route creates an opportunity to
create a gauge cleared route at marginal cost.
How Enhancing Connectivity Leads to Economic Growth
2.50 Eddington (2006) set out how enhancing connectivity leads to economic growth.
This has been summarised by the House of Commons Transport Committee (2011)
as:
I Improved business efficiency, notably by travel time savings, improving journey
time reliability and travel quality;
I Stimulating business investment and innovation by supporting economies of
scale and new ways of working;
I Agglomeration economies which bring firms closer (in space or time) to other
firms or workers in the same sector ;
I Improved labour market efficiency, enabling firms to access a larger labour
supply, and wider employment opportunities for workers and those seeking
work;
I Increasing competition by opening access to new markets, principally by
integration of world markets;
I Increasing domestic and international trade by reducing trading costs; and
I Attracting globally mobile activity to the UK, by providing an attractive
business environment and good quality of life.
2.51 The contribution that enhanced transport links make to productivity is captured
through what are usually described as 'conventional' economic benefits and 'wider'
impacts. Through demand forecasting and application of cost benefit analysis it is
possible to monetise both conventional and wider impacts. The net welfare impact
on the economy is the sum of the conventional and wider impacts. However, not

Conditional Output Statement
23
all of these welfare benefits have a direct link to productivity. Those benefits that
have a direct link to productivity include time savings enjoyed by those travelling
for business purposes and time savings and cost savings to freight traffic. They also
include the so-called wider impacts, such as agglomeration benefits. However, and
in part because of the assumptions on changes in land use, population and
employment that underpin a cost benefit analysis of a transport scheme, not all of
the GVA impacts of a transport investment are captured in the welfare assessment
of a scheme's economic worth.
2.52 The relationship between conventionally measured welfare benefits, wider
economic benefits and productivity gains is shown in the figure below taken from
Steer Davies Gleave (2008a).
FIGURE 2.1 WIDER ECONOMIC IMPACTS
2.53 Within the conventional benefit framework, journey time savings for people
travelling for business purposes have a greater contribution to the economy than
people travelling to and from work, which in turn have a greater contribution that
people travelling for leisure purposes (for example to go shopping, or visiting
friends and relatives).
2.54 From the work of the Standing Advisory Committee on Trunk Road Assessment
(SACTRA 1999) and others it became clear that the benefits captured in the
conventional framework may not be complete in all circumstances and that there
are a number of 'wider' impacts that enhanced transport links may deliver. The
Department for Transport (2005) has set out what these are:
I More people choosing to work;
I People choosing to work longer hours;
I Relocation to higher productivity locations;
Benefits
captured in
conventional
appraisal
Imperfect competition
Labour Market Impacts Net Element
Reduced Business Costs
Agglomeration Wider
impacts
Productivity
gains
Other benefits (safety, emissions etc)
Non-work related user benefits
(commuting, leisure etc)
(Captured in
commuting user
benefits)

Conditional Output Statement
24
I Agglomeration benefits; and
I Redress impacts of imperfect competition.
2.55 Agglomeration benefits, which come about by extending the effective area that
businesses can attract labour and extending the number of potential linkages
between businesses that can trade with each other, have been identified as the
most significant of the wider economic benefits.
2.56 Work by the Institute for Transport Studies (ITS, 2009) has identified a theoretical
case for further wider impacts that do not form part of the current cost benefit
framework. These 'regeneration wider impacts' occur in areas where there is
structural unemployment and transport investment enhances connectivity to areas
of employment opportunity.
The welfare impact on the economy of enhancements to the transport system
is the sum of conventional economic benefits and wider impacts.
Agglomeration benefits are the most significant of the wider economic
benefits. However, not all welfare benefits have a direct link to productivity.
2.57 Work by Steer Davies Gleave (2006) which explored how enhancing transport links
within and between city regions can lead to economic benefits led to one of the
central positions of the Northern Way's Strategic Direction for Transport (Northern
Way, 2006), namely that for the benefits of economic growth in the North to be
distributed across the North, a balanced approach of enhancing links both within
and between the North's city regions is required.
2.58 This finding was further reinforced by a subsequent study (Steer Davies Gleave,
2007a) which applied a more advanced version of the model used in the earlier
work, but this time instead of considering the impact of broad strategies to
enhance transport links considered the agglomeration benefits of packages of
proposed interventions to improve public transport links. These packages included
one focussed at improving links wholly within the Leeds City Regions and one
focussed at improving links on the trans-Pennine corridor. This work showed that
the inclusion of agglomeration benefits increased the benefits of the within city
region package by 25% and the trans-Pennine package by 12%. Significantly,
because typically inter-regional schemes deliver greater benefits than within-city
region schemes (albeit usually at greater cost) the quantum of agglomeration
benefits was much greater than for the city region package. This led to the finding
that while the inclusion of agglomeration within cost benefit analysis can have the
greatest impact on the value for money case of city region schemes, it also shows
that inter-regional schemes can have a much greater beneficial impact on
productivity growth than previously understood. The work by SERC (2009) looking
at the Manchester - Leeds corridor has further reinforced this conclusion.
To ensure that city regions across the North enjoy economic growth a
balanced approach that enhances links within city regions and between city
regions is required.

Conditional Output Statement
25
2.59 An underpinning assumption for the methodologies employed to estimate welfare
benefits is that the transport intervention under consideration does not have an
impact on the number of people employed or on the structure of the economy. In
particular it is a standard assumption that the pattern of land use (that is the
distribution of population and employment) is invariant between the do-minimum
and do-something scenarios. However, over time transport investments can and do
affect where people live and work. Indeed part of the rationale for a number of
significant investments is to realise changes in the distribution of population and
employment and so economic activity.
2.60 There is a growing body of work that is seeking to identify the impacts that
transport enhancement can have on the economy through supporting structural
economic change. Such work includes that by SERC (2009) and Greengauge21
(2010). This work suggests that well targeted transport investment can have a
substantial economic impact greatly in excess of the impact suggested by a
conventional welfare assessment through facilitating beneficial patterns of land
use development and/or structural changes to the economy (including wage rates).
2.61 Work in this area, however, remains an emerging field and as yet there is no
consensus on appropriate methodologies or the scale of the impact of different
types of transport intervention. Institute for Transport Studies (2010) has reviewed
the methods that have been developed to assess the GVA impacts of transport
investment. ITS identified:
I Transport investment can both stimulate a local economy and lead to
redistribution of economic activity from elsewhere. The redistribution of
economic activity due to a transport investment is important. The available
evidence suggests that redistribution effects are stronger than local
productivity gains;
I In turn, this reinforces the benefit in distinguishing between people-based
productivity effects and place-based productivity effects. People-based effects
come about from the migration of productive labour and are principally
associated with re-distribution. It is place-based effects (such as greater
agglomeration) that determine the net increase in national productivity;
I From the work to date, the contribution of different transport modes to
productivity appears very different. The GVA benefits of rail investments can
be large and overall the evidence thus far suggests that on a per traveller basis,
rail investment has a greater productivity impact than road investment; and
I Changes in productivity associated with rail schemes are particularly driven by
productivity changes of medium skilled workers.
2.62 The ITS work also identifies a number of further issues which are important when
considering how these new approaches are used to inform decision making:
namely, how much is spent on enhancing the transport system and where is that
expenditure directed. Conventional cost benefit analysis takes an equity approach,
that is the value for money case of a transport investment is a function of its use
and how much it costs, not where it is located. In the GVA benefit calculations,
both location and the area over which impacts are assessed are important
influences on the derived estimates of GVA uplift.

Conditional Output Statement
26
2.63 ITS (2010) also identifies that the estimates of GVA uplift is a measure of economic
potential rather than an assessment of the actual impact on the economy of a
particular transport investment. For this potential to be realised, further
investments may be needed in, for example, sites and premises or skills and
training. The nature of these additional investments is unspecified and uncosted in
the GVA assessment methods. It seems important that alongside the GVA
assessment, work is undertaken to understand the capacity of a local economy to
deliver the projected economic potential.
Emerging evidence suggests that transport investments that are anticipated
to have a structural impact on the economy can have an impact far greater
than conventional transport cost benefit analysis would suggest.
Supporting City Region Growth
2.64 Both Leeds and Sheffield have contemporary city region transport strategies.
2.65 The Leeds City Region Transport Strategy (Leeds City Region (2009)) identifies a
number of spatial priorities for development and regeneration:
I Develop the role of Leeds as a regional city and transform the role of Bradford;
I Develop enhanced and complementary roles for the sub-regional cities and
towns: Barnsley (including the Accessibility Improvement Zone and New Growth
Point proposals); Halifax (including Calderdale New Growth Point proposals);
Harrogate; Huddersfield (including Kirklees Strategic Economic Zone);
Wakefield and York;
I Support the Coalfield Regeneration Area in Wakefield district;
I Increase employment opportunities in the Airedale corridor (Bradford to
Skipton);
I Deliver housing regeneration, housing growth and economic development in
Aire Valley Leeds;
I Develop Dewsbury's role by delivering regeneration and housing renewal and
development; and
I Deliver new homes and a new central business district in York North West.
2.66 The Leeds City Region Transport Strategy identifies that these spatial priorities
would be supported by enhanced connectivity on the trans-Pennine corridor to
Manchester and Manchester Airport, to Sheffield City Region and London, to Leeds
Bradford Airport and for rail freight to the Humber ports.
2.67 The Sheffield City Region Transport Strategy (Sheffield City Region (2011)) was
developed in parallel to the third local transport plan for South Yorkshire, which
was adopted by the Integrated Transport Authority in April 2011. This identifies
that business growth in the Sheffield City Region would be supported by improved
interurban connectivity through strengthening rail links to London, Manchester,
Leeds and Nottingham on the Midland Main Line, East Coast Main Line and trans-
Pennine routes. It also notes that employment opportunities would be enhanced by
enhanced connectivity to major regeneration areas, for example in East Doncaster,

Conditional Output Statement
27
the Dearne Valley, Rossington, Waverley, the Lower Don Valley, Markham Vale and
Junctions 36-37 of the M1.
The Leeds and Sheffield city regions have identified spatial priorities for
development and regeneration. Each has highlighted that enhanced
connectivity could support these priorities. Cost effective rail enhancement
will be an option to support some of these priorities, but not all.
Concluding Remarks
2.68 From the review of evidence on the interaction of transport and the economy and
work that has considered the trans-Pennine corridor, it can be concluded that:
I City region economies drive regional and national growth. The North's city
regions perform below the national average and are not meeting their full
potential. They have been more affected by the recession than cities in the
South. The Government has set out its vision for a fairer and more balanced
economy where economic opportunities are more evenly shared.
I To support economic growth there needs to be adequate capacity, so that
journeys can be made reliably and with reasonable journey times:
within city regions;
between city regions; and
to access international gateways.
I Not all city regions are equally well connected. Facilitating economic growth
may require provision of new links to provide new capacity and capability.
I There is strong evidence to support the contention that enhancing connectivity
within the North's city regions, between the North's city regions and to
international gateways needs to be an integral part of any strategy to
accelerate the North's economic growth.
I Enhancing links between the city regions will support and facilitate future
economic growth. Enhancing the trans-Pennine corridor will support growth of
Leeds and Manchester, the North's two largest city region economies and will
also benefit the wider North. The Leeds - Sheffield corridor links the two
largest city region economies in Yorkshire and its enhancement will support
balanced growth in the region.
I The Leeds and Sheffield focussed commuter rail networks have facilitated
sustainable economic growth by supporting growth in city centre employment.
However, on-train crowding and the current scope and reach of the network
limit the scope for future growth.
I Linking areas of economic need such as the southern parts of the Leeds City
Region and the Dearne Valley with locations with stronger economic growth like
Leeds and Sheffield city centres supports the stronger areas by extending
labour markets, while at the same time facilitating spill over effects into the
weaker areas.
I Through its international connectivity Manchester Airport delivers substantial
economic benefits to Yorkshire. These benefits will grow as the Airport grows.
Surface access capacity is the most significant constraint to Manchester

Conditional Output Statement
28
Airport's future growth. Increasing rail mode share for journeys between
Yorkshire & Manchester Airport will support the Airport's growth which in turn
will deliver economic benefits to Yorkshire business and leisure travellers.
Surface access to Leeds Bradford and Robin Hood Doncaster Sheffield airports is
primarily affected by road connectivity and congestion. For rail to play a
worthwhile role the available evidence identifies the importance of direct
services at an attractive frequency operating over much of the day.
I The North's ports provide substantial economic benefits to the North which will
grow as the throughput grows. Growth in throughput of inter-modal containers
combined with increasing congestion on the strategic road network will
increase the demand to move containers by rail, both to/from the North's ports
and between the South Coast ports and the North. Gauge clearance of the links
between the North East and Humber ports to markets in the Midlands and
Scotland is being advanced, but the absence of a gauge cleared route across
the Pennines is a constraint.
I To ensure that city regions across the North enjoy economic growth a balanced
approach that enhances links within city regions and between city regions is
required.
I Emerging evidence suggests that transport investments that are anticipated to
have a structural impact on the economy can have an impact far greater than
conventional transport cost benefit analysis would suggest.
I The Leeds and Sheffield city regions have identified spatial priorities for
development and regeneration. Each has highlighted that enhanced
connectivity could support these priorities. Cost effective rail enhancement will
be an option to support some of these priorities, but not all.
Conditional Output Statement
29
3 Stakeholder Aspirations
Stakeholder Group
3.1 To shape the development of the Conditional Outputs, the study sought to capture
local aspirations for the development of the rail network. To achieve this, a study
stakeholder group was established, with members drawn from local authorities,
development agencies, business representatives and the rail industry.
Stakeholder Event
3.2 A stakeholder event was held in Leeds on 7th October 2011. The objectives of this
event were to inform stakeholders of the study’s remit and timescales and to
ascertain from stakeholders their aspirations for the development of Yorkshire’s
rail network.
3.3 The stakeholder event identified the following key themes that have been
considered in developing the evidence base and Conditional Outputs:
I Theme 1: The Need for Economic Growth;
I Theme 2: Barriers to Growth;
I Theme 3: Improved Passenger Connectivity – through increased frequency,
reduced journey times and provision of more direct services;
I Theme 4: Consistency/Quality; and
I Theme 5: Freight Network Capability.
3.4 The feedback from Theme 3 has been specifically considered in the formation of
the test timetable that underpins the modelling work and is therefore a key input
into the study’s analytical process.
Stakeholder Aspirations for Improvements
3.5 The stakeholders’ feedback has been grouped further into the following aspirations
for the Yorkshire Rail Network:
I Access to the rail network and station quality;
I Connectivity to key regional centres including Leeds, Sheffield and Manchester;
I Connectivity to and between sub-regional centres including Bradford,
Huddersfield, Wakefield, Barnsley and Doncaster;
I Consistent quality of journey experience; and
I Enhanced freight capability.
3.6 The following table demonstrates the link between these aspirations and the
Conditional Outputs. In addition the table considers the overarching national
objectives for the rail industry in terms of increasing the value of the rail industry
and reducing the environmental impact of the rail industry.

Conditional Output Statement
30
TABLE 3.1 STAKEHOLDER ASPIRATIONS V CONDITIONAL OUTPUTS
Aspiration / Objective Conditional Output
Access to the rail network and station
quality
6) Access to the Network
7) Growth centres
9) Links to Airports
Connectivity to key regional centres
including Leeds, Sheffield and Manchester
1) Connectivity
4) Performance
Connectivity to and between sub-regional
centres including Bradford, Huddersfield,
Wakefield, Barnsley and Doncaster
1) Connectivity
4) Performance
Consistent quality of journey experience 2) Capacity
5) Journey Quality
Enhanced freight capability. 3) Freight
Increase value for money of the rail
industry
Subject to subsequent study to identify
solutions
Reduce the environmental impact of
transport
10) Carbon Reduction

Conditional Output Statement
31
4 Modelling Approach
Introduction
4.1 This chapter provides an overview of the modelling framework used to estimate
the potential economic benefits generated by the Test Timetable. This evidence is
used to derive the disaggregated rates of benefit presented in Chapter 5, which in
turn supports the development of the Conditional Outputs. A Benefit Forecasting
Report accompanies this Conditional Output Statement and sets out in detail the
various modelling tools used and assumptions made to derive the potential
economic benefits.
4.2 The benefits of the Test Timetable are conditional upon viable and affordable
solutions being identified. They are provided to guide those developing solutions as
to the relative magnitude of benefits that could be generated in different
corridors. These benefits should not be used to justify investment for which a full
business case, considering in detail all costs and benefits, must be developed.
Defining the Do Minimum and the Test Timetable
4.3 The potential economic benefits presented are the incremental benefits of the
Test Timetable compared to the Do Minimum.
4.4 The Test Timetable is not a viable proposed timetable. It is simply a modelling
input that allows the potential economic benefit of removing network constraints
to be identified and facilitates calculation of the potential rate of benefit on a per
corridor basis. The Test Timetable has been specified to lead to a reduction in
Generalised Journey Time (GJT) compared to the Do Minimum timetable on each
and every corridor in the study area. This is achieved through quicker, more
frequent, and where appropriate direct services. It includes a range of
challenging, but plausible, improvements to services in the study area reflecting
the stakeholders' aspirations for future network development.
4.5 The Do Minimum timetable against which the Test Timetable is modelled has been
coded to reflect the additional peak services in the Leeds area, introduced in
December 2011, and the committed Northern Hub enhancements. The Northern
Hub enhancements include two additional Leeds to Manchester Piccadilly services
providing stops at intermediate services between Huddersfield and Stalybridge
(replacing the existing stopping service between Huddersfield and Manchester
Victoria), and diversion of the existing four trans-Pennine services via Manchester
Victoria and Ordsall Curve.
4.6 The improvements announced for the Hope Valley and Calder Valley routes in the
March 2012 Budget have not been included in the base case. The funding for these
improvements will only be fully committed once a value for money case has been
confirmed, and therefore the exact detail of any proposition is not yet known.
Allocation to Corridors
4.7 Unless otherwise stated, demand and economic benefits have been allocated to
corridors (or specific stations) based on the demand flows originating from stations

Conditional Output Statement
32
within that corridor. This approach differs from the results presented in the
Northern Hub study, which allocated demand and benefits to each corridor based
on flows through the corridor. The adopted approach makes best use of the version
of MOIRA made available for this study.
4.8 This approach means that the modelling results presented in this report have to be
considered differently to those in the Manchester Hub Conditional Output
Statement. The data presented in this study better reflects the origin and
destination of flows that generate benefits. Its strength therefore is that the rates
of benefit presented are independent of how the network could be enhanced to
realise those benefits. This is particularly important when there is more than one
route available between two stations. For example, the benefit from improved
connectivity between Leeds and Sheffield could be achieved by improving either
the route via Barnsley or Moorthorpe. It should also be noted that this study has
adopted more contemporary forecasts of demand growth that reflect the
Government’s lower projections of economic growth as well as the policy to
increase fares in excess of inflation.
Economic Growth Scenarios
4.9 Two demand growth scenarios have been considered. Both scenarios utilise the
Department for Transport’s assumptions for population and employment growth
reflecting summer 2011 Government projections of the rate of economic growth.
Gross Domestic Product (GDP) growth forecasts come from Oxford Economic
Forecasting data supplied by Metro.
4.10 The Trend scenario is based on the standard PDFH1 framework for forecasting
background rail demand growth. However the PDFH framework can underestimate
growth. Therefore the Trend scenario has been presented as a lower bound for
future demand growth and for the potential benefits that could be generated by
improvement to the rail network.
4.11 A Trend Plus scenario considers an updated framework taking into account the
potential for accelerated economic growth. It also considers changes in
employment structure and increases in car parking charges in urban centres to give
a high background demand growth scenario. This approach is consistent with that
taken in the Northern RUS. The Trend Plus forecast gives a higher bound of future
demand growth and the potential benefits.
Passenger Modelling Overview
4.12 Modelling and forecasting the potential economic benefits for passenger
improvements has been undertaken through the following process:
I Development of a study area zoning structure and definition of the study
corridors;
I Definition of the Do Minimum scenario against which the Test Timetable is
considered;
1 Passenger Demand Forecasting Handbook: The rail industry’s standard methodology for forecasting changes in rail
demand.
Conditional Output Statement
33
I Development of a Test Timetable reflecting stakeholder aspirations, to allow
the relative value of aspirations to be tested;
I Modelling of the impact of background economic and population growth on rail
demand;
I Modelling the impact of improved rail services (Test Timetable v Do Minimum)
on rail demand;
I Modelling of the impact of crowding;
I Appraisal of the conventional benefits (revenue, journey time and non-user
benefits) and wider economic impacts (agglomeration, labour supply and
imperfect completion); and
I Assessment of the impact on the distribution of jobs and business activity.
4.13 Central to the valuation of the conventional economic benefits are the rail demand
models. Where appropriate, standard rail industry tools for forecasting the impact
of background economic growth (RIFF-Lite) and the impact of timetable changes
(MOIRA) have been used. The demand forecasting uses as a base case annual
demand for the year to March 2011 taken from Lennon ticket sales data including
PTE ticket infill.
4.14 These models have been supplemented by a bespoke ‘new flows model’ that was
initially developed as part of the Northern Hub study. This model forecasts the
demand impact on flows that are currently poorly served by rail and as a result
may have historically low demand, but where there is potential for additional
demand beyond that forecast by MOIRA. The model is a gravity model that
considers the economic activity at origin and destination stations as well as the
comparable rail GJT and car drive journey time. The model has only been applied
to flows where there is currently no regular direct service and the GJT change is
greater than 20%. Additionally flows to Leeds and Sheffield have been excluded.
Because these are dominant economic centres, there is often established rail
demand to these destinations, even where the service may be relatively poor.
4.15 The wider economic benefits have been forecast based on the change in rail GJT
and demand forecast by MOIRA and the new flows model. A model has been
developed that follows WebTAG guidance to value the wider economic impacts.
4.16 Figure 4.1 illustrates the process used to forecast the potential passenger
economic benefits.
4.17 The Urban Dynamic Model (UDM) is a model that considers the distributional
impact on economic activity as a result in changes in transport supply. A version of
the model has been previously developed for the former Yorkshire and Humber
Region for Yorkshire Forward (the former regional development agency).
4.18 The modelling approach used broadly replicates that used as part of the Northern
Hub study. As such it has been discussed previously with the Department for
Transport as part of the Northern Hub Phase 1 study and was partially adopted by
Network Rail as part of the development of the Phase 2 Northern Hub business
case. For the most part the modelling tools follow standard industry practice and
evidence set out in the Passenger Demand Forecasting Handbook.
4.19 The framework is designed to forecast the impact on demand as a result of
changes to rail supply (timetable and on train capacity). The modelling process

Conditional Output Statement
34
does not consider possible future changes in the supply of alternative modes, for
example changing bus networks or new road links.
FIGURE 4.1 PASSENGER BENEFIT MODELLING OVERVIEW
Rates of Benefit
4.20 The summary of benefits included in Chapter 5 present normalised rates of
benefit; a measure of benefit per appropriate measure of unit improvement. The
rates of benefit seek to present measures of benefit that are comparable between
corridors by normalising the effect of variation in the Test Timetable specification
between each corridor. The rates of benefit have been calculated by dividing the
total benefits generated by the driver of that benefit. For connectivity benefits
the driver is GJT while for crowding benefits the driver is the number of peak
additional seats in each corridor.
4.21 Revenue increment, journey time, non-user and wider economic benefits are all
generated by connectivity improvements included in the Test Timetable. The value
of these benefits has therefore been expressed as a per minute reduction in GJT.
GJT is a measure of journey time used for rail journeys that includes passengers
perceived journey frequency penalty, the actual journey time and a perceived
penalty where there is a need to interchange. The average change in GJT from
stations in each corridor is shown in Figure 4.2.

Conditional Output Statement
35
FIGURE 4.2 AVERAGE GJT CHANGE – DO MINIMUM V TEST TIMETABLE
4.22 The crowding benefits are generated by the additional seats offered in the peak
periods (07:00 – 10:00 and 16:00 – 19:00) in the Test Timetable compared to the
Do Minimum.
4.23 Figures 4.3 and 4.4 summarises the additional seating capacity assumed in each
corridor during the peak periods.
FIGURE 4.3 INCREMENTAL PEAK SEATS - DO MINIMUM V TEST TIMETABLE -
TREND

Conditional Output Statement
36
FIGURE 4.4 INCREMENTAL PEAK SEATS - DO MINIMUM V TEST TIMETABLE –
TREND PLUS
Passenger Demand Growth
4.24 The key drivers of growth in rail demand are GDP, which drives business and
leisure trips, and employment which drive commuting trips. Forecast GDP growth
for the Yorkshire and Humber region has been adopted from Oxford Economic
Forecasting data supplied by Metro while employment growth has come from
Tempro version 6.2. Figure 4.5 illustrates the forecast growth between 2011 and
2027 in GDP and employment for the Trend scenario.
FIGURE 4.5 FORECAST GDP AND EMPLOYMENT GROWTH, 2011 TO 2027

Conditional Output Statement
37
4.25 The RIFF-Lite model, which reflects PDFH guidance, has been used to derive the
rail demand growth forecasts, based on the economic data summarised above. The
following graphs present the growth in demand from stations in each corridor. Not
all these journeys will be to and from the capacity constrained centres in the study
area. However they may still benefit from the relaxation of capacity constraints
some distance from their journey as this may facilitate improved frequency of
services, capacity and service performance.
4.26 Figure 4.6 shows the forecast growth in demand between 2011 and 2019 for each
of the individual stations and corridors. This shows that, with the exception of the
East Coast Main Line to London, the largest growth is seen on the corridors
radiating from Leeds, with lower growth found in the Sheffield City Region. This
reflects the differential in employment growth forecasts between the Leeds and
Sheffield City Regions.
FIGURE 4.6 2011 TO 2019 DEMAND GROWTH – TREND
4.27 The growth shows a conservative forecast of background demand growth with
average growth across all corridors of around 8.6% between 2011 and 2019, which
equates to an annual growth rate of 1.0% per year. The Trend Plus forecast growth
is summarised in Figure 4.7. This shows an increased rate of growth across the
study area. The average growth across all corridors between 2011 and 2019 is
21.0%, which equates to an annual growth rate of 2.4% per year.
4.28 Although the approach to the Trend Plus forecasts is consistent with the Northern
RUS the resulting growth rates differ. This is because the forecasts presented as
part of this study are based on a shorter time period (The base demand year for
the RUS is 2008/09 whereas the base year for this s tudy is 2010/11) and more
recent, and conservative, projections for employment, population and economic
growth.

Conditional Output Statement
38
4.29 Figure 4.8 provides a comparison of the forecast Trend and Trend Plus growth, set
against the context of historic demand growth in the study area. This shows the
strong growth in rail demand over the past 13 years. The dip in demand in 2000/01
reflects disruption to rail services in the aftermath of the Hatfield accident as well
as disruption associated with Leeds Station’s redevelopment. Demand growth was
also subdued during 2008/09 as a result of the economic recession. The Trend Plus
forecast suggests that demand growth will continue albeit at slower rates than
previously experienced, while the Trend forecasts suggests that growth would
continue at a notably slower rate. While subdued rates of growth and above
inflation fare increases contribute to these lower rates of growth, historically
national rail demand forecasting models have understated actual growth in
Yorkshire.
FIGURE 4.7 2011 TO 2019 DEMAND GROWTH – TREND PLUS

Conditional Output Statement
39
FIGURE 4.8 HISTORIC AND PROJECTED DEMAND GROWTH
Forecast Passenger Demand
4.30 The following figures summarise the demand growth from 2011 to 2027 including
the effect of background demand growth and the Do Minimum timetable
assumptions (summarised in Paragraph 5.16). The demand considered includes all
trips to or from stations included within corridors in the study area. The growth to
2027 equates to 21% in the Trend scenario and 37% in the Trend Plus scenario.
FIGURE 4.9 DO MINIMUM DEMAND GROWTH BY ORIGIN - TREND

Conditional Output Statement
40
FIGURE 4.10 DO MINIMUM DEMAND GROWTH BY ORIGIN – TREND PLUS
4.31 Figures 4.11 and 4.12 illustrate the induced demand in each of the modelled
demand years as a result of the Test Timetable.
4.32 In the Trend scenario, Do Minimum demand is forecast to be 95m in 2019, rising to
105m by 2027. Considering the Test Timetable the demand is forecast to be 118m
in 2019, an increment of 22m (24%) from the Do Minimum, and 130m in 2027, an
increment of 25m (24%).
4.33 In the Trend Plus scenario, Do Minimum demand is forecast to be 106m in 2019
increasing to 118m by 2027. Demand including the Test Timetable is forecast to be
130m in 2019, an increment of 25m (23%), while in 2027 demand is forecast to be
146m, an increment of 28m (23%).

Conditional Output Statement
41
FIGURE 4.11 TEST TIMETABLE INDUCED DEMAND BY ORIGIN - TREND
FIGURE 4.12 TEST TIMETABLE INDUCED DEMAND BY ORIGIN – TREND PLUS
Passenger Economic Benefits
4.34 A WebTAG compliant 60 year appraisal of the economic benefits generated by the
Test Timetable compared to the Do Minimum has been undertaken. This assumes
that the Test Timetable would be delivered in 2019. The appraisal suggests that
potential benefits of the Test Timetable could be £10.5bn under the Trend
scenario and £12.2bn in the Trend Plus scenario.

Conditional Output Statement
42
4.35 A more detailed breakdown of the economic benefits by origin, benefit type and
destination is provided in Appendix B.
4.36 The origin and destination of journeys made spreads beyond the study area with
origins and destination across the country as a whole. Many of these journeys may
not travel to or through the capacity constrained centres in the study area.
However such passengers may still benefit from improvements to infrastructure
not directly on their journey as a result of better service frequency, improved
connections and better performance.
4.37 A breakdown of the economic benefits by corridor is shown in Figure 4.13 for the
Trend scenario and Figure 4.14 for the Trend Plus scenario.
4.38 With the exception of the crowding benefits the graph shows the benefits
allocated to each individual station or corridor based on journeys originating from
the station or corridor. The crowding benefits accrue to the corridors through
which services run, hence there are no crowding benefits at the regional and sub-
regional centre stations. The graph shows that the greatest benefits are generated
on flows from the major regional centre stations, with significant benefit also
being generated from the inter-regional and local corridors serving Leeds and
Sheffield.
FIGURE 4.13 TOTAL BENEFITS BY TYPE - TREND

Conditional Output Statement
43
FIGURE 4.14 TOTAL BENEFITS BY TYPE – TREND PLUS
4.39 Figures 4.15 and 4.16 show the distribution of benefits, in the Trend and Trend
Plus scenarios respectively, by destination. This shows that the largest benefits are
generated by flows to and from the regional centre stations. Within the study area
the key destinations are Leeds and locations within the Leeds City Region. This
reflects that there is a much larger demand for rail travel in the Leeds City Region
as a result of the larger rail network. There are also significant benefits to be
found from improvement to services to the Sheffield City Region.
4.40 On these graphs, the horizontal axis shows the origin. The destinations are
represented by different colours within the bars. Again the vertical axis shows the
monetised rate of benefit.

Conditional Output Statement
44
FIGURE 4.15 CONNECTIVITY BENEFITS BY DESTINATION - TREND
FIGURE 4.16 CONNECTIVITY BENEFITS BY DESTINATION – TREND PLUS

Conditional Output Statement
45
Impact on Jobs
4.41 The Trend and Trend Plus scenarios project growth in rail demand of between
9% and 21% by 2019. Growth in journeys to the key employment centres, namely
the regional and sub-regional centres (excluding London), is greater, with trend
growth forecast to be 12% and Trend Plus growth of 29%. Even though the benefit
modelling takes into account on-train crowding there is a theoretical assumption in
the modelling that this level of demand growth can be accommodated by the
capacity modelled in the Do Minimum timetable. This assumption has been made
because the study does not consider how the benefits would be delivered.
4.42 The forecast level of growth in the peak periods suggests an increase of between
10,000 and 28,000 in the number of daily commuting journeys made by rail to the
regional and sub-regional centre stations. If this growth cannot be accommodated
by rail, trips will either be made by another mode, possibly to another destination
or not made at all, with the associated possible economic disbenefit. Providing
additional capacity to realise this growth is therefore essential to support
employment growth in the regional and sub-regional centres and across the region
in general, as recognised by the Northern RUS2.
4.43 In addition to enabling this growth in travel to employment there can be further
job impacts associate directly with enhancements in rail connectivity. Two
separate analyses of the potential impact on jobs in the study area as a result of
connectivity enhancements have been undertaken.
4.44 Wider economic impacts have been quantified as part of economic analysis and
these can also be expressed as a number of jobs. Additionally the UDM has been
used to understand the potential generation and distributional impact of
enhancement to rail connectivity on jobs. These assessments consider only the
impact of rail connectivity and no other supply or demand side changes. This is a
deliberately conservative approach.
GDP ‘Job Equivalent’ Benefits
4.45 The wider economic impacts quantified as part of the study seek to value the
potential productivity benefits to the economy in terms of GDP. By dividing the
total GDP benefits by the average GDP per worker it is possible to express the
wider economic impacts as a ‘job equivalent’ value, rather than a financial value.
However while it is possible that some productivity gains could result in increased
employment it is also possible that the productivity gains would result in lower
costs to consumers or increased profitability for business from improved
productivity of existing workers. It is important to note that these benefits are the
same as those quantified as part of the wider economic impacts, and not
additional to the wider economic impacts.
4.46 Figures 4.17 and 4.18 present the ‘jobs equivalent’ valuation of GDP benefits, for
each corridor for the Trend and Trend Plus scenario. The values show an annual
‘job equivalent’ based on the GDP gains in 2019.
2
http://www.networkrail.co.uk/browse%20documents/rus%20documents/route%20utilisation%20strategies/rus%20ge
neration%202/northern/northern%20route%20utilisation%20strategy.pdf

Conditional Output Statement
46
FIGURE 4.17 GDP ‘JOBS EQUIVALENT’ - TREND
FIGURE 4.18 GDP ‘JOBS EQUIVALENT’ – TREND PLUS
4.47 In total the analysis suggests that the total GDP benefits for 2019, expressed as
jobs, could be between 3,500 in the Trend scenario and 3,850 in the Trend Plus
scenario.
4.48 The graphs show that the greatest productivity gains, expressed as a job
equivalent, are generated by flows to and from the regional centres, particularly

Conditional Output Statement
47
from corridor stations. This reflects the importance of providing connectivity from
residential areas to employment and retail opportunities as well as inter business
connectivity.
4.49 Part of the valuation of GDP impacts includes the valuation of increased
willingness to work (labour market impacts) as a result of the reduced cost
(including journey time) of travel to employment opportunities. Calculating the
‘jobs equivalent’ measure of GDP using just the labour market impact provides a
more specific measure of potential job creation. Since the labour market impacts
relate solely to the willingness of the labour market to seek employment it can be
considered that these benefits will result in increased employment instead of
other productivity benefits. This measure can be calculated by dividing the labour
market impact benefits by the GDP per worker. As with the ‘jobs equivalent’ it is
important to note that these projections of increased labour market benefits are
the same as those quantified as part of the wider economic impacts, but expressed
in a different form of account. These job numbers are a subset of those identified
above in paragraphs 4.44 to 4.47.
4.50 Figures 4.19 and 4.20 present the ‘jobs equivalent’ valuation of GDP labour market
impacts benefits, for each corridor for the Trend and Trend Plus scenario.
FIGURE 4.19 ‘JOBS EQUIVALENT – LABOUR MARKET IMPACTS’ - TREND

Conditional Output Statement
48
FIGURE 4.20 ‘JOBS EQUIVALENT – LABOUR MARKET IMPACTS’– TREND PLUS
4.51 These show that the greatest benefits can be found by improving connections from
the sub-regional and corridor stations to the regional centres. These reflect the
concentration of employment found in the regional centres. In total the analysis
suggests, in 2019, there could be an additional 140 jobs in the Trend scenario and
160 in the Trend Plus scenario.
Urban Dynamic Model
4.52 The UDM is a simulation of how an urban area evolves over time, with particular
emphasis on how transport, land-use, population and employment all interact. The
job projections forecasts by the UDM are in addition to those identified in the GDP
‘jobs equivalent’ analysis.
4.53 For this study the UDM has been used to understand the distributional impact on
employment in the study area as a result of improvements to rail services. Rather
than model the specific benefits of the Test Timetable the UDM analysis has
considered a number of specific scenarios selected to represent packages of
possible enhancements to rail services that are likely to have differing impacts on
the distribution of employment. These have been informed by feedback received
at the stakeholder event. The packages consider improvements:
I Test 1 - to connections between the key regional economic centres of Leeds,
Sheffield and Manchester and key intermediate locations (Wakefield, Barnsley,
Stockport, Huddersfield). This considers zones covering the city centre and
suburbs of these cities;
I Test 2 - for commuter flows from Leeds City Region to Leeds. This includes
improvements from all zones in the Leeds City Region to zones covering Leeds
City Centre;

Conditional Output Statement
49
I Test 3 - for commuter flows from Sheffield City Region to Sheffield. This
includes improvements from all zones in the Sheffield City Region to zones
covering Sheffield City Centre; and
I Test 4 - in connections between sub-regional centres including Harrogate, York,
Bradford and Halifax, Huddersfield, Wakefield, Barnsley and Doncaster.
4.54 To understand how a different magnitude of improvements may affect the
distribution of economic activity a high and low reduction in generalised cost of
10% and 30% is being considered. This will give a range of possible distributional
impacts.
4.55 Figure 4.21 provides a summary of the net impact on employment, in terms of the
number of jobs, for each of the tests. A more detailed illustration of the
distribution of changes in jobs is provided in Appendix D. This suggests that there
will be some abstraction of jobs from outside the study area to as a result of the
tests. The notable abstraction in jobs from central Manchester in Tests 1, 2 and 4
is as a result of improved connectivity to locations in the study area from areas
that are also connected to Manchester, for example Huddersfield. The more minor
abstraction in jobs from areas not explicitly modelled in each test can be
considered as ‘noise’ within the model.
FIGURE 4.21 UDM TESTS – POTENTIAL JOB IMPACT
4.56 The figure shows the breakdown of job impacts for each of the test scenarios
considered. However in practice solutions developed to address the conditional
outputs are likely to deliver improvements that are covered by a combination of
the modelled test scenarios. The combined job projection for all tests considering
a 30% reduction in rail generalised journey cost is in excess of 1,000 for the Leeds
City Region and around 200 for the Sheffield City Region (reflecting the smaller rail
market and network density in this region).

Conditional Output Statement
50
4.57 A combination of test 2 and 3, consisting of improved journey to work trips to
central Leeds and Sheffield are forecast to generate the greatest number of
additional jobs. Where the generalised costs are improved by 30% the UDM
suggests an increase of 700 jobs in Leeds and 150 jobs in Sheffield.
4.58 Test 1 suggests that over 200 jobs could be generated in Yorkshire by improving
connectivity between Leeds, Sheffield and Manchester (and intermediate
locations), under the 30% generalised cost reduction scenario. The increase in jobs
includes the abstraction of around 120 jobs from the Manchester area as a result of
improved access to the Yorkshire region from locations such as Huddersfield.
4.59 Test 4, improving connectivity between selected regional and sub-regional
centres, has a relatively smaller net impact on jobs in the city regions
4.60 Overall the analysis suggests that the interventions most likely to generate jobs
are improvements to access to Leeds. However there are also meaningful benefits
that could be generated by improving connectivity to Sheffield and between the
key centres of Leeds, Sheffield and Manchester.
Performance
4.61 The punctuality of services is a consideration of passengers when they choose to
travel by rail. Evidence suggests that passengers typically perceive unscheduled
journey time (i.e. lateness) at 2.5 times the actual time, although this multiple
increases up to 6.1 for longer distance services and to 6.5 for journeys to airports.
Consistent poor performance can lead to passengers choosing to travel by
alternative modes, or to not travel at all.
4.62 The Public Performance Measure (PPM) is the percentage of trains arriving at their
destination, having made all planned calls, and within a specified lateness margin.
The lateness margin is 5 minutes for shorter distance services and 10 minutes for
longer distance services.
4.63 Northern Rail operates the majority of services within the study area. Details of
Northern Rail’s Moving Annual Average (MAA) PPM by service is provided in
Appendix C. This shows that the PPM measure for services in South and East
Yorkshire is 90% and in West and North Yorkshire is 92%, compared to the PPM
target of 91%. However, there is notable variation in PPM between different
services, ranging from 85% for services between York and Blackpool to 96% for
services between Leeds and Bradford Forster Square.
4.64 First TransPennine Express services via the South Trans Pennine route recorded
MAA PPM of 96% to January 2012 while for the North Trans Pennine route the PPM
was 95%. The PPM target for these routes was 88%.
4.65 The performance benefits have not been quantified as part of this study. Some
routes are already performing at or in excess of the study area wide targets. On
some relatively well performing routes investment to further increase the PPM may
well prove to be prohibitively expensive. Nonetheless, improving performance can
generate worthwhile economic benefits. These should be taken into consideration
when developing future enhancements to the rail network, particularly on those
corridors that are currently performing below average.

Conditional Output Statement
51
Freight Modelling Approach
4.66 Rail freight is an important part of the rail industry bringing benefits across the
country and in Yorkshire specifically. The valuation of the benefits of freight paths
complements the valuation of passenger benefits and will allow those developing
solutions to consider the importance of freight capacity where there is an
interaction with passenger corridors.
4.67 The approach taken to value the benefits of additional rail paths follows a
different approach to that used for passenger benefits. This focuses on the key
demands for rail freight in the study area: Intermodal, Aggregates, Steel and Coal.
4.68 Rail freight movements fluctuate greatly as the economy, business and shipping
practices change. Therefore it is very challenging to accurately reflect a likely
future rail freight timetable. Instead an approach has been adopted to value the
economic benefits on a number of key existing and aspirational future freight
corridors rather than for a specific timetable.
4.69 The freight flows that have been considered are summarised as follows. The key
rail freight terminals and corridors in the study area have been identified in the
map in Figure 1.2.:
I Intermodal:
Tees Port to Manchester;
Tees Port to Southampton;
Leeds to Felixstowe;
Leeds to Wilton
I Aggregates:
Hope to Dewsbury;
Hope to West Thurock;
Rylstone to Hull;
Peak Forest to the South East;
Tunstead to Aire Valley Power Stations;
Drax to Hope;
I Steel:
Immingham to Scunthorpe;
Scunthorpe to South Wales;
I Coal:
Immingham to West Burton;
Hunterston to Drax;
I Other:
Waste from Greater Manchester to Roxby.
4.70 The freight modelling identifies two sets of benefits:
I Quantification of the direct non user benefits of being able to accommodate
additional rail freight movements which in turn leads to a reduction in the

Conditional Output Statement
52
number of lorry miles. This uses Mode Shift Benefit Rates as identified by the
DfT3; and
I A qualitative assessment, using numerical evidence, of the importance of the
rail freight industry drawing on Input – Output analysis for the national economy
as a whole and the Yorkshire economy specifically.
Freight Benefits
4.71 The estimated direct economic benefits, which includes the congestion and
environmental benefits of removing freight from the highway network, for each of
the freight flows modelled is summarised in Table 4.1. This considers each freight
flow operating on a daily weekday basis throughout the 60 year appraisal period.
This suggests that the total potential economic benefit of delivering all of the
selected flows could be £689m. The value per return freight path ranges from
£125m for aggregates flows from the Peak District to South East England to £7m for
short distance flows between Scunthorpe Steel Works and Immingham Docks.
TABLE 4.1 FORECAST DIRECT FREIGHT BENEFITS
Freight Flow Economic Benefit (PV 2002 £m)
Tees Port – Manchester £24
Tees Port – Southampton £68
Leeds – Felixstowe £60
Hope – Dewsbury £21
Hope - West Thurrock £90
Rylstone – Hull £48
Peak Forest - South East £125
Immingham – Scunthorpe £7
Scunthorpe - South Wales £30
Immingham - West Burton £43
Hunterston – Drax £71
Leeds – Wilton £18
Tunstead - Aire Valley £30
Drax – Hope £25
Greater Manchester – Roxby £29
Total Benefits £689
3 http://assets.dft.gov.uk/publications/adobepdf-165226-443908/msbtechpaper.pdf

Conditional Output Statement
53
4.72 To understand the economic value of the rail freight industry, Input Output Table
analysis has been used. Input Output Tables show the supply and demand of all
industries in the economy in order to produce goods and the final consumption of
these goods.
4.73 By analysing the rail freight sector’s supply chain within the table, and the supply
chains of the industries using rail freight, it is possible to understand how
important the sector is for the rest of the economy, both nationally and within
Yorkshire.
4.74 The economic importance of the sector is measured at three levels:
I The direct effect is the turnover and employment of the industry itself;
I The indirect effect adds the sum of inter-trading between businesses to the
direct turnover. This registers as a multiplier effect as goods and services are
traded; and
I The induced effect is the indirect effect plus the expenditure driven by the
household income derived from the rail freight sector.
4.75 The direct value of the rail freight industry nationally is £830m per year
representing around 0.03% of the gross national output. The industry supports
economic output of £3,800m through indirect links and £8,300 through induced
links, the latter representing around 0.33% of the national economic output.
4.76 At a Yorkshire level the direct value of the rail freight industry is £82m, around
0.04% of the Yorkshire economy. The industry supports economic output of £332m
through indirect links and £586m through induced links, which represents around
0.25% of the Yorkshire economy.
4.77 The rail freight industry brings significant benefit to the national and local
economies in Yorkshire. It is therefore important that the forecast growth in rail
freight is accommodated to ensure that rail freight continues to support the
national and local economies.


Conditional Output Statement
55
5 Disaggregated Rates of Benefit
Introduction
5.1 The Test Timetable has been used to model the potential benefit improvements to
passenger connectivity and capacity. The objective of this Conditional Output
Statement is to provide direction to the future development of the rail network in
Yorkshire by identifying the types of services to which improvements may yield the
greatest benefits. This chapter provides an overview of the benefits of the Test
Timetable disaggregated by origin, destination and benefit type.
5.2 The Test Timetable considers a range of plausible enhancements to the services in
the study area. However, taken as a whole these are not necessarily all
economically viable or affordable enhancements and are unlikely to be technically
feasible without substantial investment. Reflecting this, what is of most interest in
informing the Conditional Outputs is the value of capacity per additional seat and
connectivity enhancements per minute of Generalised Journey Time (GJT)
improvement in different corridors rather than the absolute benefit generated.
Further, considering just the absolute benefits alone has the potential to be
misleading because of variation in the Test Timetable specification between each
corridor, although care has been taken to ensure enhancements to different
services are broadly equal.
5.3 Therefore, unless stated, this chapter presents normalised rates of benefits by
considering the total benefit generated divided by the driver of benefit. For
connectivity benefits the driver is GJT while for crowding benefits the driver is the
number of peak additional seats in each corridor. This serves to normalise the
effect of variation in the Test Timetable specification between each corridor while
still allowing comparison of the relative impact of improvements to different
services.
5.4 The metrics have been calculated based on the modelling approach summarised in
Chapter 4. The following metrics have been used:
I Crowding benefits per incremental seat provided in the peak periods;
I Timetable related benefits per GJT minute improvement; and
I Freight benefit per freight path.
5.5 The benefits are generated as a result of the improvements made in the Test
Timetable compared to the Do Minimum or the possible additional freight paths
considered. The Trend and Trend Plus scenarios present low and high scenarios of
possible future demand growth. They suggest a range of potential benefits but do
not materially change the comparable scale of benefits between different
corridors. For ease of presentation the benefits presented are for the Trend Plus
scenario, with the comparable Trend scenario graphs included in Appendix B. This
Appendix also includes tables presenting a detailed breakdown of the Rates of
Benefit for each origin, benefit type and destination.

Conditional Output Statement
56
Guidance on Interpreting the Rates of Benefit
5.6 The potential economic benefit as a result of service enhancements is driven by
two key factors: the size of the improvement and the number of people
experiencing that improvement. The rates of benefit presented are normalised
based on the size of the improvement (journey time reduction or additional seats).
The sizes of the resulting rates of benefit differ between stations and corridors
based on the volume of demand. It is therefore expected that, for example, the
rate of benefit in the Leeds City Region which has a larger rail network and greater
demand, will be larger than that in the Sheffield City Region.
5.7 The rates of benefit can be used to identify where the greatest benefit may be
generated. However, to make the case for investment it is necessary to identify an
affordable and value for money case for investment. Alone, rates of benefit cannot
be taken as an indication that investment is worthwhile as the rates do not
consider the likely cost of enhancement nor therefore, the likely value for money
case. Experience would suggest that to realise the higher rates of benefit in the
Leeds City Region will likely require a larger scale of investment.
5.8 It is important that any future study to identify possible solutions to deliver the
Conditional Outputs considers possible enhancements across the study area. To
focus solely on those corridors returning the highest rates of benefit may omit
possible low cost/high value for money enhancement elsewhere in the region, as
well as having potential distributional impacts on where benefits occur and on the
segments of the population that may benefit.
Capacity Benefits
5.9 Improving connectivity between employees and employment opportunities and
between businesses will support economic growth. Lack of capacity to make these
connections, be it crowding on train or bus or highway congestion, is a disincentive
to travel. It will reduce the pool of employees available to business and limits
business interaction which ultimately can restrict economic growth. The rail
network provides a crucial role connecting employees to employment
opportunities, particularly to those opportunities in the regional and sub-regional
centres of the Leeds and Sheffield City Regions. For rail to continue to support to
the full economic growth in the region sufficient capacity needs to be provided to
accommodate future demand growth.
5.10 Evidence4 suggests that passengers perceive crowding once a train is loaded at
more than 70% of the seating capacity. The perceived economic disbenefit of
crowding has been monetised as part of this study to calculate the potential
economic benefit of additional capacity to reduce crowding. The valuation of
crowding benefits seeks to identify the reduction in ‘crowded minutes’
experienced by existing and new passengers as a result of the additional capacity
(through longer and/or more frequent trains) in the Test Timetable.
5.11 Figure 5.1 provides a summary of the crowding benefits per additional peak (07:00
– 10:00 and 16:00 – 19:00) seat provided in the Test Timetable compared to the Do
4 Passenger Demand Forecasting Handbook

Conditional Output Statement
57
Minimum. Unlike the connectivity benefits presented later, the graph below shows
the benefit on journeys through each corridor and not specifically to and from
origins within the corridor.
FIGURE 5.1 NORMALISED CROWDING BENEFITS – TREND PLUS
5.12 The graph shows that the highest rates of crowding benefit per incremental seat,
and therefore focus of future planning for investment, can be found on the
commuter and inter regional services to and from Sheffield, notably to
Manchester, Nottingham and Doncaster. There are also benefits from
improvements to capacity in corridors that provide journey to work trips to Leeds,
notably the Skipton corridor. Worthwhile benefits can also be found on most other
corridors, and achieving these benefits must also be considered in any future
study.
5.13 It is notable that North Trans-Pennine crowding benefits are relatively small
between the Do Minimum and Test Timetable. This is because the Do Minimum
timetable includes increased capacity through the introduction of six trains per
hour between Leeds and Manchester, part of the Northern Hub first phase
implementation.
Connectivity Benefits
5.14 Connectivity benefits are generated because, compared to the Do Minimum
scenario, the Test Timetable delivers faster station to station journey times, more
frequent services and reduced need to interchange. This improvement in
connectivity will support economic growth in the study area by making it easier for
employees to travel to employment opportunities and for business to business
travel.

Conditional Output Statement
58
5.15 The following graphs show the economic benefit per minute of GJT improvement.
GJT is a composite measure of journey time used for in rail demand forecasting
and benefit assessment and includes passenger perceived frequency penalty, the
actual journey time and a perceived time penalty where there is a need to
interchange.
5.16 Figure 5.2 presents the benefit per GJT minute improvement for journeys from the
regional and sub-regional centres and for other stations grouped by corridor. The
following type of benefits have been identified:
I Revenue increment – is the additional revenue generated;
I Journey time – is the monetised reduction in GJT;
I Non-user benefits – is the benefits to non-rail users as a result of mode shift
from car to rail; and
I Wider economic impacts – are the broader impacts on the economy, including
from agglomeration benefits, improved labour supply and addressing imperfect
competition.
5.17 The horizontal axis shows all benefits accruing to journeys where regional, sub-
regional or corridor station is the origin of the journey. The vertical axis shows the
normalised rate of benefit monetised in millions of pounds stated in Present Value
(PV) terms.
FIGURE 5.2 NORMALISED CONNECTIVITY BENEFITS BY TYPE – TREND PLUS
5.18 As expected that the graph suggests that generally the highest rates of benefits
can be generated by improvements to journeys from regional centre stations and
Leeds City Region stations, reflecting the larger volumes of demand that may
benefit from improvements.
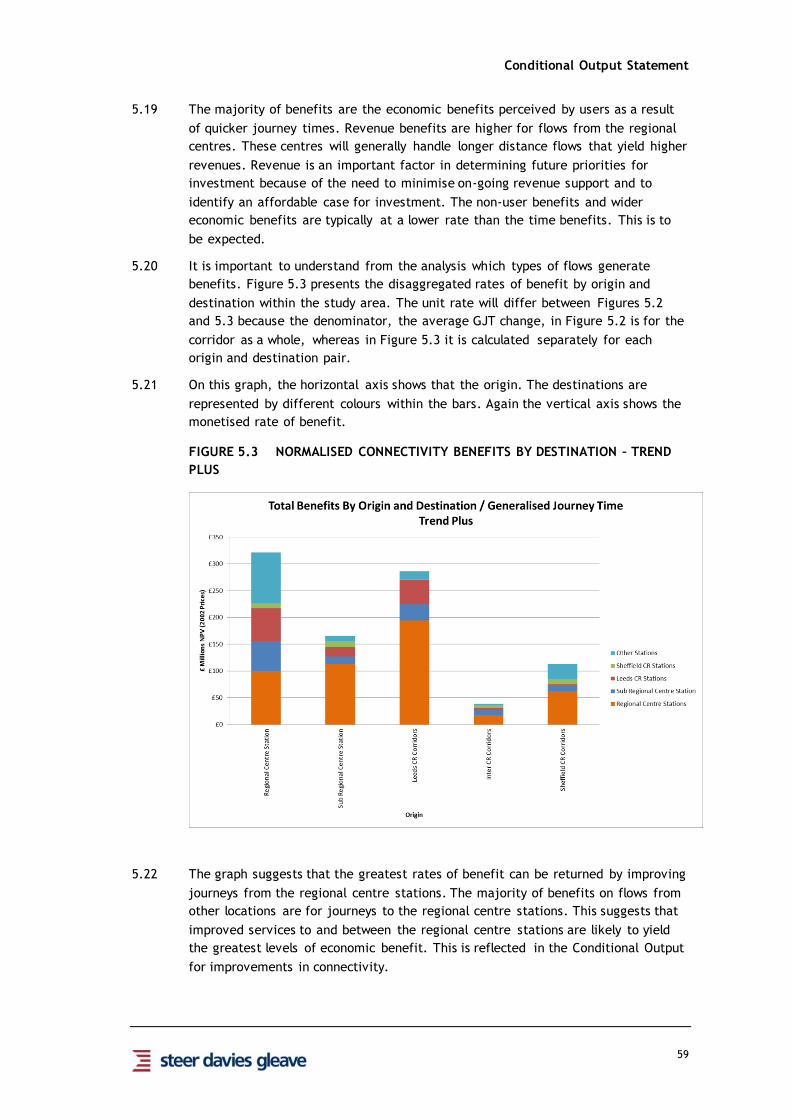
Conditional Output Statement
59
5.19 The majority of benefits are the economic benefits perceived by users as a result
of quicker journey times. Revenue benefits are higher for flows from the regional
centres. These centres will generally handle longer distance flows that yield higher
revenues. Revenue is an important factor in determining future priorities for
investment because of the need to minimise on-going revenue support and to
identify an affordable case for investment. The non-user benefits and wider
economic benefits are typically at a lower rate than the time benefits. This is to
be expected.
5.20 It is important to understand from the analysis which types of flows generate
benefits. Figure 5.3 presents the disaggregated rates of benefit by origin and
destination within the study area. The unit rate will differ between Figures 5.2
and 5.3 because the denominator, the average GJT change, in Figure 5.2 is for the
corridor as a whole, whereas in Figure 5.3 it is calculated separately for each
origin and destination pair.
5.21 On this graph, the horizontal axis shows that the origin. The destinations are
represented by different colours within the bars. Again the vertical axis shows the
monetised rate of benefit.
FIGURE 5.3 NORMALISED CONNECTIVITY BENEFITS BY DESTINATION – TREND
PLUS
5.22 The graph suggests that the greatest rates of benefit can be returned by improving
journeys from the regional centre stations. The majority of benefits on flows from
other locations are for journeys to the regional centre stations. This suggests that
improved services to and between the regional centre stations are likely to yield
the greatest levels of economic benefit. This is reflected in the Conditional Output
for improvements in connectivity.

Conditional Output Statement
60
5.23 Delivering improvements to and between all regional centre stations is likely to
require significant enhancements in the rail network covering the whole region,
which may well not be affordable. It is useful to consider where the greatest
benefits can be gained by perhaps making more focused enhancements. Figure 5.4
presents the benefit per GJT minute improvement further divided by the number
of stations, which is used as a representation for the size of the rail network, and
therefore the scale of potential investment needed to achieve the benefits.
5.24 This further supports the conclusion that the greatest benefits can be found by
improving services from the regional centre stations. However it provides greater
focus on the relative benefit of improving services between the regional centres
and from the sub-regional Centres to the regional centres, which could be
achieved through improving connections between a relatively small number of
stations.
FIGURE 5.4 NORMALISED CONNECTIVITY BENEFITS BY DESTINATION AND
NUMBER OF STATIONS – TREND PLUS
5.25 This conclusion is further enforced by the graph in Figure 5.5 which shows the
distribution of absolute benefits by flow type. The scale of benefit to destinations
outside the study area, e.g. London, reflect that no specific enhancements have
been modelled for these flows.

Conditional Output Statement
61
FIGURE 5.5 PROPORTION OF TEST TIMETABLE BENEFIT BY FLOW TYPE –
TREND PLUS
5.26 This graph shows that 12% of the Test Timetable connectivity benefits (excluding
crowding) can be achieved by improving connectivity between the regional centres
and a further 16% by linking the sub-regional centres to the regional centres.
Delivering improved connectivity between these locations could largely be
achieved by improvements to inter-regional services on four key corridors through
the region, namely:
I York to Manchester, via Leeds and Huddersfield;
I Leeds to Manchester via Bradford and Halifax (the Calder Valley route);
I Leeds to Sheffield, and beyond; and
I Doncaster to Manchester via Sheffield.
5.27 Figure 5.5 also makes very clear the importance of commuting flows to the
regional and sub-regional centres from the local (corridor) stations. While there is
a sizeable benefit to be gained from these improvements, achieving this is likely to
be more challenging requiring enhancement to services on a greater number of
corridors. The solution that is likely to yield the greatest benefits is where
enhancements lead to a combination of intra-regional and local services.
Freight Benefits
5.28 The direct economic benefits, in terms of a 60 year PV appraisal, have been
identified per additional daily freight path for a range of possible freight
movements. The direct economic benefits include the benefit from reduced
highway HGV mileage resulting from goods moving by rail. This suggests the level
of benefit per daily return freight path ranges from £125m PV for longer distance

Conditional Output Statement
62
aggregates flows from the Peak District to the South East England to £7m PV for
shorter distance flows between Scunthorpe and Immingham.
5.29 Significant growth is anticipated in the inter-modal market. The value of a freight
path from Tees Port to Southampton (which could include loaded traffic in either
direction for all or part of the route) would deliver direct benefits of £68m PV per
return path, while a flow from Tees Port to Trafford Park might secure £24m PV
benefit per return path.
5.30 These values do not include the potential wider economic benefits, which have
been summarised in Chapter 4.

Conditional Output Statement
63
6 Conditional Output Statement
6.1 This chapter – the Conditional Output Statement - sets out a number of desirable
outcomes for the rail network. These have been developed with consideration of
the wider transport objectives of supporting economic growth and carbon
reduction.
6.2 The outputs are described as conditional because achieving each of these outputs
is conditional upon affordable and economically viable solutions being identified.
It is anticipated that potential solutions to meet the outputs will be identified by
further study.
6.3 The Conditional Outputs have been considered by the study’s Steering Group. The
Steering Group has taken into account national objectives for transport as well as
stakeholders aspirations for rail network development and the available evidence
of the benefits that improvements to rail connectivity can bring. This evidence
includes existing plans, strategies and analysis as well as specific analysis
undertaken as part of this study to value the potential economic benefits that
improvements to rail services in Yorkshire could generate. Because the Conditional
Outputs are based on a range of evidence they do not specifically represent the
enhancements considered in the Test Timetable.
6.4 The first three Conditional Outputs – related to Connectivity, Capacity and Freight
– have been informed by the economic analysis undertaken for this study and
reported in the previous two chapters along with the wider evidence base
described in Chapter 2. The next six Conditional Outputs have been primarily
informed by the wider evidence base. The last Conditional Output simply captures
the need for rail to contribute appropriately to the national policy imperative of
reducing greenhouse gas emissions.
6.5 Taken together, meeting the Conditional Outputs will contribute to the sustainable
economic growth of the Leeds and Sheffield City Regions. The Outputs
complement the two city regions’ transport strategies, established by their
respective local transport plans which were adopted in April 2011.
1) Connectivity
6.6 Evidence suggests that for the economies of the North of England to function
effectively there is a need to provide quicker connectivity between the key areas
of economic activity. In the context of this study the regional centres are
Bradford, Leeds, Sheffield and York, along with Manchester. Analysis undertaken
as part of this study suggests that improved connectivity between these five
centres alone could generate economic benefits of up to £1.1bn Present Value (PV)
in the Trend scenario and £1.2bn PV in the Trend Plus scenario.
6.7 The available evidence also identifies that there are worthwhile economic benefits
to be gained by enhancing rail connectivity between the sub-regional centres
(Halifax, Harrogate, Huddersfield and Wakefield in the Leeds City Region and
Barnsley, Rotherham, Doncaster and Chesterfield in the Sheffield City Region) and
Bradford, Leeds, Sheffield, York and Manchester. The analysis suggests improving
these connections could generate benefits of up to £1.4bn PV in the Trend

Conditional Output Statement
64
Scenario (of which £0.2bn PV are from flows to and from Manchester) and £1.6bn
PV in the Trend Plus scenario (of which £0.2bn PV are to and from Manchester.)
6.8 As well as links between the regional centres and other regional and sub-regional
centres (e.g. Leeds to Huddersfield), each city region also has a number of routes
which offer within city region connectivity, serving predominantly journey to work
trips but also providing opportunities to interchange to longer distance services.
The analysis shows that enhancements to such routes could also generate
worthwhile economic benefit.
6.9 In particular the benefit of improved connectivity from all corridors (excluding the
regional and sub-regional stations) to Leeds could generate benefits of £1.2bn PV
in the Trend scenario and £1.4bn PV in the Trend Plus scenario. The benefit of
connecting the corridors to Leeds is broadly equal to the benefit of connecting
each corridor to all the other regional centres in Yorkshire (Bradford, York and
Sheffield).
6.10 Enhancements targeted at journeys between sub-regional centres will deliver
benefits but typically at a lower unit rate than enhancements focussed on journeys
between the regional centres and commuting journeys to these centres.
6.11 The available evidence also highlights that any strategy focussed on enhancing
connectivity for just one of these four groups of movement – between regional
centres, from sub-regional centres to the regional centres, within city region
journeys and between sub-regional centres – would contribute to an unbalanced
growth trajectory across Yorkshire. What is needed is a targeted strategy that
supports enhanced connectivity for each of these groups of movements.
6.12 Reflecting the evidence that a balanced package of enhancements would best
support balanced economic growth in the Leeds and Sheffield City Regions, this
Conditional Output has been separated to reflect different types of journeys:
between regional centre stations, between regional and sub-regional centres, from
other stations to regional and sub-regional centres and between sub-regional
centres.
Regional Centre Connectivity
6.13 The regional centres of Bradford, Leeds, Sheffield and York are the key economic
centres within Yorkshire. The available evidence shows that enhancing the
connectivity between these cities will accelerate economic growth in the North.
Links from these cities across the Pennines to Manchester are also highly
economically significant, and some benefits identified by this study will be realised
by interventions that are part of the Northern Hub Phase 1 and Phase 2 package of
works.
6.14 The attractiveness of rail will be maximised by offering an even interval service
with journey times recognisably faster than off-peak journeys by car. Journey time
targets are generally equivalent to around 75% of the off-peak drive time between
the regional centres. The frequency target represents an improvement to current
frequency. Target journey times and frequencies between principal centres are:

Conditional Output Statement
65
I Leeds – Manchester: 40 minutes, six trains per hour;5
I Sheffield – Manchester: 40 minutes, four trains per hour;6
I Leeds – Sheffield: 35 minutes, two trains per hour (and two semi-fast trains
which provide a viable alternative to the fast trains);7
I Bradford – Manchester: 50 minutes, two trains per hour;8
I Bradford – Leeds: 15 minutes, six trains per hour, from a single station;9 and
I Leeds – York: 20 minutes, six trains per hour.10
Sub-Regional Centre Connectivity
6.15 There are important connections from Leeds and Sheffield to other regional and
sub-regional centres within and outside Yorkshire. These include Halifax,
Harrogate, Huddersfield and Wakefield in the Leeds City Region and Barnsley,
Rotherham, Doncaster and Chesterfield in the Sheffield City Region, as well as
cities outside the two City Regions such as Hull and Nottingham.
6.16 An even interval service should be provided between these sub-regional centres
and Leeds and Sheffield that offers an in-train journey time of at most 75% of off-
peak car travel times. Frequency should be at least two trains per hour all-day
operating on a clockface timetable with additional services in the peak as the
capacity output requires.
Within City Region Connectivity
6.17 The rail network in Yorkshire also forms a vital role in providing local rail journeys
for commuting, business and leisure purposes to the key regional centres as well as
connectivity to longer distance services.
6.18 Local services11 within Leeds and Sheffield City Regions serving Leeds and Sheffield
should have a minimum all-day service frequency of two trains per hour operating
on a clockface timetable with additional services in the peak as the capacity
output requires. Improving journey times between Bradford, Leeds, Sheffield and
Manchester as well as between these regional centres and the sub-regional centres
will also offer the opportunity to improve journey times within the two city
regions. Meeting other outputs (such as those related to capacity and rolling stock)
will also provide further opportunity to deliver benefits by reducing travel times
within the journey to work catchment.
5 Currently four trains per hour with a quickest journey time of 53 minutes, 55 minute drive time
6 Currently two trains per hour with a quickest journey time of 51 minutes, 70 minute drive time (the target rail
journey time is less than 75% of the drive time reflecting the poor highway links between Sheffield and Manchester)
7 Currently one fast train per hour with a quickest journey time of 40 minutes, 45 minute drive time
8 Currently one fast train per hour with a journey time of 60 minutes, 55 minute drive time (the target rail journey
time is greater than 75% of the drive time reflecting the railway geography between Bradford and Manchester)
9 Currently four per hour from Interchange with a quickest journey time of 18 minutes, 25 minute drive time
10 Currently four fast trains per hour with a quickest journey time of 24 minutes, 35 minute time
11 Typically stopping at all stations on the route in which they operate, for example Ilkley to Leeds.

Conditional Output Statement
66
Connectivity between Sub-Regional Centres
6.19 The available evidence is that enhancing connectivity between sub-regional
centres will deliver economic benefits but not at a great a rate as enhancements
to services between and to/from the principal centres. While every opportunity
should be taken that delivers value for money enhancements to services that link
sub-regional centres, such enhancements should not be prioritised over
enhancements to services between and to/from the regional centres.
2) Capacity
6.20 Passenger demand growth is the central factor determining the need for additional
capacity. Forecast growth in demand to 2019 is between 9% in the Trend scenario
and 21% in the Trend Plus scenario. By 2027 demand is forecast to be 21% higher
than now in the Trend scenario and 37% higher in Trend Plus. These figures do not
include any additional demand that would be generated by other service
enhancements in that period, for example those identified to meet other of this
study’s Conditional Outputs.
6.21 Already peak period trains into Sheffield and Leeds, trains across the Pennines into
Manchester and trains at other locations experience crowding. For the economic
potential of rail to be fully realised, sufficient capacity, delivered by longer or
more frequent trains, needs to be provided to accommodate forecast Trend
demand growth to 2027 and demand induced by other future service
enhancements.
6.22 Further, infrastructure solutions that are identified to deliver other Conditional
Outputs should be ‘future-proofed’ to allow Trend Plus demand growth to be
accommodated through train lengthening and without the need for further major
infrastructure investment.
3) Freight
6.23 Given the long life of the principal coal-fired power stations in the Aire Valley,
providing ESI (Electricity Supply Industry) freight capacity to maintain the
generating capacity of power stations in Yorkshire is an important priority.
6.24 In addition provision should be made to accommodate future freight growth as
identified by the Strategic Freight Network analysis, the Freight Route Utilisation
Strategy and other relevant Route Utilisation Strategies. Specifically measures will
be needed to enable the forecast growth to 2030 in intermodal traffic. This will
include additional paths between the South Coast ports and existing and proposed
intermodal rail freight interchanges in Yorkshire (and the North East and Scotland),
as well as enhanced loading gauges and available paths to open up new routes
between the East Coast ports and the East and West Midlands, and the East Coast
ports and the North West via trans-Pennine routes.
4) Performance
6.25 Poor performance, in terms of reliability, punctuality and delivering planned train
capacity, can have a direct impact on passengers’ perception of rail. Over time
passengers may choose to travel by alternative modes, or to not travel at all,
which in turn can have negative economic affects.

Conditional Output Statement
67
6.26 Opportunities must be identified to reduce the variation in performance by
improving performance of the relatively poor performing corridors. Overall
performance in the study area, in terms of punctuality and reliability, should not
be worsened by enhancements to deliver the Conditional Outputs in each corridor.
6.27 Although formal targets for improved performance have yet to be determined for
Control Period 5, any enhancements identified should contribute towards meeting
such targets, once they are set.
5) Journey Quality
6.28 Additional rolling stock will be required to deliver additional passenger capacity
and connectivity targets set out in this statement. Further, some rolling stock
operating in Yorkshire is becoming life expired and will need replacing. Any
replacement rolling stock should offer an improved passenger experience.
6) Access to the Network
6.29 To attract people to the rail network it is important that stations, as the gateway
to the network, are easily accessible and offer a consistent high quality facility.
Local authorities should work in conjunction with the rail industry and other
stakeholders to ensure that necessary improvements are made to car parking
capacity, including consideration of strategic Park & Ride sites, to accommodate
forecast background demand growth and additional demand induced by future
service enhancements and that these are complemented by improvements to
pedestrian and cycle access to the stations. In particular, improving the quality of
walking routes including lighting, signage, sightlines and on occasion, the provision
of CCTV can encourage use, particularly during darkness. Station quality should be
improved by ensuring that there is consistent information provision, staffing
arrangements, retail, cycling and toilet facilities and step free access (important
for the disabled and those travelling with young children, buggies, luggage etc) for
stations in the same category.
7) Growth Centres
6.30 The key role of Bradford and Leeds as engines of economic growth is identified in
the Leeds City Region Transport Strategy and transport enhancements to these
cities are given the highest priority.
6.31 The economic role of the sub-regional cities and towns12 is also identified (Halifax,
Harrogate, Huddersfield, Wakefield and York) with the intention to capitalise on
their particular strengths and potential. The strategy also identifies the need to
support the delivery of priority areas for regeneration and housing growth
(Coalfield Regeneration Area in Wakefield District, Airedale – Bradford to Skipton,
East Leeds, South Dewsbury/North Kirklees, York North West, East Bradford – West
Leeds area).
6.32 The Sheffield City Region Transport Strategy identifies the importance of Sheffield
City Centre in supporting economic growth. It also highlights the Dearne Valley,
East Doncaster and the Lower Don Valley as priority areas for economic growth.
12 The definition of regional and sub-regional centres differs slightly between the Leeds City Region Transport
Strategy and this study. The definition for this study can be found in Chapter 1.

Conditional Output Statement
68
Ambitious housing targets have been set by the Local Development Frameworks.
Transport connectivity to housing and employment areas will be one of the factors
that contribute to their success. However, some of these locations are remote
from the rail network.
6.33 The Government has announced the creation of 21 Local Enterprise Zones (LEZs).
The zones in Yorkshire are the Aire Valley in East Leeds, the Modern Manufacturing
and Technology Growth Area in Sheffield City Region and Humber Estuary
Renewable Energy Super Cluster.
6.34 Many growth centres are already directly served by rail, but where they are not,
opportunities for appropriate fast and frequent connectivity from rail hubs to
growth areas in the Leeds and Sheffield City regions and to the LEZs should be
pursued.
8) North-South Links
6.35 From the East Coast Main Line and East Midlands RUS process and as witnessed by
the case for High Speed 2, there is a strong and established evidence base on the
benefits to Yorkshire from reducing journey times to/from London. That this study
has not proposed journey time outputs for north - south services should not be
taken as an indication that such improvements are not important. Rather it
reflects the national nature of such services and that enhancements will be
developed as part of national initiatives.
6.36 Improvements to the rail network in Yorkshire should not preclude future
enhancements in services to London, Birmingham and beyond using the existing
network or future high speed network. It is equally important that additional
services to these destinations should not preclude improvements to other inter-
regional and local rail services in Yorkshire. Improvements should seek to
distribute the economic benefits and journey opportunities that these services
generate around the Yorkshire area and make best use of capacity on longer
distance routes that will become available following the introduction of high speed
rail services.
9) Links to Airports
6.37 The region’s airports provide important international passenger gateways allowing
travel between the region and many European destinations for business and leisure
purposes. As such the airports help attract both businesses and potential
employees to locate to the area. Ensuring reliable and timely connectivity to the
airports is vital to ensuring the success of the airports, and in turn the economies
that they support.
6.38 Metro and SYPTE should continue to work with their local authority and LEP
stakeholders and transport providers to ensure fast, frequent and reliable
connectivity between rail hubs and airports, including:
I Leeds and Bradford stations to Leeds Bradford Airport; and
I Sheffield and Doncaster stations to Robin Hood Airport Doncaster Sheffield.

Conditional Output Statement
69
6.39 Enhancements identified to meet these Conditional Outputs should take into
consideration the longer term aspiration for a rail link to Leeds Bradford Airport
and the planning commitment for a station serving Robin Hood Airport Doncaster
Sheffield.
6.40 Although outside the region, Manchester Airport serves as the primary gateway
airport in the North of England. Ensuring ease of access to Manchester Airport is
important if the attractiveness of Yorkshire to business is to be maximised. The
Northern Hub considered the benefits of improved links from Yorkshire to
Manchester Airport and the Conditional Outputs set for that study remain valid.
6.41 This required that each primary corridor has direct rail connectivity to Manchester
Airport operating at least an hourly frequency (two per hour on the North Trans -
Pennine route) over an operational day defined by the period which accounts for
90% of Manchester Airport’s passenger throughput, which for the Yorkshire means:
I from Huddersfield, Leeds, York and the North East via the North Trans -Pennine
route;
I from Doncaster and Sheffield via the South Trans-Pennine route; and
I from Bradford via the Calder Valley line and utilising infrastructure that will be
provided by the Northern Hub package.
10) Carbon Reduction
6.42 The net effect of ‘in-service’ proposals developed to deliver the Conditional
Outputs should support the achievement of the overall reduced carbon trajectory
for transport sector adopted by Government.
Strategic Gap Analysis
6.43 The following table provides a summary of the Conditional Outputs together with a
strategic summary of the infrastructure constraints that might be preventing the
delivery of the outputs. An early stage of any further study must be to understand
the nature of the constraints that are preventing delivery of the Conditional
Outputs and how these might be addressed.

Conditional Output Statement
70
TABLE 6.1 CONDITIONAL OUTPUT SUMMARY
Conditional Output Current Constraint
1.Connectivity Rail journey times that are
quicker than off peak car
journeys
A minimum frequency of two
trains per hour (up to six trains
per hour in some corridors) all
day operating on a clockface
timetable with additional peak
services as required to meet
demand.
Capability of the network
and provision of sufficient
and appropriate rolling
stock to operate faster
services
Network capacity and
availability of rolling stock
to deliver increased
frequency
2. Capacity Sufficient capacity, by
providing longer or more
frequent trains, to
accommodate forecast demand
growth to 2027
Seating capacity currently
exceeded on peak and
inter-regional off peak
services.
Limited availability of
rolling stock and
infrastructure capability
prevents longer or more
frequent services
3. Freight Sufficient network capacity and
capability to maintain the
region’s electricity generating
capacity and deliver forecast
growth in rail freight,
particularly inter-modal
container traffic
Availability of trans-
Pennine and North–South
freight paths
Network currently restricts
operation of longer freight
trains and the routes that
are available for trains
transporting the latest
generation of inter-modal
containers on standard
wagons
4. Performance Reduce the variation in
performance by improving
performance of the relatively
poor performing corridors.
Any enhancements to meet
these Conditional Outputs
should not worsen performance
Variability in performance
of services in different
corridors
5. Journey
Quality
New and/or refurbished rolling
stock to offer an improved
passenger experience
Variability in the quality of
rolling stock across
different corridors

Conditional Output Statement
71
Conditional Output Current Constraint
6. Access to
the Network
Sufficient car parking capacity
and high quality access by
sustainable modes to
accommodate future demand
and consistent station quality
Insufficient car park
capacity to cater for all
day demand
Poor quality walk / cycle
routes to stations and lack
of capacity in high quality
public transport
Variability in station
facilities
7. Growth
Centres
Connectivity to rail connected
growth centres should benefit
from delivering the
Connectivity Output
Appropriate fast and frequent
connectivity from rail hubs to
growth centres that are not
connected to the rail network
While many growth centres
are well connected to the
rail network, a number of
growth centres are not, so
there is a need is to
consider access services to
these.
8. North-South
Links
Service improvements should
not preclude HS2
implementation or vice versa.
In the interim the development
of services on the Midland and
East Coast Main Lines are
supported
Local rail services should
maximise the distribution of
HS2 benefits around the region
To be considered following
HS2 Phase 2 consultation in
2014
9. Links to
Airports
Ensure fast, frequent and
reliable connectivity between
rail hubs and airports
Direct hourly connectivity to
Manchester Airport (during the
period of 90% of passenger
throughput) via South Trans
Pennine and Calder Valley
corridors and half hourly via
North Trans Pennine corridor
No current rail links to
Leeds Bradford Airport and
Robin Hood Airport
Doncaster Sheffield.
Improved connectivity
from the Calder Valley and
South Yorkshire to
Manchester Airport is not
yet committed
10. Carbon
Reduction
Support the achievement of the
overall reduced carbon
trajectory for transport sector
as adopted by Government
Not all rolling stock meets
contemporary emissions
standards

Conditional Output Statement
72

Conditional Output Statement
Appendix A
APPENDIX
A
EVIDENCE REVIEW REFERENCES


Conditional Output Statement
Appendix A
A1 STRATEGIC EVIDENCE REFERENCES
Association of Greater Manchester Authorities (AGMA) (2007) Greater Manchester
TIF Bid AGMA, Manchester
Centre for Cities (2008) City Links: Integration and Isolation Centre for Cities,
London
CEBR (2005) Macroeconomic Assessment of Manchester Hub Rail Schemes North
West Rail Campaign, Manchester
Centre for Cities (2011) Cities Outlook 2011 Centre for Cities, London
Centre for Urban Policy Studies (CUPS) et al (2008) Connecting the North:
Interdependence and Barriers: Rail, Road, Air and Maritime Links Northern Way,
Newcastle
Delta Rail (2011) Station Usage 2009/10 Office of Rail Regulation, London
Department for Transport (2005) Transport, Wider Economic Benefits and Impacts
on GDP Department for Transport, London
Department for Transport (2008) Improving the Air Passenger Experience: an
Analysis of End-to-End Journeys with a Focus on Manchester Airport Department
for Transport, London
Department for Transport (2011a) Creating Growth, Cutting Carbon Making
Sustainable Local Transport Happen Cm 7996, Department for Transport, London
Department for Transport (2011b) Business Plan 2011-2015 Department for
Transport, London
Eddington R (2006) The Eddington Transport Study HMT, London
Ekosgen (2008) Joint Economic Study: Manchester and Sheffield Final Report
Manchester City Council, Manchester
Greengauge21 (2010) Consequences for Employment and Economic Growth
Greengauge21, London
HM Government (2010) The Coalition: our Programme for Government Cabinet
Office, London
Her Majesty’s Treasury (2010) Spending Review 2010 Cm 7942 HMT, London
Her Majesty’s Treasury & Infrastructure UK (2011) National Infrastructure Plan
2011 The Stationary Office, London
House of Commons Transport Committee (2011) Transport and the Economy Third
Report of Session 2010–11 Volume I Hc 473 The Stationery Office, London
Institute for Political and Economic Governance (IPEG), University of Manchester et
al, (2008) The Northern Connection: Assessing the Comparative Economic
Performance and Prospects of Northern England Northern Way, Newcastle
Institute for Transport Studies (2009) Strengthening the Assessment of Transport’s
Wider Impacts on the Economy Northern Way, Newcastle

Conditional Output Statement
Appendix A
Institute for Transport Studies (2010) Review of Methodologies to Assess
Transport’s Impacts on the Size of the Economy Northern Way, Newcastle
Leeds City Region Partners (2009) Leeds City Region Transport Strategy Main
Report – Delivering Low Carbon Connectivity to Promote Faster Economic Growth
Leeds City Region, Leeds
Leeds City Region Partners (2010) Leeds City Region DaSTS Connectivity Study
Phase 1 Executive Summary Report Leeds City Region, Leeds
LEK (2003) Future Rail Services to Manchester Airport Manchester Airport Group,
Manchester
Lythgoe, W F and Wardman, M (2002) Demand for Rail Travel to and from Airports
Transportation 29 125-143
Manchester Airport (2007) Manchester Airport Master Plan to 2030, Manchester
Airport, Manchester
Manchester Independent Economic Review (2009) Reviewers’ Report MIER,
Manchester
MDS Transmodal (2006) Evidence Based Review of the Growth Prospects of the
Northern Ports, The Northern Way, Newcastle
Metro (2008) Leeds New Generation Transport Strategic Fit: Problems, Technical
Note Metro, Leeds
Mott MacDonald (2011) PDFC Additional Rolling Stock Study ATOC, London
Network Rail (2007) North West Route Utilisation Strategy Network Rail, London
Network Rail (2009) Yorkshire & Humber Route Utilisation Strategy Network Rail,
London
Northern Way (2004) Northern Way Growth Strategy, Northern Way, Newcastle
Northern Way (2006) Strategic Direction for Transport Northern Way, Newcastle
Northern Way (2007) Short, Medium and Long Term Transport Priorities Northern
Way, Newcastle
Northern Way (2008) Airports and Ports and the Northern Economy Northern Way,
Newcastle
Northern Way (2010) Meeting the Economic Challenge: Delivering the Northern
Way’s Transport Priorities Northern Way, Newcastle
Office of the Deputy Prime Minister (2000) Our Towns and Cities: The Future -
Delivering an Urban Renaissance ODPM, London
ORC International (2005) Trans Pennine Express Manchester Airport Research,
Trans Pennine Express, York
Parkinson et al (2006a) State of the English Cities Volume 1 ODPM, London
Parkinson et al (2006b) State of the English Cities Volume 2 ODPM, London
SACTRA (1999) Transport and the Economy, HMSO, London

Conditional Output Statement
Appendix A
Sheffield City Region Executive Team (2010) Sheffield City Region Strategic
Economic Assessment Sheffield City Region, Sheffield
Sheffield City Region (2011) Sheffield City Region Transport Strategy 2011-2026
Sheffield City Region, Sheffield
Spatial Economics Research Centre (2009) Strengthening Economic Linkages
between Leeds and Manchester: Feasibility and Implications Northern Way,
Newcastle
Steer Davies Gleave (2006) Model Development and Results for Northern Way using
the South & West Yorkshire Dynamic Model Northern Way, Newcastle
Steer Davies Gleave (2007a) Agglomeration in Leeds City Region Centre for
Cities/IPPR, London
Steer Davies Gleave (2007b) Market Demand for Rail Gauge Enhancements
Northern Way, Newcastle
Steer Davies Gleave (2007c) Manchester Hub: Objectives, Options and Next Steps
Northern Way, Newcastle
Steer Davies Gleave (2008a) The East of England Transport Economic Evidence
Study EEDA, Histon
Steer Davies Gleave (2008b) A Report to the Northern Way: Existing and Future
Traffic and Congestion on the North’s Strategic Road Network Northern Way,
Newcastle
Sykes W and Desai P (2009) Understanding Airport Passenger Experience
Department for Transport, London
The Work Foundation, Centre for Cities, Centre for Sustainable Urban and Regional
Futures (2009) City Relationships: Economic Linkages in Northern City Regions
Northern Way, Newcastle
York Aviation (2006) The Economic and Social Impact of The Manchester Airport
Group Airports Manchester Airports Group, Manchester Appendix list number


Conditional Output Statement
Appendix B
APPENDIX
B
DISAGGREGATED ECONOMIC BENEFITS


Conditional Output Statement
Appendix B
B1 INTRODUCTION
This Appendix contains additional information that has been output from the analytical work
and used to inform the Conditional Output Statement. This includes a detailed breakdown of
the economic benefits generated by the test timetable and graphs setting out the rates of
benefit for the Trend scenario. The following paragraphs provide an explanation of the data
included in this Appendix.
Test Timetable Economic Benefits
The tables in Sections B2 to B7 set out the forecast incremental economic benefit generated
by the Test Timetable compared to the Do Minimum. All values are 2002 Present Values.
The benefits are broken down by corridor. The revenue, journey time, non-user and wider
economic benefits allocated to each corridor are those generated by flows originating from
stations within that corridor. The crowding benefits are allocated to each corridor based on
the flows through that corridor. Three tables have been presented for each growth scenario,
summarised as follows.
Economic Benefits By Type (Trend, Section B2 / Trend Plus, Section B5)
These tables detail the economic benefit generated by flows from (through in the case of
crowding) each corridor broken down by the type of benefit. The data in this table is
presented in Figures 4.13 and 4.14 in the body of the report.
Economic Benefits By Destination – Regional Centre Stations Only
(Trend, Section B3 / Trend Plus, Section B6)
These tables present the benefits generated by flows originating in each corridor where the
destination is one of the regional centre stations. The benefits are disaggregated by each of
the regional centre stations. The table excludes crowding benefits, which are not output
from the modelling work on an origin - destination basis. The total benefits from each
corridor to all the regional centre stations is also summarised in the All Destinations tables.
Economic Benefits By Destination – All Destinations
(Trend, Section B4 / Trend Plus, Section B7)
These tables present the benefits generated by flows originating in each corridor
disaggregated by destination. Destinations have been split into five categories: regional and
sub-regional centre stations, stations in Leeds or Sheffield City Regions and stations outside
the region. The table excludes crowding benefits, which have not been output from the
modelling work on an origin - destination basis. The data in this table is presented in
Figures 4.15 and 4.16 in the body of the report.
Disaggregated Rates of Benefit
Chapter 5 sets out the disaggregated rates of benefit for the Trend Plus scenario, with
Figures 5.1 to 5.5 presenting the rates of benefit for crowding and connectivity benefits as
well as the distribution of benefits by flow category. The Trend scenario presents a lower
bound of forecast demand and therefore a lower bound of potential economic benefit,
although the comparable benefit to be found between each corridor does not materially
change. For completeness the graphs in Section B8 of this Appendix set out the
corresponding figures for the Trend scenario. The rates of benefit by origin corridor, benefit
type and destination, which inform the graphs presented in Chapter 5 are shown in Sections
B9 to B14.

Conditional Output Statement
Appendix B
B2 TREND ECONOMIC BENEFITS BY TYPE – PV 2002 VALUES £M
Benefit Type
Origin Station / Corridor
Revenue Incre
ment
Journ
ey T
ime
Cro
wdin
g
Non U
ser
Benefi
ts
Wid
er
Econom
ic B
enefi
ts
Tota
l Benefi
ts
Regional
Centre
Station
Leeds £141.5 £550.3 £0.0 £154.9 £119.3 £966.1
Manchester £98.5 £231.6 £0.0 £72.3 £47.7 £450.1
Sheffield £67.3 £237.8 £0.0 £59.4 £67.7 £432.1
York £59.8 £131.2 £0.0 £49.8 £35.5 £276.2
Bradford £69.1 £286.3 £0.0 £116.3 £76.0 £547.7
London £8.7 £15.1 £0.0 £5.7 £11.4 £40.9
Sub
Regional
Centre
Station
Harrogate £25.8 £74.0 £0.0 £18.8 £18.8 £137.4
Halifax £23.4 £108.3 £0.0 £36.6 £30.6 £198.9
Huddersfield (Station) £84.5 £265.5 £0.0 £135.1 £56.8 £541.8
Wakefield £30.5 £126.1 £0.0 £55.3 £23.8 £235.8
Barnsley (Station) £17.3 £65.3 £0.0 £20.2 £12.7 £115.6
Doncaster £28.1 £97.2 £0.0 £33.2 £19.3 £177.9
Rotherham £20.5 £50.9 £0.0 £13.6 £12.3 £97.3
Chesterfield £9.6 £31.0 £0.0 £7.9 £12.2 £60.6
Leeds CR
Corridors
5 Towns £19.6 £136.1 £38.3 £22.7 £30.5 £247.2
Bradford FS £3.3 £23.0 £3.3 £3.1 £4.6 £37.3
Bradford Interchange £18.0 £69.0 £163.2 £17.0 £24.3 £291.5
Calderdale £27.2 £137.6 £105.6 £37.0 £36.9 £344.3
Harrogate - York £10.0 £37.3 £11.5 £7.7 £9.2 £75.6
Huddersfield £28.1 £111.7 £254.7 £27.4 £19.8 £441.6
Hull £49.3 £140.8 £11.8 £41.0 £26.7 £269.5
Ilkley £25.5 £153.9 £49.6 £33.2 £35.2 £297.4
Leeds - Harrogate £19.5 £100.9 £61.1 £17.4 £23.7 £222.6
Leeds - York £23.3 £96.6 £126.7 £23.6 £23.2 £293.3

Conditional Output Statement
Appendix B
Benefit Type
Origin Station / Corridor
Revenue Incre
ment
Journ
ey T
ime
Cro
wdin
g
Non U
ser
Benefi
ts
Wid
er
Econom
ic B
enefi
ts
Tota
l Benefi
ts
North Transpennine £30.5 £96.9 £27.2 £19.8 £28.9 £203.4
Skipton £43.4 £230.4 £85.9 £51.7 £51.7 £463.1
Pontefract (Station) £11.4 £34.1 £0.0 £9.3 £7.7 £62.5
Inter CR
Corridors
Barnsley £33.3 £87.5 £67.3 £22.9 £16.6 £227.7
Leeds - Doncaster £12.4 £86.1 £60.8 £14.5 £18.1 £191.8
Penistone £5.4 £36.7 £1.2 £7.3 £14.7 £65.2
Pontefract Baghill £1.7 £10.4 -£0.1 £1.2 £2.9 £16.1
Bolton - Moorthorpe £4.4 £29.1 £69.9 £5.6 £8.0 £117.0
York - Doncaster £0.0 £0.0 £2.0 £0.0 £0.0 £2.0
Sheffield
CR
Corridors
Lincoln £44.0 £122.0 £17.3 £39.9 £42.5 £265.6
Midland Main Line £38.2 £107.8 £193.5 £30.2 £43.4 £413.0
Sheffield - Doncaster £18.3 £53.4 £151.8 £14.9 £12.9 £251.3
South Transpennine £32.5 £83.4 £156.7 £19.6 £32.6 £324.7
Thorne (Station) £0.5 £3.1 £0.0 £0.6 £0.8 £5.0
Other
Corridors
Blackpool £34.2 £137.1 £1.8 £28.6 £32.4 £234.2
Doncaster - Cleethorpes £5.3 £23.1 £1.5 £5.0 £5.6 £40.5
ECML North £14.6 £32.7 £49.8 £9.4 £7.4 £114.0
ECML South £7.0 £22.9 £2.8 £5.1 £5.3 £43.1
Goole £9.3 £24.5 £36.2 £8.0 £4.2 £82.1
Rochdale £17.6 £65.3 £1.3 £13.1 £16.2 £113.5
Scarborough £3.8 £19.4 £2.6 £3.7 £3.3 £32.8
Yorkshire Dales £3.4 £18.9 £0.0 £3.4 £8.0 £33.7
Outside Study Area £58.8 £213.5 £0.0 £42.5 £86.6 £401.5
Total £1,338 £4,816 £1,755 £1,366 £1,228 £10,503
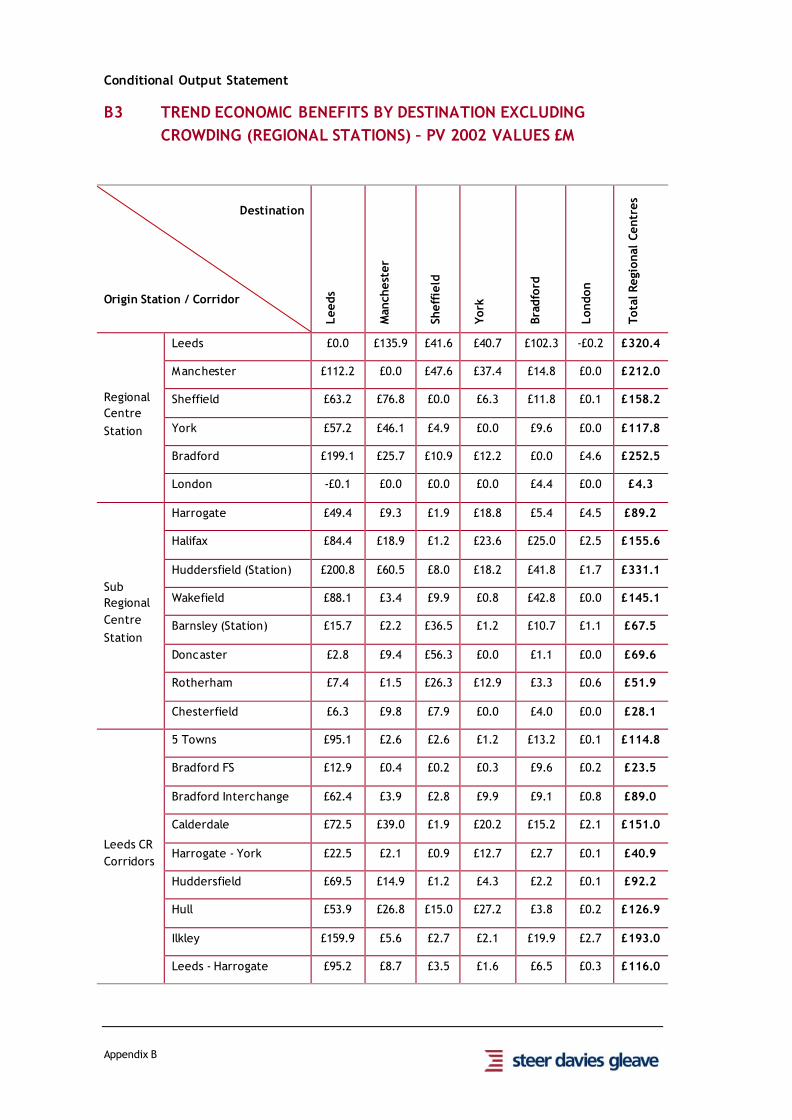
Conditional Output Statement
Appendix B
B3 TREND ECONOMIC BENEFITS BY DESTINATION EXCLUDING
CROWDING (REGIONAL STATIONS) – PV 2002 VALUES £M
Destination
Origin Station / Corridor
Leeds
Manchest
er
Sheff
ield
York
Bra
dfo
rd
London
Tota
l Regio
nal
Centr
es
Regional
Centre
Station
Leeds £0.0 £135.9 £41.6 £40.7 £102.3 -£0.2 £320.4
Manchester £112.2 £0.0 £47.6 £37.4 £14.8 £0.0 £212.0
Sheffield £63.2 £76.8 £0.0 £6.3 £11.8 £0.1 £158.2
York £57.2 £46.1 £4.9 £0.0 £9.6 £0.0 £117.8
Bradford £199.1 £25.7 £10.9 £12.2 £0.0 £4.6 £252.5
London -£0.1 £0.0 £0.0 £0.0 £4.4 £0.0 £4.3
Sub
Regional
Centre
Station
Harrogate £49.4 £9.3 £1.9 £18.8 £5.4 £4.5 £89.2
Halifax £84.4 £18.9 £1.2 £23.6 £25.0 £2.5 £155.6
Huddersfield (Station) £200.8 £60.5 £8.0 £18.2 £41.8 £1.7 £331.1
Wakefield £88.1 £3.4 £9.9 £0.8 £42.8 £0.0 £145.1
Barnsley (Station) £15.7 £2.2 £36.5 £1.2 £10.7 £1.1 £67.5
Doncaster £2.8 £9.4 £56.3 £0.0 £1.1 £0.0 £69.6
Rotherham £7.4 £1.5 £26.3 £12.9 £3.3 £0.6 £51.9
Chesterfield £6.3 £9.8 £7.9 £0.0 £4.0 £0.0 £28.1
Leeds CR
Corridors
5 Towns £95.1 £2.6 £2.6 £1.2 £13.2 £0.1 £114.8
Bradford FS £12.9 £0.4 £0.2 £0.3 £9.6 £0.2 £23.5
Bradford Interchange £62.4 £3.9 £2.8 £9.9 £9.1 £0.8 £89.0
Calderdale £72.5 £39.0 £1.9 £20.2 £15.2 £2.1 £151.0
Harrogate - York £22.5 £2.1 £0.9 £12.7 £2.7 £0.1 £40.9
Huddersfield £69.5 £14.9 £1.2 £4.3 £2.2 £0.1 £92.2
Hull £53.9 £26.8 £15.0 £27.2 £3.8 £0.2 £126.9
Ilkley £159.9 £5.6 £2.7 £2.1 £19.9 £2.7 £193.0
Leeds - Harrogate £95.2 £8.7 £3.5 £1.6 £6.5 £0.3 £116.0

Conditional Output Statement
Appendix B
Destination
Origin Station / Corridor
Leeds
Manchest
er
Sheff
ield
York
Bra
dfo
rd
London
Tota
l Regio
nal
Centr
es
Leeds - York £83.9 £10.7 £0.6 £23.2 £0.8 £1.7 £120.9
North Transpennine £6.6 £71.9 £0.6 £3.3 £1.0 £1.0 £84.5
Skipton £167.5 £8.1 £5.1 £6.5 £59.6 £6.4 £253.3
Pontefract (Station) £17.2 £1.9 £3.3 £25.0 £1.9 £0.6 £49.8
Inter CR
Corridors
Barnsley £14.7 £8.9 £28.3 £5.7 £8.4 £0.8 £66.8
Leeds - Doncaster £59.7 £1.2 £3.9 £2.6 £4.0 £0.1 £71.5
Penistone £6.1 £2.7 £12.5 £1.6 £0.7 £0.5 £24.1
Pontefract Baghill £0.0 £0.0 £0.5 £10.8 £0.0 £0.2 £11.5
Bolton - Moorthorpe £15.7 £0.3 £8.3 £0.7 £0.9 £0.0 £25.9
York - Doncaster £0.0 £0.0 £0.0 £0.0 £0.0 £0.0 £0.0
Sheffield
CR
Corridors
Lincoln £6.9 £6.0 £44.4 £3.9 £2.9 £0.9 £64.9
Midland Main Line £23.2 £45.4 £33.9 £2.3 £22.4 £1.1 £128.2
Sheffield - Doncaster £3.5 £1.0 £25.2 £1.5 £0.5 £0.3 £32.0
South Transpennine £19.9 £25.5 £32.0 £14.0 £1.9 £0.2 £93.5
Thorne (Station) £0.2 £0.1 £0.5 £0.0 £0.0 £0.0 £0.8
Other
Corridors
Blackpool £31.7 £1.7 £3.4 £19.6 £10.4 £10.2 £77.0
Doncaster - Cleethorpes £5.0 £4.0 £4.9 £0.2 £1.0 -£0.4 £14.7
ECML North -£3.6 £38.5 £0.2 -£19.6 £1.6 -£3.5 £13.5
ECML South £0.2 £6.4 £5.7 £0.1 £0.9 -£2.0 £11.4
Goole £1.0 £0.5 £1.8 £0.3 £0.2 £0.2 £4.0
Rochdale £6.6 £60.7 £0.4 £1.1 £4.1 £0.8 £73.7
Scarborough -£2.2 £3.2 £0.6 -£1.8 £0.4 £1.6 £1.7
Yorkshire Dales £12.8 £0.3 £1.5 £2.0 £1.7 £1.0 £19.3
Outside Study Area £63.6 £30.5 £38.4 £27.8 £13.5 £3.2 £177.0
Total Excluding Crowding £2,071 £833 £540 £383 £498 £47 £4,371

Conditional Output Statement
Appendix B
B4 TREND ECONOMIC BENEFITS BY DESTINATION EXCLUDING
CROWDING (ALL LOCATIONS) – PV 2002 VALUES £M
Destination
Origin Station / Corridor Regio
nal Centr
es
Sub R
egio
nal
Centr
e S
tati
on
Leeds
CR
Corr
idors
Sheff
ield
CR
Corr
idors
Oth
er
Corr
idors
All
Flo
ws
Regional
Centre
Station
Leeds £320.4 £154.3 £332.8 £12.9 £145.7 £966.1
Manchester £212.0 £53.0 £29.1 £6.7 £149.2 £450.1
Sheffield £158.2 £83.9 £14.7 £61.9 £113.4 £432.1
York £117.8 £44.6 £38.9 £5.3 £69.7 £276.2
Bradford £252.5 £128.5 £91.4 £16.1 £59.2 £547.7
London £4.3 £8.8 £10.3 £1.3 £16.2 £40.9
Sub
Regional
Centre
Station
Harrogate £89.2 £6.6 £15.7 £0.6 £25.3 £137.4
Halifax £155.6 £8.5 £15.7 £0.7 £18.4 £198.9
Huddersfield (Station) £331.1 £46.1 £110.1 £4.9 £49.7 £541.8
Wakefield £145.1 £47.0 £29.1 £4.1 £10.5 £235.8
Barnsley (Station) £67.5 £12.1 £5.7 £22.2 £8.2 £115.6
Doncaster £69.6 £11.0 £4.3 £35.9 £57.1 £177.9
Rotherham £51.9 £14.9 £2.4 £20.4 £7.7 £97.3
Chesterfield £28.1 £4.6 £1.4 £8.3 £18.3 £60.6
Leeds CR
Corridors
5 Towns £114.8 £22.4 £41.0 £4.1 £26.7 £208.9
Bradford FS £23.5 £0.9 £9.2 £0.0 £0.4 £34.0
Bradford Interchange £89.0 £18.6 £9.7 £3.8 £7.2 £128.3
Calderdale £151.0 £20.7 £32.3 £1.1 £33.6 £238.7
Harrogate - York £40.9 £10.4 £7.3 £0.2 £5.3 £64.2
Huddersfield £92.2 £72.4 £13.1 £0.6 £8.6 £186.9
Hull £126.9 £20.0 £31.3 £7.5 £72.0 £257.7
Ilkley £193.0 £6.5 £40.3 £0.6 £7.4 £247.7
Leeds - Harrogate £116.0 £21.3 £16.1 £0.7 £7.3 £161.4
Leeds - York £120.9 £20.2 £16.8 £0.4 £8.4 £166.7

Conditional Output Statement
Appendix B
Destination
Origin Station / Corridor Regio
nal Centr
es
Sub R
egio
nal
Centr
e S
tati
on
Leeds
CR
Corr
idors
Sheff
ield
CR
Corr
idors
Oth
er
Corr
idors
All
Flo
ws
North Transpennine £84.5 £57.9 £12.3 £0.4 £21.1 £176.2
Skipton £253.3 £18.1 £91.0 £1.5 £13.4 £377.2
Pontefract (Station) £49.8 £4.7 £4.5 £0.4 £3.1 £62.5
Inter CR
Corridors
Barnsley £66.8 £38.4 £6.1 £33.5 £15.6 £160.4
Leeds - Doncaster £71.5 £40.4 £11.0 £4.8 £3.2 £131.0
Penistone £24.1 £22.3 £6.6 £8.6 £2.3 £64.0
Pontefract Baghill £11.5 £0.4 £0.9 £0.1 £3.3 £16.2
Bolton - Moorthorpe £25.9 £8.2 £3.6 £7.9 £1.5 £47.0
York - Doncaster £0.0 £0.0 £0.0 £0.0 £0.0 £0.0
Sheffield
CR
Corridors
Lincoln £64.9 £50.5 £1.6 £93.7 £37.6 £248.3
Midland Main Line £128.2 £23.3 £8.3 £10.1 £49.6 £219.5
Sheffield - Doncaster £32.0 £27.2 £1.0 £36.1 £3.3 £99.5
South Transpennine £93.5 £18.4 £7.5 £6.2 £42.4 £168.0
Thorne (Station) £0.8 £2.6 £0.1 £0.5 £1.0 £5.0
Other
Corridors
Blackpool £77.0 £13.1 £9.1 £1.3 £131.8 £232.3
Doncaster - Cleethorpes £14.7 £6.3 £1.0 £3.2 £13.8 £38.9
ECML North £13.5 £5.0 £4.4 £0.4 £40.8 £64.1
ECML South £11.4 £2.7 £1.1 £9.1 £16.0 £40.4
Goole £4.0 £16.0 £2.2 £5.3 £18.5 £45.9
Rochdale £73.7 £12.3 £10.2 £0.2 £15.8 £112.3
Scarborough £1.7 £1.7 £0.3 £0.2 £26.2 £30.2
Yorkshire Dales £19.3 £2.4 £2.2 £0.3 £9.5 £33.7
Outside Study Area £177.0 £39.2 £21.5 £8.3 £155.5 £401.5
Total Excluding Crowding £4,371 £1,249 £1,125 £452 £1,551 £8,747

Conditional Output Statement
Appendix B
B5 TREND PLUS ECONOMIC BENEFITS BY TYPE – PV 2002 VALUES £M
Benefit Type
Origin Station / Corridor
Revenue Incre
ment
Journ
ey T
ime
Cro
wdin
g
Non U
ser
Benefi
ts
Wid
er
Econom
ic B
enefi
ts
Tota
l Benefi
ts
Regional
Centre
Station
Leeds £145.9 £604.6 £0.0 £155.3 £128.4 £1,034.1
Manchester £85.8 £249.5 £0.0 £62.2 £48.6 £446.3
Sheffield £75.7 £264.4 £0.0 £66.2 £75.3 £481.5
York £74.8 £150.5 £0.0 £62.7 £42.0 £330.0
Bradford £80.7 £339.2 £0.0 £143.2 £91.0 £654.0
London £8.7 £15.2 £0.0 £5.8 £11.5 £41.1
Sub
Regional
Centre
Station
Harrogate £30.5 £85.4 £0.0 £22.4 £21.9 £160.2
Halifax £27.6 £124.8 £0.0 £43.7 £35.6 £231.7
Huddersfield (Station) £88.1 £312.2 £0.0 £128.4 £62.4 £591.1
Wakefield £36.1 £151.2 £0.0 £68.1 £28.7 £284.2
Barnsley (Station) £20.2 £76.9 £0.0 £24.3 £15.0 £136.4
Doncaster £29.8 £111.5 £0.0 £37.4 £22.0 £200.7
Rotherham £21.0 £57.0 £0.0 £15.3 £13.7 £106.9
Chesterfield £10.9 £35.3 £0.0 £9.0 £13.9 £69.1
Leeds CR
Corridors
5 Towns £23.2 £157.1 £70.6 £27.6 £35.5 £314.0
Bradford FS £3.7 £25.4 £5.8 £3.5 £5.1 £43.4
Bradford Interchange £21.1 £80.6 £193.4 £20.1 £28.4 £343.7
Calderdale £30.9 £154.6 £123.6 £42.9 £41.8 £393.8
Harrogate - York £11.6 £42.0 £12.8 £9.2 £10.5 £86.0
Huddersfield £35.6 £135.4 £290.2 £34.5 £24.2 £519.9
Hull £56.0 £158.8 £13.1 £46.8 £30.2 £304.8
Ilkley £26.5 £175.7 £79.2 £34.5 £39.5 £355.4
Leeds - Harrogate £23.4 £119.9 £74.2 £21.4 £28.3 £267.2
Leeds - York £26.9 £111.7 £163.9 £27.4 £26.8 £356.6
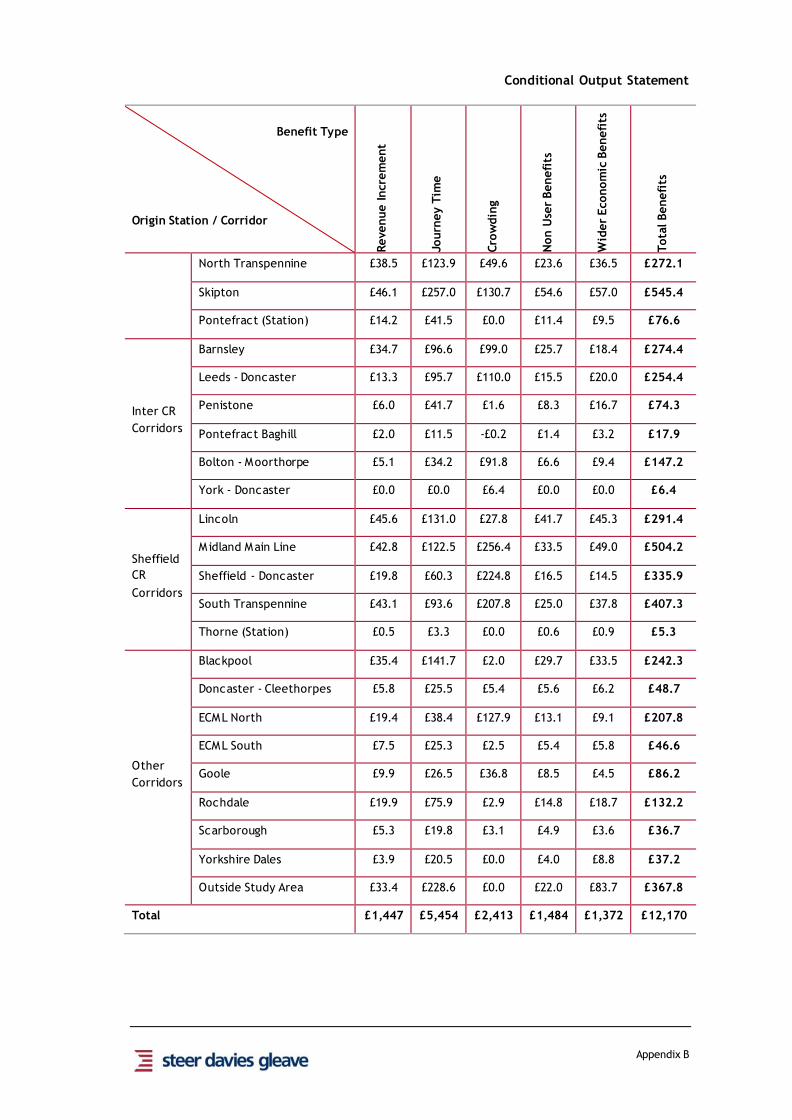
Conditional Output Statement
Appendix B
Benefit Type
Origin Station / Corridor
Revenue Incre
ment
Journ
ey T
ime
Cro
wdin
g
Non U
ser
Benefi
ts
Wid
er
Econom
ic B
enefi
ts
Tota
l Benefi
ts
North Transpennine £38.5 £123.9 £49.6 £23.6 £36.5 £272.1
Skipton £46.1 £257.0 £130.7 £54.6 £57.0 £545.4
Pontefract (Station) £14.2 £41.5 £0.0 £11.4 £9.5 £76.6
Inter CR
Corridors
Barnsley £34.7 £96.6 £99.0 £25.7 £18.4 £274.4
Leeds - Doncaster £13.3 £95.7 £110.0 £15.5 £20.0 £254.4
Penistone £6.0 £41.7 £1.6 £8.3 £16.7 £74.3
Pontefract Baghill £2.0 £11.5 -£0.2 £1.4 £3.2 £17.9
Bolton - Moorthorpe £5.1 £34.2 £91.8 £6.6 £9.4 £147.2
York - Doncaster £0.0 £0.0 £6.4 £0.0 £0.0 £6.4
Sheffield
CR
Corridors
Lincoln £45.6 £131.0 £27.8 £41.7 £45.3 £291.4
Midland Main Line £42.8 £122.5 £256.4 £33.5 £49.0 £504.2
Sheffield - Doncaster £19.8 £60.3 £224.8 £16.5 £14.5 £335.9
South Transpennine £43.1 £93.6 £207.8 £25.0 £37.8 £407.3
Thorne (Station) £0.5 £3.3 £0.0 £0.6 £0.9 £5.3
Other
Corridors
Blackpool £35.4 £141.7 £2.0 £29.7 £33.5 £242.3
Doncaster - Cleethorpes £5.8 £25.5 £5.4 £5.6 £6.2 £48.7
ECML North £19.4 £38.4 £127.9 £13.1 £9.1 £207.8
ECML South £7.5 £25.3 £2.5 £5.4 £5.8 £46.6
Goole £9.9 £26.5 £36.8 £8.5 £4.5 £86.2
Rochdale £19.9 £75.9 £2.9 £14.8 £18.7 £132.2
Scarborough £5.3 £19.8 £3.1 £4.9 £3.6 £36.7
Yorkshire Dales £3.9 £20.5 £0.0 £4.0 £8.8 £37.2
Outside Study Area £33.4 £228.6 £0.0 £22.0 £83.7 £367.8
Total £1,447 £5,454 £2,413 £1,484 £1,372 £12,170

Conditional Output Statement
Appendix B
B6 TREND PLUS ECONOMIC BENEFITS BY DESTINATION EXCLUDING
CROWDING (REGIONAL STATIONS) – PV 2002 VALUES £M
Destination
Origin Station / Corridor
Leeds
Manchest
er
Sheff
ield
York
Bra
dfo
rd
London
Tota
l Regio
nal
Centr
es
Regional
Centre
Station
Leeds £0.0 £163.1 £53.3 £43.9 £110.9 -£0.2 £371.0
Manchester £122.1 £0.0 £58.8 £38.9 £14.8 £0.0 £234.5
Sheffield £73.6 £95.0 £0.0 £6.3 £11.8 £0.1 £186.8
York £71.7 £60.0 £6.1 £0.0 £9.6 £0.0 £147.4
Bradford £246.7 £32.4 £13.7 £12.3 £0.0 £4.7 £309.9
London -£0.1 £0.0 £0.1 £0.0 £4.4 £0.0 £4.3
Sub
Regional
Centre
Station
Harrogate £59.6 £12.0 £2.5 £19.3 £7.1 £4.6 £105.1
Halifax £102.3 £23.4 £1.5 £31.5 £25.7 £2.5 £186.9
Huddersfield (Station) £176.3 £71.3 £9.7 £21.8 £55.8 £1.7 £336.6
Wakefield £103.5 £4.2 £12.3 £0.8 £56.6 £0.0 £177.5
Barnsley (Station) £18.3 £2.7 £47.3 £1.2 £12.8 £1.1 £83.5
Doncaster £2.9 £11.7 £73.4 £0.0 £1.1 £0.0 £89.1
Rotherham £8.6 £1.8 £33.8 £14.9 £3.7 £0.6 £63.4
Chesterfield £7.3 £12.2 £9.9 £0.0 £4.8 £0.0 £34.2
Leeds CR
Corridors
5 Towns £113.1 £3.1 £3.2 £1.3 £17.4 £0.1 £138.2
Bradford FS £15.6 £0.4 £0.2 £0.3 £9.9 £0.2 £26.6
Bradford Interchange £76.3 £4.9 £3.5 £10.2 £9.5 £0.8 £105.2
Calderdale £86.3 £48.3 £2.3 £26.5 £15.5 £2.1 £181.1
Harrogate - York £27.2 £2.7 £1.2 £13.1 £3.5 £0.1 £47.8
Huddersfield £85.5 £19.5 £1.5 £4.4 £2.4 £0.1 £113.3
Hull £63.5 £34.4 £18.8 £27.6 £3.9 £0.2 £148.4
Ilkley £184.5 £6.6 £3.4 £2.2 £20.6 £2.8 £220.0
Leeds - Harrogate £115.6 £11.3 £4.5 £1.8 £8.1 £0.3 £141.6

Conditional Output Statement
Appendix B
Destination
Origin Station / Corridor
Leeds
Manchest
er
Sheff
ield
York
Bra
dfo
rd
London
Tota
l Regio
nal
Centr
es
Leeds - York £101.6 £13.6 £0.8 £23.7 £0.8 £1.7 £142.3
North Transpennine £3.1 £90.0 £0.5 £5.5 £1.1 -£0.3 £99.9
Skipton £193.7 £10.3 £6.4 £6.5 £62.0 £6.4 £285.2
Pontefract (Station) £20.6 £2.3 £3.7 £33.2 £2.4 £0.6 £62.8
Inter CR
Corridors
Barnsley £17.2 £11.0 £36.2 £6.5 £10.0 £0.8 £81.7
Leeds - Doncaster £69.0 £1.6 £4.8 £2.5 £5.1 £0.1 £83.1
Penistone £6.5 £3.3 £15.8 £2.0 £0.9 £0.5 £29.0
Pontefract Baghill £0.0 £0.0 £0.6 £11.0 £0.0 £0.2 £11.8
Bolton - Moorthorpe £18.9 £0.3 £10.3 £0.7 £1.1 £0.0 £31.4
York - Doncaster £0.0 £0.0 £0.0 £0.0 £0.0 £0.0 £0.0
Sheffield
CR
Corridors
Lincoln £8.0 £7.4 £55.7 £4.1 £3.3 £0.9 £79.4
Midland Main Line £27.0 £56.3 £42.0 £2.3 £24.0 £1.1 £152.7
Sheffield - Doncaster £4.0 £1.3 £32.4 £1.5 £0.6 £0.3 £40.1
South Transpennine £27.4 £33.6 £39.6 £16.6 £1.9 £0.2 £119.3
Thorne (Station) £0.2 £0.1 £0.6 £0.0 £0.0 £0.0 £1.0
Other
Corridors
Blackpool £36.9 £2.1 £4.2 £19.6 £10.4 £10.2 £83.4
Doncaster - Cleethorpes £5.8 £5.0 £6.2 £0.2 £1.0 -£0.4 £17.8
ECML North -£4.2 £50.4 £0.3 -£19.8 £1.6 -£3.6 £24.7
ECML South £0.2 £7.9 £7.1 £0.1 £0.9 -£2.0 £14.3
Goole £1.1 £0.6 £2.3 £0.3 £0.2 £0.2 £4.7
Rochdale £7.5 £75.1 £0.5 £1.1 £4.1 £0.8 £89.2
Scarborough -£2.5 £4.2 £0.7 -£1.8 £0.4 £2.5 £3.4
Yorkshire Dales £15.3 £0.4 £1.8 £2.1 £1.7 £1.0 £22.4
Outside Study Area £64.0 -£12.7 £47.5 £28.6 £13.1 £3.2 £143.7
Total Excluding Crowding £2,382 £985 £681 £425 £557 £46 £5,076

Conditional Output Statement
Appendix B
B7 TREND PLUS ECONOMIC BENEFITS BY DESTINATION EXCLUDING
CROWDING (ALL LOCATIONS) – PV 2002 VALUES £M
Destination
Origin Station / Corridor Regio
nal Centr
es
Sub R
egio
nal
Centr
e S
tati
on
Leeds
CR
Corr
idors
Sheff
ield
CR
Corr
idors
Oth
er
Corr
idors
All
Flo
ws
Regional
Centre
Station
Leeds £371.0 £149.5 £350.1 £15.2 £148.4 £1,034.1
Manchester £234.5 £53.0 £29.5 £7.9 £121.4 £446.3
Sheffield £186.8 £92.6 £15.2 £69.3 £117.7 £481.5
York £147.4 £53.1 £42.8 £5.9 £80.7 £330.0
Bradford £309.9 £163.9 £101.3 £18.3 £60.6 £654.0
London £4.3 £8.9 £9.9 £1.5 £16.5 £41.1
Sub
Regional
Centre
Station
Harrogate £105.1 £8.4 £17.8 £0.7 £28.1 £160.2
Halifax £186.9 £8.9 £16.8 £0.8 £18.3 £231.7
Huddersfield (Station) £336.6 £57.8 £136.6 £5.7 £54.3 £591.1
Wakefield £177.5 £59.8 £31.6 £4.6 £10.7 £284.2
Barnsley (Station) £83.5 £12.3 £6.2 £26.2 £8.2 £136.4
Doncaster £89.1 £12.9 £4.3 £38.4 £56.0 £200.7
Rotherham £63.4 £16.1 £2.6 £16.6 £8.1 £106.9
Chesterfield £34.2 £4.7 £1.5 £10.1 £18.5 £69.1
Leeds CR
Corridors
5 Towns £138.2 £23.7 £45.7 £4.7 £31.1 £243.4
Bradford FS £26.6 £1.0 £9.6 £0.0 £0.4 £37.7
Bradford Interchange £105.2 £21.6 £11.6 £4.3 £7.5 £150.2
Calderdale £181.1 £21.3 £33.5 £1.2 £33.2 £270.2
Harrogate - York £47.8 £11.1 £8.3 £0.2 £5.9 £73.3
Huddersfield £113.3 £91.8 £14.1 £0.7 £9.8 £229.7
Hull £148.4 £22.7 £38.3 £8.4 £73.8 £291.7
Ilkley £220.0 £6.3 £41.6 £0.6 £7.6 £276.2
Leeds - Harrogate £141.6 £24.0 £18.4 £0.9 £8.0 £193.0
Leeds - York £142.3 £22.7 £17.9 £0.4 £9.4 £192.7
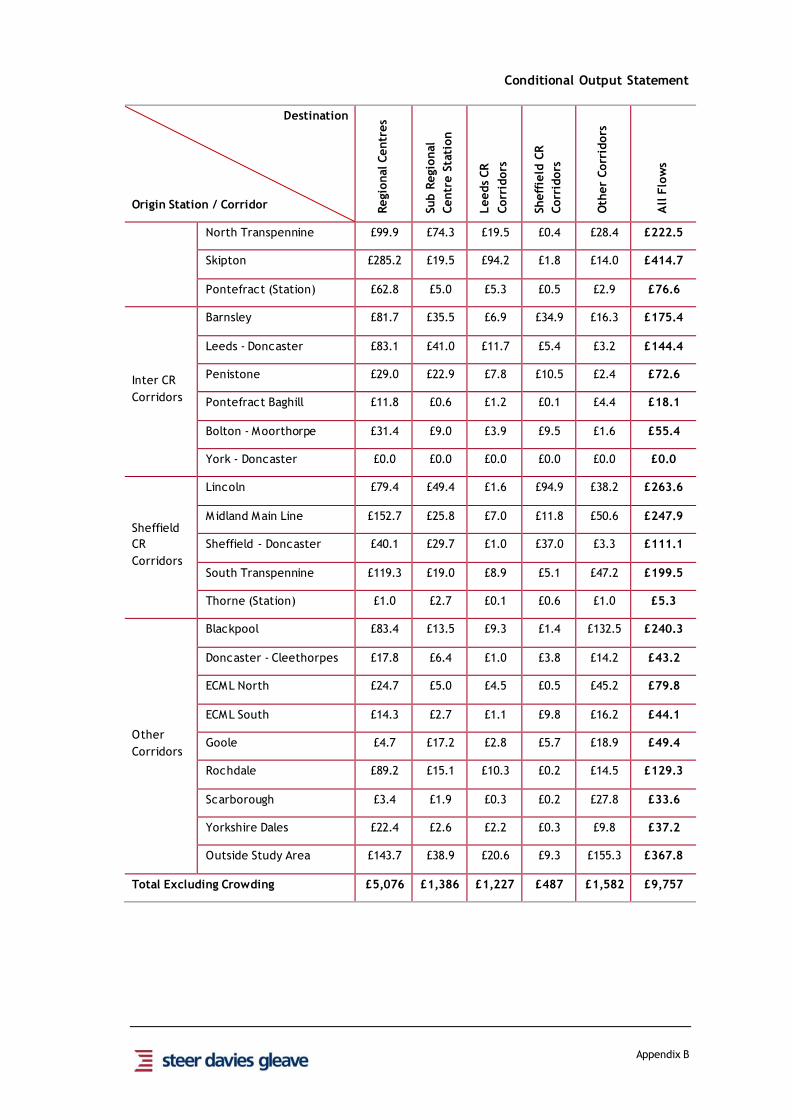
Conditional Output Statement
Appendix B
Destination
Origin Station / Corridor Regio
nal Centr
es
Sub R
egio
nal
Centr
e S
tati
on
Leeds
CR
Corr
idors
Sheff
ield
CR
Corr
idors
Oth
er
Corr
idors
All
Flo
ws
North Transpennine £99.9 £74.3 £19.5 £0.4 £28.4 £222.5
Skipton £285.2 £19.5 £94.2 £1.8 £14.0 £414.7
Pontefract (Station) £62.8 £5.0 £5.3 £0.5 £2.9 £76.6
Inter CR
Corridors
Barnsley £81.7 £35.5 £6.9 £34.9 £16.3 £175.4
Leeds - Doncaster £83.1 £41.0 £11.7 £5.4 £3.2 £144.4
Penistone £29.0 £22.9 £7.8 £10.5 £2.4 £72.6
Pontefract Baghill £11.8 £0.6 £1.2 £0.1 £4.4 £18.1
Bolton - Moorthorpe £31.4 £9.0 £3.9 £9.5 £1.6 £55.4
York - Doncaster £0.0 £0.0 £0.0 £0.0 £0.0 £0.0
Sheffield
CR
Corridors
Lincoln £79.4 £49.4 £1.6 £94.9 £38.2 £263.6
Midland Main Line £152.7 £25.8 £7.0 £11.8 £50.6 £247.9
Sheffield - Doncaster £40.1 £29.7 £1.0 £37.0 £3.3 £111.1
South Transpennine £119.3 £19.0 £8.9 £5.1 £47.2 £199.5
Thorne (Station) £1.0 £2.7 £0.1 £0.6 £1.0 £5.3
Other
Corridors
Blackpool £83.4 £13.5 £9.3 £1.4 £132.5 £240.3
Doncaster - Cleethorpes £17.8 £6.4 £1.0 £3.8 £14.2 £43.2
ECML North £24.7 £5.0 £4.5 £0.5 £45.2 £79.8
ECML South £14.3 £2.7 £1.1 £9.8 £16.2 £44.1
Goole £4.7 £17.2 £2.8 £5.7 £18.9 £49.4
Rochdale £89.2 £15.1 £10.3 £0.2 £14.5 £129.3
Scarborough £3.4 £1.9 £0.3 £0.2 £27.8 £33.6
Yorkshire Dales £22.4 £2.6 £2.2 £0.3 £9.8 £37.2
Outside Study Area £143.7 £38.9 £20.6 £9.3 £155.3 £367.8
Total Excluding Crowding £5,076 £1,386 £1,227 £487 £1,582 £9,757

Conditional Output Statement
Appendix B
B8 TREND SCENARIO DISAGGREGATED RATE OF BENEFIT / DISTRIBUTION OF BENEFIT GRAPHS

Conditional Output Statement
Appendix B

Conditional Output Statement
Appendix B

Conditional Output Statement
Appendix B

Conditional Output Statement
Appendix B


Conditional Output Statement
Appendix B
B9 TREND RATES OF ECONOMIC BENEFIT BY TYPE – PV 2002 VALUES
£M (BENEFIT DIVIDED BY GJT MINUTES / ADDITIONAL SEATS)
Benefit Type
Origin Station / Corridor
Revenue Incre
ment
Journ
ey T
ime
Non U
ser
Benefi
ts
Wid
er
Econom
ic B
enefi
ts
Tota
l Connecti
vit
y
Benefi
ts
Cro
wdin
g (
£000’s
)
Regional
Centre
Station
Leeds £14.1 £54.8 £15.4 £11.9 £96.3
Manchester £15.4 £36.3 £11.3 £7.5 £70.5
Sheffield £5.3 £18.9 £4.7 £5.4 £34.3
York £7.3 £15.9 £6.0 £4.3 £33.6
Bradford £6.4 £26.7 £10.8 £7.1 £51.0
London £5.7 £9.8 £3.7 £7.4 £26.6
Sub
Regional
Centre
Station
Harrogate £1.7 £4.9 £1.2 £1.2 £9.1
Halifax £2.0 £9.2 £3.1 £2.6 £16.9
Huddersfield (Station) £7.9 £25.0 £12.7 £5.3 £50.9
Wakefield £3.1 £12.7 £5.6 £2.4 £23.8
Barnsley (Station) £1.8 £6.7 £2.1 £1.3 £11.9
Doncaster £2.7 £9.5 £3.2 £1.9 £17.3
Rotherham £1.2 £3.0 £0.8 £0.7 £5.7
Chesterfield £1.3 £4.2 £1.1 £1.7 £8.2
Leeds CR
Corridors
5 Towns £1.3 £8.7 £1.5 £1.9 £13.3 £5.0
Bradford FS £0.4 £2.6 £0.3 £0.5 £3.8 £0.3
Bradford Interchange £1.6 £6.0 £1.5 £2.1 £11.2 £8.4
Calderdale £2.0 £9.9 £2.7 £2.6 £17.1 £8.5
Harrogate - York £0.7 £2.8 £0.6 £0.7 £4.8 £1.7
Huddersfield £3.5 £14.1 £3.5 £2.5 £23.6 £10.1
Hull £3.5 £10.1 £2.9 £1.9 £18.5 £1.1
Ilkley £3.1 £18.7 £4.0 £4.3 £30.1 £6.5
Leeds - Harrogate £2.2 £11.4 £2.0 £2.7 £18.2 £8.5

Conditional Output Statement
Appendix B
Benefit Type
Origin Station / Corridor
Revenue Incre
ment
Journ
ey T
ime
Non U
ser
Benefi
ts
Wid
er
Econom
ic B
enefi
ts
Tota
l Connecti
vit
y
Benefi
ts
Cro
wdin
g (
£000’s
)
Leeds - York £2.3 £9.5 £2.3 £2.3 £16.4 £4.7
North Transpennine £3.6 £11.4 £2.3 £3.4 £20.7 £3.1
Skipton £6.8 £36.1 £8.1 £8.1 £59.0 £13.0
Pontefract (Station) £0.6 £1.7 £0.5 £0.4 £3.2
Inter CR
Corridors
Barnsley £2.7 £7.2 £1.9 £1.4 £13.1 £6.6
Leeds - Doncaster £1.0 £7.3 £1.2 £1.5 £11.1 £4.1
Penistone £0.5 £3.1 £0.6 £1.2 £5.4 £0.6
Pontefract Baghill £0.0 £0.2 £0.0 £0.1 £0.3 -£0.1
Bolton - Moorthorpe £0.3 £2.1 £0.4 £0.6 £3.3 £9.5
York - Doncaster £0.0 £0.0 £0.0 £0.0 £0.0 £3.7
Sheffield
CR
Corridors
Lincoln £2.7 £7.4 £2.4 £2.6 £15.2 £4.4
Midland Main Line £4.8 £13.6 £3.8 £5.5 £27.6 £15.6
Sheffield - Doncaster £1.5 £4.2 £1.2 £1.0 £7.9 £9.4
South Transpennine £9.5 £24.5 £5.8 £9.6 £49.4 £16.6
Thorne (Station) £0.2 £1.4 £0.3 £0.4 £2.2
Other
Corridors
Blackpool £3.6 £14.4 £3.0 £3.4 £24.5 £0.3
Doncaster - Cleethorpes £1.0 £4.5 £1.0 £1.1 £7.6 £1.8
ECML North £16.6 £37.0 £10.6 £8.4 £72.6 £3.2
ECML South £5.1 £16.7 £3.7 £3.9 £29.3
Goole £0.7 £2.0 £0.6 £0.3 £3.7 £7.5
Rochdale £2.1 £7.7 £1.6 £1.9 £13.3 £0.3
Scarborough £0.7 £3.5 £0.7 £0.6 £5.4 £1.1
Yorkshire Dales £0.4 £2.1 £0.4 £0.9 £3.7

Conditional Output Statement
Appendix B
B10 TREND RATES OF ECONOMIC BENEFIT BY DESTINATION (REGIONAL
STATIONS) – PV 2002 VALUES £M (BENEFIT DIVIDED BY GJT
MINUTES - EXCLUDING CROWDING)
Destination
Origin Station / Corridor Leeds
Manchest
er
Sheff
ield
York
Bra
dfo
rd
London
Regional
Centre
Station
Leeds £0.0 £7.1 £3.2 £6.0 £8.7 £3.4
Manchester £5.9 £0.0 £3.0 £1.7 £0.7 £0.0
Sheffield £4.8 £4.6 £0.0 £1.7 £0.3 £1.9
York £8.0 £2.0 £1.2 £0.0 £0.4 £0.0
Bradford £16.9 £1.3 £0.3 £0.5 £0.0 £0.8
London £2.0 £0.0 £0.9 £0.0 £0.8 £0.0
Sub
Regional
Centre
Station
Harrogate £3.1 £0.2 £0.1 £1.5 £0.2 £1.1
Halifax £6.7 £1.0 £0.0 £0.8 £3.6 £0.6
Huddersfield (Station) £27.0 £4.6 £0.4 £1.5 £1.9 £0.6
Wakefield £11.0 £0.2 £0.9 £0.4 £1.6 £0.0
Barnsley (Station) £1.4 £0.1 £3.9 £0.1 £0.2 £0.1
Doncaster £1.7 £0.6 £5.5 £0.0 £0.1 £0.0
Rotherham £0.3 £0.1 £1.8 £0.4 £0.1 £0.1
Chesterfield £0.6 £0.5 £4.0 £0.2 £0.1 £0.0
Leeds CR
Corridors
5 Towns £6.1 £0.1 £0.1 £0.1 £0.5 £0.0
Bradford FS £1.2 £0.0 £0.0 £0.0 £1.2 £0.0
Bradford Interchange £5.9 £0.2 £0.1 £0.5 £1.0 £0.1
Calderdale £5.4 £3.1 £0.1 £0.6 £1.7 £0.4
Harrogate - York £1.1 £0.0 £0.0 £1.3 £0.1 £0.2
Huddersfield £10.5 £1.1 £0.1 £0.5 £0.1 £0.2
Hull £4.6 £0.9 £0.5 £1.5 £0.2 £0.3
Ilkley £20.1 £0.2 £0.1 £0.2 £2.2 £0.6
Leeds - Harrogate £10.9 £0.3 £0.2 £0.8 £0.4 £0.3
Leeds - York £10.1 £0.4 £0.1 £1.1 £0.3 £0.1

Conditional Output Statement
Appendix B
Destination
Origin Station / Corridor Leeds
Manchest
er
Sheff
ield
York
Bra
dfo
rd
London
North Transpennine £1.8 £10.9 £0.0 £0.2 £0.0 £0.1
Skipton £30.1 £0.3 £0.3 £0.5 £7.7 £1.5
Pontefract (Station) £1.0 £0.1 £0.1 £0.4 £0.1 £0.1
Inter CR
Corridors
Barnsley £0.9 £0.5 £2.9 £0.2 £0.2 £0.1
Leeds - Doncaster £5.3 £0.0 £0.2 £0.2 £0.1 £0.0
Penistone £0.5 £0.1 £0.6 £0.1 £0.0 £0.0
Pontefract Baghill £0.0 £0.0 £0.0 £0.2 £0.0 £0.0
Bolton - Moorthorpe £0.9 £0.0 £0.5 £0.0 £0.0 £0.0
York - Doncaster £0.0 £0.0 £0.0 £0.0 £0.0 £0.0
Sheffield
CR
Corridors
Lincoln £0.2 £0.2 £2.5 £0.2 £0.0 £0.9
Midland Main Line £1.5 £2.4 £2.9 £0.5 £0.4 £0.2
Sheffield - Doncaster £0.2 £0.0 £1.8 £0.1 £0.0 £0.1
South Transpennine £1.3 £40.0 £2.0 £0.6 £0.1 £0.3
Thorne (Station) £0.0 £0.0 £0.1 £0.0 £0.0 £0.0
Other
Corridors
Blackpool £1.2 £3.4 £0.2 £0.5 £0.4 £1.2
Doncaster - Cleethorpes £0.4 £0.4 £0.7 £0.2 £0.0 £0.8
ECML North £3.6 £2.3 £0.3 £8.4 £0.2 £0.9
ECML South £0.3 £0.4 £0.4 £0.1 £0.1 £23.5
Goole £0.0 £0.0 £0.1 £0.0 £0.0 £0.0
Rochdale £0.4 £9.1 £0.0 £0.0 £0.4 £0.1
Scarborough £1.2 £0.2 £0.0 £3.6 £0.0 £0.5
Yorkshire Dales £1.2 £0.0 £0.1 £0.1 £0.1 £0.1

Conditional Output Statement
Appendix B
B11 TREND RATES OF ECONOMIC BENEFIT BY DESTINATION (ALL
LOCATIONS) – PV 2002 VALUES £M (BENEFIT DIVIDED BY GJT
MINUTES - EXCLUDING CROWDING)
Destination
Origin Station / Corridor Regio
nal Centr
es
Sub R
egio
nal
Centr
e S
tati
on
Leeds
CR
Corr
idors
Sheff
ield
CR
Corr
idors
Oth
er
Corr
idors
All
Flo
ws
Regional
Centre
Station
Leeds £27.1 £16.8 £37.5 £0.8 £12.0 £96.3
Manchester £11.3 £3.0 £1.7 £0.3 £51.3 £70.5
Sheffield £12.5 £7.7 £0.7 £5.4 £7.8 £34.3
York £12.1 £4.1 £2.9 £0.3 £13.2 £33.6
Bradford £20.2 £64.6 £11.8 £0.3 £1.9 £51.0
London £2.4 £2.2 £2.3 £0.2 £24.8 £26.6
Sub
Regional
Centre
Station
Harrogate £6.2 £0.2 £2.8 £0.0 £0.8 £9.1
Halifax £13.6 £0.5 £2.0 £0.0 £0.8 £16.9
Huddersfield (Station) £39.7 £3.3 £7.8 £0.3 £1.6 £50.9
Wakefield £16.2 £4.2 £2.0 £0.4 £0.9 £23.8
Barnsley (Station) £6.6 £0.8 £0.3 £3.6 £0.4 £11.9
Doncaster £7.5 £1.0 £0.4 £4.1 £3.7 £17.3
Rotherham £3.2 £1.2 £0.1 £1.1 £0.3 £5.7
Chesterfield £6.3 £0.3 £0.1 £0.9 £1.3 £8.2
Leeds CR
Corridors
5 Towns £7.1 £1.8 £3.7 £0.4 £0.5 £13.3
Bradford FS £2.5 £0.1 £1.3 £0.0 £0.0 £3.8
Bradford Interchange £7.9 £2.3 £0.9 £0.1 £0.2 £11.2
Calderdale £11.8 £2.0 £2.1 £0.0 £1.3 £17.1
Harrogate - York £2.8 £1.0 £1.2 £0.0 £0.2 £4.8
Huddersfield £12.7 £7.8 £1.9 £0.0 £0.5 £23.6
Hull £8.2 £1.2 £1.3 £0.3 £6.7 £18.5
Ilkley £23.6 £0.5 £5.6 £0.0 £0.4 £30.1
Leeds - Harrogate £12.9 £2.7 £3.1 £0.0 £0.3 £18.2
Leeds - York £12.9 £1.2 £1.5 £0.0 £0.3 £16.4

Conditional Output Statement
Appendix B
Destination
Origin Station / Corridor Regio
nal Centr
es
Sub R
egio
nal
Centr
e S
tati
on
Leeds
CR
Corr
idors
Sheff
ield
CR
Corr
idors
Oth
er
Corr
idors
All
Flo
ws
North Transpennine £13.1 £3.7 £0.4 £0.0 £1.7 £20.7
Skipton £40.6 £1.3 £15.6 £0.1 £1.3 £59.0
Pontefract (Station) £2.7 £0.2 £0.5 £0.0 £0.0 £3.2
Inter CR
Corridors
Barnsley £5.7 £2.8 £0.3 £3.7 £0.9 £13.1
Leeds - Doncaster £6.0 £3.8 £0.8 £0.4 £0.1 £11.1
Penistone £1.4 £2.5 £1.9 £0.7 £0.1 £5.4
Pontefract Baghill £0.2 £0.0 £0.0 £0.0 £0.1 £0.3
Bolton - Moorthorpe £1.5 £0.7 £0.3 £0.8 £0.1 £3.3
York - Doncaster £0.0 £0.0 £0.0 £0.0 £0.0 £0.0
Sheffield
CR
Corridors
Lincoln £3.8 £1.0 £0.0 £5.2 £3.1 £15.2
Midland Main Line £8.4 £1.7 £0.4 £0.7 £15.3 £27.6
Sheffield - Doncaster £2.2 £2.4 £0.1 £3.3 £0.2 £7.9
South Transpennine £36.2 £1.2 £0.3 £0.2 £10.0 £49.4
Thorne (Station) £0.2 £1.4 £0.0 £0.1 £0.8 £2.2
Other
Corridors
Blackpool £8.0 £0.6 £0.3 £0.0 £15.1 £24.5
Doncaster - Cleethorpes £2.5 £2.3 £0.1 £0.6 £2.2 £7.6
ECML North £0.8 £0.4 £0.1 £44.4 £72.6
ECML South £15.6 £0.6 £0.2 £0.5 £12.8 £29.3
Goole £0.2 £1.8 £0.0 £0.4 £1.2 £3.7
Rochdale £10.2 £1.0 £0.7 £0.0 £1.3 £13.3
Scarborough £5.1 £0.2 £0.1 £0.0 £1.8 £5.4
Yorkshire Dales £1.6 £0.1 £1.2 £0.0 £1.0 £3.7

Conditional Output Statement
Appendix B
B12 TREND PLUS RATES OF ECONOMIC BENEFIT BY TYPE – PV 2002
VALUES £M (BENEFIT DIVIDED BY GJT MINUTES / ADDITIONAL
SEATS)
Benefit Type
Origin Station / Corridor
Revenue Incre
ment
Journ
ey T
ime
Non U
ser
Benefi
ts
Wid
er
Econom
ic B
enefi
ts
Tota
l Connecti
vit
y
Benefi
ts
Cro
wdin
g (
£000’s
)
Regional
Centre
Station
Leeds £14.5 £60.1 £15.4 £12.8 £102.8
Manchester £14.0 £40.7 £10.2 £7.9 £72.8
Sheffield £6.0 £21.0 £5.2 £6.0 £38.2
York £9.0 £18.1 £7.5 £5.0 £39.6
Bradford £7.5 £31.4 £13.2 £8.4 £60.5
London £5.8 £10.1 £3.8 £7.6 £27.3
Sub
Regional
Centre
Station
Harrogate £2.0 £5.5 £1.5 £1.4 £10.4
Halifax £2.3 £10.5 £3.7 £3.0 £19.5
Huddersfield (Station) £8.4 £29.7 £12.2 £5.9 £56.2
Wakefield £3.7 £15.3 £6.9 £2.9 £28.8
Barnsley (Station) £2.1 £8.0 £2.5 £1.6 £14.3
Doncaster £2.9 £10.9 £3.6 £2.1 £19.6
Rotherham £1.3 £3.4 £0.9 £0.8 £6.4
Chesterfield £1.5 £5.0 £1.3 £2.0 £9.7
Leeds CR
Corridors
5 Towns £1.5 £10.0 £1.8 £2.3 £15.5 £7.1
Bradford FS £0.4 £2.8 £0.4 £0.6 £4.2 £0.6
Bradford Interchange £1.9 £7.1 £1.8 £2.5 £13.2 £7.9
Calderdale £2.2 £11.1 £3.1 £3.0 £19.5 £7.8
Harrogate - York £0.8 £3.1 £0.7 £0.8 £5.3 £1.9
Huddersfield £4.4 £16.9 £4.3 £3.0 £28.6 £10.0
Hull £4.0 £11.3 £3.3 £2.1 £20.8 £1.1
Ilkley £3.2 £21.4 £4.2 £4.8 £33.7 £9.5
Leeds - Harrogate £2.6 £13.4 £2.4 £3.1 £21.5 £9.8

Conditional Output Statement
Appendix B
Benefit Type
Origin Station / Corridor
Revenue Incre
ment
Journ
ey T
ime
Non U
ser
Benefi
ts
Wid
er
Econom
ic B
enefi
ts
Tota
l Connecti
vit
y
Benefi
ts
Cro
wdin
g (
£000’s
)
Leeds - York £2.7 £11.1 £2.7 £2.7 £19.1 £4.9
North Transpennine £4.3 £14.0 £2.7 £4.1 £25.1 £4.2
Skipton £7.3 £40.6 £8.6 £9.0 £65.5 £16.7
Pontefract (Station) £0.7 £2.1 £0.6 £0.5 £3.9
Inter CR
Corridors
Barnsley £3.0 £8.3 £2.2 £1.6 £15.1 £7.4
Leeds - Doncaster £1.1 £8.1 £1.3 £1.7 £12.2 £6.4
Penistone £0.5 £3.4 £0.7 £1.4 £6.0 £0.6
Pontefract Baghill £0.0 £0.2 £0.0 £0.1 £0.4 -£0.1
Bolton - Moorthorpe £0.4 £2.4 £0.5 £0.7 £3.9 £9.4
York - Doncaster £0.0 £0.0 £0.0 £0.0 £0.0 £6.4
Sheffield
CR
Corridors
Lincoln £2.7 £7.9 £2.5 £2.7 £15.8 £6.9
Midland Main Line £5.1 £14.7 £4.0 £5.9 £29.8 £15.8
Sheffield - Doncaster £1.6 £4.7 £1.3 £1.1 £8.7 £11.1
South Transpennine £13.9 £30.2 £8.1 £12.2 £64.4 £19.6
Thorne (Station) £0.2 £1.4 £0.3 £0.4 £2.3
Other
Corridors
Blackpool £3.8 £15.2 £3.2 £3.6 £25.8 £0.3
Doncaster - Cleethorpes £1.1 £4.8 £1.1 £1.2 £8.2 £2.1
ECML North £20.6 £40.9 £13.9 £9.7 £85.1 £6.5
ECML South £5.0 £16.9 £3.6 £3.9 £29.3
Goole £0.8 £2.0 £0.7 £0.3 £3.8 £6.7
Rochdale £2.4 £9.2 £1.8 £2.3 £15.6 £0.6
Scarborough £1.0 £3.7 £0.9 £0.7 £6.3 £0.9
Yorkshire Dales £0.4 £2.2 £0.4 £1.0 £4.1

Conditional Output Statement
Appendix B
B13 TREND PLUS RATES OF ECONOMIC BENEFIT BY DESTINATION
(REGIONAL STATIONS) – PV 2002 VALUES £M (BENEFIT DIVIDED BY
GJT MINUTES - EXCLUDING CROWDING)
Destination
Origin Station / Corridor Leeds
Manchest
er
Sheff
ield
York
Bra
dfo
rd
London
Regional
Centre
Station
Leeds £0.0 £8.5 £4.1 £6.4 £9.4 £3.5
Manchester £6.4 £0.0 £3.7 £1.7 £0.7 £0.0
Sheffield £5.5 £5.7 £0.0 £1.7 £0.3 £1.9
York £10.0 £2.7 £1.6 £0.0 £0.4 £0.0
Bradford £20.9 £1.6 £0.3 £0.5 £0.0 £0.8
London £2.3 £0.0 £1.1 £0.0 £0.8 £0.0
Sub
Regional
Centre
Station
Harrogate £3.7 £0.3 £0.1 £1.6 £0.3 £1.1
Halifax £8.1 £1.2 £0.1 £1.1 £3.7 £0.6
Huddersfield (Station) £23.7 £5.4 £0.4 £1.7 £2.5 £0.6
Wakefield £12.9 £0.2 £1.1 £0.4 £2.1 £0.0
Barnsley (Station) £1.6 £0.1 £5.0 £0.1 £0.3 £0.1
Doncaster £1.7 £0.7 £7.2 £0.0 £0.1 £0.0
Rotherham £0.3 £0.1 £2.3 £0.4 £0.1 £0.1
Chesterfield £0.7 £0.6 £4.9 £0.2 £0.1 £0.0
Leeds CR
Corridors
5 Towns £7.2 £0.1 £0.2 £0.1 £0.6 £0.0
Bradford FS £1.5 £0.0 £0.0 £0.0 £1.2 £0.0
Bradford Interchange £7.2 £0.2 £0.1 £0.5 £1.0 £0.1
Calderdale £6.4 £3.9 £0.1 £0.8 £1.7 £0.4
Harrogate - York £1.3 £0.1 £0.0 £1.3 £0.1 £0.2
Huddersfield £12.8 £1.4 £0.1 £0.5 £0.2 £0.2
Hull £5.4 £1.1 £0.7 £1.5 £0.2 £0.3
Ilkley £23.2 £0.3 £0.2 £0.2 £2.3 £0.7
Leeds - Harrogate £13.2 £0.3 £0.2 £0.9 £0.5 £0.3
Leeds - York £12.3 £0.5 £0.1 £1.2 £0.3 £0.1

Conditional Output Statement
Appendix B
Destination
Origin Station / Corridor Leeds
Manchest
er
Sheff
ield
York
Bra
dfo
rd
London
North Transpennine £0.7 £13.5 £0.0 £0.3 £0.1 £0.0
Skipton £34.8 £0.4 £0.3 £0.5 £7.9 £1.5
Pontefract (Station) £1.2 £0.1 £0.1 £0.6 £0.1 £0.1
Inter CR
Corridors
Barnsley £1.0 £0.6 £3.8 £0.2 £0.2 £0.1
Leeds - Doncaster £6.1 £0.1 £0.2 £0.2 £0.2 £0.0
Penistone £0.5 £0.1 £0.8 £0.1 £0.0 £0.0
Pontefract Baghill £0.0 £0.0 £0.0 £0.2 £0.0 £0.0
Bolton - Moorthorpe £1.1 £0.0 £0.7 £0.0 £0.0 £0.0
York - Doncaster £0.0 £0.0 £0.0 £0.0 £0.0 £0.0
Sheffield
CR
Corridors
Lincoln £0.2 £0.2 £3.1 £0.2 £0.0 £0.9
Midland Main Line £1.7 £3.0 £3.6 £0.5 £0.4 £0.2
Sheffield - Doncaster £0.2 £0.1 £2.3 £0.1 £0.0 £0.1
South Transpennine £1.7 £51.9 £2.5 £0.7 £0.1 £0.4
Thorne (Station) £0.0 £0.0 £0.1 £0.0 £0.0 £0.0
Other
Corridors
Blackpool £1.4 £4.2 £0.3 £0.5 £0.4 £1.2
Doncaster - Cleethorpes £0.5 £0.5 £0.9 £0.2 £0.0 £0.8
ECML North £4.2 £3.0 £0.4 £8.4 £0.2 £0.9
ECML South £0.3 £0.5 £0.5 £0.1 £0.1 £23.6
Goole £0.0 £0.0 £0.1 £0.0 £0.0 £0.0
Rochdale £0.4 £11.3 £0.0 £0.0 £0.4 £0.1
Scarborough £1.4 £0.2 £0.1 £3.5 £0.0 £0.7
Yorkshire Dales £1.4 £0.0 £0.1 £0.1 £0.1 £0.1

Conditional Output Statement
Appendix B
B14 TREND RATES OF ECONOMIC BENEFIT BY DESTINATION (ALL
LOCATIONS) – PV 2002 VALUES £M (BENEFIT DIVIDED BY GJT
MINUTES - EXCLUDING CROWDING)
Destination
Origin Station / Corridor Regio
nal Centr
es
Sub R
egio
nal
Centr
e S
tati
on
Leeds
CR
Corr
idors
Sheff
ield
CR
Corr
idors
Oth
er
Corr
idors
All
Flo
ws
Regional
Centre
Station
Leeds £30.4 £16.7 £39.2 £0.9 £12.7 £102.8
Manchester £12.6 £3.0 £1.7 £0.3 £49.7 £72.8
Sheffield £14.4 £8.5 £0.7 £6.1 £8.1 £38.2
York £15.2 £4.9 £3.2 £0.3 £15.0 £39.6
Bradford £24.8 £60.9 £13.4 £0.4 £2.0 £60.5
London £2.6 £2.2 £2.2 £0.2 £26.5 £27.3
Sub
Regional
Centre
Station
Harrogate £7.1 £0.3 £3.4 £0.0 £0.8 £10.4
Halifax £16.0 £0.5 £2.2 £0.0 £0.8 £19.5
Huddersfield (Station) £40.3 £4.1 £9.4 £0.3 £1.7 £56.2
Wakefield £19.8 £5.2 £2.2 £0.5 £0.9 £28.8
Barnsley (Station) £8.2 £0.8 £0.4 £4.3 £0.4 £14.3
Doncaster £9.5 £1.2 £0.4 £4.2 £3.8 £19.6
Rotherham £3.9 £1.3 £0.1 £1.0 £0.3 £6.4
Chesterfield £7.7 £0.4 £0.1 £1.1 £1.3 £9.7
Leeds CR
Corridors
5 Towns £8.5 £1.9 £4.3 £0.4 £0.6 £15.5
Bradford FS £2.8 £0.1 £1.3 £0.0 £0.0 £4.2
Bradford Interchange £9.3 £2.7 £1.0 £0.1 £0.2 £13.2
Calderdale £14.1 £2.0 £2.2 £0.0 £1.3 £19.5
Harrogate - York £3.1 £1.0 £1.5 £0.0 £0.2 £5.3
Huddersfield £15.6 £9.4 £2.0 £0.0 £0.5 £28.6
Hull £9.5 £1.3 £1.5 £0.4 £6.9 £20.8
Ilkley £26.9 £0.5 £5.8 £0.0 £0.4 £33.7
Leeds - Harrogate £15.5 £3.1 £3.6 £0.0 £0.3 £21.5
Leeds - York £15.3 £1.3 £1.5 £0.0 £0.3 £19.1

Conditional Output Statement
Appendix B
Destination
Origin Station / Corridor Regio
nal Centr
es
Sub R
egio
nal
Centr
e S
tati
on
Leeds
CR
Corr
idors
Sheff
ield
CR
Corr
idors
Oth
er
Corr
idors
All
Flo
ws
North Transpennine £15.2 £4.8 £0.5 £0.0 £1.9 £25.1
Skipton £46.0 £1.4 £16.4 £0.1 £1.3 £65.5
Pontefract (Station) £3.4 £0.2 £0.6 £0.0 £0.0 £3.9
Inter CR
Corridors
Barnsley £7.0 £3.0 £0.4 £4.0 £0.9 £15.1
Leeds - Doncaster £7.0 £3.9 £0.8 £0.4 £0.1 £12.2
Penistone £1.6 £2.6 £2.4 £0.8 £0.1 £6.0
Pontefract Baghill £0.2 £0.0 £0.0 £0.0 £0.1 £0.4
Bolton - Moorthorpe £1.8 £0.8 £0.3 £1.0 £0.1 £3.9
York - Doncaster £0.0 £0.0 £0.0 £0.0 £0.0 £0.0
Sheffield
CR
Corridors
Lincoln £4.6 £1.0 £0.0 £5.1 £3.1 £15.8
Midland Main Line £10.0 £2.0 £0.3 £0.9 £15.3 £29.8
Sheffield - Doncaster £2.8 £2.6 £0.1 £3.3 £0.2 £8.7
South Transpennine £47.9 £1.5 £0.4 £0.3 £11.9 £64.4
Thorne (Station) £0.2 £1.4 £0.0 £0.2 £0.7 £2.3
Other
Corridors
Blackpool £9.3 £0.6 £0.4 £0.0 £15.2 £25.8
Doncaster - Cleethorpes £2.8 £2.3 £0.1 £0.8 £2.3 £8.2
ECML North £0.8 £0.4 £0.1 £51.5 £85.1
ECML South £16.1 £0.6 £0.2 £0.6 £12.4 £29.3
Goole £0.2 £2.0 £0.0 £0.5 £1.2 £3.8
Rochdale £12.4 £1.1 £0.7 £0.0 £1.2 £15.6
Scarborough £8.2 £0.2 £0.1 £0.0 £2.0 £6.3
Yorkshire Dales £1.8 £0.1 £1.3 £0.0 £1.1 £4.1


Conditional Output Statement
Appendix C
APPENDIX
C
NORTHERN RAIL PPM MAA


Conditional Output Statement
Appendix C
C1 NORTHERN RAIL PPM MAA
Public Performance Measure (PPM) is the percentage of trains arriving at their destination,
having made all planned calls, and within a specified lateness margin. The lateness margin
is 5 minutes for shorter distance services and 10 minutes for longer distance services.
With the exception of the following services, all Northern Rail services in the study area are
shorter distance services. The longer distance services are indicated by an ‘*’ in the table.
I Leeds - Carlisle
I Leeds - Blackpool North
I Leeds - Manchester Victoria
I Leeds – Morecambe
I Leeds - Barnsley - Sheffield (fast trains)
I Leeds - Nottingham
I Sheffield - Pontefract - York
I Sheffield - Lincoln/Cleethorpes
Northern Rail services in the study are divided into two areas, West and North Yorkshire and
South and East Yorkshire. The average PPM in each area is included in the table.
Service Area Corridors PPM
York/Leeds - Blackpool North* West and North
Yorkshire
(WNY)
Leeds - York, Bradford Interchange,
Calderdale & Blackpool
85%
Sheffield - Denby Dale –
Huddersfield
South and East
Yorkshire (SEY)
Barnsley & Penistone 87%
Leeds - Harrogate – York WNY Leeds - Harrogate & Harrogate York 87%
Leeds – Huddersfield WNY Huddersfield 88%
Leeds - Manchester Victoria via
Bradford*
WNY Bradford Interchange, Calderdale &
Rochdale
88%
Doncaster – Goole SEY Doncaster - Cleethorpes & Goole 88%
Leeds – Selby WNY Leeds - York & Hull 88%
Sheffield – Hull SEY Sheffield - Doncaster, Doncaster -
Cleethorpes, Goole & Hull
88%
Sheffield - Doncaster -
Adwick/Goole/Scunthorpe
SEY Sheffield - Doncaster, Doncaster -
Cleethorpes, Leeds - Doncaster & Goole
89%
Leeds - Sheffield via Moorthorpe WNY Leeds - Doncaster, Bolton - Moorthorpe &
Sheffield - Doncaster
89%
Leeds – Nottingham* SEY 5 Towns, Barnsley & Midland Main Line 89%
Leeds-Dewsbury-Rochdale-
Manchester Victoria*
WNY Huddersfield, Calderdale & Rochdale 90%

Conditional Output Statement
Appendix C
Service Area Corridors PPM
Sheffield - Barnsley - Darton –
Leeds
SEY Barnsley & 5 Towns 90%
Carlisle – Leeds* WNY Skipton & Yorkshire Dales 90%
Leeds – York WNY Leeds - York 90%
Sheffield - Barnsley - Leeds (fast
trains)*
SEY 5 Towns & Barnsley 91%
Leeds – Doncaster WNY Leeds - Doncaster 91%
Leeds – Morecambe* WNY Skipton & Yorkshire Dales 91%
Sheffield/Kiveton Park - Retford
- Lincoln/Cleethorpes*
SEY Lincoln 91%
York - Moorthorpe – Sheffield* SEY Leeds - York, Pontefract Baghill, Bolton -
Moorthorpe & Sheffield - Doncaster
92%
Wakefield - Huddersfield/Halifax
- Bradford - Leeds – Selby
WNY Huddersfield, Calderdale, Bradford
Interchange, Leeds - York & Selby
92%
Bradford – Ilkley WNY Bradford FS & Ilkley 93%
Doncaster - Scunthorpe SEY Doncaster - Cleethorpes 93%
York – Hull SEY Leeds - York, Pontefract Baghill & Hull 93%
Leeds - Knottingley – Goole WNY 5 Towns 93%
Bradford Forster Square –
Skipton
WNY Bradford FS & Skipton 95%
Leeds – Skipton WNY Skipton 95%
Leeds - Harrogate –
Knaresborough
WNY Leeds - Harrogate & Harrogate York 95%
Wakefield – Knottingley WNY 5 Towns 96%
Leeds - Ilkley WNY Ilkley 96%
Leeds - Bradford Forster Square WNY Bradford FS 96%
Area Totals WNY 92%
South and East Yorkshire 90%

Conditional Output Statement
Appendix D
APPENDIX
D
UDM CHANGES IN JOB DISTRIBUTION MAPS


Conditional Output Statement
Appendix D
D1 UDM TEST 1 – CHANGES IN JOB DISTRIBUTION

Conditional Output Statement
Appendix D
D2 UDM TEST 2 – CHANGES IN JOB DISTRIBUTION

Conditional Output Statement
Appendix D
D3 UDM TEST 3 – CHANGES IN JOB DISTRIBUTION

Conditional Output Statement
Appendix D
D4 UDM TEST 4 – CHANGES IN JOB DISTRIBUTION

\\Douglas\Work\Projects\224\0\78\01\Work\COS\Yorkshire Rail Network Study - Conditional Output Statement v11.docx
Control Sheet
CONTROL SHEET
Project/Proposal Name Yorkshire Rail Network Study
Document Title Conditional Output Statement
Client Contract/Project No. .
SDG Project/Proposal No. 22407801
ISSUE HISTORY
Issue No. Date Details
V11 29/03/2012 Final version
REVIEW
Originator Hutchinson, Alastair
Other Contributors
Review by: Print Neil Chadwick
Sign
DISTRIBUTION
Client: Metro, SYPTE and Leeds City Region
Steer Davies Gleave: