P a g e 1 | 6
RAINWATER+ Tutorial
What is Rainwater+: Rainwater+ can be used for design evaluation, decision-making,
compliance checking, and rough cost estimation. It is comprised of four
major process components 1) a built-in precipitation database; 2) a
terrain analysis tool; 3) a runoff volume calculator; and 4) a library of LID
practices and sizing components.1
This document provides you with an overview of each
component and step by step instructions to use this tool for the
evaluation of your design.
You need: 1. Your Rhino model
2. Grasshopper plugin (get it here):
http://www.grasshopper3d.com/page/download-1
3. Rainwater+ Grasshopper file
Model preparation: Make sure your Rhino model is built properly. Here are some tips:
1. Create separate surfaces for each intervention i.e. green roof, roof,
permeable surfaces, pavement, lawn, etc.
2. Be sure there are no overlapping surfaces
Opening Rainwater+ tool: 1. Open your Rhino model
2. In the command bar enter Grasshopper
3. Drag Rainwater+ Grasshopper file into the Grasshopper window
4. Click No for any generated warnings
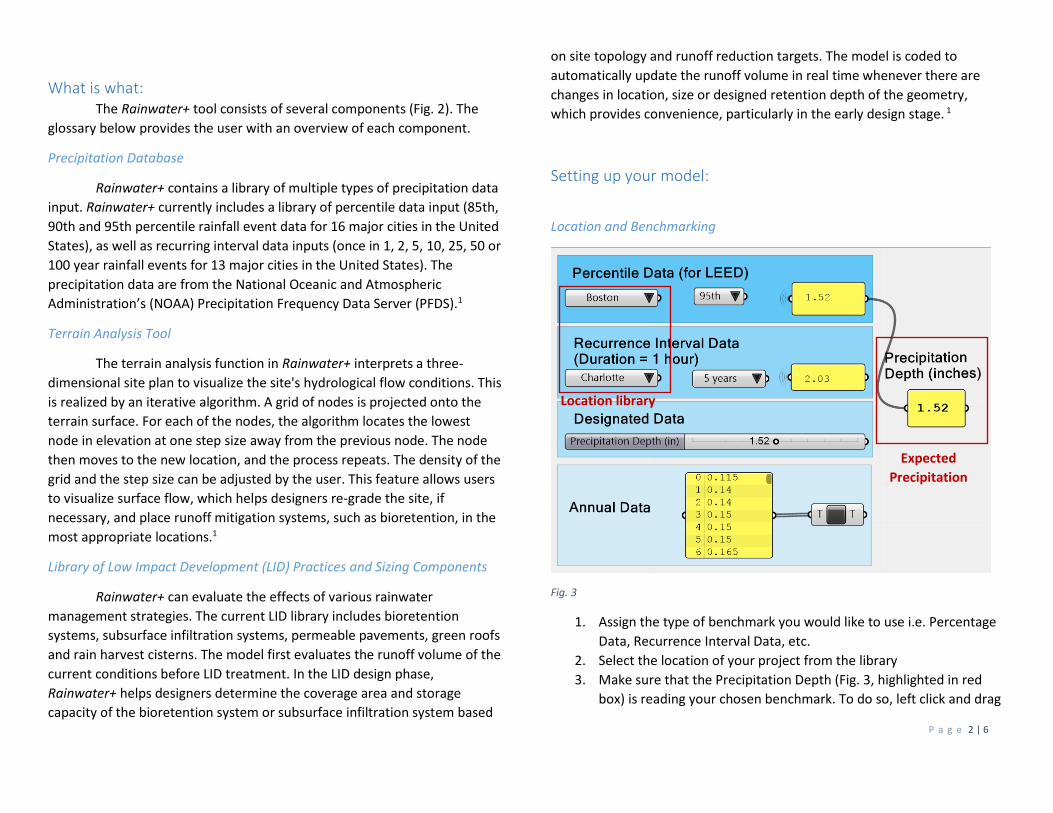
5. Right click anywhere on the window and select ungroup (Fig. 1). You
need to select ungroup three times to unlock the tool completely. Fig. 2
shows the ungrouped tool.
Fig.1. Grouped file
Fig. 2. Ungrouped file
P a g e 2 | 6
What is what: The Rainwater+ tool consists of several components (Fig. 2). The
glossary below provides the user with an overview of each component.
Precipitation Database
Rainwater+ contains a library of multiple types of precipitation data
input. Rainwater+ currently includes a library of percentile data input (85th,
90th and 95th percentile rainfall event data for 16 major cities in the United
States), as well as recurring interval data inputs (once in 1, 2, 5, 10, 25, 50 or
100 year rainfall events for 13 major cities in the United States). The
precipitation data are from the National Oceanic and Atmospheric
Administration’s (NOAA) Precipitation Frequency Data Server (PFDS).1
Terrain Analysis Tool
The terrain analysis function in Rainwater+ interprets a three-
dimensional site plan to visualize the site's hydrological flow conditions. This
is realized by an iterative algorithm. A grid of nodes is projected onto the
terrain surface. For each of the nodes, the algorithm locates the lowest
node in elevation at one step size away from the previous node. The node
then moves to the new location, and the process repeats. The density of the
grid and the step size can be adjusted by the user. This feature allows users
to visualize surface flow, which helps designers re-grade the site, if
necessary, and place runoff mitigation systems, such as bioretention, in the
most appropriate locations.1
Library of Low Impact Development (LID) Practices and Sizing Components
Rainwater+ can evaluate the effects of various rainwater
management strategies. The current LID library includes bioretention
systems, subsurface infiltration systems, permeable pavements, green roofs
and rain harvest cisterns. The model first evaluates the runoff volume of the
current conditions before LID treatment. In the LID design phase,
Rainwater+ helps designers determine the coverage area and storage
capacity of the bioretention system or subsurface infiltration system based
on site topology and runoff reduction targets. The model is coded to
automatically update the runoff volume in real time whenever there are
changes in location, size or designed retention depth of the geometry,
which provides convenience, particularly in the early design stage. 1
Setting up your model:
Location and Benchmarking
Fig. 3
1. Assign the type of benchmark you would like to use i.e. Percentage
Data, Recurrence Interval Data, etc.
2. Select the location of your project from the library
3. Make sure that the Precipitation Depth (Fig. 3, highlighted in red
box) is reading your chosen benchmark. To do so, left click and drag
Location library
Expected
Precipitation
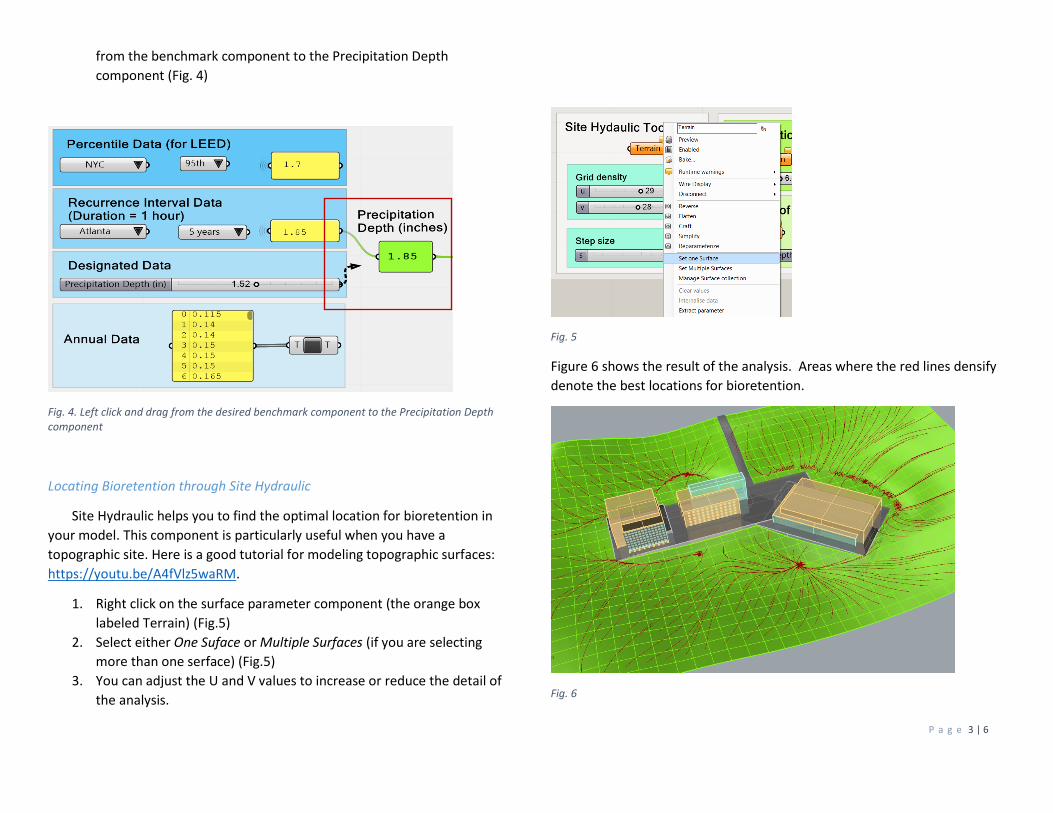
P a g e 3 | 6
from the benchmark component to the Precipitation Depth
component (Fig. 4)
Fig. 4. Left click and drag from the desired benchmark component to the Precipitation Depth component
Locating Bioretention through Site Hydraulic
Site Hydraulic helps you to find the optimal location for bioretention in
your model. This component is particularly useful when you have a
topographic site. Here is a good tutorial for modeling topographic surfaces:
https://youtu.be/A4fVlz5waRM.
1. Right click on the surface parameter component (the orange box
labeled Terrain) (Fig.5)
2. Select either One Suface or Multiple Surfaces (if you are selecting
more than one serface) (Fig.5)
3. You can adjust the U and V values to increase or reduce the detail of
the analysis.
Fig. 5
Figure 6 shows the result of the analysis. Areas where the red lines densify
denote the best locations for bioretention.
Fig. 6
P a g e 4 | 6
Modeling Bioretention
1. Use the results of your analysis to locate the best placement for
bioretention
2. Cut out the desired design from the terrain/site surface (Fig. 7)
3. Assign the cutout section as Bioretention (see next section for
detail)
Fig. 7
Assigning Functions to Surfaces of the Model
You can select various water management LID interventions for
your project (Fig 8).
1. Right click on the surface parameter component (the orange box)
(Fig.8)
2. Select either One Suface or Multiple Surfaces (if you are selecting
more than one surface) (Fig.8)
3. Select the desired surface. Note that the orange surface parameter
component has changed to gray. This indicates that the surface
parameter component is recognizing the surface.
4. Refine the selected intervention by specifying the design option
from either a dropdown menu or slider (Fig. 9)
5. Repeat the process to assign all the desired surfaces in your model
Fig. 8. Right click on surface parameter (the orange box) to assign model surfaces
Fig. 9. Adjust for a specific design option
Specifying design
option
P a g e 5 | 6
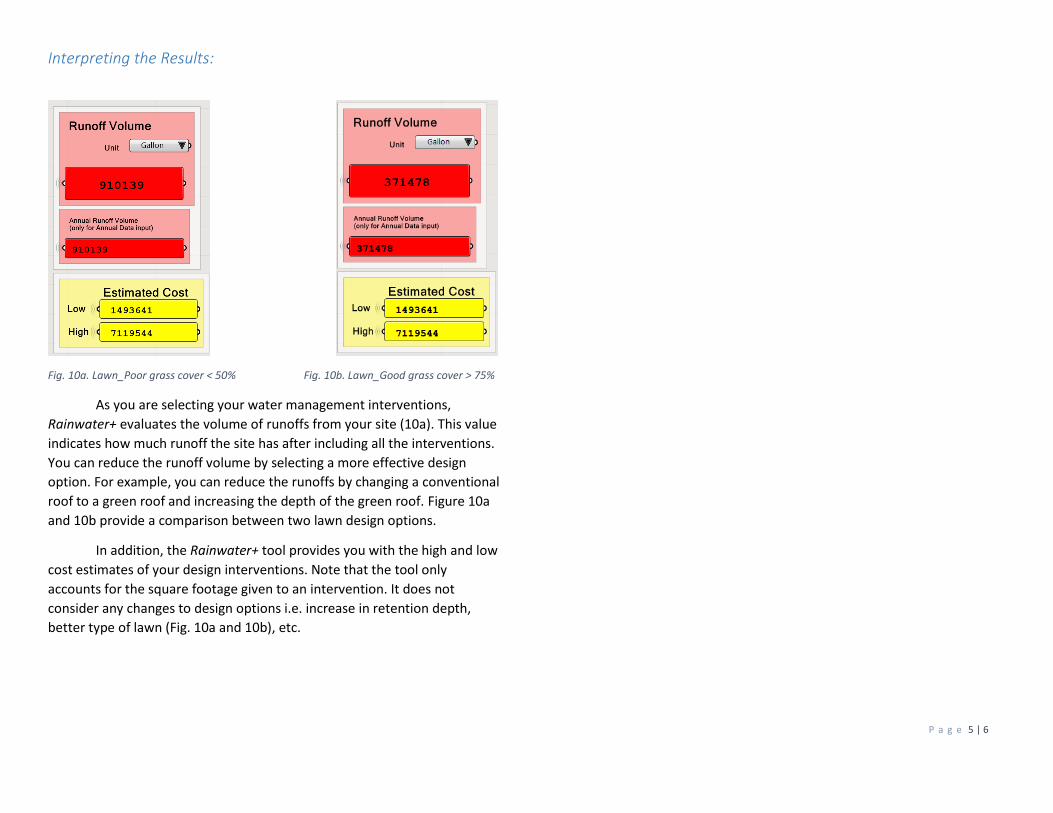
Interpreting the Results:
Fig. 10a. Lawn_Poor grass cover < 50% Fig. 10b. Lawn_Good grass cover > 75%
As you are selecting your water management interventions,
Rainwater+ evaluates the volume of runoffs from your site (10a). This value
indicates how much runoff the site has after including all the interventions.
You can reduce the runoff volume by selecting a more effective design
option. For example, you can reduce the runoffs by changing a conventional
roof to a green roof and increasing the depth of the green roof. Figure 10a
and 10b provide a comparison between two lawn design options.
In addition, the Rainwater+ tool provides you with the high and low
cost estimates of your design interventions. Note that the tool only
accounts for the square footage given to an intervention. It does not
consider any changes to design options i.e. increase in retention depth,
better type of lawn (Fig. 10a and 10b), etc.

P a g e 6 | 6
Recommended