A science-gateway workload archive to study pilot jobs, user activity, bag of tasks,
task sub-steps and workflow executions
1
CoreGRID/ERCIM Workshop on Grids, Clouds and P2P Computing August 27th 2012
Rafael Ferreira da Silva – [email protected]
Rafael FERREIRA DA SILVA and Tristan GLATARD University of Lyon, CNRS, INSERM, CREATIS
Villeurbanne, France

Context: Workload Archives
2 Rafael Ferreira da Silva – [email protected]
Information produced by grid workflow executions
Assumptions validation
Computational activity modeling
Methods evaluation (simulation or experimental)
use
ful fo
r task_status
submit_time execution_time
input_file
site_name
workflow_id
activity_name
exit_code

Science-gateway architecture
3 Rafael Ferreira da Silva – [email protected]
User
Web Portal
0. Login 1. Send input data
Storage Element
Workflow Engine
3. Launch workflow
Pilot Manager
4. Generate and submit task
Meta-Scheduler
5. Submit pilot jobs
2. Transfer input files
6. Schedule pilot jobs
Computing site
7. Get task 8. Get files 9. Execute 10. Upload results

State of the Art
4 Rafael Ferreira da Silva – [email protected]
task_status
submit_time
execution_time
input_file
site_name
workflow_id
activity_name
exit_code
Information gathered at infrastructure-level
Grid Workload Archives
tasks
Lack of critical information: • Dependencies among tasks • Task sub-steps • Application-level scheduling artifacts • User
• Parallel Workloads Archive (http://www.cs.huji.ac.il/labs/parallel/workload/)
• Grid Workloads Archive (http://gwa.ewi.tudelft.nl/pmwiki/)

At infrastructure-level
5 Rafael Ferreira da Silva – [email protected]
Storage Element
Pilot Manager
Meta-Scheduler
6. Schedule pilot jobs
Computing site
User
Web Portal
0. Login 1. Send input data
Workflow Engine
3. Launch workflow
4. Generate and submit task
5. Submit pilot jobs
2. Transfer input files
7. Get task 8. Get files 9. Execute 10. Upload results

Outline
A science-gateway workload archive
Case studies Pilot Jobs Accounting Task analysis
Bag of tasks Workflows
Conclusions
6 Rafael Ferreira da Silva – [email protected]

Our approach
7 Rafael Ferreira da Silva – [email protected]
task_status
submit_time
execution_time
input_file
site_name
workflow_id
activity_name
exit_code
Information gathered at science-gateway level
Science-Gateway Workload Archive
workflow executions Advantages: • Fine-grained information about tasks • Dependencies among tasks • Workflow characterization • Accounting
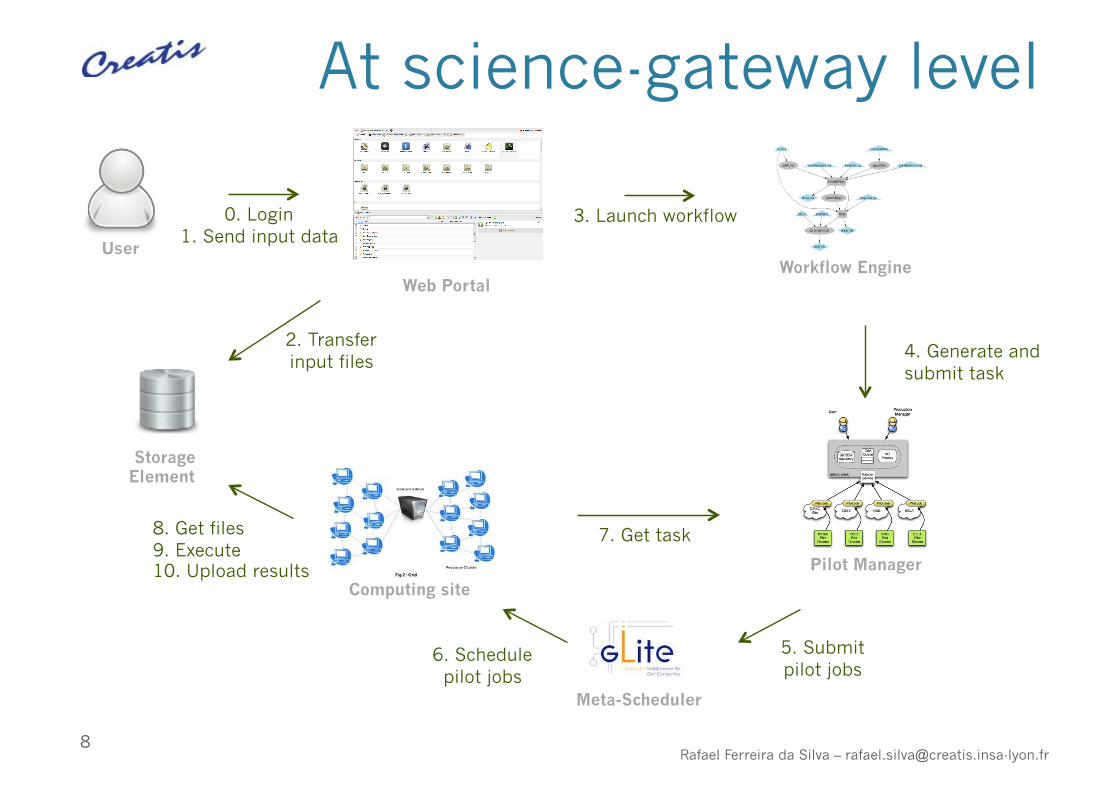
At science-gateway level
8 Rafael Ferreira da Silva – [email protected]
User
Web Portal
0. Login 1. Send input data
Storage Element
Workflow Engine
3. Launch workflow
Pilot Manager
4. Generate and submit task
Meta-Scheduler
5. Submit pilot jobs
2. Transfer input files
6. Schedule pilot jobs
Computing site
7. Get task 8. Get files 9. Execute 10. Upload results

Virtual Imaging Platform Virtual Imaging Platform (VIP)
Medical imaging science-gateway
Grid of 129 sites (EGI – http://www.egi.eu)
Significant usage Registered users: 244 from 26 countries
Applications: 18
Consumed 32 CPU years in 2011
9 Rafael Ferreira da Silva – [email protected]
VIP usage in 2011: CPU consumption of VIP and related platforms on EGI.
Applications
File transfer
VIP – http://vip.creatis.insa-lyon.fr
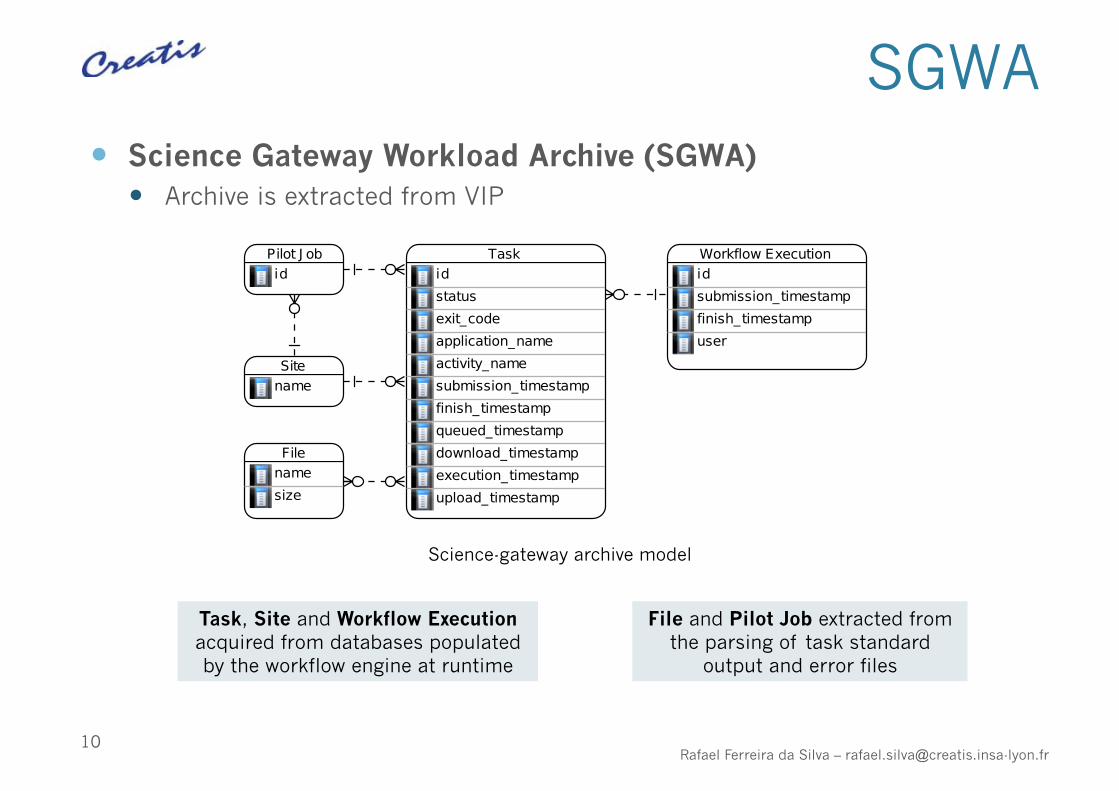
SGWA Science Gateway Workload Archive (SGWA)
Archive is extracted from VIP
10 Rafael Ferreira da Silva – [email protected]
Science-gateway archive model
Task, Site and Workflow Execution acquired from databases populated by the workflow engine at runtime
File and Pilot Job extracted from the parsing of task standard
output and error files

Workload for Case Studies Based on the workload of VIP
January 2011 to April 2012
11 Rafael Ferreira da Silva – [email protected]
112 users 2,941 workflow executions 680,988 tasks
338,989 completed
138,480 error
105,488 aborted
15,576 aborted replicas
48,293 stalled
34,162 queued
339,545 pilot jobs

Pilot Jobs A single pilot can wrap several
tasks and users
At infrastructure-level Assimilates pilot jobs to tasks and
users
Valid for only 62% of the tasks
Valid for 95% of user-task associations
At science-gateway level Users and tasks are correctly
associated to pilots
12 Rafael Ferreira da Silva – [email protected]
0
50000
100000
150000200000250000
282331
2812111885
6721 10487
1 2 3 4 5Tasks per pilot
Freq
uenc
y
0
50000
100000
150000200000250000300000
323214
15178
1079 70 4
1 2 3 4 5Users per pilot
Freq
uenc
y
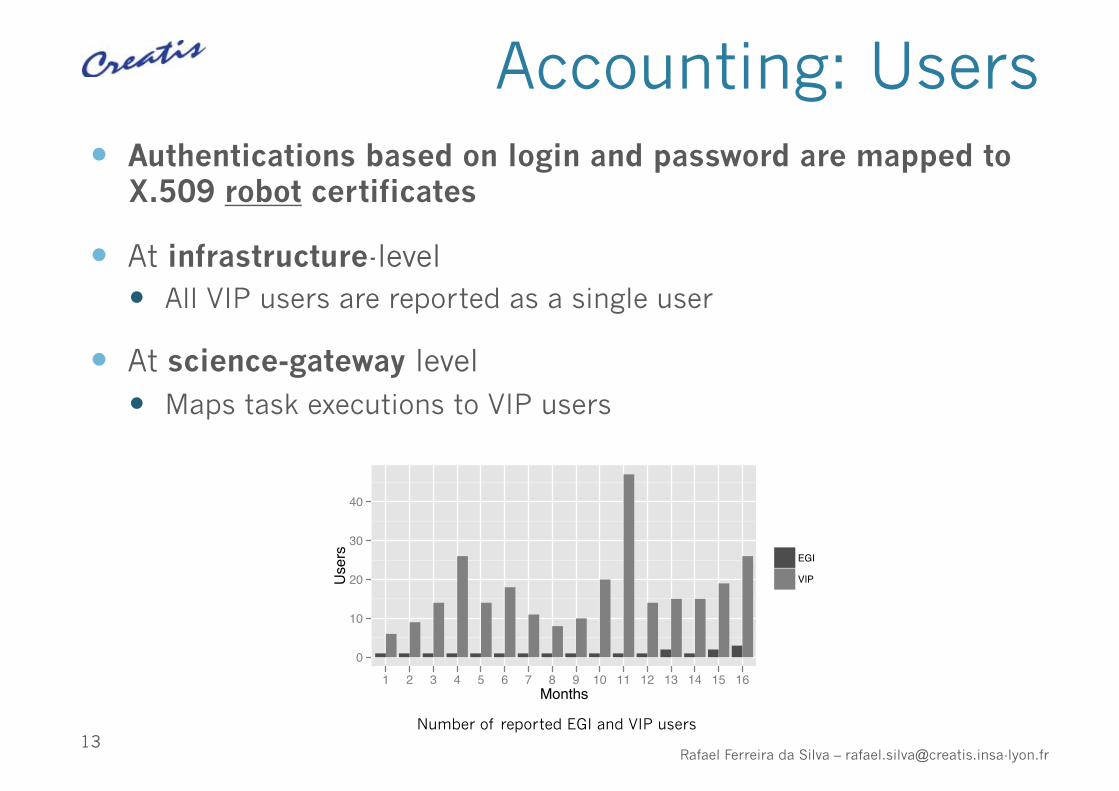
Accounting: Users Authentications based on login and password are mapped to
X.509 robot certificates
At infrastructure-level All VIP users are reported as a single user
At science-gateway level Maps task executions to VIP users
13 Rafael Ferreira da Silva – [email protected]
0
10
20
30
40
1 2 3 4 5 6 7 8 9 10 11 12 13 14 15 16Months
Users EGI
VIP
Number of reported EGI and VIP users

Accounting: CPU and Wall-clock Time
Huge discrepancy of values Pilot jobs do not register to
the pilot system
Absence of workload
Outputs unretrievable
Pilot setup time
Lost tasks (a.k.a. stalled)
Undetectable at infrastructure-level
14 Rafael Ferreira da Silva – [email protected]
1e+05
2e+05
3e+05
4e+05
5e+05
6e+05
5 10 15Month
Num
ber o
f job
s
VIP jobs
EGI jobs
Number of submitted pilot jobs by EGI and VIP
50
100
150
5 10 15Month
Year
s
VIP CPU time
VIP Wall−clock time
EGI CPU time
EGI Wall−clock time
Consumed CPU and wall-clock time by EGI and VIP

Task Analysis At infrastructure-level
Limited to task exit codes
At science-gateway level Fine-grained information
Steps in task life
Error causes
Replicas per task
15 Rafael Ferreira da Silva – [email protected]
0
10000
20000
30000
40000
50000
5516550925 48293
19463
1123
application input stalled output folderError causes
Num
ber o
f tas
ks
0
200
400
600
800
1000
1200 1191
401 347 322
1285
6
1 2 3 4 5 +5Replicas per task
Freq
uenc
y
0.2
0.4
0.6
0.8
1.0
1 100 10000Time(s)
CDF
download
execution
upload
Different steps in task life

Δ
Bag of Tasks: at Infrastructure level
Evaluation of the accuracy of Iosup et al.[8] method to detect bag of tasks (BoT)
Two successively submitted tasks are in the same BoT if the time interval between submission times is lower or equal to Δ.
16 Rafael Ferreira da Silva – [email protected]
Task 1
Task 2
Task 3
t1 t2 t3 time
Δ1,2 Δ2,3
Task 1
Task 2
BoT 1
Task 3
BoT 2
Δ1,2 ≤Δ |t1 – t2|≤Δ
Δ2,3 >Δ |t2 – t3|>Δ
Δ
[8] Iosup, A., Jan, M., Sonmez, O., Epema, D.: The Characteristics and performance of groups of jobs in grids. In: Euro-Par. (2007) 382-393

Bag of Tasks: Size and Duration Infrastructure vs science-gateway
17 Rafael Ferreira da Silva – [email protected]
0.0
0.2
0.4
0.6
0.8
200 400 600 800 1000Size (number of tasks)
CD
F
Real Batch
Batch
0.0
0.2
0.4
0.6
0.8
10000 20000 30000 40000 50000Duration (s)
CD
F
Real Batch
Real Non−Batch
Batch
Non−Batch
Real Batch = ground-truth BoT Real Non-Batch = ground-truth non-BoT Batch = Iosup et al. BoT Non-Batch = Iosup et al. non-BoT
90% of Batch BoTs size ranges from 2 to 10 while it represents 50% of Real Batch
Non-Batch duration is overestimated up to 400%

Bag of Tasks: Inter-arrival Time and Consumed CPU Time
18 Rafael Ferreira da Silva – [email protected]
0.0
0.2
0.4
0.6
0.8
2000 4000 6000 8000 10000Inter−Arrival Time (s)
CD
F
Real Batch
Real Non−Batch
Batch
Non−Batch
Real Batch = ground-truth BoT Real Non-Batch = ground-truth non-BoT Batch = Iosup et al. BoT Non-Batch = Iosup et al. non-BoT
0.2
0.4
0.6
0.8
0 5000 10000 15000 20000 25000 30000Consumed CPUTime (KCPUs)
CD
F
Real Batch
Real Non−Batch
Batch
Non−Batch
Batch and Non-Batch inter-arrival times are underestimated by about 30%
CPU times are underestimated of 25% for Non-Batch and of about 20% for Batch

Workflow Characterization
19 Rafael Ferreira da Silva – [email protected]
0.2
0.4
0.6
0.8
1.0
2000 4000 6000 8000Size (number of tasks)
CD
F
0.2
0.4
0.6
0.8
1.0
1e+03 1e+05 1e+07 1e+09Makespan (s)
CD
F
small
medium
large
total
0.2
0.4
0.6
0.8
1.0
200 400 600 800Speedup
CDF
small
medium
large
total
0.0
0.2
0.4
0.6
0.8
1.0
0 1 2 3 4 5 6Critical path length
CD
F
small
medium
large
total
Small (52%): ≤ 100 tasks Medium (31%): between 101 and 500 tasks Large (17%): > 500 tasks
At infrastructure-level Hardly possible
At science-gateway level

Conclusions
Science-gateway model of workload archive Illustration by using traces of the VIP from 2011/2012
Added value when compared to infrastructure-level traces Exactly identify tasks and users
Distinguishes additional workload artifacts from real workload
Fine-grained information about tasks
Ground-truth of bag of tasks
Workflow characterization
Traces are available to the community in the Grid Observatory http://www.grid-observatory.org
20 Rafael Ferreira da Silva – [email protected]

Thank you for your attention. Questions?
21
Rafael FERREIRA DA SILVA and Tristan GLATARD University of Lyon, CNRS, INSERM, CREATIS
Villeurbanne, France
ACKNOWLEDGMENTS VIP users and project members
French National Agency for Research (ANR-09-COSI-03) European Grid Initiative (EGI)
France-Grilles
Rafael Ferreira da Silva – [email protected]
A science-gateway workload archive to study pilot jobs, user activity, bag of tasks,
task sub-steps and workflow executions
Recommended