1
Accelerated cell divisions drive the outgrowth of the regenerating spinal cord 1
in axolotls 2
Fabian Rost1†, Aida Rodrigo Albors2,3,4†, Vladimir Mazurov3,4, Lutz Brusch1,5, Andreas Deutsch1,5, Elly 3
M. Tanaka3,4‡* and Osvaldo Chara1,6‡* 4
1 Center for Information Services and High Performance Computing, Technische Universität Dresden, Dresden, 5
Germany 6
2 Present address: Division of Cell & Developmental Biology, School of Life Sciences, University of Dundee, 7
Dundee, United Kingdom 8
3 Deutsche Forschungsgemeinschaft – Center for Regenerative Therapies Dresden, Dresden, Germany 9
4 Max Planck Institute of Molecular Cell Biology and Genetics, Dresden, Germany 10
5 Center for Advancing Electronics Dresden (cfaed), 01062 Dresden, Germany 11
6 Systems Biology Group (SysBio), Institute of Physics of Liquids and Biological Systems, National Scientific and 12
Technical Research Council (CONICET) and University of La Plata, La Plata, Argentina 13
14
† Co-first authorship 15
‡ Co-last authorship 16
* Corresponding authors 17
18
Corresponding authors: 19
Osvaldo Chara 20
Center for Information Services and High Performance Computing, Technische Universität Dresden, 21 Nöthnitzer Straße 46, 01187 Dresden, Germany 22 Tel. +49 351 463-38780 23 E-mail: [email protected] 24 25
Systems Biology Group (SysBio), Institute of Physics of Liquids and Biological Systems (IFLySIB), 26 National Scientific and Technical Research Council (CONICET) and University of La Plata 27 Calle 59 N 789, 1900 La Plata, Argentina 28 Tel. +54 221 4233283 Ext: 26 29 E-mail: [email protected] 30 31
Elly Tanaka 32
Deutsche Forschungsgemeinschaft – Center for Regenerative Therapies Dresden (CRTD) 33 Fetscherstraβe 105, 01307 Dresden, Germany 34 Tel. +49 351 458-82000 35 E-mail: [email protected] 36
.CC-BY 4.0 International licensenot peer-reviewed) is the author/funder. It is made available under aThe copyright holder for this preprint (which was. http://dx.doi.org/10.1101/067785doi: bioRxiv preprint first posted online Aug. 4, 2016;
2
Abstract 37
Axolotls are unique in their ability to regenerate the spinal cord. However, the mechanisms that 38
underlie this phenomenon remain poorly understood. Previously, we showed that resting stem cells in 39
the axolotl spinal cord revert to a molecular state resembling embryonic neuroepithelial cells and 40
functionally acquire rapid proliferative divisions during regeneration. Here we refine in space and time 41
this increase in cell proliferation during regeneration, and identify a dynamic high-proliferation zone in 42
the regenerating spinal cord. By tracking sparsely-labeled cells, we quantify cell influx into the 43
regenerate. Taking a mathematical modelling approach, we integrate these quantitative biological 44
datasets across cellular and tissue level to provide a mechanistic and quantitative understanding of 45
regenerative spinal cord outgrowth. We find that the acceleration of the cell cycle is necessary and 46
sufficient to drive the outgrowth of the regenerating spinal cord in axolotls. 47
Introduction 48
Neural stem cells exist in the spinal cord of all vertebrates, but only in salamanders these cells 49
are mobilized efficiently to resolve spinal cord injuries (Becker & Becker, 2015; Tanaka and Ferretti, 50
2009). In axolotls, this is best exemplified following tail amputation, when cells adjacent to the cut end 51
regrow a fully functional spinal cord (Holtzer, 1956; Mchedlishvili et al., 2007). Despite the 52
regenerative potential of axolotl neural stem cells, little was known about the molecular changes 53
occurring upon these cells and the changes in cell behavior that lead to the fast expansion of the 54
neural stem cell pool during regeneration. 55
In our previous study, we looked at spinal cord regeneration at the molecular and cellular 56
level. There, we found that resident SOX2+ neural stem cells re-activate an embryonic-like gene 57
expression program following tail amputation (Rodrigo Albors et al., 2015). Part of this program 58
involves the re-establishment of planar cell polarity (PCP) signaling, the downregulation of pro-neural 59
genes, and upregulation of proliferation-promoting genes. In line with these gene expression changes, 60
we also found that regenerating neural stem cells speed up their cell cycle, and switch from neuron-61
generating to proliferative cell divisions. PCP turned out to be key for the efficient and orderly 62
expansion of the regenerating spinal cord at least in part by instructing cells to divide along the 63
growing axis. However, besides oriented cell division, whether other cell mechanisms such as 64
.CC-BY 4.0 International licensenot peer-reviewed) is the author/funder. It is made available under aThe copyright holder for this preprint (which was. http://dx.doi.org/10.1101/067785doi: bioRxiv preprint first posted online Aug. 4, 2016;
3
convergence and extension or neural stem cell recruitment are required for the rapid expansion of the 65
regenerating spinal cord remained unknown. 66
In this follow-up study we investigate how different cell mechanisms contribute to the 67
elongation of the regenerating spinal cord in the axolotl. To address this question we apply a 68
quantitative modeling approach to causally link previous (Rodrigo Albors et al., 2015) and new 69
datasets to the time-course of spinal cord outgrowth. Particularly, we calculate neural stem cell density 70
from previous measurements (Rodrigo Albors et al., 2015) to show that convergence and extension 71
are negligible. We make use of cell proliferation-related measurements along the anterior-posterior 72
axis (AP) of the spinal cord (Rodrigo Albors et al., 2015) to identify a high-proliferation zone that 73
extends 800 μm anterior to the amputation plane, and calculate changes in cell cycle kinetics within 74
this zone. By tracing sparsely-labelled cells, we also determine the cell influx into the regenerating 75
spinal cord. Finally, we set up a mathematical model of spinal cord outgrowth that incorporates cell 76
proliferation, neural stem cell activation and cell influx. Using this model, we test the contribution of 77
each of these cell mechanisms to the regenerative spinal cord outgrowth. Comparing the predictions 78
of the model with experimental data of tissue outgrowth we show that while cell influx and the 79
activation of quiescent neural stem cells play a minor role, the acceleration of the cell cycle in the high-80
proliferation zone is necessary and sufficient to explain the observed regenerative outgrowth. 81
82
Results 83
The regenerating spinal cord grows with increasing velocity 84
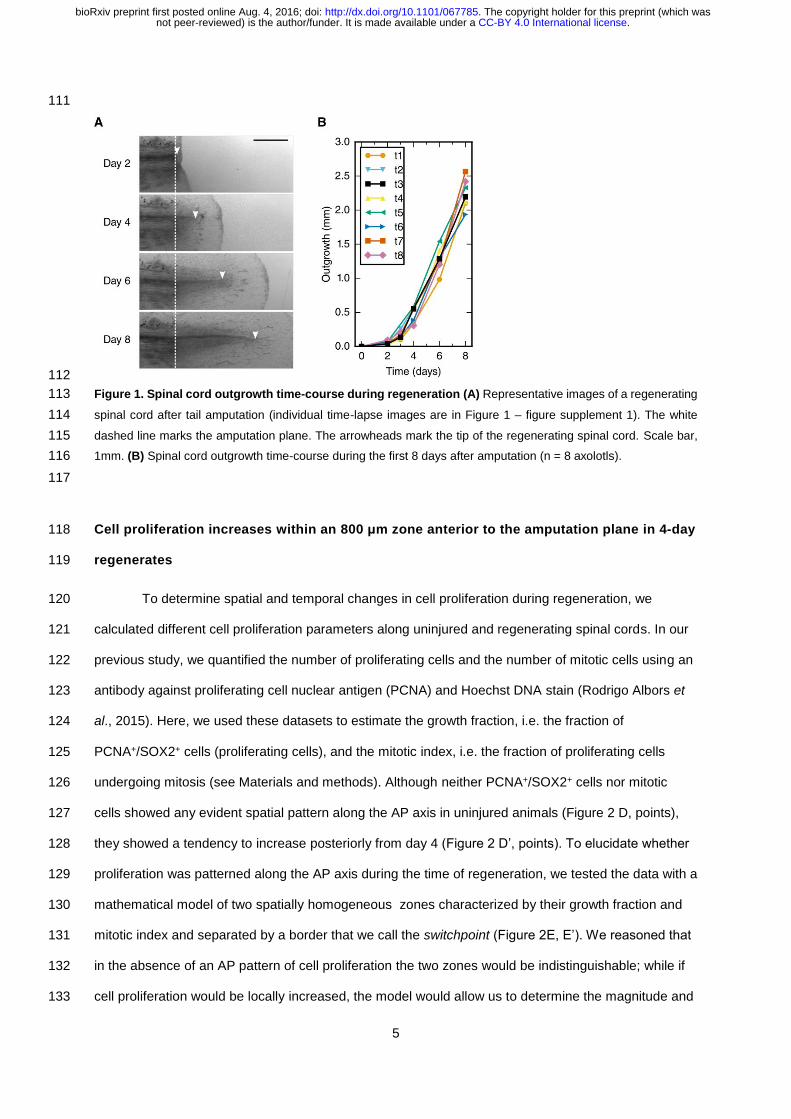
In order to refine the outgrowth time-course of the regenerating spinal cord, we measured the 85
spinal cord outgrowth in individual axolotls during the first 8 days of regeneration (Figure 1A, Figure 1 86
– figure supplement 1 and Supplementary file 1). Initially, the regenerating spinal cord extended slowly 87
to a mean outgrowth of 0.45 ± 0.04 mm at day 4 (Figure 1B). Thereafter, the spinal cord grew faster, 88
reaching an outgrowth of 2.3 ± 0.1 mm by day 8. 89
.CC-BY 4.0 International licensenot peer-reviewed) is the author/funder. It is made available under aThe copyright holder for this preprint (which was. http://dx.doi.org/10.1101/067785doi: bioRxiv preprint first posted online Aug. 4, 2016;
4
The density of neural stem cells stays constant along the AP axis of the regenerating 90
spinal cord 91
To explain the outgrowth time-course of the regenerating spinal cord in terms of underlying 92
cellular activities, we first set out to translate tissue outgrowth into cell numbers. To quantitatively 93
investigate neural stem cell arrangement in space and time, we revisited our previously published 94
dataset of the number of SOX2+ cells per cross section in uninjured and regenerating spinal cords 95
(Figure 2A and see Materials and methods) (Rodrigo Albors et al., 2015). We found that the number of 96
SOX2+ cells per spinal cord cross section is constant along the AP axis in both uninjured and 97
regenerating samples at any time (Figure 2B,B’ and Figure 2 – figure supplement 1). We also found 98
that the number of SOX2+ cells per cross section spatially averaged along the AP axis is constant 99
during regeneration time (Figure 2C and see Materials and methods). On average, 30.4 ± 0.6 SOX2+ 100
cells make up the circumference of the axolotl spinal cord. Since the length of SOX2+ cells along the 101
AP axis does not change during regeneration (lc = 13.2 ± 0.1 μm) (Rodrigo Albors et al., 2015), the 102
density of cells along the AP axis is spatially homogeneous and equal to 2.3 ± 0.6 cells / μm (Figure 103
2A). 104
Taken together, these findings allow us to exclude cell mechanisms such as cell shape 105
changes as well as convergence and extension, which leads to the narrowing and lengthening of 106
tissues, as driving forces of the polarized spinal cord growth in the axolotl. Instead, constant neural 107
stem cell density implies an increasing neural stem cell number during regeneration. This suggests 108
that the expansion of the regenerating neural stem cell pool relies on proliferation-related 109
mechanisms. 110
.CC-BY 4.0 International licensenot peer-reviewed) is the author/funder. It is made available under aThe copyright holder for this preprint (which was. http://dx.doi.org/10.1101/067785doi: bioRxiv preprint first posted online Aug. 4, 2016;
5
111
112
Figure 1. Spinal cord outgrowth time-course during regeneration (A) Representative images of a regenerating 113
spinal cord after tail amputation (individual time-lapse images are in Figure 1 – figure supplement 1). The white 114
dashed line marks the amputation plane. The arrowheads mark the tip of the regenerating spinal cord. Scale bar, 115
1mm. (B) Spinal cord outgrowth time-course during the first 8 days after amputation (n = 8 axolotls). 116
117
Cell proliferation increases within an 800 μm zone anterior to the amputation plane in 4-day 118
regenerates 119
To determine spatial and temporal changes in cell proliferation during regeneration, we 120
calculated different cell proliferation parameters along uninjured and regenerating spinal cords. In our 121
previous study, we quantified the number of proliferating cells and the number of mitotic cells using an 122
antibody against proliferating cell nuclear antigen (PCNA) and Hoechst DNA stain (Rodrigo Albors et 123
al., 2015). Here, we used these datasets to estimate the growth fraction, i.e. the fraction of 124
PCNA+/SOX2+ cells (proliferating cells), and the mitotic index, i.e. the fraction of proliferating cells 125
undergoing mitosis (see Materials and methods). Although neither PCNA+/SOX2+ cells nor mitotic 126
cells showed any evident spatial pattern along the AP axis in uninjured animals (Figure 2 D, points), 127
they showed a tendency to increase posteriorly from day 4 (Figure 2 D’, points). To elucidate whether 128
proliferation was patterned along the AP axis during the time of regeneration, we tested the data with a 129
mathematical model of two spatially homogeneous zones characterized by their growth fraction and 130
mitotic index and separated by a border that we call the switchpoint (Figure 2E, E’). We reasoned that 131
in the absence of an AP pattern of cell proliferation the two zones would be indistinguishable; while if 132
cell proliferation would be locally increased, the model would allow us to determine the magnitude and 133
.CC-BY 4.0 International licensenot peer-reviewed) is the author/funder. It is made available under aThe copyright holder for this preprint (which was. http://dx.doi.org/10.1101/067785doi: bioRxiv preprint first posted online Aug. 4, 2016;
6
the location of the increased cell proliferation. For a given growth fraction and mitotic index, the model 134
predicts the expected number of proliferating cells and mitotic cells per cross section (Figure 2 – figure 135
supplement 2). Hence, we fitted the model to the cell number datasets of uninjured and regenerating 136
spinal cords at day 3, 4, 6 and 8 after amputation (Figure 2E,E’, Figure 2 – figure supplement 3 and 137
Figure 2 – figure supplement 4) to determine the growth fraction, the mitotic index, and the switchpoint 138
for each time point (Figure 2F-F’’). Not surprisingly, we found that in the uninjured spinal cord the 139
growth fraction and the mitotic index in the two modeled zones are not significantly different (Figure 140
2E,F,F’ and Figure 2 – figure supplement 3). Similarly, at day 3 there are no significant differences 141
between the two zones (Figure 2F,F’ and Figure 2 – figure supplement 3). In contrast, the growth 142
fraction and the mitotic index are higher in the posterior zone from day 4 onward (Figure 4E’, F, F’ and 143
Figure 2 – figure supplement 3). These findings reveal that a high-proliferation zone emerges in the 144
regenerating spinal cord at day 4. At this time point, the switchpoint between the two zones is located 145
800 ± 100 μm anterior to the amputation plane, but shows the tendency to shift posteriorly at later time 146
points as the regenerating spinal cord grows (Figure 2F’’). 147
Next, we combined the mitotic index measurements with our previous cell cycle length 148
estimates (Rodrigo Albors et al., 2015) to establish how the proliferation rate changes during 149
regeneration (Figure 2G and see Material and methods). We find that the proliferation rate is 150
0.06 ± 0.02 per day in the uninjured spinal cord which corresponds to a cell cycle length of 10 ± 4 days 151
(Figure 2 – figure supplement 5). The proliferation rate is similar at day 3. However, at day 4 the 152
proliferation rate increases to about 0.15 per day corresponding to a cell cycle length of about 5 days 153
and the proliferation rate remains that high until day 8. 154
155
.CC-BY 4.0 International licensenot peer-reviewed) is the author/funder. It is made available under aThe copyright holder for this preprint (which was. http://dx.doi.org/10.1101/067785doi: bioRxiv preprint first posted online Aug. 4, 2016;
7
156
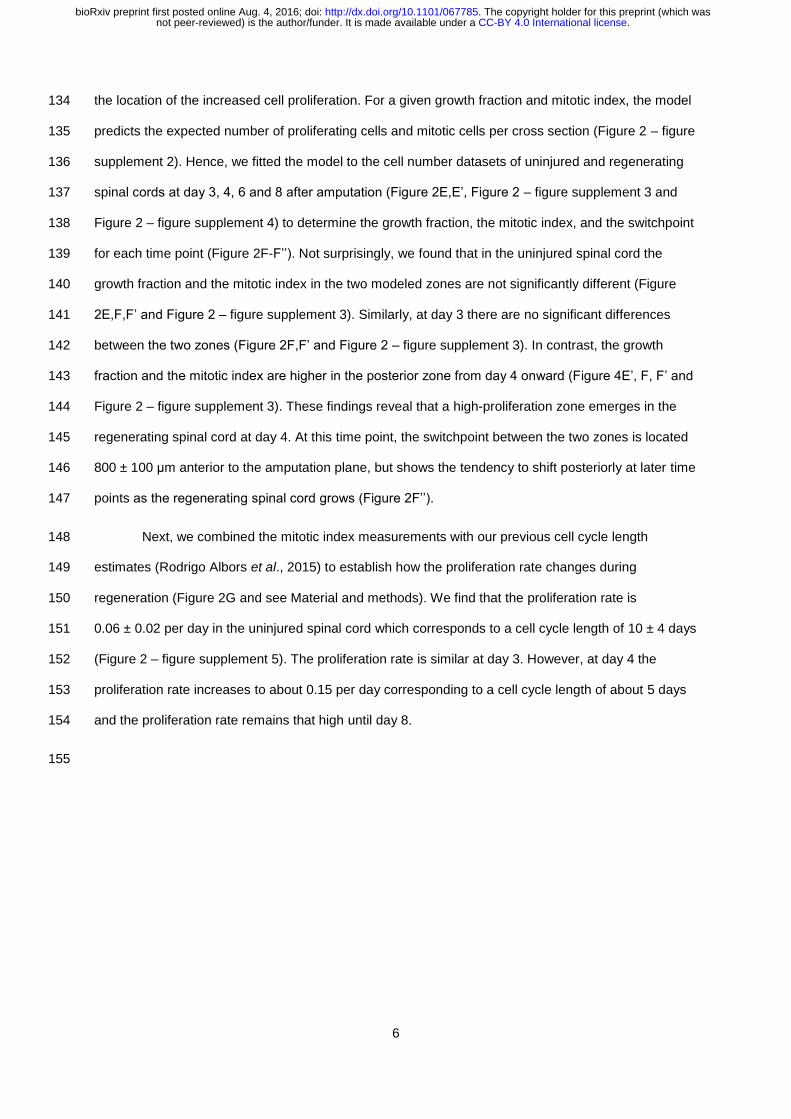
Figure 2. Cellular mechanisms underlying spinal cord outgrowth. (A) Sketch of measurements taken to 157
estimate the density and total number of neural stem cells (nuclei, black dots) in the axolotl spinal cord. The density 158
of SOX2+ cells, ρ, is the ratio of the number of SOX2+ cells per cross section (# stem cells) and the mean AP cell 159
length, lc. The density of SOX2+ cells is the proportionality constant between the total number of stem cells in a 160
zone along the spinal cord with zone length, LSC. (B,B’) Number of SOX2+ per cross section along the AP axis of a 161
selected uninjured (B) and a selected day 4-regenerating spinal cord (B’). Black line and grey region indicate the 162
mean number of SOX2+ cells and the standard deviation, respectively. Plots for all individual axolotls in Figure 2 – 163
figure supplement 1. (C) Spatial average of the number of SOX2+ cells per cross section of individual axolotls 164
against time (black dots). Black line and gray region indicate the mean number of SOX2+ cells and the standard 165
deviation of all animals, respectively. (D,D’) Number of SOX2+/PCNA+ cells per cross section (upper panel) and 166
mitotic cells per section (lower panel) along the AP axis in a selected uninjured (D) and a selected day 4-167
regenerating spinal cord (D’). Black line and the gray region show the expected number and the 68% confidence 168
belt for the best fit of the model with two spatial proliferation zones, respectively. Plots for all animals in Figure 2 – 169
figure supplement 3. (E) Possible cell states in the two spatial proliferation zones model used to analyze the spatial 170
cell proliferation dataset (D,D’). pp, probability that a cell is proliferative, otherwise quiescent. pm, probability that a 171
proliferative cell undergoes mitosis. (E’) The model assumes two proliferation zones. The location of the border 172
between zones is called switchpoint. (F-F’) Results of model fitting for growth fraction (F) and mitotic index time-173
course (F’) in the anterior (orange diamonds) and posterior (green triangles) zone. Error bars indicate the 68% 174
credibility interval. (F’’) Black dots mark the switchpoint. Blue dashed line marks 800 μm anterior to the amputation 175
.CC-BY 4.0 International licensenot peer-reviewed) is the author/funder. It is made available under aThe copyright holder for this preprint (which was. http://dx.doi.org/10.1101/067785doi: bioRxiv preprint first posted online Aug. 4, 2016;

8
plane. The dashed region marks the space outside of the embryo, the dotted region marks the unaffected part of 176
the embryo. (G) Proliferation rate time-course in the high-proliferation zone. (H) Total number of SOX2+PCNA- cells 177
in the high-proliferation zone (mean ± linearly propagated 1-σ error). (I) Selected time-lapse images of clone (blue 178
arrowhead) tracking during spinal cord regeneration. Dashed line marks the amputation plane. (J) Tracking of 19 179
clones along the AP axis during regeneration. Clone trajectories are color coded by their initial position. (K) Clone 180
velocities at different positions along the AP axis. 181
Quiescent neural stem cells re-enter the cell cycle during regeneration 182
Two possible scenarios could lead to the observed increased growth fraction in the high-183
proliferation zone: the activation of quiescent neural stem cells, or the dilution of quiescent cells by the 184
expansion of the proliferating cell population. If quiescent cells were activated, the total number of 185
quiescent cells in the high-proliferation zone would decrease. We estimated the total number of 186
quiescent cells in the high-proliferation zone from the mean number of SOX2+PCNA- cells per cross 187
section, the mean AP cell length, and the outgrowth time-course (see Materials and methods). The 188
number of SOX2+PCNA- cells drops from 180 ± 30 at day 0 to 23 ± 13 at day 6 (Figure 2H) which 189
means that quiescent SOX2+ cells get activated and re-enter the cell cycle upon injury. The number of 190
quiescent SOX2+ cells appears to increase again at day 8, when cells resume neurogenesis (Rodrigo 191
Albors et al., 2015). 192
Cells move faster the closer they are to the tip of the regenerate 193
Cell movement could also contribute to regenerative spinal cord growth. To investigate 194
whether anterior neural stem cells move into the high-proliferation zone, we followed individual cells 195
during regeneration. For that, we co-electroporated cytoplasmic GFP and nuclear mCherry plasmids at 196
very low concentration to achieve sparse labelling of cells and tracked them daily during the first 8 197
days of regeneration (Figure 2I and see Materials and methods). We found that labelled cells preserve 198
their original spatial order: cells located close to the amputation plane end up at the posterior end of 199
the regenerated spinal cord (Figure 2J). Most-anterior cells, however, almost do not change their 200
position. From the clone trajectories, we calculated the mean clone velocity at different positions along 201
the AP axis (Figure 2K and see Materials and methods). Clones initially located 800 μm anterior to the 202
amputation plane move slowly, with a velocity of 20 ± 9 m/day. In contrast, the more posterior a clone 203
is, the faster it moves. 204
205
.CC-BY 4.0 International licensenot peer-reviewed) is the author/funder. It is made available under aThe copyright holder for this preprint (which was. http://dx.doi.org/10.1101/067785doi: bioRxiv preprint first posted online Aug. 4, 2016;

9
Cell proliferation drives the outgrowth of the regenerating spinal cord 206
Above we showed that cell density is constant along the AP axis of the regenerating spinal 207
cord (Figure 2B and C). The spinal cord must therefore grow as a result of increasing cell numbers. In 208
line with this, we found a high-proliferation zone, first spanning from 800 μm anterior to the amputation 209
plane, and showed that the increase in cell proliferation is due to both (i) the acceleration of the cell 210
cycle and (ii) the activation of quiescent stem cells. Based on our finding of cell flow during 211
regeneration (Figure 2J and Figure 2K), the influx of cells into the regenerating spinal cord could also 212
contribute to increasing the cell numbers in the regenerating spinal cord (Figure 3A). To assess the 213
contribution of these cell mechanisms to the spinal cord outgrowth time-course, we used a quantitative 214
mathematical modeling framework (Greulich & Simons 2016; Rué & Martinez Arias, 2015; Oates et al., 215
2009). Assuming that cells entering the high-proliferation zone at the switchpoint acquire the features 216
of high-proliferative cells via activation, we formalized the influence of those cellular mechanisms on 217
the total number of proliferating and quiescent SOX2+ cells in the high-proliferation zone (see 218
Materials and methods, equations (3) and (4)). Making use of the constant cell density along the spinal 219
cord we rewrote this cell number model as a model for spinal cord outgrowth, L, and growth fraction, 220
GF: 221
𝑑𝐿
𝑑𝑡= 𝑟(𝑡) (𝐿 + 𝐿0) 𝐺𝐹
⏞ divisions of proliferating cells
+ 𝑣⏞
influx of cellsinto the high-proliferation zone
, 𝐿(𝑡 = 0) = 0, (1)
𝑑𝐺𝐹
𝑑𝑡= (1 − 𝐺𝐹) 𝑘⏟
activation of quiescent
SOX2+ cells
+ (1 − 𝐺𝐹) 𝑟(𝑡) 𝐺𝐹⏟ dilution of quiescent SOX2+ cells
in the expanding pool
of proliferating cells
, 𝐺𝐹(𝑡 = 0) = 𝐺𝐹0 (2) 222
where L0 = 800 μm is the length of the high-proliferation zone, GF0 is the growth fraction in 223
uninjured tails, r(t) is the proliferation rate at time t, v is the velocity of cells 800 μm anterior to the 224
amputation plane, and k is the cell cycle entry rate. As we determined the proliferation rate time-225
course r(t) (Figure 2G), the initial growth fraction G0 (Figure 2F) and the influx velocity v (Figure 2K), 226
only the cell cycle entry rate k is unknown. By fitting the model to the experimental growth fraction data 227
from day 0 to day 6 (Figure 3B), we determined this parameter as k = 0.2 ± 0.1 day-1. Strikingly, the 228
model predicts a spinal cord outgrowth time-course that recapitulates the experimental data (Figure 229
3C). This fit-free agreement shows that acceleration of the cell cycle, activation of quiescent neural 230
stem cells, and an influx of cells quantitatively explain the observed time course of spinal cord 231
outgrowth. 232
.CC-BY 4.0 International licensenot peer-reviewed) is the author/funder. It is made available under aThe copyright holder for this preprint (which was. http://dx.doi.org/10.1101/067785doi: bioRxiv preprint first posted online Aug. 4, 2016;

10
To quantitatively determine the contribution of each cell mechanism we switched them off one 233
by one in silico. Switching off the acceleration of the cell cycle leads to an outgrowth of less than 234
1.7 mm by day 8 due to the basal proliferation rate in the uninjured spinal cord, the influx of cells 235
towards the amputation plane and the activation of quiescent neural stem cells (Figure 3D). This 236
underestimates the experimental outgrowth which implies that the acceleration of the cell cycle is 237
necessary to drive spinal cord outgrowth. In contrast, switching off cell influx does nearly not affect 238
spinal cord outgrowth, implying that cell influx is not a major driver of regenerative outgrowth (Figure 239
3E). Similarly, switching off the activation of quiescent stem cells has only a small effect on 240
regenerative spinal cord outgrowth (Figure 3F). Interestingly, when both, cell influx and cell activation 241
are switched off the experimental spinal cord outgrowth time-course is correctly predicted, implying 242
that acceleration of the cell cycle is sufficient to drive the regenerative process (Figure 3G). 243
Taken together, our model shows that the acceleration of the cell cycle in cells that were 244
already proliferating in the uninjured spinal cord is necessary and sufficient to explain the observed 245
spinal cord outgrowth. 246
247
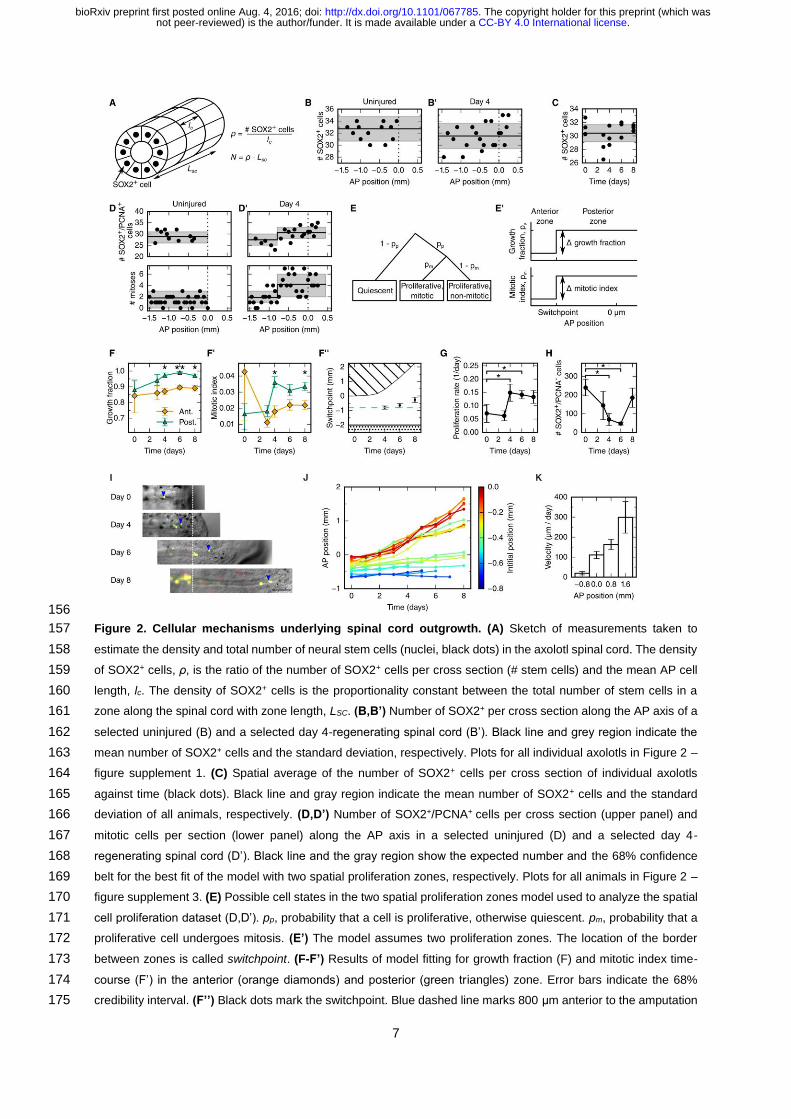
Figure 3. Mechanistic model of spinal cord outgrowth. (A) Sketch of cell mechanisms included in the model: 248
cell proliferation, quiescent cell activation, and cell influx into the 800 μm high-proliferation zone. (B) Growth fraction 249
time-course of the SOX2+ cell population in the high-proliferation zone as observed (black dots) and fitted by the 250
model (grey shaded areas, from darker to lighter, 68%, 95% and 99.7% confidence intervals of the model 251
prediction). (C) Spinal cord outgrowth during the first eight days of regeneration as observed (black dots, n = 8 252
.CC-BY 4.0 International licensenot peer-reviewed) is the author/funder. It is made available under aThe copyright holder for this preprint (which was. http://dx.doi.org/10.1101/067785doi: bioRxiv preprint first posted online Aug. 4, 2016;
11
axolotls) and predicted by the model (green shaded areas). The model prediction is in agreement with the 253
experimental data. (D-G) Prediction of spinal cord outgrowth for four model scenarios with selected mechanisms 254
switched off (green shaded areas). Black dots show the same experimental data as in panel (C). (D) The 255
acceleration of the cell cycle is switched off. Hence, the proliferation rate is fixed to the basal proliferation rate of 256
uninjured animals. (E) Cell influx is switched off (v = 0). (F) Quiescent cell activation is switched off (k = 0). (G) Cell 257
influx and quiescent cell activation are switched off (k = 0, v = 0). Corresponding predictions for growth fraction in 258
Figure 3 – supplementary figure 1. 259
260
Discussion 261
The spinal cord tissue size and architecture is faithfully restored after tail amputation in 262
axolotls. This unique regenerative capability relies on the neural stem cells surrounding the central 263
canal of the spinal cord. These cells re-activate an embryonic gene expression program that 264
implements PCP signaling to make possible the increase in cell proliferation while maintaining a tube-265
like structure (Rodrigo Albors et al., 2015). However, whether other cellular mechanisms (such us 266
convergence and extension, activation of quiescent neural stem cells or influx of cells) could contribute 267
as well to the regenerated spinal cord outgrowth remained unknown. 268
Here, we combined detailed quantitative datasets with mathematical modeling to dissect the 269
cell mechanisms that underlie regenerative spinal cord outgrowth in axolotls. We found that the 270
response to injury involves (i) changes in the cell proliferation rate, (ii) activation of quiescent cells, and 271
(iii) cell influx into the regenerating spinal cord, while maintaining a surprisingly organized neural stem 272
cell-scaffold. Modeling the contribution of each of these mechanisms to tissue outgrowth upon 273
regeneration, we uncovered that the acceleration of the cell cycle is the main driver of regenerative 274
spinal cord outgrowth in axolotls. 275
276
277
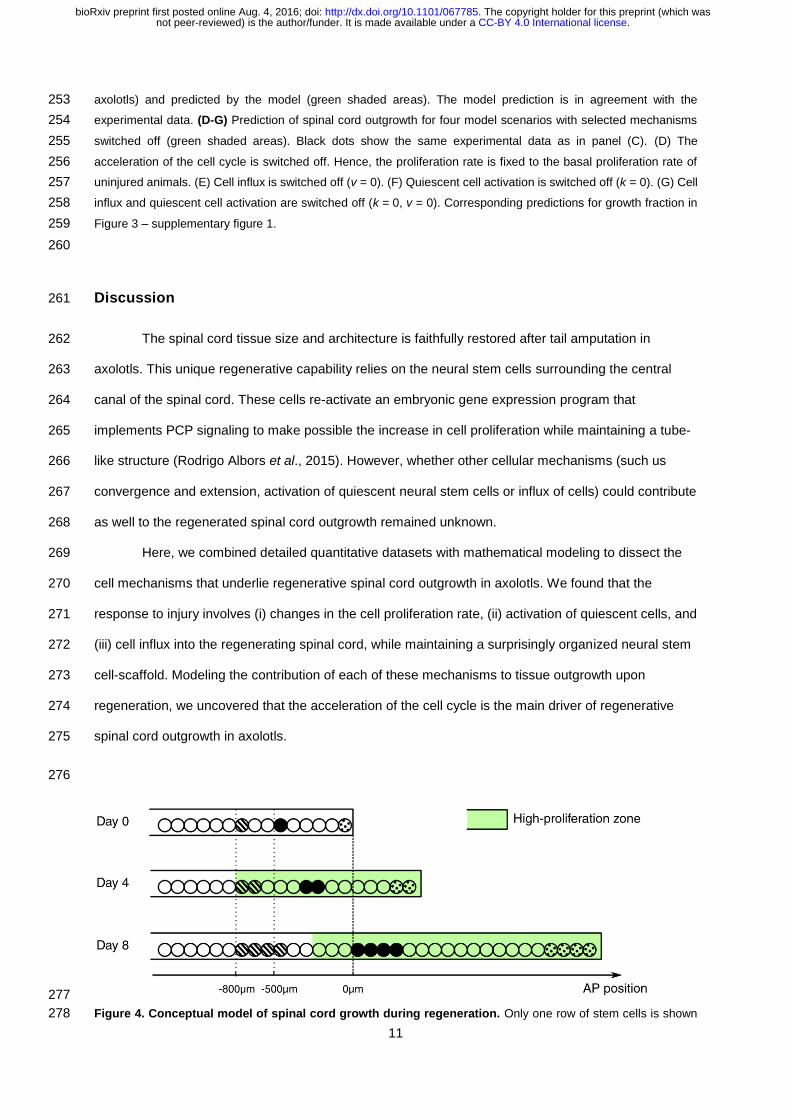
Figure 4. Conceptual model of spinal cord growth during regeneration. Only one row of stem cells is shown 278
.CC-BY 4.0 International licensenot peer-reviewed) is the author/funder. It is made available under aThe copyright holder for this preprint (which was. http://dx.doi.org/10.1101/067785doi: bioRxiv preprint first posted online Aug. 4, 2016;

12
as circles and three cell clones are marked with different patterns (striped, black and dotted). In the uninjured spinal 279
cord (Day 0), cells divide at a slow, basal proliferation rate (white background). From day 4 after amputation, cells 280
speed up their cell cycle and the growth fraction increases, within a high-proliferation zone that initially extends 800 281
μm anterior to the amputation plane (green background). The density of neural stem cells along the spinal cord 282
stays constant and spinal cord outgrowth is achieved by an increase in the total number of neural stem cells. Cell 283
proliferation in the high-proliferation zone is necessary and sufficient to provide this increase in cell numbers. 284
Dividing cells might push cells posteriorly. The more posterior a cell is the more cells anterior to that cell divide and 285
push the cell making it move faster: While an anterior clone (striped) hardly moves, clones in the center of the high 286
proliferation zone (black) move faster. Clones that start at the amputation plane (dotted) stay at the tip of the 287
regenerating spinal cord and move fastest. 288
289
Increased proliferation of SOX2+ cells upon spinal cord injury is a common feature among 290
vertebrates (Becker & Becker, 2015). In zebrafish (Hui et al., 2010; Hui et al., 2015), Xenopus (Gaete 291
et al., 2012), mouse (Lacroix et al., 2014) and axolotl (this work, Rodrigo Albors et al. 2015, Holtzer, 292
1956) traumatic spinal cord injury triggers a long-range wave of increased cell proliferation. It is 293
however clear that although the potential to replace lost cells or tissue exists in other species, they are 294
not as efficient as axolotls resolving spinal cord injuries. A more comprehensive characterization of cell 295
proliferation responses is thus needed to understand fundamental differences between species with 296
different regenerative capabilities. In our previous study, we uncovered that spinal cord stem cells 297
speed up their cell cycle during regeneration (Rodrigo Albors et al., 2015). Performing detailed 298
quantifications in the axolotl, we were now able to delineate a high-proliferation zone that initially 299
spans from the 800 μm adjacent to the amputation plane to the regenerating tip, and later shifts 300
posteriorly, as the spinal cord regrows. Although quiescent neural stem cells enter the cell cycle during 301
regeneration, we demonstrate that the observed increase in proliferation is primarily due to the 302
acceleration of the cell cycle within the regenerating pool of neural stem cells. By performing 303
experiments in silico using our mechanistic model of spinal cord regeneration, we demonstrated that 304
this acceleration of the cell cycle is necessary and sufficient to explain the observed spinal cord 305
outgrowth. In agreement with this, Sox2-knockout spinal cords fail to regrow upon tail amputation, due 306
to the inability of Sox2-knockout cells to ‘change gears’ in response to injury (Fei et al., 2014). Indeed, 307
while Sox2-knockout cells express PCNA like their SOX2+ counterparts and are therefore able to 308
proliferate, their lower incorporation of the thymidine analog 5-ethynyl-2’-deoxyuridine (EdU) indicates 309
that they cannot speed up their cell cycle (Fei et al., 2014). Our findings highlight the importance of 310
careful quantification of cell proliferation and of mathematical modeling to understand the mechanisms 311
.CC-BY 4.0 International licensenot peer-reviewed) is the author/funder. It is made available under aThe copyright holder for this preprint (which was. http://dx.doi.org/10.1101/067785doi: bioRxiv preprint first posted online Aug. 4, 2016;
13
of regeneration. Moreover, our detailed spatial and temporal characterization of cell proliferation might 312
help to focus the search for key signals that might be operating in the high-proliferation zone to speed 313
up the cell cycle of regenerative neural stem cells. It will be interesting to see whether the expression 314
of AxMLP, the recently identified regeneration-initiating factor in axolotls (Sugiura et al., 2016), 315
correlates in time and space with the high-proliferation zone. 316
By tracking cells during regeneration, we found that cells move along the AP axis of the spinal 317
cord but maintain their relative position: cells move faster the closer they are to the amputation plane 318
(Figure 2J,K). In line with earlier work (Mchedlishvili et al., 2007), we found that cells initially located 319
within the 500 μm anterior to the amputation plane move fast enough to contribute to the regenerated 320
spinal cord; while cells outside this zone move slower, and cells at 800 μm, the border of the high-321
proliferation zone, almost do not move. This is consistent with a model in which cells are passively 322
displaced, pushed by more anterior dividing cells. In this model, the more posterior a cell is the more 323
cells anterior to that cell divide and the stronger is the push, making the cell move faster (Figure 4). 324
Importantly, the proliferative response extends beyond the 500 μm anterior to the amputation plane 325
that gives rise to the regenerated spinal cord (Mchedlishvili et al., 2007). In the light of this model, it is 326
plausible that cells in the posterior 500 μm of the high-proliferation zone produce the regenerated 327
spinal cord posterior to the amputation plane. Simultaneously cells from the anterior 300 μm of the 328
high-proliferation zone replenish and push out the posterior 500 μm. 329
A notable finding of this study is that the increase in cell numbers during regeneration is tightly 330
regulated so that the regenerating spinal cord extends while maintaining constant cell density and its 331
proper tube-like structure. This tube-like structure made up almost entirely of neural stem cells might 332
be essential to act as a scaffold for rebuilding the complete spinal cord tissue architecture. Previously, 333
we showed that the activation of PCP signaling within the source zone instructs cells to divide along 334
the growing axis of the spinal cord and is key for effective spinal cord regeneration. This work 335
highlights the importance of orderly and directed expansion of the neural stem cell pool for efficient 336
spinal cord regeneration. 337
Together, our findings provide a quantitative mechanistic understanding of the cellular 338
mechanisms that drive complete spinal cord regeneration in axolotls. By performing a quantitative 339
modeling approach combined with quantitative experimental data, we found that axolotl spinal cord 340
outgrowth is driven by the acceleration of the cell cycle in a pool of SOX2+ neural stem cells restricted 341
.CC-BY 4.0 International licensenot peer-reviewed) is the author/funder. It is made available under aThe copyright holder for this preprint (which was. http://dx.doi.org/10.1101/067785doi: bioRxiv preprint first posted online Aug. 4, 2016;
14
in space and time. Whether this peculiar spatiotemporal proliferative pattern is unique to the axolotl 342
and how this correlates with injury-induced signals remain to be elucidated. 343
344
Materials and methods 345
Axolotls 346
Axolotls, Ambystoma mexicanum, from 2 to 3 cm in length snout-to-tail were used for 347
experiments. Axolotls were kept in tap water in individual cups and fed daily with Artemia. Before any 348
manipulation or imaging, axolotls were anaesthetized in 0.01% benzocaine. The axolotl animal work 349
was performed under permission granted in animal license number DD24-9168.11-1/2012-13 350
conferred by the Animal Welfare Commission of the State of Saxony, Germany (Landesdirektion 351
Sachsen). 352
Measurement of spinal cord outgrowth 353
Images of regenerating tails were acquired on an Olympus SZX16 stereomicroscope using the 354
Cell^F software by Olympus. Spinal cord outgrowth was measured from bright field images in Fiji. 355
First, the amputation plane which is clearly visible in the myotome was marked with a line. Then, the 356
length between the intersection of the amputation plane with the spinal cord and the spinal cord tip 357
was measured with Fiji's line tool. 358
Cell count data 359
The cell count data of SOX2+ and SOX2+/PCNA+ cells per cross section and mitotic cells in 360
50 µm sections were taken from Rodrigo Albors et al., 2015. 361
Spatial model of cell counts to analyze the spatiotemporal pattern of proliferation 362
To test whether the SOX2+ cells per cross section showed a spatial pattern along the AP axis 363
or not, we used three different methods (Figure 2B,B’, Supplementary Figure 1). First, it was tested if 364
the cell count data linearly depends on spatial position along the AP axis using Bayesian inference 365
(see Supplementary notebook “Constant Density”). The slope was always smaller than 0.13 cells / mm 366
and only significantly different from 0 (p < 0.05) for 4 of the 15 replicates. Second, a model of two 367
.CC-BY 4.0 International licensenot peer-reviewed) is the author/funder. It is made available under aThe copyright holder for this preprint (which was. http://dx.doi.org/10.1101/067785doi: bioRxiv preprint first posted online Aug. 4, 2016;

15
spatially homogeneous zones was fitted to the data using Bayesian inference (see Supplementary 368
notebook “Constant Density”). Here, only 4 of the 15 replicates showed a significant difference in 369
density between the two zones (p < 0.05). These first two methods indicated that, for an average 370
animal, there is no significant change of the number of SOX2+ cells per cross section along the AP 371
axis. Third, the data was collapsed ignoring the spatial position, and the resulting cell count histogram 372
was tested for being a normal distribution using the SciPy function scipy.stats.normaltest (D’agostino, 373
1971; D’agostino and Pearson, 1973). Only for one of the replicates the null hypothesis could be 374
rejected (p < 0.05), hence SOX2+ cell density in an average animal was considered spatially 375
homogeneous with Gaussian noise in this study. 376
For each replicate the mean number of SOX2+ cells per cross section averaged over all 377
measurements along the AP axis was calculated. To access whether there was a significant change in 378
this mean number, the replicates were grouped according to their time post amputation. A one-way 379
ANOVA-test showed no significant differences among the groups (p = 0.08, see Supplementary 380
Notebook “Constant Density”). 381
Analysis of proliferation count data 382
The counts of SOX2+ cells, SOX2+/PCNA+ cells and mitotic cells were analyzed by fitting a 383
mathematical model of two adjacent spatial proliferation zones to the data of each time point (Figure 384
2E,E’, Figure 2 – figure supplement 3). 385
The model that predicts the number of SOX2+/PCNA+cells per cross section and the number 386
of mitotic cells in three-dimensional (3D) 50 µm sections based on the growth fraction and mitotic 387
index was defined as follows: If the number of SOX2+ cells for a specific cross section along the AP 388
axis, NS, had been measured, it was used for this section. If the data for the specific section was 389
missing, NS was computed by assuming that there is a constant expected number of SOX2+ cells per 390
cross section and that the deviations from the expected value follow a normal distribution. The mean 391
and standard deviation of this normal distribution were estimated by the sample mean and standard 392
deviation of the sample of the measured numbers of SOX2+ cells per cross section for each replicate, 393
respectively. The number of SOX2+ in a cross section is independent from other cross sections. The 394
state ‘Proliferative’, i.e. SOX2+/PCNA+, is independently assigned to each SOX2+ cell with probability 395
pp or ‘Quiescent’ with probability 1 – pp (Figure 2D). Hence, for a given number of SOX2+ cells in a 396
.CC-BY 4.0 International licensenot peer-reviewed) is the author/funder. It is made available under aThe copyright holder for this preprint (which was. http://dx.doi.org/10.1101/067785doi: bioRxiv preprint first posted online Aug. 4, 2016;
16
cross section, NS, the number of SOX2+/PCNA+ cells per cross section, NP, follows a binomial 397
distribution with Ns experiments and success probability pp. Consequently, the expected growth 398
fraction equals pp. As the number of mitotic cells, NM, in 3D 50 µm sections was measured previously, 399
we estimated the number of SOX2+/PCNA+ cells also in a 3D 50 µm section, 𝑁𝑃𝑆 = 50 𝜇𝑚/𝑙𝑐𝑒𝑙𝑙 ⋅ 𝑁𝑃, 400
where 𝑙𝑐𝑒𝑙𝑙 = 13.2 ± 0.1 𝜇𝑚 is the mean AP length of SOX2+ cells (Rodrigo Albors et al., 2015). 401
Assuming that the cell cycle position and hence the cell cycle phase of each cell is independent of all 402
other cells, the state ‘Proliferative, mitotic’ is independently assigned to each SOX2+/PCNA+ cell with 403
probability pm or ‘Proliferative, non-mitotic’ with probability 1 – pm . Hence, the number of mitotic cells 404
per section, NM, follows a binomial distribution with NPS experiments and success probability pm. 405
Consequently, the expected mitotic index equals pm. For given values of pp and pm the model gives a 406
likelihood for the observed number of SOX2+/PCNA+ cells per cross section and mitotic cells per 3D 407
section that can be used to fit the model parameters. To reflect the assumption of two spatial 408
proliferation zones, pp and pm have spatial dependencies in the form of step functions (Figure 2D’). 409
Hence, there can be different growth fractions and mitotic indices for the anterior and the posterior 410
zone, respectively. The spatial position of the border between the zones is another model parameter 411
termed switchpoint. Furthermore, variability between replicates in the switchpoint is modeled as a 412
normal distribution with standard deviation 𝜎𝑠𝑤𝑖𝑡𝑐ℎ . Likewise, variability in growth fraction and mitotic 413
index between replicates is modeled with a normal distribution with spatially homogeneous standard 414
deviations 𝜎𝐺𝐹 and 𝜎𝑚𝑖, respectively. Hence, the resulting model to describe the cell count data of all 415
replicates at a given time point has 8 parameters: the switch-point, growth fraction and mitotic index in 416
the anterior zone and in the posterior zone, respectively, and the inter-replicate variabilities 𝜎𝑠𝑤𝑖𝑡𝑐ℎ, 𝜎𝐺𝐹 417
and 𝜎𝑚𝑖. Those parameters were estimated with Bayesian inference using uniform priors for uninjured 418
animals and at 3, 4, 6 and 8 days. Fitting was performed using a Markov chain Monte Carlo algorithm 419
implemented in pymc (Figure 2F-F’’, Supplementary Figure 2,3, see also Supplementary notebook 420
“step_model_fixed_density_fit_per_timepoint”). To verify the fitting procedure, test data were created 421
by simulating our model with picked parameter values. These ‘’true’’ parameter values were then 422
found to be included in the 95% credibility intervals of the parameter values inferred from the test data 423
with our fitting procedure. 424
.CC-BY 4.0 International licensenot peer-reviewed) is the author/funder. It is made available under aThe copyright holder for this preprint (which was. http://dx.doi.org/10.1101/067785doi: bioRxiv preprint first posted online Aug. 4, 2016;

17
Proliferation rate time-course 425
The cell cycle length at day 6 was estimated previously using a cumulative 5-bromo-2'-426
deoxyuridine (BrdU) labelling approach (Rodrigo Albors et al., 2015). For the sake of consistent 427
methodology within the present study, the data were reanalyzed with bootstrapping using case 428
resampling (see Supplementary Notebook “brdu_bootstrapping_day6”). In agreement with the 429
previous analysis the cell cycle length was estimated as 117 ± 12 h corresponding to a proliferation 430
rate of 0.21 ± 0.02 per day at 6 days after amputation. 431
As the mitotic index is proportional to the proliferation rate (Smith & Dendy, 1962), the mitotic 432
index time-course in the high-proliferation zone was rescaled with the proliferation rate at day 6 to 433
obtain the proliferation rate time-course: 434
𝑟(𝑡) =𝑚𝑖(𝑡)
𝑚𝑖(𝑑𝑎𝑦 6)𝑟(𝑑𝑎𝑦 6), 435
where r(t) is the proliferation rate at time t, and mi is the mitotic index. The mitotic index in the 436
high-proliferation zone was estimated as described in (Rodrigo Albors et al., 2015). 437
Axolotl spinal cord electroporation 438
Axolotl larvae (2 cm snout-to-tail) were electroporated with a dual fluorescent reporter plasmid 439
(cytoplasmic eGFP and nuclear Cherry). Cells were electroporated by cutting the tail of 2 cm-long 440
larval axolotls and inserting a DNA-filled electrode into the spinal cord (Echeverri & Tanaka 2003). To 441
transfect DNA into only a few cells, optimum electroporation conditions were three pulses of 50 V, 200 442
Hz and a length of 100 ms, applied using an SD9 Stimulator (Grass Telefactor, West Warwick, RI). 443
In vivo imaging of labeled cells in the spinal cord 444
Axolotls with sparsely labelled cells in the spinal cord were amputated, leaving cells at 445
different distances from the amputation plane. Regenerating axolotls were anaesthetized and imaged 446
every 1-2 days by placing them on a cover slip. Labelled cells were imaged using a Zeiss Apotome A1 447
microscope. 448
Clone tracking 449
The distance between the amputation plane and the anterior border of a clone was measured 450
manually in each image using AxioVision microscopy software. 451
.CC-BY 4.0 International licensenot peer-reviewed) is the author/funder. It is made available under aThe copyright holder for this preprint (which was. http://dx.doi.org/10.1101/067785doi: bioRxiv preprint first posted online Aug. 4, 2016;
18
Clone velocity 452
To estimate the mean velocity of clones at different spatial positions, the space along the AP 453
axis was subdivided into 800 μm bins. For each clone trajectory, the position measurements were 454
grouped according to these bins. Groups containing less than 2 measurements were excluded. The 455
average clone velocity for each group was estimated with linear regression. Then, the mean and 456
standard deviation of the velocity of all the clones in a bin was calculated. 457
Mechanistic model of spinal cord outgrowth 458
To simultaneously evaluate the importance of cell proliferation, cell influx and activation of 459
quiescent cells in the outgrowth of the spinal cord we performed a data-driven modeling approach 460
(Greulich & Simons 2016; Rué & Martinez Arias, 2015; Oates et al., 2009). This approach allows to 461
establish causal relationship between the individually quantified cellular processes and it has been 462
previously employed to unravel the stem cell dynamics during spinal cord development in chick and 463
mouse (Kicheva et al., 2014). Although less frequent so far, modeling is more and more being used in 464
the regeneration arena (Durant et al., 2016; for an overview see Chara et al., 2014). In this study we 465
model the number of proliferating and quiescent cells in the high-proliferation zone by the following 466
ordinary differential equations (Fig. 4A): 467
d𝑁𝑝
d𝑡 = 𝑟(𝑡) 𝑁𝑝⏞
cell divisions
+ 𝑘 𝑁𝑞⏞activation
+𝑁𝑝
𝑁𝑝 + 𝑁𝑞𝑣 𝜌
⏞ influx
, 𝑁𝑝(𝑡 = 0) = 𝑁𝑝0 (3)
d𝑁𝑞
d𝑡= − 𝑘 𝑁𝑞 +
𝑁𝑞
𝑁𝑝 + 𝑁𝑞𝑣 𝜌, 𝑁𝑞(𝑡 = 0) = 𝑁𝑞
0 (4)
468
where 𝑁𝑝0 and 𝑁𝑞
0 are the initial cell numbers in this zone, r(t) is the proliferation rate at time t, 469
v is the velocity of cells 800 m anterior to the amputation plane, is the line density of cells along the 470
AP axis and k is the quiescent cell activation rate. The factors Np/q / (Np + Nq) ensure that the influx of 471
cells into the high-proliferation zone does not alter the growth fraction. As the density is constant one 472
can write 473
𝜌 ⋅ (𝐿 + 𝐿0) = 𝑁𝑝 + 𝑁𝑞 , (5) 474
where L is the outgrowth posterior to the amputation plane and L0 = 800 µm is the high-475
proliferation zone length at t = 0. Using this relation and the definition of the growth fraction GF, 476
.CC-BY 4.0 International licensenot peer-reviewed) is the author/funder. It is made available under aThe copyright holder for this preprint (which was. http://dx.doi.org/10.1101/067785doi: bioRxiv preprint first posted online Aug. 4, 2016;
19
𝐺𝐹 =𝑁𝑝
𝑁𝑝 +𝑁𝑞, (6) 477
the cell number model was reformulated as a model for outgrowth and growth fraction (see 478
Results, equations (1) and (2)). 479
The assumption that the population mean model parameters can be used to estimate the 480
population mean outgrowth time-course was used when simulating the model and interpreting results. 481
The confidence intervals of the model prediction were estimated with a Monte Carlo approach using 482
bootstrapping with a case resampling scheme (100,000 iterations). In each iteration we case-483
resampled the cell count data, the BrdU incorporation data and the clone trajectory data, and 484
calculated the proliferation rate time-course, clone velocity at -800 µm and initial growth fraction from 485
this resampled data as described above. Then, in each iteration, these bootstrapped parameter values 486
were used to estimate the activation rate k by fitting the model prediction of the growth fraction to the 487
data (Fig. 4B). The growth fraction measurement of day 8 was excluded from the fit because its 488
precise value would only affect the model prediction after this day. Now, as all parameters were 489
estimated, an outgrowth trajectory was calculated for each iteration. This ensemble of trajectories was 490
used to calculate the confidence intervals of the model prediction (Fig. 4C). The same approach was 491
used for the model scenarios with individual cell mechanisms turned off (Fig. 4D-G). The source code 492
is available in the supplementary notebook “lg_model”. 493
Coordinate system 494
Time starts with the event of amputation. For spatial positions along the AP axis of the spinal 495
cord, the amputation plane defines 0; positive values refer to positions posterior to the amputation 496
plane, in regenerated tissue; negative values refer to positions anterior to the amputation plane. In all 497
images, anterior is to the left. 498
Statistics and computational tools 499
If not stated otherwise, measurements are reported as mean ± standard error of the mean. In 500
the figures * denotes p < 0.05 and ** denotes p < 0.01 for the respective test as indicated in the figure 501
caption. 502
.CC-BY 4.0 International licensenot peer-reviewed) is the author/funder. It is made available under aThe copyright holder for this preprint (which was. http://dx.doi.org/10.1101/067785doi: bioRxiv preprint first posted online Aug. 4, 2016;

20
Image analysis was performed with Fiji (Schindelin et al., 2012) and AxioVision Microscopy 503
software (Zeiss). Data analysis was performed using the python modules bokeh 504
(http://bokeh.pydata.org), iminuit (http://github.com/iminuit/iminuit), ipycache 505
(http://github.com/rossant/ipycache), Jupyter Notebook (http://jupyter.org/), matplotlib (Hunter, 2007), 506
numba (http://numba.pydata.org/), pandas (McKinney, 2010), probfit (http://github.com/iminuit/probfit), 507
pymc (Patil et al., 2010), SciPy (Jones et al., 2001) and uncertainties 508
(http://pythonhosted.org/uncertainties/). 509
Supplementary notebooks 510
Jupyter Notebooks containing the source code for all computations performed together with 511
the data and referred to as individually named supplementary notebooks in this work can be found 512
under http://dx.doi.org/10.5281/zenodo.58951. 513
514
Acknowledgements 515
We are grateful to Beate Gruhl, Sabine Mögel, Anja Wagner, and Heino Andreas for 516
outstanding axolotl care. We thank Nuno Barros, Emanuel Cura Costa, Keisuke Ishihara, Jörn Starruß 517
and Anja Voß-Böhme for helpful discussions. 518
Competing interests 519
The authors declare no competing interests. 520
Author contributions 521
FR, Conception and design, Analysis and interpretation of data, Drafting or revising the article. 522
ARA, Conception and design, Acquisition of data, Analysis and interpretation of data, Drafting or 523
revising the article. 524
VM, Acquisition of data, Drafting or revising the article. 525
LB, Analysis and interpretation of data, Drafting or revising the article. 526
AD, Drafting or revising the article. 527
EMT, Conception and design, Analysis and interpretation of data, Drafting or revising the article. 528
.CC-BY 4.0 International licensenot peer-reviewed) is the author/funder. It is made available under aThe copyright holder for this preprint (which was. http://dx.doi.org/10.1101/067785doi: bioRxiv preprint first posted online Aug. 4, 2016;
21
OC, Conception and design, Analysis and interpretation of data, Drafting or revising the article. 529
Funding 530
This work was supported by grants from the Human Frontier Science Program (HFSP) 531
RGP0016/2010, DFG-274/2-3/SFB655 'Cells into tissues', TU Dresden Graduate Academy 532
(great!ipid4all) and the Center for Regenerative Therapies to E.M.T. and Agencia Nacional de 533
Promoción Científica y Tecnológica (ANPCyT) PICT-2014-3469 'Mecanismos de Regeneración de la 534
médula espinal del Axolotl: Una aproximación de Biología de Sistemas' to O.C. and BMBF grant 535
(0316169A) to L.B. A.R.A. was funded by a DIGS-BB fellowship; F.R. and O.C. were funded by the 536
HFSP, the German Ministry for Education and Research (BMBF, grant 0316169A) and TU Dresden 537
Graduate Academy (great!ipid4all). O.C. is a career researcher from Consejo Nacional de 538
Investigaciones Científicas y Técnicas (CONICET) of Argentina. 539
References 540
Becker CG, Becker T. 2015. Neuronal regeneration from ependymo-radial glial cells: cook, little Pot, 541
cook! Dev Cell. 32(4): 516-527. doi: 10.1016/j.devcel.2015.01.001. 542
Chara O, Tanaka EM, Brusch L. 2014. Mathematical modeling of regenerative processes. Curr Top 543
Dev Biol. 108: 283-317. doi: 10.1016/B978-0-12-391498-9.00011-5. 544
D’agostino R, Pearson ES. 1973. Tests for departure from normality. Empirical results for the 545
distributions of b2 and √b1. Biometrika 60: 613–622. doi: 10.1093/biomet/60.3.613. 546
D’agostino RB. 1971. An omnibus test of normality for moderate and large size samples. Biometrika 547
58: 341–348. doi: 10.1093/biomet/58.2.341. 548
Durant F, Lobo D, Hammelman J, Levin M. 2016. Physiological controls of large-scale patterning in 549
planarian regeneration: a molecular and computational perspective on growth and form. Regeneration. 550
3(2): 78-102. doi: 10.1002/reg2.54. 551
Echeverri K, Tanaka EM. 2003. Electroporation as a tool to study in vivo spinal cord regeneration. Dev 552
Dyn. 226(2): 418-25. doi: 10.1002/dvdy.10238. 553
Fei JF, Schuez M, Tazaki A, Taniguchi Y, Roensch K, Tanaka EM. 2014. CRISPR-mediated genomic 554
deletion of Sox2 in the axolotl shows a requirement in spinal cord neural stem cell amplification during 555
tail regeneration. Stem Cell Reports. 3(3): 444-59. doi: 10.1016/j.stemcr.2014.06.018. 556
Gaete M, Muñoz R, Sánchez N, Tampe R, Moreno M, Contreras EG, Lee-Liu D, Larraín J. 2012. 557
Spinal cord regeneration in Xenopus tadpoles proceeds through activation of Sox2-positive cells. 558
Neural Dev. 7:13. doi: 10.1186/1749-8104-7-13. 559
.CC-BY 4.0 International licensenot peer-reviewed) is the author/funder. It is made available under aThe copyright holder for this preprint (which was. http://dx.doi.org/10.1101/067785doi: bioRxiv preprint first posted online Aug. 4, 2016;
22
Greulich P, Simons BD. 2016. Dynamic heterogeneity as a strategy of stem cell self-renewal. Proc 560
Natl Acad Sci U S A. 113(27): 7509-14. doi: 10.1073/pnas.1602779113. 561
Holtzer SW. 1956. The inductive activity of the spinal cord in urodele tail regeneration. J Morphol. 99: 562
1-39. doi: 10.1002/jmor.1050990102. 563
Hui SP, Dutta A, Ghosh S. 2010. Cellular response after crush injury in adult zebrafish spinal cord. 564
Dev Dyn. 239(11): 2962-79. doi: 10.1002/dvdy.22438. 565
Hui SP, Nag TC, Ghosh S. 2015. Characterization of proliferating neural progenitors after spinal cord 566
injury in adult zebrafish. PLoS One. 10(12): e0143595. doi: 10.1371/journal.pone.0143595. 567
Hunter JD. 2007. Matplotlib: A 2D Graphics environment. Comput Sci Eng. 9: 90–95. doi: 568
10.1109/MCSE.2007.55. 569
Jones E, Oliphant T, Peterson P et al., 2001. SciPy: Open source scientific tools for Python. 570
http://www.scipy.org/ 571
Kicheva A, Bollenbach T, Ribeiro A, Valle HP, Lovell-Badge R, Episkopou V, Briscoe J. 2014. 572
Coordination of progenitor specification and growth in mouse and chick spinal cord. Science. 573
345(6204): 1254927. doi: 10.1126/science.1254927. 574
Lacroix S, Hamilton LK, Vaugeois A, Beaudoin S, Breault-Dugas C, Pineau I, Lévesque SA, Grégoire 575
CA, Fernandes KJ. 2014. Central canal ependymal cells proliferate extensively in response to 576
traumatic spinal cord injury but not demyelinating lesions. PLoS One. 9(1):e85916. doi: 577
10.1371/journal.pone.0085916. 578
Mchedlishvili L, Epperlein HH, Telzerow A, Tanaka EM. 2007. A clonal analysis of neural progenitors 579
during axolotl spinal cord regeneration reveals evidence for both spatially restricted and multipotent 580
progenitors. Development. 134(11): 2083-93. doi: 10.1242/dev.02852. 581
McKinney W. 2010. Data structures for statistical computing in Python. In: van der Walt S & Millman J, 582
editors. Proceedings of the 9th Python in Science Conference. p. 51–56. 583
Oates AC, Gorfinkiel N, González-Gaitán M, Heisenberg CP. 2009. Quantitative approaches in 584
developmental biology. Nat Rev Genet. 10(8): 517-30. doi: 10.1038/nrg2548. 585
Patil A, Huard D, Fonnesbeck CJ. 2010. PyMC: Bayesian stochastic modelling in Python. J Stat Softw. 586
35: 1–81. doi: 10.18637/jss.v035.i04. 587
Rodrigo Albors A, Tazaki A, Rost F, Nowoshilow S, Chara O,Tanaka EM. 2015. Planar cell polarity-588
mediated induction of neural stem cell expansion during axolotl spinal cord regeneration. eLife 589
e10230. doi: 10.7554/eLife.10230. 590
Rué P, Martinez Arias A. 2015. Cell dynamics and gene expression control in tissue homeostasis and 591
development. Mol Syst Biol. 11(1):792. doi: 10.15252/msb.20145549. 592
Schindelin J, Arganda-Carreras I, Frise E., Kaynig V, Longair M, Pietzsch T, Preibisch S, Rueden C, 593
Saalfeld S, Schmid B, Tinevez JY, White DJ, Hartenstein V, Eliceiri K, Tomancak P, Cardona A. 2012. 594
.CC-BY 4.0 International licensenot peer-reviewed) is the author/funder. It is made available under aThe copyright holder for this preprint (which was. http://dx.doi.org/10.1101/067785doi: bioRxiv preprint first posted online Aug. 4, 2016;

23
Fiji: an open-source platform for biological-image analysis. Nat Methods. 9: 676–682. doi: 595
10.1038/nmeth.2019. 596
Smith C, Dendy PP. 1962. Relation between mitotic index, duration of mitosis, generation time and 597
fraction of dividing cells in a cell population. Nature 193: 555–556. doi: 10.1038/193555a0. 598
Sugiura T, Wang H, Barsacchi R, Simon A, Tanaka EM. 2016. MARCKS-like protein is an initiating 599
molecule in axolotl appendage regeneration. Nature. 531(7593): 237-40. doi: 10.1038/nature16974. 600
Tanaka EM, Ferretti P. 2009. Considering the evolution of regeneration in the central nervous system. 601
Nat Rev Neurosci. 10(10): 713-23. doi: 10.1038/nrn2707. 602
603
.CC-BY 4.0 International licensenot peer-reviewed) is the author/funder. It is made available under aThe copyright holder for this preprint (which was. http://dx.doi.org/10.1101/067785doi: bioRxiv preprint first posted online Aug. 4, 2016;
24
Figure supplements 604
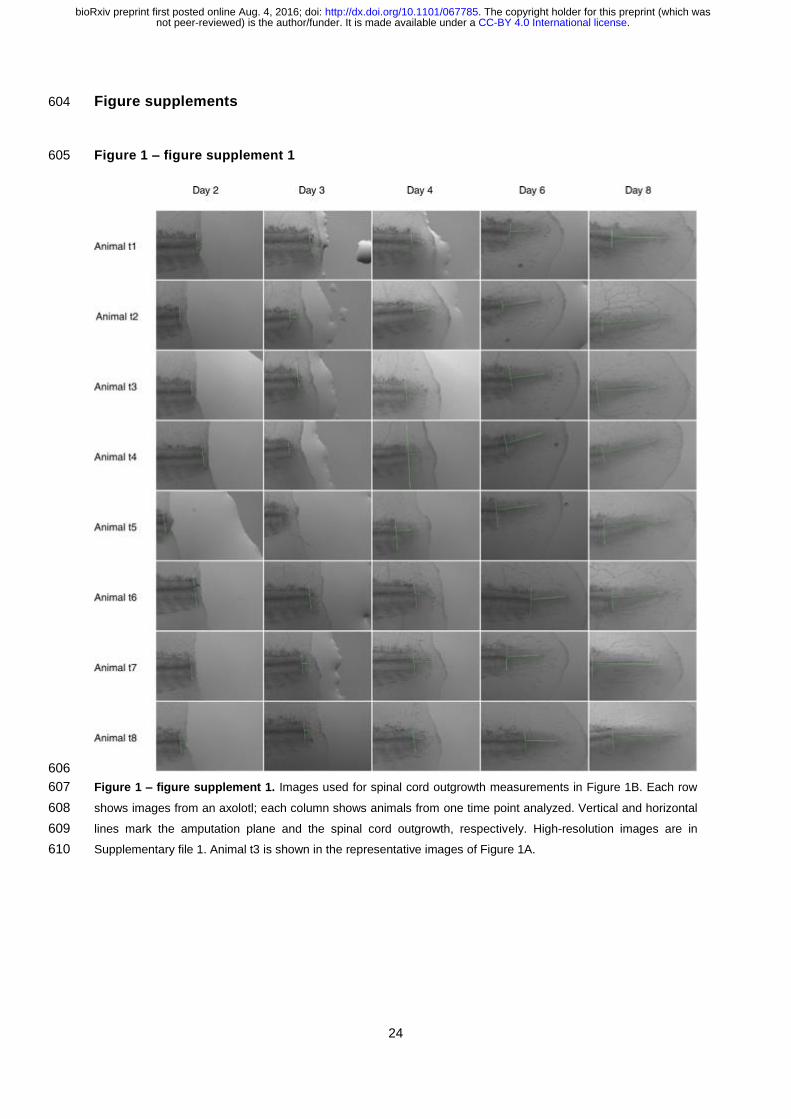
Figure 1 – figure supplement 1 605
606
Figure 1 – figure supplement 1. Images used for spinal cord outgrowth measurements in Figure 1B. Each row 607
shows images from an axolotl; each column shows animals from one time point analyzed. Vertical and horizontal 608
lines mark the amputation plane and the spinal cord outgrowth, respectively. High-resolution images are in 609
Supplementary file 1. Animal t3 is shown in the representative images of Figure 1A. 610
.CC-BY 4.0 International licensenot peer-reviewed) is the author/funder. It is made available under aThe copyright holder for this preprint (which was. http://dx.doi.org/10.1101/067785doi: bioRxiv preprint first posted online Aug. 4, 2016;

25
Figure 2 – figure supplement 1 611
612
Figure 2 – figure supplement 1. Number of SOX2+ cells per cross section along the AP axis for all 15 animals. 613
Each row shows data from three animals at a given time point. Data from animals 0D_1 and 4D_3 are shown as 614
representative data in Figure 2B and B’, respectively. 615
.CC-BY 4.0 International licensenot peer-reviewed) is the author/funder. It is made available under aThe copyright holder for this preprint (which was. http://dx.doi.org/10.1101/067785doi: bioRxiv preprint first posted online Aug. 4, 2016;
26
Figure 2 – figure supplement 2 616
617
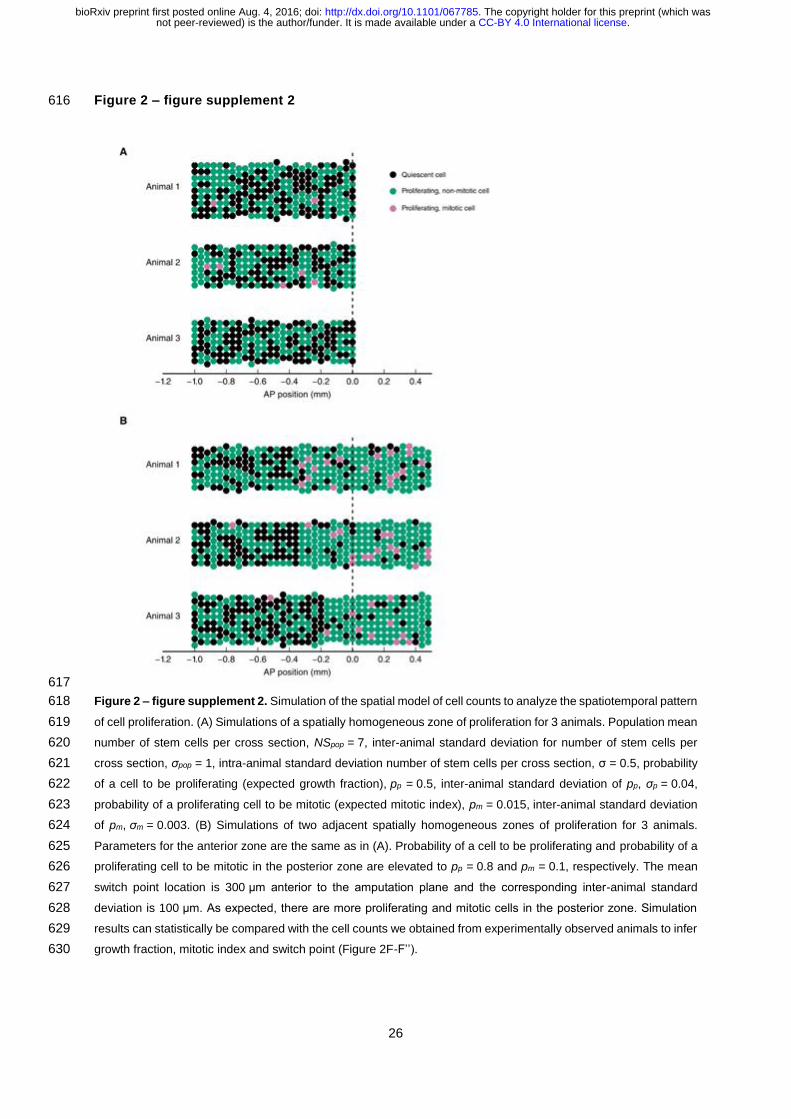
Figure 2 – figure supplement 2. Simulation of the spatial model of cell counts to analyze the spatiotemporal pattern 618
of cell proliferation. (A) Simulations of a spatially homogeneous zone of proliferation for 3 animals. Population mean 619
number of stem cells per cross section, NSpop = 7, inter-animal standard deviation for number of stem cells per 620
cross section, σpop = 1, intra-animal standard deviation number of stem cells per cross section, σ = 0.5, probability 621
of a cell to be proliferating (expected growth fraction), pp = 0.5, inter-animal standard deviation of pp, σp = 0.04, 622
probability of a proliferating cell to be mitotic (expected mitotic index), pm = 0.015, inter-animal standard deviation 623
of pm, σm = 0.003. (B) Simulations of two adjacent spatially homogeneous zones of proliferation for 3 animals. 624
Parameters for the anterior zone are the same as in (A). Probability of a cell to be proliferating and probability of a 625
proliferating cell to be mitotic in the posterior zone are elevated to pp = 0.8 and pm = 0.1, respectively. The mean 626
switch point location is 300 μm anterior to the amputation plane and the corresponding inter-animal standard 627
deviation is 100 μm. As expected, there are more proliferating and mitotic cells in the posterior zone. Simulation 628
results can statistically be compared with the cell counts we obtained from experimentally observed animals to infer 629
growth fraction, mitotic index and switch point (Figure 2F-F’’). 630
.CC-BY 4.0 International licensenot peer-reviewed) is the author/funder. It is made available under aThe copyright holder for this preprint (which was. http://dx.doi.org/10.1101/067785doi: bioRxiv preprint first posted online Aug. 4, 2016;
27
Figure 2 – figure supplement 3 631
632
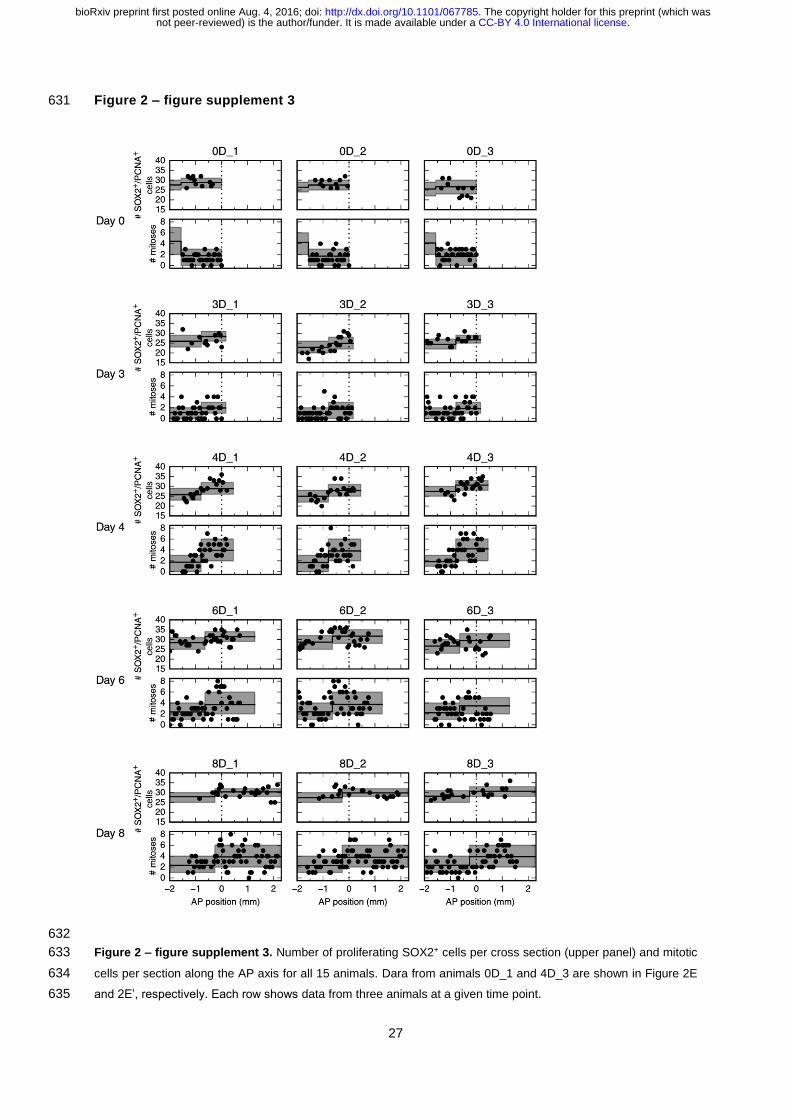
Figure 2 – figure supplement 3. Number of proliferating SOX2+ cells per cross section (upper panel) and mitotic 633
cells per section along the AP axis for all 15 animals. Dara from animals 0D_1 and 4D_3 are shown in Figure 2E 634
and 2E’, respectively. Each row shows data from three animals at a given time point. 635
.CC-BY 4.0 International licensenot peer-reviewed) is the author/funder. It is made available under aThe copyright holder for this preprint (which was. http://dx.doi.org/10.1101/067785doi: bioRxiv preprint first posted online Aug. 4, 2016;
28
Figure 2 – figure supplement 4 636
637
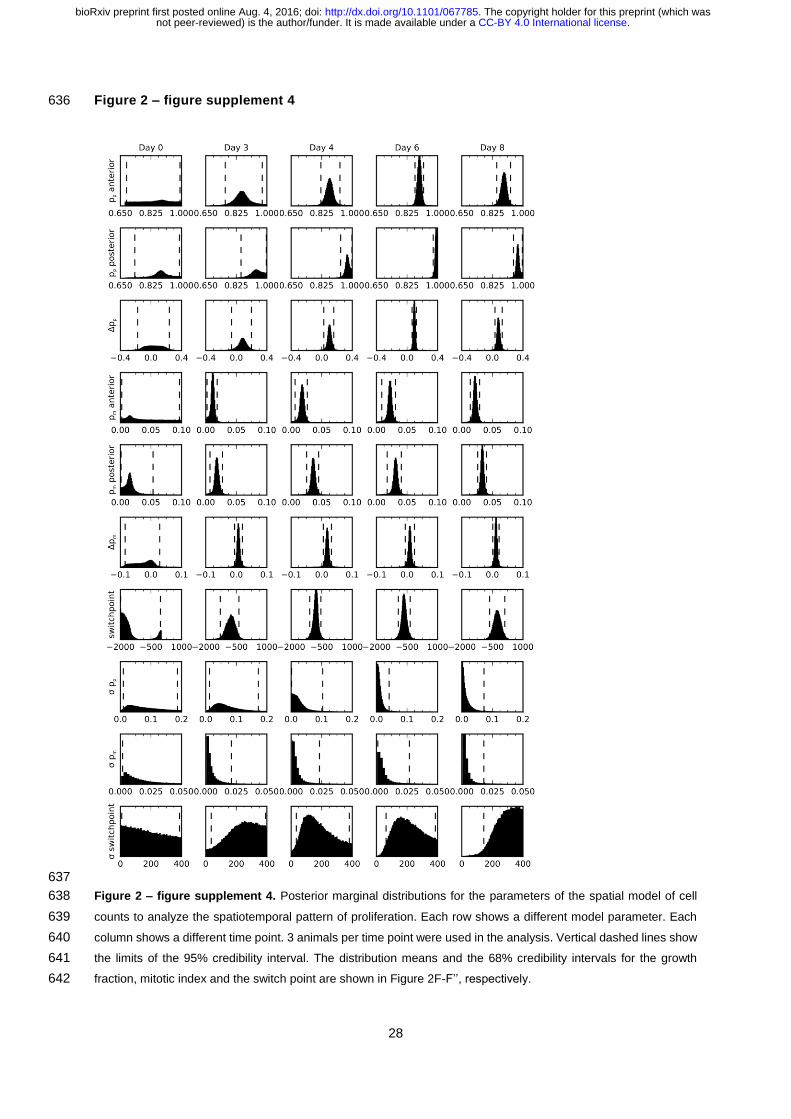
Figure 2 – figure supplement 4. Posterior marginal distributions for the parameters of the spatial model of cell 638
counts to analyze the spatiotemporal pattern of proliferation. Each row shows a different model parameter. Each 639
column shows a different time point. 3 animals per time point were used in the analysis. Vertical dashed lines show 640
the limits of the 95% credibility interval. The distribution means and the 68% credibility intervals for the growth 641
fraction, mitotic index and the switch point are shown in Figure 2F-F’’, respectively. 642
.CC-BY 4.0 International licensenot peer-reviewed) is the author/funder. It is made available under aThe copyright holder for this preprint (which was. http://dx.doi.org/10.1101/067785doi: bioRxiv preprint first posted online Aug. 4, 2016;

29
Figure 2 – figure supplement 5 643
644
Figure 2 – figure supplement 5. Cell cycle length time-course calculated from the proliferation rate time-course 645
shown in Figure 2G. 646
647
.CC-BY 4.0 International licensenot peer-reviewed) is the author/funder. It is made available under aThe copyright holder for this preprint (which was. http://dx.doi.org/10.1101/067785doi: bioRxiv preprint first posted online Aug. 4, 2016;
30
Figure 3 – figure supplement 1 648
649
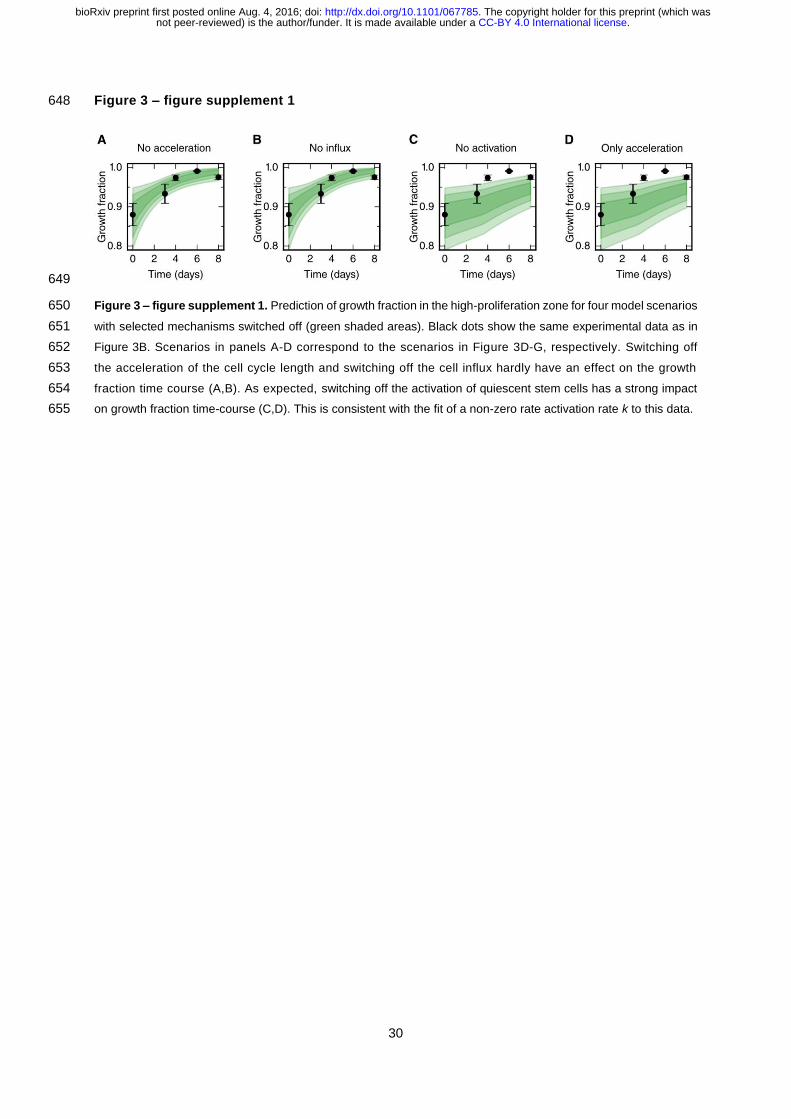
Figure 3 – figure supplement 1. Prediction of growth fraction in the high-proliferation zone for four model scenarios 650
with selected mechanisms switched off (green shaded areas). Black dots show the same experimental data as in 651
Figure 3B. Scenarios in panels A-D correspond to the scenarios in Figure 3D-G, respectively. Switching off 652
the acceleration of the cell cycle length and switching off the cell influx hardly have an effect on the growth 653
fraction time course (A,B). As expected, switching off the activation of quiescent stem cells has a strong impact 654
on growth fraction time-course (C,D). This is consistent with the fit of a non-zero rate activation rate k to this data. 655
.CC-BY 4.0 International licensenot peer-reviewed) is the author/funder. It is made available under aThe copyright holder for this preprint (which was. http://dx.doi.org/10.1101/067785doi: bioRxiv preprint first posted online Aug. 4, 2016;
31
Additional files 656
Supplementary file 1 657
Stack of individual high-resolution images shown together in Figure 1 – figure supplement 1. Can be 658
opened with Fiji or ImageJ. 659
Supplementary file 2 660
Zip archive containing all raw images used for the clone tracking. The image files can be opened with 661
AxioVision Microscopy software (Zeiss). Images for each individual animal are in separate folders. 662
Folder names correspond to the animal IDs used in the clone trajectory dataset (see supplementary 663
notebook “clone_velocities”). The image filename indicates the time point of the measurement and the 664
ID. 665
.CC-BY 4.0 International licensenot peer-reviewed) is the author/funder. It is made available under aThe copyright holder for this preprint (which was. http://dx.doi.org/10.1101/067785doi: bioRxiv preprint first posted online Aug. 4, 2016;
Recommended