Welwyn Hatfield Borough Council
Annual Monitoring
Report 2017/18
February 2019
www.welhat.gov.uk
2
Annual Monitoring Report 2017/18 Covering 1 April 2017 to 31 March 2018
Published February 2019
Welwyn Hatfield Borough Council Council Offices The Campus
Welwyn Garden City Hertfordshire
AL8 6AE
Tel: 01707 357532 Email: [email protected]
If you would like to receive this information in a different language or format please call 01707 357000 or email [email protected]
Contents Overall summary 4
Introduction to the AMR 6
Chapter 1: The borough and its people 7
Chapter 2: Planning for the future 12
Chapter 3: Monitoring of Local Plan policies 16
Chapter 4: Centres, Services and Facilities 19
Chapter 5: Housing 25
Chapter 6: The Economy 40
Chapter 7: Environmental Assets 47
Chapter 8: Infrastructure and Movement 53
Chapter 9: Site-Specific Monitoring 56
Appendix 1: Housing site monitoring 60
Appendix 2: Housing trajectory summary table 67 Cover photos: Top Left: New homes at Lilac Close in Hatfield Top Right: Cuffley High Street Centre Left: Folly Arch, Brookmans Park Bottom Left: Parkway, Welwyn Garden City Town Centre Bottom Right: Mill Lane, Welwyn Back Cover: The Digswell Viaduct
Except where shown, the source of the data in the AMR is Hertfordshire County Council via the CDP Smart development monitoring software.
4
Overall summary This is the 14th Annual Monitoring Report (AMR) produced by Welwyn Hatfield Borough Council. It
reports on the development progress in the borough between 1 April 2017 and 31 March 2018.
The borough and its people
The borough’s population grew at a rate of 1.0% during the year to just over 122,000. While
lower than in recent years, Welwyn Hatfield still recorded higher growth than the surrounding
authorities. Indicator BP1 explores the reasons why this should be treated cautiously;
Incidents of crime in the borough continued to increase this year to 75 per 1,000 residents.
Despite this rise, the figure for Welwyn Hatfield remained below the national average of 83.5
per 1,000. Recent improvements to reporting are expected to be at least in part behind rises
in recent years;
The health of the borough’s population generally remains good – Welwyn Hatfield scores
better than the national average for 12 of 32 indicators (although this was down slightly from
15 last year). The Borough fell below the national average in terms of diabetes diagnosis
(aged 17+) and excess winter deaths this year.
Planning for the future
The Draft Local Plan was submitted for examination on 15th May 2017;
A number of hearing sessions of the Examination in Public have taken place during the
monitoring year. Throughout this process further technical work has been requested by the
examining inspector and modifications have been proposed;
The Green Belt Study, a key piece of evidence, was commissioned and published after the
end of the 2017/18 monitoring year;
The Council has continued to work with a wide range of stakeholders and neighbouring
authorities under the Duty to Cooperate, and has a number of Memoranda of Understanding
in place setting out the outcomes of joint working.
Monitoring of Local Plan Policies
The Council’s success at appeal weakened during the year with 35% of appeals being
allowed compared with 19% in 2016/17. This was also slightly higher than the national
average of 32%.
Centres, Services and Facilities
There was a net gain in retail floorspace of over 3,900m2 during the year.
Whilst there was a significant net loss of 6,000m2 in community facilities, this was offset by
the gain in the previous year, where extensions were built before demolition works.
Within the town centres, shop vacancy increased slightly in Welwyn Garden City to 4.3%,
although still remains relatively low. Meanwhile vacancy in Hatfield is higher at 10.7%,
although saw a decline this year. This also includes ‘planned vacancy’ for the redevelopment
of 1-9 Town Centre.
5
Housing
During the year 315 net new housing units have been completed, including 238 C3
dwellings and 77 C2 residential care home dwelling equivalents;
A total of 44 new affordable homes were brought to the market during the year, accounting
for 18.5% of total net C3 dwelling completions;
The borough has a housing land supply of 3.63 years against the standard methodology and
under the 2016-based household projections. Under the 2014-based projections this falls to
3.10 years supply.
The average house price in Welwyn Hatfield was £384,503 across the 12 months April 2017
– March 2018. This was 1.3% higher than the same period the previous year. Lower quartile
house prices have increased to 12.22 times the average lower quartile income, now just
above the Hertfordshire average.
The Economy
The borough has continued to lose employment premises to other uses during the year, with
a loss of 6,000m2 of office floorspace and overall floorspace loss of 13,200m2;
These ongoing losses of employment floorspace, greater than that previously estimated and
over which the Council generally has no control, have resulted in the Council accepting
through the Local Plan examination that it may not be able to meet its established economic
needs. The implications of this are being explored through the examination;
The latest data for the number of enterprises showed a 1.5% increase in 2018. Meanwhile
the number of claimants of Job Seekers Allowance saw a minor increase to 1.3%, from 1.1%
in March 2017.
Environmental Assets
In terms of protected historic assets, there were an additional three sites in the Borough given
listed status during the monitoring year, with designations at Grade II* of Hatfield War
Memorial and Grade II of Essendon War Memorial and Captain William Leefe Robinson VC
memorial obelisk in Cuffley;
There has been no change to the number of protected natural assets (such as wildlife sites
in the borough) or to the borough’s three Green Flag Award winning open spaces –
Stanborough Park, the King George V Playing Fields, and Hatfield Lawn Cemetery, which all
retained the award.
Infrastructure and Movement
Significant progress was made on the redevelopment of Welwyn Garden City Bus Station,
which was completed and opened just after the end of the 2017/18 monitoring year;
A consultation on schemes to improve the pedestrian environment and traffic circulation
around Stonehills and Howardsgate was undertaken and a new traffic system was trialled
since the end of the monitoring year in May and June 2018;
During the year the Council received £90,000 in Section 106 funds secured from new
development, committed to a range of Borough Council projects;
Hertfordshire County Council received £708,000 in Section 106 funds from new development
during the year, funding schemes related to education and transport.
6
Introduction to the AMR
What is the AMR?
This is the 14th Annual Monitoring Report produced by Welwyn Hatfield Borough Council, and covers
the period between 1 April 2017 and 31 March 2018 (referred to throughout as ‘the year’).
AMRs serve a number of purposes:
To act as a record of the amount of development which has taken place in the borough during
the year and of how the borough’s population and places are performing;
To assess how that development meets the Council’s aspirations across a number of
indicators, and compares to the progress made in previous years;
To set out projections and expectations for future development in the borough, and act as a
feedback mechanism for policies and approaches which may need to change;
To set out the Council’s progress against its ‘Local Development Scheme’, a high-level
project plan for the production of new planning documents and policies;
To report on the Council’s efforts under its ‘duty to cooperate’ with other public authorities.
Chapters and contents
The main contents of the AMR are set out across 9 chapters, and follow the structure of the new
Local Plan. Most contain a number of specific indicators (see below) and are themed by topic:
Chapter 1 is contextual, setting out key information about the borough and its people;
Chapter 2 covers the Council’s ‘plan-making’ duties, and how it engages with the public and
cooperates with other public authorities and stakeholders;
Chapter 3 examines the effectiveness of policies for dealing with planning applications;
Chapters 4-8 cover the amount and quality of new development built in the borough;
Chapter 9 reports the development progress on the 3 Mixed Use Sites and 7 Strategic
Development Sites proposed to be allocated in the Draft Local Plan.
Indicators
In order to monitor on an effective and consistent basis and enable trends to be established, the
AMR contains a number of ‘indicators’. There are two types of indicators – Local Plan indicators, and
contextual indicators. The 36 Local Plan indicators each specifically relate to at least one policy in
the Draft Local Plan. Now that it has been submitted for examination, the majority of indicators
monitor progress against a specific target or threshold set out in the Plan, allowing it to be established
whether its objectives are being delivered effectively. The contextual indicators do not specifically
relate to Local Plan policies, but are just as crucial in indicating how the borough’s people and places
are performing. They are also an essential part of the Sustainability Appraisal process taking place
alongside the Local Plan, in helping to identify cases where an unexpected significant adverse
environmental impact might occur. Because these indicators are contextual and relate to issues
outside the Council’s direct control, it is not appropriate for them to have targets. Due to data
availability issues two contextual indicators which were reported on previously have been removed
in the 2017/18 AMR – these indicators were Town Centre footfall and bus routes and mileage.
7
This chapter introduces the borough and its context, and contains four indicators covering the borough’s population and socio-economic state.
Geography
1.1 Welwyn Hatfield is located centrally within Hertfordshire, and covers an area of approximately
130 square kilometres (12,954 hectares). The borough is bordered by Hertsmere to the
south, St Albans to the west, North Hertfordshire to the north, and East Hertfordshire and
Broxbourne to the east. The borough also has a short border with the London Borough of
Enfield to the south. Around 79% of the borough is currently designated as part of the
Metropolitan Green Belt – this is a relatively high proportion, reflecting the borough’s
extensive countryside in such close proximity to London.
1.2 Welwyn Garden City is the largest town in the borough and had an estimated population
(derived from output area data) of 46,600 at the 2011 Census – around 42% of the borough’s
total population. The other main town is Hatfield, only slightly smaller with an estimated
population of 37,200 in 2011 – around 34% of the borough’s population. Both towns have a
wide range of retail and services serving both the towns themselves and the wider local area,
as well as large regionally-significant employment areas with a particular prevalence of large
businesses and national headquarters. Hatfield is also home to the two main campuses of
the University of Hertfordshire, giving the town a notable student population and character.
1.3 The remaining 24% of the borough’s population lives in a number of smaller settlements and
in rural areas. The larger villages of Brookmans Park, Cuffley, Digswell, Oaklands & Mardley
Heath, Welham Green, Welwyn and Woolmer Green are excluded from the green belt, as is
Little Heath – a small part of the town of Potters Bar, largely in Hertsmere, but which extends
beyond the border. Most of these villages contain a good provision of retail and services;
whilst Cuffley, Welham Green and Woolmer Green also have employment areas. The Royal
Veterinary Collage is also located within the borough, south of Brookmans Park. A further
13 smaller villages and hamlets are ‘washed over’ by the green belt – as are areas of more
sporadic and ribbon development, particularly along the old Great North Road.
1.4 The nature of the borough’s location on radial routes out of London means that it is highly
accessible by rail and road. The East Coast Main Line has stations at Welwyn North (in
Digswell), Welwyn Garden City, Hatfield, Welham Green and Brookmans Park; with services
south into London and north towards Stevenage, Peterborough and Cambridge. Cuffley, in
the east of the borough, is served by trains south into London and north towards Hertford.
The A1(M) passes north-south through the borough; linking London to Peterborough, the
East Midlands and beyond, as well as connecting with the M25 just south of the borough
1. The Borough and its People
8
boundary, providing orbital connectivity around London. In addition, the A414 passes east-
west through Welwyn Hatfield and is a key cross county route connecting with other districts
within Hertfordshire.
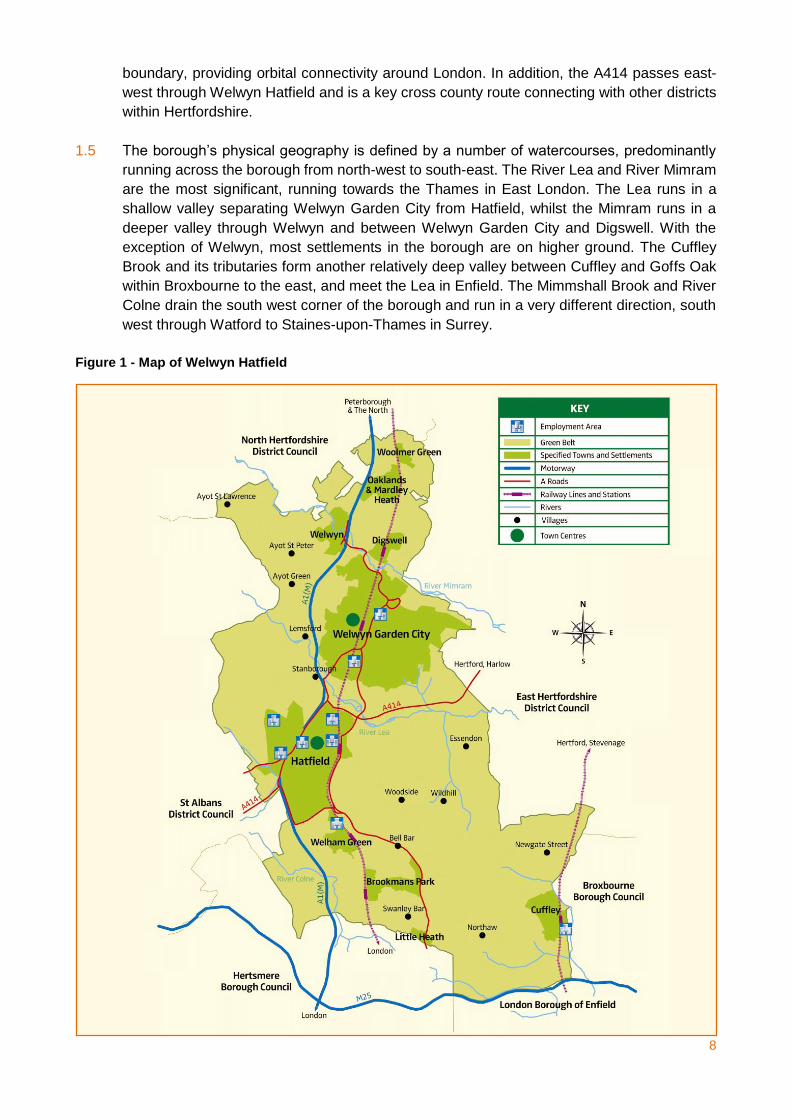
1.5 The borough’s physical geography is defined by a number of watercourses, predominantly
running across the borough from north-west to south-east. The River Lea and River Mimram
are the most significant, running towards the Thames in East London. The Lea runs in a
shallow valley separating Welwyn Garden City from Hatfield, whilst the Mimram runs in a
deeper valley through Welwyn and between Welwyn Garden City and Digswell. With the
exception of Welwyn, most settlements in the borough are on higher ground. The Cuffley
Brook and its tributaries form another relatively deep valley between Cuffley and Goffs Oak
within Broxbourne to the east, and meet the Lea in Enfield. The Mimmshall Brook and River
Colne drain the south west corner of the borough and run in a very different direction, south
west through Watford to Staines-upon-Thames in Surrey.
Figure 1 - Map of Welwyn Hatfield
9
Population
Indicator BP1 Contextual Indicator
Borough population
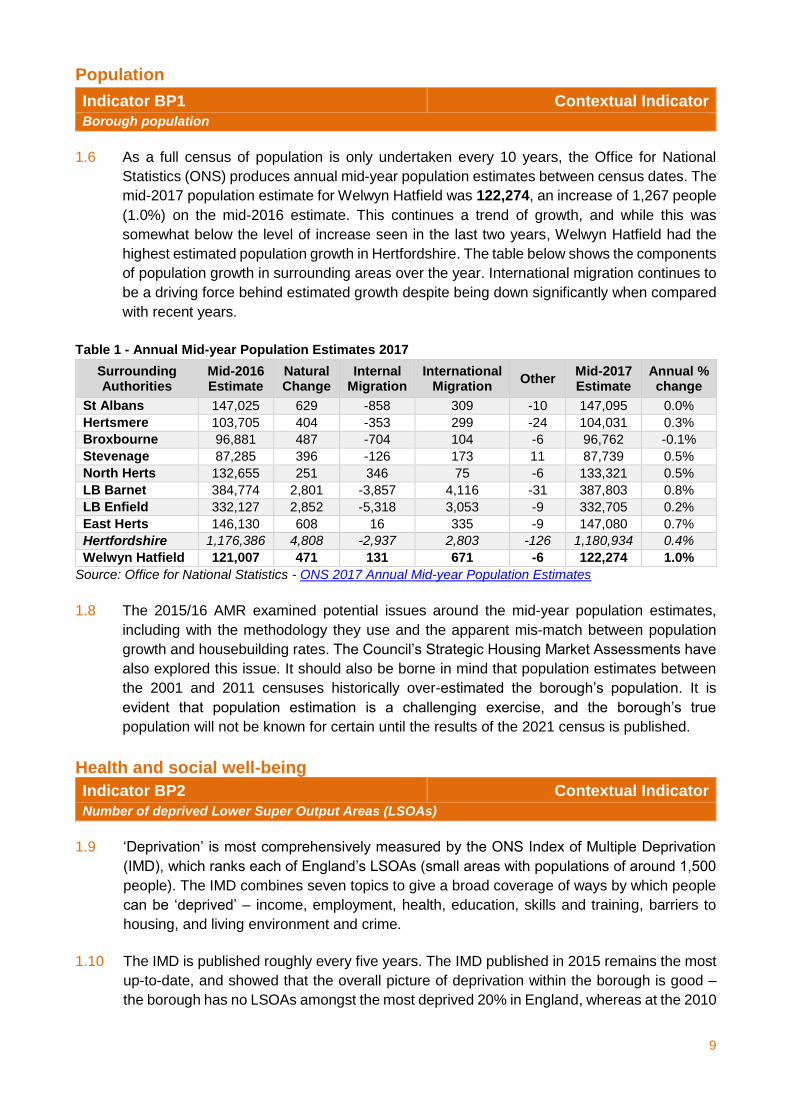
1.6 As a full census of population is only undertaken every 10 years, the Office for National
Statistics (ONS) produces annual mid-year population estimates between census dates. The
mid-2017 population estimate for Welwyn Hatfield was 122,274, an increase of 1,267 people
(1.0%) on the mid-2016 estimate. This continues a trend of growth, and while this was
somewhat below the level of increase seen in the last two years, Welwyn Hatfield had the
highest estimated population growth in Hertfordshire. The table below shows the components
of population growth in surrounding areas over the year. International migration continues to
be a driving force behind estimated growth despite being down significantly when compared
with recent years.
Table 1 - Annual Mid-year Population Estimates 2017
Surrounding Authorities
Mid-2016 Estimate
Natural Change
Internal Migration
International Migration
Other Mid-2017 Estimate
Annual % change
St Albans 147,025 629 -858 309 -10 147,095 0.0%
Hertsmere 103,705 404 -353 299 -24 104,031 0.3%
Broxbourne 96,881 487 -704 104 -6 96,762 -0.1%
Stevenage 87,285 396 -126 173 11 87,739 0.5%
North Herts 132,655 251 346 75 -6 133,321 0.5%
LB Barnet 384,774 2,801 -3,857 4,116 -31 387,803 0.8%
LB Enfield 332,127 2,852 -5,318 3,053 -9 332,705 0.2%
East Herts 146,130 608 16 335 -9 147,080 0.7%
Hertfordshire 1,176,386 4,808 -2,937 2,803 -126 1,180,934 0.4%
Welwyn Hatfield 121,007 471 131 671 -6 122,274 1.0%
Source: Office for National Statistics - ONS 2017 Annual Mid-year Population Estimates
1.8 The 2015/16 AMR examined potential issues around the mid-year population estimates,
including with the methodology they use and the apparent mis-match between population
growth and housebuilding rates. The Council’s Strategic Housing Market Assessments have
also explored this issue. It should also be borne in mind that population estimates between
the 2001 and 2011 censuses historically over-estimated the borough’s population. It is
evident that population estimation is a challenging exercise, and the borough’s true
population will not be known for certain until the results of the 2021 census is published.
Health and social well-being
Indicator BP2 Contextual Indicator
Number of deprived Lower Super Output Areas (LSOAs)
1.9 ‘Deprivation’ is most comprehensively measured by the ONS Index of Multiple Deprivation
(IMD), which ranks each of England’s LSOAs (small areas with populations of around 1,500
people). The IMD combines seven topics to give a broad coverage of ways by which people
can be ‘deprived’ – income, employment, health, education, skills and training, barriers to
housing, and living environment and crime.
1.10 The IMD is published roughly every five years. The IMD published in 2015 remains the most
up-to-date, and showed that the overall picture of deprivation within the borough is good –
the borough has no LSOAs amongst the most deprived 20% in England, whereas at the 2010
10
IMD it had one, in Hatfield Central ward. It is understood that the next IMD will be published
in Summer 2019.
Indicator BP3 Contextual Indicator
Recorded incidences of crime
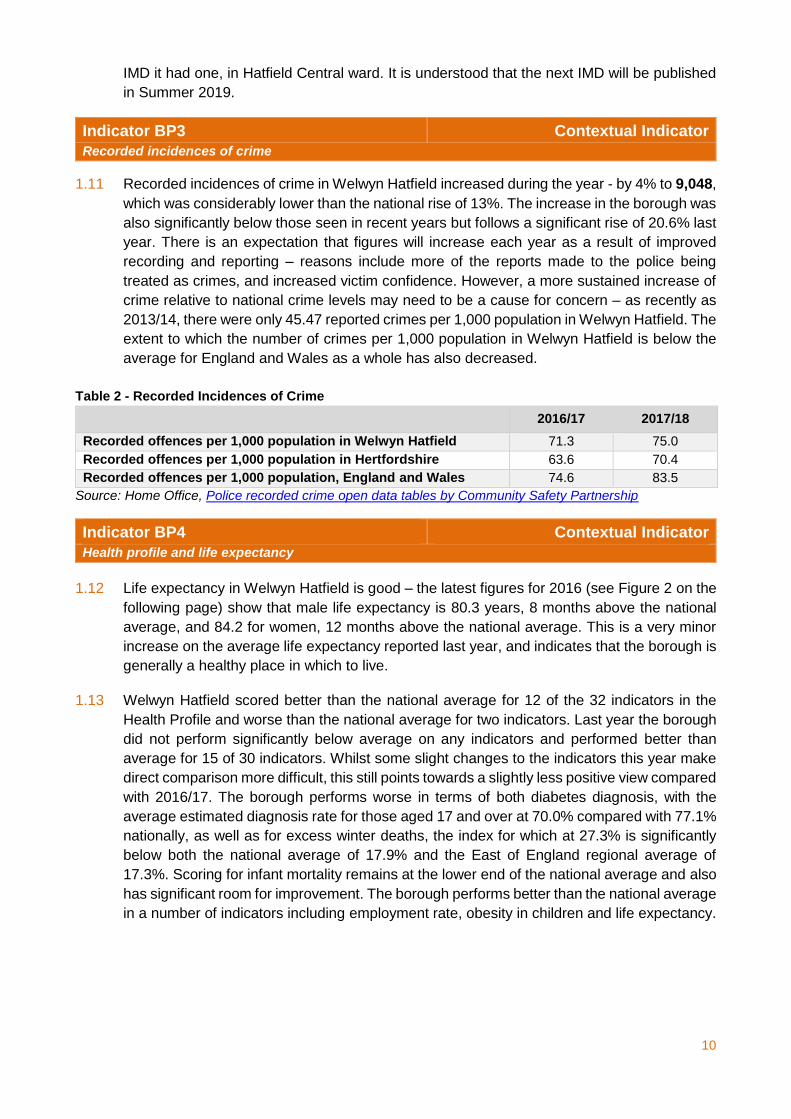
1.11 Recorded incidences of crime in Welwyn Hatfield increased during the year - by 4% to 9,048,
which was considerably lower than the national rise of 13%. The increase in the borough was
also significantly below those seen in recent years but follows a significant rise of 20.6% last
year. There is an expectation that figures will increase each year as a result of improved
recording and reporting – reasons include more of the reports made to the police being
treated as crimes, and increased victim confidence. However, a more sustained increase of
crime relative to national crime levels may need to be a cause for concern – as recently as
2013/14, there were only 45.47 reported crimes per 1,000 population in Welwyn Hatfield. The
extent to which the number of crimes per 1,000 population in Welwyn Hatfield is below the
average for England and Wales as a whole has also decreased.
Table 2 - Recorded Incidences of Crime
2016/17 2017/18
Recorded offences per 1,000 population in Welwyn Hatfield 71.3 75.0
Recorded offences per 1,000 population in Hertfordshire 63.6 70.4
Recorded offences per 1,000 population, England and Wales 74.6 83.5
Source: Home Office, Police recorded crime open data tables by Community Safety Partnership
Indicator BP4 Contextual Indicator
Health profile and life expectancy
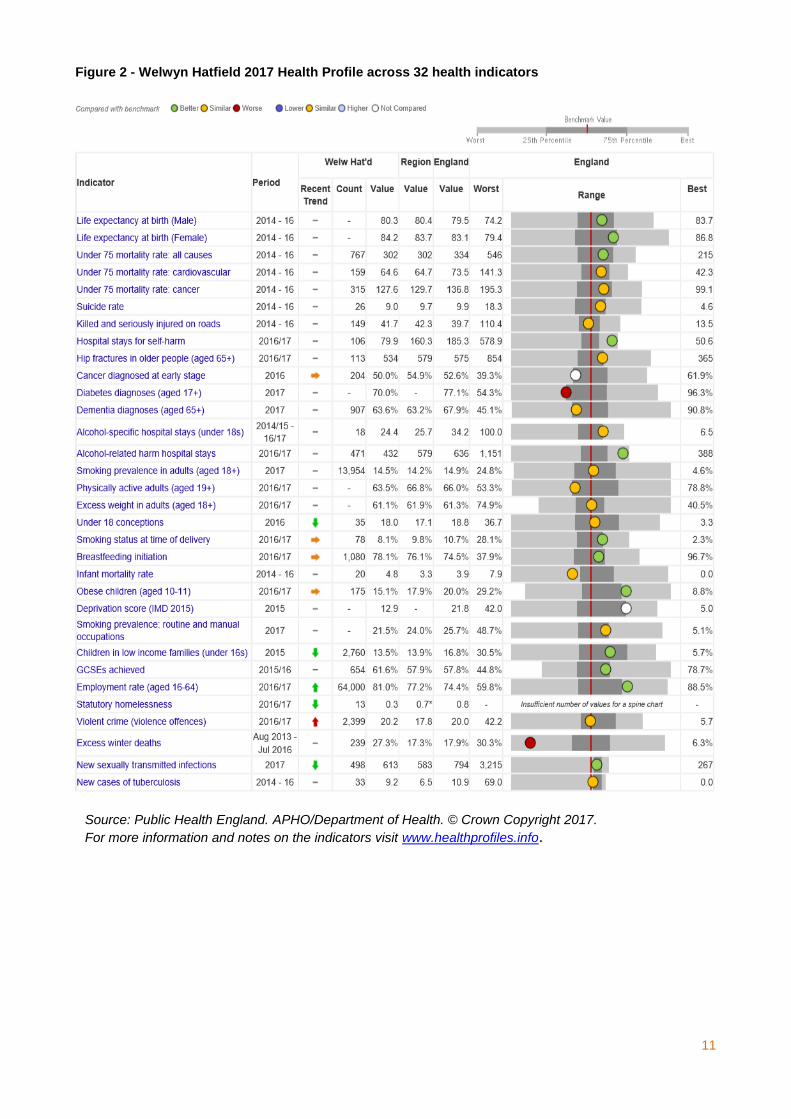
1.12 Life expectancy in Welwyn Hatfield is good – the latest figures for 2016 (see Figure 2 on the
following page) show that male life expectancy is 80.3 years, 8 months above the national
average, and 84.2 for women, 12 months above the national average. This is a very minor
increase on the average life expectancy reported last year, and indicates that the borough is
generally a healthy place in which to live.
1.13 Welwyn Hatfield scored better than the national average for 12 of the 32 indicators in the
Health Profile and worse than the national average for two indicators. Last year the borough
did not perform significantly below average on any indicators and performed better than
average for 15 of 30 indicators. Whilst some slight changes to the indicators this year make
direct comparison more difficult, this still points towards a slightly less positive view compared
with 2016/17. The borough performs worse in terms of both diabetes diagnosis, with the
average estimated diagnosis rate for those aged 17 and over at 70.0% compared with 77.1%
nationally, as well as for excess winter deaths, the index for which at 27.3% is significantly
below both the national average of 17.9% and the East of England regional average of
17.3%. Scoring for infant mortality remains at the lower end of the national average and also
has significant room for improvement. The borough performs better than the national average
in a number of indicators including employment rate, obesity in children and life expectancy.
11
Figure 2 - Welwyn Hatfield 2017 Health Profile across 32 health indicators
Source: Public Health England. APHO/Department of Health. © Crown Copyright 2017.
For more information and notes on the indicators visit www.healthprofiles.info.
12
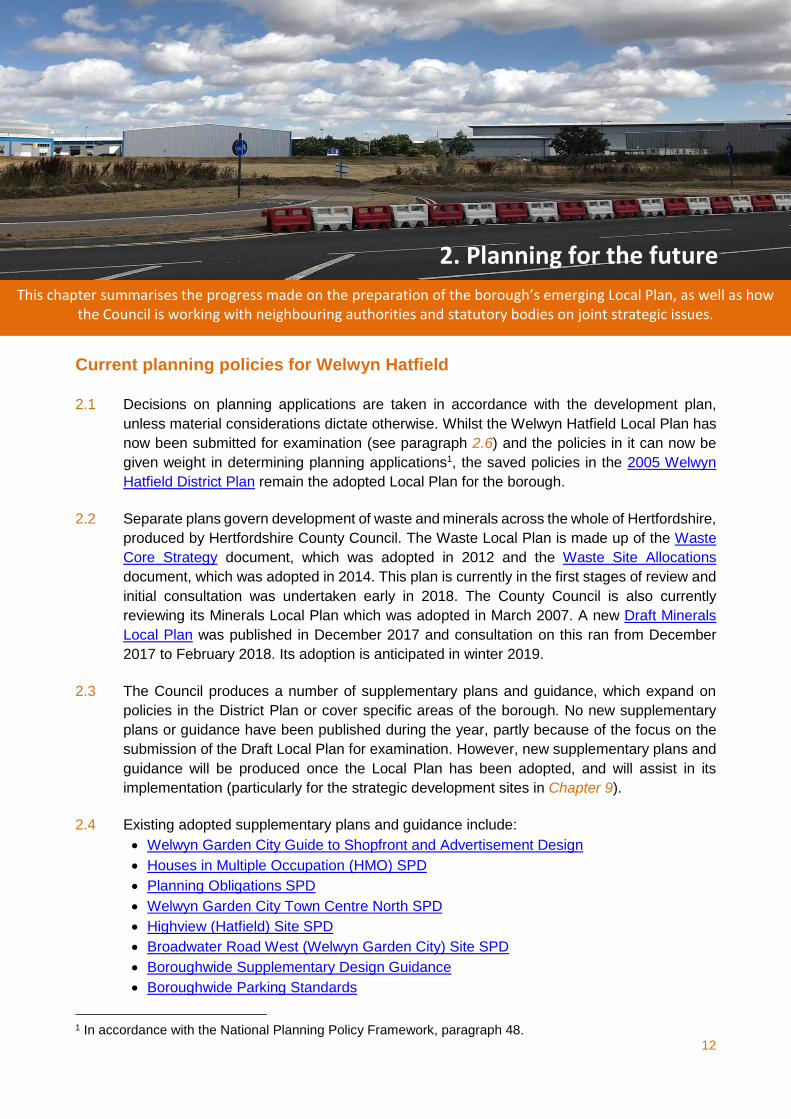
This chapter summarises the progress made on the preparation of the borough’s emerging Local Plan, as well as how the Council is working with neighbouring authorities and statutory bodies on joint strategic issues.
Current planning policies for Welwyn Hatfield
2.1 Decisions on planning applications are taken in accordance with the development plan,
unless material considerations dictate otherwise. Whilst the Welwyn Hatfield Local Plan has
now been submitted for examination (see paragraph 2.6) and the policies in it can now be
given weight in determining planning applications1, the saved policies in the 2005 Welwyn
Hatfield District Plan remain the adopted Local Plan for the borough.
2.2 Separate plans govern development of waste and minerals across the whole of Hertfordshire,
produced by Hertfordshire County Council. The Waste Local Plan is made up of the Waste
Core Strategy document, which was adopted in 2012 and the Waste Site Allocations
document, which was adopted in 2014. This plan is currently in the first stages of review and
initial consultation was undertaken early in 2018. The County Council is also currently
reviewing its Minerals Local Plan which was adopted in March 2007. A new Draft Minerals
Local Plan was published in December 2017 and consultation on this ran from December
2017 to February 2018. Its adoption is anticipated in winter 2019.
2.3 The Council produces a number of supplementary plans and guidance, which expand on
policies in the District Plan or cover specific areas of the borough. No new supplementary
plans or guidance have been published during the year, partly because of the focus on the
submission of the Draft Local Plan for examination. However, new supplementary plans and
guidance will be produced once the Local Plan has been adopted, and will assist in its
implementation (particularly for the strategic development sites in Chapter 9).
2.4 Existing adopted supplementary plans and guidance include:
Welwyn Garden City Guide to Shopfront and Advertisement Design
Houses in Multiple Occupation (HMO) SPD
Planning Obligations SPD
Welwyn Garden City Town Centre North SPD
Highview (Hatfield) Site SPD
Broadwater Road West (Welwyn Garden City) Site SPD
Boroughwide Supplementary Design Guidance
Boroughwide Parking Standards
1 In accordance with the National Planning Policy Framework, paragraph 48.
2. Planning for the future
13
Digswell Character Appraisal
Planning for the future of Welwyn Hatfield
2.5 The Local Development Scheme (LDS) is the means by which the Council formally sets out
the proposed programme for the preparation of the Local Plan, as well as other key planning
documents such as the Community Infrastructure Levy Charging Schedule. It is a procedural
requirement that Local Plans are prepared in accordance with an adopted LDS. In April 2017
a revised LDS was published by the Council.
2.6 The submitted Draft Local Plan covers the period from 2013 to 20322, and once adopted will
replace the 2005 District Plan. During the previous monitoring year the council undertook
consultation on the Draft Local Plan, further details of which were reported in the 2016/17
AMR. A list of minor modifications were recommended by the Council in March and April
2017 and the plan was subsequently submitted for examination on 15th May 2017. During the
examination the soundness and legal compliance of the plan is considered. The process
includes a number of hearing sessions of the Examination in Public (EIP), these sessions
commenced in September 2017, with the following sessions taking place during the
monitoring year:
Stage 1 - Legal soundness and duty to co-operate (21st - 22nd September 2017);
Stage 2 - Objectively assessed needs, Green Belt, spatial vision and targets and
housing land availability (24th - 27th October 2017);
Joint Session with EHDC - Birchhill Garden Suburb (30th January 2018);
Stage 3 - Topic specific and development management policies, including:
community services, transport, retail, housing, the local economy, infrastructure and
new schools (20th – 22nd February 2018).
2.7 The stage 4 hearing session, which covered sites in Welwyn Garden City & Hatfield, took
place in June 2018. Throughout the examination further technical work has been requested
by the examining inspector and a number of modifications have been proposed. This included
further work in relation to the Green Belt, and a study was commissioned and published in
the 2018/19 monitoring year. The study is a key piece of Green Belt evidence and is likely to
assist in determining, alongside other evidence and considerations, the next steps that will
be taken with respect of the Local Plan and its examination. The study was examined in the
stage 5 hearing session in November 2018. If the Local Plan is capable of being found sound,
the Inspector is likely to require some main modifications, which would be subject to public
consultation in due course.
2.8 The Council has continued to progress its Community Infrastructure Levy (CIL) during the
monitoring year, by which it will be able to collect money from developers to fund all types of
infrastructure within the borough. The Preliminary Draft Charging Schedule was published at
the beginning of the year and was consulted upon from 15th May 2017 to 26th June 2017. The
Council is considering comments which will result in amendments to the proposed charging
schedule prior to further consultation and subsequent examination.
2 During the examination the council has agreed that the end date of the plan should move to 2033.

14
The Duty to Cooperate
2.9 The ‘duty to cooperate’ requirement was introduced via the 2011 Localism Act. Whilst
planning authorities and other public bodies have clearly always aimed to cooperate, it was
included in paragraph 178 of the 2012 National Planning Policy Framework (NPPF) and
continues to feature in the revised NPPF, published in July 2018. Paragraphs 24-27 of which
state that cooperation is required on strategic matters that cross administrative boundaries,
in particular highlighting that joint working should help determine where additional
infrastructure may be needed and whether development needs that cannot be met within a
plan area could be met elsewhere. It also states that strategic policy making authorities
should prepare and maintain statements of common ground documenting cross boundary
matters to be addressed.
2.10 Liaison has taken place with a number of duty to cooperate bodies throughout plan
preparation in order to identify what the specific priorities with cross-boundary implications
involving Welwyn Hatfield are, so that these matters are properly addressed in the Local Plan.
Duty to cooperate activity over the monitoring year has included the following:
Continued joint working with East Herts District Council on proposals for Birchall Garden
Suburb, which straddles the administrative boundary between the two authorities. This
has culminated in jointly-agreed policy wording and strategy diagrams being included in
each authority’s submitted Local Plan, as well as a Memorandum of Understanding.
Birchall Garden Suburb was examined through a joint hearing session with East Herts in
January 2018;
Similarly a statement of common ground was produced between the council, East Herts
District Council and Historic England regarding the site South East of Welwyn Garden
City. The land spans across the two authorities and has been proposed for allocation in
both local plans;
In the lead-up to this authority’s Local Plan’s examination hearings, the Council has agreed
Memoranda of Understanding with a number of Duty to Cooperate bodies, including
Hertfordshire authorities – Broxbourne, Stevenage, East Herts, Hertsmere and North
Herts, as well as Hertfordshire County Council, Historic England and Hertfordshire Local
Enterprise Partnership;
The Council has submitted significant amounts of evidence relating to its Duty to
Cooperate activities (both during the monitoring year and over a more lengthy period
historically) as part of the Local Plan’s examination. This notably includes Examination
Documents EX04 and EX12, available at http://welhat.gov.uk/article/6938/Examination-
Documents;
Community Engagement . 2.11 All members of the community who wish to do so should be able to engage in plan-making.
The Welwyn Hatfield Statement of Community Involvement (SCI) sets out the means by
which the Council aims to facilitate this, and ensure that the borough’s diversity is recognised
and the potential needs of all aspects of the community are considered. The current SCI was
adopted in December 2013; and identifies young people, ethnic minorities, the borough’s
rural communities and those living in less well-off parts of the borough as under-represented,
or ‘hard-to-reach’. It sets out ways in which the Council will aim to consult on the local plan,
15
for example by holding consultation events at a variety of times of day, at accessible venues
and by making proposals as easy to understand as possible.
2.12 The various stages of consultation that have been undertaken during the plan-making
process include:
Pre-Issues and Options Consultation (2007/08)
Core Strategy Issues and Options (2009)
Community Representatives - Neighbourhood Workshops (2010)
Housing Targets Consultation (2011)
How Many New Homes – Housing Targets (2011)
Emerging Core Strategy and Land for Housing Outside Urban Areas (2012/13)
Draft Local Plan Consultation (2016).
2.13 During the previous monitoring year, public consultation was undertaken on the publication
of the Draft Local Plan and accompanying policies maps prior to its submission for
examination. The consultation took place in accordance with Regulation 19 of the Town and
Country Planning Regulations 2012, and was held between 30th August and 24th October
2016. The Statement of Consultation (Regulation 22) was published in 2017. The Council
also simultaneously consulted on three supporting documents – a Sustainability Appraisal
and Habitats Regulations Assessment of the proposals in the Draft Local Plan, and a revised
Draft Infrastructure Delivery Plan. This was reported on in last year’s Annual Monitoring
Report in further detail.
16
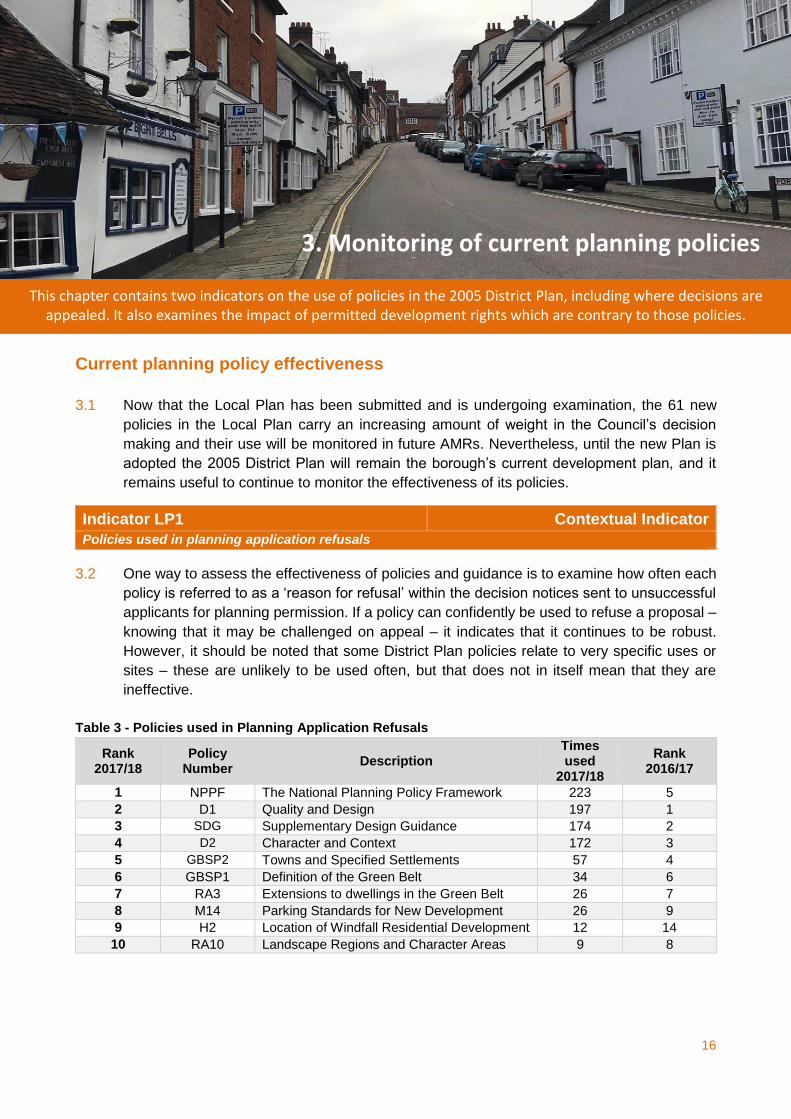
This chapter contains two indicators on the use of policies in the 2005 District Plan, including where decisions are appealed. It also examines the impact of permitted development rights which are contrary to those policies.
Current planning policy effectiveness
3.1 Now that the Local Plan has been submitted and is undergoing examination, the 61 new
policies in the Local Plan carry an increasing amount of weight in the Council’s decision
making and their use will be monitored in future AMRs. Nevertheless, until the new Plan is
adopted the 2005 District Plan will remain the borough’s current development plan, and it
remains useful to continue to monitor the effectiveness of its policies.
Indicator LP1 Contextual Indicator
Policies used in planning application refusals
3.2 One way to assess the effectiveness of policies and guidance is to examine how often each
policy is referred to as a ‘reason for refusal’ within the decision notices sent to unsuccessful
applicants for planning permission. If a policy can confidently be used to refuse a proposal –
knowing that it may be challenged on appeal – it indicates that it continues to be robust.
However, it should be noted that some District Plan policies relate to very specific uses or
sites – these are unlikely to be used often, but that does not in itself mean that they are
ineffective.
Table 3 - Policies used in Planning Application Refusals
Rank 2017/18
Policy Number
Description Times used
2017/18
Rank 2016/17
1 NPPF The National Planning Policy Framework 223 5
2 D1 Quality and Design 197 1
3 SDG Supplementary Design Guidance 174 2
4 D2 Character and Context 172 3
5 GBSP2 Towns and Specified Settlements 57 4
6 GBSP1 Definition of the Green Belt 34 6
7 RA3 Extensions to dwellings in the Green Belt 26 7
8 M14 Parking Standards for New Development 26 9
9 H2 Location of Windfall Residential Development 12 14
10 RA10 Landscape Regions and Character Areas 9 8
3. Monitoring of current planning policies
17
3.3 The National Planning Policy Framework (NPPF) has been used with increasing frequency
to supplement District Plan policies in reasons for refusal. This helps to demonstrate general
conformity of those policies with the NPPF, which is an important requirement for the
effectiveness of the District Plan as it gets older. In addition to the NPPF and the
Supplementary Design Guidance, design policies D1 and D2 continue to be the most
frequently used policies in the refusal of applications by a reasonable margin. Polices
GBSP1, GBSP2 and RA3 are also frequently used against inappropriate proposals in the
Green Belt. Although not featuring within table 3 on the previous page, policies within the
Draft Local Plan have also been mentioned in refusals, where weight can be given in
accordance with the NPPF.
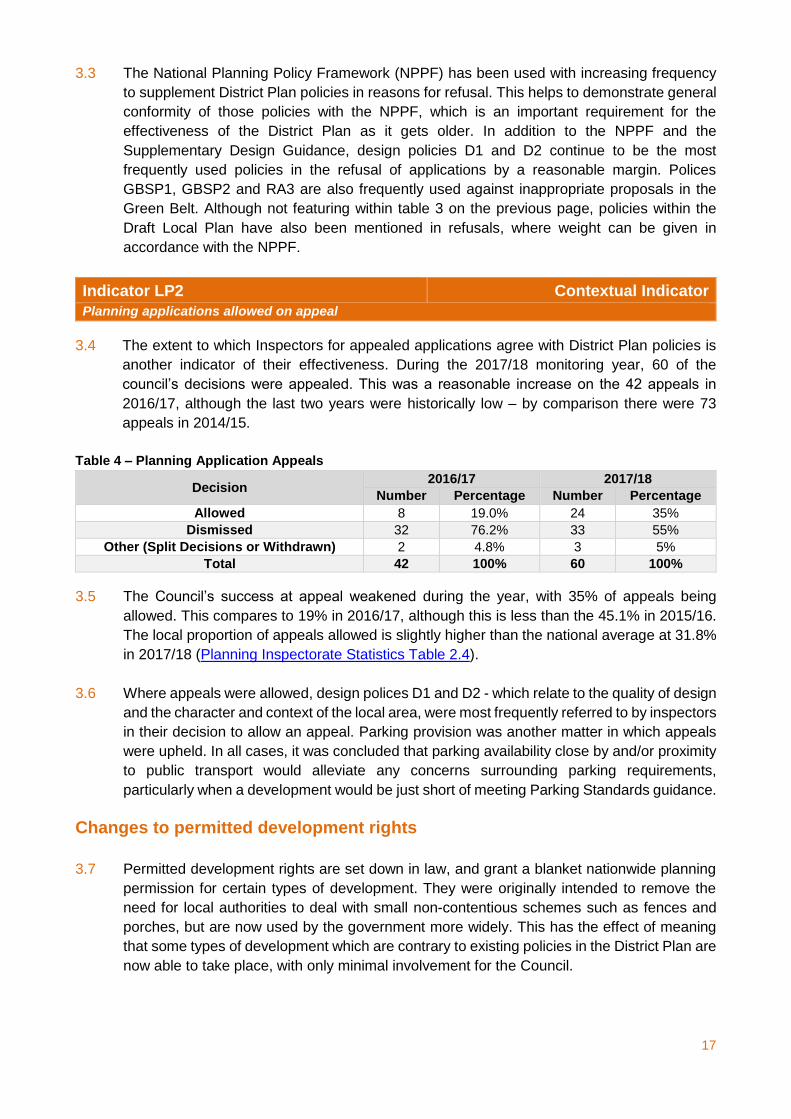
Indicator LP2 Contextual Indicator
Planning applications allowed on appeal
3.4 The extent to which Inspectors for appealed applications agree with District Plan policies is
another indicator of their effectiveness. During the 2017/18 monitoring year, 60 of the
council’s decisions were appealed. This was a reasonable increase on the 42 appeals in
2016/17, although the last two years were historically low – by comparison there were 73
appeals in 2014/15.
Table 4 – Planning Application Appeals
Decision 2016/17 2017/18
Number Percentage Number Percentage
Allowed 8 19.0% 24 35%
Dismissed 32 76.2% 33 55%
Other (Split Decisions or Withdrawn) 2 4.8% 3 5%
Total 42 100% 60 100%
3.5 The Council’s success at appeal weakened during the year, with 35% of appeals being
allowed. This compares to 19% in 2016/17, although this is less than the 45.1% in 2015/16.
The local proportion of appeals allowed is slightly higher than the national average at 31.8%
in 2017/18 (Planning Inspectorate Statistics Table 2.4).
3.6 Where appeals were allowed, design polices D1 and D2 - which relate to the quality of design
and the character and context of the local area, were most frequently referred to by inspectors
in their decision to allow an appeal. Parking provision was another matter in which appeals
were upheld. In all cases, it was concluded that parking availability close by and/or proximity
to public transport would alleviate any concerns surrounding parking requirements,
particularly when a development would be just short of meeting Parking Standards guidance.
Changes to permitted development rights
3.7 Permitted development rights are set down in law, and grant a blanket nationwide planning
permission for certain types of development. They were originally intended to remove the
need for local authorities to deal with small non-contentious schemes such as fences and
porches, but are now used by the government more widely. This has the effect of meaning
that some types of development which are contrary to existing policies in the District Plan are
now able to take place, with only minimal involvement for the Council.

18
3.8 Permitted development rights for change of use of a building from Class B1(a) (offices) to
Class C3 (dwelling houses) were temporarily introduced in 2013, before being made
permanent in 2016. Indicator EC3 reports on the impact this is having on loss of employment
land.
19
This chapter sets out seven indicators covering the health of the borough’s centres; including the amount of new retail, leisure and community facility floorspace built during the year and progress on town centre redevelopment.
Indicator CS1 Local Plan Indicator (Policies SP2 & SP5)
Changes in retail floorspace
Targets: - Delivery of 12,500m2 new retail floorspace by 2025/26
- 15-20% of new town centre comparison floorspace to be in Class A3 to A5 uses
Achieved to date: Net increase of 5,770m2 since 2013/14.
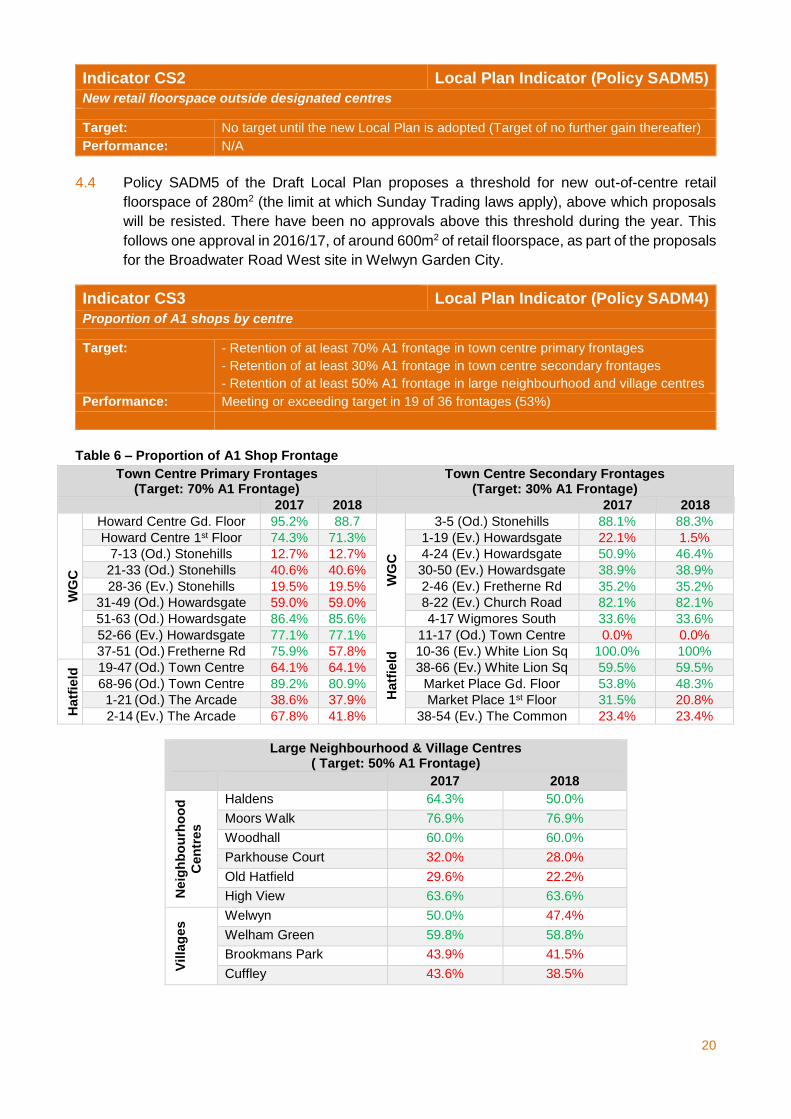
4.1 This indicator covers changes in the amount of floorspace in each of the five retail use classes
– A1 (Shops), A2 (Financial/Professional Services), A3 (Restaurants and Cafes), A4 (Pubs
and Bars) and A5 (Hot Food Takeaways). It also includes retail-type ‘sui generis’ uses (i.e.
those not in a specific use class), such as betting shops, payday loan offices and salons. The
figures only include development which required planning permission – for example, some
changes of use between the retail use classes (such as A1 to A2) do not.
Table 5 – Floorspace Change by Use Class in 2017/18
Location A1 A2 A3 A4 A5 SG Total
Welwyn Garden City Town Centre - - - - - - -
Hatfield Town Centre -159m2 - 159m2 - - - -
Village & Neighbourhood Centres -112m2 - - - 84m2 28m2 -
Out-of-centre 2,756m2 - - -349m2 - 1,537 m2 3,944m2
Borough Totals 2,485m2 - 159m2 -349m2 84m2 1,565m2 3,944m2
4.2 There have been significant levels of retail floorspace change in 2017/18, with the majority
of this taking place outside town and village centres. The increase was largely a result of the
opening of a bulky goods retail warehouse, as well as a builder’s merchant off Bessemer
Road. This resulted in large increases of A1 and SG retail floorspace just outside Welwyn
Garden City Town Centre. The part conversion of The Peartree Inn to a hotel resulted in the
loss of A4 space to use class C1, while the loss of retail- type ‘sui generis’ space was a result
the former service station at North Mymms being converted to a scaffolding yard (class B8).
4.3 Whilst it does not constitute a change of use in planning terms, changes in the balance of
Class A1 units occupied by charity shops are also monitored. This is more pronounced in
Welwyn Garden City – following a number of new arrivals during 2015 which took the number
of charity shops to 13, though this has since fallen to 11. There was no change in the number
this year, equating to 6.0% of all retail units in the town centre.
4. Centres, Services and Facilities
20
Indicator CS2 Local Plan Indicator (Policy SADM5)
New retail floorspace outside designated centres
Target: No target until the new Local Plan is adopted (Target of no further gain thereafter)
Performance: N/A
4.4 Policy SADM5 of the Draft Local Plan proposes a threshold for new out-of-centre retail
floorspace of 280m2 (the limit at which Sunday Trading laws apply), above which proposals
will be resisted. There have been no approvals above this threshold during the year. This
follows one approval in 2016/17, of around 600m2 of retail floorspace, as part of the proposals
for the Broadwater Road West site in Welwyn Garden City.
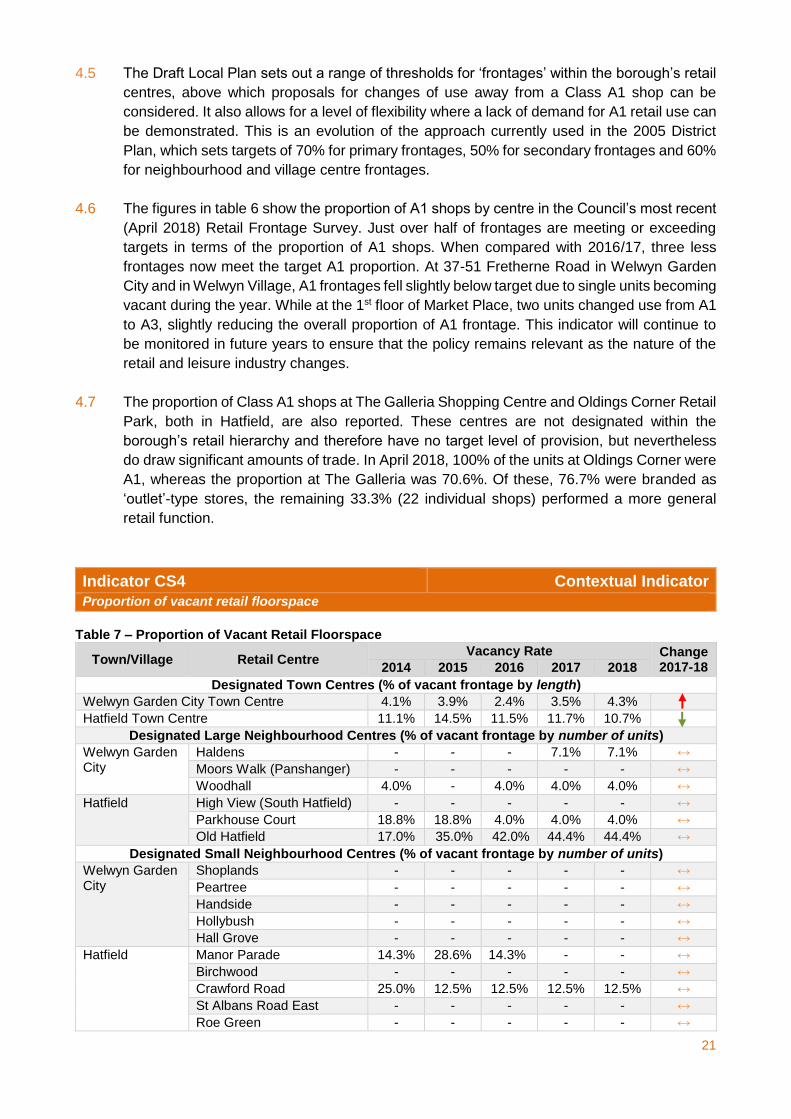
Indicator CS3 Local Plan Indicator (Policy SADM4)
Proportion of A1 shops by centre
Target: - Retention of at least 70% A1 frontage in town centre primary frontages
- Retention of at least 30% A1 frontage in town centre secondary frontages
- Retention of at least 50% A1 frontage in large neighbourhood and village centres
Performance: Meeting or exceeding target in 19 of 36 frontages (53%)
Table 6 – Proportion of A1 Shop Frontage
Town Centre Primary Frontages (Target: 70% A1 Frontage)
Town Centre Secondary Frontages (Target: 30% A1 Frontage)
2017 2018 2017 2018
WG
C
Howard Centre Gd. Floor 95.2% 88.7
WG
C
3-5 (Od.) Stonehills 88.1% 88.3%
Howard Centre 1st Floor 74.3% 71.3% 1-19 (Ev.) Howardsgate 22.1% 1.5%
7-13 (Od.) Stonehills 12.7% 12.7% 4-24 (Ev.) Howardsgate 50.9% 46.4%
21-33 (Od.) Stonehills 40.6% 40.6% 30-50 (Ev.) Howardsgate 38.9% 38.9%
28-36 (Ev.) Stonehills 19.5% 19.5% 2-46 (Ev.) Fretherne Rd 35.2% 35.2%
31-49 (Od.) Howardsgate 59.0% 59.0% 8-22 (Ev.) Church Road 82.1% 82.1%
51-63 (Od.) Howardsgate 86.4% 85.6% 4-17 Wigmores South 33.6% 33.6%
52-66 (Ev.) Howardsgate 77.1% 77.1%
Hatf
ield
11-17 (Od.) Town Centre 0.0% 0.0%
37-51 (Od.) Fretherne Rd 75.9% 57.8% 10-36 (Ev.) White Lion Sq 100.0% 100%
Hatf
ield
19-47 (Od.) Town Centre 64.1% 64.1% 38-66 (Ev.) White Lion Sq 59.5% 59.5%
68-96 (Od.) Town Centre 89.2% 80.9% Market Place Gd. Floor 53.8% 48.3%
1-21 (Od.) The Arcade 38.6% 37.9% Market Place 1st Floor 31.5% 20.8%
2-14 (Ev.) The Arcade 67.8% 41.8% 38-54 (Ev.) The Common 23.4% 23.4%
Large Neighbourhood & Village Centres ( Target: 50% A1 Frontage)
2017 2018
Neig
hb
ou
rho
od
Cen
tres
Haldens 64.3% 50.0%
Moors Walk 76.9% 76.9%
Woodhall 60.0% 60.0%
Parkhouse Court 32.0% 28.0%
Old Hatfield 29.6% 22.2%
High View 63.6% 63.6%
Villa
ges
Welwyn 50.0% 47.4%
Welham Green 59.8% 58.8%
Brookmans Park 43.9% 41.5%
Cuffley 43.6% 38.5%
21
4.5 The Draft Local Plan sets out a range of thresholds for ‘frontages’ within the borough’s retail
centres, above which proposals for changes of use away from a Class A1 shop can be
considered. It also allows for a level of flexibility where a lack of demand for A1 retail use can
be demonstrated. This is an evolution of the approach currently used in the 2005 District
Plan, which sets targets of 70% for primary frontages, 50% for secondary frontages and 60%
for neighbourhood and village centre frontages.
4.6 The figures in table 6 show the proportion of A1 shops by centre in the Council’s most recent
(April 2018) Retail Frontage Survey. Just over half of frontages are meeting or exceeding
targets in terms of the proportion of A1 shops. When compared with 2016/17, three less
frontages now meet the target A1 proportion. At 37-51 Fretherne Road in Welwyn Garden
City and in Welwyn Village, A1 frontages fell slightly below target due to single units becoming
vacant during the year. While at the 1st floor of Market Place, two units changed use from A1
to A3, slightly reducing the overall proportion of A1 frontage. This indicator will continue to
be monitored in future years to ensure that the policy remains relevant as the nature of the
retail and leisure industry changes.
4.7 The proportion of Class A1 shops at The Galleria Shopping Centre and Oldings Corner Retail
Park, both in Hatfield, are also reported. These centres are not designated within the
borough’s retail hierarchy and therefore have no target level of provision, but nevertheless
do draw significant amounts of trade. In April 2018, 100% of the units at Oldings Corner were
A1, whereas the proportion at The Galleria was 70.6%. Of these, 76.7% were branded as
‘outlet’-type stores, the remaining 33.3% (22 individual shops) performed a more general
retail function.
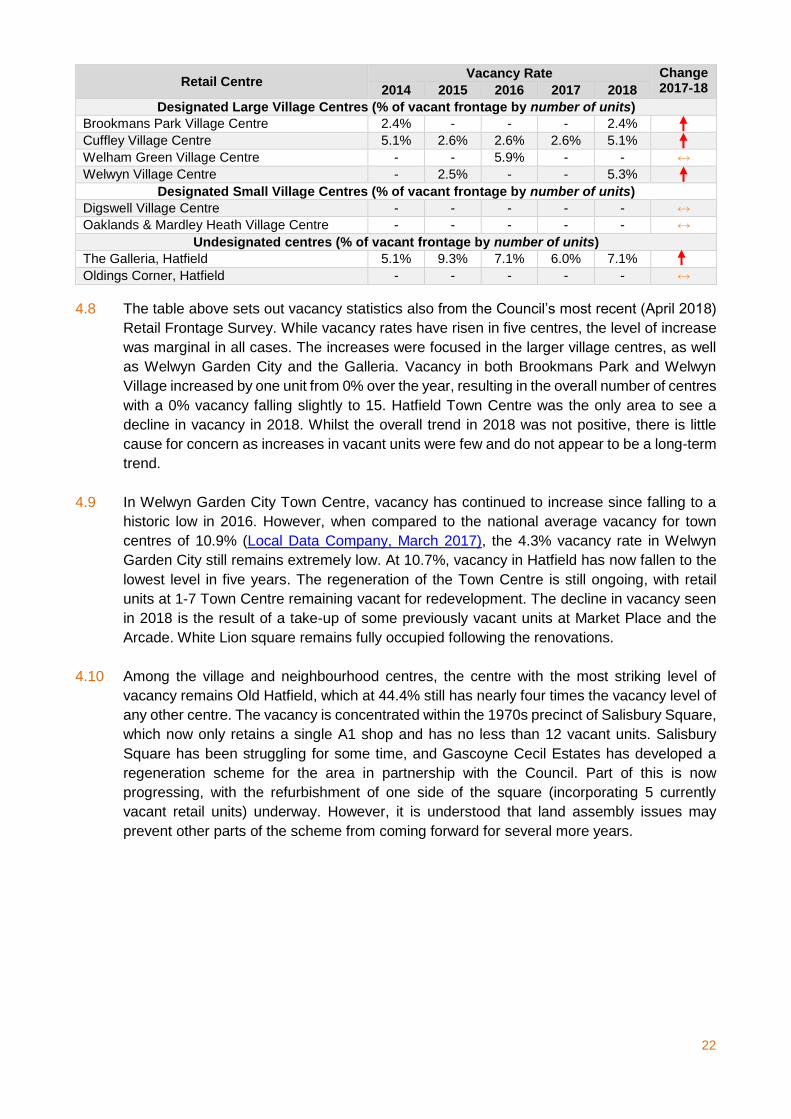
Indicator CS4 Contextual Indicator
Proportion of vacant retail floorspace
Table 7 – Proportion of Vacant Retail Floorspace
Town/Village Retail Centre Vacancy Rate Change
2017-18 2014 2015 2016 2017 2018
Designated Town Centres (% of vacant frontage by length)
Welwyn Garden City Town Centre 4.1% 3.9% 2.4% 3.5% 4.3%
Hatfield Town Centre 11.1% 14.5% 11.5% 11.7% 10.7%
Designated Large Neighbourhood Centres (% of vacant frontage by number of units)
Welwyn Garden City
Haldens - - - 7.1% 7.1% ↔
Moors Walk (Panshanger) - - - - - ↔
Woodhall 4.0% - 4.0% 4.0% 4.0% ↔
Hatfield High View (South Hatfield) - - - - - ↔
Parkhouse Court 18.8% 18.8% 4.0% 4.0% 4.0% ↔
Old Hatfield 17.0% 35.0% 42.0% 44.4% 44.4% ↔
Designated Small Neighbourhood Centres (% of vacant frontage by number of units)
Welwyn Garden City
Shoplands - - - - - ↔
Peartree - - - - - ↔
Handside - - - - - ↔
Hollybush - - - - - ↔
Hall Grove - - - - - ↔
Hatfield Manor Parade 14.3% 28.6% 14.3% - - ↔
Birchwood - - - - - ↔
Crawford Road 25.0% 12.5% 12.5% 12.5% 12.5% ↔
St Albans Road East - - - - - ↔
Roe Green - - - - - ↔
22
Retail Centre Vacancy Rate Change
2017-18 2014 2015 2016 2017 2018
Designated Large Village Centres (% of vacant frontage by number of units)
Brookmans Park Village Centre 2.4% - - - 2.4%
Cuffley Village Centre 5.1% 2.6% 2.6% 2.6% 5.1%
Welham Green Village Centre - - 5.9% - - ↔
Welwyn Village Centre - 2.5% - - 5.3%
Designated Small Village Centres (% of vacant frontage by number of units)
Digswell Village Centre - - - - - ↔
Oaklands & Mardley Heath Village Centre - - - - - ↔
Undesignated centres (% of vacant frontage by number of units)
The Galleria, Hatfield 5.1% 9.3% 7.1% 6.0% 7.1%
Oldings Corner, Hatfield - - - - - ↔
4.8 The table above sets out vacancy statistics also from the Council’s most recent (April 2018)
Retail Frontage Survey. While vacancy rates have risen in five centres, the level of increase
was marginal in all cases. The increases were focused in the larger village centres, as well
as Welwyn Garden City and the Galleria. Vacancy in both Brookmans Park and Welwyn
Village increased by one unit from 0% over the year, resulting in the overall number of centres
with a 0% vacancy falling slightly to 15. Hatfield Town Centre was the only area to see a
decline in vacancy in 2018. Whilst the overall trend in 2018 was not positive, there is little
cause for concern as increases in vacant units were few and do not appear to be a long-term
trend.
4.9 In Welwyn Garden City Town Centre, vacancy has continued to increase since falling to a
historic low in 2016. However, when compared to the national average vacancy for town
centres of 10.9% (Local Data Company, March 2017), the 4.3% vacancy rate in Welwyn
Garden City still remains extremely low. At 10.7%, vacancy in Hatfield has now fallen to the
lowest level in five years. The regeneration of the Town Centre is still ongoing, with retail
units at 1-7 Town Centre remaining vacant for redevelopment. The decline in vacancy seen
in 2018 is the result of a take-up of some previously vacant units at Market Place and the
Arcade. White Lion square remains fully occupied following the renovations.
4.10 Among the village and neighbourhood centres, the centre with the most striking level of
vacancy remains Old Hatfield, which at 44.4% still has nearly four times the vacancy level of
any other centre. The vacancy is concentrated within the 1970s precinct of Salisbury Square,
which now only retains a single A1 shop and has no less than 12 vacant units. Salisbury
Square has been struggling for some time, and Gascoyne Cecil Estates has developed a
regeneration scheme for the area in partnership with the Council. Part of this is now
progressing, with the refurbishment of one side of the square (incorporating 5 currently
vacant retail units) underway. However, it is understood that land assembly issues may
prevent other parts of the scheme from coming forward for several more years.
23
In 2015 the Council formed the Hatfield Renewal Partnership; which incorporates Hatfield Town
Council, Hertfordshire County Council, Gascoyne Cecil Estates, the University of Hertfordshire,
Oaklands College, Greenwich Leisure Ltd, Arlington Business Parks, and the Hertfordshire Local
Enterprise Partnership. Whereas the regeneration of Hatfield has historically been focussed around
efforts to revitalise the town centre, the Hatfield 2030+ project will guide regeneration across the
whole of the town. It has culminated in the Hatfield New Town Renewal Framework, with six broad
themes: Hatfield’s Centres; Housing in Hatfield; Business and Enterprise; Identity and Placemaking;
Walking, Cycling and Transportation; and Community and Leisure.
In the town centre, the Council’s programme of improvements has continued. Work on replacing the
shop fronts and first floor facades in White Lion Square has been completed, and the planning
application for the redevelopment of 1-9 Town Centre, with a scheme to regenerate the eastern end
of the town centre with new shops and homes, is awaiting determination. The work to refurbish the
public realm in White Lion Square, including the installation of play equipment, cycle parking and the
creation of space to better host events is expected to start in early 2019 and complete in summer
2019.
Further work to consolidate a number of the existing surface level car parks in the town centre onto
one site, and enable the redevelopment of existing sites for new housing are expected to move
forward shortly, with a planning application for the first stage – a multi-storey car park - anticipated in
late 2019.
Outside the Town Centre at High View in South Hatfield, the Council has appointed a developer for
the scheme to re-provide the existing neighbourhood centre alongside new homes. A planning
application is expected to be submitted late in due course, with work completing in up to four phases
by 2023.
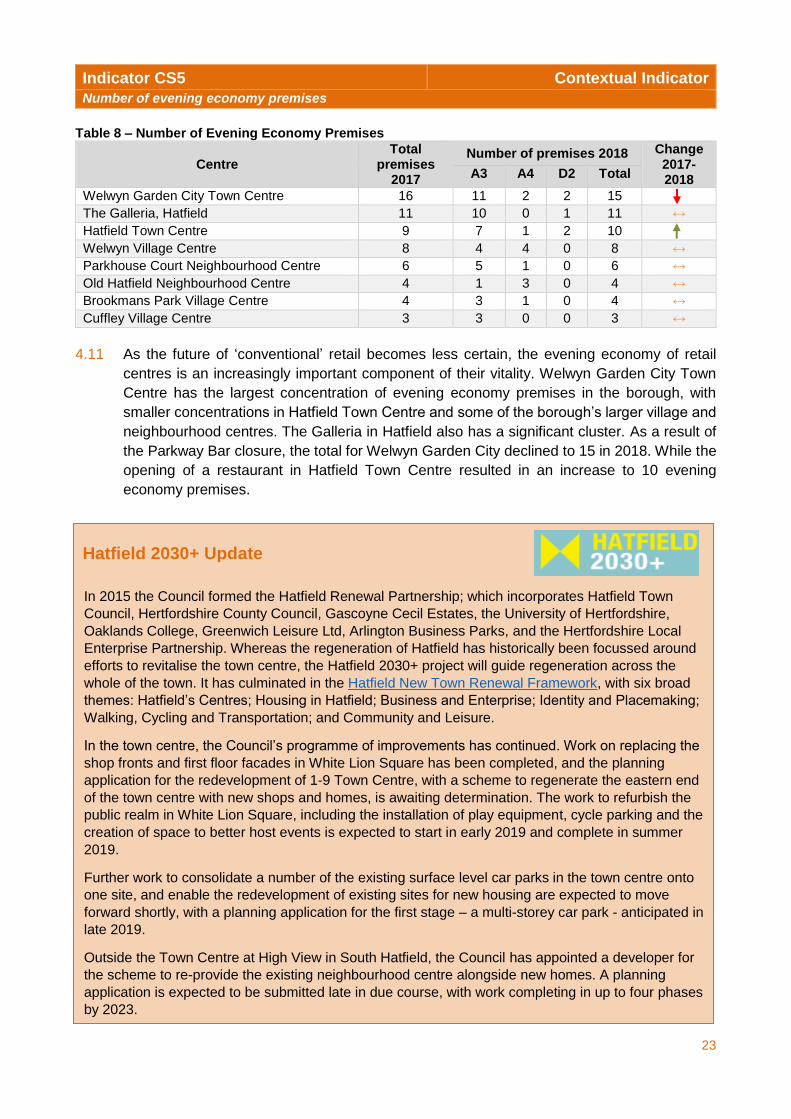
Indicator CS5 Contextual Indicator
Number of evening economy premises
Table 8 – Number of Evening Economy Premises
Centre Total
premises 2017
Number of premises 2018 Change 2017-2018
A3 A4 D2 Total
Welwyn Garden City Town Centre 16 11 2 2 15
The Galleria, Hatfield 11 10 0 1 11 ↔
Hatfield Town Centre 9 7 1 2 10
Welwyn Village Centre 8 4 4 0 8 ↔
Parkhouse Court Neighbourhood Centre 6 5 1 0 6 ↔
Old Hatfield Neighbourhood Centre 4 1 3 0 4 ↔
Brookmans Park Village Centre 4 3 1 0 4 ↔
Cuffley Village Centre 3 3 0 0 3 ↔
4.11 As the future of ‘conventional’ retail becomes less certain, the evening economy of retail
centres is an increasingly important component of their vitality. Welwyn Garden City Town
Centre has the largest concentration of evening economy premises in the borough, with
smaller concentrations in Hatfield Town Centre and some of the borough’s larger village and
neighbourhood centres. The Galleria in Hatfield also has a significant cluster. As a result of
the Parkway Bar closure, the total for Welwyn Garden City declined to 15 in 2018. While the
opening of a restaurant in Hatfield Town Centre resulted in an increase to 10 evening
economy premises.
Hatfield 2030+ Update
24
Welwyn Garden City Town Centre is the main shopping and service centre for the borough. In October
2016 the former Welwyn Garden City Town Centre Partnership, of which the Council was a member,
was successful in becoming a Business Improvement District (BID), through a referendum. The BID
is business-led and business-funded, although the Council continues to have officer and member-
level representation on the BID’s Development Board. The BID has 4 objectives – to make the town
centre more animated and attractive, well promoted and celebrated, welcoming and accessible, and
have a great business and leisure offer – and will invest around £1.5m between now and 2022.
Key developments in the town centre during 2017/18 include:
The completion of works at the Welwyn Garden City bus station in order to improve safety,
as well as providing enhanced seating, lighting and information screens. The redesign
means that pedestrians no longer need to cross the roadway to access bus stops.
Hertfordshire County Council, in partnership with the council, have undertaken
consultation on schemes to improve the pedestrian environment and traffic circulation
around Stonehills and Howardsgate. A new system was trialled in May and June 2018
which restricted the traffic flow through Wigmores North to make it easier for pedestrians
to cross the road, as well as removing traffic from the north side of Stonehills.
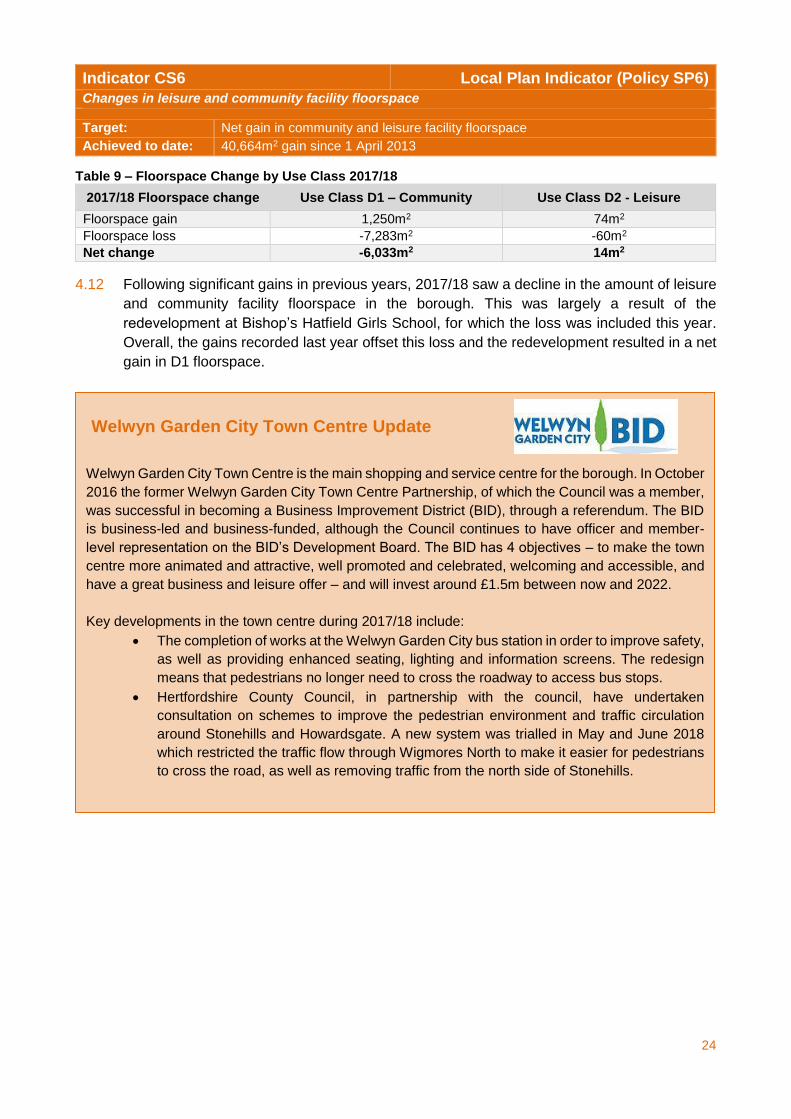
Indicator CS6 Local Plan Indicator (Policy SP6)
Changes in leisure and community facility floorspace
Target: Net gain in community and leisure facility floorspace
Achieved to date: 40,664m2 gain since 1 April 2013
Table 9 – Floorspace Change by Use Class 2017/18
2017/18 Floorspace change Use Class D1 – Community Use Class D2 - Leisure
Floorspace gain 1,250m2 74m2
Floorspace loss -7,283m2 -60m2
Net change -6,033m2 14m2
4.12 Following significant gains in previous years, 2017/18 saw a decline in the amount of leisure
and community facility floorspace in the borough. This was largely a result of the
redevelopment at Bishop’s Hatfield Girls School, for which the loss was included this year.
Overall, the gains recorded last year offset this loss and the redevelopment resulted in a net
gain in D1 floorspace.
Welwyn Garden City Town Centre Update
25
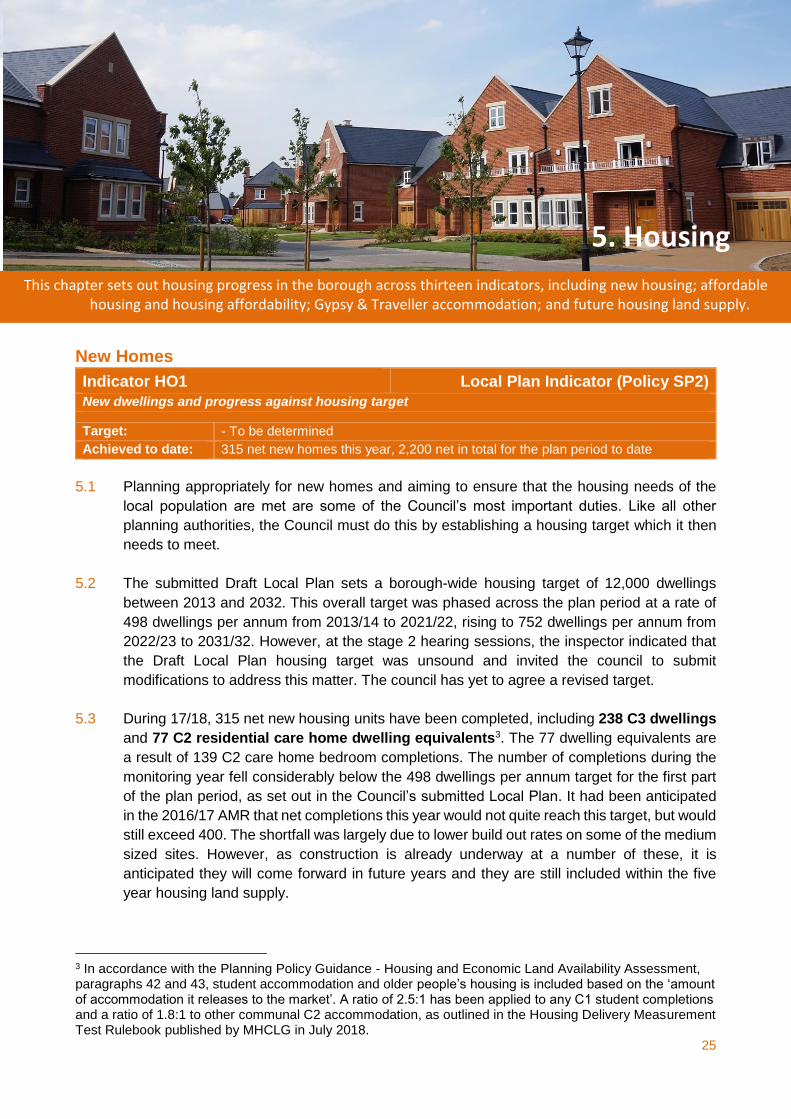
This chapter sets out housing progress in the borough across thirteen indicators, including new housing; affordable housing and housing affordability; Gypsy & Traveller accommodation; and future housing land supply.
New Homes
Indicator HO1 Local Plan Indicator (Policy SP2)
New dwellings and progress against housing target
Target: - To be determined
Achieved to date: 315 net new homes this year, 2,200 net in total for the plan period to date
5.1 Planning appropriately for new homes and aiming to ensure that the housing needs of the
local population are met are some of the Council’s most important duties. Like all other
planning authorities, the Council must do this by establishing a housing target which it then
needs to meet.
5.2 The submitted Draft Local Plan sets a borough-wide housing target of 12,000 dwellings
between 2013 and 2032. This overall target was phased across the plan period at a rate of
498 dwellings per annum from 2013/14 to 2021/22, rising to 752 dwellings per annum from
2022/23 to 2031/32. However, at the stage 2 hearing sessions, the inspector indicated that
the Draft Local Plan housing target was unsound and invited the council to submit
modifications to address this matter. The council has yet to agree a revised target.
5.3 During 17/18, 315 net new housing units have been completed, including 238 C3 dwellings
and 77 C2 residential care home dwelling equivalents3. The 77 dwelling equivalents are
a result of 139 C2 care home bedroom completions. The number of completions during the
monitoring year fell considerably below the 498 dwellings per annum target for the first part
of the plan period, as set out in the Council’s submitted Local Plan. It had been anticipated
in the 2016/17 AMR that net completions this year would not quite reach this target, but would
still exceed 400. The shortfall was largely due to lower build out rates on some of the medium
sized sites. However, as construction is already underway at a number of these, it is
anticipated they will come forward in future years and they are still included within the five
year housing land supply.
3 In accordance with the Planning Policy Guidance - Housing and Economic Land Availability Assessment, paragraphs 42 and 43, student accommodation and older people’s housing is included based on the ‘amount of accommodation it releases to the market’. A ratio of 2.5:1 has been applied to any C1 student completions and a ratio of 1.8:1 to other communal C2 accommodation, as outlined in the Housing Delivery Measurement Test Rulebook published by MHCLG in July 2018.
5. Housing
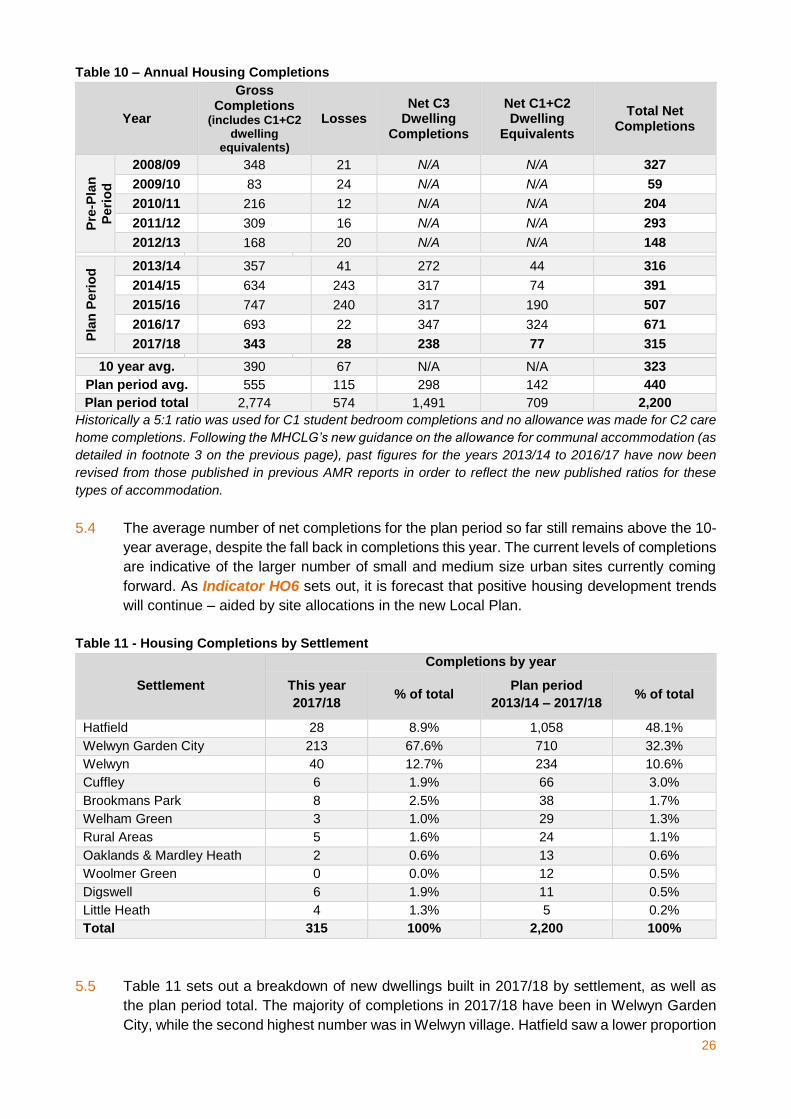
26
Table 10 – Annual Housing Completions
Year
Gross Completions
(includes C1+C2 dwelling
equivalents)
Losses Net C3
Dwelling Completions
Net C1+C2 Dwelling
Equivalents
Total Net
Completions
Pre
-Pla
n
Peri
od
2008/09 348 21 N/A N/A 327
2009/10 83 24 N/A N/A 59
2010/11 216 12 N/A N/A 204
2011/12 309 16 N/A N/A 293
2012/13 168 20 N/A N/A 148
Pla
n P
eri
od
2013/14 357 41 272 44 316
2014/15 634 243 317 74 391
2015/16 747 240 317 190 507
2016/17 693 22 347 324 671
2017/18 343 28 238 77 315
10 year avg. 390 67 N/A N/A 323
Plan period avg. 555 115 298 142 440
Plan period total 2,774 574 1,491 709 2,200
Historically a 5:1 ratio was used for C1 student bedroom completions and no allowance was made for C2 care
home completions. Following the MHCLG’s new guidance on the allowance for communal accommodation (as
detailed in footnote 3 on the previous page), past figures for the years 2013/14 to 2016/17 have now been
revised from those published in previous AMR reports in order to reflect the new published ratios for these
types of accommodation.
5.4 The average number of net completions for the plan period so far still remains above the 10-
year average, despite the fall back in completions this year. The current levels of completions
are indicative of the larger number of small and medium size urban sites currently coming
forward. As Indicator HO6 sets out, it is forecast that positive housing development trends
will continue – aided by site allocations in the new Local Plan.
Table 11 - Housing Completions by Settlement
Settlement
Completions by year
This year
2017/18 % of total
Plan period
2013/14 – 2017/18 % of total
Hatfield 28 8.9% 1,058 48.1%
Welwyn Garden City 213 67.6% 710 32.3%
Welwyn 40 12.7% 234 10.6%
Cuffley 6 1.9% 66 3.0%
Brookmans Park 8 2.5% 38 1.7%
Welham Green 3 1.0% 29 1.3%
Rural Areas 5 1.6% 24 1.1%
Oaklands & Mardley Heath 2 0.6% 13 0.6%
Woolmer Green 0 0.0% 12 0.5%
Digswell 6 1.9% 11 0.5%
Little Heath 4 1.3% 5 0.2%
Total 315 100% 2,200 100%
5.5 Table 11 sets out a breakdown of new dwellings built in 2017/18 by settlement, as well as
the plan period total. The majority of completions in 2017/18 have been in Welwyn Garden
City, while the second highest number was in Welwyn village. Hatfield saw a lower proportion
27
of completions than in previous years, accounting for only 8.9% of the total for the borough.
For some of the villages the proportion of completions was generally above historic levels,
reflecting the mixed range of locations in which development is coming forward.
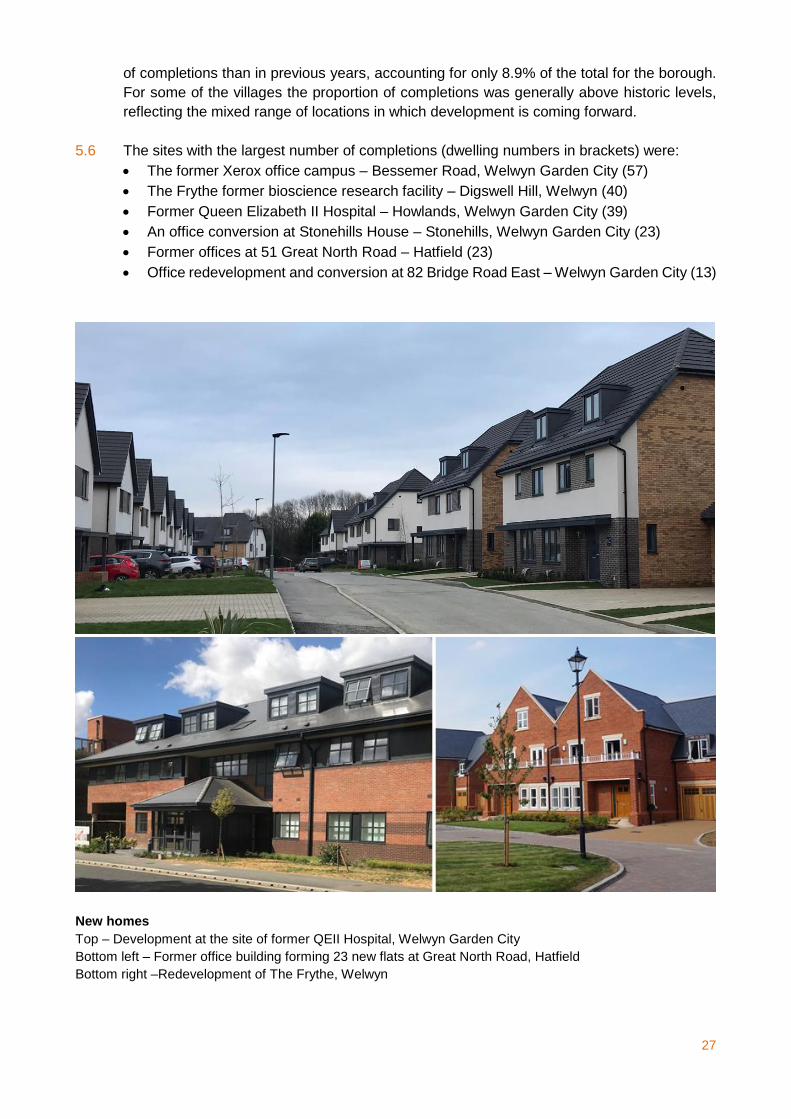
5.6 The sites with the largest number of completions (dwelling numbers in brackets) were:
The former Xerox office campus – Bessemer Road, Welwyn Garden City (57)
The Frythe former bioscience research facility – Digswell Hill, Welwyn (40)
Former Queen Elizabeth II Hospital – Howlands, Welwyn Garden City (39)
An office conversion at Stonehills House – Stonehills, Welwyn Garden City (23)
Former offices at 51 Great North Road – Hatfield (23)
Office redevelopment and conversion at 82 Bridge Road East – Welwyn Garden City (13)
New homes
Top – Development at the site of former QEII Hospital, Welwyn Garden City
Bottom left – Former office building forming 23 new flats at Great North Road, Hatfield
Bottom right –Redevelopment of The Frythe, Welwyn
28
Indicator HO2 Local Plan Indicator (Policy SADM1)
Proportion of dwellings on allocated sites
Target: No target until 2020/21
Achieved to date: N/A for new Local Plan.
5.7 Within a ‘plan-led’ system, it is generally expected that the majority of new homes will come
forward on sites which are either allocated in a development plan or identified through
processes such as the Housing and Economic Land Availability Assessment. However, it is
inevitable that as circumstances change proposals will arise for sites which had not
previously been envisaged for development. Such development is known as ‘windfall’ and is
particularly common for smaller sites, but can sometimes take place on much larger sites as
well. The Council does not make an allowance for windfall completions for the first three
years of its housing trajectory, reflecting the likely development timescale for windfall
approvals from this point.
5.8 All of this year’s completions first arose as windfall, translating to a 100% windfall proportion,
which whilst exceptionally high is not necessarily unexpected given that the District Plan was
adopted in 2005 and the majority of sites identified in this plan have now completed. Most
completions in 2017/18 were urban sites which do not necessarily need to be allocated for
housing in an adopted plan first in the same way as Green Belt sites, although exceptions do
apply.
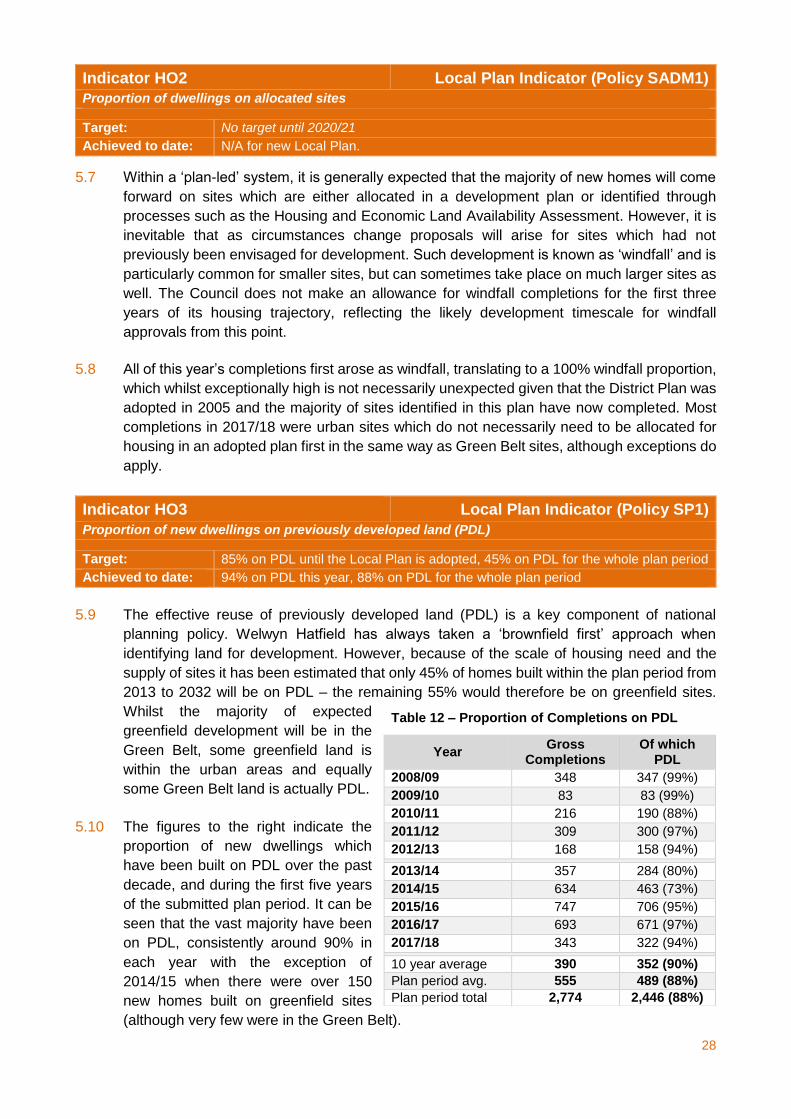
Indicator HO3 Local Plan Indicator (Policy SP1)
Proportion of new dwellings on previously developed land (PDL)
Target: 85% on PDL until the Local Plan is adopted, 45% on PDL for the whole plan period
Achieved to date: 94% on PDL this year, 88% on PDL for the whole plan period
5.9 The effective reuse of previously developed land (PDL) is a key component of national
planning policy. Welwyn Hatfield has always taken a ‘brownfield first’ approach when
identifying land for development. However, because of the scale of housing need and the
supply of sites it has been estimated that only 45% of homes built within the plan period from
2013 to 2032 will be on PDL – the remaining 55% would therefore be on greenfield sites.
Whilst the majority of expected
greenfield development will be in the
Green Belt, some greenfield land is
within the urban areas and equally
some Green Belt land is actually PDL.
5.10 The figures to the right indicate the
proportion of new dwellings which
have been built on PDL over the past
decade, and during the first five years
of the submitted plan period. It can be
seen that the vast majority have been
on PDL, consistently around 90% in
each year with the exception of
2014/15 when there were over 150
new homes built on greenfield sites
(although very few were in the Green Belt).
Table 12 – Proportion of Completions on PDL
Year Gross
Completions Of which
PDL
2008/09 348 347 (99%)
2009/10 83 83 (99%)
2010/11 216 190 (88%)
2011/12 309 300 (97%)
2012/13 168 158 (94%)
2013/14 357 284 (80%)
2014/15 634 463 (73%)
2015/16 747 706 (95%)
2016/17 693 671 (97%)
2017/18 343 322 (94%)
10 year average 390 352 (90%)
Plan period avg. 555 489 (88%)
Plan period total 2,774 2,446 (88%)
29
5.11 In 2017 the Government introduced requirements for each local authority to produce a
Brownfield Land Register at least once each year, listing all PDL sites in their area which are
considered to be suitable for development. The Council’s Brownfield Land Register is
available to view at www.welhat.gov.uk/brownfieldland, although it has not resulted in the
identification of any significant new dwelling capacity on PDL.
Indicator HO4 Contextual Indicator
Size and type of new dwellings
5.12 Policy SP7 of the Draft Local Plan, once adopted, will require proposals for major new
housing developments to include a mix of dwelling sizes and types which reflect the Council’s
latest evidence of housing need. Because this will change over time this is a contextual
indicator, albeit monitoring against the estimated figures in the Local Plan.
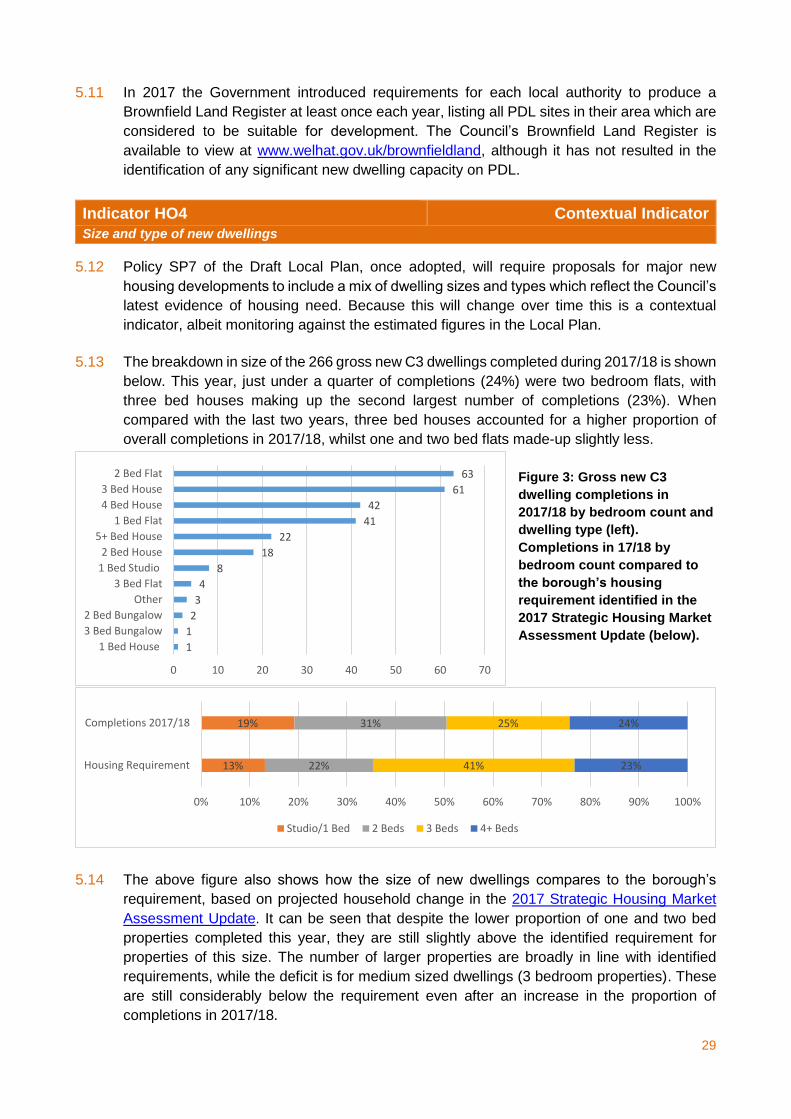
5.13 The breakdown in size of the 266 gross new C3 dwellings completed during 2017/18 is shown
below. This year, just under a quarter of completions (24%) were two bedroom flats, with
three bed houses making up the second largest number of completions (23%). When
compared with the last two years, three bed houses accounted for a higher proportion of
overall completions in 2017/18, whilst one and two bed flats made-up slightly less.
Figure 3: Gross new C3
dwelling completions in
2017/18 by bedroom count and
dwelling type (left).
Completions in 17/18 by
bedroom count compared to
the borough’s housing
requirement identified in the
2017 Strategic Housing Market
Assessment Update (below).
5.14 The above figure also shows how the size of new dwellings compares to the borough’s
requirement, based on projected household change in the 2017 Strategic Housing Market
Assessment Update. It can be seen that despite the lower proportion of one and two bed
properties completed this year, they are still slightly above the identified requirement for
properties of this size. The number of larger properties are broadly in line with identified
requirements, while the deficit is for medium sized dwellings (3 bedroom properties). These
are still considerably below the requirement even after an increase in the proportion of
completions in 2017/18.
13%
19%
22%
31%
41%
25%
23%
24%
0% 10% 20% 30% 40% 50% 60% 70% 80% 90% 100%
Housing Requirement
Completions 2017/18
Studio/1 Bed 2 Beds 3 Beds 4+ Beds
1
1
2
3
4
8
18
22
41
42
61
63
0 10 20 30 40 50 60 70
1 Bed House
3 Bed Bungalow
2 Bed Bungalow
Other
3 Bed Flat
1 Bed Studio
2 Bed House
5+ Bed House
1 Bed Flat
4 Bed House
3 Bed House
2 Bed Flat
30
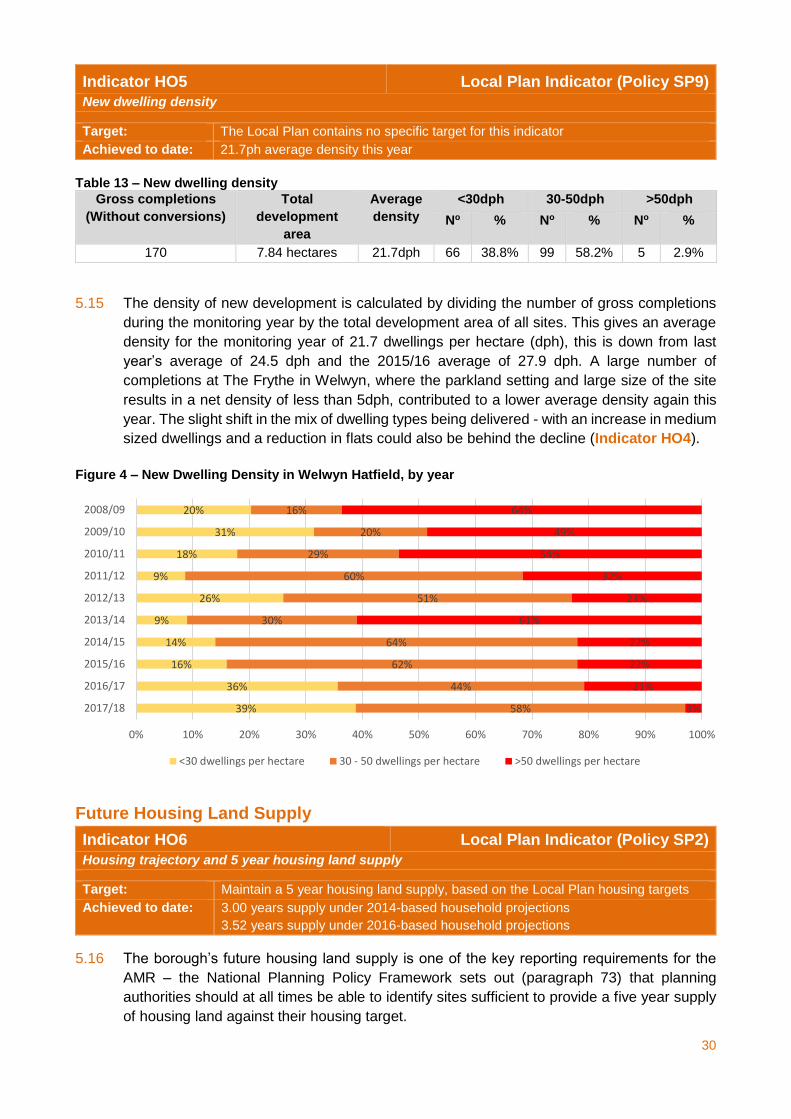
Indicator HO5 Local Plan Indicator (Policy SP9)
New dwelling density
Target: The Local Plan contains no specific target for this indicator
Achieved to date: 21.7ph average density this year
Table 13 – New dwelling density
Gross completions
(Without conversions)
Total
development
area
Average
density
<30dph 30-50dph >50dph
No % No % No %
170 7.84 hectares 21.7dph 66 38.8% 99 58.2% 5 2.9%
5.15 The density of new development is calculated by dividing the number of gross completions
during the monitoring year by the total development area of all sites. This gives an average
density for the monitoring year of 21.7 dwellings per hectare (dph), this is down from last
year’s average of 24.5 dph and the 2015/16 average of 27.9 dph. A large number of
completions at The Frythe in Welwyn, where the parkland setting and large size of the site
results in a net density of less than 5dph, contributed to a lower average density again this
year. The slight shift in the mix of dwelling types being delivered - with an increase in medium
sized dwellings and a reduction in flats could also be behind the decline (Indicator HO4).
Figure 4 – New Dwelling Density in Welwyn Hatfield, by year
Future Housing Land Supply
Indicator HO6 Local Plan Indicator (Policy SP2)
Housing trajectory and 5 year housing land supply
Target: Maintain a 5 year housing land supply, based on the Local Plan housing targets
Achieved to date: 3.00 years supply under 2014-based household projections
3.52 years supply under 2016-based household projections
5.16 The borough’s future housing land supply is one of the key reporting requirements for the
AMR – the National Planning Policy Framework sets out (paragraph 73) that planning
authorities should at all times be able to identify sites sufficient to provide a five year supply
of housing land against their housing target.
39%
36%
16%
14%
9%
26%
9%
18%
31%
20%
58%
44%
62%
64%
30%
51%
60%
29%
20%
16%
3%
21%
22%
22%
61%
23%
32%
54%
49%
64%
0% 10% 20% 30% 40% 50% 60% 70% 80% 90% 100%
2017/18
2016/17
2015/16
2014/15
2013/14
2012/13
2011/12
2010/11
2009/10
2008/09
<30 dwellings per hectare 30 - 50 dwellings per hectare >50 dwellings per hectare
31
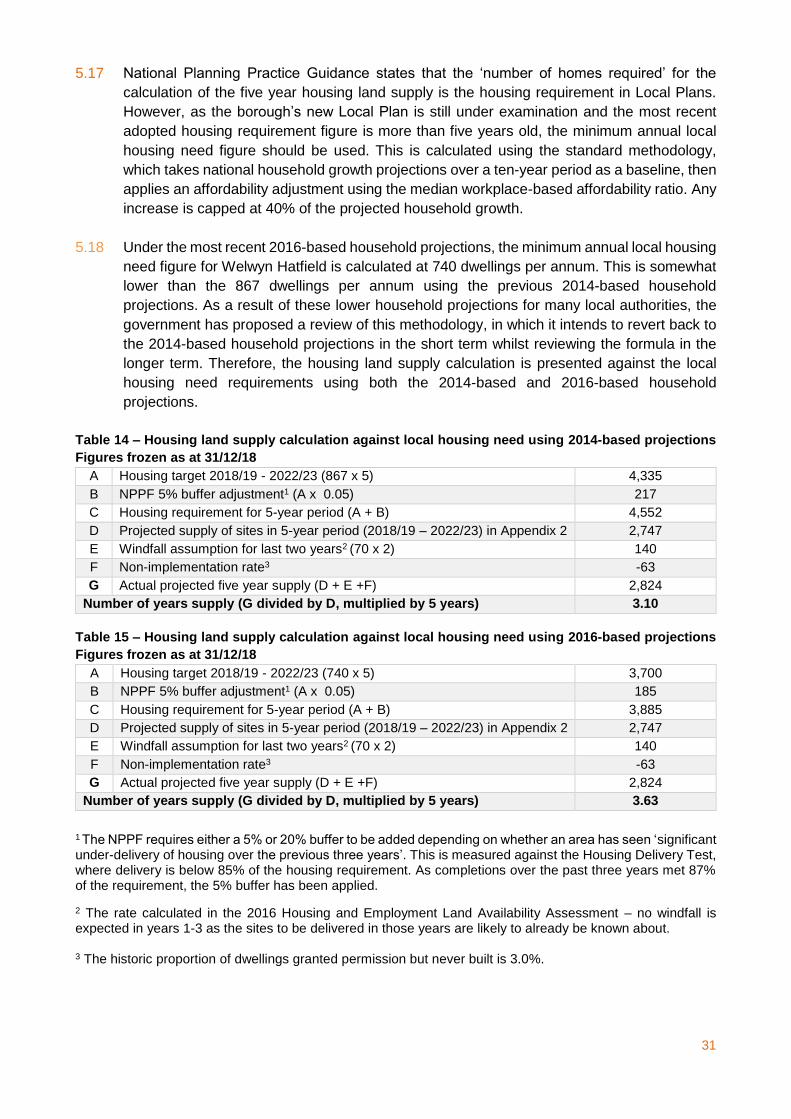
5.17 National Planning Practice Guidance states that the ‘number of homes required’ for the
calculation of the five year housing land supply is the housing requirement in Local Plans.
However, as the borough’s new Local Plan is still under examination and the most recent
adopted housing requirement figure is more than five years old, the minimum annual local
housing need figure should be used. This is calculated using the standard methodology,
which takes national household growth projections over a ten-year period as a baseline, then
applies an affordability adjustment using the median workplace-based affordability ratio. Any
increase is capped at 40% of the projected household growth.
5.18 Under the most recent 2016-based household projections, the minimum annual local housing
need figure for Welwyn Hatfield is calculated at 740 dwellings per annum. This is somewhat
lower than the 867 dwellings per annum using the previous 2014-based household
projections. As a result of these lower household projections for many local authorities, the
government has proposed a review of this methodology, in which it intends to revert back to
the 2014-based household projections in the short term whilst reviewing the formula in the
longer term. Therefore, the housing land supply calculation is presented against the local
housing need requirements using both the 2014-based and 2016-based household
projections.
Table 14 – Housing land supply calculation against local housing need using 2014-based projections
Figures frozen as at 31/12/18
A Housing target 2018/19 - 2022/23 (867 x 5) 4,335
B NPPF 5% buffer adjustment1 (A x 0.05) 217
C Housing requirement for 5-year period (A + B) 4,552
D Projected supply of sites in 5-year period (2018/19 – 2022/23) in Appendix 2 2,747
E Windfall assumption for last two years2 (70 x 2) 140
F Non-implementation rate3 -63
G Actual projected five year supply (D + E +F) 2,824
Number of years supply (G divided by D, multiplied by 5 years) 3.10
Table 15 – Housing land supply calculation against local housing need using 2016-based projections
Figures frozen as at 31/12/18
A Housing target 2018/19 - 2022/23 (740 x 5) 3,700
B NPPF 5% buffer adjustment1 (A x 0.05) 185
C Housing requirement for 5-year period (A + B) 3,885
D Projected supply of sites in 5-year period (2018/19 – 2022/23) in Appendix 2 2,747
E Windfall assumption for last two years2 (70 x 2) 140
F Non-implementation rate3 -63
G Actual projected five year supply (D + E +F) 2,824
Number of years supply (G divided by D, multiplied by 5 years) 3.63
1 The NPPF requires either a 5% or 20% buffer to be added depending on whether an area has seen ‘significant under-delivery of housing over the previous three years’. This is measured against the Housing Delivery Test, where delivery is below 85% of the housing requirement. As completions over the past three years met 87% of the requirement, the 5% buffer has been applied.
2 The rate calculated in the 2016 Housing and Employment Land Availability Assessment – no windfall is expected in years 1-3 as the sites to be delivered in those years are likely to already be known about. 3 The historic proportion of dwellings granted permission but never built is 3.0%.
32
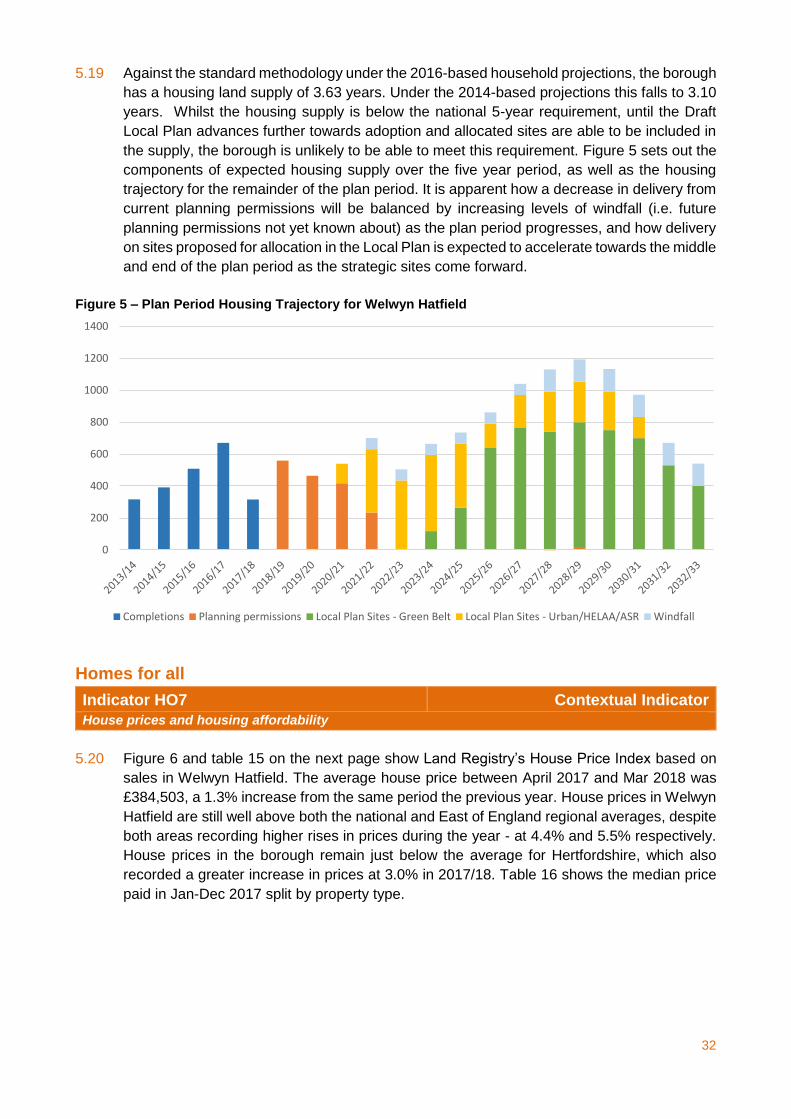
5.19 Against the standard methodology under the 2016-based household projections, the borough
has a housing land supply of 3.63 years. Under the 2014-based projections this falls to 3.10
years. Whilst the housing supply is below the national 5-year requirement, until the Draft
Local Plan advances further towards adoption and allocated sites are able to be included in
the supply, the borough is unlikely to be able to meet this requirement. Figure 5 sets out the
components of expected housing supply over the five year period, as well as the housing
trajectory for the remainder of the plan period. It is apparent how a decrease in delivery from
current planning permissions will be balanced by increasing levels of windfall (i.e. future
planning permissions not yet known about) as the plan period progresses, and how delivery
on sites proposed for allocation in the Local Plan is expected to accelerate towards the middle
and end of the plan period as the strategic sites come forward.
Figure 5 – Plan Period Housing Trajectory for Welwyn Hatfield
Homes for all
Indicator HO7 Contextual Indicator
House prices and housing affordability
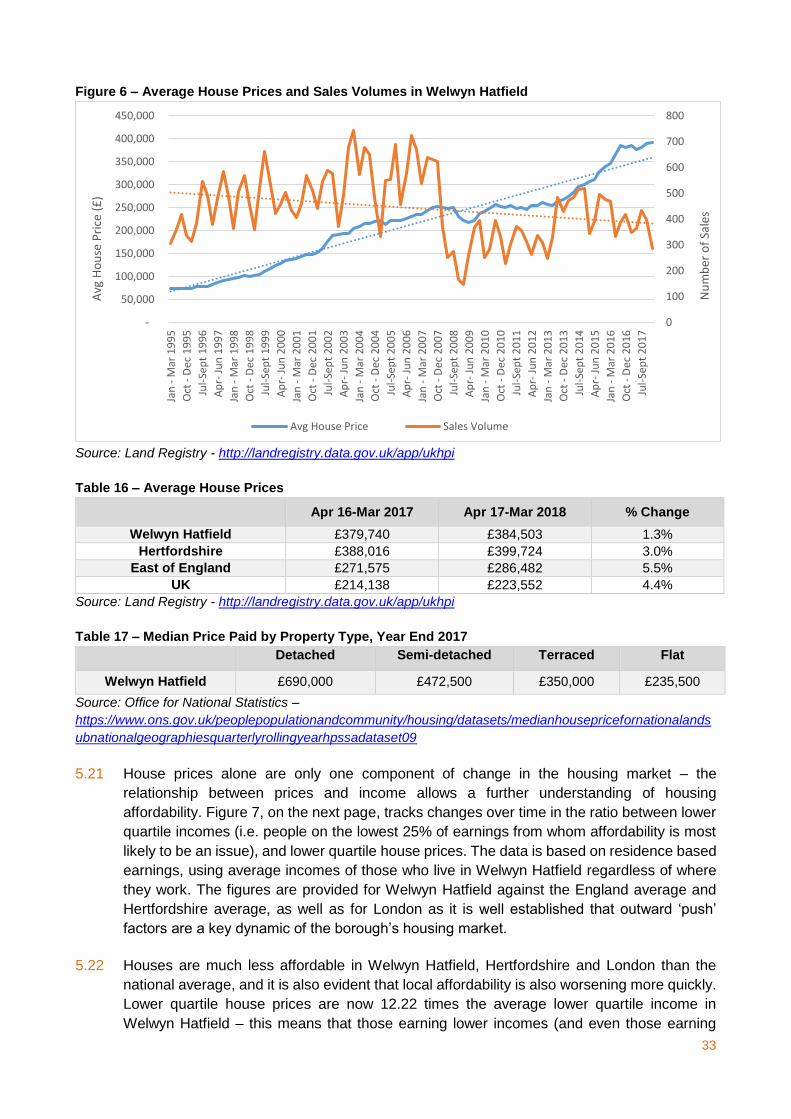
5.20 Figure 6 and table 15 on the next page show Land Registry’s House Price Index based on
sales in Welwyn Hatfield. The average house price between April 2017 and Mar 2018 was
£384,503, a 1.3% increase from the same period the previous year. House prices in Welwyn
Hatfield are still well above both the national and East of England regional averages, despite
both areas recording higher rises in prices during the year - at 4.4% and 5.5% respectively.
House prices in the borough remain just below the average for Hertfordshire, which also
recorded a greater increase in prices at 3.0% in 2017/18. Table 16 shows the median price
paid in Jan-Dec 2017 split by property type.
0
200
400
600
800
1000
1200
1400
Completions Planning permissions Local Plan Sites - Green Belt Local Plan Sites - Urban/HELAA/ASR Windfall
33
Figure 6 – Average House Prices and Sales Volumes in Welwyn Hatfield
Source: Land Registry - http://landregistry.data.gov.uk/app/ukhpi
Table 16 – Average House Prices
Apr 16-Mar 2017 Apr 17-Mar 2018 % Change
Welwyn Hatfield £379,740 £384,503 1.3%
Hertfordshire £388,016 £399,724 3.0%
East of England £271,575 £286,482 5.5%
UK £214,138 £223,552 4.4%
Source: Land Registry - http://landregistry.data.gov.uk/app/ukhpi
Table 17 – Median Price Paid by Property Type, Year End 2017 Detached Semi-detached Terraced Flat
Welwyn Hatfield £690,000 £472,500 £350,000 £235,500
Source: Office for National Statistics –
https://www.ons.gov.uk/peoplepopulationandcommunity/housing/datasets/medianhousepricefornationalands
ubnationalgeographiesquarterlyrollingyearhpssadataset09
5.21 House prices alone are only one component of change in the housing market – the
relationship between prices and income allows a further understanding of housing
affordability. Figure 7, on the next page, tracks changes over time in the ratio between lower
quartile incomes (i.e. people on the lowest 25% of earnings from whom affordability is most
likely to be an issue), and lower quartile house prices. The data is based on residence based
earnings, using average incomes of those who live in Welwyn Hatfield regardless of where
they work. The figures are provided for Welwyn Hatfield against the England average and
Hertfordshire average, as well as for London as it is well established that outward ‘push’
factors are a key dynamic of the borough’s housing market.
5.22 Houses are much less affordable in Welwyn Hatfield, Hertfordshire and London than the
national average, and it is also evident that local affordability is also worsening more quickly.
Lower quartile house prices are now 12.22 times the average lower quartile income in
Welwyn Hatfield – this means that those earning lower incomes (and even those earning
0
100
200
300
400
500
600
700
800
-
50,000
100,000
150,000
200,000
250,000
300,000
350,000
400,000
450,000
Jan
- M
ar 1
99
5
Oct
- D
ec 1
99
5
Jul-
Sep
t 1
99
6
Ap
r- J
un
19
97
Jan
- M
ar 1
99
8
Oct
- D
ec 1
99
8
Jul-
Sep
t 1
99
9
Ap
r- J
un
20
00
Jan
- M
ar 2
00
1
Oct
- D
ec 2
00
1
Jul-
Sep
t 2
00
2
Ap
r- J
un
20
03
Jan
- M
ar 2
00
4
Oct
- D
ec 2
00
4
Jul-
Sep
t 2
00
5
Ap
r- J
un
20
06
Jan
- M
ar 2
00
7
Oct
- D
ec 2
00
7
Jul-
Sep
t 2
00
8
Ap
r- J
un
20
09
Jan
- M
ar 2
01
0
Oct
- D
ec 2
01
0
Jul-
Sep
t 2
01
1
Ap
r- J
un
20
12
Jan
- M
ar 2
01
3
Oct
- D
ec 2
01
3
Jul-
Sep
t 2
01
4
Ap
r- J
un
20
15
Jan
- M
ar 2
01
6
Oct
- D
ec 2
01
6
Jul-
Sep
t 2
01
7
Nu
mb
er o
f Sa
les
Avg
Ho
use
Pri
ce (
£)
Avg House Price Sales Volume
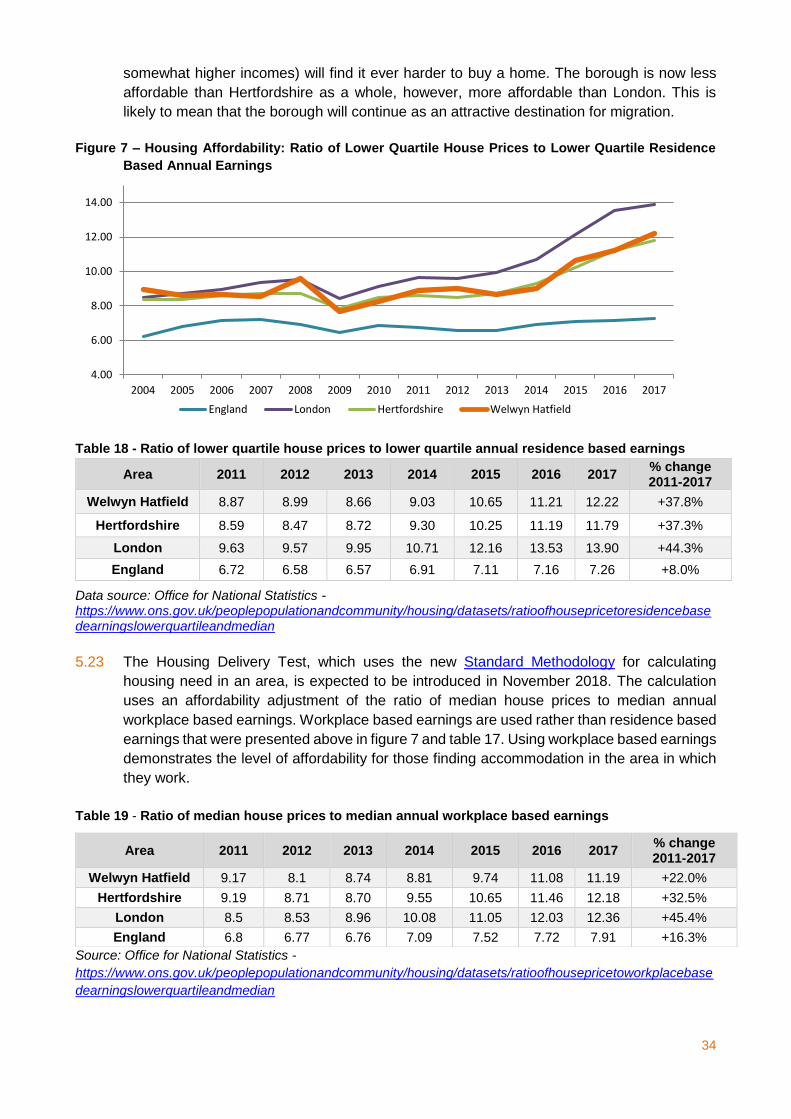
34
somewhat higher incomes) will find it ever harder to buy a home. The borough is now less
affordable than Hertfordshire as a whole, however, more affordable than London. This is
likely to mean that the borough will continue as an attractive destination for migration.
Figure 7 – Housing Affordability: Ratio of Lower Quartile House Prices to Lower Quartile Residence
Based Annual Earnings
Table 18 - Ratio of lower quartile house prices to lower quartile annual residence based earnings
Area 2011 2012 2013 2014 2015 2016 2017 % change 2011-2017
Welwyn Hatfield 8.87 8.99 8.66 9.03 10.65 11.21 12.22 +37.8%
Hertfordshire 8.59 8.47 8.72 9.30 10.25 11.19 11.79 +37.3%
London 9.63 9.57 9.95 10.71 12.16 13.53 13.90 +44.3%
England 6.72 6.58 6.57 6.91 7.11 7.16 7.26 +8.0%
Data source: Office for National Statistics -https://www.ons.gov.uk/peoplepopulationandcommunity/housing/datasets/ratioofhousepricetoresidencebasedearningslowerquartileandmedian
5.23 The Housing Delivery Test, which uses the new Standard Methodology for calculating
housing need in an area, is expected to be introduced in November 2018. The calculation
uses an affordability adjustment of the ratio of median house prices to median annual
workplace based earnings. Workplace based earnings are used rather than residence based
earnings that were presented above in figure 7 and table 17. Using workplace based earnings
demonstrates the level of affordability for those finding accommodation in the area in which
they work.
Table 19 - Ratio of median house prices to median annual workplace based earnings
Source: Office for National Statistics -
https://www.ons.gov.uk/peoplepopulationandcommunity/housing/datasets/ratioofhousepricetoworkplacebase
dearningslowerquartileandmedian
4.00
6.00
8.00
10.00
12.00
14.00
2004 2005 2006 2007 2008 2009 2010 2011 2012 2013 2014 2015 2016 2017
England London Hertfordshire Welwyn Hatfield
Area 2011 2012 2013 2014 2015 2016 2017 % change 2011-2017
Welwyn Hatfield 9.17 8.1 8.74 8.81 9.74 11.08 11.19 +22.0%
Hertfordshire 9.19 8.71 8.70 9.55 10.65 11.46 12.18 +32.5%
London 8.5 8.53 8.96 10.08 11.05 12.03 12.36 +45.4%
England 6.8 6.77 6.76 7.09 7.52 7.72 7.91 +16.3%
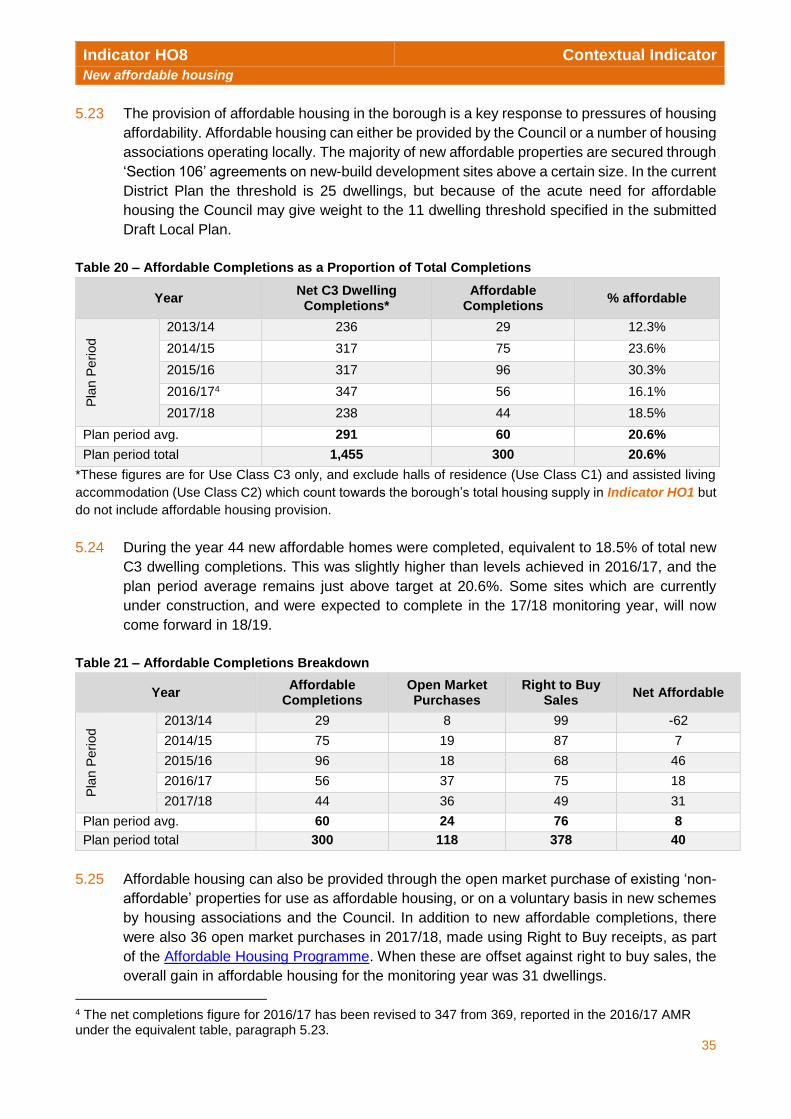
35
5.23 The provision of affordable housing in the borough is a key response to pressures of housing
affordability. Affordable housing can either be provided by the Council or a number of housing
associations operating locally. The majority of new affordable properties are secured through
‘Section 106’ agreements on new-build development sites above a certain size. In the current
District Plan the threshold is 25 dwellings, but because of the acute need for affordable
housing the Council may give weight to the 11 dwelling threshold specified in the submitted
Draft Local Plan.
Table 20 – Affordable Completions as a Proportion of Total Completions
Year Net C3 Dwelling Completions*
Affordable Completions
% affordable
Pla
n P
eri
od
2013/14 236 29 12.3%
2014/15 317 75 23.6%
2015/16 317 96 30.3%
2016/174 347 56 16.1%
2017/18 238 44 18.5%
Plan period avg. 291 60 20.6%
Plan period total 1,455 300 20.6%
*These figures are for Use Class C3 only, and exclude halls of residence (Use Class C1) and assisted living
accommodation (Use Class C2) which count towards the borough’s total housing supply in Indicator HO1 but
do not include affordable housing provision.
5.24 During the year 44 new affordable homes were completed, equivalent to 18.5% of total new
C3 dwelling completions. This was slightly higher than levels achieved in 2016/17, and the
plan period average remains just above target at 20.6%. Some sites which are currently
under construction, and were expected to complete in the 17/18 monitoring year, will now
come forward in 18/19.
Table 21 – Affordable Completions Breakdown
Year Affordable
Completions Open Market Purchases
Right to Buy Sales
Net Affordable
Pla
n P
eri
od
2013/14 29 8 99 -62
2014/15 75 19 87 7
2015/16 96 18 68 46
2016/17 56 37 75 18
2017/18 44 36 49 31
Plan period avg. 60 24 76 8
Plan period total 300 118 378 40
5.25 Affordable housing can also be provided through the open market purchase of existing ‘non-
affordable’ properties for use as affordable housing, or on a voluntary basis in new schemes
by housing associations and the Council. In addition to new affordable completions, there
were also 36 open market purchases in 2017/18, made using Right to Buy receipts, as part
of the Affordable Housing Programme. When these are offset against right to buy sales, the
overall gain in affordable housing for the monitoring year was 31 dwellings.
4 The net completions figure for 2016/17 has been revised to 347 from 369, reported in the 2016/17 AMR under the equivalent table, paragraph 5.23.
Indicator HO8 Contextual Indicator
New affordable housing
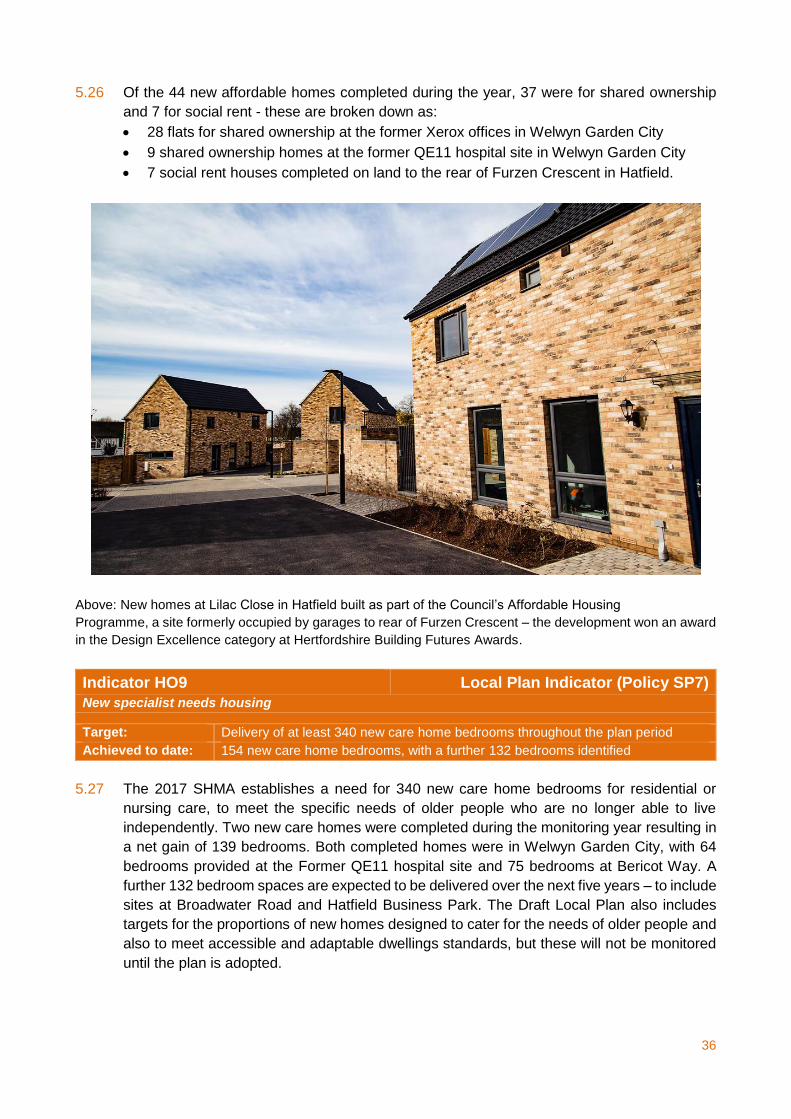
36
5.26 Of the 44 new affordable homes completed during the year, 37 were for shared ownership
and 7 for social rent - these are broken down as:
28 flats for shared ownership at the former Xerox offices in Welwyn Garden City
9 shared ownership homes at the former QE11 hospital site in Welwyn Garden City
7 social rent houses completed on land to the rear of Furzen Crescent in Hatfield.
Above: New homes at Lilac Close in Hatfield built as part of the Council’s Affordable Housing
Programme, a site formerly occupied by garages to rear of Furzen Crescent – the development won an award
in the Design Excellence category at Hertfordshire Building Futures Awards.
Indicator HO9 Local Plan Indicator (Policy SP7)
New specialist needs housing
Target: Delivery of at least 340 new care home bedrooms throughout the plan period
Achieved to date: 154 new care home bedrooms, with a further 132 bedrooms identified
5.27 The 2017 SHMA establishes a need for 340 new care home bedrooms for residential or
nursing care, to meet the specific needs of older people who are no longer able to live
independently. Two new care homes were completed during the monitoring year resulting in
a net gain of 139 bedrooms. Both completed homes were in Welwyn Garden City, with 64
bedrooms provided at the Former QE11 hospital site and 75 bedrooms at Bericot Way. A
further 132 bedroom spaces are expected to be delivered over the next five years – to include
sites at Broadwater Road and Hatfield Business Park. The Draft Local Plan also includes
targets for the proportions of new homes designed to cater for the needs of older people and
also to meet accessible and adaptable dwellings standards, but these will not be monitored
until the plan is adopted.
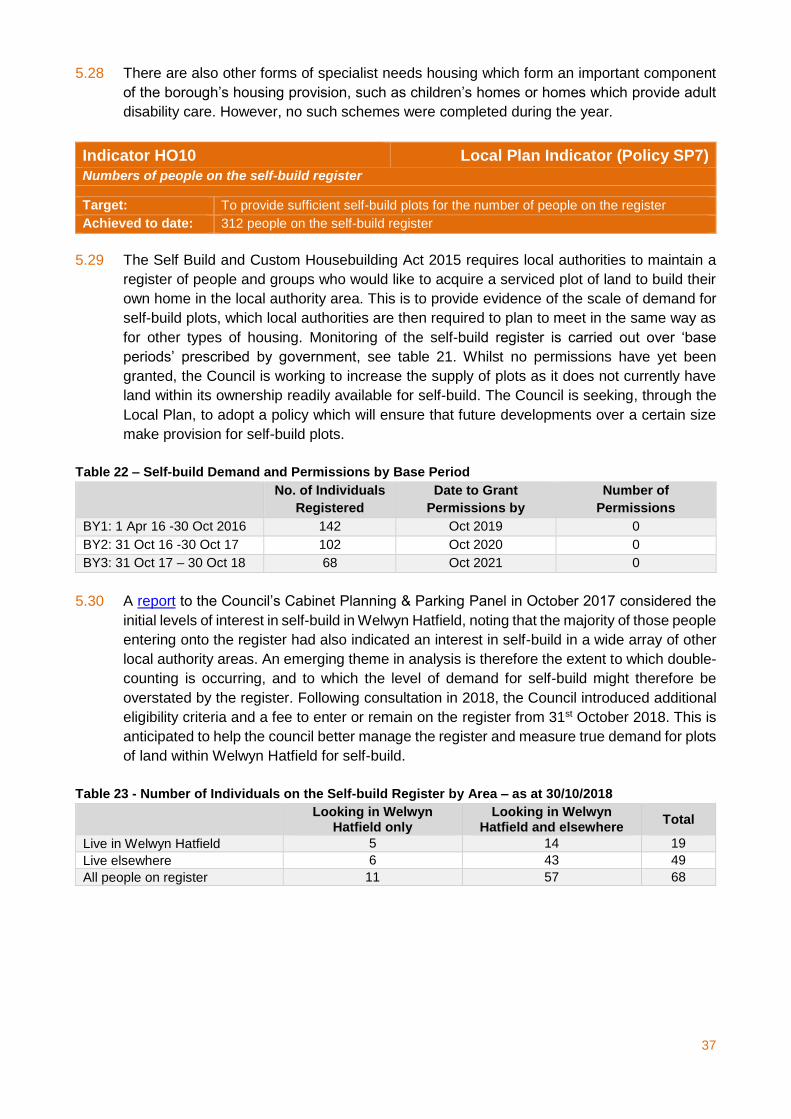
37
5.28 There are also other forms of specialist needs housing which form an important component
of the borough’s housing provision, such as children’s homes or homes which provide adult
disability care. However, no such schemes were completed during the year.
Indicator HO10 Local Plan Indicator (Policy SP7)
Numbers of people on the self-build register
Target: To provide sufficient self-build plots for the number of people on the register
Achieved to date: 312 people on the self-build register
5.29 The Self Build and Custom Housebuilding Act 2015 requires local authorities to maintain a
register of people and groups who would like to acquire a serviced plot of land to build their
own home in the local authority area. This is to provide evidence of the scale of demand for
self-build plots, which local authorities are then required to plan to meet in the same way as
for other types of housing. Monitoring of the self-build register is carried out over ‘base
periods’ prescribed by government, see table 21. Whilst no permissions have yet been
granted, the Council is working to increase the supply of plots as it does not currently have
land within its ownership readily available for self-build. The Council is seeking, through the
Local Plan, to adopt a policy which will ensure that future developments over a certain size
make provision for self-build plots.
Table 22 – Self-build Demand and Permissions by Base Period
No. of Individuals
Registered
Date to Grant
Permissions by
Number of
Permissions
BY1: 1 Apr 16 -30 Oct 2016 142 Oct 2019 0
BY2: 31 Oct 16 -30 Oct 17 102 Oct 2020 0
BY3: 31 Oct 17 – 30 Oct 18 68 Oct 2021 0
5.30 A report to the Council’s Cabinet Planning & Parking Panel in October 2017 considered the
initial levels of interest in self-build in Welwyn Hatfield, noting that the majority of those people
entering onto the register had also indicated an interest in self-build in a wide array of other
local authority areas. An emerging theme in analysis is therefore the extent to which double-
counting is occurring, and to which the level of demand for self-build might therefore be
overstated by the register. Following consultation in 2018, the Council introduced additional
eligibility criteria and a fee to enter or remain on the register from 31st October 2018. This is
anticipated to help the council better manage the register and measure true demand for plots
of land within Welwyn Hatfield for self-build.
Table 23 - Number of Individuals on the Self-build Register by Area – as at 30/10/2018
Looking in Welwyn
Hatfield only Looking in Welwyn
Hatfield and elsewhere Total
Live in Welwyn Hatfield 5 14 19
Live elsewhere 6 43 49
All people on register 11 57 68
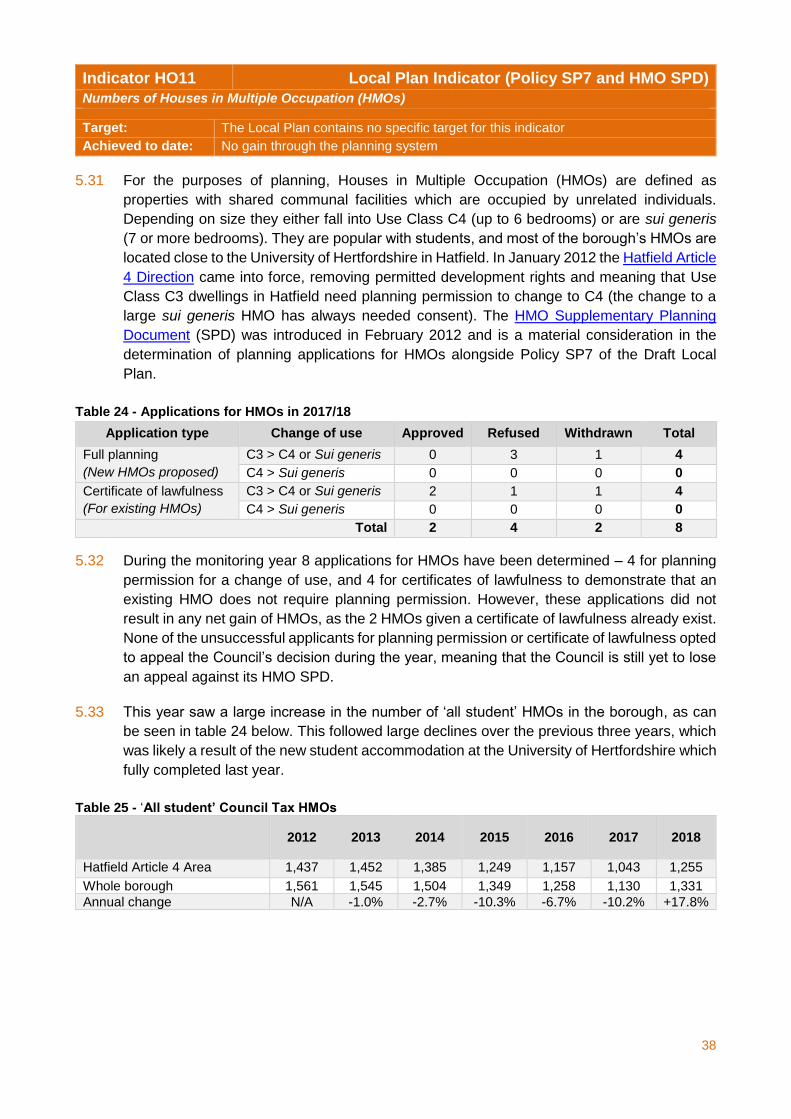
38
Indicator HO11 Local Plan Indicator (Policy SP7 and HMO SPD)
Numbers of Houses in Multiple Occupation (HMOs)
Target: The Local Plan contains no specific target for this indicator
Achieved to date: No gain through the planning system
5.31 For the purposes of planning, Houses in Multiple Occupation (HMOs) are defined as
properties with shared communal facilities which are occupied by unrelated individuals.
Depending on size they either fall into Use Class C4 (up to 6 bedrooms) or are sui generis
(7 or more bedrooms). They are popular with students, and most of the borough’s HMOs are
located close to the University of Hertfordshire in Hatfield. In January 2012 the Hatfield Article
4 Direction came into force, removing permitted development rights and meaning that Use
Class C3 dwellings in Hatfield need planning permission to change to C4 (the change to a
large sui generis HMO has always needed consent). The HMO Supplementary Planning
Document (SPD) was introduced in February 2012 and is a material consideration in the
determination of planning applications for HMOs alongside Policy SP7 of the Draft Local
Plan.
Table 24 - Applications for HMOs in 2017/18
Application type Change of use Approved Refused Withdrawn Total
Full planning
(New HMOs proposed)
C3 > C4 or Sui generis 0 3 1 4
C4 > Sui generis 0 0 0 0
Certificate of lawfulness
(For existing HMOs)
C3 > C4 or Sui generis 2 1 1 4
C4 > Sui generis 0 0 0 0
Total 2 4 2 8
5.32 During the monitoring year 8 applications for HMOs have been determined – 4 for planning
permission for a change of use, and 4 for certificates of lawfulness to demonstrate that an
existing HMO does not require planning permission. However, these applications did not
result in any net gain of HMOs, as the 2 HMOs given a certificate of lawfulness already exist.
None of the unsuccessful applicants for planning permission or certificate of lawfulness opted
to appeal the Council’s decision during the year, meaning that the Council is still yet to lose
an appeal against its HMO SPD.
5.33 This year saw a large increase in the number of ‘all student’ HMOs in the borough, as can
be seen in table 24 below. This followed large declines over the previous three years, which
was likely a result of the new student accommodation at the University of Hertfordshire which
fully completed last year.
Table 25 - ‘All student’ Council Tax HMOs
2012 2013 2014 2015 2016 2017 2018
Hatfield Article 4 Area 1,437 1,452 1,385 1,249 1,157 1,043 1,255
Whole borough 1,561 1,545 1,504 1,349 1,258 1,130 1,331
Annual change N/A -1.0% -2.7% -10.3% -6.7% -10.2% +17.8%
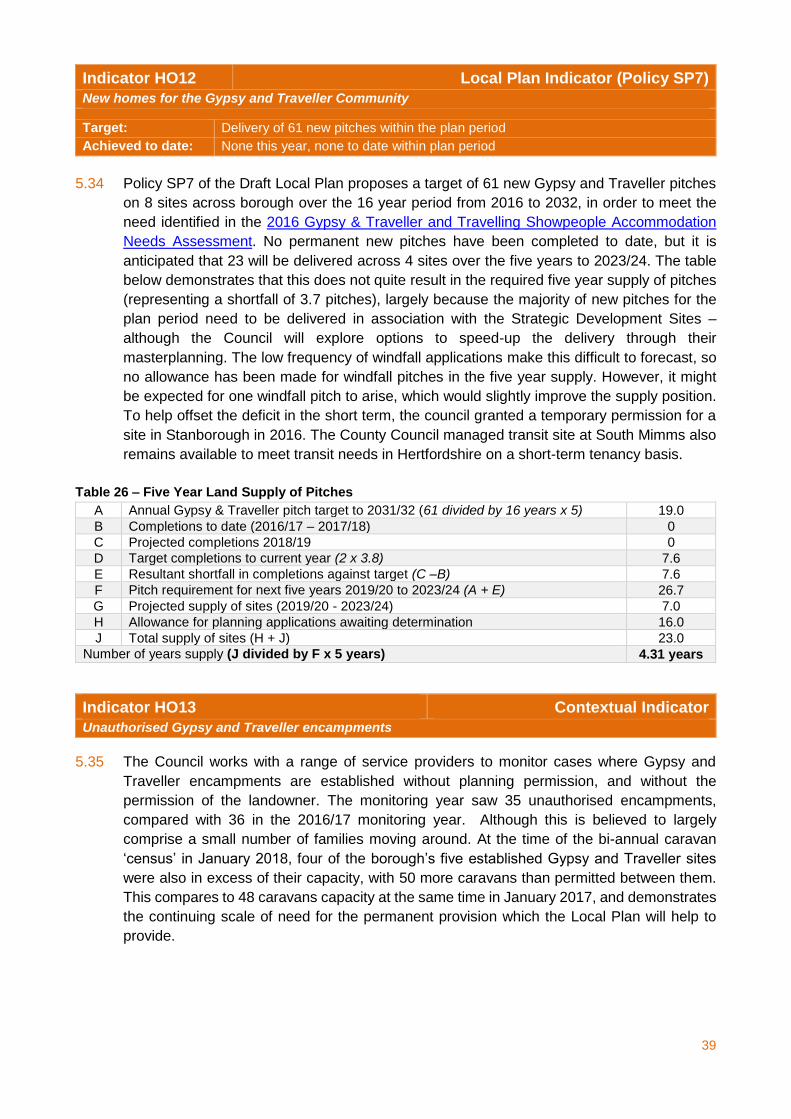
39
Indicator HO12 Local Plan Indicator (Policy SP7)
New homes for the Gypsy and Traveller Community
Target: Delivery of 61 new pitches within the plan period
Achieved to date: None this year, none to date within plan period
5.34 Policy SP7 of the Draft Local Plan proposes a target of 61 new Gypsy and Traveller pitches
on 8 sites across borough over the 16 year period from 2016 to 2032, in order to meet the
need identified in the 2016 Gypsy & Traveller and Travelling Showpeople Accommodation
Needs Assessment. No permanent new pitches have been completed to date, but it is
anticipated that 23 will be delivered across 4 sites over the five years to 2023/24. The table
below demonstrates that this does not quite result in the required five year supply of pitches
(representing a shortfall of 3.7 pitches), largely because the majority of new pitches for the
plan period need to be delivered in association with the Strategic Development Sites –
although the Council will explore options to speed-up the delivery through their
masterplanning. The low frequency of windfall applications make this difficult to forecast, so
no allowance has been made for windfall pitches in the five year supply. However, it might
be expected for one windfall pitch to arise, which would slightly improve the supply position.
To help offset the deficit in the short term, the council granted a temporary permission for a
site in Stanborough in 2016. The County Council managed transit site at South Mimms also
remains available to meet transit needs in Hertfordshire on a short-term tenancy basis.
Table 26 – Five Year Land Supply of Pitches
A Annual Gypsy & Traveller pitch target to 2031/32 (61 divided by 16 years x 5) 19.0
B Completions to date (2016/17 – 2017/18) 0
C Projected completions 2018/19 0
D Target completions to current year (2 x 3.8) 7.6
E Resultant shortfall in completions against target (C –B) 7.6
F Pitch requirement for next five years 2019/20 to 2023/24 (A + E) 26.7
G Projected supply of sites (2019/20 - 2023/24) 7.0
H Allowance for planning applications awaiting determination 16.0
J Total supply of sites (H + J) 23.0
Number of years supply (J divided by F x 5 years) 4.31 years
Indicator HO13 Contextual Indicator
Unauthorised Gypsy and Traveller encampments
5.35 The Council works with a range of service providers to monitor cases where Gypsy and
Traveller encampments are established without planning permission, and without the
permission of the landowner. The monitoring year saw 35 unauthorised encampments,
compared with 36 in the 2016/17 monitoring year. Although this is believed to largely
comprise a small number of families moving around. At the time of the bi-annual caravan
‘census’ in January 2018, four of the borough’s five established Gypsy and Traveller sites
were also in excess of their capacity, with 50 more caravans than permitted between them.
This compares to 48 caravans capacity at the same time in January 2017, and demonstrates
the continuing scale of need for the permanent provision which the Local Plan will help to
provide.
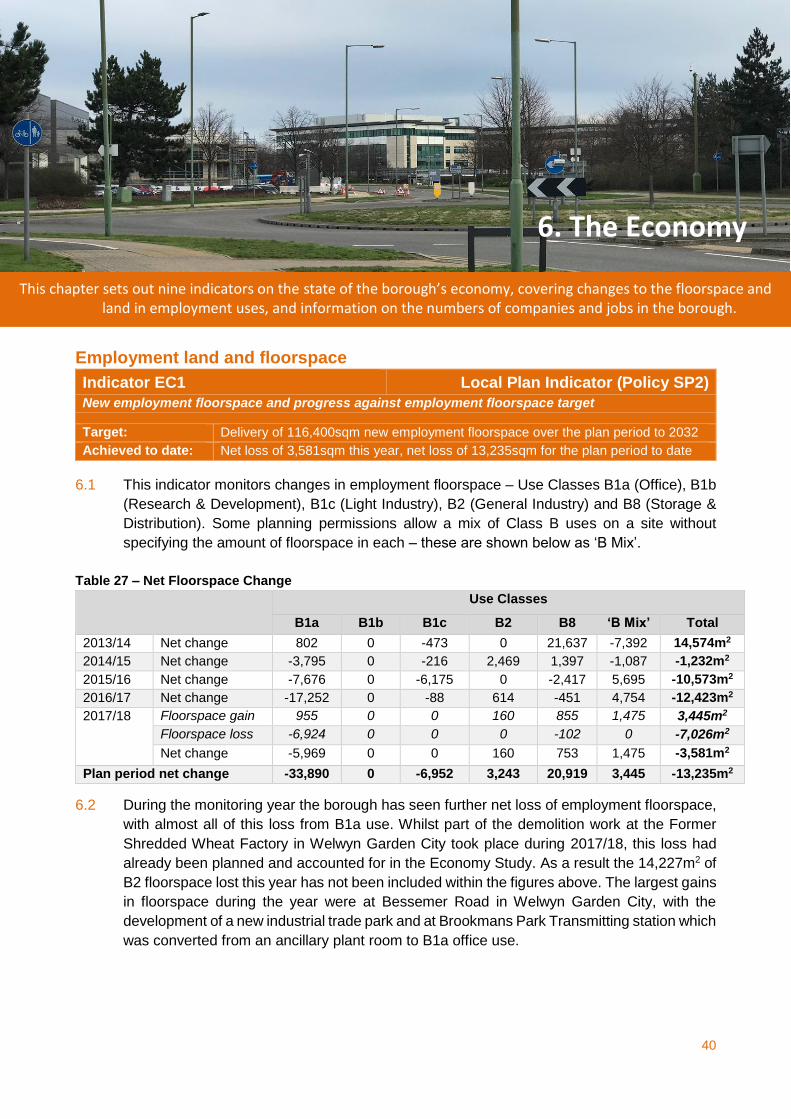
40
This chapter sets out nine indicators on the state of the borough’s economy, covering changes to the floorspace and land in employment uses, and information on the numbers of companies and jobs in the borough.
Employment land and floorspace
Indicator EC1 Local Plan Indicator (Policy SP2)
New employment floorspace and progress against employment floorspace target
Target: Delivery of 116,400sqm new employment floorspace over the plan period to 2032
Achieved to date: Net loss of 3,581sqm this year, net loss of 13,235sqm for the plan period to date
6.1 This indicator monitors changes in employment floorspace – Use Classes B1a (Office), B1b
(Research & Development), B1c (Light Industry), B2 (General Industry) and B8 (Storage &
Distribution). Some planning permissions allow a mix of Class B uses on a site without
specifying the amount of floorspace in each – these are shown below as ‘B Mix’.
Table 27 – Net Floorspace Change
Use Classes
B1a B1b B1c B2 B8 ‘B Mix’ Total
2013/14 Net change 802 0 -473 0 21,637 -7,392 14,574m2
2014/15 Net change -3,795 0 -216 2,469 1,397 -1,087 -1,232m2
2015/16 Net change -7,676 0 -6,175 0 -2,417 5,695 -10,573m2
2016/17 Net change -17,252 0 -88 614 -451 4,754 -12,423m2
2017/18 Floorspace gain 955 0 0 160 855 1,475 3,445m2
Floorspace loss -6,924 0 0 0 -102 0 -7,026m2
Net change -5,969 0 0 160 753 1,475 -3,581m2
Plan period net change -33,890 0 -6,952 3,243 20,919 3,445 -13,235m2
6.2 During the monitoring year the borough has seen further net loss of employment floorspace,
with almost all of this loss from B1a use. Whilst part of the demolition work at the Former
Shredded Wheat Factory in Welwyn Garden City took place during 2017/18, this loss had
already been planned and accounted for in the Economy Study. As a result the 14,227m2 of
B2 floorspace lost this year has not been included within the figures above. The largest gains
in floorspace during the year were at Bessemer Road in Welwyn Garden City, with the
development of a new industrial trade park and at Brookmans Park Transmitting station which
was converted from an ancillary plant room to B1a office use.
6. The Economy
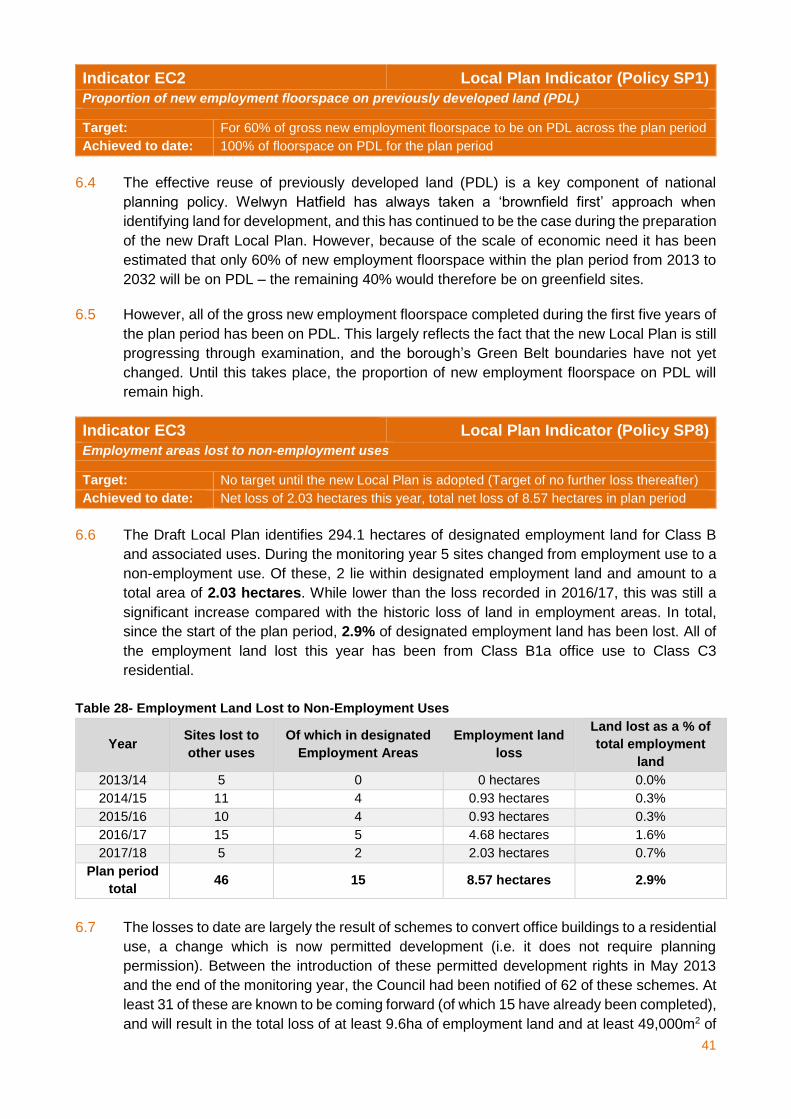
41
Indicator EC2 Local Plan Indicator (Policy SP1)
Proportion of new employment floorspace on previously developed land (PDL)
Target: For 60% of gross new employment floorspace to be on PDL across the plan period
Achieved to date: 100% of floorspace on PDL for the plan period
6.4 The effective reuse of previously developed land (PDL) is a key component of national
planning policy. Welwyn Hatfield has always taken a ‘brownfield first’ approach when
identifying land for development, and this has continued to be the case during the preparation
of the new Draft Local Plan. However, because of the scale of economic need it has been
estimated that only 60% of new employment floorspace within the plan period from 2013 to
2032 will be on PDL – the remaining 40% would therefore be on greenfield sites.
6.5 However, all of the gross new employment floorspace completed during the first five years of
the plan period has been on PDL. This largely reflects the fact that the new Local Plan is still
progressing through examination, and the borough’s Green Belt boundaries have not yet
changed. Until this takes place, the proportion of new employment floorspace on PDL will
remain high.
Indicator EC3 Local Plan Indicator (Policy SP8)
Employment areas lost to non-employment uses
Target: No target until the new Local Plan is adopted (Target of no further loss thereafter)
Achieved to date: Net loss of 2.03 hectares this year, total net loss of 8.57 hectares in plan period
6.6 The Draft Local Plan identifies 294.1 hectares of designated employment land for Class B
and associated uses. During the monitoring year 5 sites changed from employment use to a
non-employment use. Of these, 2 lie within designated employment land and amount to a
total area of 2.03 hectares. While lower than the loss recorded in 2016/17, this was still a
significant increase compared with the historic loss of land in employment areas. In total,
since the start of the plan period, 2.9% of designated employment land has been lost. All of
the employment land lost this year has been from Class B1a office use to Class C3
residential.
Table 28- Employment Land Lost to Non-Employment Uses
Year Sites lost to
other uses
Of which in designated
Employment Areas
Employment land
loss
Land lost as a % of
total employment
land
2013/14 5 0 0 hectares 0.0%
2014/15 11 4 0.93 hectares 0.3%
2015/16 10 4 0.93 hectares 0.3%
2016/17 15 5 4.68 hectares 1.6%
2017/18 5 2 2.03 hectares 0.7%
Plan period
total 46 15 8.57 hectares 2.9%
6.7 The losses to date are largely the result of schemes to convert office buildings to a residential
use, a change which is now permitted development (i.e. it does not require planning
permission). Between the introduction of these permitted development rights in May 2013
and the end of the monitoring year, the Council had been notified of 62 of these schemes. At
least 31 of these are known to be coming forward (of which 15 have already been completed),
and will result in the total loss of at least 9.6ha of employment land and at least 49,000m2 of
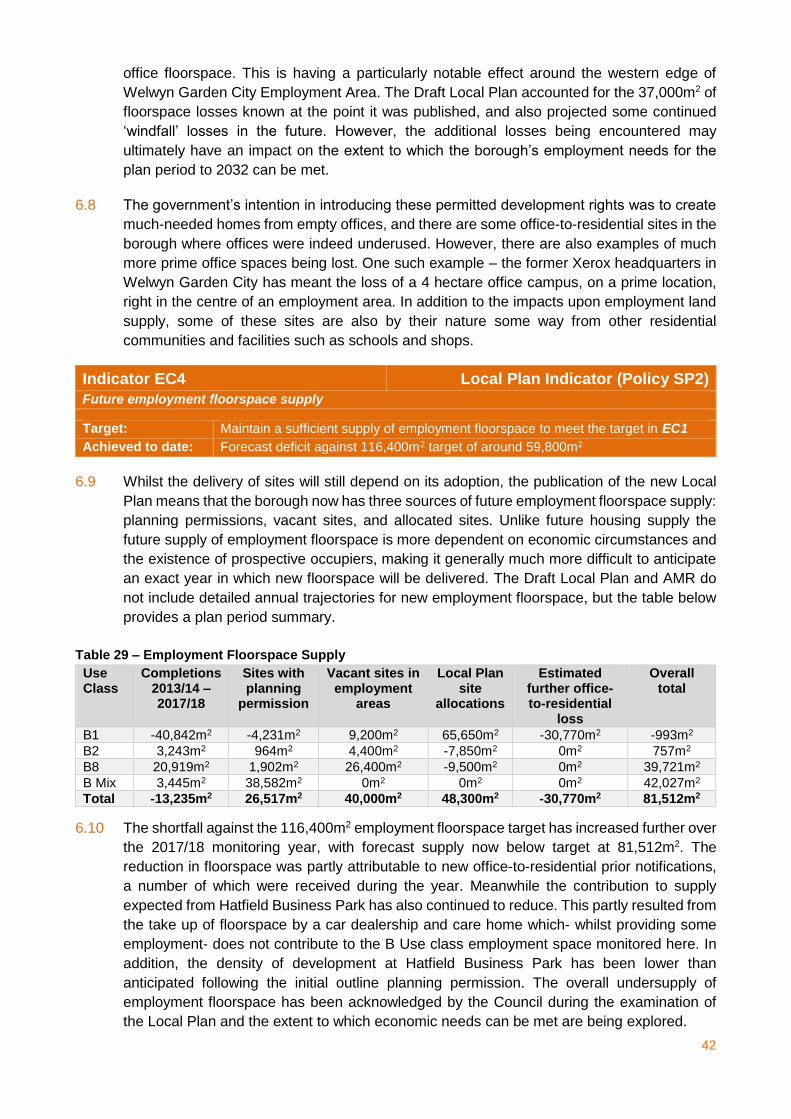
42
office floorspace. This is having a particularly notable effect around the western edge of
Welwyn Garden City Employment Area. The Draft Local Plan accounted for the 37,000m2 of
floorspace losses known at the point it was published, and also projected some continued
‘windfall’ losses in the future. However, the additional losses being encountered may
ultimately have an impact on the extent to which the borough’s employment needs for the
plan period to 2032 can be met.
6.8 The government’s intention in introducing these permitted development rights was to create
much-needed homes from empty offices, and there are some office-to-residential sites in the
borough where offices were indeed underused. However, there are also examples of much
more prime office spaces being lost. One such example – the former Xerox headquarters in
Welwyn Garden City has meant the loss of a 4 hectare office campus, on a prime location,
right in the centre of an employment area. In addition to the impacts upon employment land
supply, some of these sites are also by their nature some way from other residential
communities and facilities such as schools and shops.
Indicator EC4 Local Plan Indicator (Policy SP2)
Future employment floorspace supply
Target: Maintain a sufficient supply of employment floorspace to meet the target in EC1
Achieved to date: Forecast deficit against 116,400m2 target of around 59,800m2
6.9 Whilst the delivery of sites will still depend on its adoption, the publication of the new Local
Plan means that the borough now has three sources of future employment floorspace supply:
planning permissions, vacant sites, and allocated sites. Unlike future housing supply the
future supply of employment floorspace is more dependent on economic circumstances and
the existence of prospective occupiers, making it generally much more difficult to anticipate
an exact year in which new floorspace will be delivered. The Draft Local Plan and AMR do
not include detailed annual trajectories for new employment floorspace, but the table below
provides a plan period summary.
Table 29 – Employment Floorspace Supply
Use Class
Completions 2013/14 – 2017/18
Sites with planning
permission
Vacant sites in employment
areas
Local Plan site
allocations
Estimated further office-to-residential
loss
Overall total
B1 -40,842m2 -4,231m2 9,200m2 65,650m2 -30,770m2 -993m2
B2 3,243m2 964m2 4,400m2 -7,850m2 0m2 757m2
B8 20,919m2 1,902m2 26,400m2 -9,500m2 0m2 39,721m2
B Mix 3,445m2 38,582m2 0m2 0m2 0m2 42,027m2
Total -13,235m2 26,517m2 40,000m2 48,300m2 -30,770m2 81,512m2
6.10 The shortfall against the 116,400m2 employment floorspace target has increased further over
the 2017/18 monitoring year, with forecast supply now below target at 81,512m2. The
reduction in floorspace was partly attributable to new office-to-residential prior notifications,
a number of which were received during the year. Meanwhile the contribution to supply
expected from Hatfield Business Park has also continued to reduce. This partly resulted from
the take up of floorspace by a car dealership and care home which- whilst providing some
employment- does not contribute to the B Use class employment space monitored here. In
addition, the density of development at Hatfield Business Park has been lower than
anticipated following the initial outline planning permission. The overall undersupply of
employment floorspace has been acknowledged by the Council during the examination of
the Local Plan and the extent to which economic needs can be met are being explored.
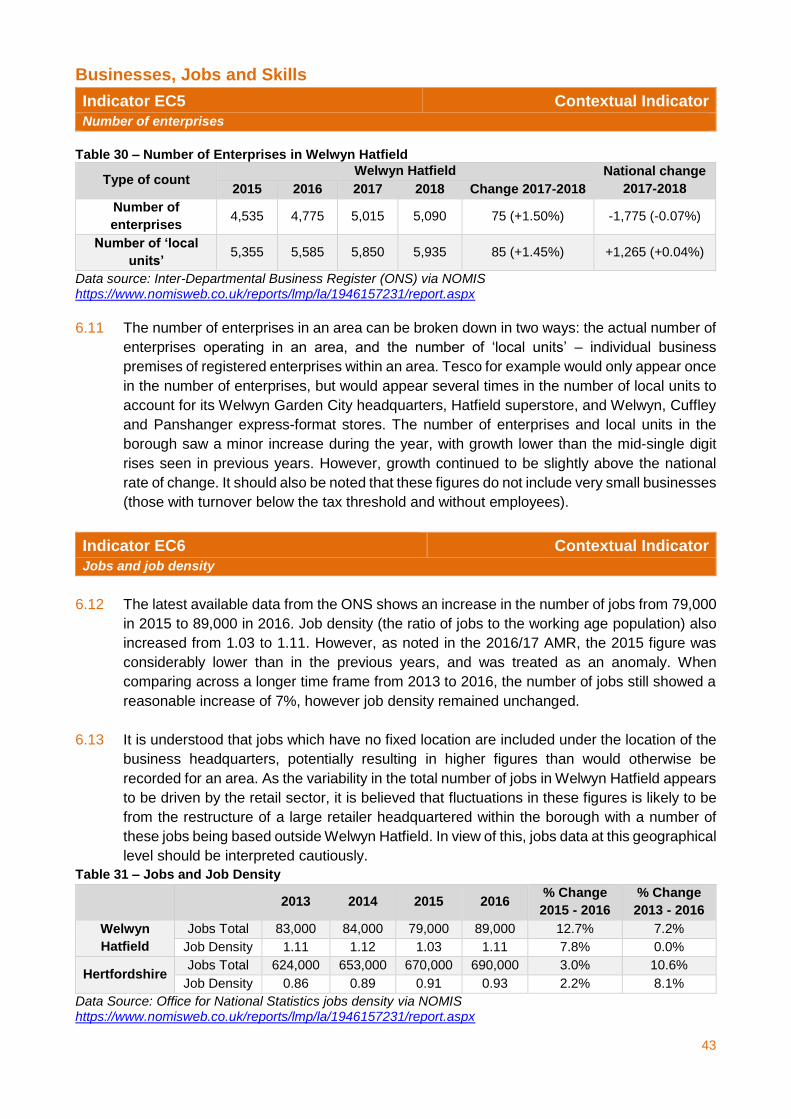
43
Businesses, Jobs and Skills
Indicator EC5 Contextual Indicator
Number of enterprises
Table 30 – Number of Enterprises in Welwyn Hatfield
Type of count Welwyn Hatfield National change
2017-2018 2015 2016 2017 2018 Change 2017-2018
Number of
enterprises 4,535 4,775 5,015 5,090 75 (+1.50%) -1,775 (-0.07%)
Number of ‘local
units’ 5,355 5,585 5,850 5,935 85 (+1.45%) +1,265 (+0.04%)
Data source: Inter-Departmental Business Register (ONS) via NOMIS https://www.nomisweb.co.uk/reports/lmp/la/1946157231/report.aspx
6.11 The number of enterprises in an area can be broken down in two ways: the actual number of
enterprises operating in an area, and the number of ‘local units’ – individual business
premises of registered enterprises within an area. Tesco for example would only appear once
in the number of enterprises, but would appear several times in the number of local units to
account for its Welwyn Garden City headquarters, Hatfield superstore, and Welwyn, Cuffley
and Panshanger express-format stores. The number of enterprises and local units in the
borough saw a minor increase during the year, with growth lower than the mid-single digit
rises seen in previous years. However, growth continued to be slightly above the national
rate of change. It should also be noted that these figures do not include very small businesses
(those with turnover below the tax threshold and without employees).
Indicator EC6 Contextual Indicator
Jobs and job density
6.12 The latest available data from the ONS shows an increase in the number of jobs from 79,000
in 2015 to 89,000 in 2016. Job density (the ratio of jobs to the working age population) also
increased from 1.03 to 1.11. However, as noted in the 2016/17 AMR, the 2015 figure was
considerably lower than in the previous years, and was treated as an anomaly. When
comparing across a longer time frame from 2013 to 2016, the number of jobs still showed a
reasonable increase of 7%, however job density remained unchanged.
6.13 It is understood that jobs which have no fixed location are included under the location of the
business headquarters, potentially resulting in higher figures than would otherwise be
recorded for an area. As the variability in the total number of jobs in Welwyn Hatfield appears
to be driven by the retail sector, it is believed that fluctuations in these figures is likely to be
from the restructure of a large retailer headquartered within the borough with a number of
these jobs being based outside Welwyn Hatfield. In view of this, jobs data at this geographical
level should be interpreted cautiously.
Table 31 – Jobs and Job Density
2013 2014 2015 2016
% Change
2015 - 2016
% Change
2013 - 2016
Welwyn
Hatfield
Jobs Total 83,000 84,000 79,000 89,000 12.7% 7.2%
Job Density 1.11 1.12 1.03 1.11 7.8% 0.0%
Hertfordshire Jobs Total 624,000 653,000 670,000 690,000 3.0% 10.6%
Job Density 0.86 0.89 0.91 0.93 2.2% 8.1%
Data Source: Office for National Statistics jobs density via NOMIS https://www.nomisweb.co.uk/reports/lmp/la/1946157231/report.aspx
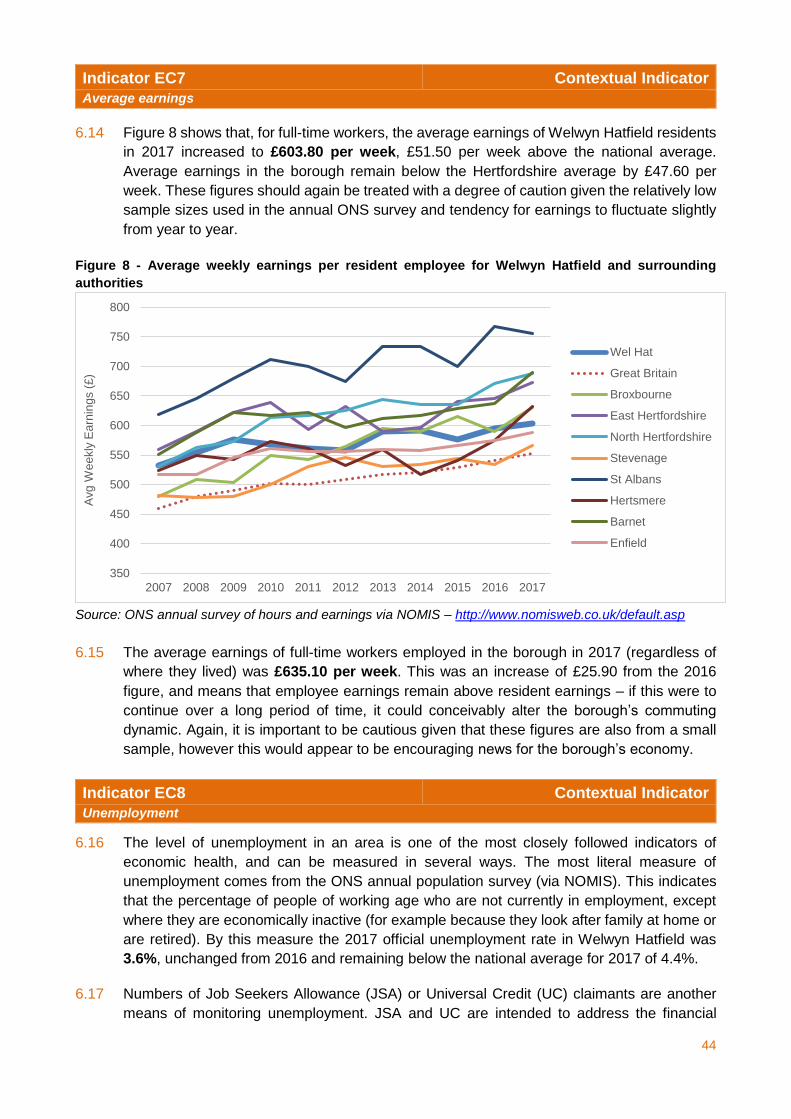
44
Indicator EC7 Contextual Indicator
Average earnings
6.14 Figure 8 shows that, for full-time workers, the average earnings of Welwyn Hatfield residents
in 2017 increased to £603.80 per week, £51.50 per week above the national average.
Average earnings in the borough remain below the Hertfordshire average by £47.60 per
week. These figures should again be treated with a degree of caution given the relatively low
sample sizes used in the annual ONS survey and tendency for earnings to fluctuate slightly
from year to year.
Figure 8 - Average weekly earnings per resident employee for Welwyn Hatfield and surrounding
authorities
Source: ONS annual survey of hours and earnings via NOMIS – http://www.nomisweb.co.uk/default.asp
6.15 The average earnings of full-time workers employed in the borough in 2017 (regardless of
where they lived) was £635.10 per week. This was an increase of £25.90 from the 2016
figure, and means that employee earnings remain above resident earnings – if this were to
continue over a long period of time, it could conceivably alter the borough’s commuting
dynamic. Again, it is important to be cautious given that these figures are also from a small
sample, however this would appear to be encouraging news for the borough’s economy.
Indicator EC8 Contextual Indicator
Unemployment
6.16 The level of unemployment in an area is one of the most closely followed indicators of
economic health, and can be measured in several ways. The most literal measure of
unemployment comes from the ONS annual population survey (via NOMIS). This indicates
that the percentage of people of working age who are not currently in employment, except
where they are economically inactive (for example because they look after family at home or
are retired). By this measure the 2017 official unemployment rate in Welwyn Hatfield was
3.6%, unchanged from 2016 and remaining below the national average for 2017 of 4.4%.
6.17 Numbers of Job Seekers Allowance (JSA) or Universal Credit (UC) claimants are another
means of monitoring unemployment. JSA and UC are intended to address the financial
350
400
450
500
550
600
650
700
750
800
2007 2008 2009 2010 2011 2012 2013 2014 2015 2016 2017
Avg
We
ekly
Ea
rnin
gs (
£)
Wel Hat
Great Britain
Broxbourne
East Hertfordshire
North Hertfordshire
Stevenage
St Albans
Hertsmere
Barnet
Enfield
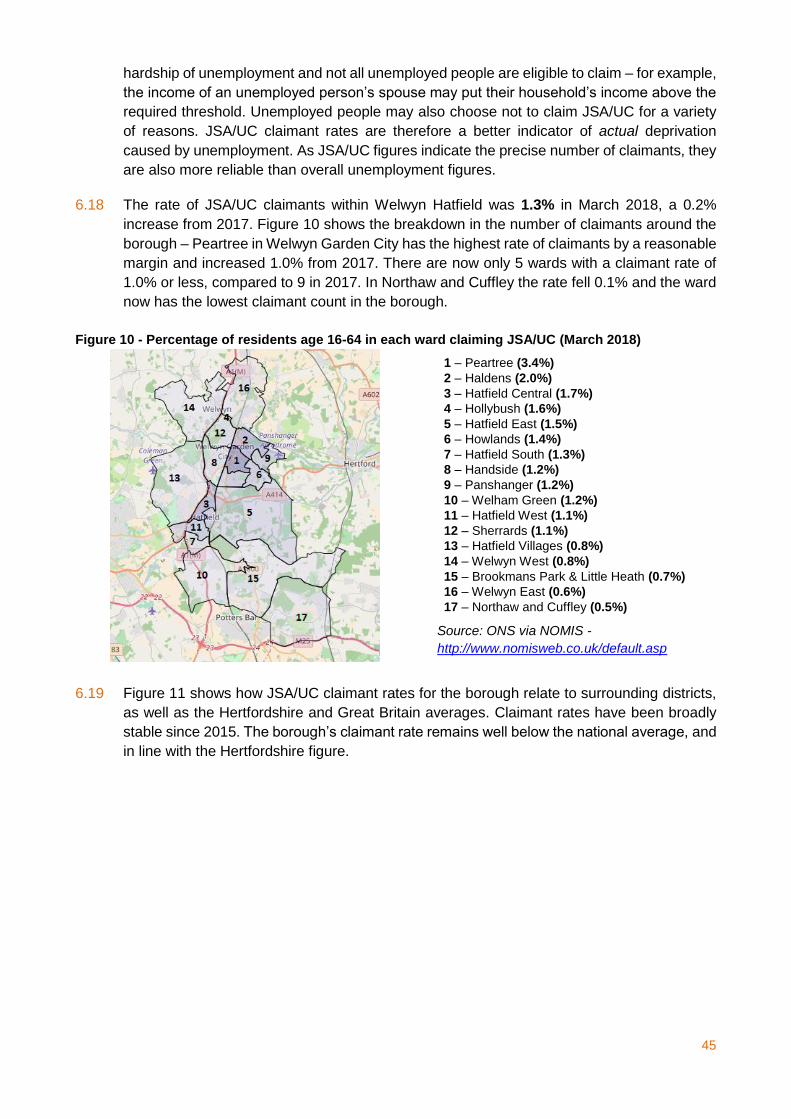
45
hardship of unemployment and not all unemployed people are eligible to claim – for example,
the income of an unemployed person’s spouse may put their household’s income above the
required threshold. Unemployed people may also choose not to claim JSA/UC for a variety
of reasons. JSA/UC claimant rates are therefore a better indicator of actual deprivation
caused by unemployment. As JSA/UC figures indicate the precise number of claimants, they
are also more reliable than overall unemployment figures.
6.18 The rate of JSA/UC claimants within Welwyn Hatfield was 1.3% in March 2018, a 0.2%
increase from 2017. Figure 10 shows the breakdown in the number of claimants around the
borough – Peartree in Welwyn Garden City has the highest rate of claimants by a reasonable
margin and increased 1.0% from 2017. There are now only 5 wards with a claimant rate of
1.0% or less, compared to 9 in 2017. In Northaw and Cuffley the rate fell 0.1% and the ward
now has the lowest claimant count in the borough.
Figure 10 - Percentage of residents age 16-64 in each ward claiming JSA/UC (March 2018)
6.19 Figure 11 shows how JSA/UC claimant rates for the borough relate to surrounding districts,
as well as the Hertfordshire and Great Britain averages. Claimant rates have been broadly
stable since 2015. The borough’s claimant rate remains well below the national average, and
in line with the Hertfordshire figure.
1 – Peartree (3.4%)
2 – Haldens (2.0%)
3 – Hatfield Central (1.7%)
4 – Hollybush (1.6%)
5 – Hatfield East (1.5%)
6 – Howlands (1.4%)
7 – Hatfield South (1.3%)
8 – Handside (1.2%)
9 – Panshanger (1.2%)
10 – Welham Green (1.2%)
11 – Hatfield West (1.1%)
12 – Sherrards (1.1%)
13 – Hatfield Villages (0.8%)
14 – Welwyn West (0.8%)
15 – Brookmans Park & Little Heath (0.7%)
16 – Welwyn East (0.6%)
17 – Northaw and Cuffley (0.5%)
Source: ONS via NOMIS -
http://www.nomisweb.co.uk/default.asp
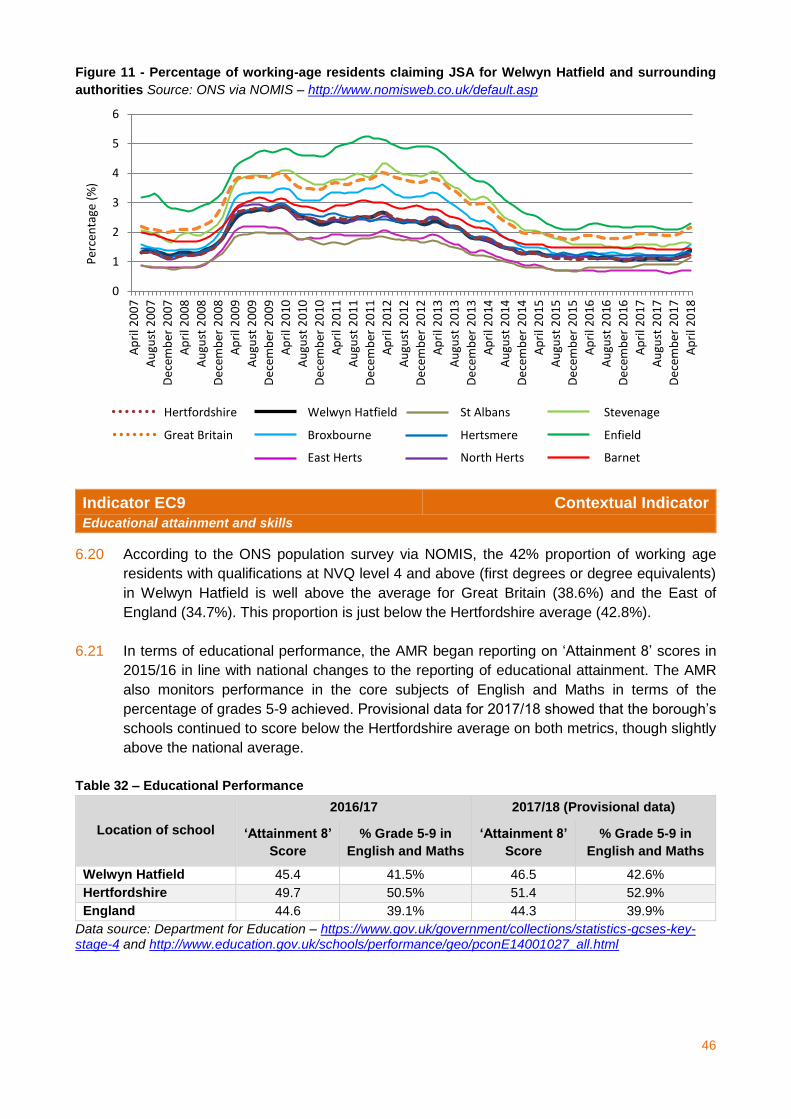
46
Figure 11 - Percentage of working-age residents claiming JSA for Welwyn Hatfield and surrounding
authorities Source: ONS via NOMIS – http://www.nomisweb.co.uk/default.asp
Indicator EC9 Contextual Indicator
Educational attainment and skills
6.20 According to the ONS population survey via NOMIS, the 42% proportion of working age
residents with qualifications at NVQ level 4 and above (first degrees or degree equivalents)
in Welwyn Hatfield is well above the average for Great Britain (38.6%) and the East of
England (34.7%). This proportion is just below the Hertfordshire average (42.8%).
6.21 In terms of educational performance, the AMR began reporting on ‘Attainment 8’ scores in
2015/16 in line with national changes to the reporting of educational attainment. The AMR
also monitors performance in the core subjects of English and Maths in terms of the
percentage of grades 5-9 achieved. Provisional data for 2017/18 showed that the borough’s
schools continued to score below the Hertfordshire average on both metrics, though slightly
above the national average.
Table 32 – Educational Performance
Location of school
2016/17 2017/18 (Provisional data)
‘Attainment 8’
Score
% Grade 5-9 in
English and Maths
‘Attainment 8’
Score
% Grade 5-9 in
English and Maths
Welwyn Hatfield 45.4 41.5% 46.5 42.6%
Hertfordshire 49.7 50.5% 51.4 52.9%
England 44.6 39.1% 44.3 39.9%
Data source: Department for Education – https://www.gov.uk/government/collections/statistics-gcses-key-stage-4 and http://www.education.gov.uk/schools/performance/geo/pconE14001027_all.html
0
1
2
3
4
5
6
Ap
ril 2
00
7
Au
gust
20
07
De
cem
ber
20
07
Ap
ril 2
00
8
Au
gust
20
08
De
cem
ber
20
08
Ap
ril 2
00
9
Au
gust
20
09
De
cem
ber
20
09
Ap
ril 2
01
0
Au
gust
20
10
De
cem
ber
20
10
Ap
ril 2
01
1
Au
gust
20
11
De
cem
ber
20
11
Ap
ril 2
01
2
Au
gust
20
12
De
cem
ber
20
12
Ap
ril 2
01
3
Au
gust
20
13
De
cem
ber
20
13
Ap
ril 2
01
4
Au
gust
20
14
De
cem
ber
20
14
Ap
ril 2
01
5
Au
gust
20
15
De
cem
ber
20
15
Ap
ril 2
01
6
Au
gust
20
16
De
cem
ber
20
16
Ap
ril 2
01
7
Au
gust
20
17
De
cem
ber
20
17
Ap
ril 2
01
8
Per
cen
tage
(%
)
Hertfordshire Welwyn Hatfield St Albans Stevenage
Great Britain Broxbourne Hertsmere Enfield
East Herts North Herts Barnet
47
This chapter contains indicators covering the borough’s environment and the sustainability of new development; across a range of topics including the historic environment, wildlife, open space, green belt, energy, and transport.
The Natural and Historic Environment
Indicator EN1 Local Plan Indicator (Policy SADM15)
Changes to protected historic assets
Targets: No loss of protected heritage assets, or increase in the number ‘at risk’
Achieved to date: Net increase of 3 listed buildings in the borough. Still 1 asset ‘at risk’.
Table 33 – Protected Historic Assets
Type 2017/18 2018/19
Change No of sites Area No of sites Area
Listed Buildings 428 n/a 431 n/a +3 sites
Of which Grade I 6 n/a 6 n/a No change
Of which Grade II* 23 n/a 24 n/a +1 site
Of which Grade II 399 n/a 401 n/a +2 sites
Conservation Areas 8 374ha 8 374ha No change
Areas of Archaeological Significance
73 1,071ha 73 1,071ha No change
Scheduled Ancient Monuments 4 n/a 4 n/a No change
Registered Historic Parks/Gardens 5 1,005ha 5 1,005ha No change
Heritage assets at risk 1 n/a 1 n/a No change
Source: National Heritage List for England, Historic England – https://www.historicengland.org.uk/listing/the-list , Heritage at Risk Register, Historic England – https://www.historicengland.org.uk/advice/heritage-at-risk, Hertfordshire Historic Environment Record via Heritage Gateway – http://www.heritagegateway.org.uk
7.1 This year saw an increase in the number of listed buildings in the borough, with designations
at Grade II* of Hatfield War Memorial and Grade II of Essendon War Memorial and Captain
William Leefe Robinson VC memorial obelisk in Cuffley. Whilst protecting the memorials
themselves, it will also mean that the setting is protected from any future changes. Historic
England’s Heritage at Risk Register continues to show that one listed structure in the borough
is at risk – the Grade II* Paine Bridge at Brocket Hall in Lemsford. Whilst the bridge is not in
any structural danger, stonework cladding on it is slowly decaying – the bridge’s inclusion
partly reflects the fact that no solution to address the decay has been agreed.
7. Environmental Assets
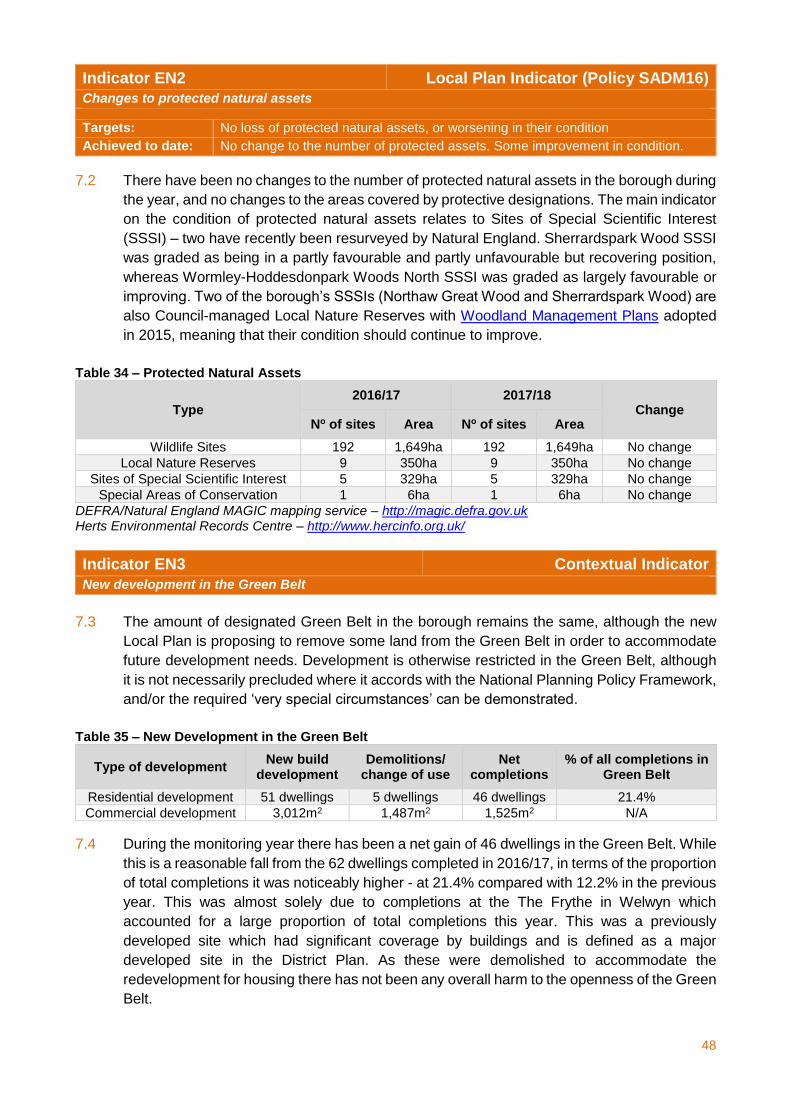
48
Indicator EN2 Local Plan Indicator (Policy SADM16)
Changes to protected natural assets
Targets: No loss of protected natural assets, or worsening in their condition
Achieved to date: No change to the number of protected assets. Some improvement in condition.
7.2 There have been no changes to the number of protected natural assets in the borough during
the year, and no changes to the areas covered by protective designations. The main indicator
on the condition of protected natural assets relates to Sites of Special Scientific Interest
(SSSI) – two have recently been resurveyed by Natural England. Sherrardspark Wood SSSI
was graded as being in a partly favourable and partly unfavourable but recovering position,
whereas Wormley-Hoddesdonpark Woods North SSSI was graded as largely favourable or
improving. Two of the borough’s SSSIs (Northaw Great Wood and Sherrardspark Wood) are
also Council-managed Local Nature Reserves with Woodland Management Plans adopted
in 2015, meaning that their condition should continue to improve.
Table 34 – Protected Natural Assets
Type 2016/17 2017/18
Change No of sites Area No of sites Area
Wildlife Sites 192 1,649ha 192 1,649ha No change
Local Nature Reserves 9 350ha 9 350ha No change
Sites of Special Scientific Interest 5 329ha 5 329ha No change
Special Areas of Conservation 1 6ha 1 6ha No change
DEFRA/Natural England MAGIC mapping service – http://magic.defra.gov.uk Herts Environmental Records Centre – http://www.hercinfo.org.uk/
Indicator EN3 Contextual Indicator
New development in the Green Belt
7.3 The amount of designated Green Belt in the borough remains the same, although the new
Local Plan is proposing to remove some land from the Green Belt in order to accommodate
future development needs. Development is otherwise restricted in the Green Belt, although
it is not necessarily precluded where it accords with the National Planning Policy Framework,
and/or the required ‘very special circumstances’ can be demonstrated.
Table 35 – New Development in the Green Belt
Type of development New build
development Demolitions/
change of use Net
completions % of all completions in
Green Belt
Residential development 51 dwellings 5 dwellings 46 dwellings 21.4%
Commercial development 3,012m2 1,487m2 1,525m2 N/A
7.4 During the monitoring year there has been a net gain of 46 dwellings in the Green Belt. While
this is a reasonable fall from the 62 dwellings completed in 2016/17, in terms of the proportion
of total completions it was noticeably higher - at 21.4% compared with 12.2% in the previous
year. This was almost solely due to completions at the The Frythe in Welwyn which
accounted for a large proportion of total completions this year. This was a previously
developed site which had significant coverage by buildings and is defined as a major
developed site in the District Plan. As these were demolished to accommodate the
redevelopment for housing there has not been any overall harm to the openness of the Green
Belt.
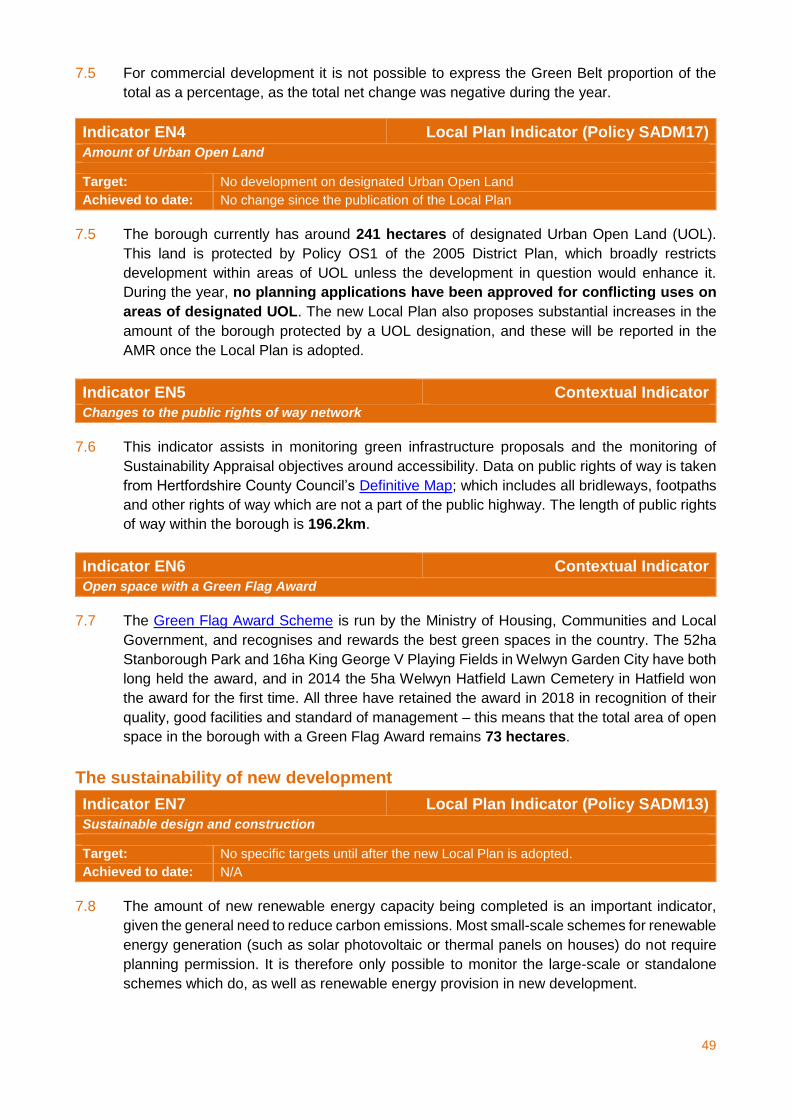
49
7.5 For commercial development it is not possible to express the Green Belt proportion of the
total as a percentage, as the total net change was negative during the year.
Indicator EN4 Local Plan Indicator (Policy SADM17)
Amount of Urban Open Land
Target: No development on designated Urban Open Land
Achieved to date: No change since the publication of the Local Plan
7.5 The borough currently has around 241 hectares of designated Urban Open Land (UOL).
This land is protected by Policy OS1 of the 2005 District Plan, which broadly restricts
development within areas of UOL unless the development in question would enhance it.
During the year, no planning applications have been approved for conflicting uses on
areas of designated UOL. The new Local Plan also proposes substantial increases in the
amount of the borough protected by a UOL designation, and these will be reported in the
AMR once the Local Plan is adopted.
Indicator EN5 Contextual Indicator
Changes to the public rights of way network
7.6 This indicator assists in monitoring green infrastructure proposals and the monitoring of
Sustainability Appraisal objectives around accessibility. Data on public rights of way is taken
from Hertfordshire County Council’s Definitive Map; which includes all bridleways, footpaths
and other rights of way which are not a part of the public highway. The length of public rights
of way within the borough is 196.2km.
Indicator EN6 Contextual Indicator
Open space with a Green Flag Award
7.7 The Green Flag Award Scheme is run by the Ministry of Housing, Communities and Local
Government, and recognises and rewards the best green spaces in the country. The 52ha
Stanborough Park and 16ha King George V Playing Fields in Welwyn Garden City have both
long held the award, and in 2014 the 5ha Welwyn Hatfield Lawn Cemetery in Hatfield won
the award for the first time. All three have retained the award in 2018 in recognition of their
quality, good facilities and standard of management – this means that the total area of open
space in the borough with a Green Flag Award remains 73 hectares.
The sustainability of new development
Indicator EN7 Local Plan Indicator (Policy SADM13)
Sustainable design and construction
Target: No specific targets until after the new Local Plan is adopted.
Achieved to date: N/A
7.8 The amount of new renewable energy capacity being completed is an important indicator,
given the general need to reduce carbon emissions. Most small-scale schemes for renewable
energy generation (such as solar photovoltaic or thermal panels on houses) do not require
planning permission. It is therefore only possible to monitor the large-scale or standalone
schemes which do, as well as renewable energy provision in new development.
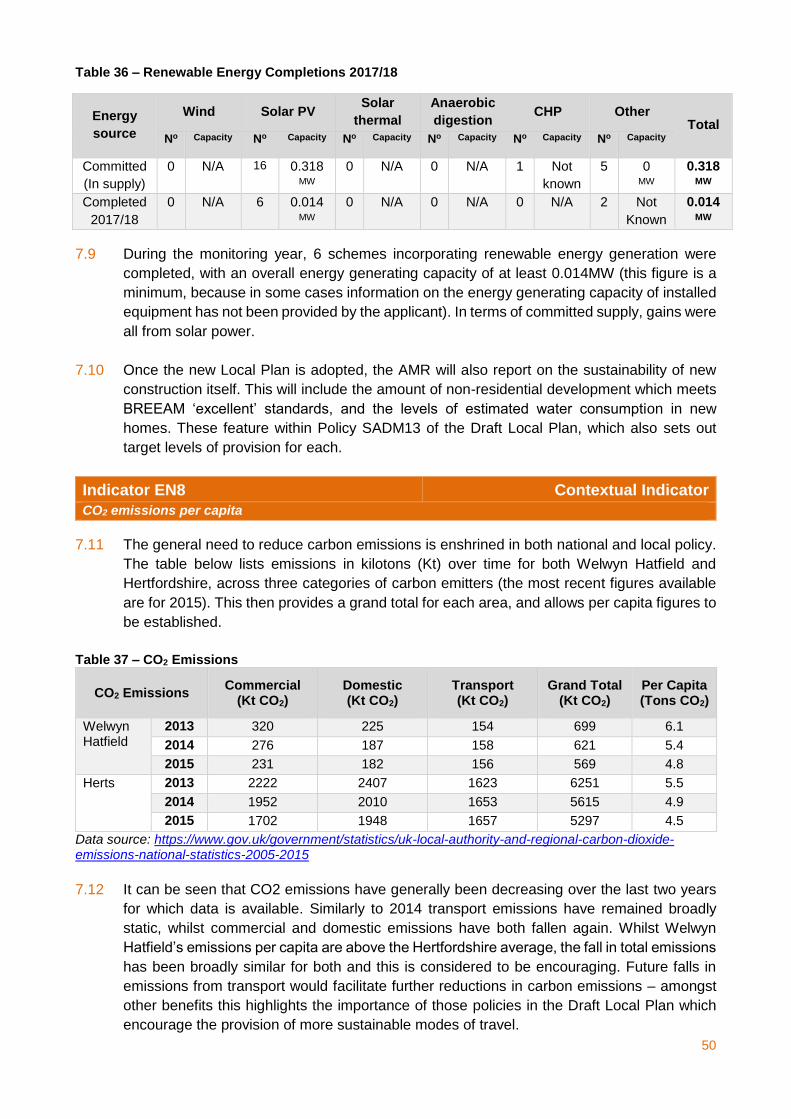
50
Table 36 – Renewable Energy Completions 2017/18
7.9 During the monitoring year, 6 schemes incorporating renewable energy generation were
completed, with an overall energy generating capacity of at least 0.014MW (this figure is a
minimum, because in some cases information on the energy generating capacity of installed
equipment has not been provided by the applicant). In terms of committed supply, gains were
all from solar power.
7.10 Once the new Local Plan is adopted, the AMR will also report on the sustainability of new
construction itself. This will include the amount of non-residential development which meets
BREEAM ‘excellent’ standards, and the levels of estimated water consumption in new
homes. These feature within Policy SADM13 of the Draft Local Plan, which also sets out
target levels of provision for each.
Indicator EN8 Contextual Indicator
CO2 emissions per capita
7.11 The general need to reduce carbon emissions is enshrined in both national and local policy.
The table below lists emissions in kilotons (Kt) over time for both Welwyn Hatfield and
Hertfordshire, across three categories of carbon emitters (the most recent figures available
are for 2015). This then provides a grand total for each area, and allows per capita figures to
be established.
Table 37 – CO2 Emissions
CO2 Emissions Commercial
(Kt CO2) Domestic (Kt CO2)
Transport (Kt CO2)
Grand Total (Kt CO2)
Per Capita (Tons CO2)
Welwyn Hatfield
2013 320 225 154 699 6.1
2014 276 187 158 621 5.4
2015 231 182 156 569 4.8
Herts 2013 2222 2407 1623 6251 5.5
2014 1952 2010 1653 5615 4.9
2015 1702 1948 1657 5297 4.5
Data source: https://www.gov.uk/government/statistics/uk-local-authority-and-regional-carbon-dioxide-emissions-national-statistics-2005-2015
7.12 It can be seen that CO2 emissions have generally been decreasing over the last two years
for which data is available. Similarly to 2014 transport emissions have remained broadly
static, whilst commercial and domestic emissions have both fallen again. Whilst Welwyn
Hatfield’s emissions per capita are above the Hertfordshire average, the fall in total emissions
has been broadly similar for both and this is considered to be encouraging. Future falls in
emissions from transport would facilitate further reductions in carbon emissions – amongst
other benefits this highlights the importance of those policies in the Draft Local Plan which
encourage the provision of more sustainable modes of travel.
Energy
source
Wind Solar PV Solar
thermal
Anaerobic
digestion CHP Other
Total No Capacity No Capacity No Capacity No Capacity No Capacity No Capacity
Committed
(In supply)
0 N/A 16 0.318 MW
0 N/A 0 N/A 1 Not
known
5 0 MW
0.318 MW
Completed
2017/18
0 N/A 6 0.014 MW
0 N/A 0 N/A 0 N/A 2 Not
Known
0.014 MW
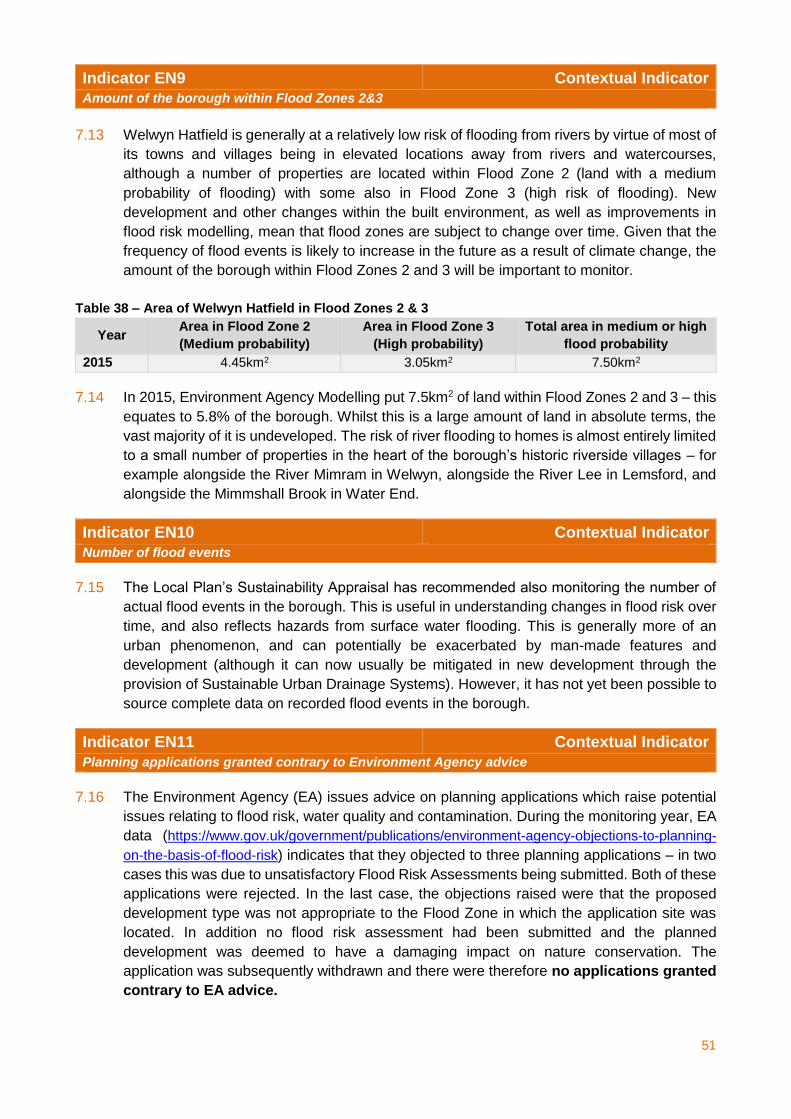
51
Indicator EN9 Contextual Indicator
Amount of the borough within Flood Zones 2&3
7.13 Welwyn Hatfield is generally at a relatively low risk of flooding from rivers by virtue of most of
its towns and villages being in elevated locations away from rivers and watercourses,
although a number of properties are located within Flood Zone 2 (land with a medium
probability of flooding) with some also in Flood Zone 3 (high risk of flooding). New
development and other changes within the built environment, as well as improvements in
flood risk modelling, mean that flood zones are subject to change over time. Given that the
frequency of flood events is likely to increase in the future as a result of climate change, the
amount of the borough within Flood Zones 2 and 3 will be important to monitor.
Table 38 – Area of Welwyn Hatfield in Flood Zones 2 & 3
Year Area in Flood Zone 2
(Medium probability)
Area in Flood Zone 3
(High probability)
Total area in medium or high
flood probability
2015 4.45km2 3.05km2 7.50km2
7.14 In 2015, Environment Agency Modelling put 7.5km2 of land within Flood Zones 2 and 3 – this
equates to 5.8% of the borough. Whilst this is a large amount of land in absolute terms, the
vast majority of it is undeveloped. The risk of river flooding to homes is almost entirely limited
to a small number of properties in the heart of the borough’s historic riverside villages – for
example alongside the River Mimram in Welwyn, alongside the River Lee in Lemsford, and
alongside the Mimmshall Brook in Water End.
Indicator EN10 Contextual Indicator
Number of flood events
7.15 The Local Plan’s Sustainability Appraisal has recommended also monitoring the number of
actual flood events in the borough. This is useful in understanding changes in flood risk over
time, and also reflects hazards from surface water flooding. This is generally more of an
urban phenomenon, and can potentially be exacerbated by man-made features and
development (although it can now usually be mitigated in new development through the
provision of Sustainable Urban Drainage Systems). However, it has not yet been possible to
source complete data on recorded flood events in the borough.
Indicator EN11 Contextual Indicator
Planning applications granted contrary to Environment Agency advice
7.16 The Environment Agency (EA) issues advice on planning applications which raise potential
issues relating to flood risk, water quality and contamination. During the monitoring year, EA
data (https://www.gov.uk/government/publications/environment-agency-objections-to-planning-
on-the-basis-of-flood-risk) indicates that they objected to three planning applications – in two
cases this was due to unsatisfactory Flood Risk Assessments being submitted. Both of these
applications were rejected. In the last case, the objections raised were that the proposed
development type was not appropriate to the Flood Zone in which the application site was
located. In addition no flood risk assessment had been submitted and the planned
development was deemed to have a damaging impact on nature conservation. The
application was subsequently withdrawn and there were therefore no applications granted
contrary to EA advice.
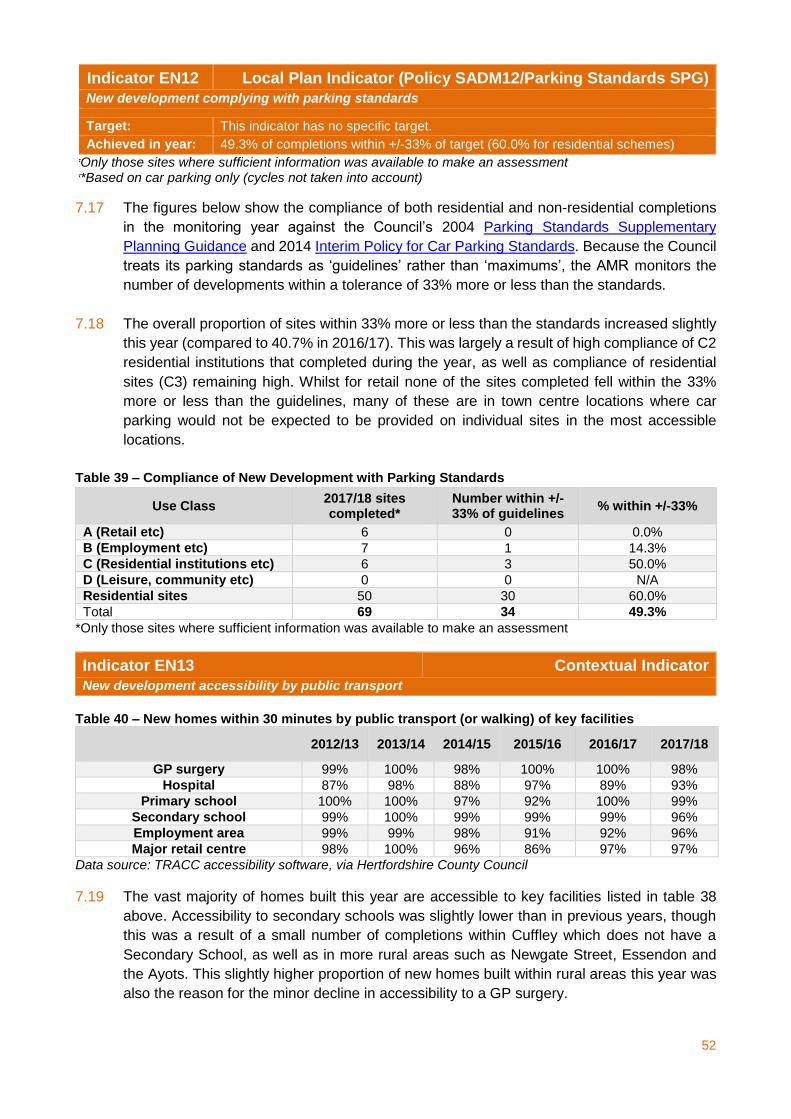
52
Indicator EN12 Local Plan Indicator (Policy SADM12/Parking Standards SPG)
New development complying with parking standards
Target: This indicator has no specific target.
Achieved in year: 49.3% of completions within +/-33% of target (60.0% for residential schemes)
*Only those sites where sufficient information was available to make an assessment **Based on car parking only (cycles not taken into account)
7.17 The figures below show the compliance of both residential and non-residential completions
in the monitoring year against the Council’s 2004 Parking Standards Supplementary
Planning Guidance and 2014 Interim Policy for Car Parking Standards. Because the Council
treats its parking standards as ‘guidelines’ rather than ‘maximums’, the AMR monitors the
number of developments within a tolerance of 33% more or less than the standards.
7.18 The overall proportion of sites within 33% more or less than the standards increased slightly
this year (compared to 40.7% in 2016/17). This was largely a result of high compliance of C2
residential institutions that completed during the year, as well as compliance of residential
sites (C3) remaining high. Whilst for retail none of the sites completed fell within the 33%
more or less than the guidelines, many of these are in town centre locations where car
parking would not be expected to be provided on individual sites in the most accessible
locations.
Table 39 – Compliance of New Development with Parking Standards
Use Class 2017/18 sites completed*
Number within +/-33% of guidelines
% within +/-33%
A (Retail etc) 6 0 0.0%
B (Employment etc) 7 1 14.3%
C (Residential institutions etc) 6 3 50.0%
D (Leisure, community etc) 0 0 N/A
Residential sites 50 30 60.0%
Total 69 34 49.3%
*Only those sites where sufficient information was available to make an assessment
Indicator EN13 Contextual Indicator
New development accessibility by public transport
Table 40 – New homes within 30 minutes by public transport (or walking) of key facilities
2012/13 2013/14 2014/15 2015/16 2016/17 2017/18
GP surgery 99% 100% 98% 100% 100% 98%
Hospital 87% 98% 88% 97% 89% 93%
Primary school 100% 100% 97% 92% 100% 99%
Secondary school 99% 100% 99% 99% 99% 96%
Employment area 99% 99% 98% 91% 92% 96%
Major retail centre 98% 100% 96% 86% 97% 97%
Data source: TRACC accessibility software, via Hertfordshire County Council
7.19 The vast majority of homes built this year are accessible to key facilities listed in table 38
above. Accessibility to secondary schools was slightly lower than in previous years, though
this was a result of a small number of completions within Cuffley which does not have a
Secondary School, as well as in more rural areas such as Newgate Street, Essendon and
the Ayots. This slightly higher proportion of new homes built within rural areas this year was
also the reason for the minor decline in accessibility to a GP surgery.
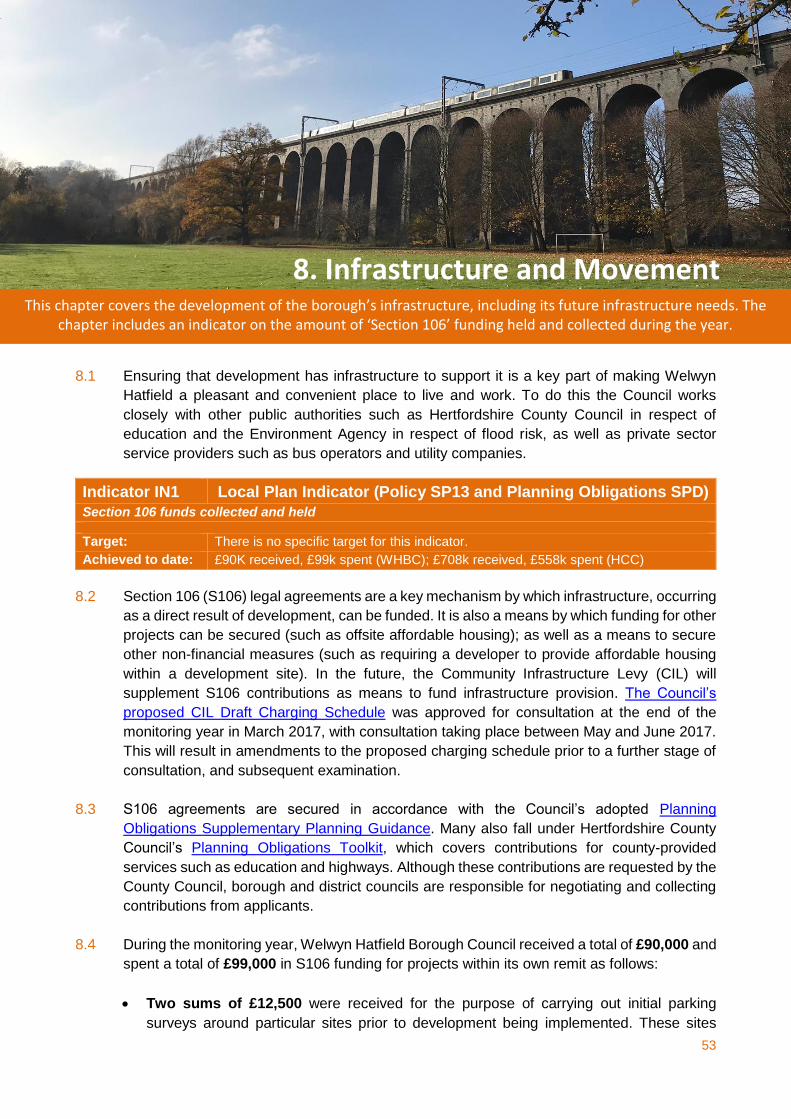
53
This chapter covers the development of the borough’s infrastructure, including its future infrastructure needs. The chapter includes an indicator on the amount of ‘Section 106’ funding held and collected during the year.
8.1 Ensuring that development has infrastructure to support it is a key part of making Welwyn
Hatfield a pleasant and convenient place to live and work. To do this the Council works
closely with other public authorities such as Hertfordshire County Council in respect of
education and the Environment Agency in respect of flood risk, as well as private sector
service providers such as bus operators and utility companies.
Indicator IN1 Local Plan Indicator (Policy SP13 and Planning Obligations SPD)
Section 106 funds collected and held
Target: There is no specific target for this indicator.
Achieved to date: £90K received, £99k spent (WHBC); £708k received, £558k spent (HCC)
8.2 Section 106 (S106) legal agreements are a key mechanism by which infrastructure, occurring
as a direct result of development, can be funded. It is also a means by which funding for other
projects can be secured (such as offsite affordable housing); as well as a means to secure
other non-financial measures (such as requiring a developer to provide affordable housing
within a development site). In the future, the Community Infrastructure Levy (CIL) will
supplement S106 contributions as means to fund infrastructure provision. The Council’s
proposed CIL Draft Charging Schedule was approved for consultation at the end of the
monitoring year in March 2017, with consultation taking place between May and June 2017.
This will result in amendments to the proposed charging schedule prior to a further stage of
consultation, and subsequent examination.
8.3 S106 agreements are secured in accordance with the Council’s adopted Planning
Obligations Supplementary Planning Guidance. Many also fall under Hertfordshire County
Council’s Planning Obligations Toolkit, which covers contributions for county-provided
services such as education and highways. Although these contributions are requested by the
County Council, borough and district councils are responsible for negotiating and collecting
contributions from applicants.
8.4 During the monitoring year, Welwyn Hatfield Borough Council received a total of £90,000 and
spent a total of £99,000 in S106 funding for projects within its own remit as follows:
Two sums of £12,500 were received for the purpose of carrying out initial parking
surveys around particular sites prior to development being implemented. These sites
8. Infrastructure and Movement
54
included: the land adjacent to the Porsche Garage within Hatfield Business Park, the
Comet, Hatfield and St Albans Road West, Hatfield;
Cumulative sums were received for a number of measures including: £13,500 for local
green spaces, £34,900 for play facilities and improvements and £16,700 for waste and
recycling provision at specific developments;
£42,500 was spent towards ceiling improvements and new energy saving lighting at
Hatfield Bowls Club, financed by the Hatfield Community Sports Fund. This fund was
created in 2016/17 using resources received from the University of Hertfordshire on the
completion of its park and ride development at Angerland Common in South Hatfield;
£13,600 was spent on providing waste and recycling bins to three new residential
developments;
£12,500 was used on the first parking survey at the Comet in Hatfield, as mentioned
above;
Smaller amounts were spent on new play facilities and exercise equipment at Gobions
play area and open space in Brookmans Park, Birchwood Leisure Centre play area and
at Welwyn Garden City football club where a new disabled toilet, shower and changing
space was provided.
8.5 Because it is responsible for higher level services and infrastructure, Hertfordshire County
Council generally receives and spends much larger sums of S106 money (though as noted
above, it is the borough council that is responsible for securing these amounts). During the
year the County Council received £708,000 to fund a range of schemes including:
£248,000 from the developers of two sites, to fund improvements to primary education
facilities in the borough;
£240,000 from the developers of two sites, to fund improvements to secondary education
facilities in the borough;
Smaller amounts from a number of developments, to fund a range of measures, such as
libraries, childcare, youth provision and transport.
8.6 During the year Hertfordshire County Council spent £558,000 in S106 money within the
borough, funding a range of schemes including:
£339,000 towards the upgrade of Welwyn Garden City bus station, including a new shelter,
increased seating and an improved layout;
£35,000 on a feasibility study looking at traffic calming measures on Travellers Lane and
Woods Avenue;
£30,000 towards the delivery of a cycle scheme between Bishops Rise and Wood Avenue;
Smaller amounts from a number of developments, which funded a range of measures,
such as education and sustainable transport.
55
Indicator IN2 Local Plan Indicator (Policy SP13 and IDP)
Delivery of new infrastructure
Target: There is no specific target for this indicator.
8.7 To deliver the larger number of smaller scale infrastructure improvements needed to support
the growth proposed in the Local Plan, a revised Draft Infrastructure Delivery Plan (IDP) has
been published alongside its submission. In addition to the more typically thought of ‘physical’
infrastructure (such as transport and utilities), the IDP identifies requirements for social
infrastructure (such as schools and community facilities) and green infrastructure (such as
open spaces and conservation areas). The IDP will facilitate further dialogue with service
providers and developers, and will be a ‘living’ document that continues to evolve. It will be
able to influence spending priorities for public bodies and service providers, and form the
basis of the Council’s emerging CIL Charging Schedule.
8.8 Notable infrastructure developments during the year have included:
Significant progress was made on the redevelopment of Welwyn Garden City bus station,
which was completed and opened just after the end of the 2017/18 monitoring year. The
redesign has improved safety - with pedestrians no longer needing to cross the roadway
to access bus stops - as well as providing enhanced seating, lighting and information
screens.
Hertfordshire County Council, in partnership with the council, have undertaken
consultation on schemes to improve the pedestrian environment and traffic circulation
around Stonehills and Howardsgate. A new system was trialled since the end of the
monitoring year in May and June 2018 which restricted the traffic flow through Wigmores
North to make it easier for pedestrians to cross the road, as well as removing traffic from
the north side of Stonehills;
Since the end of the monitoring year, train operator Govia Thameslink introduced new
rail timetables in May 2018, which impacted services to the borough. The disruption
caused whilst this change was implemented resulted in an interim timetable being
introduced. The planned changes to timetables are still expected to go ahead in due
course, which will result in increases to the number of stopping services at Welwyn
Garden City, Hatfield and Cuffley; however, there are proposed to be no additional fast
services at stations in the borough, and Welham Green and Brookmans Park will actually
see reduced frequencies;
The Government and Highways England plans to convert the A1(M) to a Smart Motorway
between Junction 6 (Welwyn) and Junction 8 (Stevenage), with the current hard shoulder
converted to a running lane. This £100m+ scheme, expected to start work by 2020, would
result in the A1(M) having three lanes in each direction all the way from Hatfield to Hitchin.
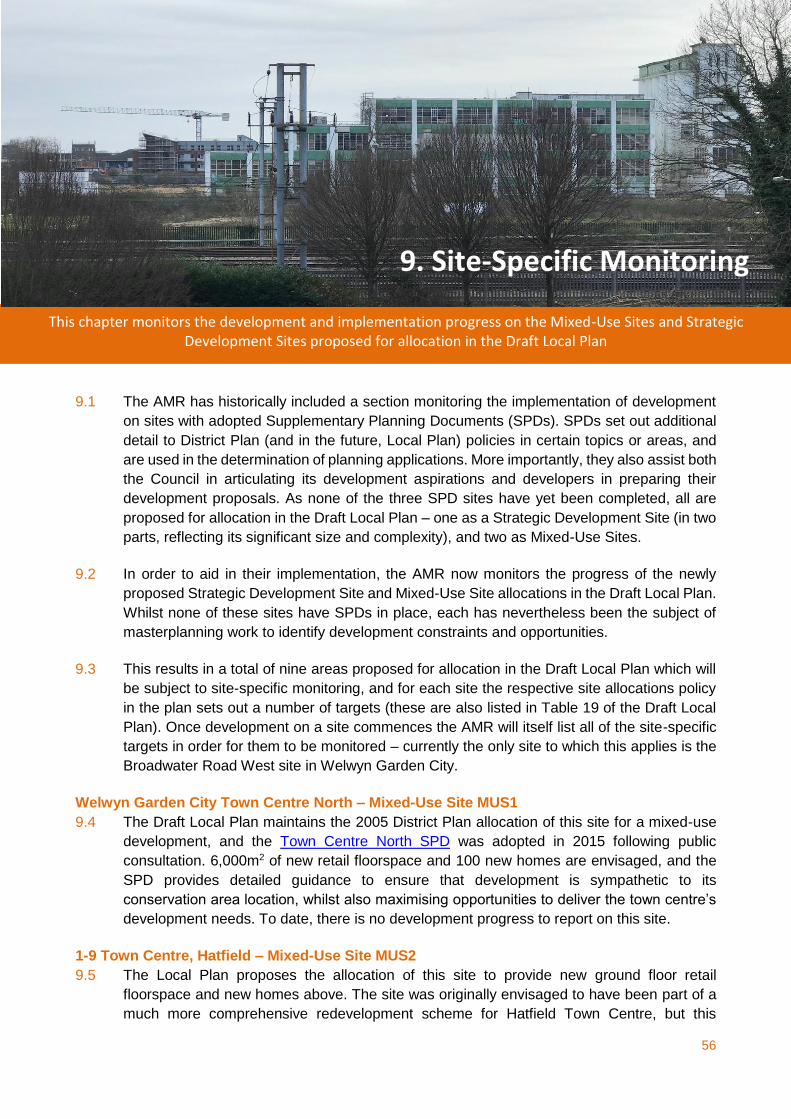
56
This chapter monitors the development and implementation progress on the Mixed-Use Sites and Strategic Development Sites proposed for allocation in the Draft Local Plan
9.1 The AMR has historically included a section monitoring the implementation of development
on sites with adopted Supplementary Planning Documents (SPDs). SPDs set out additional
detail to District Plan (and in the future, Local Plan) policies in certain topics or areas, and
are used in the determination of planning applications. More importantly, they also assist both
the Council in articulating its development aspirations and developers in preparing their
development proposals. As none of the three SPD sites have yet been completed, all are
proposed for allocation in the Draft Local Plan – one as a Strategic Development Site (in two
parts, reflecting its significant size and complexity), and two as Mixed-Use Sites.
9.2 In order to aid in their implementation, the AMR now monitors the progress of the newly
proposed Strategic Development Site and Mixed-Use Site allocations in the Draft Local Plan.
Whilst none of these sites have SPDs in place, each has nevertheless been the subject of
masterplanning work to identify development constraints and opportunities.
9.3 This results in a total of nine areas proposed for allocation in the Draft Local Plan which will
be subject to site-specific monitoring, and for each site the respective site allocations policy
in the plan sets out a number of targets (these are also listed in Table 19 of the Draft Local
Plan). Once development on a site commences the AMR will itself list all of the site-specific
targets in order for them to be monitored – currently the only site to which this applies is the
Broadwater Road West site in Welwyn Garden City.
Welwyn Garden City Town Centre North – Mixed-Use Site MUS1
9.4 The Draft Local Plan maintains the 2005 District Plan allocation of this site for a mixed-use
development, and the Town Centre North SPD was adopted in 2015 following public
consultation. 6,000m2 of new retail floorspace and 100 new homes are envisaged, and the
SPD provides detailed guidance to ensure that development is sympathetic to its
conservation area location, whilst also maximising opportunities to deliver the town centre’s
development needs. To date, there is no development progress to report on this site.
1-9 Town Centre, Hatfield – Mixed-Use Site MUS2
9.5 The Local Plan proposes the allocation of this site to provide new ground floor retail
floorspace and new homes above. The site was originally envisaged to have been part of a
much more comprehensive redevelopment scheme for Hatfield Town Centre, but this
9. Site-Specific Monitoring
57
ultimately fell through following the recession of the late 2000’s. A planning application has
now been submitted for 1,200m2 of commercial retail space and 70 new flats. The application
will be determined in due course.
High View Neighbourhood Centre, Hatfield – Mixed-Use Site MUS3
9.6 The Local Plan proposes the comprehensive redevelopment of High View to provide more
modern retail and community provision as well as new homes. The High View SPD was
adopted in April 2011 in order to help to drive the development of this site forward, but
because of the condition of the property market since its adoption it had been challenging to
bring the scheme forward. However, a commercial developer partner has since been
appointed and consultation has taken place to deliver around 150 new homes and redevelop
the existing retail space.
North East Welwyn Garden City (Panshanger Airfield) – Strategic Development Site SDS1
9.7 The Local Plan proposes the allocation of this site as part of a major urban extension, with a
target provision of 650 new homes supported by infrastructure including a new school. The
Local Plan also proposes that any masterplan for the site allows the opportunity for a
realigned grass runway to the north of the site. Until the adoption of the Local Plan the site
remains a designated Area of Special Restraint, although the landowner has carried out pre-
application public consultation and the Council is continuing to work with them to secure a
successful scheme for the site. During the hearing sessions in June 2018 the inspector
observed that the council could consider bringing forward a larger area for residential
development. A planning application has been submitted relating to the area of special
restraint.
South East Welwyn Garden City (Birchall Garden Suburb) – Strategic Development Site SDS2
9.8 The Draft Local Plan proposes the allocation of this site as part of a major urban extension,
with a target provision of 1,200 new homes supported by infrastructure including a new
school, neighbourhood centre, and new parkland. This site extends into East Herts District,
where a further 1,350 new homes and additional supporting infrastructure are proposed. Until
the adoption of the Local Plan in due course the site remains within the Green Belt, and there
is no development progress to report on the site. However, the landowner has carried out
pre-application public consultation and the Council is continuing to work with them to help to
prepare a successful development scheme for the site. The East Herts District Plan was
adopted in October 2018.
Broadwater Road West, Welwyn Garden City – Strategic Development Sites SDS3 (North) and
SDS4 (West)
9.9 The Broadwater Road West site is the only one of the sites subject to site-specific monitoring
on which development has taken place. The 16.2 hectare site is situated immediately east of
Welwyn Garden City Town Centre across the East Coast Main Line, and comprises four main
areas along with some highway and railway land:
3.0ha (once the factory and offices of Roche Pharmaceuticals) on which 209 homes were
completed between 2012-2014;
9.1ha (once a factory for Shredded Wheat), which is proposed for allocation in the Local
Plan as Strategic Development Site SDS3. A new planning application was submitted
during the monitoring year for 1,340 dwellings, including 114 care home bedrooms, as
well as office floorspace and a number of other uses and supporting infrastructure. The
application has been approved subject to conditions and legal agreements.
58
2.1ha (currently occupied by a warehouse and distribution centre), which is proposed for
allocation in the Local Plan as Strategic Development Site SDS4 and has a target
provision of 170 new homes and 11,350m2 of new office floorspace;
1.1ha occupied by the BioPark research and development complex, which provides start-
of-the-art facilities for science and technology companies. This is an established use, and
not anticipated for any form of redevelopment.
9.10 The Broadwater Road West SPD was adopted in December 2008. It sets out the Council’s
vision and a masterplan to help shape the mixed-use redevelopment of this key site. Whilst
the progress of development on the site has been somewhat slower than anticipated, 85% of
the land envisaged for redevelopment now has planning permission in place. This will secure
the reuse of the most important heritage assets on the site, notably including the landmark
Grade II listed silos formerly used to store grain.
9.11 Because development of these sites has commenced, the targets set out in the Local Plan
can now be monitored against. It can be seen that meeting the targets is heavily dependent
on provision on site SDS3 (as well as SDS4 in the future).
Table 40 – Broadwater Road West SPD Performance
Site-Specific Local Plan Target Performance to date
1,230 new dwellings across three areas 209 completed, remainder in proposed allocations
17,650m2 new B1 employment floorspace None completed, remainder in proposed allocations
Maximum 600m2 A1 convenience retail floorspace 572m2 in planning permission for site SDS3
Provision of a new hotel Forms part of planning permission for site SDS3
Provision of a new healthcare facility Forms part of planning permission for site SDS3
Provision of new community facility floorspace Forms part of planning permission for site SDS3
0.8ha new urban space per 1,000 residents 1.16ha per 1,000 residents achieved to date
No loss or harm to protected heritage assets Some loss as authorised by planning permission/listed building consent
10% of site energy need from renewable sources 10.1% to date
Introduce traffic calming along Broadwater Road Forms part of planning permission for site SDS3
Improvements to bus services serving the site Funding received, but scheme not yet implemented
Improvements to the footbridge to the town centre Forms part of planning permission for site SDS3
Delivery of new primary school capacity (offsite) Forms part of planning permission for site SDS3
North West Hatfield – Strategic Site SDS5
9.12 The Draft Local Plan proposes the allocation of this site as part of a major urban extension,
with a target provision of 1,650 new homes supported by infrastructure including a new
school and neighbourhood centre. Until the adoption of the Local Plan in due course the site
remains within the Green Belt, and there is no development progress to report on the site –
although the landowner has carried out pre-application public consultation and the Council is
continuing to work with them to secure a successful scheme for the site.
Symondshyde New Village – Strategic Site SDS6
9.13 The Draft Local Plan proposes the allocation of this site, north of Hatfield, to create a new
village. The target provision of 1,130 new homes would be supported by infrastructure
including a new school and neighbourhood centre. Until the adoption of the Local Plan in due
course the site remains within the Green Belt, and there is no development progress to report

59
on the site – although the landowner has carried out pre-application public consultation and
the Council is continuing to work with them to secure a successful scheme for the site.
Marshmoor, Welham Green – Strategic Site SDS7
9.14 The Draft Local Plan proposes the allocation of this site as part of an urban extension, with
a target provision of over 40,000m2 of new employment floorspace in addition to 80 new
homes. Until the adoption of the Local Plan in due course the site remains within the Green
Belt, and there is no development progress to report on the site – although the landowner
has carried out pre-application public consultation and the Council is continuing to work with
them to secure a successful scheme for the site.
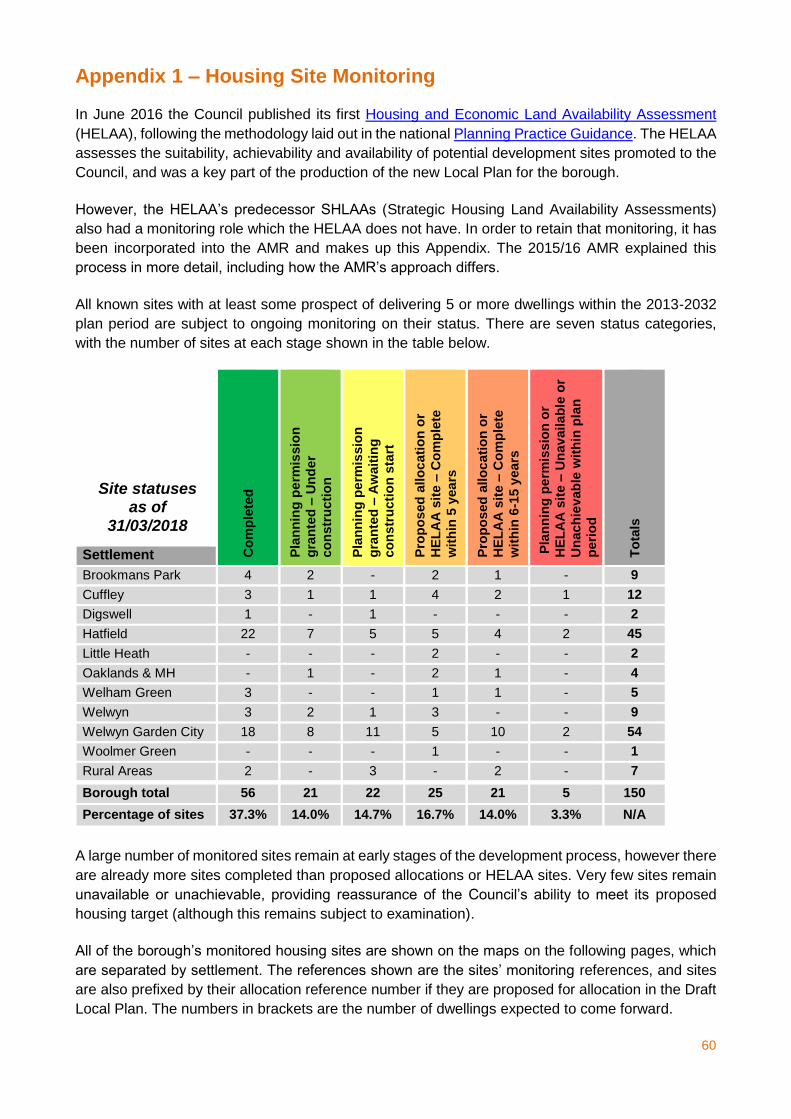
60
Appendix 1 – Housing Site Monitoring In June 2016 the Council published its first Housing and Economic Land Availability Assessment
(HELAA), following the methodology laid out in the national Planning Practice Guidance. The HELAA
assesses the suitability, achievability and availability of potential development sites promoted to the
Council, and was a key part of the production of the new Local Plan for the borough.
However, the HELAA’s predecessor SHLAAs (Strategic Housing Land Availability Assessments)
also had a monitoring role which the HELAA does not have. In order to retain that monitoring, it has
been incorporated into the AMR and makes up this Appendix. The 2015/16 AMR explained this
process in more detail, including how the AMR’s approach differs.
All known sites with at least some prospect of delivering 5 or more dwellings within the 2013-2032
plan period are subject to ongoing monitoring on their status. There are seven status categories,
with the number of sites at each stage shown in the table below.
Co
mp
lete
d
Pla
nn
ing
pe
rmis
sio
n
gra
nte
d –
Un
der
co
nstr
ucti
on
Pla
nn
ing
pe
rmis
sio
n
gra
nte
d –
Aw
ait
ing
co
nstr
ucti
on
sta
rt
Pro
po
sed
allo
cati
on
or
HE
LA
A s
ite –
Co
mp
lete
wit
hin
5 y
ea
rs
Pro
po
sed
allo
cati
on
or
HE
LA
A s
ite –
Co
mp
lete
wit
hin
6-1
5 y
ears
Pla
nn
ing
pe
rmis
sio
n o
r
HE
LA
A s
ite –
Un
av
ailab
le o
r
Un
ach
ievab
le w
ith
in p
lan
peri
od
To
tals
Settlement
Brookmans Park 4 2 - 2 1 - 9
Cuffley 3 1 1 4 2 1 12
Digswell 1 - 1 - - - 2
Hatfield 22 7 5 5 4 2 45
Little Heath - - - 2 - - 2
Oaklands & MH - 1 - 2 1 - 4
Welham Green 3 - - 1 1 - 5
Welwyn 3 2 1 3 - - 9
Welwyn Garden City 18 8 11 5 10 2 54
Woolmer Green - - - 1 - - 1
Rural Areas 2 - 3 - 2 - 7
Borough total 56 21 22 25 21 5 150
Percentage of sites 37.3% 14.0% 14.7% 16.7% 14.0% 3.3% N/A
A large number of monitored sites remain at early stages of the development process, however there
are already more sites completed than proposed allocations or HELAA sites. Very few sites remain
unavailable or unachievable, providing reassurance of the Council’s ability to meet its proposed
housing target (although this remains subject to examination).
All of the borough’s monitored housing sites are shown on the maps on the following pages, which
are separated by settlement. The references shown are the sites’ monitoring references, and sites
are also prefixed by their allocation reference number if they are proposed for allocation in the Draft
Local Plan. The numbers in brackets are the number of dwellings expected to come forward.
Site statuses as of
31/03/2018
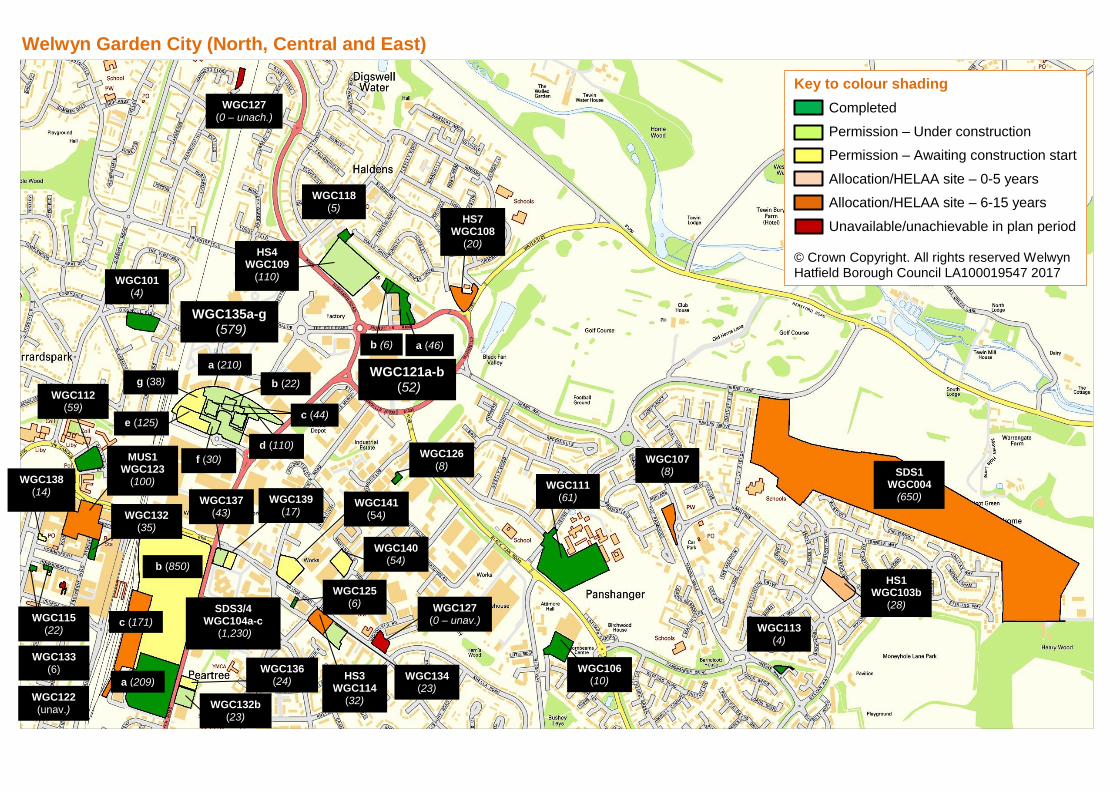
Welwyn Garden City (North, Central and East)
WGC135a-g (579)
e (125)
d (110)
c (44)
b (22)
HS4 WGC109
(110)
MUS1 WGC123
(100)
HS3 WGC114
(32)
a (210)
SDS3/4 WGC104a-c
(1,230)
HS1 WGC103b
(28)
WGC132 (35)
WGC115 (22)
WGC122 (unav.)
WGC132b (23)
WGC134 (23)
HS7 WGC108
(20)
WGC136 (24)
WGC107 (8)
WGC133 (6)
WGC121a-b (52)
a (46)
b (6)
WGC125 (6)
WGC112 (59)
WGC106 (10)
WGC126 (8)
WGC118 (5)
WGC101 (4)
WGC113 (4)
WGC127 (0 – unav.)
WGC127 (0 – unach.)
Key to colour shading
Completed
Permission – Under construction
Permission – Awaiting construction start
Allocation/HELAA site – 0-5 years
Allocation/HELAA site – 6-15 years
Unavailable/unachievable in plan period © Crown Copyright. All rights reserved Welwyn Hatfield Borough Council LA100019547 2017
WGC138 (14)
f (30)
SDS1 WGC004
(650)
WGC111 (61)
a (209)
c (171)
b (850)
WGC139 (17)
WGC137 (43)
WGC140 (54)
WGC141 (54)
g (38)
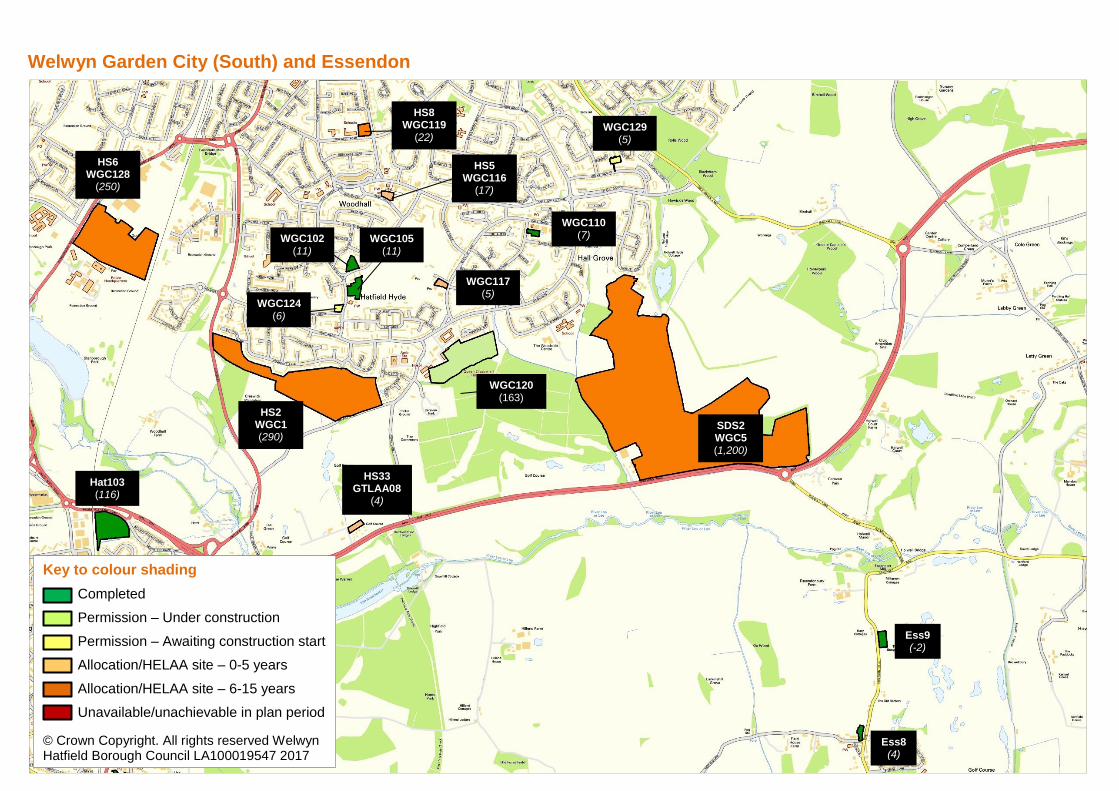
62
Welwyn Garden City (South) and Essendon
HS8 WGC119
(22)
HS5 WGC116
(17)
WGC102
(11)
WGC124 (6)
WGC117 (5)
WGC129 (5)
WGC105 (11)
WGC110 (7)
Hat103 (116)
HS33 GTLAA08
(4)
HS6 WGC128
(250)
HS2 WGC1 (290)
Key to colour shading
Completed
Permission – Under construction
Permission – Awaiting construction start
Allocation/HELAA site – 0-5 years
Allocation/HELAA site – 6-15 years
Unavailable/unachievable in plan period
© Crown Copyright. All rights reserved Welwyn Hatfield Borough Council LA100019547 2017
WGC120 (163)
SDS2 WGC5 (1,200)
Ess9 (-2)
Ess8 (4)
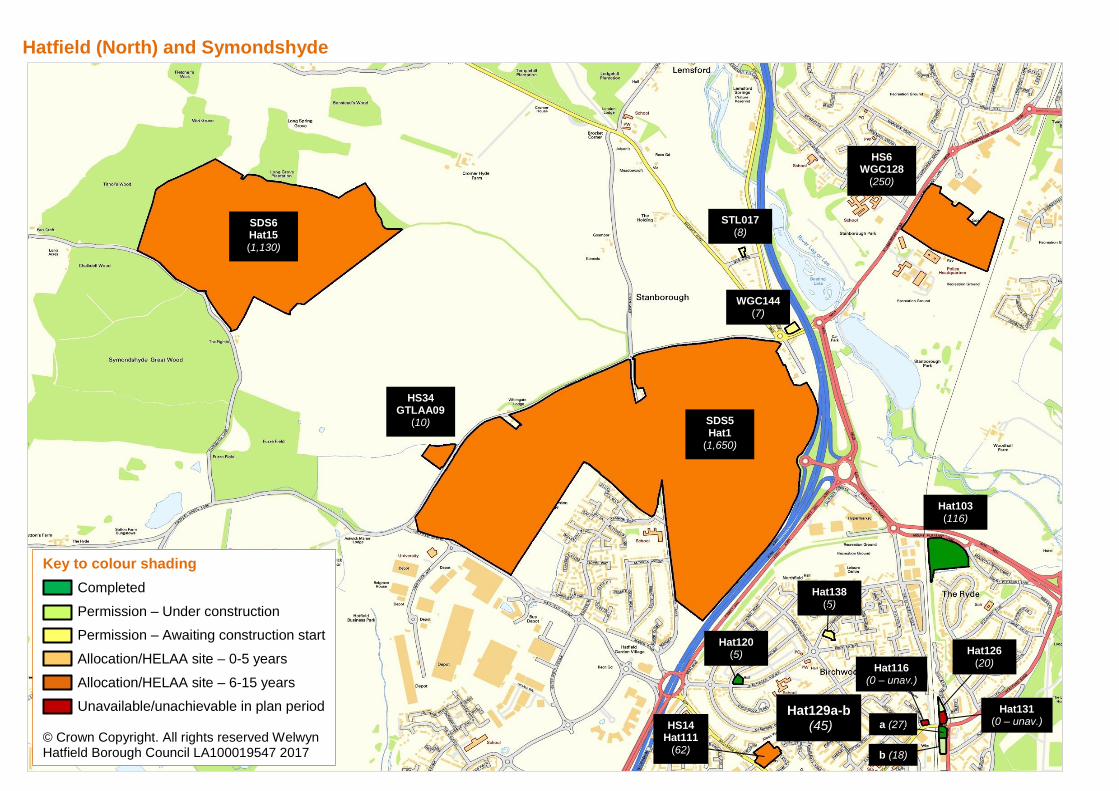
63
Hatfield (North) and Symondshyde
Hat103 (116)
HS34 GTLAA09
(10)
HS14 Hat111
(62)
Hat129a-b (45)
a (27)
b (18)
Hat126 (20)
Hat116
(0 – unav.)
Hat131 (0 – unav.)
Hat120 (5)
Key to colour shading
Completed
Permission – Under construction
Permission – Awaiting construction start
Allocation/HELAA site – 0-5 years
Allocation/HELAA site – 6-15 years
Unavailable/unachievable in plan period © Crown Copyright. All rights reserved Welwyn Hatfield Borough Council LA100019547 2017
HS6 WGC128
(250)
SDS6 Hat15 (1,130)
SDS5 Hat1
(1,650)
STL017 (8)
Hat138 (5)
WGC144 (7)
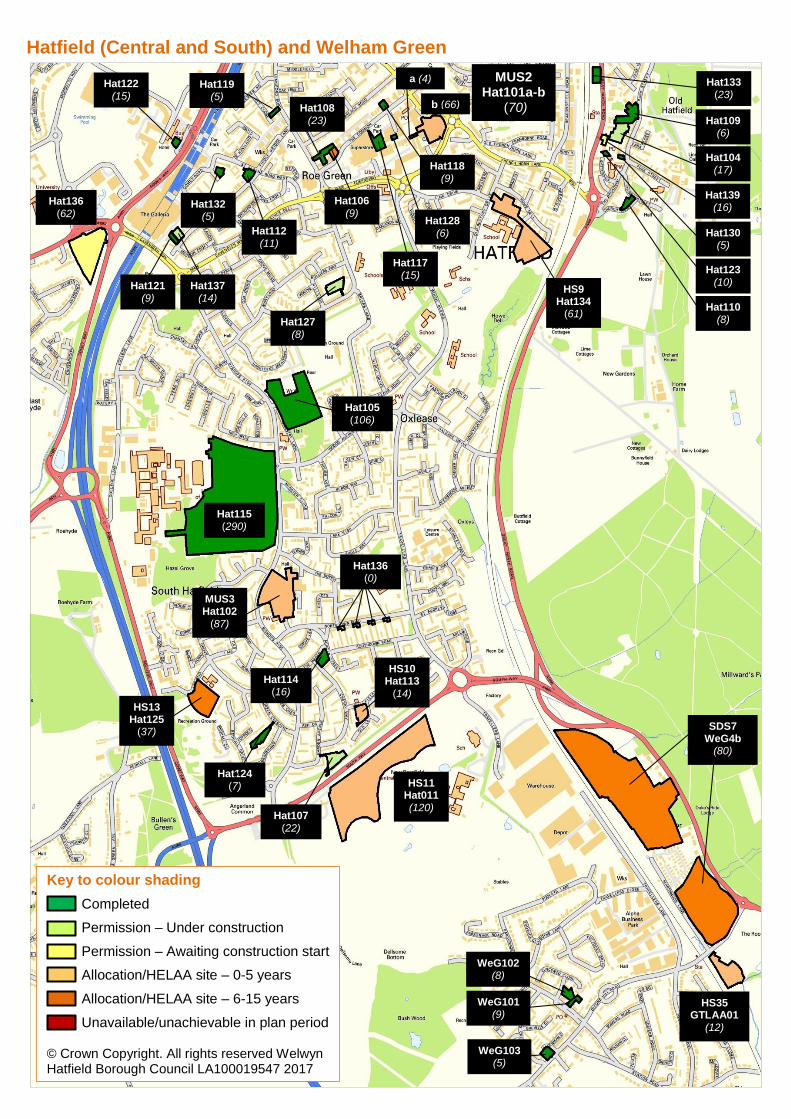
MUS3 Hat102
(87)
MUS2 Hat101a-b
(70)
b (66)
a (4)
HS9 Hat134
(61)
HS13 Hat125
(37)
Hat107 (22)
Hat133 (23)
Hat109
(6)
Hat104
(17)
Hat130 (5)
Hat123
(10)
Hat110
(8)
Hat122 (15)
HS10 Hat113
(14)
Hat118 (9)
Hat128 (6)
Hat117 (15)
Hat119 (5)
Hat106 (9)
Hat108 (23)
Hat121 (9)
Hat132 (5)
Hat112 (11)
Hat124 (7)
Hat114 (16)
Hatfield (Central and South) and Welham Green
Key to colour shading
Completed
Permission – Under construction
Permission – Awaiting construction start
Allocation/HELAA site – 0-5 years
Allocation/HELAA site – 6-15 years
Unavailable/unachievable in plan period © Crown Copyright. All rights reserved Welwyn Hatfield Borough Council LA100019547 2017
WeG102 (8)
WeG101
(9)
WeG103 (5)
HS35 GTLAA01
(12)
SDS7 WeG4b
(80)
HS11 Hat011 (120)
Hat136 (0)
Hat115 (290)
Hat105 (106)
Hat136 (62)
Hat127 (8)
Hat137 (14)
Hat139 (16)
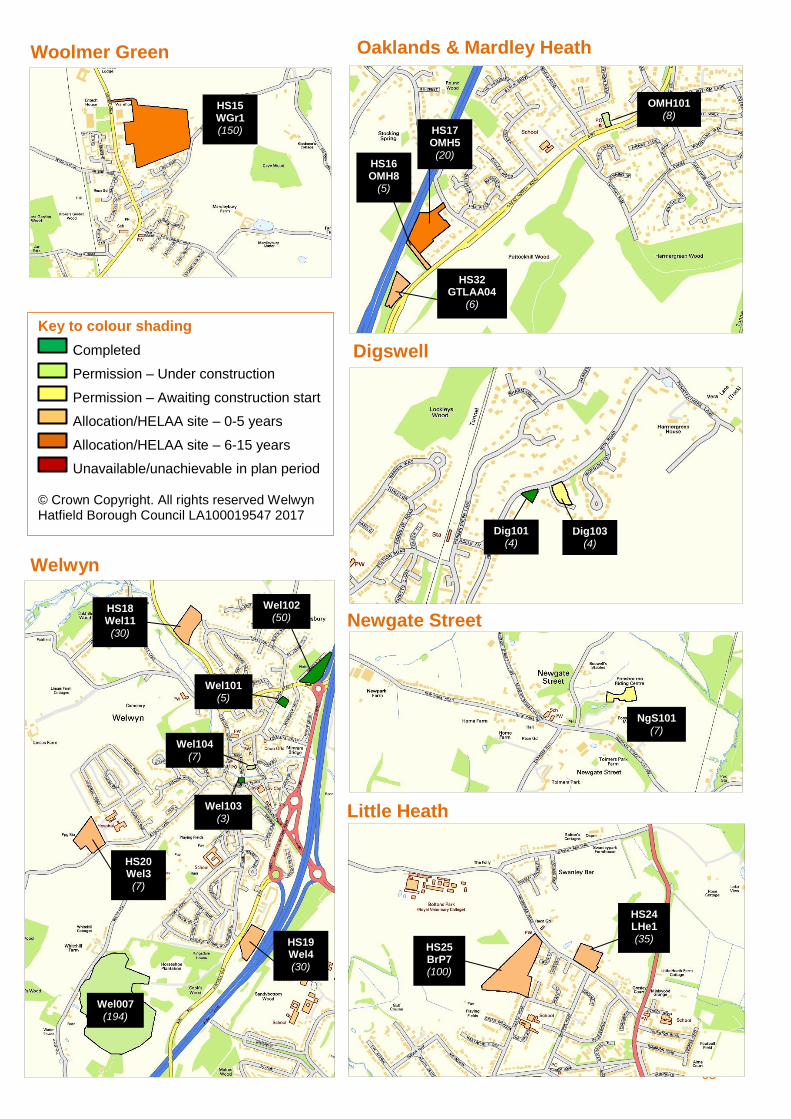
65
Woolmer Green Oaklands & Mardley Heath
Welwyn
Digswell
HS17 OMH5 (20)
HS16 OMH8
(5)
HS32 GTLAA04
(6)
HS18 Wel11 (30)
HS19 Wel4 (30)
HS20 Wel3 (7)
Wel102 (50)
Wel101 (5)
Wel103 (3)
Wel104 (7)
Dig101 (4)
HS24 LHe1 (35)
Wel007 (194)
Key to colour shading
Completed
Permission – Under construction
Permission – Awaiting construction start
Allocation/HELAA site – 0-5 years
Allocation/HELAA site – 6-15 years
Unavailable/unachievable in plan period © Crown Copyright. All rights reserved Welwyn Hatfield Borough Council LA100019547 2017
HS15 WGr1 (150)
OMH101 (8)
Dig103 (4)
Newgate Street
NgS101 (7)
Little Heath
HS25 BrP7 (100)
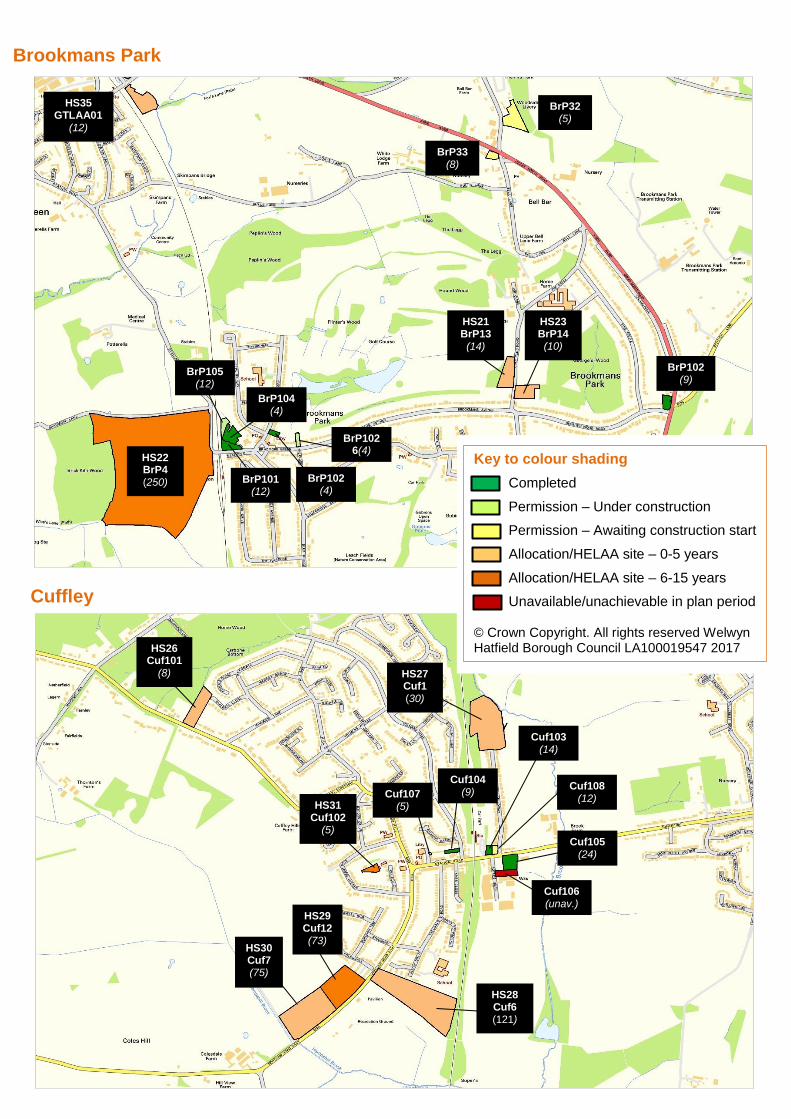
66
Brookmans Park
Cuffley
Key to colour shading
Completed
Permission – Under construction
Permission – Awaiting construction start
Allocation/HELAA site – 0-5 years
Allocation/HELAA site – 6-15 years
Unavailable/unachievable in plan period © Crown Copyright. All rights reserved Welwyn Hatfield Borough Council LA100019547 2017
HS35 GTLAA01
(12)
BrP32 (5)
BrP33 (8)
BrP102 (9)
BrP105 (12)
BrP104 (4)
BrP101 (12)
BrP102 (4)
HS30 Cuf7 (75)
HS29 Cuf12 (73)
HS26 Cuf101
(8)
HS31 Cuf102
(5)
Cuf105 (24)
Cuf106 (unav.)
Cuf107 (5)
Cuf104 (9)
Cuf103 (14)
Cuf108 (12)
HS28 Cuf6 (121)
BrP1026(4)
HS21 BrP13 (14)
HS23 BrP14 (10)
HS22 BrP4 (250)
HS27 Cuf1 (30)
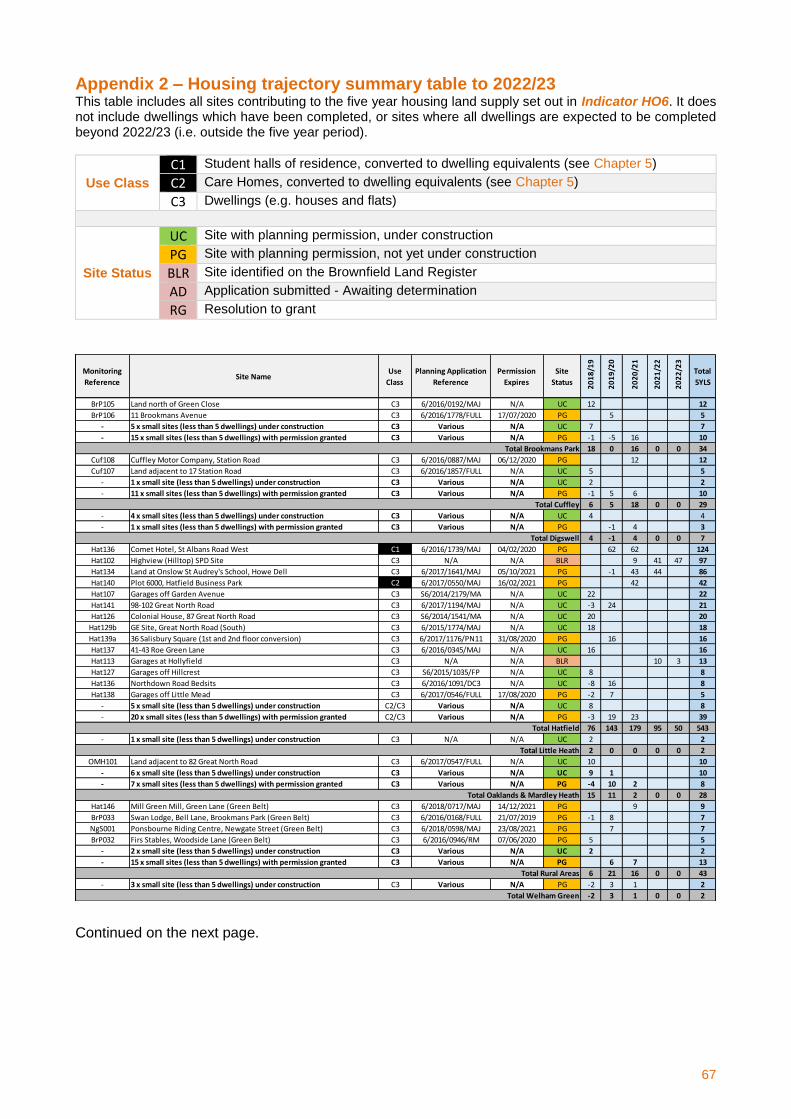
67
Appendix 2 – Housing trajectory summary table to 2022/23 This table includes all sites contributing to the five year housing land supply set out in Indicator HO6. It does not include dwellings which have been completed, or sites where all dwellings are expected to be completed beyond 2022/23 (i.e. outside the five year period).
Use Class
C1 Student halls of residence, converted to dwelling equivalents (see Chapter 5)
C2 Care Homes, converted to dwelling equivalents (see Chapter 5)
C3 Dwellings (e.g. houses and flats)
Site Status
UC Site with planning permission, under construction
PG Site with planning permission, not yet under construction
BLR Site identified on the Brownfield Land Register
AD Application submitted - Awaiting determination
RG Resolution to grant
Continued on the next page.
Monitoring
ReferenceSite Name
Use
Class
Planning Application
Reference
Permission
Expires
Site
Status
20
18
/19
20
19
/20
20
20
/21
20
21
/22
20
22
/23
Total
5YLS
BrP105 Land north of Green Close C3 6/2016/0192/MAJ N/A UC 12 12
BrP106 11 Brookmans Avenue C3 6/2016/1778/FULL 17/07/2020 PG 5 5
- 5 x small sites (less than 5 dwellings) under construction C3 Various N/A UC 7 7
- 15 x small sites (less than 5 dwellings) with permission granted C3 Various N/A PG -1 -5 16 10
Total Brookmans Park 18 0 16 0 0 34
Cuf108 Cuffley Motor Company, Station Road C3 6/2016/0887/MAJ 06/12/2020 PG 12 12
Cuf107 Land adjacent to 17 Station Road C3 6/2016/1857/FULL N/A UC 5 5
- 1 x small site (less than 5 dwellings) under construction C3 Various N/A UC 2 2
- 11 x small sites (less than 5 dwellings) with permission granted C3 Various N/A PG -1 5 6 10
Total Cuffley 6 5 18 0 0 29
- 4 x small sites (less than 5 dwellings) under construction C3 Various N/A UC 4 4
- 1 x small sites (less than 5 dwellings) with permission granted C3 Various N/A PG -1 4 3
Total Digswell 4 -1 4 0 0 7
Hat136 Comet Hotel, St Albans Road West C1 6/2016/1739/MAJ 04/02/2020 PG 62 62 124
Hat102 Highview (Hilltop) SPD Site C3 N/A N/A BLR 9 41 47 97
Hat134 Land at Onslow St Audrey's School, Howe Dell C3 6/2017/1641/MAJ 05/10/2021 PG -1 43 44 86
Hat140 Plot 6000, Hatfield Business Park C2 6/2017/0550/MAJ 16/02/2021 PG 42 42
Hat107 Garages off Garden Avenue C3 S6/2014/2179/MA N/A UC 22 22
Hat141 98-102 Great North Road C3 6/2017/1194/MAJ N/A UC -3 24 21
Hat126 Colonial House, 87 Great North Road C3 S6/2014/1541/MA N/A UC 20 20
Hat129b GE Site, Great North Road (South) C3 6/2015/1774/MAJ N/A UC 18 18
Hat139a 36 Salisbury Square (1st and 2nd floor conversion) C3 6/2017/1176/PN11 31/08/2020 PG 16 16
Hat137 41-43 Roe Green Lane C3 6/2016/0345/MAJ N/A UC 16 16
Hat113 Garages at Hollyfield C3 N/A N/A BLR 10 3 13
Hat127 Garages off Hillcrest C3 S6/2015/1035/FP N/A UC 8 8
Hat136 Northdown Road Bedsits C3 6/2016/1091/DC3 N/A UC -8 16 8
Hat138 Garages off Little Mead C3 6/2017/0546/FULL 17/08/2020 PG -2 7 5
- 5 x small site (less than 5 dwellings) under construction C2/C3 Various N/A UC 8 8
- 20 x small sites (less than 5 dwellings) with permission granted C2/C3 Various N/A PG -3 19 23 39
Total Hatfield 76 143 179 95 50 543
- 1 x small site (less than 5 dwellings) under construction C3 N/A N/A UC 2 2
Total Little Heath 2 0 0 0 0 2
OMH101 Land adjacent to 82 Great North Road C3 6/2017/0547/FULL N/A UC 10 10
- 6 x small site (less than 5 dwellings) under construction C3 Various N/A UC 9 1 10
- 7 x small sites (less than 5 dwellings) with permission granted C3 Various N/A PG -4 10 2 8
Total Oaklands & Mardley Heath 15 11 2 0 0 28
Hat146 Mill Green Mill, Green Lane (Green Belt) C3 6/2018/0717/MAJ 14/12/2021 PG 9 9
BrP033 Swan Lodge, Bell Lane, Brookmans Park (Green Belt) C3 6/2016/0168/FULL 21/07/2019 PG -1 8 7
NgS001 Ponsbourne Riding Centre, Newgate Street (Green Belt) C3 6/2018/0598/MAJ 23/08/2021 PG 7 7
BrP032 Firs Stables, Woodside Lane (Green Belt) C3 6/2016/0946/RM 07/06/2020 PG 5 5
- 2 x small site (less than 5 dwellings) under construction C3 Various N/A UC 2 2
- 15 x small sites (less than 5 dwellings) with permission granted C3 Various N/A PG 6 7 13
Total Rural Areas 6 21 16 0 0 43
- 3 x small site (less than 5 dwellings) under construction C3 Various N/A PG -2 3 1 2
Total Welham Green -2 3 1 0 0 2
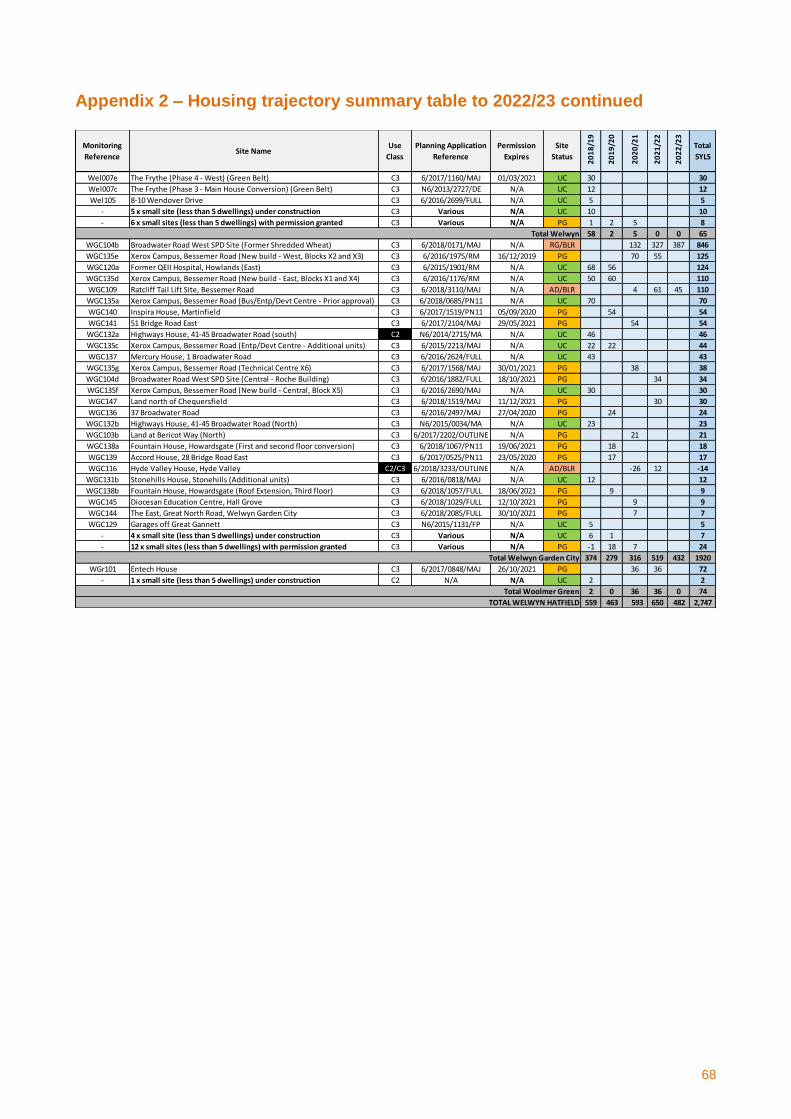
68
Appendix 2 – Housing trajectory summary table to 2022/23 continued
Monitoring
ReferenceSite Name
Use
Class
Planning Application
Reference
Permission
Expires
Site
Status
20
18
/19
20
19
/20
20
20
/21
20
21
/22
20
22
/23
Total
5YLS
Wel007e The Frythe (Phase 4 - West) (Green Belt) C3 6/2017/1160/MAJ 01/03/2021 UC 30 30
Wel007c The Frythe (Phase 3 - Main House Conversion) (Green Belt) C3 N6/2013/2727/DE N/A UC 12 12
Wel105 8-10 Wendover Drive C3 6/2016/2699/FULL N/A UC 5 5
- 5 x small site (less than 5 dwellings) under construction C3 Various N/A UC 10 10
- 6 x small sites (less than 5 dwellings) with permission granted C3 Various N/A PG 1 2 5 8
Total Welwyn 58 2 5 0 0 65
WGC104b Broadwater Road West SPD Site (Former Shredded Wheat) C3 6/2018/0171/MAJ N/A RG/BLR 132 327 387 846
WGC135e Xerox Campus, Bessemer Road (New build - West, Blocks X2 and X3) C3 6/2016/1975/RM 16/12/2019 PG 70 55 125
WGC120a Former QEII Hospital, Howlands (East) C3 6/2015/1901/RM N/A UC 68 56 124
WGC135d Xerox Campus, Bessemer Road (New build - East, Blocks X1 and X4) C3 6/2016/1176/RM N/A UC 50 60 110
WGC109 Ratcliff Tail Lift Site, Bessemer Road C3 6/2018/3110/MAJ N/A AD/BLR 4 61 45 110
WGC135a Xerox Campus, Bessemer Road (Bus/Entp/Devt Centre - Prior approval) C3 6/2018/0685/PN11 N/A UC 70 70
WGC140 Inspira House, Martinfield C3 6/2017/1519/PN11 05/09/2020 PG 54 54
WGC141 51 Bridge Road East C3 6/2017/2104/MAJ 29/05/2021 PG 54 54
WGC132a Highways House, 41-45 Broadwater Road (south) C2 N6/2014/2715/MA N/A UC 46 46
WGC135c Xerox Campus, Bessemer Road (Entp/Devt Centre - Additional units) C3 6/2015/2213/MAJ N/A UC 22 22 44
WGC137 Mercury House, 1 Broadwater Road C3 6/2016/2624/FULL N/A UC 43 43
WGC135g Xerox Campus, Bessemer Road (Technical Centre X6) C3 6/2017/1568/MAJ 30/01/2021 PG 38 38
WGC104d Broadwater Road West SPD Site (Central - Roche Building) C3 6/2016/1882/FULL 18/10/2021 PG 34 34
WGC135f Xerox Campus, Bessemer Road (New build - Central, Block X5) C3 6/2016/2690/MAJ N/A UC 30 30
WGC147 Land north of Chequersfield C3 6/2018/1519/MAJ 11/12/2021 PG 30 30
WGC136 37 Broadwater Road C3 6/2016/2497/MAJ 27/04/2020 PG 24 24
WGC132b Highways House, 41-45 Broadwater Road (North) C3 N6/2015/0034/MA N/A UC 23 23
WGC103b Land at Bericot Way (North) C3 6/2017/2202/OUTLINE N/A PG 21 21
WGC138a Fountain House, Howardsgate (First and second floor conversion) C3 6/2018/1067/PN11 19/06/2021 PG 18 18
WGC139 Accord House, 28 Bridge Road East C3 6/2017/0525/PN11 23/05/2020 PG 17 17
WGC116 Hyde Valley House, Hyde Valley C2/C3 6/2018/3233/OUTLINE N/A AD/BLR -26 12 -14
WGC131b Stonehills House, Stonehills (Additional units) C3 6/2016/0818/MAJ N/A UC 12 12
WGC138b Fountain House, Howardsgate (Roof Extension, Third floor) C3 6/2018/1057/FULL 18/06/2021 PG 9 9
WGC145 Diocesan Education Centre, Hall Grove C3 6/2018/1029/FULL 12/10/2021 PG 9 9
WGC144 The East, Great North Road, Welwyn Garden City C3 6/2018/2085/FULL 30/10/2021 PG 7 7
WGC129 Garages off Great Gannett C3 N6/2015/1131/FP N/A UC 5 5
- 4 x small site (less than 5 dwellings) under construction C3 Various N/A UC 6 1 7
- 12 x small sites (less than 5 dwellings) with permission granted C3 Various N/A PG -1 18 7 24
Total Welwyn Garden City 374 279 316 519 432 1920
WGr101 Entech House C3 6/2017/0848/MAJ 26/10/2021 PG 36 36 72
- 1 x small site (less than 5 dwellings) under construction C2 N/A N/A UC 2 2
Total Woolmer Green 2 0 36 36 0 74
559 463 593 650 482 2,747 TOTAL WELWYN HATFIELD

69
70
The Annual Monitoring Report is produced and published by: Planning Policy Welwyn Hatfield Borough Council The Campus Welwyn Garden City Hertfordshire AL8 6AE Tel: 01707 357532
Email: [email protected]
If you would like to receive this document in a different language or format please call 01707 557000 or
email [email protected]
Recommended