CLEAN WATER SERVICES • FY 2021-22 PROPOSED BUDGET i
Budget Committee • Fiscal Year 2021-22
BOARD OF DIRECTORS MEMBERS
Kathryn Harrington, At-Large, Chair
Nafisa Fai, District 1
Pam Treece, District 2
Roy Rogers, District 3
Jerry Willey, District 4
COMMUNITY MEMBERS
Molly Brown
Andy Duyck
Lori Hennings
Mike McKillip
Tony Weller

CLEAN WATER SERVICES • FY 2021-22 PROPOSED BUDGET ii
The Government Finance Officers Association of the United States and Canada (GFOA) presented a Distinguished Budget Presentation award to Clean Water Services for its annual budget for fiscal year beginning July 1, 2020. In order to receive this award, a governmental unit must publish a budget document that meets program criteria as a policy document, as an operations guide, as a financial plan and as a communications device. The award is valid for one year. We believe our current budget continues to conform to program requirements and we are submitting it to GFOA to determine its eligibility for another award.
Clean Water Services has received both the Distinguished Budget Presentation and the Certificate of Achievement for Excellence in Financial Reporting every year it has applied. This represents 33 years for the budget award and 34 years for the financial report.
D istinguishedB udget P resentation
A w ard
G O V E R N M E N T FIN A N C E O FFIC E R S A S S O C IA TIO N
July 1, 2020
For the Fiscal Year Beginning
PRESENTED TO
Clean Water Services
Executive Director
Oregon

CLEAN WATER SERVICES • FY 2021-22 PROPOSED BUDGET iii
Table of ContentsBUDGET IN BRIEFBudget Committee • Fiscal Year 2021-22 .......................... iBudget Message & Budget Overview ...............................1About Clean Water Services ............................................29History: District Formation ..................................................29The Organization ................................................................30Regulatory History & Current Operating Environment........31District Map .........................................................................37District Organizational Chart...............................................38Strategic Planning ............................................................39Mission, Vision, Promise, Values ........................................39Business Planning ..............................................................41Financial Policies .............................................................43Budget Process ................................................................47Budget Process Calendar...................................................48Budget Overview ..............................................................51Budget Overview – All Funds Summary .............................53Budget Sources & Uses ...................................................55Sources of District Funds ...................................................55Uses of District Funds ........................................................61Departmental Summaries ...................................................67District Summary of Positions ............................................75Debt Service ......................................................................77Debt Service Requirements ...............................................77Capital Project Summary .................................................81Major Sanitary Sewer Projects ..........................................83Major Surface Water Management Projects .......................86Financial Outlook .............................................................89Strategies ...........................................................................89Financial Forecast Assumptions .........................................90

CLEAN WATER SERVICES • FY 2021-22 PROPOSED BUDGET iv
DEPARTMENTAL DETAIL
FUND & PROGRAM DETAILFunds Summary ...............................................................93Resources & Requirements................................................94Fund Accounting Structure .................................................95General Fund Program Codes .........................................96Operating Funds ...............................................................97General Fund 101...............................................................98Storm & Surface Water Management Fund 201 ..............100Construction Funds .......................................................103Sanitary Sewer System LID Construction Fund 108 ........105Surface Water Management LID Construction Fund 208 .106Sanitary Sewer Construction Fund 112 ............................107Surface Water Management Construction Fund 212 .......108Reserve Funds ................................................................109Liability Reserve Fund 102 ............................................... 110Sanitary Sewer Capital Replacement Fund 106............... 111Surface Water Management
Capital Replacement Fund 206 .................................... 112Sanitary Sewer Capital Reserve Fund 107 ...................... 113Surface Water Management Capital Reserve Fund 207 .. 114Debt Service Funds ........................................................ 115Master Plan Update Debt Service Fund 111 .................... 115Revenue Pension Bond Fund 114 .................................... 117
Business Services ............................................................ 119Enterprise Asset & Technical Services .............................153Natural Systems Enhancement & Stewardship ................169Regional Utilities Services ................................................185Regulatory Affairs .............................................................197Utility Operations & Services ............................................209Water Resource Recovery Operations & Services ...........245
APPENDIXChart of Accounts .............................................................285Sanitary Sewer Capital Project List ..................................286Surface Water Capital Project List ...................................302Glossary ...........................................................................307Abbreviations ....................................................................319

CLEAN WATER SERVICES • FY 2021-22 PROPOSED BUDGET PAGE 1
Budget Message & Budget Overview
Chair Kathryn HarringtonMembers of the Board of DirectorsMembers of the Community Budget CommitteeClean Water Services Customers and Partners:
We are pleased to present Clean Water Services’ proposed budget for Fiscal Year (FY) 2021-22. This budget message is presented in accordance with Oregon Revised Statutes (ORS), Chapter 294, and is designed to present an overview that will help readers better understand this budget as a financial planning road map. Comparisons in this Budget Message are budget to budget to the revised FY 2020-21 budget unless otherwise noted.
Clean Water Services (District) is a regional utility that helps the people and businesses in the region grow and thrive. We anticipate and solve the complex water challenges of a large region and return water to a small, slow and sensitive river. We’re overachievers, because the Tualatin River demands us to be.
The PandemicThe emergence of the COVID-19 pandemic in FY 2019-20 brought economic hardships that our community and ratepayers could not have anticipated. The abrupt threat to public health and the resulting economic impact of the pandemic challenged local and state governments, large and small businesses, and families in our community.
In recognition of those economic impacts, we helped secure $3 million from the CARES Act for Community Action to fund a utility assistance program that served ratepayers in Washington County impacted by COVID-19. We suspended planned increases

CLEAN WATER SERVICES • FY 2021-22 PROPOSED BUDGET PAGE 2
to sanitary sewer and surface water management rates through June 30, 2021.
Clean Water Services received federal award funding of over $1.67 million through Washington County CARES Act Cities & Special Districts Assistance Grants and the Federal Emergency Management Agency. These funds covered additional costs incurred by Clean Water Services to operate our Emergency Operations Center, purchase digital equipment to support remote working for staff, produce and purchase personal protective equipment (PPE), cover COVID-19 temporary leave for staff, install health and safety upgrades at our facilities, and support efforts by our Sewer Surveillance Lab to track COVID-19 in the sanitary sewer system.
Low-income water and wastewater ratepayer assistance funding was included the December 2020 Pandemic Relief Package and the March 2021 American Rescue Plan Act (ARPA). We are working with federal and state authorities to monitor and support the distribution of this first-ever ratepayer assistance funding to qualifying ratepayers. We are also monitoring implementation of ARPA, which includes resources for state and local governments to invest in infrastructure, including wastewater.
In response to scarcity, the community stepped up by tripling donations for the food insecure during our annual Leaf Disposal and Food Drive. Our staff implemented the People Protecting People project in collaboration with several community partners to provide personal protective equipment where it is needed most. More than 1.6 million pieces of PPE have been distributed to agricultural
Clean Water Services crews and
community partners help distribute
personal protective equipment in
summer 2020.

CLEAN WATER SERVICES • FY 2021-22 PROPOSED BUDGET PAGE 3
workers, COVID Business Recovery Centers, community-based organizations, TriMet passengers, and employees of Washington County assisted living facilities and food processing companies. Those distribution efforts continue.
Ensuring our water is safe and clean always requires vigilance, but it took on new urgency in the face of a global pandemic. Our 406 employees had to find ways to work together while staying apart, but we never stopped delivering the round-the-clock, essential services that our community depends on.
We also never stopped innovating and connecting, as we collaborated with Oregon State University, Oregon Health & Science University and Oregon Health Authority on research projects to help public health officials detect the presence and scope of the virus in communities through wastewater testing.
Our utility was born in 1970 when a community came together to address a public health crisis. Today, we mourn the lives lost in this pandemic and we look forward with hope as our community continues working together to overcome this crisis and prepare for those that lie ahead.
Going forward, we need to be deliberate and measured with our investments, as well as forward-thinking and proactive in our financial planning while doing our part for the economic recovery in the region.
Repositioning CWS to Meet the Needs of the FutureOver the past year, Clean Water Services has been working to reposition and align our people, resources and programs to better position the organization to deliver on our key strategic outcomes and respond to future challenges and opportunities. We’re changing our structure to build a more resilient, responsive and nimble organization that integrates policy and strategy while effectively implementing programs to protect and restore our watershed and support the economic health of the region. This means fewer silos and more collaborative cross-discipline work. It means a more deliberate focus on the city, community and regional partnerships that drive success. It means an increased focus on research to help drive the innovation necessary to meet the challenges of increasingly stringent regulatory requirements, climate change and the needs of the Tualatin River.
The new organizational structure will create space to identify and nurture talent and leadership in our workforce. We’re proposing 17 new full time equivalent positions in the coming fiscal year; 12 are conversions of temporary positions where the workload has proven

CLEAN WATER SERVICES • FY 2021-22 PROPOSED BUDGET PAGE 4
sustained and long-term. We will continue to prioritize and sequence hiring for all current vacancies and new positions.
In FY 2020-21 we created three new senior leadership positions — Chief Operating Officer, Chief of Staff and Chief Utility Relations Officer — and shifted programmatic portfolios to continue to build the capacity and capability of the Clean Water Services team. In FY 2021-22 we’re creating two new service-driven departments. The Regional Utilities Services Department will be led by the Chief Utility Relations Officer and will focus on regional governmental relationships and agreements, agreements with large industrial customers and developers, regional community and economic development planning and services, systems planning and integrated planning. The Enterprise Asset & Technical Services department will focus on asset management, providing technical engineering services, designing and maintaining automation and control systems, and managing the maintenance and services for all District buildings and facilities.
PrioritiesHealth and safety are our priority. The community’s investment in protecting water resources helps us look beyond this pandemic and keep up with changing needs. The proposed FY 2021-22 budget supports our dedication to public health, the environment, our employees and our infrastructure assets by:
● Continuing to prioritize and sequence capital investments. ● Prioritizing and sequencing hiring for current vacancies and
new positions. ● Reducing travel and training and other operating costs that
can be delayed or deferred.
Budget SummaryThe all funds budget for FY 2021-22 excluding interfund transfers is $505.3 million, compared to last year’s revised budget of $489.5 million. This is an increase of $15.8 million or 3.2%. The total budget includes operating expenditures, capital investments, debt service, other fund level outlays, contingency and unappropriated ending working capital and reserves.
Primary ongoing budget revenues are rate revenues from sewer and surface water of $159.3 million and System Development Charges (SDCs) of $15.6 million. Rate revenues for sanitary sewer and surface water management (SWM) are projected to increase by $9.1 million or 6.1%, reflecting the effects of a proposed rate increase as well as customer growth.

CLEAN WATER SERVICES • FY 2021-22 PROPOSED BUDGET PAGE 5
Primary expenditures include $88.9 million for departmental operating expenses, $21.7 million for debt service on outstanding debt obligations, $93.6 million for capital projects, $7.0 million for other fund outlays and $37.3 million for contingencies. Total expenditures for FY 2021-22 increased by $9.8 million compared to the prior year, or 4.9%.
Total departmental operating expenditures are increasing by 4.8% overall. Labor costs are budgeted to increase by $2.3 million or 4.3%. This increase is primarily the result of costs from adding 17 positions during FY 2021-22. These additional positions will enable the District to continue its excellence in operations and maintenance as well as handle capital project workload driven by growth in the region and increased regulatory requirements. Materials and services are budgeted to increase by $1.8 million or 5.7% primarily due to increasing property insurance and software costs.
The Capital Improvement Program (CIP) is $93.6 million this year, a 6.7% increase. In response to COVID-19 in FY 2020-21, we focused on high priority assets and deferred the projects that could wait. That deliberate strategy is a factor in the increase in CIP expenditures in FY 2021-22. The District will continue to prioritize and sequence our investment in capital in response to the anticipated reduction in future revenue growth due to the deferred rate increase in FY 2021-21.
Other fund level outlays are budgeted to decrease by $134,500 or 1.9%.
FINANCIAL MANAGEMENT
Financial Management Excellence Recognized Clean Water Services continues to earn honors for excellence in financial reporting and budget presentation, as evidenced by awards for Achievement of Excellence in Financial Reporting and for Distinguished Budget Presentation in the most recent reporting periods from the Government Finance Officers Association of the United States and Canada.
Strategies to Keep the District On Track FinanciallyClean Water Services is initiating a comprehensive financial plan and cost of service study. In this study, our team will conduct a comprehensive review and update of the District’s long-term financial plan, cost of service analysis and develop a strategy for adjusting the sanitary sewer and surface water management rates and System Development Charges. The last time we conducted

CLEAN WATER SERVICES • FY 2021-22 PROPOSED BUDGET PAGE 6
a similar study was 2008. Since then we have seen growth in our customer base and organizational changes. It is now time to evaluate our financial strategy to ensure we maintain adequate funding for operating, maintenance and capital investment needs in the future. This will be a collaborative effort where we will engage our stakeholders throughout the course of the study for input on the direction of our work and outcomes. The FY 2021-22 budget has been prepared in accordance with the tenets of financial strategic direction established by the Clean Water Services Board of Directors (Board). These are as follows (see page 89 for more detail):
● Keep rate increases reasonable and predictable. ● Maintain adequate capacity to issue debt. ● Establish and maintain appropriate financial reserves. ● Adopt sound financial policies.
Utility RatesIn accordance with Board direction, reasonable and predictable rate increases are vital to the long-term financial health of Clean Water Services. They provide strong assurance that the organization is well positioned to meet future needs equipped with the strongest bond credit ratings and financial flexibility possible.
Rates support the District’s work to protect water resources and meet the changing needs of the community. We do this by making additional investments in aging infrastructure, ensuring our long-term water supply security and meeting increasingly stringent federal and state water pollution control needs.
The District sets the regional sanitary sewer and surface water management utility rates, which are charged to all customers. The District also sets local sanitary sewer and surface water management rates, which are charged to residents of unincorporated Washington County and the cities of Banks, North Plains, Gaston, King City and Durham. The seven large cities — Beaverton, Cornelius, Forest Grove, Hillsboro, Sherwood, Tigard and Tualatin — set their own local rates to deliver local services and meet local needs. More detail about regional and local services is available starting on page 34.

CLEAN WATER SERVICES • FY 2021-22 PROPOSED BUDGET PAGE 7
The District is proposing the following utility rate increases in FY 2021-22:
● Increase the regional sanitary sewer rate by 4.5% The regional rate is charged to all District customers to support the operations, maintenance and investments in the pipes, pumps and advanced facilities that collect and clean 62 million gallons a day of wastewater to some the highest standards in the nation before returning it to the Tualatin River.
● Increase the local sanitary sewer rate by 4.5% The local rate is charged to District customers in Banks, North Plains, Gaston, King City, Durham and unincorporated Washington County. The local rate supports operation and maintenance of the local collection system and 24-hour emergency response.
● Increase the regional SWM fees 5.4% The regional rate is charged to all District customers and supports watershed restoration, constructing and maintaining regional stormwater facilities.
● Increase the local SWM fee by 5.4% The local rate is charged to District customers in Banks, North Plains, Gaston, King City, Durham and unincorporated Washington County for services such as sweeping streets and maintaining water quality facilities.
● To help fund capital investments at Clean Water Services, increase sanitary SDCs from $5,800 to $6,085 per Equivalent Dwelling Unit. SWM SDCs would increase from $560 to $585 per Equivalent Service Unit. An SDC is a one-time assessment charged when customers connect to the District’s system. It’s set for the entire District.
The sanitary sewer and SWM rate increases will add an estimated $2.57 per month to the typical residential customer’s combined bill, a total combined rate increase of 4.6%.

CLEAN WATER SERVICES • FY 2021-22 PROPOSED BUDGET PAGE 8
Average combined monthly service fees for sanitary sewer and SWM utilities have risen at a 10-year average annual rate of 3.4%.
Average sanitary sewer bills are substantially lower than those of a majority of local service providers (see chart on next page).This is especially notable since Clean Water Services provides a substantially higher level of wastewater treatment than nearly all local, regional and national providers of comparable services. Looking forward, the District’s current financial forecast includes projected annual rate increases of 5.0% - 5.5% for the next 10 years.
10-YEAR UTILITY ► RATE HISTORY
Sanitary sewer and SWM average
monthly rates for single family
residential
Combined Sanitary Percentage Rate IncreasesFiscal and SWM Monthly Combined 10-YearYear Rates (per EDU & ESU) Annual Annual Avg (13-22)2013 $43.08 4.44%2014 $44.71 3.78%2015 $46.36 3.69%2016 $48.04 3.62%2017 $49.76 3.58%2018 $51.52 3.54%2019 $53.35 3.55%2020 $55.20 3.47%2021 $55.20 0.00%2022 $57.77 4.66% 3.4%
10-Year Utility Rate History
(Single Family Residential)Sanitary Sewer & SWM Average Monthly Rates

CLEAN WATER SERVICES • FY 2021-22 PROPOSED BUDGET PAGE 9
Clean Water Services bills customers who reside in Washington County within the urban growth boundary; the cities of Banks, Gaston, Durham, North Plains and King City; and small portions of Clackamas and Multnomah counties for sewer and surface water management services.
Customers also served by Tualatin Valley Water District receive a single bill that combines charges for our services along with the water charges.
The seven larger cities bill their customers directly for city services as well as services we provide. Each city remits the regional portion of revenue to Clean Water Services. These cities may add additional local surcharges or right-of-way fees to their bills. These charges are retained by each city.
CWS has been able to maintain lower rates for local services due to the size of our service area and customer base. The Urban Unincorporated area and small cities account for 42% of customer accounts and almost 45% of the population in Washington County.
◄TYPICAL MONTHLY SEWER AND SWM BILL COMPARISON RATE HISTORYDistrict provides a higher level of wastewater treatment than nearly all local, regional and national providers of comparable services
City / AgencyLevel of
Treatment
FY 2020-21AverageMonthlySanitary Charge
FY 2020-21AverageMonthly
SWMCharge
FY 2020-21AverageMonthly
CombinedBill
Estimated Rate Change
for FY 2021-22
EstimatedCombined
Monthly Bill
Clean Water Services AdvancedTertiary $45.95 $9.25 $55.20 4.5% sani &
5.4% SWM $57.77
Lake Oswego Secondary
provided by Portland
$76.93 $17.64 $94.57 3.9% sani &7% SWM $98.84
McMinnville AdvancedTertiary $70.94 $0.00 $70.94 2.5% sani $72.70
Portland Secondary $92.40 $30.05 $122.45 3.15% $126.31
SalemRates effective 1/1/2021 Secondary $43.81 $16.41 $60.22 3% sani &
5% SWM $62.37
Vancouver, WARates effective 1/1/2021 Secondary $46.40 (a)
$71.77 (b) $11.80 $58.20 (a)$81.48 (b)
3% sani & 5% SWM
$60.23 (a)$84.15 (b)
Rates calculated using CWS system average of 8 CCF use
Typical Monthly Sewer and SWM Bill Comparisons
(a) Inside city limits (b) Outside city limits
Clean WaterServices
VancouverInside Salem McMinnville Vancouver
Outside Lake Oswego Portland
SWM $9.75 $12.39 $17.23 $- $12.39 $18.87 $31.00Sanitary $48.02 $47.84 $45.14 $72.70 $71.76 $79.97 $95.31
$-
$20.00
$40.00
$60.00
$80.00
$100.00
$120.00
$140.00
Estimated Monthly Single Family Combined Bill
$57.77 $62.37 $60.23 $72.70
$126.31
$98.84
$84.15

CLEAN WATER SERVICES • FY 2021-22 PROPOSED BUDGET PAGE 10
CWS Hillsboro Beaverton Tigard Tualatin Forest Grove Sherwood CorneliusLocal $7.56 $11.67 $9.91 $12.36 $10.05 $11.74 $10.04 $17.59Regional $38.39 $38.39 $38.39 $38.39 $38.39 $38.39 $38.39 $38.39Population 276,515 104,670 99,225 54,520 27,195 25,435 19,885 12,635
-
50,000
100,000
150,000
200,000
250,000
300,000
$-
$10.00
$20.00
$30.00
$40.00
$50.00
$60.00
$45.95$48.30
$55.98
$50.13$50.06 $48.43$50.75
$48.44
SANITARYSEWERRATE▼ By Jurisdiction
CWS Hillsboro Beaverton Tigard Tualatin Forest Grove Sherwood CorneliusLocal $6.94 $9.26 $8.99 $12.44 $7.93 $7.94 $14.11 $12.34Regional $2.31 $2.31 $2.31 $2.31 $2.31 $2.31 $2.31 $2.31Population 276,515 104,670 99,225 54,520 27,195 25,435 19,885 12,635
-
50,000
100,000
150,000
200,000
250,000
300,000
$-
$2.00
$4.00
$6.00
$8.00
$10.00
$12.00
$14.00
$16.00
$18.00
$9.25
$11.30
$14.65
$10.25
$11.57
$16.42
$14.75
$10.24
SWMRATE▼ By Jurisdiction
The incorporated cities have a smaller customer base to spread costs of operation over and have increased their local rates to meet these needs.

CLEAN WATER SERVICES • FY 2021-22 PROPOSED BUDGET PAGE 11
Capacity to Issue DebtTo ensure adequate fiscal capacity to issue debt and meet sanitary sewer system expansion needs, Clean Water Services has a financial practice to maintain coverage ratios above the minimum required by the existing bond covenants to maintain a high bond rating. The FY 2021-22 budget continues this practice with an estimated coverage ratio of 4.10, compared to the minimum coverage requirement of 1.20 times annual debt service. Clean Water Services’ strong financial position has earned Standard & Poor’s highest rating of AAA as well as Aa1 by Moody’s Investors Service. This strong financial performance and bond rating positions Clean Water Services well for future bond issuances to fund large infrastructure project investments to meet regulatory and growth requirements.
Maintain Financial ReservesFinancial reserves provide stable funding for working capital, operating contingencies and capital investments for repair and replacement and expansion of infrastructure. The planned rate increases ranging from 5.0% - 5.5% will allow for growth in operating reserves to meet funding needs for operations and capital investments including the Water Supply Program to increase water supply to the Tualatin River.
The multiyear financial forecast reflects a planned SWM rate increase of 5% to fund needed capital replacements such as street sweepers and to provide stormwater treatment to areas with inadequate stormwater management facilities. Clean Water Services has prioritized SWM capital projects in the five-year CIP.
Financial PoliciesThe Board has established a number of policies that provide management with direction in decision-making and foster financial stability and the ability to accomplish the organization’s mission. These policies are detailed on page 43.
CLEAN WATER SERVICES • FY 2021-22 PROPOSED BUDGET PAGE 12
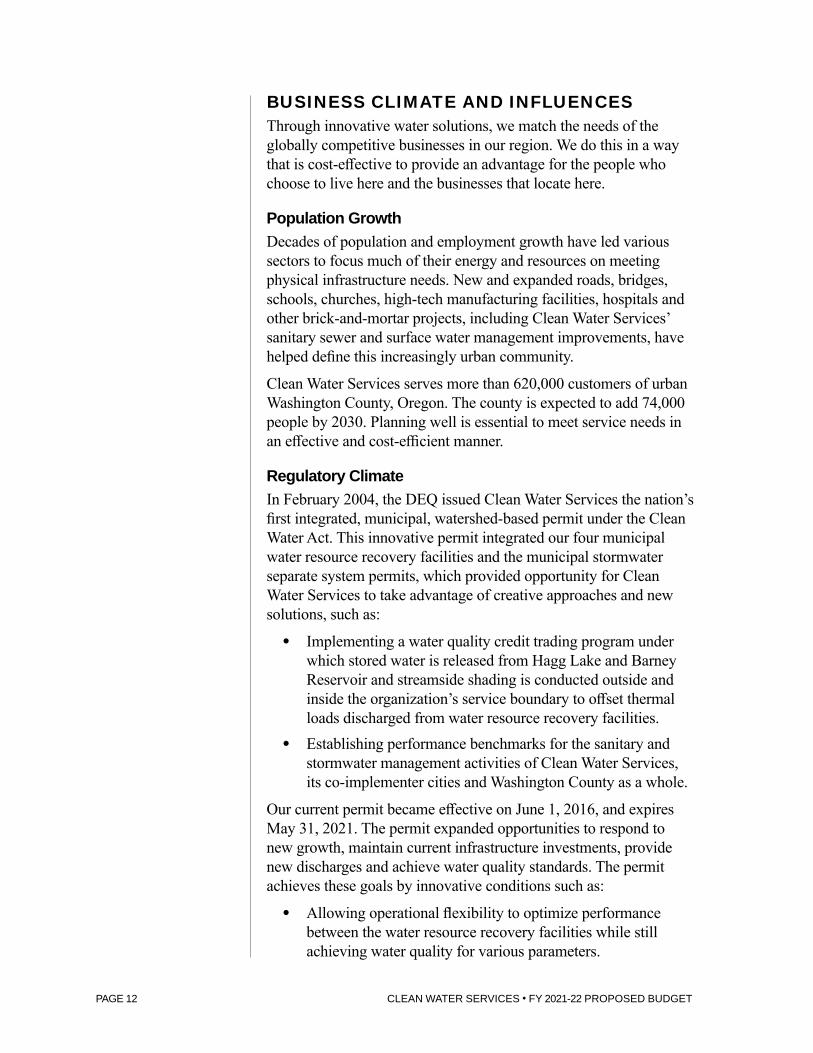
BUSINESS CLIMATE AND INFLUENCESThrough innovative water solutions, we match the needs of the globally competitive businesses in our region. We do this in a way that is cost-effective to provide an advantage for the people who choose to live here and the businesses that locate here.
Population GrowthDecades of population and employment growth have led various sectors to focus much of their energy and resources on meeting physical infrastructure needs. New and expanded roads, bridges, schools, churches, high-tech manufacturing facilities, hospitals and other brick-and-mortar projects, including Clean Water Services’ sanitary sewer and surface water management improvements, have helped define this increasingly urban community.
Clean Water Services serves more than 620,000 customers of urban Washington County, Oregon. The county is expected to add 74,000 people by 2030. Planning well is essential to meet service needs in an effective and cost-efficient manner.
Regulatory ClimateIn February 2004, the DEQ issued Clean Water Services the nation’s first integrated, municipal, watershed-based permit under the Clean Water Act. This innovative permit integrated our four municipal water resource recovery facilities and the municipal stormwater separate system permits, which provided opportunity for Clean Water Services to take advantage of creative approaches and new solutions, such as:
● Implementing a water quality credit trading program under which stored water is released from Hagg Lake and Barney Reservoir and streamside shading is conducted outside and inside the organization’s service boundary to offset thermal loads discharged from water resource recovery facilities.
● Establishing performance benchmarks for the sanitary and stormwater management activities of Clean Water Services, its co-implementer cities and Washington County as a whole.
Our current permit became effective on June 1, 2016, and expires May 31, 2021. The permit expanded opportunities to respond to new growth, maintain current infrastructure investments, provide new discharges and achieve water quality standards. The permit achieves these goals by innovative conditions such as:
● Allowing operational flexibility to optimize performance between the water resource recovery facilities while still achieving water quality for various parameters.

CLEAN WATER SERVICES • FY 2021-22 PROPOSED BUDGET PAGE 13
● Providing for a new and innovative natural treatment system discharge.
● Optimizing treatment strategies for the Natural Treatment System.
● Optimizing discharge limits and compliance measurements by integrating bubble loads, which allow for sharing permit limits between water resource recovery facilities and thereby providing greater opportunity for operational optimization and compliance assurance.
● Enhancing water quality trading between facilities, streamside shading and flow management.
● Planning for growth and development in the basin. ● Consolidating regulatory reporting requirements including
electronic reporting for state and federal reporting requirements.
● Developing and applying state-of-the-art dynamic water quality models to assess long-term strategies for compliance and to evaluate alternatives for changes to Scoggins Dam.
● Providing research and data supporting the DEQ development and application of a biotic ligand model criteria for copper and accurate methods for “Reasonable Potential Analysis” to ensure achievable compliance at the water resource recovery facilities.
We applied for a new permit in December 2020. The permit application includes EPA and DEQ forms for the four resource recovery facilities and specific stormwater elements that are identified in the permit. DEQ has found the application administratively complete and the current permit can be extended past the expiration date. DEQ is planning to issue a new permit on or before September 1, 2021.
As part of the permit application process, we developed an Integrated Plan to establish a long-term permitting strategy. The strategy describes current activities we are implementing and long-term objectives related to permit compliance. These efforts are designed to integrate our compliance objectives with broader strategic efforts for the entire basin. The long-term efforts focus on improving health and resilience, responding to growth and the anticipated impacts of climate change on our basin, controlling pollution, and improving ecological outcomes. Many of the strategies we want to implement require regulatory support and action and will take time to implement. These actions include:

CLEAN WATER SERVICES • FY 2021-22 PROPOSED BUDGET PAGE 14
● Affirming a watershed-based approach. ● Incorporating the Integrated Plan to guide future permitting. ● Affirming a subbasin approach for stormwater management
to provide resilience in urban streams, and responding to anticipated climate change by integrating stream enhancement, flow, treatment and upland stormwater controls.
● Incorporating the observed benefits of the Natural Treatment System into the compliance regulatory permitting structure at the Forest Grove Water Resource Recovery Facility and Natural Treatment System.
● Updating the thermal load management plan to expand water resource strategies, prioritize efforts to protect aquatic resources and refine the trading ratio for riparian planting.
● Adopting more modern, cost effective compliance monitoring.
● Expanding the recycled water use program to provide more opportunities to apply recycled water, including natural resource restoration.
● Updating the monitoring frequency at the water resource recovery facilities.
● Updating the phosphorus TMDL to focus on biological processes.
The permit and regulatory requirements are complex, and we implement innovative programs to implement and ensure compliance. We anticipate that extensive reuse goals will require changes to how we manage industrial and commercial discharges, track and control pollutants, and effectively implement pollution prevention and minimization efforts. The Laboratory, Environmental Services and the Administration programs in Regulatory Affairs are creating road maps to help create the necessary framework to meet these obligations. The Environmental Services staff is also updating its core documents to establish the foundation needed to meet the expectations envisioned in the Integrated Plan.
Clean Water Services continues to work with DEQ to implement several water quality standards including copper, mercury and disinfection by-products. One notable effort is the development of methods for measuring biologically available aluminum. EPA incorporated information developed by the laboratory into the new aluminum standard, which allows substantial flexibility for compliance. RAD is currently working with DEQ to develop procedures for application in Oregon.

CLEAN WATER SERVICES • FY 2021-22 PROPOSED BUDGET PAGE 15
Clean Water Services has undertaken an extensive sampling and modeling effort of the Tualatin Basin to support a request to modify the current regulatory requirements for the Tualatin River. One substantive proposal would be changing the phosphorus limits to allow the District to reduce chemical addition while achieving the new aluminum standard and still improve water quality in the Tualatin River. The District has implemented innovative monitoring and outreach for a class of toxic perfluorinated compounds (PFAS) to obtain information in advance of regulatory requirements.
Clean Water Services has also worked with regulatory agencies to develop strategies to increase water reuse for irrigation, restoration and growing wetland plants to support wetland restoration. Clean Water Services has developed and implemented innovative strategies that link stream enhancement, runoff control, and urban stormwater treatment to meet regulatory requirements, achieve substantive ecological health improvement and provide resiliency to urban streams.
There has been significant improvement in the water quality in the Tualatin River due to effective pollution control efforts and innovative strategies for nutrient control, effluent reuse and water management. The Regulatory Affairs group has initiated extensive analytical and modeling efforts and will use this information to work with DEQ and guide future regulatory approaches.
While water quality has improved in the Tualatin River and its tributaries in the last decade, new and more complex challenges have arisen that cannot be solved through pollution control alone. These challenges to the health of the Tualatin River basin require a cohesive, watershed-based strategy that reaches beyond the existing regulatory framework. The watershed-based permit allows regulators, permit holders and community stakeholders to consider

CLEAN WATER SERVICES • FY 2021-22 PROPOSED BUDGET PAGE 16
the entire watershed, not just individual point sources, when managing the water resources in the basin.
Clean Water Services’ successful record of implementing complex water quality regulations through partnerships and collaboration is widely recognized as a national model. Investments by our customers in a highly advanced wastewater treatment program and a comprehensive surface water management program have paid off in a watershed that is healthier than it has been in generations – and at an affordable cost, in comparison, to peer agencies.
WE BELIEVE IN THE TUALATIN BASINThe District’s commitment to the Tualatin Basin is apparent in the budget with advanced water resource recovery and comprehensive stormwater management. Our conveyance and treatment of wastewater produce billions of gallons of clean water, with millions of gallons applied to parks, schools and golf courses. We produce biosolids that help grow grass seed and forage crops. Recovering resources in the wastewater includes recovering energy – enough to produce millions of kilowatt hours of electric power used to offset over a third of the electric power requirements for treatment.
Recovering nutrients also allows Clean Water Services to create a unique slow-release fertilizer that is better for plants and helps protect our streams and the Tualatin River. It’s available as a retail product called Clean Water Grow®. GROW was created in 2012 and is produced and sold by the Clean Water Institute in collaboration with Clean Water Services. The slow-release fertilizer contains Crystal Green® recovered from used water at the Durham and Rock Creek water resource recovery facilities through Ostara’s nutrient recovery system. The result is a high-performing retail product that benefits the environment, improves operation and maintenance of the resource recovery process and provides the community with a thriving plant food for their gardens. This product is made possible by the ratepayers’ investment in building the nation’s most advanced water resource recovery facilities at the Durham and Rock Creek facilities.
We Believe in Watershed HealthClean Water Services has spent more than 50 years pursuing a cohesive strategy to advance the health of the Tualatin River Watershed for more than 620,000 residents in 12 cities and Washington County. Through innovation, scientific knowledge and creativity, we work to improve environmental health and value for our customers. These efforts have paid dividends for water quality,

CLEAN WATER SERVICES • FY 2021-22 PROPOSED BUDGET PAGE 17
public health and our community. The Tualatin River is healthier than it has been in generations and has become a valued recreational asset.
We Believe in Infrastructure, Public Health and the EnvironmentOver the past 10 years, Clean Water Services and our co-implementer cities have invested more than $570 million to expand, replace and upgrade our community’s four water resource recovery facilities, 43 pump stations, sewer lines and storm sewers. The District is responsible for 859 miles of the 1,860 miles of sewer lines and 549 miles of the 1,529 miles of storm sewers.
Achievements in FY 2020-21
● Cleaned more than 22.7 billion gallons of wastewater. ● Recycled an average of 31.5 dry tons of biosolids per day
onto agricultural fields in the Willamette Valley and eastern Oregon to improve soil condition and crop production.
● Monitored over 9,700 strict permit conditions at District water resource recovery facilities, including monthly, weekly and daily limits established to protect the Tualatin River.
● Earned the National Association of Clean Water Agency’s highest awards at three water resource recovery facilities for 100% permit compliance (Gold Award), including for more than five consecutive years at three of the facilities (Platinum Award). One facility earned a Silver Award for less than five permit exceptions.
● Invested $454,000 in facilities, equipment and supplies to help keep District employees safe during the pandemic. Work included:
○ Upgrading to higher levels of HVAC filtration. ○ Modifying workspaces with cubicle wall glass stackers
and signage. ○ Installing alternate work sites for construction crews and
other employees at the Materials Handling Yard and ripl. ○ Increasing janitorial service and sanitization of facilities. ○ Installing portable temporary restrooms for District field
staff and contractors. ○ Procuring and distributing PPE masks, sanitizer and
gloves.
CLEAN WATER SERVICES • FY 2021-22 PROPOSED BUDGET PAGE 18
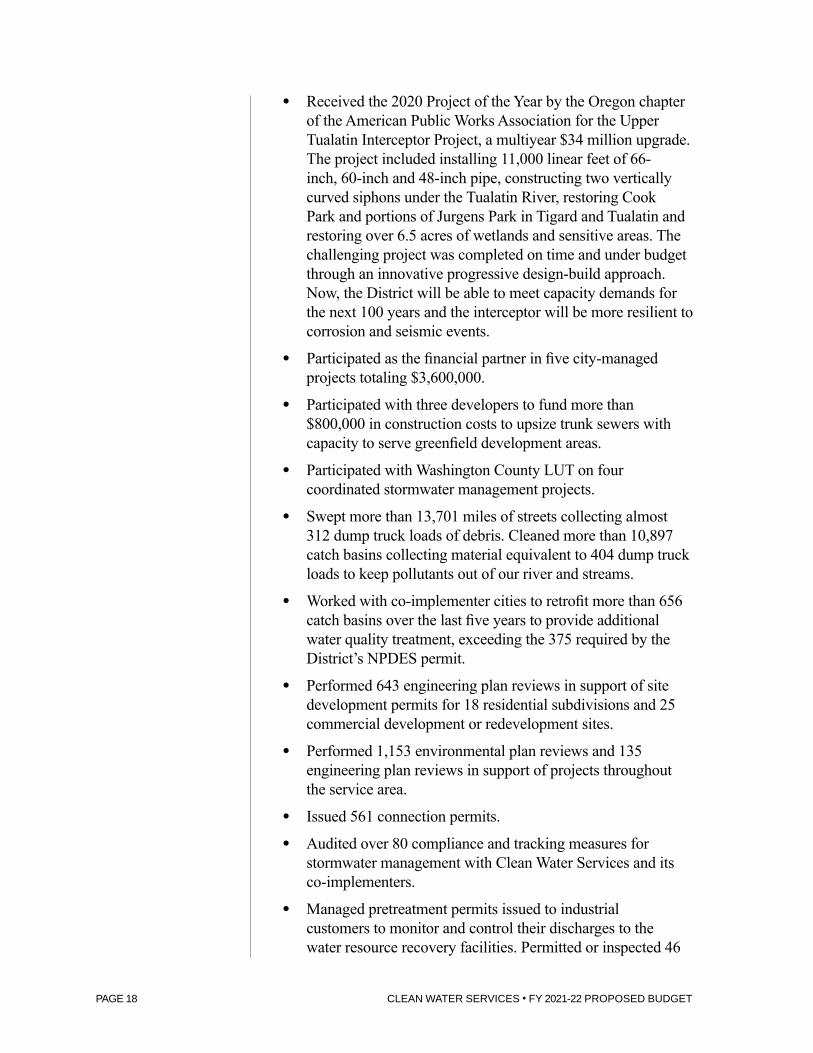
● Received the 2020 Project of the Year by the Oregon chapter of the American Public Works Association for the Upper Tualatin Interceptor Project, a multiyear $34 million upgrade. The project included installing 11,000 linear feet of 66-inch, 60-inch and 48-inch pipe, constructing two vertically curved siphons under the Tualatin River, restoring Cook Park and portions of Jurgens Park in Tigard and Tualatin and restoring over 6.5 acres of wetlands and sensitive areas. The challenging project was completed on time and under budget through an innovative progressive design-build approach. Now, the District will be able to meet capacity demands for the next 100 years and the interceptor will be more resilient to corrosion and seismic events.
● Participated as the financial partner in five city-managed projects totaling $3,600,000.
● Participated with three developers to fund more than $800,000 in construction costs to upsize trunk sewers with capacity to serve greenfield development areas.
● Participated with Washington County LUT on four coordinated stormwater management projects.
● Swept more than 13,701 miles of streets collecting almost 312 dump truck loads of debris. Cleaned more than 10,897 catch basins collecting material equivalent to 404 dump truck loads to keep pollutants out of our river and streams.
● Worked with co-implementer cities to retrofit more than 656 catch basins over the last five years to provide additional water quality treatment, exceeding the 375 required by the District’s NPDES permit.
● Performed 643 engineering plan reviews in support of site development permits for 18 residential subdivisions and 25 commercial development or redevelopment sites.
● Performed 1,153 environmental plan reviews and 135 engineering plan reviews in support of projects throughout the service area.
● Issued 561 connection permits. ● Audited over 80 compliance and tracking measures for
stormwater management with Clean Water Services and its co-implementers.
● Managed pretreatment permits issued to industrial customers to monitor and control their discharges to the water resource recovery facilities. Permitted or inspected 46

CLEAN WATER SERVICES • FY 2021-22 PROPOSED BUDGET PAGE 19
facilities discharging to the stormwater conveyance system. Inspected 57 dentist offices to control mercury discharges to resource recovery facilities. Issued 58 Ecological Business certifications.
● Established and implemented a monitoring plan to sample for perfluorinated compounds at regular intervals at select industrial contributors, treatment facilities and key collection system sampling points throughout the District’s watersheds.
● Participated in three pilot studies to evaluate in-line wastewater monitoring in the sewage collection systems that could provide an additional layer of protection for the water resource recovery systems.
● Created an innovative dashboard tool to track our NPDES compliance and monitoring activities. The tool helps with data review and prompts follow-up to help maintain compliance with permit requirements and improve regulatory efficiency and oversight.
● Updated the District’s Recycled Water Use Plan to include seven additional land application sites. Worked with the DEQ to expand the District’s recycled water use program to include supporting native wetland plant growth.

CLEAN WATER SERVICES • FY 2021-22 PROPOSED BUDGET PAGE 20
● Continued to work with DEQ and the Tualatin River Watershed Council on a collaborative study in the Dairy McKay subbasin evaluating the effects of flow enhancement and riparian planting restoration efforts on temperature and water quality in the subbasin.
● Continued to implement the proactive mercury minimization plan, which provided a smooth transition to the new federal requirements for mercury reporting from dentist offices. To date the district has received 99.2% of required dentist office reporting.
We Believe in Resource Recovery Clean Water Services is a leader in the industry’s transformation from advanced wastewater treatment to recovering valuable resources that include clean water, renewable energy and nutrients. We’ve shifted from conventional treatment systems of pipes, pumps and plants into resource recovery facilities to minimize waste, maximize resources and save ratepayers money.
Achievements in FY 2020-21
● Provided 75 million gallons (including on-site use) of irrigation water to more than 218 acres of athletic fields, golf courses, and parks from the Durham facility.
● Generated approximately 21.5 million kilowatt hours of renewable energy by capturing digester gas from the Rock Creek and Durham facilities, as well as solar power at Durham to meet approximately 47% of the electrical demands for the Durham and Rock Creek facilities.
● Recycled phosphorus and ammonia at the Durham and Rock Creek facilities to produce more than 765 tons of Crystal Green fertilizer for sale to the commercial nursery and agricultural industry.
● Continued the development of Clean Water Grow, a slow-release fertilizer that helps reduce nutrient runoff to waterways by slowly releasing nutrients as plants use them.
We Believe in ScienceAs a first-class regional utility, we control our destiny through research and innovation in the face of population growth and water quality demands to return water to the sensitive Tualatin River. We’re in a new era with new challenges — climate changes, more complex treatment, larger facilities and aging infrastructure. Technology is more complex. We need to replace assets and take

CLEAN WATER SERVICES • FY 2021-22 PROPOSED BUDGET PAGE 21
advantage of more modern technology. What was once new, now needs renewal.
Achievements in FY 2020-21
● The research and innovation staff conducted over 20 research studies including:
○ Disinfection by-product reduction and compliance. ○ Nutrient control and treatment process. ○ Natural Treatment System treatment optimization. ○ Impacts of removing phosphorus at Rock Creek and
Durham without tertiary alum treatment. ○ Optimization and stabilization of biological phosphorus
removal. ○ Presence of SARS-CoV-2 in wastewater at the four
CWS water resource recovery facilities and throughout Washington County.
○ Establishment of local limits for industrial dischargers based on inhibition testing.
○ Measurement of allowable loadings into the Durham anaerobic digesters of fats, oils and grease.
○ Improved techniques for wetland and understory species. ○ Optimization of treatment for direct potable reuse. ○ Development of DIY continuous monitors for ambient
and conveyance flow regimes. ○ Development of a water quality model in cooperation
with Portland State University for Hagg Lake and the Tualatin River basin.
○ Development of a model to evaluate future scenarios to meet thermal NPDES permit requirements and options for the Scoggins Dam safety modifications.
● The Water Quality Laboratory: ○ Produced surface disinfectants, hand disinfectant and
disinfecting wipes for the District and other County programs.
○ Performed approximately 216,000 chemical, biological and physical analyses to help Clean Water Services assure the health and safety of the Tualatin River Watershed and its residents.

CLEAN WATER SERVICES • FY 2021-22 PROPOSED BUDGET PAGE 22
○ Monitored 70 water quality parameters at 38 sites on the Tualatin River and its tributaries twice per month and operates a continuous water quality monitoring station on Beaverton Creek.
○ Monitored wastewater treatment facilities to demonstrate compliance with permit requirements.
○ Monitored wastewater treatment operations to ensure proper operation of the treatment facilities and provide critical data to operators.
○ Monitored stormwater runoff from different land uses to assess characteristics and inform program management decisions.
○ Monitored industrial discharges to verify industries are meeting permit obligations.
○ Supported critical compliance analysis including innovative phosphorous fractionation and emerging methods for evaluation of aluminum toxicity.
○ Supported research and projects that included frog embryo survival in Kingfisher Marsh, effects of tributary flow restoration on water quality, harmful algae blooms, fungal uptake and degradation of pollutants, and a number of studies on improving efficiencies and effectiveness at the water resource recovery facilities.
○ Developed an asset management system to maintain critical equipment and implement project planning and resource management and reduce the need for external laboratory analytical support. The system has already saved over $100,000.
● Together with the United States Geological Survey (USGS), DEQ and the Washington County Watermaster, Clean Water Services has conducted comprehensive water quality and flow monitoring of the Tualatin River and its tributaries for more than two decades. This integrated monitoring program has allowed water resource managers to be more responsive to the needs and potential of the watershed. Some examples include:
○ Working with the USGS, Oregon Water Resources Department (District 18 Watermaster) and consultants, Clean Water Services co-funds and/or manages more than 20 stream flow gauging stations to continuously

CLEAN WATER SERVICES • FY 2021-22 PROPOSED BUDGET PAGE 23
measure the flow in the Tualatin River; Dairy, Fanno, Rock, Beaverton, Gales and Chicken creeks; and many other Tualatin River tributaries. Many of these locations provide real-time data that informs water resource management activities in the basin.
○ Working with the USGS, gathered continuous, real-time water quality data in the Tualatin River and major tributaries.
○ Coordinated with the District 18 Watermaster, Joint Water Commission and Tualatin Valley Irrigation District to manage stored water releases from Hagg Lake and Barney Reservoir to offset thermal loads from the water resource recovery facilities, maintain sustainable base flows in the Tualatin River and improve overall water quality.
● Completed a phosphorus study to update the Tualatin River phosphorus Total Maximum Daily Load (TMDL). The study assessed the capabilities of the water resource recovery facilities to remove phosphorus without adding tertiary alum and monitoring the river to evaluate the effects of the higher phosphorus loading to the river.
● Continued sampling, tracking and investigating industrial and other sources of PFAS to expand the understanding the impact on District infrastructure and biosolids. Continued outreach and working with select industries to reduce presence of perfluorinated compounds.
We Believe in Engagement and EducationClean Water Services encourages the community to join our efforts in protecting public health, enhancing the region’s environmental quality of life and planning for the region’s water future. We accomplish this with a supportive and collaborative internal culture where employees can see how their work is reflected in the District’s vision, mission and goals.
Achievements in FY 2020-21
● Provided virtual programming in the form of lesson plans, videos, and presentations to support distance learning for students and teachers in the Tualatin River Watershed. Synchronous programs reached 500 high school and college students, printed resources were delivered to 1,630 elementary students and asynchronous content was provided to more than 500 educators.

CLEAN WATER SERVICES • FY 2021-22 PROPOSED BUDGET PAGE 24
● Launched a digital storytelling tool to help students and community members understand the process of treating water and recovering resources.
● Produced and sold four blends of GROW retail fertilizer. GROW is sold on Amazon.com and at over 35 local and regional stores, including ACE Hardware, True Value chains and a variety of locally owned independent businesses. Portland Nursery and Amazon.com continue to be our fertilizer’s biggest fan, especially for stay-at-home gardeners this past fiscal year. Most importantly, the Clean Water Grow messaging and retail program advance the mission of Clean Water Services and the Clean Water Institute to promote resource recovery and watershed health.
● Promoted four times as many leaf drop-off events, which resulted in three times the number of leaves collected (2,345 cubic yards) and three times the amount of food donations (7,700 pounds — about the weight of an elephant). Cash donations increased by 300% from an annual average of $870 to $2,900 in FY 2020-21. Food donations went to St. Vincent de Paul of Hillsboro, and monetary donations went to the Oregon Food Bank.
We Believe in Organization CultureClean Water Services is focused on equity and diversity in our organization and in future hires to serve and reflect the region we serve.
● Launched a three-year diversity, equity and inclusion program development initiative with an initial focus on race. This first year was one of leadership learning, employee

CLEAN WATER SERVICES • FY 2021-22 PROPOSED BUDGET PAGE 25
engagement and research on best practices. The second year of the program will focus on employee learning while the third year will focus on plans and policy. We are sponsors of events for community organizations such as Centro Cultural, Community Action, Vision Action Network and others.
● Promoted employee safety and resilience through employee engagement and strategic internal communications in support of emergency operations for the pandemic and wildfires. Key topics included testing; contact tracing; safety tools such as face coverings, physical distancing, sanitation and self-monitoring; CWS policies; state guidance; tips for teleworking, online meetings and digital collaboration; childcare and schooling; vaccinations for flu and COVID-19; opportunities to give back; and making safe choices on personal time.
We Believe in Community and Building PartnershipsClean Water Services and Tree for All partners continue to build and strengthen innovative and resilient partnerships to enhance the benefits that natural resources provide to the community.
Achievements in FY 2020-21
● Since 2005, the 35-plus partners of Tree for All have restored 150 river miles of riparian habitat in the Tualatin River Watershed and planted more than 14 million native plants. Collectively these public and private partnerships are managing more than 30,000 acres for watershed health.
● Clean Water Services, US Fish and Wildlife Service and Tree for All partners created more than two miles of new high value stream habitat on the 300-acre Chicken Creek Project on Tualatin National Wildlife Refuge. This visionary project reconnected Chicken Creek to its historic floodplain through a meandering path linking remnant and newly constructed channels. A landscape-scale project with multiple funding partners enables all 300 acres to receive intensive native planting of riparian and wetland habitats, as well as incorporate access trails for humans.
● The Paseos Verdes (Watershed Health Walks), which includes training for bilingual walk leaders, continues to flourish. The program is a partnership with the Portland Audubon, Bienestar, Virginia Garcia and Tualatin Hills Park & Recreation District.
● Several improvements were completed during the past year at

CLEAN WATER SERVICES • FY 2021-22 PROPOSED BUDGET PAGE 26
the Wapato National Wildlife Refuge near Gaston including new bridges, walking paths and a new pump station. Multiple partners including Intel, US Fish and Wildlife Service, Tualatin Soil and Water Conservation District, Joint Water Commission, USGS, Metro and Bonneville Environmental Foundation have contributed funding and been working collaboratively on planning and implementing these and other projects at the refuge.
● Our project team completed construction on the Denney-to-Hall project. The team reestablished the natural flow of Fanno Creek in the northern portion of the site, replaced two undersized culverts with a pedestrian bridge, removed a berm surrounding the pond, created depressional floodplain wetlands and placed logs in the stream channel and wetland to improve habitat. Finally, they established native plant communities along the entire Denney-to-Hall reach. Metro made the project possible with a Nature in Neighborhoods grant. Clean Water Services handled the engineering, construction and revegetation.
SUMMARY
Commitment to Service and Financial SustainabilityClean Water Services demonstrates its ongoing commitment to service and financial sustainability by:
● Advancing restoration of the ecological integrity of the Tualatin River Watershed; continuing to apply principles of long-term environmental sustainability; and improving the design, construction and operation of its facilities and programs.
● Providing high-quality services at a reasonable cost to ratepayers, both now and in the future.
● Producing environmental and economic outcomes that are superior to those achievable through the application of individual state and federal laws, rules and regulations by adopting an integrated watershed-based approach.
● Continually seeking and implementing innovative and cost-effective solutions.
CLEAN WATER SERVICES • FY 2021-22 PROPOSED BUDGET PAGE 27
EPILOGUEClean Water Services has long provided cost-effective and environmentally sensitive management of sanitary sewer and surface water management services for the Tualatin River Watershed. Our vision and commitment to providing sustainable, high value water resource management services at a reasonable cost continues with this budget. During this unprecedented time, our commitment to providing reliable, cost-effective lifeline public health services to our customers is more important than ever. We thank the Board, our partners and, most of all, our ratepayers for enabling this vital work.
Diane Taniguchi-DennisChief Executive Officer


CLEAN WATER SERVICES • FY 2021-22 PROPOSED BUDGET PAGE 29
About Clean Water Services
History: District FormationClean Water Services (District), formerly Unified Sewerage Agency of Washington County, was formed February 4, 1970, as a county service district under Oregon Revised Statutes Chapter 451. It was created by popular vote with the authority to implement sewerage improvements and programs and to provide the financing of those improvements and programs. The formation of the District unified 26 wastewater treatment plants. The District began a multimillion dollar pollution control program based on the areawide wastewater

CLEAN WATER SERVICES • FY 2021-22 PROPOSED BUDGET PAGE 30
treatment Master Plan. The plan called for eliminating all treatment plants on the tributaries of the Tualatin River and limited the construction or expansion of major treatment facilities to the Tualatin River. In July 1989, the Portland Metropolitan Area Local Government Boundary Commission authorized an expansion of the District’s authority to include storm and surface water management (SWM) services. In this capacity, the District manages nonpoint source pollution, rainfall-related erosion and sedimentation, drainage and water pollution prevention. Combining science and nature, the District works in partnership with others to safeguard the river’s health and vitality, ensure the economic success of the region, and protect public health for more than 620,000 residents in urban Washington County.
The OrganizationThe District’s Board of Directors is made up of the Washington County Board of Commissioners. Although the District shares an elected Board with the county, Clean Water Services is a separately managed, financed and governed regional utility. The Board of Directors appoints a 15-member advisory body, the Clean Water Services Advisory Commission (CWAC). The purpose of CWAC is to review and discuss major policy issues and programs related to the management of water resources in the Tualatin River Watershed and make recommendations to Board of Directors. Five representatives from CWAC along with the Board of Directors constitute the District’s 10-member Budget Committee, which reviews and approves the proposed budget before it goes to the Board of Directors for adoption. The Chief Executive Officer, who is appointed by the Board of Directors, is the District’s administrator.
The Clean Water Services Advisory Commission and District staff met
virtually beginning in April 2020.

CLEAN WATER SERVICES • FY 2021-22 PROPOSED BUDGET PAGE 31
Regulatory History & Current Operating EnvironmentClean Water Services’ operations are governed by the federal Clean Water Act as administered by the U.S. Environmental Protection Agency and the Oregon Department of Environmental Quality. EPA and DEQ are empowered to develop and enforce regulatory standards for surface water resources through the United States. Federal and state permit requirements govern the operations of the District’s wastewater collection and treatment facilities and the region’s stormwater system. Due to the slow and sensitive nature of the Tualatin River, the District operates under some of the most stringent water quality standards in the nation, including a requirement that Clean Water Services provides a higher level of wastewater treatment than 98 percent of the publicly owned water resource recovery facilities in the United States.
The District’s single largest regulatory driver is the watershed-based National Pollution Discharge Elimination System (NPDES), which governs industrial and domestic stormwater and wastewater management throughout the Tualatin River Watershed. The NPDES permit is issued by DEQ on behalf of the EPA. DEQ also regulates air quality at District facilities. DEQ has established Total Maximum Daily Loads (TMDLs) and waste load allocations for the Tualatin River. The requirements of the NPDES act as the implementation mechanism for the elements of the Tualatin TMDL directly related to the activities of Clean Water Services. The 1988 Tualatin TMDLs were among the first set in the nation and were updated in 1998 and 2005.
The District is also subject to local, state and federal laws and regulations not specific to the water sector, including Oregon Occupational Safety and Health Administration, Oregon public records law financial regulations and Equal Employment Opportunity requirements. Treatment plant operators, professional engineers, attorneys and other employees with professional certifications must maintain those certifications.
The District is guided by and participates in developing industrywide policy guidance as promulgated by organizations such as the Oregon Association of Clean Water Agencies, the Pacific Northwest Clean Water Association, the National Association of Clean Water Agencies, the Water Environment Federation, the Water Research Foundation and the WateReuse Association.
Clean Water Services executes many requirements of the MS4 and NPDES permits through intergovernmental agreements with Washington County and the 12 incorporated cities within it. Agreements with local, state, federal and tribal governments drive many District programs and projects.

CLEAN WATER SERVICES • FY 2021-22 PROPOSED BUDGET PAGE 32
Economic and Demographic InformationThe District’s service area encompasses most of the developed part of the Tualatin River Watershed, an area of approximately 123 square miles. The service area includes more than 95% of Washington County’s population. Cities located within and served by the District are Banks, Beaverton, Cornelius, Durham, Forest Grove, Gaston, Hillsboro, King City, North Plains, Sherwood, Tigard, and Tualatin. The District also serves portions of Multnomah County and Clackamas County..
The economy of the District’s service area reflects the diversification of industry characteristic of the Portland metropolitan area. The county relies more heavily on the high tech industry than other counties in the metropolitan area, and is less dependent on the forest products industry than the state as a whole. Other major county economic clusters include sporting goods and apparel, manufacturing, agriculture and food processing.
The region’s population continues to grow at a modest pace. Although official population estimates are not available for special districts, Clean Water Services’ estimates the population
of its service area at approximately 620,000, based on 2020 estimates. Population growth within the District’s service area has consistently outpaced population growth within the region over the past decade, and the county is expected to add 74,000 people by 2030. Washington County per capita personal income continues to show signs of modest growth. Washington County’s per capita personal income has consistently outpaced state average and the unemployment rate remains among the lowest in the region.
$25,000 $30,000 $35,000 $40,000 $45,000 $50,000 $55,000 $60,000 $65,000 $70,000
2010 2011 2012 2013 2014 2015 2016 2017 2018 2019United States Oregon Washington County
PER CAPITA ►PERSONAL
INCOMEWashington County
income outpaces state and country
SOURCE: BUREAU OF ECONOMIC ANALYSIS

CLEAN WATER SERVICES • FY 2021-22 PROPOSED BUDGET PAGE 33
0.0%
0.5%
1.0%
1.5%
2.0%
2.5%
2012 2013 2014 2015 2016 2017 2018 2019 2020 2021
Oregon Population Change Washington County Population Change
◄ STATE AND POPULATION TRENDGrowth in Washington County outpaces growth in state
SOURCE: PORTLAND STATE UNIVERSITY POPULATION RESEARCH CENTER
2011 2012 2013 2014 2015 2016 2017 2018 2019 2020United States 8.9% 8.1% 7.4% 6.2% 5.3% 4.9% 4.4% 3.9% 3.7% 8.1%Oregon 9.5% 8.8% 7.9% 6.8% 5.6% 4.7% 4.1% 4.0% 3.7% 7.6%Washington
County 7.7% 7.1% 6.3% 5.6% 4.7% 4.1% 3.5% 3.4% 3.1% 6.5%
0.0%
1.0%
2.0%
3.0%
4.0%
5.0%
6.0%
7.0%
8.0%
9.0%
10.0%
UNEMPLOYMENTRATES▼ Washington County rates are lower than state and country
SOURCE: STATE OF OREGON EMPLOYMENT DEPARTMENT

CLEAN WATER SERVICES • FY 2021-22 PROPOSED BUDGET PAGE 34
Regional and Local ServicesSanitary sewer rates and SWM fees include a regional component to support services that benefit the entire service area and a local component. Clean Water Services provides local services in the unincorporated area of Washington County and the cities of Banks, Durham, Gaston, King City and North Plains. The seven larger cities in our service area — Beaverton, Cornelius, Forest Grove, Hillsboro, Sherwood, Tigard and Tualatin — provide all or a portion of the local component of sanitary sewer and surface water management in their jurisdictions.
Regional services include: ● Constructing, operating and maintaining all treatment plants,
sewage pump stations and pressure lines. ● Designing, constructing and maintaining large diameter
sanitary sewers (24 inches and larger). ● Master planning. ● Water supply planning. ● Pretreatment regulatory compliance and billing for industrial
customers. ● Rehabilitating manholes. ● Monitoring sanitary sewer flow. ● Managing river flow. ● Watershed restoration. ● Managing compliance reporting and oversight for the NPDES
permit. ● Constructing and maintaining regional stormwater facilities. ● Managing compliance reporting and oversight for the
Municipal Separate Storm Sewer System (MS4) permit. ● Coordinating and managing the regional inflow and
infiltration abatement program.

CLEAN WATER SERVICES • FY 2021-22 PROPOSED BUDGET PAGE 35
Local services include: ● Designing, constructing and maintaining small diameter (21-
inch and smaller) local sanitary sewer and storm and surface water system extensions and capacity upgrades.
● 24-hour emergency response. ● Cleaning and performing TV inspection of public storm and
sanitary sewer pipes. ● Cleaning catch basins and water quality manholes. ● Sweeping streets. ● Maintaining water quality facilities. ● Repairing damaged or deteriorated infrastructure and
constructing short line extensions. ● Installing catch basins and inlets. ● Enhancing stream corridors.

CLEAN WATER SERVICES • FY 2021-22 PROPOSED BUDGET PAGE 36
DISTRICT CUSTOMERS – THREE TYPESClean Water Services provides services to three types of customers: large incorporated cities, small cities and urban unincorporated areas, and industries. Rates for each type of customer have a regional component and a local component.
Large Incorporated City The District provides sanitary sewer and SWM regional services to seven cities — Beaverton, Cornelius, Forest Grove, Hillsboro, Sherwood, Tigard and Tualatin. The cities provide local services in their areas and manage their systems. The District has intergovernmental agreements with each city to govern how services are provided.
The sanitary sewer and SWM regional rate is set by the District. The local rate is set by the cities to meet local needs and may include right-of-way fees. Each city remits the regional portion of revenue to Clean Water Services.
Small City and Unincorporated AreasClean Water Services provides regional and local sanitary sewer and SWM services in the unincorporated area of Washington County and the cities of Banks, Durham, Gaston, King City and North Plains.
Clean Water Services bills these customers for sewer and SWM services. Customers also served by Tualatin Valley Water District receive a single bill that combines charges for District services along with the water charges.
IndustriesThe District bills and collects for sewer service to all industrial customers in its service area. Clean Water Services remits to each city an agreed upon percentage of the wastewater volume charge for industrial customers within that city.

CLEAN WATER SERVICES • FY 2021-22 PROPOSED BUDGET PAGE 37
DISTRICT MAP

CLEAN WATER SERVICES • FY 2021-22 PROPOSED BUDGET PAGE 38
Clean Water Services
Customers
Laboratory Services
Administration
Regulatory Affairs
35 FTE
Environmental Services
Clean Water Services Advisory
Commission
Office of the CEO
5 FTE
Biosolids, Reuse & Fernhill
Treatment Plant Services
Durham Facility
Administration
Rock Creek Facility
Forest Grove & Hillsboro Facilities
Pump Stations
Water Resource Recovery Ops
& Services123 FTE
Administration
Conveyance Engineering
Field Operations
Utility Operations & Services
93 FTE
Systems Planning
Administration
Regional Utilities Services
34 FTE
Development Services
Business Strategy & Performance
Systems
Finance & Accounting
Risk & Insurance Management
Digital Solutions
Human Resources
Business Services
79 FTE
Legal Services
Government Affairs
Communications & Community Engagement
Business Opportunities & Operations
Research & Innovation
Financial Strategy & Performance Management
Control Systems
Administration
Enterprise Asset & Technology
Services 25 FTE
Asset Management
Facilities
Technical Support
Landscape Strategies
Administration
Natural Systems Enhancement & Stewardship
29 FTE
Stewardship
Project Delivery
Board of Directors
DISTRICT ORGANIZATIONAL CHART

CLEAN WATER SERVICES • FY 2021-22 PROPOSED BUDGET PAGE 39
Strategic Planning
MISSION, VISION, PROMISE, VALUES
Our MissionWe provide cost-effective services and environmentally sensitive management of water resources for the Tualatin River Watershed.
Our VisionEnhance the environment and quality of life in the Tualatin River Watershed through visionary and collaborative management of water resources in partnership with others.

CLEAN WATER SERVICES • FY 2021-22 PROPOSED BUDGET PAGE 40
Our PromiseBeautiful clean water for today and tomorrow.
Our ValuesA Long-Range, Comprehensive, Basinwide Perspective on water resources issues, challenges and opportunities.
A Supportive, Collaborative, Team-Based Work Environment utilizing timely communication and diverse backgrounds, skills and aspirations of all Clean Water Services employees.
Active Public Awareness and Involvement in Clean Water Services affairs and regional water resources issues.
Decision-Making and Performance Management based on up-to-date, scientific and technical information.
Financially Sound, Fiscally Responsible Management maximizing value for Clean Water Services ratepayers and investors.
Our Employee Team as Clean Water Services’ greatest and most trusted resource and asset.
Protection of the Public Health and Enhancement of the Environment through the development and delivery of Clean Water Services programs and services.
Quality, Cost-Effective Customer Service supported by friendly, service-oriented personnel.
Strong, Visionary and Principle-Based Leadership providing direction and purpose in the achievement of the Clean Water Services mission.
Technical Excellence and Innovation in the management of Clean Water Services’ water resource recovery facilities.
Timely, Efficient Decision-Making at the Appropriate Level of the Organization enabling Clean Water Services to act swiftly, responsibly and effectively.

CLEAN WATER SERVICES • FY 2021-22 PROPOSED BUDGET PAGE 41
BUSINESS PLANNINGFive Key Strategic Outcomes focus and drive Clean Water Services’ (District) efforts to achieve its Vision, Mission, Promise and Values. Key Strategic Outcomes are the organization’s areas of greatest expertise; those strategically important, specialized capabilities that are central to fulfilling our mission and that provide an advantage in our region and to the people we serve. They set the overall direction for the District both for the short term and long term.
Clean Water Services Key Strategic Outcomes
Organizational Excellence: Clean Water Services is a highly effective and transformative organization that maximizes the capabilities, talent and effectiveness of our employees to provide services and products that deliver on the values of the region we serve.
Integrated Water Resource Management & Resilient Watersheds: In partnership with others, Clean Water Services creates resilient watersheds by optimizing and integrating the management of water resources for the benefit of the public and the environment.
Research, Innovation & Resource Recovery: Clean Water Services provides services and products that deliver practical and pragmatic water solutions for our region to recover resources and to optimize our operations through innovation that is shared globally.
Catalyzing Transformational Partnerships: Clean Water Services goes beyond organizational boundaries to create and sustain strategic partnerships in the region to accomplish more than any one organization can alone.
Contributing to the Region’s Environmental & Economic Vitality: Clean Water Services’ sound planning, investment and stewardship in regional assets is essential to Washington County’s continued appeal as a place to invest, live, work and play.

CLEAN WATER SERVICES • FY 2021-22 PROPOSED BUDGET PAGE 42
Performance ExcellenceClean Water Services has adopted the National Institute of Standards and Technology Performance Excellence Framework, an integrated systems approach to organizational performance. The Performance Excellence Framework focuses on people, process, planning, dialogue and implementation to help the District deliver timely, responsive service and products for our customers and stakeholders – and help deliver on the region’s values.
Under the guidance of the Business Strategy & Performance Systems program, interdisciplinary teams are developing and documenting the specific strategies that the District will implement as an organization to reach our key strategic outcomes. This process requires participants to clarify the purpose, goal and scope; to assess the current and future state; to define objectives; to consider multiple strategic perspectives; to measure, set targets and track progress; to identify initiatives; and to create action plans.
Performance MeasurementThe District’s pay delivery system for employees consists of two elements: performance-based pay and Goal Sharing. This system has been extensively reevaluated to refine and improve the overall programs to better connect employee compensation to measurable business results.
The pay-for-performance program is focused on the individual level and is administered through the evaluation process with employees. This also improves the competitiveness of the District’s salary structure. No automatic pay increases are built into the system.
The District’s Goal Sharing program has been very successful in promoting cost savings and service enhancements by encouraging both practical and innovative employee approaches and solutions to improve delivery of priority services to ratepayers. This gGoal sSharing program provides a critical linkage between employees’ achievement of meeting targets, working together and the related financial compensation. This will help continue the trend of increasing employee productivity.
In addition to these performance measurement systems, the District tracks and reports on a wide array of other performance indicators for regulatory and operational purposes.

CLEAN WATER SERVICES • FY 2021-22 PROPOSED BUDGET PAGE 43
Financial Policies
Following are summaries of Clean Water Services’ (District’s) financial policies.
Accounting, Auditing and Financial Reporting ● The District will maintain its accounting records and
report on its financial condition and results of operations in accordance with Generally Accepted Accounting Principles (GAAP), as promulgated by the Governmental Accounting Standards Board.
● The District will have an independent financial and compliance audit performed annually in accordance with generally accepted auditing standards and Oregon Revised Statutes.
● The District will publish an audited Annual Financial Report each year.
Budgeting, Financial Planning and Forecasting ● The District will balance budgeted resources with budgeted
requirements within each fund to produce a balanced budget per Oregon Administrative Rules 150-294.388(1).
● The District will legally adopt its budget at the fund level with appropriations adopted in the categories of operating expenses, debt service, capital outlay, contingency and operating transfers for each fund, except the General Fund, which will have appropriations adopted by organizational unit. Appropriations will lapse at the end of the fiscal year.
● The District will maintain a budgetary system to monitor and report on actual revenues and expenditures in comparison
CLEAN WATER SERVICES • FY 2021-22 PROPOSED BUDGET PAGE 44
to budgeted amounts to ensure appropriate budgetary compliance.
● The District will include its Goal Sharing objectives, measures and targets as well as other measures of performance in its published adopted budget.
● The District will appropriate a minimum contingency of 10% of total budgeted expenditures in the General Fund and 5% of total expenditures for all other District operating and construction funds, within each individual fund.
● Strategic utility rate stabilization planning will be facilitated through sustainable budget contingency and carryover balance levels in the General Fund and the Surface Water Management Operating Fund. This approach will help promote reasonable and predictable rate adjustments, supported by multiyear rate forecasting.
● The District will maintain reasonable resources for the Capital Improvement Program (CIP) and Capital Outlay, working capital, and prudent risk management.
● The District will annually prepare a multiyear financial forecast of major revenues, expenditures and other financing sources and uses for the District.
Capital Improvement Program and Budget ● The District will plan for capital improvements over multiple
years. The CIP will directly relate to the Master Plan, departmental operation plans and other long-range plans.
● The District will annually prepare a multiyear CIP to identify and plan for anticipated capital projects and estimated costs and to identify estimated significant impacts on the operating budget.
● The District will reasonably maintain its capital assets at a level sufficient to protect the District’s capital investment and to mitigate future maintenance and replacement costs. The budget will provide for adequate maintenance and orderly replacement of capital assets, as resources allow.
● The District will define as CIP capital assets any asset acquired, constructed, financed, modified or replaced by the District with a total cost of $50,000 or more and a useful life of five years or more, in accordance with GAAP. Expenditures between $5,000 and $50,000 that result in the creation of a capital asset or extend the useful life of an existing capital asset for at least five years shall be classified

CLEAN WATER SERVICES • FY 2021-22 PROPOSED BUDGET PAGE 45
as capital outlay within the operating budget. ● The District will include CIP projects and their estimated
costs within the operating budget for the period covered by the operating budget for approval by the District’s Budget Committee and adoption by the District’s Board of Directors (Board).
Debt Management ● The District will issue long-term debt in accordance with
all applicable federal, state and local laws and regulations, as well as District resolutions and orders, for appropriate purposes.
● The District will adhere to full disclosure of financial and pertinent credit information as it relates to the District’s outstanding securities and comply with applicable continuing disclosure requirements.
● The District will strive to maintain credit ratings of A or higher to ensure that borrowing costs are minimized and the District’s access to credit is assured.
● The District will comply with all requirements associated with revenue bonds, including, but not limited to, debt service reserve requirements and debt service coverage ratios.

CLEAN WATER SERVICES • FY 2021-22 PROPOSED BUDGET PAGE 46
● The District will use a competitive bidding process in the sale of bonds unless the Board authorizes a negotiated sale process that is expected to produce more favorable results for the District.
Investments ● The District’s cash and investments will be received,
safeguarded, invested and disbursed by the Washington County treasurer on behalf of the District for District purposes, in accordance with Oregon Revised Statutes.
● The District will monitor the activities of the Washington County treasurer regarding District cash and investments held by the County to ensure that liquidity and working capital needs are met and that investments are in compliance with Washington County’s investment policy.
Revenue ● The District will maintain sanitary sewer and surface water
management rates at levels that are deemed appropriate by the Board to finance costs associated with regulatory requirements, needed program enhancements, maintenance of a competitive workforce, maintenance or replacement of capital assets, debt service related requirements, and to avoid or mitigate rate spikes.
● The District will follow an assertive policy of collecting revenues determined to be due to the District.

CLEAN WATER SERVICES • FY 2021-22 PROPOSED BUDGET PAGE 47
Budget Process
Clean Water Services (District) follows a budget process that is consistent with Oregon Local Budget Law requirements. These requirements are designed to accomplish two important results:
● Utilize standard procedures for preparing, presenting and administering the budget.
● Enhance citizen involvement in the budget process and public exposure to the budget before formal adoption.
The four phases of the budget process include:
Requested ● The initial in-house development of the structure, levels of
appropriation, and revenue and expenditure estimates. New and revised program approaches are developed and reviewed by staff at this time.
● These requests are then reviewed at the department level and a recommendation sent to the District’s Business Partners for collaborative review. All District managers participate in relevant portions of this review and discussions.
● Operating and capital budgets are reviewed against previously developed evaluation criteria and District priorities. No budget increases are approved if they can be met by operating more efficiently or reallocating resources.
Proposed ● The proposed budget is prepared under the direction of the
Budget Officer, using the results from the District’s internal review process, and presented to the Budget Committee in a public meeting.

CLEAN WATER SERVICES • FY 2021-22 PROPOSED BUDGET PAGE 48
Approved ● In the public meeting, the Budget Committee receives
the budget document, receives public comment and has the opportunity to amend and/or approve the budget as proposed. The budget is in the approved stage if approved as presented or after incorporating any changes requested by the Committee.
Adopted ● In a public hearing, the District’s Board of Directors (Board)
calls for comments from interested parties on the budget and may make revisions in response to those comments. After the public hearing, the Board adopts the budget, formalizing the appropriations for the coming fiscal year.
An increase in appropriations outside the above process requires a supplemental budget, which involves many of the same procedures for notification and public hearings as the adoption of the annual budget. Transfers from the contingency appropriations may be made with Board authorization.
BUDGET PROCESS CALENDARThe budget process calendar identifies timing and opportunities for public input while moving toward the actual adoption of appropriations for the coming fiscal year.
The outline below illustrates in general terms the process used to arrive at an adopted budget.
October Through January ● Develop individual program budgets using budget software
program. ● Develop draft Capital Improvement Program using an
electronic database.
February and MarchRequested
● Meet with District staff and management to develop current fiscal year expenditures and review initial budget requests as prepared by division and department leaders.
● Chief Financial Officer and staff develop revenue projections for upcoming fiscal year and conduct rate analysis based on anticipated fund balances and revenues.

CLEAN WATER SERVICES • FY 2021-22 PROPOSED BUDGET PAGE 49
April and MayProposed
● Prepare proposed budget for publication. ● Mid-April: Publish required public notice in a newspaper of
general circulation to announce when the proposed budget will be available for viewing, as well as the date and purpose of the Budget Committee meeting. Post the notice on the District’s website per ORS 294.426(5).
● Publish proposed budget document.
Approved ● Early May: Hold Budget Committee meeting to review and
revise the proposed budget. Receive and address public comments. When approved, the budget moves to the Board for adoption.
May and JuneAdopted
● Publish notice in newspaper of general circulation that a public hearing will be held to review the budget. (Notice includes schedule of appropriations, meeting time and place.)
● Mid-June: Board of Directors holds public hearing(s) before July 1, the beginning of the fiscal year, to receive public comment and adopt the budget. At this time, Board also adopts Resolution and Orders setting rates and charges and adopting the Capital Improvement Program.
Accounting StructureThe District reports costs in two separate enterprise funds for sanitary sewer and storm water operations. For financial reporting purposes, financial statements are presented on a full accrual basis of accounting. In this method, revenues are recorded when they are earned and expenses are recorded at the time liabilities are incurred regardless of the timing of related cash inflows and outflows.
The District’s budget is prepared using the modified accrual basis of accounting. Under modified accrual basis of accounting, revenues are recognized as soon as they are both measureable and available. Measureable means the amount of the transaction can be determined and revenues are considered available when they are collected within the current period or expected to be collected soon enough thereafter to be used to pay liabilities of the current period. For this purpose, revenues are considered available if they are collected within 60 days of the end of the current fiscal period.

CLEAN WATER SERVICES • FY 2021-22 PROPOSED BUDGET PAGE 50
For legal requirements set forth in Oregon Local Budget Law, the District is required to prepare and adopt a budget by individual funds. Accounting records are maintained on a governmental fund accounting basis. The resolution authorizing appropriations is adopted by fund each year by organizational unit or in the categories of personnel services, materials and services, debt service, capital outlay, contingency and operating transfers.
The District’s budget and financial tracking systems are based on a hierarchy of accounts which start at the Fund level and continue down to specific Projects. Line items are simply the individual expenditure and revenue categories which are tracked during the year (e.g., electricity, salaries, service charges).
For the Operating Funds, it looks like this: ● Fund
● Department/Division ● Division/Program
● Project (as needed)
The other funds rely on Projects and Line Items to identify budget appropriations dedicated to specific purposes.
The fund accounting structure table page 95 shows the organization of the various funds within the Operating, Construction, Reserve or Debt fund types. Each tab identifies the budget components included in that section of the document. A listing of the general fund program codes and the chart of accounts are provided in this document.

CLEAN WATER SERVICES • FY 2021-22 PROPOSED BUDGET PAGE 51
Budget Overview
SummaryTotal Clean Water Services (District) revenues are budgeted to increase by $5.7 million, or 3.1%, over FY 2020-21’s revised budget. Total District expenditures, including operating and capital expenditures, debt service and other fund outlays are budgeted to increase by $9.8 million, or 4.9%, due primarily to increases in the Capital Improvement Program (CIP) and increased departmental expenditures. Combined beginning fund balances are estimated to increase by just under $10.1 million, or 3.3%, as a result of intentionally reduced capital project expenditures as well as sequencing of filling vacant positions. The District continues to be in excellent financial condition, as indicated by its credit ratings of AAA from Standard & Poor’s and Aa1 by Moody’s Investors Service.
Revenue HighlightsThe primary ongoing revenue drivers are service charges for sanitary sewer and surface water management (SWM), as well as System Development Charges (SDCs) for sanitary sewer and surface water. Together these revenue sources make up approximately 93% of estimated ongoing revenues for FY 2021-22. Service charges are projected to increase by $9.8 million, or 6.1%, reflecting the effects of a proposed rate increase as well as customer growth. SDCs are projected to decrease by $2.4 million, or 13.4%, based on FY 2020-21 year to date and projections related to the effects of COVID-19 on the economy.
Other sources of operating and nonoperating revenue are interest earnings, grants, contributions, other assessments and miscellaneous fees. These other sources of revenue make up approximately 7% of

CLEAN WATER SERVICES • FY 2021-22 PROPOSED BUDGET PAGE 52
estimated revenues for FY 2021-22. These revenues are anticipated to decrease by approximately $0.9 million in FY 2021-22.
Expenditure HighlightsTotal departmental expenditures are budgeted to increase by just under $4.1 million, or 4.8%. Expenditures for personnel services, materials and services, capital investment, debt service, and other fund level outlays are discussed in greater detail below.
Personnel Services (Labor)Total personnel services are budgeted to increase by just over $2.3 million, or 4.3%, from the FY 2020-21 revised budget. The primary drivers of this increase are the 17 proposed full time equivalent positions in the coming fiscal year; 12 are conversions of temporary positions where the work load has proven sustained and long-term. Staff will prioritize and sequence hiring for all current vacancies and new positions. The new positions are described in detail in the departmental summaries beginning on page 119.
Materials and ServicesDepartmental materials and services are budgeted to increase by just under $1.8 million, or 5.7%, compared to last year’s revised budget. Increasing property insurance costs, the addition of cyber insurance and growing software license needs are the primary drivers of this change.
Capital InvestmentThe District is budgeting an estimated $89.2 million in sanitary sewer system improvements and $4.4 million in surface water management system improvements in FY 2021-22. These investments are planned to increase system capacity, meet regulatory requirements for water quality, watershed health, and to prepare for current and future growth. All the projects scheduled for implementation in this budget have been vetted against previously adopted sanitary and surface water management facilities/master plans.
Debt ServiceDebt service remains flat in comparison to the FY 2021-22 budget.
Other Fund Level OutlaysThis expenditure type includes utility bad debt expense, franchise fees, pass-through revenues to cities, self-insurance claims costs, and other miscellaneous nondepartmental outlays. This category is budgeted to decrease by $0.1 million as compared to the prior year.

CLEAN WATER SERVICES • FY 2021-22 PROPOSED BUDGET PAGE 53
In the current fiscal year, other fund outlays includes $3.5 million for pass-through revenues to co-implementer cities, $0.9 million for self-insurance claims, $0.7 million for utility bad debts, $0.4 million for right of way fees paid to cities and $0.2 million for franchise fees. Additional costs budgeted in the current year include $0.45 million designated for assistance programs.
Fund BalancesBeginning fund balances are anticipated to increase by approximately $10.1 million, or 3.3%, over the current budget year primarily due to the reduction in planned capital spending in FY 2020-21 as well as the intentional sequencing of hiring vacant positions.
Budget Overview – All Funds SummaryThe chart below shows the District’s all fund information at a summary level, which is presented on the following page in more detail.
$-
$50
$100
$150
$200
$250
$300
$350
FY19Actual
FY20Actual
FY21Revised Budget
FY22Proposed Budget
in m
illio
ns
Combined Beginning Fund BalancesTotal Operating & Nonoperating RevenuesTotal ExpendituresEnding Fund Balance & Contingency
◄ALLFUNDSSUMMARYTotal revenues are projected to increase by 3.1% and total expenditures are budgeted to increase by 4.9% in the FY 2021-22 proposed budget
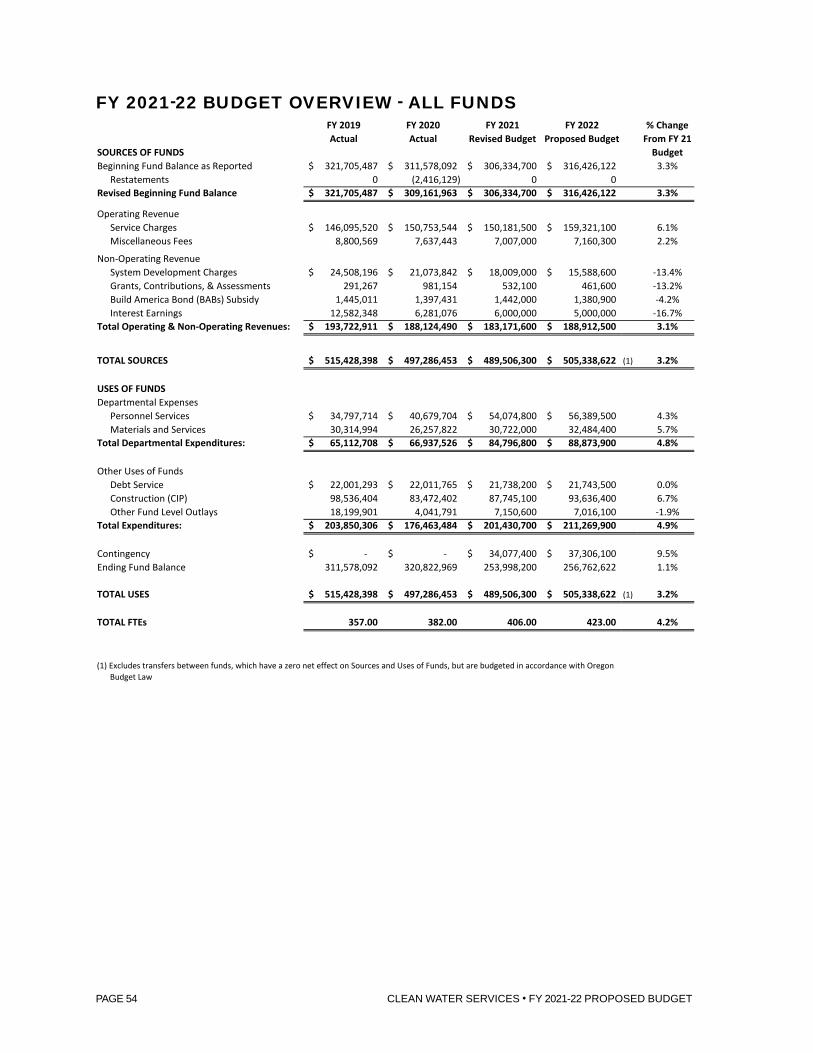
CLEAN WATER SERVICES • FY 2021-22 PROPOSED BUDGET PAGE 54
FY 2021-22 BUDGET OVERVIEW - ALL FUNDSFY 2019 FY 2020 FY 2021 FY 2022 % ChangeActual Actual Revised Budget Proposed Budget From FY 21
SOURCES OF FUNDS BudgetBeginning Fund Balance as Reported 321,705,487$ 311,578,092$ 306,334,700$ 316,426,122$ 3.3%
Restatements 0 (2,416,129) 0 0Revised Beginning Fund Balance 321,705,487$ 309,161,963$ 306,334,700$ 316,426,122$ 3.3%
Operating RevenueService Charges 146,095,520$ 150,753,544$ 150,181,500$ 159,321,100$ 6.1%Miscellaneous Fees 8,800,569 7,637,443 7,007,000 7,160,300 2.2%
Non-Operating RevenueSystem Development Charges 24,508,196$ 21,073,842$ 18,009,000$ 15,588,600$ -13.4%Grants, Contributions, & Assessments 291,267 981,154 532,100 461,600 -13.2%Build America Bond (BABs) Subsidy 1,445,011 1,397,431 1,442,000 1,380,900 -4.2%Interest Earnings 12,582,348 6,281,076 6,000,000 5,000,000 -16.7%
Total Operating & Non-Operating Revenues: 193,722,911$ 188,124,490$ 183,171,600$ 188,912,500$ 3.1%
TOTAL SOURCES 515,428,398$ 497,286,453$ 489,506,300$ 505,338,622$ (1) 3.2%
USES OF FUNDSDepartmental Expenses
Personnel Services 34,797,714$ 40,679,704$ 54,074,800$ 56,389,500$ 4.3%Materials and Services 30,314,994 26,257,822 30,722,000 32,484,400 5.7%
Total Departmental Expenditures: 65,112,708$ 66,937,526$ 84,796,800$ 88,873,900$ 4.8%
Other Uses of FundsDebt Service 22,001,293$ 22,011,765$ 21,738,200$ 21,743,500$ 0.0%Construction (CIP) 98,536,404 83,472,402 87,745,100 93,636,400 6.7%Other Fund Level Outlays 18,199,901 4,041,791 7,150,600 7,016,100 -1.9%
Total Expenditures: 203,850,306$ 176,463,484$ 201,430,700$ 211,269,900$ 4.9%
Contingency -$ -$ 34,077,400$ 37,306,100$ 9.5%Ending Fund Balance 311,578,092 320,822,969 253,998,200 256,762,622 1.1%
TOTAL USES 515,428,398$ 497,286,453$ 489,506,300$ 505,338,622$ (1) 3.2%
TOTAL FTEs 357.00 382.00 406.00 423.00 4.2%
(1) Excludes transfers between funds, which have a zero net effect on Sources and Uses of Funds, but are budgeted in accordance with Oregon Budget Law
FY 2021-22 BUDGET OVERVIEW - ALL FUNDS
U:\Finance\BUDGET\2022 Budget\Budget Document\Budget Overview All Funds FY22.xlsx
CLEAN WATER SERVICES • FY 2021-22 PROPOSED BUDGET PAGE 55
Budget Sources & Uses
SOURCES OF DISTRICT FUNDS
Recent Fiscal TrendsKey sources of funds for Clean Water Services (District) include sanitary sewer revenues, surface water management service revenues and System Development Charges (SDCs). In developing financial plans, staff reviews local economic data as well as the history of these key revenues to identify trends that might be useful in formulating assumptions for the current year budget and for financial forecasts over the next five years. Below are brief historical discussions of the key sources of funds, followed by a more detailed discussion of Fiscal Year (FY) 2021-22 sources of District funds. In most cases, the comparative data used is as of FY 2019-20 as audited. The FY 2020-21 information is estimated.
Service RevenueThe sanitary sewer revenues, which represent service charges assessed of city and unincorporated area customers, represent the single largest source of operating revenues for the District. In FY 2019-20, they amounted to $131.5 million. The surface water management (SWM) revenues, which represent a flat fee assessed on any District customer who uses or discharges stormwater to the public storm and surface water systems, amounted to just under $16.9 million in FY 2019-20.

CLEAN WATER SERVICES • FY 2021-22 PROPOSED BUDGET PAGE 56
The District increased sanitary sewer rates by 3.0% every year from FY 2014-15 through FY 2019-20. SWM rates remained constant at $4/month/Equivalent Service Unit (ESU) through FY 2008-09. They increased $0.25 per ESU in FY 2009-10 and $0.50 per ESU each year from FY 2012-13 through FY 2019-20. In FY 2020-21 the District did not increase rates due to the financial stress many households and businesses felt from the COVID-19 pandemic.
The District follows the Environmental Protection Agency’s (EPA) criteria for reasonable rates to monitor the combined sanitary sewer and surface water management average annual rate as a percentage of median household income. The EPA criteria is based on a median household income affordability index, which states if the sanitary sewer rate is less than 1% of median household income it is considered to be a low burden to the ratepayer while greater than 2% is considered a medium burden. The following chart reflects the District’s rate as a percentage of Washington County’s median household income for the past 10 years.
SERVICE ►REVENUE
For sanitary and stormwater
management
FY 2017 FY 2018 FY 2019 FY 2020 Est FY 2021Sanitary Sewer
Revenue $115.95 $122.59 $127.89 $131.54 $134.10
SWM Revenue $13.75 $14.65 $15.75 $16.88 $17.04
$0
$20
$40
$60
$80
$100
$120
$140
$160
in m
illio
ns

CLEAN WATER SERVICES • FY 2021-22 PROPOSED BUDGET PAGE 57
The District’s rates have been less than 1% of the county’s median household income during this time frame. This indicator is well within the EPA’s 2% criteria for affordability, but the lowest quintile of county households trends closer to 3%.
Population and economic trends are also used in estimating future revenues. Sanitary sewer revenues are largely affected by land and housing development stemming from population growth. As shown in the following table, the county’s population has increased by approximately 15% since 2012, and state economists expect that trend to continue in Washington County over the next 10 years.
◄DISTRICT RATES As percentage of Washington County median household income for past 10 years
SOURCE: U.S. CENSUS BUREAU
$-
$10,000
$20,000
$30,000
$40,000
$50,000
$60,000
$70,000
$80,000
$90,000
$100,000
0.0%
0.5%
1.0%
1.5%
2.0%
2.5%
3.0%
3.5%
2010 2011 2012 2013 2014 2015 2016 2017 2018 2019
Washington County Median Household Income
EPA Wastewater Affordability Index
District Combined Rate as % of Median Household Income
District Combined Rate as % of Lowest Quintile Household Income
◄ WASHINGTON COUNTY DEMOGRAPHIC STATISTICS FOR PAST 10 YEARSAs of April 9, 2021
YearPopulation (estimated)
Personal Income (in thousands)
Per Capita Income
Unemployment Rate
2021 620,080 n/a n/a 5.6%2020 613,410 n/a n/a 6.5%2019 606,280 38,527,576$ 64,043$ 3.1%2018 595,860 36,978,789$ 61,951$ 3.4%2017 583,595 34,429,415$ 58,223$ 3.5%2016 570,510 32,195,324$ 55,043$ 4.1%2015 560,465 30,877,272$ 53,899$ 4.7%2014 550,990 28,446,967$ 50,569$ 5.6%2013 542,845 25,969,097$ 46,757$ 6.3%2012 536,370 25,788,385$ 47,008$ 7.1%
Last Ten YearsDemographic Statistics
Washington County, Oregon

CLEAN WATER SERVICES • FY 2021-22 PROPOSED BUDGET PAGE 58
The largest threat to sanitary sewer revenues would be a slowdown in the region’s economy and subsequent residential housing occupancy. The last economic slowdown did not significantly impact service revenues received from existing residences. Population growth and retainage remain strong in Washington County. The District will continue to monitor economic conditions and revenues received as a result of the COVID-19 pandemic and adjust projected expenses accordingly. Over a longer term, reserve funds could be used to maintain service levels as needed and programs would be evaluated for efficacy based on the changes in demand. As the chart below indicates, the 10 largest ratepayers account for 10.56% of the District’s FY 2019-20 rate income. This indicates that the business risk of any single customer having a significant direct impact on revenue projections is relatively small.
Customer Amount %Intel Corporation - Ronler Acres 8,574,450$ 6.70%Intel Corporation - Aloha Campus 873,902 0.68%Pacific Foods of Oregon 825,246 0.65%Jireh Semiconductor, Inc. 726,141 0.57%Maxim Integrated Products 723,234 0.57%Resers Fine Foods - Jenkins Road 700,697 0.55%Providence Health Systems - St. Vincent 405,889 0.32%Heritage Village Mobile Home Park 260,157 0.20%TTM Technologies North America, LLC 223,152 0.17%Nike Inc. 190,687 0.15%
SUBTOTAL (10 largest ratepayers) 13,503,555 10.56%
Balance from other customers 114,386,797 89.44%
Grand Total 127,890,352$ 100.00%
Fiscal Year 2020
Ten Largest Individual Ratepayers10 LARGEST ►INDIVIDUAL
RATEPAYERS

CLEAN WATER SERVICES • FY 2021-22 PROPOSED BUDGET PAGE 59
System Development Charges The second largest source of revenue is SDCs, one-time assessments charged when customers connect to the District’s system. These revenues totaled just under $21.1 million in FY 2019-20.
As evidenced by large swings from one year to the next, SDC revenues are not predictable and can be influenced by a few major developments, particularly development by large multifamily, commercial or industrial customers.
FY 2021-22 Sources of FundsOn a current year basis, resources for Clean Water Services to provide services and carry out other responsibilities are derived primarily from beginning fund balances and current operating and nonoperating revenues. The beginning fund balance consists of
◄SYSTEM DEVELOPMENT CHARGESIn millions
$-
$5,000,000
$10,000,000
$15,000,000
$20,000,000
$25,000,000
$30,000,000
$35,000,000
FY2006
FY2007
FY2008
FY2009
FY2010
FY2011
FY2012
FY2013
FY2014
FY2015
FY2016
FY2017
FY2018
FY2019
FY2020
Service Charges$159,321,100
SDCs$15,588,600
Misc Fees & Grants$7,621,900
Build America Bond Subsidy
$1,380,900
Interest Earnings$5,000,000
Operating Fund Balances
$173,398,930
Construction Fund Balances
$78,252,924
Reserve Fund Balances$43,641,400
Debt Services Fund Balances$21,132,868
◄SOURCES OF FUNDSFY 2021-22
CLEAN WATER SERVICES • FY 2021-22 PROPOSED BUDGET PAGE 60
estimated balances carried forward from previous fiscal years and the required bond reserve amounts. Current revenues are those earned during the fiscal year from the District’s operations, such as service charges, or received from other sources, such as SDCs, interest earnings, various fees and project reimbursements.
Current RevenuesCurrent revenues or resources the District earns during the year account for $188.9 million, or about 37% of total resources expected in FY 2021-22. The principal sources of current revenues are sanitary sewer and SWM charges, which are labeled Service Charges in the pie chart. These two sources account for $159.3 million, or 84.3% of the District’s total current revenues. The other major sources are SDCs, grants, contributions and assessments, Build America Bond subsidy and interest earnings.
Service ChargesBased on trend analysis, sanitary sewer service charges are estimated at $141.2 million and SWM charges are estimated at $18.1 million. A 4.5% sanitary sewer rate increase and a SWM increase of $0.50 (5.4%) are built into the revenue estimates along with a modest growth factor. These sanitary sewer and SWM rate increases will add an estimated $2.57 per month to the typical residential customer’s combined bill.
System Development ChargesThe second largest source of current revenues, SDCs, amounts to just over $15.5 million, or 8.3% of total current revenues.
The sanitary sewer SDC is designed to recognize the cost of growth and consists of an assessment for the share of costs related to new capacity and performance improvements, as well as an assessment to share cost burdens with existing customers for collection and treatment systems already built. District customers are assessed this one-time SDC upon connection to the sanitary sewer system.
This budget reflects a proposed increase in the sanitary sewer SDC to $6,085 for FY 2021-22, which is a $285 increase from FY 2020-21.
The surface water management SDC is a one-time charge designed to recover the cost of surface water management improvements. The SWM SDC will increase from $560 to $585 per Equivalent Service Unit.
Revenues from both SDCs are dedicated to capital projects and payment of bonded debt service, per Oregon Revised Statutes (ORS 223.302).

CLEAN WATER SERVICES • FY 2021-22 PROPOSED BUDGET PAGE 61
Miscellaneous Fees, Grants and Other RevenuesThe remaining current revenues are composed of grants, contributions and assessments, Build America Bond subsidy, interest earnings and miscellaneous fees accounting for approximately $14.0 million or 7.4% of total current revenues.
Combined Beginning Fund BalancesThe beginning fund balances for all funds combined consist of unused revenues carried forward from prior fiscal years. In FY 2021-22, these combined balances account for just over $316.4 million, or 62.6% of the total $505.3 million in budgeted District resources. Approximately $7.6 million of this fund balance is held in reserve pursuant to debt service requirements, just under $25.3 million is held in reserve in SDC capital reserve funds, and the remaining $280.1 million is working capital.
USES OF DISTRICT FUNDS
Recent Fiscal TrendsDue to substantial infrastructure needs, capital improvements remain one of the District’s largest expenditures. In developing financial plans, staff reviews historical spending trends and anticipated capital needs in the Capital Improvement Program (CIP) to formulate assumptions for the current year budget and financial forecasts over the next five years. Below are brief descriptions of key expenditure categories, followed by more detailed discussions of FY 2021-22 uses of District funds.

CLEAN WATER SERVICES • FY 2021-22 PROPOSED BUDGET PAGE 62
Capital ExpendituresThe District allocates a large portion of its budget to capital improvements that are needed to meet water quality standards and satisfy the sanitary sewer and surface water management needs of a growing customer base. The routine replacement of vehicles, heavy equipment, information systems, and wastewater treatment and conveyance equipment, is also included in capital expenditures. In FY 2019-20, the District spent about $83.5 million, or 47.3% of total current expenditures, on capital improvements.
Operating ExpenseAnother significant expenditure type for Clean Water Services is operating expense. The biggest portion of operating expense is for personnel services, which includes salaries and fringe benefits. In FY 2019-20, the District spent $66.9 million, or 37.9% of total current expenditures, on operating expense.
Over the five-year period from FY 2016-17 through FY 2020-21, operating expense has grown an average of 5% annually. The biggest drivers of cost increases have been rising utility and chemical costs, along with the increasing cost of wages and benefits for personnel. During this period, the District added 68 full-time equivalent (FTE), which contributed to the increasing personnel costs.
FY 2017 FY 2018 FY 2019 FY 2020 Est.FY 2021
CapitalExpenditures $55.4 $57.9 $98.5 $83.5 $74.1
$-
$20
$40
$60
$80
$100
$120
in m
illio
ns
CAPITAL ►EXPENDITURESDistrict spending
is projected to decrease in
FY 2020-21 from the previous year

CLEAN WATER SERVICES • FY 2021-22 PROPOSED BUDGET PAGE 63
Combined Ending Fund BalancesThe ending fund balance for all funds combined includes unrestricted operating cash reserves for sanitary sewer and stormwater operations, capital construction reserves, pension liability reserves, self-insurance reserves, and restricted reserves for debt service and sanitary sewer and stormwater SDCs for capacity enhancing improvements to the systems.
The District uses unrestricted operating cash reserves to finance capital improvements, maintain existing systems, and provide reserves for working capital needs.
The restricted reserves can only be used to fund capital construction or debt service payments. These funds are not available to meet daily operating cash needs.
FY 2017 FY 2018 FY 2019 FY 2020 Est FY 2021OperatingExpense $59.3 $62.8 $65.1 $66.9 $73.0
$0
$20
$40
$60
$80
in m
illion
s
◄ OPERATING EXPENSES Utility and chemical costs contibute to cost increases
$-
$50,000,000
$100,000,000
$150,000,000
$200,000,000
$250,000,000
$300,000,000
$350,000,000
FY 2017 FY 2018 FY 2019 FY 2020
◄ COMBINED ENDING FUND BALANCES

CLEAN WATER SERVICES • FY 2021-22 PROPOSED BUDGET PAGE 64
Capital Construction$93,636,400
Operating Expenses$88,873,900
Debt Service$21,743,500
Other Fund Level Outlays$7,016,100Contingency
$37,306,100
Operating Fund Balances
$147,962,530
Construction Fund Balances
$56,573,124
Reserve Fund Balances$33,395,400
Debt Service Fund Balances$18,831,568
USES OF ► FUNDS
FY 2021-22
FY 2021-22 Uses of FundsClean Water Services uses resources to provide sanitary sewer and surface water management services to its customers. Ending fund balances are resources that are not spent during the year but are carried over to subsequent years.
Current ExpendituresCurrent expenditures are funds that are budgeted for the 2021-22 fiscal year including, among others, payments to construction contractors, wages and benefits to employees and principal and interest on borrowed monies. Current expenditures estimated for FY 2021-22 amount to approximately $211.3 million. The major categories of current expenditures are described below.
Capital Outlay and ProjectsOne of the largest expenditures is for capital projects, which amounts to $93.6 million or 44.3% of current expenditures.
Clean Water Services allocates a large portion of its budget to capital improvements needed to meet water quality and quantity standards and to satisfy the sanitary sewer and surface water management needs of a growing customer base. Brief descriptions of major capital projects are presented in the Capital Projects Overview section beginning on page 81. The index listing all projects is included in the appendix.

CLEAN WATER SERVICES • FY 2021-22 PROPOSED BUDGET PAGE 65
Debt ServiceDebt service for construction of the District’s facilities and other capital improvements as well as pension obligations is expected to amount to $21.7 million in FY 2021-22, or 10.3% of total current expenditures. Debt service represents the repayment of principal and interest costs on bonds issued to finance construction projects and other major capital assets and cover pension liability costs. Borrowing allows the District to spread the costs of a capital project over the life of the asset and thereby avoid sharp increases in rates.
Personnel ServicesThe District expects to spend $56.4 million in FY 2021-22 on salaries and associated fringe benefits for its employees. Total personnel services costs represent about 26.7% of total current expenditures. The number of FTE positions is increasing by 17 FTE from the FY 2020-21 revised budget of 406 FTE to 423 FTE. Twelve of the new FTEs are conversions of temporary positions where the work load has proven sustained and long-term. Staff will prioritize and sequence hiring for all current vacancies and new positions. The following graph indicates the staffing trends over the past five years.
51 50 62 72 84- - - -25
21 22 23 24 29
- - - -
34
34 35 35 33
35118 121 126 130
93127 129
136 147 123
-
50
100
150
200
250
300
350
400
450
FY 2018Actual
FY 2019Actual
FY 2020Actual
FY 2021Revised
FY 2022Proposed
Business Services Enterprise Asset & Technical ServicesNatural Systems Enhancement & Stewardship Regional Utilities ServicesRegulatory Affairs Utility Operations & ServicesWater Resource Recovery
351 357 382
423 406 ◄ DISTRICT FTE COUNTSFY 2017-18 through FY 2021-22

CLEAN WATER SERVICES • FY 2021-22 PROPOSED BUDGET PAGE 66
Materials and ServicesThe District expects to spend $32.5 million on departmental materials and services in FY 2021-22. This represents approximately 15.4% of total current expenditures. The single largest cost in this category is for chemicals, which account for about $4.1 million or 12.7% of total materials and services. The second largest materials and services costs are other government services at just over $3.8 million and contracted services at just under $3.8 million.
Combined Ending Fund Balances and ContingenciesAt the close of the fiscal year, funds remaining constitute the ending fund balance. The ending fund balance is estimated for FY 2021-22 at just under $294.1 million, including $37.3 million that the District will set aside in fiscal 2021-22 for operating contingency in the event of significant unexpected or unforeseen costs. Clean Water Services maintains minimum contingencies at 10% of total budgeted expenditures in the General Fund and 5% of total expenditures in each of the District operating and construction funds.
The unappropriated ending fund balance also includes restricted funds of approximately $7.6 million for future debt principal and interest payments and $19.9 million for sanitary sewer and SWM System Development Charges restricted for use on capacity enhancing projects.
The District maintains additional reserves of approximately $229.3 million:
● To absorb short-term revenue losses from fluctuations in demand for service or loss of significant customers.
● Allocations for short-term and long-term PERS cost stabilization.
● Saving for large capital investments to stabilize future impact on rates.
● To pay for unexpected and extraordinary operating expenses driven by unforeseen changes in regulations, major asset replacements, additional major infrastructure investments to meet capacity needs, unexpected fluctuations in commodities pricing (chemicals, fuel, electricity, insurance premiums), and emergency response to infrastructure damage caused by natural disasters.

CLEAN WATER SERVICES • FY 2021-22 PROPOSED BUDGET PAGE 67
DEPARTMENTAL SUMMARIESExpenditures for the seven District departments are budgeted to increase by 4.8% in FY 2021-22.
The District has been working to realign its people, resources and programs to better position the organization to deliver on key strategic outcomes and respond to future challenges and opportunities. In FY 2020-21 the District created three new leadership positions — Chief Operating Officer, Chief of Staff and Chief Utility Relations Officer — and shifted programmatic portfolios to continue to build the capacity and capability of the Clean Water Services team. The District also created two new service-driven departments.
A detailed summary of positions by department and program is available on page 75. Summaries of these costs as well as any significant changes within departments are detailed on the next pages.
Business Services
$22,916,600 26%
Enterprise Asset & Technical Services
$5,743,000 6%
Regional Utilities Services$5,746,600
6%Regulatory
Affairs$7,308,600
8%
Natural Systems
Enhancement$7,001,400
8%
Utility Operations & Services
$13,030,100 15%
Water Resource Recovery
$27,127,600 31%
◄DEPARTMENTAL EXPENSES FY 2021-22

CLEAN WATER SERVICES • FY 2021-22 PROPOSED BUDGET PAGE 68
Change fromFY 2019 FY 2020 FY 2021 FY 2022 FY 2021
Expenditure Summary ACTUAL ACTUAL REVISED BUDGET PROPOSED BudgetDepartmental Expenses
Personnel Services 7,465,285$ 8,582,349$ 12,286,000$ 14,119,600$ Materials & Services 6,359,814 6,121,683 7,363,600 8,797,000
13,825,099$ 14,704,032$ 19,649,600$ 22,916,600$ 17%TOTAL DEPARTMENTAL BUDGET
FTEs 50.00 62.00 72.00 84.00
BUSINESSSERVICES▼
Business Services The Business Services Department (BSD) is composed of the administrative programs that support District operations and services provided to customers — Office of the Chief Executive Officer, Legal Services, Government Affairs, Communications & Community Engagement, Human
Resources, Risk & Insurance Management, Business Strategy & Performance Management, Digital Solutions, Finance & Accounting, and Research & Innovation. Two new programs are being added in FY 2021-22 — Financial Strategy & Performance Management and Business Opportunities & Operations.
The FY 2021-22 budget includes the addition of 12 FTE as compared to the FY 2020-21 revised budget. These positions are described in detail in the departmental summary beginning on page 119.
The two new programs were creating by reorganizing multiple programs to better provide services across the District. The FY 2021-22 BSD budget reflects the transfer of seven existing FTE into the Business Opportunities & Operations program. Four FTE moved from Water Resource Recovery Operations & Services, one FTE moved from Utility Operations & Services and two FTE moved from two programs in BSD. The two positions in the Financial Strategy & Performance Management program are transfers of existing FTE from other BSD programs. In FY 2021-22, the Chief of Staff position will transfer from Government Affairs to the Office of the CEO.
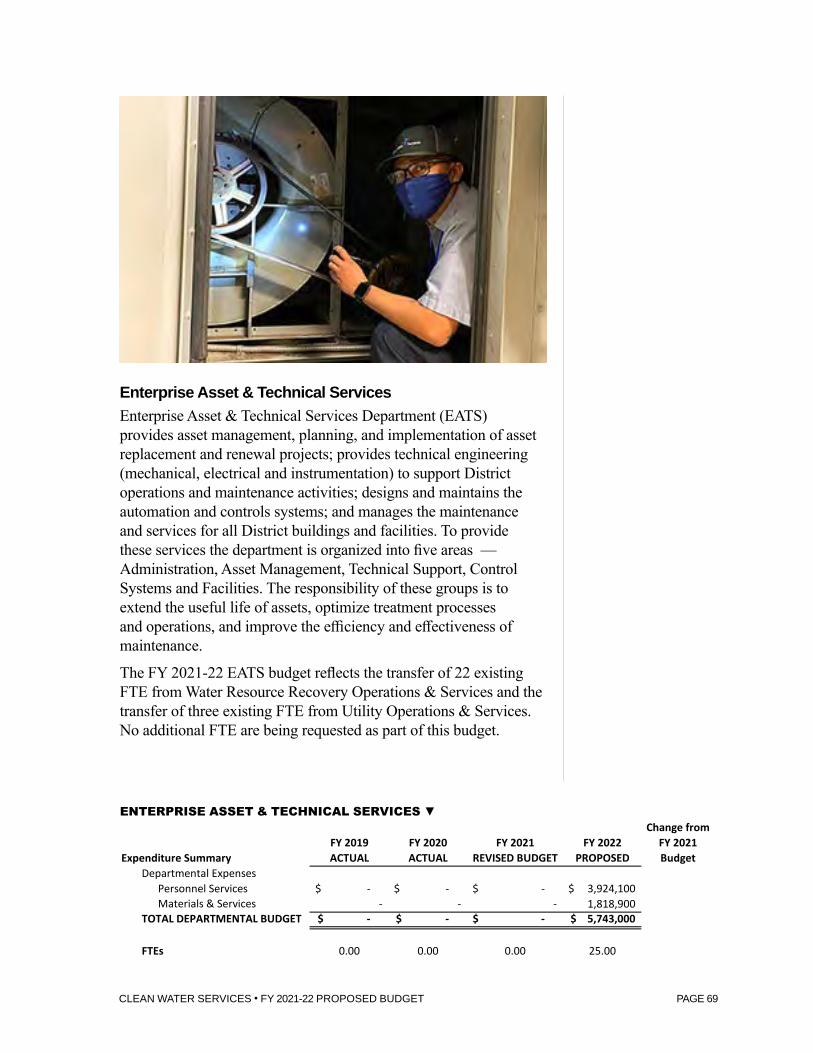
CLEAN WATER SERVICES • FY 2021-22 PROPOSED BUDGET PAGE 69
Enterprise Asset & Technical Services Enterprise Asset & Technical Services Department (EATS) provides asset management, planning, and implementation of asset replacement and renewal projects; provides technical engineering (mechanical, electrical and instrumentation) to support District operations and maintenance activities; designs and maintains the automation and controls systems; and manages the maintenance and services for all District buildings and facilities. To provide these services the department is organized into five areas — Administration, Asset Management, Technical Support, Control Systems and Facilities. The responsibility of these groups is to extend the useful life of assets, optimize treatment processes and operations, and improve the efficiency and effectiveness of maintenance.
The FY 2021-22 EATS budget reflects the transfer of 22 existing FTE from Water Resource Recovery Operations & Services and the transfer of three existing FTE from Utility Operations & Services. No additional FTE are being requested as part of this budget.
EATSChange from
FY 2019 FY 2020 FY 2021 FY 2022 FY 2021Expenditure Summary ACTUAL ACTUAL REVISED BUDGET PROPOSED Budget
- -$ -$ 3,924,100$ - - - 1,818,900
- -$ -$ 5,743,000$
Departmental Expenses Personnel Services $
Materials & ServicesTOTAL DEPARTMENTAL BUDGET $
FTEs 0.00 0.00 0.00 25.00
ENTERPRISEASSET&TECHNICALSERVICES▼

CLEAN WATER SERVICES • FY 2021-22 PROPOSED BUDGET PAGE 70
Natural SystemsChange from
FY 2019 FY 2020 FY 2021 FY 2022 FY 2021Expenditure Summary ACTUAL ACTUAL REVISED BUDGET PROPOSED Budget
Departmental Expenses Personnel Services 1,820,536$ 2,064,911$ 3,169,600$ 3,812,000$ Materials & Services 2,183,423 2,083,752 2,991,300 3,189,400
TOTAL DEPARTMENTAL BUDGET 4,003,959$ 4,148,663$ 6,160,900$ 7,001,400$ 14%
FTEs 22.00 23.00 24.00 29.00
NATURALSYSTEMSENHANCEMENT&STEWARDSHIP▼
Natural System Enhancement & StewardshipThe Natural System Enhancement & Stewardship Department (NSES) builds and strengthens partnerships to enhance the benefits that natural resources provide to the community. As a regional services provider, NSES is able to leverage millions of dollars for streamside enhancement from voluntary incentive Farm Bill programs; conservation districts; local parks and open space providers; city, state and federal governments; and more than two dozen nonprofit partners. In January 2021, NSES initiated an in-depth department assessment. The existing Operations program will be split into three new programs in FY 2021-22 — Landscape Strategies, Project Delivery and Stewardship — to align people, resources and programs to act strategically to meet current and future opportunities and challenges.
The FY 2021-22 budget includes an additional five FTE as compared to the FY 2020-21 revised budget. The new positions are described in detail in the departmental summary beginning on page 169.

CLEAN WATER SERVICES • FY 2021-22 PROPOSED BUDGET PAGE 71
Regional Utilities Services The Regional Utilities Services Department (RUSD) is responsible for customer relations, economic development and community planning, strategic integrated planning and policy development and utility intergovernmental relations. Staff in these programs manage and administer the District’s intergovernmental agreements with its co-implementing cities, Washington County, City of Portland and other partners, develop the policies and standards for new development and build transformative relationships with land use and community development, public works and engineering programs at our partner agencies. The department manages private development permitting, environmental and engineering design plan review and construction oversight. The department consists of Administration, Development Services and Systems Planning.
The FY 2021-22 RUSD budget reflects the transfer of 31 existing FTE from Utility Operations & Services and one FTE from Business Services. It also includes two new FTE. The new positions are described in detail in the departmental summary beginning on page 185.
RUSDChange from
FY 2019 FY 2020 FY 2021 FY 2022 FY 2021Expenditure Summary ACTUAL ACTUAL REVISED BUDGET PROPOSED Budget
- -$ -$ 4,726,300$ - - - 1,020,300
- -$ -$ 5,746,600$
Departmental Expenses Personnel Services $
Materials & ServicesTOTAL DEPARTMENTAL BUDGET $
FTEs 0.00 0.00 0.00 34.00
REGIONALUTILITIESSERVICES▼

CLEAN WATER SERVICES • FY 2021-22 PROPOSED BUDGET PAGE 72
Regulatory Affairs The Regulatory Affairs Department (RAD) performs research and data analysis for ambient water quality, updates the Tualatin TMDL, oversees compliance and monitoring, and helps develop state and federal regulations. RAD includes Administration, Environmental Services and Laboratory Services.
The FY 2021-22 budget includes an additional two FTE as compared to the FY 2020-21 revised budget. The new positions are described in detail in the departmental summary beginning on page 197.
Regulatory Affairs DepartmentChange from
FY 2019 FY 2020 FY 2021 FY 2022 FY 2021Expenditure Summary ACTUAL ACTUAL REVISED BUDGET PROPOSED Budget
Departmental Expenses Personnel Services 4,476,791$ 4,436,752$ 4,589,400$ 4,938,100$ Materials & Services 1,834,064 1,860,949 2,745,100 2,370,500
TOTAL DEPARTMENTAL BUDGET 6,310,855$ 6,297,701$ 7,334,500$ 7,308,600$ 0%
FTEs 35.00 35.00 33.00 35.00
REGULATORYAFFAIRS▼

CLEAN WATER SERVICES • FY 2021-22 PROPOSED BUDGET PAGE 73
Utility Operations & Services The Utility Operations & Services Department (UOPS) is responsible for design, construction oversight, operations and maintenance of the District’s surface water and sanitary conveyance systems. The department includes Administration, Conveyance Engineering and Field Operations.
The FY 2021-22 UOPS budget transfers two programs, Development Services and Systems Planning, from UOPS into the new Regional Utilities Services department. It also includes two new FTE. The new positions are described in detail in the departmental summary beginning on page 209. Also in FY 2021-22, the Chief Utility Relations Officer position will transfer from UOPS to the Office of the CEO in Business Services.
Change fromFY 2019 FY 2020 FY 2021 FY 2022 FY 2021
Expenditure Summary ACTUAL ACTUAL REVISED BUDGET PROPOSED BudgetDepartmental Expenses
Personnel Services 11,449,706$ 12,146,362$ 15,346,300$ 10,550,100$ Materials & Services 2,927,555 3,993,664 4,159,100 2,480,000
TOTAL DEPARTMENTAL BUDGET 14,377,261$ 16,140,026$ 19,505,400$ 13,030,100$ -33%
FTEs 121.00 126.00 130.00 93.00
UTILITYOPERATIONS&SERVICES▼

CLEAN WATER SERVICES • FY 2021-22 PROPOSED BUDGET PAGE 74
Water Resource Recovery Operations & Services The Water Resource Recovery Operations & Services Department (WRRD) provides operation, maintenance and engineering for the District’s four water resource recovery facilities and 43 pump stations. Close to 62 million gallons of wastewater per day, on average, are pumped and treated to some of the highest standards in the nation. The water is then returned to the environment in the Tualatin River or reused for irrigation on golf courses, parks and sports fields. Solids removed from the wastewater are processed and used as soil amendments on farm land and nutrients are recovered and sold as a premium fertilizer. Digester gas produced in processing the solids fuels cogeneration systems offset approximately 47% of the electrical energy and 70% of the natural gas energy used by the facilities.
The department has five operating divisions that deliver on the core functions of conveying and treating wastewater: Durham; Rock Creek; Hillsboro/Forest Grove; Pump Stations; and Biosolids, Reuse and Fernhill. Two programs support the operating groups: Treatment Plant Services and Administration.
The FY 2021-22 budget includes the addition of five new FTE into WRRD as well as the reduction of one FTE and transfer of 28 FTE into other departments to support organizational realignment. The new positions are described in detail in the departmental summary beginning on page 245. Also in FY 2021-22, the Chief Operating Officer position will transfer from WRRD to the Office of the CEO.
Change fromFY 2019 FY 2020 FY 2021 FY 2022 FY 2021
Expenditure Summary ACTUAL ACTUAL REVISED BUDGET PROPOSED BudgetDepartmental Expenses Personnel Services 12,781,235$ 13,366,270$ 18,683,500$ 14,319,300$
Materials & Services 13,814,298 12,280,834 13,462,900 12,808,300 26,595,533$ 25,647,104$ 32,146,400$ 27,127,600$ -16%TOTAL DEPARTMENTAL BUDGET
FTEs 129.00 136.00 147.00 123.00
WATERRESOURCERECOVERYOPERATIONS&SERVICES▼

CLEAN WATER SERVICES • FY 2021-22 PROPOSED BUDGET PAGE 75
DISTRICT SUMMARY OF POSITIONS FY 2022
PERSONNELSERVICES
Business Services DepartmentOffice of the CEO - 8101 5.00 6.00 4.00 5.00 1,347,100$ Legal Services - 8102 3.00 3.00 3.00 3.00 697,600 Government Affairs - 8110 7.00 10.00 5.00 4.00 537,000 Communications & Community Engagement - 8112 0.00 0.00 10.00 12.00 1,754,900 Human Resources - 8501 5.00 6.00 5.50 6.00 1,001,800 Digital Solutions - 8305 13.00 15.00 16.00 16.00 2,812,900 Business Strategy & Performance Systems - 8500 2.00 4.00 2.00 2.00 347,000 Finance & Accounting - 8504 13.00 15.00 17.00 14.00 1,998,900 Risk & Insurance Management - 8502 2.00 3.00 3.50 4.00 731,400 Research & Innovation - 8113 0.00 0.00 6.00 8.00 1,429,100 Business Opportunities & Operations - 8503 0.00 0.00 0.00 8.00 1,109,600 Financial Strategy & Performance Management - 8600 0.00 0.00 0.00 2.00 352,300
50.00 62.00 72.00 84.00 14,119,600$
Enterprise Asset & Technical ServicesAdministration - 8364 0.00 0.00 0.00 5.00 1,050,000$ Asset Management - 8362 0.00 0.00 0.00 8.00 1,123,000 Control Systems - 8353 0.00 0.00 0.00 3.00 359,800 Technical Support - 8363 0.00 0.00 0.00 5.00 873,900 Facilities 0.00 0.00 0.00 4.00 517,400
0.00 0.00 0.00 25.00 3,924,100$
Natural Systems Enhancement & StewardshipAdministration - 8233 2.25 2.25 2.25 2.00 425,300$ Landscape Strategies - 8236 0.00 0.00 0.00 10.50 1,194,700 Project Delivery - 8237 0.00 0.00 0.00 12.25 1,728,600 Stewardship - 8238 0.00 0.00 0.00 4.25 463,400 Operations - 8234 19.75 20.75 21.75 0.00 -
22.00 23.00 24.00 29.00 3,812,000$
Regional Utilities Services DepartmentAdministration - 8201 0.00 0.00 0.00 5.00 934,000$ Development Services - 8225 0.00 0.00 0.00 23.50 3,311,100 Systems Planning - 8226 0.00 0.00 0.00 5.50 481,200
0.00 0.00 0.00 34.00 4,726,300$
Regulatory Affairs DepartmentAdministration - 8210 11.00 9.00 7.00 8.00 1,361,800$ Environmental Services - 8212 7.00 8.00 8.00 8.00 1,123,500 Laboratory Services - 8232 17.00 18.00 18.00 19.00 2,452,800
35.00 35.00 33.00 35.00 4,938,100$
Utility Operations & Services DepartmentAdministration - 8370 5.00 5.00 7.00 10.00 1,475,100$ Conveyance Engineering - 8224 18.00 18.00 18.00 14.00 1,222,200 Field Ops Systems Repair - 8371 14.00 14.00 14.00 14.00 1,212,900 Field Ops Systems Maintenance - 8373 15.00 15.00 15.00 15.00 1,840,100 Field Ops TV/Flow Monitoring - 8375 14.00 14.00 13.00 13.00 1,554,300 Local Repair & Construction - 8380 11.00 11.00 11.00 11.00 1,341,600 SWM Facility Maintenance - 8383 15.00 16.00 16.00 16.00 1,903,900 Administration - 8201 4.00 5.00 6.00 0.00 - Engineering Development Related Services - 8225 21.00 22.00 17.00 0.00 - Engineering Systems Delivery Planning - 8226 4.00 4.00 11.00 0.00 - Building Maintenance - ABC Building - 8507 0.00 2.00 2.00 0.00 -
121.00 126.00 130.00 93.00 10,550,100$
Water Resource Recovery Operations & Services DepartmentAdministration - 8301 12.00 12.00 15.00 9.00 1,392,500$ Biosolids/Reuse/Fernhill - 8331 3.00 2.00 3.00 4.00 493,700 TPS Engineering - 8211 13.00 13.00 13.00 13.00 623,600 Pump Stations - 8343 5.00 8.00 8.00 8.00 1,038,700 Technology Development & Research - 8316 3.00 4.00 6.00 6.00 448,900 Durham Operations - 8311 16.50 16.00 17.00 17.00 2,253,400 Durham Mechanical Maintenance - 8361 10.50 11.50 10.00 11.00 1,355,600 Durham E&I Maintenance - 8351 9.50 8.50 8.50 8.00 834,000 Rock Creek Operations - 8312 16.50 16.00 16.00 16.00 2,039,700 Rock Creek Mechanical Maintenance - 8344 10.50 9.50 10.00 11.00 1,226,100 Rock Creek E&I Maintenance - 8352 9.50 8.50 8.50 8.00 995,600 Hillsboro Operations & Maintenance - 8314 4.50 5.00 4.00 5.50 703,300 Forest Grove Operations & Maintenance - 8315 4.50 6.00 8.00 6.50 914,200 Asset Management - 8362 5.00 9.00 9.00 0.00 - Control Systems - 8353 6.00 7.00 6.00 0.00 - Technical Support - 8363 0.00 0.00 5.00 0.00 -
129.00 136.00 147.00 123.00 14,319,300$
Total District FTEs and Salary 357.00 382.00 406.00 423.00 56,389,500$
FY 2022PROPOSED
FY 2019ACTUAL
FY 2020ACTUAL
FY 2021REVISED


CLEAN WATER SERVICES • FY 2021-22 PROPOSED BUDGET PAGE 77
Debt Service
DEBT SERVICE REQUIREMENTS The District has a policy of utilizing cash, System Development Charges, and long-term debt as tools to manage the funding requirements of its infrastructure investment strategy. As of June 30, 2021, the District’s long-term indebtedness consists of:
The District’s legal debt limitation, as defined by Oregon Revised Statutes 451.545, shall not exceed 13% of the true cash value of all property by law assessable for state and county purposes within the Agency’s boundaries. The limitation applies to the aggregate of all outstanding General Obligation Bonds. The District does not have any general obligation debt and hence has not incurred any such debt under the $16.758 billion debt margin allowed by state law. The table on the next page illustrates the debt margin calculation for the past five years.
June 30, 2021
Date of IssueDate of
Maturity Amount IssuedPrincipal
Outstanding Principal InterestSerial Revenue Bonds
Senior Lien2010B Bonds 4/28/2010 10/1/2035 90,260,000$ 72,845,000$ 3,790,000$ 3,945,696$ 2011A Refunding 8/24/2011 10/1/2021 30,255,000 3,720,000 3,720,000 93,000 2011B Bonds 8/24/2011 10/1/2032 50,000,000 34,995,000 2,275,000 1,418,825 2016 Refunding 10/13/2016 10/1/2029 33,225,000 30,045,000 3,340,000 1,418,750
Total Serial Revenue Bonds 141,605,000 13,125,000 6,876,271
Special Purpose Revenue BondsPension Bonds 5/27/2004 6/30/2028 15,990,000 10,155,000 1,125,000 617,035
Total Long Term Debt 151,760,000$ 14,250,000$ 7,493,306$
Debt Service Fiscal 2022LONG-TERMINDEBTEDNESS▼ As of June 30, 2021

CLEAN WATER SERVICES • FY 2021-22 PROPOSED BUDGET PAGE 78
Fiscal Year GeneralEnded Real Market Legal Debt Obligation Debt
June 30 Value Limitation Indebtedness Margin2021 128,908,009,365$ 16,758,041,217$ -$ 16,758,041,217$ 2020 111,702,863,070 14,521,372,199 - 14,521,372,1992019 107,044,937,425 13,915,841,865 - 13,915,841,8652018 103,347,612,510 13,435,189,626 - 13,435,189,6262017 93,028,764,748 12,093,739,417 - 12,093,739,417
DEBTMARGINCALCULATION▼ For past five years
Clean Water Services is required by its bond documents to generate coverage of at least 120% of the annual debt service on its senior lien bonds and at least 110% on its second lien bonds. Senior lien coverage is calculated as the ratio of net revenues (as defined in the bond documents) to annual senior lien bond debt service. Second lien bond coverage is calculated as the ratio of net revenues, less the annual senior lien bond debt service, to the annual second lien bond debt service. The District has no subordinate debt outstanding.
2017Actual
2018 Actual
2019Actual
2020Actual
2021Estimated
Net Revenues $90,032,480 $86,808,158 $105,344,405 $98,808,402 $89,158,700Total Debt Service* $24,710,391 $20,529,807 $20,466,665 $20,412,865 $20,071,322Sr Debt Svc Coverage 3.64 4.23 5.15 4.84 4.44
$0
$20,000,000
$40,000,000
$60,000,000
$80,000,000
$100,000,000
$120,000,000DEBT SERVICE ► COVERAGE
Total debt service is estimated to be
4.44 in FY 2020-21
* Excluding pension bonds not subject to covenants. Pension bond annual debt service is included in operating labor costs for calculation of net revenues to calculate the debt service coverage ratio.
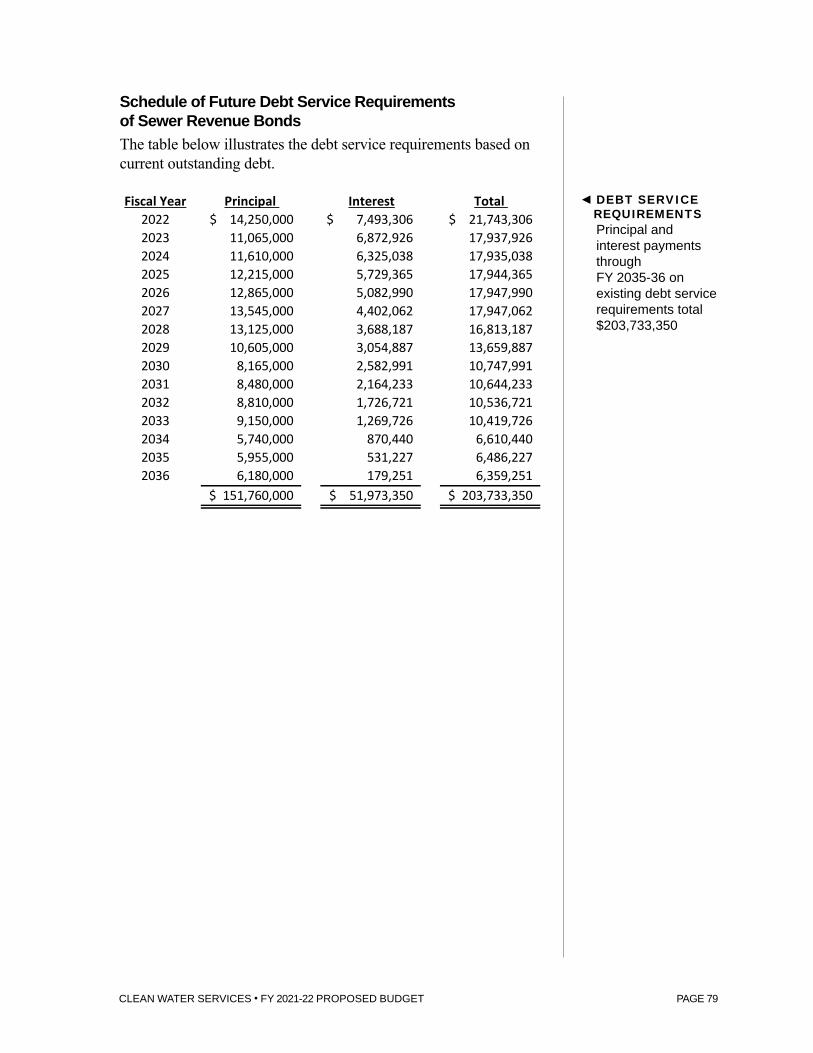
CLEAN WATER SERVICES • FY 2021-22 PROPOSED BUDGET PAGE 79
Schedule of Future Debt Service Requirements of Sewer Revenue BondsThe table below illustrates the debt service requirements based on current outstanding debt.
Principal Interest Total 14,250,000$ 7,493,306$ 21,743,306$ 11,065,000 6,872,926 17,937,92611,610,000 6,325,038 17,935,03812,215,000 5,729,365 17,944,36512,865,000 5,082,990 17,947,99013,545,000 4,402,062 17,947,06213,125,000 3,688,187 16,813,18710,605,000 3,054,887 13,659,887
8,165,000 2,582,991 10,747,9918,480,000 2,164,233 10,644,2338,810,000 1,726,721 10,536,7219,150,000 1,269,726 10,419,7265,740,000 870,440 6,610,4405,955,000 531,227 6,486,2276,180,000 179,251 6,359,251
151,760,000$ 51,973,350$ 203,733,350$
203420352036
20292030203120322033
20242025202620272028
20222023
Fiscal Year ◄DEBT SERVICEREQUIREMENTSPrincipal and interest payments through FY 2035-36 on existing debt service requirements total $203,733,350

CLEAN WATER SERVICES • FY 2021-22 PROPOSED BUDGET PAGE 80
Projected Bond IssuesThe number and size of new bond issues for the forecast period is driven by the level of projected capital spending and level of projected operating revenue. In order to responsibly maintain ending reserves and to keep rate increases modest, the District would need to issue debt in increments driven by increasing capital requirements. To date, the District has not issued debt for surface water management projects.
The current financial forecast indicates the need to issue approximately $100 million in bonds in Fiscal Year 2027-28 to help fund sanitary sewer capital projects. However, forecasted capital requirements could be impacted by increased development that will require the District to accelerate construction of infrastructure to meet system demands and will be adjusted accordingly.
2022Budget
2023 Projected
2024Projected
2025Projected
2026Projected
Est. Net Revenues $89,562,300 $93,666,600 $98,889,100 $104,431,300 $110,314,500Est. Debt Service* $20,001,400 $16,123,700 $16,046,900 $15,972,400 $15,892,700Est. Debt Svc Coverage 4.48 5.81 6.16 6.54 6.94
$0
$20,000,000
$40,000,000
$60,000,000
$80,000,000
$100,000,000
$120,000,000PROJECTED ►DEBT SERVICE
COVERAGEThe estimated debt
service coverage is projected to increase from
4.48 in FY 2021-22 to 6.94 in
FY 2025-26
* Excluding pension bonds not subject to covenants. Pension bond annual debt service is included in operating labor costs for calculation of net revenues to calculate the debt service coverage ratio.

CLEAN WATER SERVICES • FY 2021-22 PROPOSED BUDGET PAGE 81
Capital Project Summary
Clean Water Services (District) annually develops a five-year Capital Improvement Program (CIP). Each December division and program managers request new projects and update the status of existing projects. The District’s Business Partners review the projects in the first quarter of each calendar year and recommend a preliminary five-year CIP. The CIP is then analyzed in the context of the 10-year financial plan and projected spending is matched with cash or debt funding, as appropriate. The first year of the CIP is the basis for the budget for the ensuing fiscal year with respect to capital improvements and related professional services. The CIP also has an impact on staffing and materials and services in the operating budget as discussed below. Further information regarding CIP projects can be found on the District’s website: www.cleanwaterservices.org.
Prioritization of Capital ProjectsProjects at the District are largely driven by the need to meet stringent regulatory requirements. Population growth, infrastructure age and system capacity all impact the District’s ability to meet those requirements. While operating budget impacts are also considered, projects needed to meet regulatory requirements are prioritized.
The impact to the operating budget is assessed secondarily as a part of the project-by-project review of the CIP each year. The District’s operations are large enough that the impact of any one capital improvement project on operating cost is relatively small. In total, however, the impacts can be significant enough to warrant additions to the operating budget. These additions can be partially offset by savings achieved through the use of new capital technology. In addition to considering direct operational budget impacts in project

CLEAN WATER SERVICES • FY 2021-22 PROPOSED BUDGET PAGE 82
selection, the District also considers operational efficiencies and long-term viability of the system to meet growing capacity needs.
Sanitary Sewer CIPSanitary sewer systems projects might be needed to increase capacity due to growth or to replace aged or inadequate equipment. These projects tend to lead to staffing additions and generally do not require additions to energy or chemical budgets. Staffing changes connected to the collection system are integrated with the District’s Conveyance System Management Plan, so collection system maintenance is coordinated with co-implementer cities. The District shares costs with cities and other partners for certain projects.
Capital improvements summarized in the CIP do not include collection system projects wholly designed, managed and maintained by co-implementer cities. The budget will typically show the gross project costs for projects managed by the District as an appropriation with any shared cost proceeds received as resources.

CLEAN WATER SERVICES • FY 2021-22 PROPOSED BUDGET PAGE 83
MAJOR SANITARY SEWER PROJECTS The chart below illustrates the projects and corresponding costs by departments for the next five years of the budgeted sanitary CIP:
Fiscal Year 2021-22Of the $89.2 million in the FY 2021-22 capital budget for sanitary sewer projects, $30.3 million, or 34%, is estimated to be spent on the following five projects. A complete project list is located in the Appendix.
Forest Grove Effluent Pump Station: $9.1 million An effluent pump station is needed at the Forest Grove Water Resource Recovery Facility to send water to the western wetland natural treatment system (NTS) during the summer months, and to the river through a newly constructed outfall pipe during the winter months. The existing effluent pump station is not capable of meeting the hydraulic demands of the new system and cannot be retrofitted to meet the new conditions. The new pump station will be designed for future flows of approximately 12 million gallons per day (mgd) to the NTS and 30 mgd for the outfall. Additionally, the existing ultraviolet (UV) disinfection system is undersized and has reached the end of its useful life. Parts are continually failing and it’s difficult to find replacements.
Tasks in FY 2021-22 include final design and starting construction for the pumping, UV and tertiary filtration technologies. Work on the project includes building new structures, installing new electrical and mechanical equipment, making site civil improvements, and improving seismic reliability. Maintenance requirements will be
FY 22 Budget
FY 23Projected
FY 24Projected
FY 25 Projected
FY 26 Projected
Water Resource Recovery $45.2 $48.2 $30.5 $39.1 $56.8Water Supply Project $1.5 $1.0 $1.0 $1.0 $1.0Utility Operations $25.8 $21.8 $28.3 $27.4 $24.7Support $5.4 $1.7 $1.4 $1.4 $0.5Natural Systems $6.2 $4.7 $4.1 $2.7 $0.9Enterprise Asset & Facilities $5.1 $18.4 $24.2 $5.1 $7.4
$0
$20
$40
$60
$80
$100
$120
in m
illio
ns
$89.2$95.8
$89.5$76.7
$91.3
◄ SANITARY CIPFiscal Year 2021-22 projected through FY 2025-26

CLEAN WATER SERVICES • FY 2021-22 PROPOSED BUDGET PAGE 84
improved while providing operational reliability for disinfection requirements. The project also will add pumping redundancy to the NTS pumping system. Construction is scheduled to be completed in FY 2022-23.
Cedar Mill Trunk Upgrade, Jenkins to Beaverton Interceptor: $8.0 million Approximately 4,900 linear feet of the existing 36-inch sanitary sewer will be upgraded to 48-inch pipe in the Cedar Mill Creek Corridor, which joins the Beaverton Creek Sanitary Trunk, inside the Tualatin Hills Nature Park. Model calibration confirmed capacity improvements are needed to this 36-inch sewer by 2025. However, flow meters have shown significant surcharging during recent storm events, which suggests the improvements may be needed sooner. No significant structural defects or inflow and infiltration have been identified; the upgrade is required strictly for capacity. Additional modeling demonstrated the upgrade from Jenkins Road downstream to the Beaverton Interceptor would eliminate the need for sanitary improvements through the Nike Campus in the near future.
In partnership with Washington County for the Jenkins Road Improvement Project, the District has evaluated the existing corridor to identify and implement enhancement actions to the streams, wetland and riparian corridors. The project will increase corridor resilience and preserve a healthy natural area to withstand the
The land adjacent to Cedar Mill Creek is
a floodplain. The project team
will work to eliminate flooding of paths,
parking lots and other amenities used by
people, but flooding will not be entirely
eliminated.
CLEAN WATER SERVICES • FY 2021-22 PROPOSED BUDGET PAGE 85
pressures of hydromodification caused by future urbanization of the watershed. Work on the project includes community outreach and engagement to connect the neighborhood to the District’s work as well as connect people to nature. Through an intergovernmental agreement with Washington County, the District will enhance the Cedar Mill Creek Corridor to satisfy permit conditions as well as restoration requirements for the sanitary sewer improvement. Significant coordination with Tualatin Hills Park and Recreation District and Resers’ Fine Foods is anticipated. Project costs include the sanitary sewer improvements and the Cedar Mill Creek Regional Stormwater Management Approach.
Rock Creek Solids Dewatering: $7.0 million This is a solids treatment process improvement project at the Rock Creek Wastewater Treatment Facility. Rock Creek uses one centrifuge and four belt filter presses for dewatering digested biosolids. The centrifuge, which is used as the primary dewatering process, was installed in 2001. The belt filter presses were installed in 1995 and are used as backups to the centrifuge. To reduce dewatering program costs, improve reliability and eliminate the need to use the belt filter presses, two new centrifuges were procured in November 2017 in conjunction with improvements at the Durham Water Resource Recovery Facility. Work on this project includes predesign, design and installation of the two centrifuges; odor control system improvements; and seismic resilience improvements to the dewatering building. Project financials reflect a FY 2020-21 start and FY 2022-23 construction completion.
North Hillsboro Pump Station: $3.2 million A new pump station and force main are needed to serve development in the North Hillsboro industrial area. The proposed pump station name is North Hillsboro Pump Station.
The pump station is projected to have an initial capacity of 1.5 mgd and 4,100 linear feet of 8-inch diameter force main. Project funding is for design, construction and land acquisition for the pump station site. The pump station is scheduled to be constructed by spring of 2022.
Utility Billing Customer Information System Replacement: $3.0 million This is a joint project with the District’s billing partner, Tualatin Valley Water District, to replace the utility billing software system. The scope of Phase 2 in FY 2021-22 includes the software purchase and implementation.
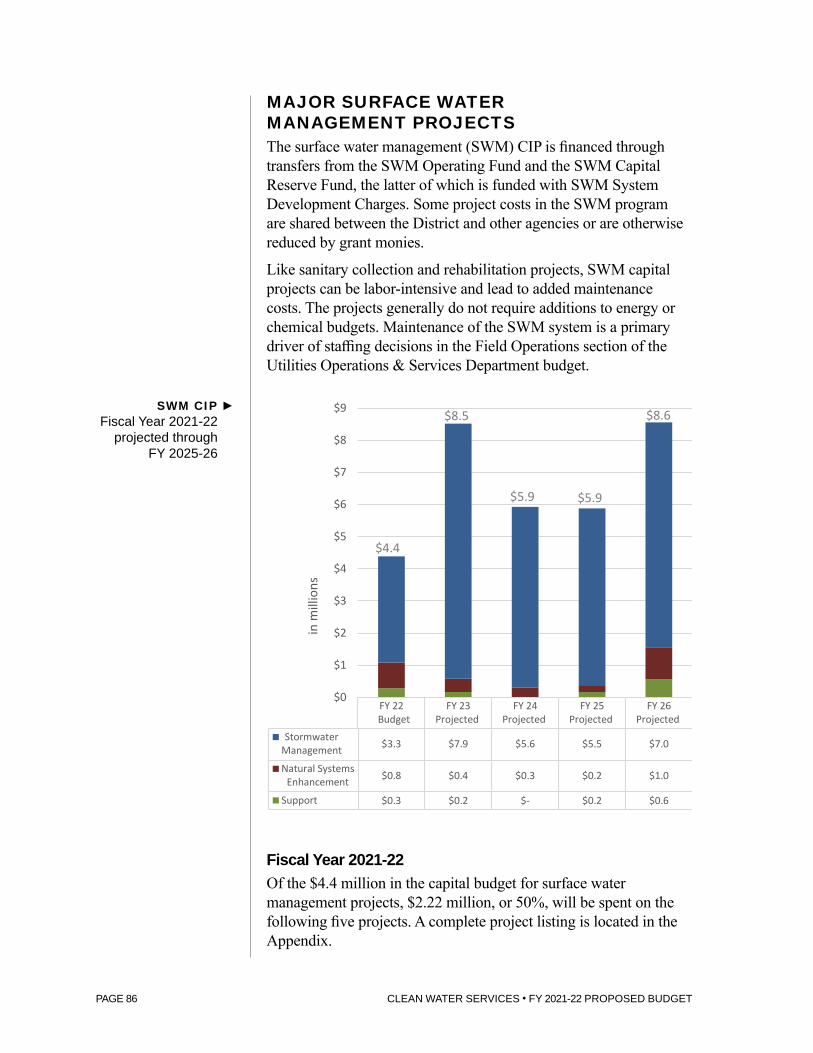
CLEAN WATER SERVICES • FY 2021-22 PROPOSED BUDGET PAGE 86
MAJOR SURFACE WATER MANAGEMENT PROJECTSThe surface water management (SWM) CIP is financed through transfers from the SWM Operating Fund and the SWM Capital Reserve Fund, the latter of which is funded with SWM System Development Charges. Some project costs in the SWM program are shared between the District and other agencies or are otherwise reduced by grant monies.
Like sanitary collection and rehabilitation projects, SWM capital projects can be labor-intensive and lead to added maintenance costs. The projects generally do not require additions to energy or chemical budgets. Maintenance of the SWM system is a primary driver of staffing decisions in the Field Operations section of the Utilities Operations & Services Department budget.
Fiscal Year 2021-22Of the $4.4 million in the capital budget for surface water management projects, $2.22 million, or 50%, will be spent on the following five projects. A complete project listing is located in the Appendix.
FY 22 Budget
FY 23Projected
FY 24Projected
FY 25Projected
FY 26Projected
StormwaterManagement $3.3 $7.9 $5.6 $5.5 $7.0
Natural SystemsEnhancement $0.8 $0.4 $0.3 $0.2 $1.0
Support $0.3 $0.2 $- $0.2 $0.6
$0
$1
$2
$3
$4
$5
$6
$7
$8
$9
in m
illio
ns
$8.5
$5.9 $5.9
$8.6
$4.4
SWM CIP ►Fiscal Year 2021-22
projected through FY 2025-26

CLEAN WATER SERVICES • FY 2021-22 PROPOSED BUDGET PAGE 87
Tualatin Watershed Enhancement Collaborative: $610,000 The District, Washington County, Tualatin Hills Park and Recreation District, the Tualatin Soil and Water Conservation District, the cities of Beaverton and Portland, and three local nonprofit organizations have organized as the Tualatin Watershed Enhancement Collaborative (TWEC)/Cedar Mill-North Johnson Creek team. TWEC will implement the vision developed in the previous Oregon Solutions phase of efforts in this basin that documented frequent road flooding, stream encroachment, and construction within regulatory floodplains as significant issues. As one of the two lead entities in TWEC, the District is supporting a systemic approach to finding ways to adapt to flooding through education, outreach and technical assistance. The District is supporting evaluation of possible governance and funding options for these activities and potential public capital investment in the basis geared toward flood and erosion risk reduction.
Programmatic Subbasin and Surface Water Planning: $500,000 This project serves as an umbrella program for the programmatic development of subbasin and surface water management planning strategies. This umbrella program will be used to develop programmatic strategies necessary to support subbasin planning and to provide stream resilience or mitigation efforts to offset the impacts of hydromodification. Potential programmatic efforts may include:
● Developing domain-specific HM Guidance for stream corridor enhancement.
● Developing quantification metrics for hydromodification. ● Creating a Low Impact Development Approaches sizing tool. ● Creating guidance documents for developers on stormwater
management. ● Developing guidance to create integrated subbasin plans
including stormwater management and natural system enhancement and stewardship that connects to overall planning efforts for cities and community development.
● Creating a state and federal agency permit compliance tracking tool to account for the creation of credits and debits to hydromodification and buffer requirements.
● Developing an infill development approach.
Subbasin and Surface Water Planning: $500,000 This is a placeholder for Subbasin and Surface Water Management Area Planning Projects to reflect budget impacts until actual

CLEAN WATER SERVICES • FY 2021-22 PROPOSED BUDGET PAGE 88
projects are identified and commence. It represents more planning and design elements for FY 2021-22, with an anticipation of more construction-type of projects in FY 2022-23 and beyond. Initial planning will occur in the Preliminary Subbasin and Surface Water Planning Umbrella Project and new planning projects will be rolled out of this placeholder to create capital projects with unique CIP numbers. It may promulgate several studies and investigations of watersheds, developing tools to help assess approaches and metrics for adaptive management strategies.
West Bethany Creek Enhancement: $390,000 This project is the implementation of a surface water management strategy to incorporate natural features, landscape and vegetation, and restoration activities with structural surface water practices to achieve surface water management objectives for quantity. The objective of this strategy is to enhance existing natural areas and features by limiting channel and corridor degradation, floodplain disconnection, erosion potential and hydromodification.
The project area begins at a point where Bethany Creek crosses Northwest Kaiser Road, approximately 450 feet north of Southwest Springville Road and extends westward, downstream, approximately 4,500 linear feet to Bethany Creek’s confluence with Springville Creek, approximately 450 feet south of Southwest Springville Road and 400 feet east of Northwest Samuel Drive. The project area includes Basin 10 as described in the North Bethany Stormwater Implementation Plan and the stream reach outside of the North Bethany Planning area on either side of Northwest Joss Avenue.
The project area is immediately downstream of the Bethany Creek Enhancement project and immediately upstream of the Springville Creek project, effectively providing stream reach scale enhancement and surface water management consistent with the Landscape Conservation Strategy approach.
198th Avenue Stormwater Treatment Real Time Control: $220,000 This project is to for system design, installation and commissioning of Stormwater Real Time Control (RTC) Continuous Monitoring and Adaptive Control (CMAC) for the three water quality facilities associated with the stormwater management of Washington County’s 198th Avenue Transportation Project. Work on this project includes site evaluation and engineering for the installation of RTC-CMAC monitoring equipment, control structure, valve, actuator and hardware for continuous monitoring and automated control of up to three storm water facilities.

CLEAN WATER SERVICES • FY 2021-22 PROPOSED BUDGET PAGE 89
Financial Outlook
The purpose of the long-range financial plan at Clean Water Services (District) is to identify financial trends, forecast revenue-raising and spending, and identify strategies to mitigate negative trends and enhance the positive ones. The District has prepared a plan that supports the goal of continued financial health and flexibility. The plan provides background on financial trends, presents 10-year financial forecasts, and defines several strategies that can be implemented to maintain the District’s financial strength.
Clean Water Services has a history of sound finances evidenced by strong credit ratings on its bonded indebtedness and healthy unrestricted financial reserves. The District manages the utility to be competitive with the best in both the private sector and other leading public wastewater and stormwater management agencies. This competitive approach coupled with small, predictable rate increases has led to healthy financial reserves.
STRATEGIESThe District has crafted financial strategies that will enable timely and effective responses to a variety of economic, operational and regulatory changes. These strategies are presented below.
1. Keep Rate Increases Reasonable and Predictable Planning and implementing reasonable and predictable rate increases helps avoid negative ratepayer reaction, especially during uncertain economic times. Moreover, years without rate increases put added pressure on the District’s reserve and debt service coverage levels. To address both ratepayer and operational issues, the District has adopted a policy of reasonable rate increases on a regular basis, if not annually.

CLEAN WATER SERVICES • FY 2021-22 PROPOSED BUDGET PAGE 90
2. Maintain Adequate Capacity to Issue Debt Borrowing is absolutely essential to finance the large capital investments that are necessary to meet regulatory requirements and growth in customer base. To ensure the District has adequate fiscal capacity to issue debt, the District maintains coverage ratios far above those set for debt service coverage.
3. Establish and Maintain Appropriate Financial Reserves Financial reserves are needed to provide working capital, fund operating contingencies, finance future capital replacement, and cover risk management liabilities. In recent years, cash reserves have been sufficiently high to cover all these needs. Specific target amounts have been set for each reserve type so the unrestricted ending fund balances are adequate to meet each of those needs.
4. Adopt Sound Financial Policies The District has established financial policies for the major areas of financial management to provide a broad framework within which the District can make decisions in a financially sound and prudent manner. They are not to be so specific that they constrain management flexibility or prevent efficiency gains. Those policies can be seen elsewhere in the budget document.
FINANCIAL FORECAST ASSUMPTIONSThe District has prepared multiyear financial forecasts to help plan its revenue raising and borrowing. Although the reliability of financial forecasts decline the longer the planning horizon, the value of forecasts as a policy tool increases as the horizon expands. The longer-range forecast makes it possible to see the range of consequences of various revenue raising and spending decisions years in advance and formulate actions to help attain financial goals.
District staff made the following assumptions in developing the 10-year forecast. The base year for the forecast is FY 2020-21 (estimated). The FY 2021-22 budget maintains revenue and expenditure levels in line with the previous fiscal year. Operating costs are proposed to increase 4.8% as compared to the prior year. Major revenues and expenditures for the future forecast periods (FY 2022-23 - FY 2029-30) are projected based upon a multiplier of the base year. The multiplier in turn is chosen based upon historical trends or staff’s best estimate of future activity for a given revenue or expenditure category.
CLEAN WATER SERVICES • FY 2021-22 PROPOSED BUDGET PAGE 91
● Customer Usage Revenue Growth Sanitary sewer charges and other minor service assessments are projected to increase by about .75% annually due to anticipated minimal growth in new development and customer connections as the region recovers from the impacts of the COVID-19 pandemic. The average annual growth in Equivalent Dwelling Units has remained close to 1.5% over the past 10 years.
● SDC Revenue Growth Similar to customer growth, System Development Charge (SDC) revenues are projected to increase by about .75% annually with minimal growth in new development in the region as the economy recovers from the impacts of the COVID-19 pandemic. The forecast includes a planned rate increase of 2.5% annually, starting in FY 2022-23 and continuing for the next nine years. This assumption is the most vulnerable to the vagaries associated with SDCs that often are a leading indicator of economic activity, but one that can swing dramatically with the timing of only a few major development projects. A significant drop in development and accompanying SDC revenue will also delay those projects in the CIP necessary to serve the new development.
● Operating Expense Increases Like the District’s largest source of revenue, the assumption for increases in operating expenses relies on historical trends and anticipated impacts in the future. Increases are currently estimated to average 4.5% over the forecast period.
● Capital Expenditures The largest portion of capital expenditures is dedicated to capital projects. The District has a reasonably reliable source for those spending projections of the forecast in the form of its capital improvement program. This projection may be heavily affected by regulatory requirements imposed by the federal and state governments as well as economic conditions.
● Rate Increases Rate increases for the forecast period are derived from all other revenue and spending variables in the forecast, as well as the need to responsibly maintain ending reserves and debt service. The District will continue to propose reasonable annual rate increases to support upcoming capital spending necessitated by federal and state requirements.
The current forecast for sanitary sewer operations assumes reasonable and predicable rate increases of 5.0-5.5% annually
CLEAN WATER SERVICES • FY 2021-22 PROPOSED BUDGET PAGE 92
beginning in FY 2022-23. The current forecast for surface water management operations assumes that the rate will increase 5% annually through the same period.
● Bond Issues The number and size of new bond issues for the forecast period is driven primarily by the level of projected capital spending and the level of projected operating revenues and expenditures. For further information refer to the Debt Service Requirements section beginning on page 77.

CLEAN WATER SERVICES • FY 2021-22 PROPOSED BUDGET PAGE 93
Funds Summary

CLEAN WATER SERVICES • FY 2021-22 PROPOSED BUDGET PAGE 94
Serv
iceSA
NITA
RY S
EWER
SURF
ACE
WAT
ER M
ANAG
EMEN
TFu
nd N
umbe
r10
110
210
610
710
811
111
211
420
120
620
720
821
2
Fund
Nam
eGe
nera
l Fun
dLia
bilit
y Re
serv
e Fu
nd
Capi
tal
Repl
acem
ent
Fund
Capi
tal
Rese
rves
Sa
nita
ry
LID
Cons
truc
tion
San
itary
Mas
ter P
lan
Upda
te D
ebt
Serv
ice
Sani
tary
Sew
er
Cons
truc
tion
Reve
nue
Pens
ion
Bond
SWM
Op
erat
ing
SWM
Cap
ital
Repl
acem
ent
Fund
Capi
tal
Rese
rves
S
WM
LID
Cons
truc
tion
SW
M
SWM
Co
nstr
uctio
nDi
stric
t Tot
al
Reso
urce
s:Be
ginn
ing
fund
bal
ance
152,
602,
045
$ 5,
161,
832
$
10,2
64,9
13$
23
,031
,722
$
2,59
3,77
5$
20
,488
,974
$
66,1
97,6
90$
64
3,89
4$
20,7
96,8
85$
2,
930,
711
$
2,25
2,22
2$
64
3,00
3$
8,81
8,45
6$
31
6,42
6,12
2$
Serv
ice ch
arge
s14
1,23
2,20
0
18,0
88,9
00
159,
321,
100
Syst
em d
evel
opm
ent c
harg
es (S
DCs)
15,4
43,6
00
14
5,00
0
15,5
88,6
00
Pl
an ch
eck
fees
242,
400
24
2,40
0
484,
800
Sept
age
char
ges
1,28
2,20
0
1,
282,
200
Co
unty
/City
cont
ract
mai
nten
ance
350,
000
35
0,00
0
Er
osio
n co
ntro
l fee
s27
2,30
0
272,
300
Gran
ts, c
ontr
ibut
ions
, & a
sses
smen
ts30
0,00
0
161,
600
-
46
1,60
0
Re
imbu
rsem
ents
from
dev
elop
ers
1,90
0,00
0
850,
000
2,
750,
000
Pa
ymen
ts fr
om th
ird p
artie
s33
,500
-
33
,500
Insu
ranc
e &
third
par
ty re
imb
5,40
0
5,
400
Bo
nd su
bsid
y1,
380,
900
1,38
0,90
0
Misc
ella
neou
s1,
706,
400
50,0
00
15
0,70
0
75,0
00
-
1,98
2,10
0
Inte
rest
on
inve
stm
ents
2,41
1,30
0
81
,600
16
2,20
0
363,
900
41
,000
32
3,80
0
1,04
6,00
0
10,2
00
328,
600
46
,300
35
,600
10
,200
13
9,30
0
5,00
0,00
0
Bond
sale
pro
ceed
s-
-
-
-
-
-
-
-
-
-
-
-
-
-
Subt
otal
299,
776,
545
5,
282,
332
10,4
27,1
13
38,8
39,2
22
2,
796,
375
22,1
93,6
74
69,1
93,6
90
65
4,09
4
40,2
29,7
85
2,97
7,01
1
2,
507,
822
653,
203
9,
807,
756
505,
338,
622
Tran
sfer
s IN
13,0
00,0
00
-
7,
500,
000
-
-
17
,120
,500
60
,528
,000
1,73
1,80
0
75
0,00
0
-
4,57
5,00
0
10
5,20
5,30
0
Tota
l Res
ourc
es31
2,77
6,54
5$
5,28
2,33
2$
17
,927
,113
$
38,8
39,2
22$
2,
796,
375
$
39,3
14,1
74$
12
9,72
1,69
0$
2,
385,
894
$
40,2
29,7
85$
3,
727,
011
$
2,50
7,82
2$
65
3,20
3$
14,3
82,7
56$
61
0,54
3,92
2$
Requ
irem
ents
:De
part
men
tal:
Busin
ess S
ervi
ces D
epar
tmen
t22
,916
,600
$
22,9
16,6
00$
En
terp
rise
Asse
t & T
ech
Serv
ices
5,74
3,00
0
5,
743,
000
Na
tura
l Sys
tem
s Enh
ance
men
t7,
001,
400
7,00
1,40
0
Regi
onal
Util
ities
Ser
vice
s5,
746,
600
5,74
6,60
0
Regu
lato
ry A
ffairs
Dep
artm
ent
7,30
8,60
0
7,
308,
600
Ut
ility
Ope
ratio
ns &
Ser
vice
s13
,030
,100
13,0
30,1
00
W
ater
Res
ourc
e Re
cove
ry D
ept
27,1
27,6
00
27
,127
,600
Subt
otal
88,8
73,9
00
88
,873
,900
Non-
Depa
rtm
enta
l:Ca
pita
l con
stru
ctio
n (C
IP)
4,27
6,00
0
9,
826,
500
850,
000
74
,241
,000
328,
000
25
,000
4,
089,
900
93,6
36,4
00
M
ater
ials
& se
rvice
s5,
105,
500
890,
000
65
0,00
0
50,0
00
100,
000
13
5,60
0
10,0
00
25,0
00
50,0
00
7,01
6,10
0
Debt
serv
ice -
prin
cipal
13,1
25,0
00
1,12
5,00
0
14
,250
,000
Debt
serv
ice -
inte
rest
6,87
6,40
0
61
7,10
0
7,49
3,50
0
Cont
inge
ncy
19,6
51,1
00
10
0,00
0
1,50
0,00
0
1,
500,
000
200,
000
1,
050,
000
10,2
50,0
00
75
,000
1,
750,
000
100,
000
30
,000
10
0,00
0
1,00
0,00
0
37
,306
,100
Unap
prop
riate
d en
ding
fund
bal
ance
127,
868,
345
4,
292,
332
5,95
0,61
3
17
,460
,622
1,69
6,37
5
18
,262
,774
45
,130
,690
568,
794
20
,094
,185
3,
289,
011
2,40
2,82
2
50
3,20
3
9,24
2,85
6
25
6,76
2,62
2
Su
btot
al24
5,77
4,84
5
5,28
2,33
2
17
,927
,113
18
,960
,622
2,79
6,37
5
39
,314
,174
12
9,72
1,69
0
2,38
5,89
4
21
,979
,785
3,
727,
011
2,43
2,82
2
65
3,20
3
14,3
82,7
56
505,
338,
622
Tran
sfer
s OUT
67,0
01,7
00
19
,878
,600
-
18
,250
,000
-
75
,000
-
10
5,20
5,30
0
To
tal R
equi
rem
ents
312,
776,
545
$ 5,
282,
332
$
17,9
27,1
13$
38
,839
,222
$
2,79
6,37
5$
39
,314
,174
$
129,
721,
690
$
2,38
5,89
4$
40
,229
,785
$
3,72
7,01
1$
2,
507,
822
$
653,
203
$
14
,382
,756
$
610,
543,
922
$
Net I
ncre
ase
(Dec
reas
e) in
Fun
d Ba
lanc
e(2
4,73
3,70
0)$
(8
69,5
00)
$
(4
,314
,300
)$
(5
,571
,100
)$
(8
97,4
00)
$
(2
,226
,200
)$
(2
1,06
7,00
0)$
(7
5,10
0)$
(702
,700
)$
358,
300
$
15
0,60
0$
(139
,800
)$
424,
400
$
(5
9,66
3,50
0)$
%
Cha
nge
-16.
2%-1
6.8%
-24.
2%-3
4.6%
-10.
9%-3
1.8%
-11.
7%-3
.4%
6.7%
-21.
7%4.
8%-1
8.9%
-$
-
$
-
$
-
$
-$
-$
-$
-
$
-
$
-
$
-
$
-
$
-
$
-
$
CLEA
N W
ATER
SER
VICE
SAl
l Fun
ds S
umm
ary
- Fun
d Bu
dget
Det
ail
Fisc
al Y
ear 2
021-
2022
RE
SO
UR
CE
S &
RE
QU
IRE
ME
NT
SAl
l Fun
ds S
umm
ary
| Fun
d Bu
dget
Det
ail F
isca
l Yea
r 202
1-22
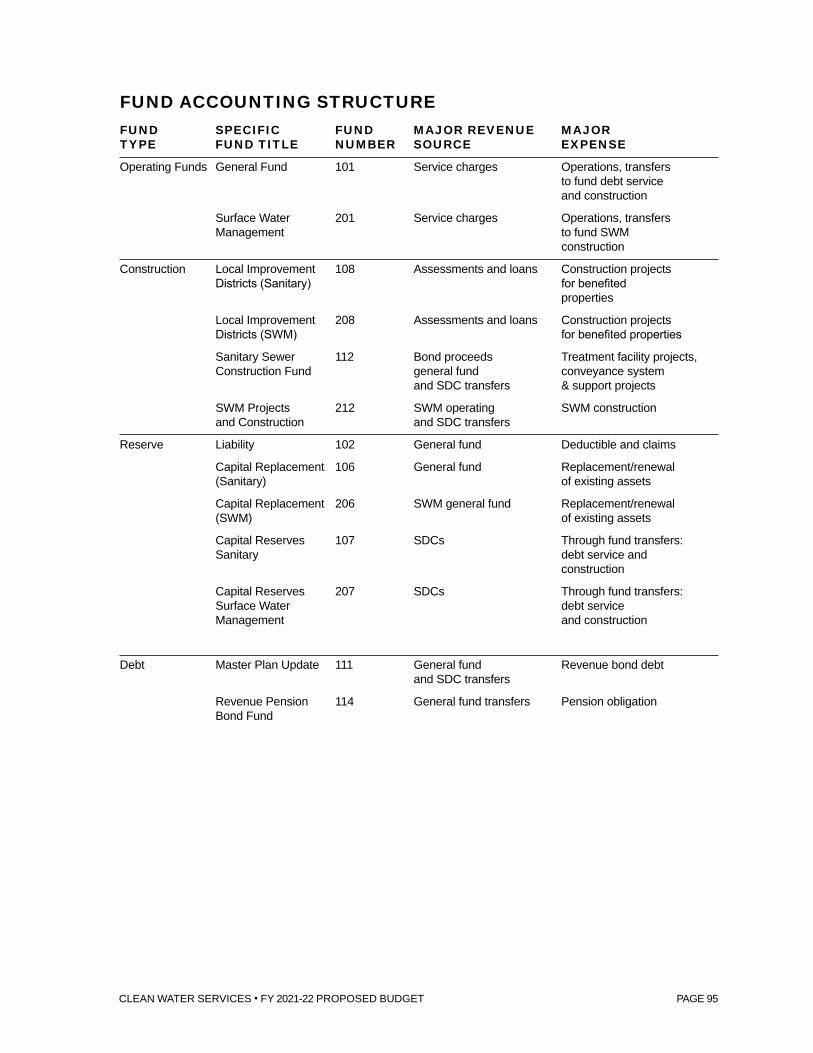
CLEAN WATER SERVICES • FY 2021-22 PROPOSED BUDGET PAGE 95
FUND ACCOUNTING STRUCTUREFUND SPECIFIC FUND MAJOR REVENUE MAJORTYPE FUND TITLE NUMBER SOURCE EXPENSE
Operating Funds General Fund 101 Service charges Operations, transfers to fund debt service and construction
Surface Water 201 Service charges Operations, transfers Management to fund SWM construction
Construction Local Improvement 108 Assessments and loans Construction projects Districts (Sanitary) for benefited properties
Local Improvement 208 Assessments and loans Construction projects Districts (SWM) for benefited properties
Sanitary Sewer 112 Bond proceeds Treatment facility projects, Construction Fund general fund conveyance system and SDC transfers & support projects
SWM Projects 212 SWM operating SWM construction and Construction and SDC transfers
Reserve Liability 102 General fund Deductible and claims
Capital Replacement 106 General fund Replacement/renewal (Sanitary) of existing assets
Capital Replacement 206 SWM general fund Replacement/renewal (SWM) of existing assets
Capital Reserves 107 SDCs Through fund transfers: Sanitary debt service and construction
Capital Reserves 207 SDCs Through fund transfers: Surface Water debt service Management and construction
Debt Master Plan Update 111 General fund Revenue bond debt and SDC transfers
Revenue Pension 114 General fund transfers Pension obligation Bond Fund

CLEAN WATER SERVICES • FY 2021-22 PROPOSED BUDGET PAGE 96
GENERAL FUND PROGRAM CODES Department Program
Department / Division Program Code CodeBusiness Services Department Office of the Chief Executive Officer 010 8101
Legal Services 010 8102Government Affairs 020 8110Communications & Community Engagement 020 8112Human Resources 020 8501Digital Solutions 020 8305Business Strategy & Performance Systems 050 8500Risk & Insurance Management 050 8502Business Opportunities & Operations 050 8503Finance & Accounting 050 8504Financial Strategy & Performance Management 050 8600Research & Innovation 050 8113
Enterprise Asset & Technical Services Administration 090 8364Asset Management 090 8362Control Systems 090 8353Technical Support 090 8363WRRD Facilities 091 8512Building Maintenance - Field Operations 091 8508Building Maintenance - Materials Handling Yard 091 8509Building Maintenance - Tualatin River Farm 091 8510Building Maintenance - ripl 091 8511Building Maintenance - ABC Building 091 8507
Natural Systems Enhancement & Stewardship Administration 030 8233Landscape Strategies 030 8236Project Delivery 030 8237Stewardship 030 8238
Regional Utilities Services Department Administration 080 8201Development Services 080 8225Systems Planning 080 8226
Regulatory Affairs Department Administration 040 8210Environmental Services 040 8212Laboratory Services 040 8232
Utility Operations & Services Department Administration 063 8370Conveyance Engineering 062 8224
Field Operations Division System Repair 063 8371System Maintenance 063 8373Local Repair & Construction 063 8380SWM Surface Facility Maintenance 063 8383TV/Flow Monitoring 063 8375
Water Resource Recovery Operations & Services Administration 071 8301
Biosolids/Reuse/Fernhill Biosolids/Reuse/Fernhill 074 8331
Treatment Plant Services Engineering 075 8211Technology Development & Research 074 8316
Pump Stations Pump Stations 073 8343
Durham Durham Operations 072 8311Durham Mechanical Maintenance 072 8361Durham E&I Maintenance 072 8351
Rock Creek Rock Creek Operations 073 8312Rock Creek Mechanical Maintenance 073 8344Rock Creek E&I Maintenance 073 8352
Hillsboro & Forest Grove Hillsboro Operations & Maintenance 073 8314Forest Grove Operations & Maintenance 073 8315

CLEAN WATER SERVICES • FY 2021-22 PROPOSED BUDGET PAGE 97
Operating Funds
The District fund structure includes the following two operating funds:
● General Fund 101 Includes appropriation for all personnel-related expenses and materials and services related to day-to-day operations.
● Surface Water Management Operating Fund 201 Collects service charge revenues from the Surface Water Management (SWM) Program and transfers a portion to the General Fund in support of SWM related operations.
Both funds track not only the revenues from service charges, but also maintain budgetary segregation of these resources and expenses.
Beginning in Fiscal Year 1997-98, the District began to capitalize the personnel and materials and services costs associated with staff whose time is dedicated to capital improvement projects. This practice is continuing in FY 2021-22.

CLEAN WATER SERVICES • FY 2021-22 PROPOSED BUDGET PAGE 98
GENERAL FUND 101The Clean Water Services (District) General Fund supports the overall operations of the treatment and conveyance systems through collection of service charge revenues. The FY 2021-22 budget reflects a 4.5% increase in sewer services charges, which equates to a monthly charge of $48.02 for the average residential customer.
Resources in the FY 2021-22 budget total $312.7 million, including service charges of $141.2 million, other revenues of $5.9 million, reimbursement for SWM operating costs of $13 million, and $152.6 million in anticipated fund balance carryover from the prior year.
Operating expenditures in the FY 2021-22 budget total $88.9 million, including departmental labor costs of $56.4 million and materials and services of $32.5 million. The budget also includes transfers totaling $67 million to fund debt service principal and interest payments and capital construction, capital outlay of $4.3 million and other nondepartmental costs of $5.1 million. As noted previously, other nondepartmental costs include utility bad debt expense, franchise fees, utility assistance and pass-through revenues from co-implementer cities.
Authorized Positions: All District positions are funded in Fund 101. Where appropriate, Fund 101 personnel expenditures are reimbursed by other funds such as SWM Operating Fund 201. The District’s full-time equivalent total includes both operating and capital staff. The format of Fund 101 requirements reflects the decision to capitalize staff whose time is dedicated to capital projects.
$-
$20,000,000
$40,000,000
$60,000,000
$80,000,000
$100,000,000
$120,000,000
$140,000,000
$160,000,000
$180,000,000
2018 Actual 2019 Actual 2020 Actual 2021 RevisedBudget
2022 ProposedBudget
Revenues Expenditures Reserves(contingency & unappropriated)
GENERAL ►FUND 101
REVENUE, EXPENDITURE AND RESERVE
TRENDSExcluding transfers

CLEAN WATER SERVICES • FY 2021-22 PROPOSED BUDGET PAGE 99
FY 2019 FY 2020 FY 2021 RESOURCES OR REQUIREMENTS: OBJECT FY 2022 FY 2022 FY 2022ACTUAL ACTUAL REVISED BUDGET CATEGORY CODE PROPOSED APPROVED ADOPTED
RESOURCES$44,212,781 $45,853,873 $46,666,400 Service Charges 40110 $48,656,300
69,324,816 72,617,222 69,999,600 City Service Payments 40120 76,041,10016,022,892 14,498,164 15,999,900 Industrial/Commercial 40140 15,493,300
300,977 368,753 394,000 City Right of Way Fees 40155 372,70058,865 49,730 49,900 Water Usage Accounts 40130 49,200
572,160 591,094 297,400 Portland Customers 40150 619,600
$130,492,491 $133,978,836 $133,407,200 SERVICE CHARGES Subtotal $141,232,200 $0 $0
$198,306 $187,703 $210,600 Plan Check Fees 40190 $242,4001,311,352 1,376,710 1,315,800 Septage Charges 40170 1,282,200
84,631 98,150 15,000 Sewer Field Services 40250 98,0002,653,719 2,366,751 1,416,000 Miscellaneous Revenue 40200-42000 1,608,400
80,540 506,628 10,000 Grants/Contributions 43010-43040 300,000TRANSFERS FROM:
10,080,009 10,318,425 11,557,500 Fund 201 - SWM Operating 49201 13,000,0006,130,382 2,854,846 2,923,300 Investment Interest 44020 2,411,300
171,041,805 156,392,813 151,052,100 Beginning Balance, as previously reported 152,602,0450 (1,176,003) 0 Restatements 0
171,041,805 155,216,811 151,052,100 Beginning Balance 31100 152,602,045
$322,073,235 $306,904,860 $301,907,500 TOTAL RESOURCES $312,776,545 $0 $0
REQUIREMENTSDEPARTMENTAL
$42,981,585 49,241,337 58,748,500 Personnel Services 63,389,500 (8,183,871) (8,561,633) (4,673,700) Less Capital Personnel Services (7,000,000) 30,314,994 26,257,822 30,722,000 Materials & Services 32,484,400
$65,112,708 $66,937,526 $84,796,800 Total Departmental $88,873,900 $0 $0
$211,198 $207,976 $351,800 Utility Billing Bad Debt Expense 52905 $708,900110,299 120,873 122,000 Franchise Fees 52530 122,900300,977 368,753 394,000 City Right of Way Fees 52270 372,700
2,478,948 1,933,665 3,399,000 Industrial Local 52270 3,501,0001,165,869 1,382,522 5,929,600 Capital Projects 55000 4,276,000
14,699,023 0 608,800 Nondepartmental Materials & Services 52495 400,000
TRANSFERS TO:5,000,000 4,500,000 7,500,000 Replacement Reserve 57106 7,500,000
0 500,000 500,000 LID Construction Fund 57108 05,066,700 9,409,700 9,129,500 Revenue Bond Debt 57111 7,769,900
70,000,000 66,500,000 60,000,000 Capital Construction 57112 50,000,0001,534,700 1,597,100 1,664,800 Revenue Pension Bond Fund 57114 1,731,800
RESERVES AND ENDING BALANCES:0 0 17,464,200 Operating Contingency 58100 19,651,100
156,392,813 153,446,745 110,047,000 Ending Fund Balance 31100 127,868,345
$322,073,235 $306,904,860 $301,907,500 TOTAL REQUIREMENTS $312,776,545 $0 $0
FUND101▼ General Fund Summary

CLEAN WATER SERVICES • FY 2021-22 PROPOSED BUDGET PAGE 100
STORM & SURFACE WATER MANAGEMENT FUND 201The District’s SWM Program was introduced in 1990 and is based on a monthly service charge of $9.75 per typical household. The larger co-implementer cities retain a portion of this charge to fund SWM maintenance activities within their respective boundaries.
Resources in the FY 2021-22 budget total $40.2 million, including service charges of $18.1 million, other revenues of $1.3 million, and $20.8 million in anticipated fund balance carryover from the prior year.
Expenditures in the FY 2021-22 budget are primarily attributable to a transfer of $13 million to the General Fund (Fund 101) to reimburse for operating expenses and a transfer of $5.2 million to fund capital expenditures.
The District is proposing to increase rates by $0.50 in this fiscal year and the FY 2021-22 budget has prioritized capital projects to help stabilize reserves going forward. Adequate reserves are needed to address increased operating costs due to wet weather conditions, regulatory requirements and increased public demand for services, as well as to fund capital projects.
$-
$5,000,000
$10,000,000
$15,000,000
$20,000,000
$25,000,000
2018 Actual 2019 Actual 2020 Actual 2021 RevisedBudget
2022 ProposedBudget
Revenues Expenditures Reserves(contingency & unappropriated)
SWM ►FUND 201
REVENUE, EXPENDITURE AND RESERVE
TRENDSExcluding transfers

CLEAN WATER SERVICES • FY 2021-22 PROPOSED BUDGET PAGE 101
FY 2019 FY 2020 FY 2021 RESOURCES OR REQUIREMENTS: OBJECT FY 2022 FY 2022 FY 2022ACTUAL ACTUAL REVISED BUDGET CATEGORY CODE PROPOSED APPROVED ADOPTED
RESOURCES:Service Charges
$9,921,911 $10,533,078 $10,588,300 CWS Customers 40110 $11,338,9005,681,118 6,241,630 6,186,000 City Customers 40120 6,750,000
550,000 300,000 350,000 County/City Contract Maintenance 40340 350,000337,128 261,580 297,900 Erosion Control Fees 40280/40290 272,300107,700 78,978 90,800 Inspection 40200 125,700211,043 187,703 209,500 Plan Check Fees 40190 242,400
1,297,060 422,880 25,100 Miscellaneous Revenue 40380 25,000490,568 330,981 233,900 Interest on Investments 44020 328,600
13,122,178 17,077,378 18,405,200 Beginning Balance 31100 20,796,8850 (100,754) 0 Restatements 0
13,122,178 16,976,624 18,405,200 Beginning Balance, as restated 31100 20,796,885
$31,718,706 $35,333,454 $36,386,700 TOTAL RESOURCES $40,229,785 $0 $0
REQUIREMENTS:Transfer to General Fund 101:Administrative Costs
$1,320,303 $1,440,473 $1,759,700 Business Operations 81XX $2,177,1000 0 0 Regional Utilities Services Admin 8201 $331,200
133,326 166,574 176,500 Utility Operations & Services Admin 8201 0110,121 110,402 240,400 Capital Projects Administration 8224 186,500
1,280,550 1,403,876 1,203,800 Development Related Services 8225 1,699,200139,525 121,422 320,200 Systems Delivery Planning 8226 130,800
Programmatic Costs383,611 371,699 403,200 Laboratory Services 8232 443,800
79,084 87,800 109,300 Natural Systems Administration 8233 94,800356,928 393,025 440,500 Environmental Services 8212 505,700383,448 298,527 337,600 UOPS/Field Operations Admin 8370 546,500577,495 567,002 528,300 Regulatory Affairs Admin 8210 544,100724,179 736,520 1,042,000 Natural Systems Operations 823x 1,269,300
2,073,611 1,991,324 2,222,200 SWM Facility Maintenance 8383 2,242,8002,517,828 2,629,780 2,773,800 System Repair/Maintenance/Flow Monitoring8371/8373/8375 2,828,200
$10,080,009 $10,318,424 $11,557,500 Transfer to General Fund 57101 $13,000,000 $0 $0
Materials & Services:$32,214 $57,631 $45,000 Bad Debt Expense 52905 $45,300
29,106 27,613 40,000 Franchise Fees 52530 40,300 0 0 55,000 Nondepartmental Materials & Services 50,000
4,000,000 3,750,000 6,000,000 Transfer to Fund 212 57212 4,500,000500,000 750,000 750,000 Transfer to Fund 206 57206 750,000
0 0 1,844,800 Contingency 58100 1,750,00017,077,377 20,429,785 16,094,400 Ending Fund Balance 31100 20,094,185
$31,718,706 $35,333,453 $36,386,700 TOTAL REQUIREMENTS $40,229,785 $0 $0
FUND201▼ Surface Water Management Operating Fund

CLEAN WATER SERVICES • FY 2021-22 PROPOSED BUDGET PAGE 103
Construction Funds
The Clean Water Services (District) fund structure includes four funds that provide for the construction of major treatment and sanitary collection system improvements, support facilities, surface water management facilities, Local Improvement District construction, and onetime or ongoing specialized professional services that relate to capital projects and/or long-term planning.

CLEAN WATER SERVICES • FY 2021-22 PROPOSED BUDGET PAGE 104
● Sanitary Sewer Local Improvement District Construction Fund 108 Fund 108 finances collection system construction projects benefiting local property owners who pay assessments to fund the projects.
● Surface Water Management Local Improvement District Construction Fund 208 Fund 208 finances storm drainage and other surface water management facilities benefiting local property owners who pay assessments to fund the project.
● Sanitary Sewer Construction Fund 112 Fund 112 finances treatment, recycled wastewater, sanitary collection system, project-related studies and capital equipment needs from a combination of revenue bond proceeds, sanitary System Development Charge (SDC) revenues and transfers from the District’s General Fund.
● Surface Water Management Construction Fund 212 Fund 212 finances storm drainage and SWM facilities, project-related studies and capital equipment needs from a combination of transfers from SWM Fund 201 and the SWM Capital Reserve Fund 207.

CLEAN WATER SERVICES • FY 2021-22 PROPOSED BUDGET PAGE 105
SANITARY SEWER SYSTEM LOCAL IMPROVEMENT DISTRICT CONSTRUCTION FUND 108At the request of interested property owners, the District will help construct local sanitary sewer system improvements by forming Local Improvement Districts (LIDs). The costs of construction are ultimately funded by assessments paid by benefited property owners. Benefited property owners are residents who own land adjacent to the local improvement and are able to connect to, or be served by, the improvement.
Due to changes in state law and federal regulations for tax-exempt financing, the District has financed LIDs internally. By financing internally, benefited property owners are able to finance a loan with better terms and interest rates and the District receives interest and administrative fees when processing the loan. Additionally, the District does not have to issue debt or be responsible for principal and interest payments on debt if the property owner is in default on the loan.
It is possible that an LID bond sale may be an option in the future; however this budget assumes continued internal financing.
FY 2019 FY 2020 FY 2021 RESOURCES OR REQUIREMENTS: OBJECT FY 2022 FY 2022 FY 2022ACTUAL ACTUAL REVISED BUDGET CATEGORY CODE PROPOSED APPROVED ADOPTED
RESOURCES:$210,727 $474,526 $235,000 Assessment Principal 46010 $235,000
64,765 40,465 27,600 Interest on Investments 44020 32,8007,658 62,752 6,900 Interest on Assessments 44040 8,200
(42,803) (38,408) (72,900) Incentives 46015 (73,400)0 500,000 500,000 Transfer from Fund 101 49101 0
1,702,554 1,912,165 2,240,100 Beginning Balance 31100 2,593,7750 (12,581) 0 Restatements 0
1,702,554 1,899,584 2,240,100 Beginning Balance, as restated 2,593,775
$1,942,901 $2,938,919 $2,936,700 TOTAL RESOURCES $2,796,375 $0 $0
REQUIREMENTS:$30,736 $281,744 $800,000 New Projects (LID Support) 6273 $850,000
$30,736 $281,744 $800,000 PROJECT COSTS - SUBTOTAL $850,000 $0 $0
0 0 50,000 Materials & Services 52240 50,0000 0 160,000 Contingency 58100 200,000
1,912,165 2,657,175 1,926,700 Ending Fund Balance 31100 1,696,375
$1,942,901 $2,938,919 $2,936,700 TOTAL REQUIREMENTS $2,796,375 $0 $0
FUND108▼ Sanitary Sewer System LID Construction Fund Summary
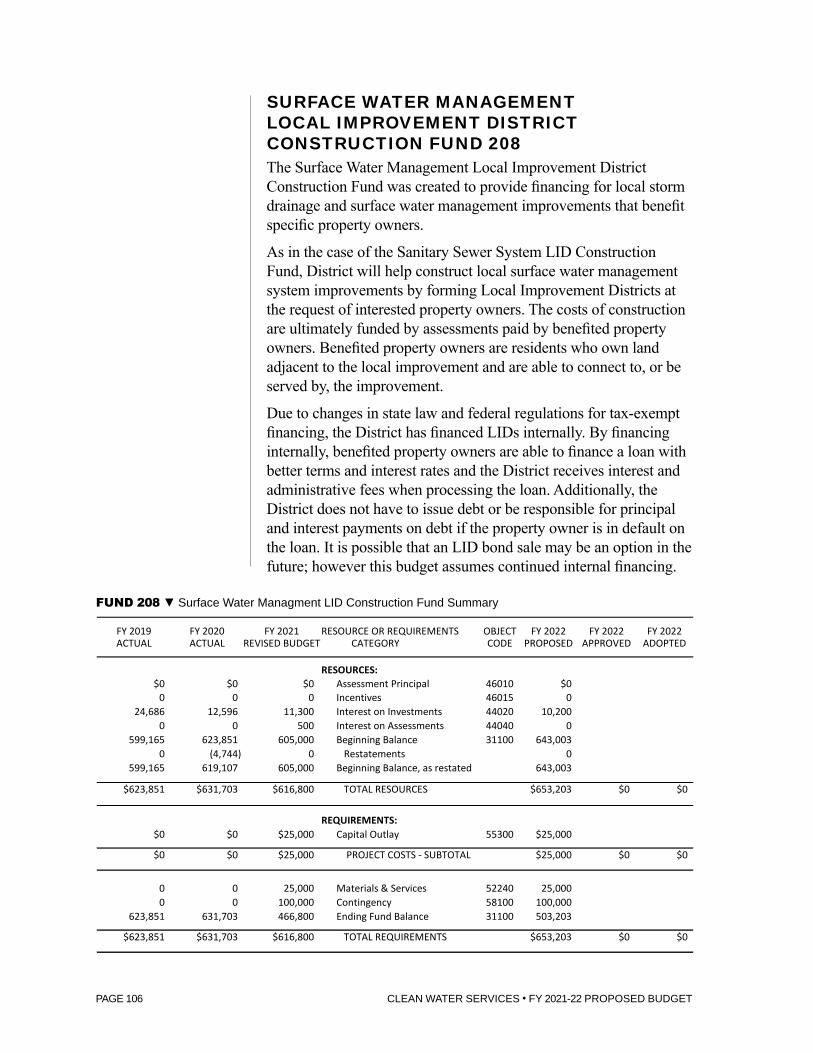
CLEAN WATER SERVICES • FY 2021-22 PROPOSED BUDGET PAGE 106
FY 2019 FY 2020 FY 2021 RESOURCE OR REQUIREMENTS OBJECT FY 2022 FY 2022 FY 2022ACTUAL ACTUAL REVISED BUDGET CATEGORY CODE PROPOSED APPROVED ADOPTED
RESOURCES:$0 $0 $0 Assessment Principal 46010 $0
0 0 0 Incentives 46015 024,686 12,596 11,300 Interest on Investments 44020 10,200
0 0 500 Interest on Assessments 44040 0599,165 623,851 605,000 Beginning Balance 31100 643,003
0 (4,744) 0 Restatements 0599,165 619,107 605,000 Beginning Balance, as restated 643,003
$623,851 $631,703 $616,800 TOTAL RESOURCES $653,203 $0 $0
REQUIREMENTS:$0 $0 $25,000 Capital Outlay 55300 $25,000
$0 $0 $25,000 PROJECT COSTS - SUBTOTAL $25,000 $0 $0
0 0 25,000 Materials & Services 52240 25,0000 0 100,000 Contingency 58100 100,000
623,851 631,703 466,800 Ending Fund Balance 31100 503,203
$623,851 $631,703 $616,800 TOTAL REQUIREMENTS $653,203 $0 $0
FUND208▼ Surface Water Managment LID Construction Fund Summary
SURFACE WATER MANAGEMENT LOCAL IMPROVEMENT DISTRICT CONSTRUCTION FUND 208The Surface Water Management Local Improvement District Construction Fund was created to provide financing for local storm drainage and surface water management improvements that benefit specific property owners.
As in the case of the Sanitary Sewer System LID Construction Fund, District will help construct local surface water management system improvements by forming Local Improvement Districts at the request of interested property owners. The costs of construction are ultimately funded by assessments paid by benefited property owners. Benefited property owners are residents who own land adjacent to the local improvement and are able to connect to, or be served by, the improvement.
Due to changes in state law and federal regulations for tax-exempt financing, the District has financed LIDs internally. By financing internally, benefited property owners are able to finance a loan with better terms and interest rates and the District receives interest and administrative fees when processing the loan. Additionally, the District does not have to issue debt or be responsible for principal and interest payments on debt if the property owner is in default on the loan. It is possible that an LID bond sale may be an option in the future; however this budget assumes continued internal financing.
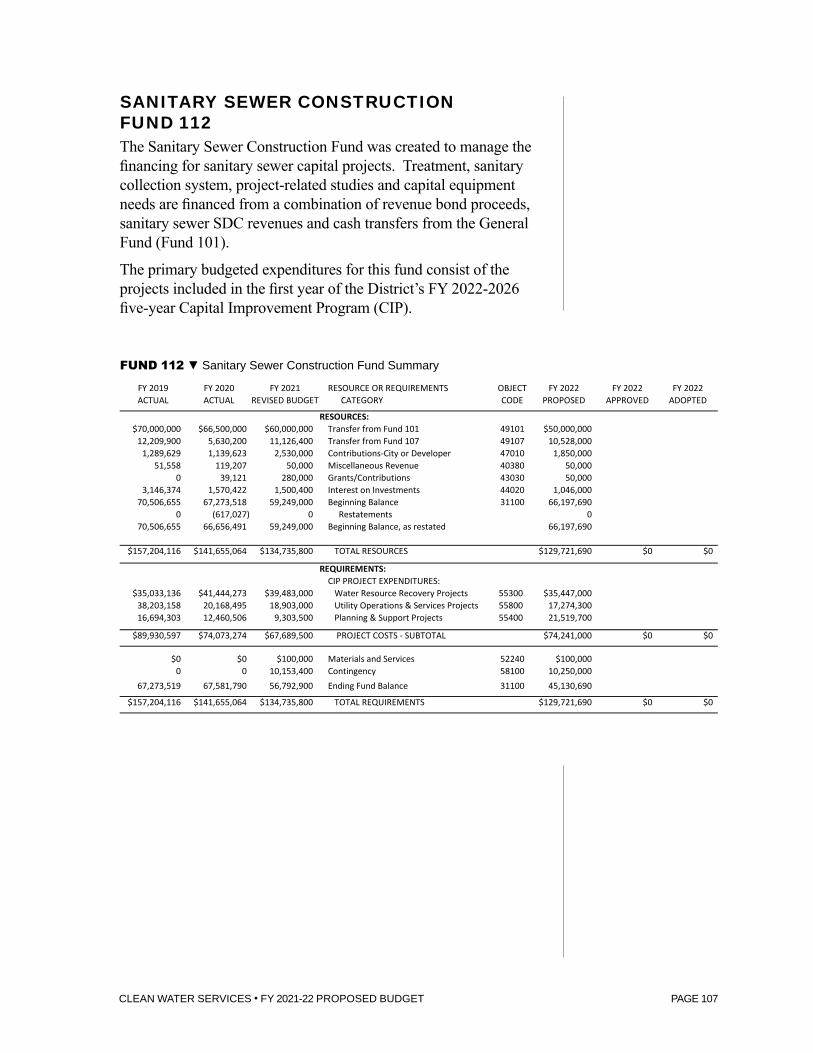
CLEAN WATER SERVICES • FY 2021-22 PROPOSED BUDGET PAGE 107
SANITARY SEWER CONSTRUCTION FUND 112The Sanitary Sewer Construction Fund was created to manage the financing for sanitary sewer capital projects. Treatment, sanitary collection system, project-related studies and capital equipment needs are financed from a combination of revenue bond proceeds, sanitary sewer SDC revenues and cash transfers from the General Fund (Fund 101).
The primary budgeted expenditures for this fund consist of the projects included in the first year of the District’s FY 2022-2026 five-year Capital Improvement Program (CIP).
FY 2019 FY 2020 FY 2021 RESOURCE OR REQUIREMENTS OBJECT FY 2022 FY 2022 FY 2022ACTUAL ACTUAL REVISED BUDGET CATEGORY CODE PROPOSED APPROVED ADOPTED
RESOURCES:$70,000,000 $66,500,000 $60,000,000 Transfer from Fund 101 49101 $50,000,000
12,209,900 5,630,200 11,126,400 Transfer from Fund 107 49107 10,528,0001,289,629 1,139,623 2,530,000 Contributions-City or Developer 47010 1,850,000
51,558 119,207 50,000 Miscellaneous Revenue 40380 50,0000 39,121 280,000 Grants/Contributions 43030 50,000
3,146,374 1,570,422 1,500,400 Interest on Investments 44020 1,046,000 70,506,655 67,273,518 59,249,000 Beginning Balance 31100 66,197,690
0 (617,027) 0 Restatements 070,506,655 66,656,491 59,249,000 Beginning Balance, as restated 66,197,690
$157,204,116 $141,655,064 $134,735,800 TOTAL RESOURCES $129,721,690 $0 $0
REQUIREMENTS:CIP PROJECT EXPENDITURES:
$35,033,136 $41,444,273 $39,483,000 Water Resource Recovery Projects 55300 $35,447,00038,203,158 20,168,495 18,903,000 Utility Operations & Services Projects 55800 17,274,30016,694,303 12,460,506 9,303,500 Planning & Support Projects 55400 21,519,700
$89,930,597 $74,073,274 $67,689,500 PROJECT COSTS - SUBTOTAL $74,241,000 $0 $0
$0 $0 $100,000 Materials and Services 52240 $100,0000 0 10,153,400 Contingency 58100 10,250,000
67,273,519 67,581,790 56,792,900 Ending Fund Balance 31100 45,130,690
$157,204,116 $141,655,064 $134,735,800 TOTAL REQUIREMENTS $129,721,690 $0 $0
FUND112▼ Sanitary Sewer Construction Fund Summary
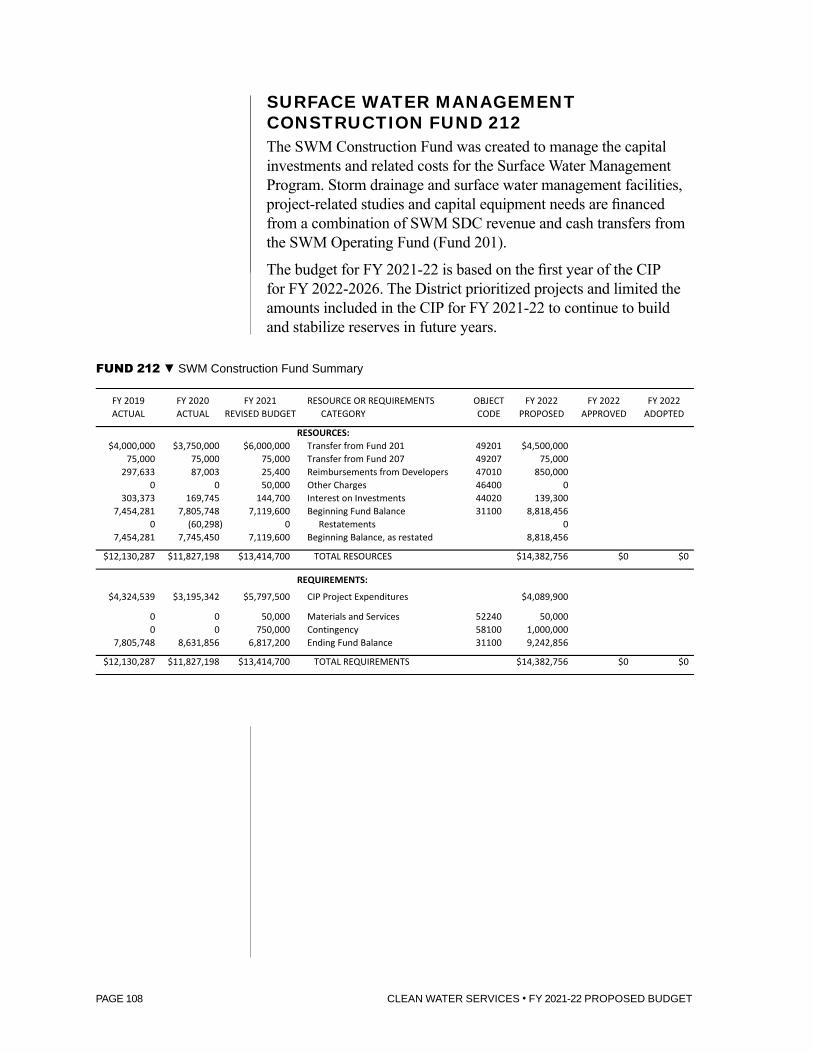
CLEAN WATER SERVICES • FY 2021-22 PROPOSED BUDGET PAGE 108
FY 2019 FY 2020 FY 2021 RESOURCE OR REQUIREMENTS OBJECT FY 2022 FY 2022 FY 2022ACTUAL ACTUAL REVISED BUDGET CATEGORY CODE PROPOSED APPROVED ADOPTED
RESOURCES:$4,000,000 $3,750,000 $6,000,000 Transfer from Fund 201 49201 $4,500,000
75,000 75,000 75,000 Transfer from Fund 207 49207 75,000297,633 87,003 25,400 Reimbursements from Developers 47010 850,000
0 0 50,000 Other Charges 46400 0303,373 169,745 144,700 Interest on Investments 44020 139,300
7,454,281 7,805,748 7,119,600 Beginning Fund Balance 31100 8,818,4560 (60,298) 0 Restatements 0
7,454,281 7,745,450 7,119,600 Beginning Balance, as restated 8,818,456
$12,130,287 $11,827,198 $13,414,700 TOTAL RESOURCES $14,382,756 $0 $0
REQUIREMENTS:$4,324,539 $3,195,342 $5,797,500 CIP Project Expenditures $4,089,900
0 0 50,000 Materials and Services 52240 50,0000 0 750,000 Contingency 58100 1,000,000
7,805,748 8,631,856 6,817,200 Ending Fund Balance 31100 9,242,856
$12,130,287 $11,827,198 $13,414,700 TOTAL REQUIREMENTS $14,382,756 $0 $0
FUND212▼ SWM Construction Fund Summary
SURFACE WATER MANAGEMENT CONSTRUCTION FUND 212The SWM Construction Fund was created to manage the capital investments and related costs for the Surface Water Management Program. Storm drainage and surface water management facilities, project-related studies and capital equipment needs are financed from a combination of SWM SDC revenue and cash transfers from the SWM Operating Fund (Fund 201).
The budget for FY 2021-22 is based on the first year of the CIP for FY 2022-2026. The District prioritized projects and limited the amounts included in the CIP for FY 2021-22 to continue to build and stabilize reserves in future years.

CLEAN WATER SERVICES • FY 2021-22 PROPOSED BUDGET PAGE 109
Reserve Funds
The Clean Water Services (District) fund structure includes five funds intended to provide for mid- and long-term financial requirements and revenues.
● Liability Reserve Fund 102 Fund 102 accounts for the District’s expenses incurred under its self-insurance programs for fire loss, property damage and all risks up to a self-insured retention limit and workers’ compensation claims related to job injuries.
● Sanitary Sewer Capital Replacement Fund 106 Fund 106 finances routine replacement of rolling stock, computers and minor sanitary sewer treatment facility and collection system needs.
● Surface Water Management Capital Replacement Fund 206 Fund 206 finances routine replacement of rolling stock and stormwater collection system needs.
● Sanitary Capital Reserve Fund 107 Fund 107 accounts for the collection and tracking of revenues from System Development Charges expended to construct sanitary sewer systems and facilities and related debt service.
● Surface Water Management Capital Reserve Fund 207 Fund 207 accounts for the collection and tracking of revenues from System Development Charges expended to construct stormwater systems and facilities.
CLEAN WATER SERVICES • FY 2021-22 PROPOSED BUDGET PAGE 110
LIABILITY RESERVE FUND 102The Liability Reserve Fund provides for payments of the retained amount (deductible) of any insured loss and payments for losses that are either uninsured or uninsurable. The District maintains retention levels of $50,000 per occurrence on its liability insurance coverage and $5,000,000 per occurrence on its property coverage. These retentions are insured through the District’s captive, Clean Water Insurance Company.
A portion of the ending fund balance is appropriated as Contingency each year in case of significant payments for self-insured programs and insured losses greater than policy limits. Actual expenditures of these funds would require formal action by the District’s Board of Directors. Examples of self-insured risks include:
● Damage to the District’s vehicles and equipment valued at more than $7,600,000.
● Railroad liability, on-premises pollution from aboveground storage tanks, and off-premises pollution liability.
● Legal defense costs associated with any uninsured or insured but contested occurrence.
● Employee-related claims such as medical expenses from volunteers, employee dishonesty resulting in losses greater than $100,000, and workers’ compensation claims in excess of the standard premium.
Anticipated annual expenses are funded by insurance reimbursements and interest earnings.
Although expenditures are impossible to predict reliably, appropriations are included in the budget as potential payments against District deductibles in property, legal liability, automobile loss and prior years’ workers’ compensation claim payments. The contingency enables the District to modify its insurance policies in volatile markets. For example, expanding the “self-funded” liability portion of coverage can be used to keep insured programs affordable when insurance costs increase due to changes in market conditions or insurers’ assessment of District risk.

CLEAN WATER SERVICES • FY 2021-22 PROPOSED BUDGET PAGE 111
SANITARY SEWER CAPITAL REPLACEMENT FUND 106The Sanitary Sewer Capital Replacement Fund was established in Fiscal Year 2016-17 to track and fund routine replacement of rolling stock, computers and minor treatment facility and collection system needs. This fund is maintained through service charge revenue transferred from the General Fund (Fund 101).
FY 2019 FY 2020 FY 2021 RESOURCE OR REQUIREMENTS OBJECT FY 2022 FY 2022 FY 2022ACTUAL ACTUAL REVISED BUDGET CATEGORY CODE PROPOSED APPROVED ADOPTED
RESOURCES:$0 $0 $0 Transfer from Fund 101 49101 $0
0 0 360,000 Federal Grants 43025 095,185 436,538 0 Payments From Third Parties 46300 33,50025,084 1,223 5,200 Workers Compensation Refunds 46320 5,40044,769 249,775 0 Insurance Reimbursement 46310 0
226,629 109,497 108,100 Interest on Investments 44020 81,600 5,442,558 5,739,412 5,142,600 Beginning Balance 31100 5,161,832
0 (43,511) 0 Restatements 05,442,558 5,695,901 5,142,600 Beginning Balance, as restated 5,161,832
$5,834,225 $6,492,934 $5,615,900 TOTAL RESOURCES $5,282,332 $0 $0
REQUIREMENTS:$5,973 $10,113 $50,000 Workers Comp Medical Claims 52770 $50,000
9,596 342,192 350,000 Legal 52710 350,0003,825 9,105 350,000 Property 52720 350,0004,513 52,261 50,000 Automobile/vehicle-liability 52725 50,000
10,257 43,613 40,000 Automobile/vehicle-collision 52730 40,00049,844 153,302 50,000 Non - Clean Water Services 52735-52750 50,00010,805 493,816 360,000 Other Materials & Services 52495 0
0 0 100,000 Contingency 58100 100,000 5,739,412 5,388,532 4,265,900 Ending Fund Balance 31100 4,292,332
$5,834,225 $6,492,934 $5,615,900 TOTAL REQUIREMENTS $5,282,332 $0 $0
FUND 102▼Liability Reserve Fund Summary
FY 2019 FY 2020 FY 2021 RESOURCE OR REQUIREMENTS OBJECT FY 2022 FY 2022 FY 2022ACTUAL ACTUAL REVISED BUDGET CATEGORY CODE PROPOSED APPROVED ADOPTED
RESOURCES:$5,000,000 $4,500,000 $7,500,000 Transfer from Fund 101 49101 $7,500,000
257,355 160,313 122,700 Interest on Investments 44020 162,2005,656,531 7,585,901 7,432,900 Beginning Balance 31100 10,264,913
0 (55,291) 0 Restatements 05,656,531 7,530,610 7,432,900 Beginning Balance, as restated 10,264,913
$10,913,886 $12,190,923 $15,055,600 TOTAL RESOURCES $17,927,113 $0 $0
REQUIREMENTS:$3,084,663 $4,312,187 $6,855,500 Capital Outlay 55000 $9,826,500
243,323 219,123 650,000 Non Departmental Materials & Services 52000 650,0000 0 750,000 Contingency 58100 1,500,000
7,585,900 7,659,613 6,800,100 Ending Fund Balance 31100 5,950,613
$10,913,886 $12,190,923 $15,055,600 TOTAL REQUIREMENTS $17,927,113 $0 $0
FUND106▼ Sanitary Sewer Capital Replacement Fund Summary

CLEAN WATER SERVICES • FY 2021-22 PROPOSED BUDGET PAGE 112
SURFACE WATER MANAGEMENT CAPITAL REPLACEMENT FUND 206The Surface Water Management Capital Replacement Fund was established in FY 2016-17 to track and fund routine replacement of rolling stock and collection system needs. This fund is maintained through service charge revenue transferred from the Surface Water Management Operating Fund (Fund 201).
FY 2019 FY 2020 FY 2021 RESOURCE OR REQUIREMENTS OBJECT FY 2022 FY 2022 FY 2022ACTUAL ACTUAL REVISED BUDGET CATEGORY CODE PROPOSED APPROVED ADOPTED
RESOURCES:$500,000 $750,000 $750,000 Transfer from Fund 201 49201 $750,000
69,099 51,008 33,000 Interest on Investments 44020 46,3001,676,870 2,245,969 2,767,000 Beginning Balance 31100 2,930,711
0 (15,178) 0 Restatements 01,676,870 2,230,791 2,767,000 Beginning Balance, as restated 2,930,711
$2,245,969 $3,031,799 $3,550,000 TOTAL RESOURCES $3,727,011 $0 $0
REQUIREMENTS:$0 $227,333 $648,000 Capital Outlay 55000 $328,000
0 1,755 10,000 Non Departmental Materials & Services52000 10,0000 0 100,000 Contingency 58100 100,000
2,245,969 2,802,711 2,792,000 Ending Fund Balance 31100 3,289,011
$2,245,969 $3,031,799 $3,550,000 TOTAL REQUIREMENTS $3,727,011 $0 $0
FUND206▼ SWM Capital Replacement Fund Summary

CLEAN WATER SERVICES • FY 2021-22 PROPOSED BUDGET PAGE 113
SANITARY SEWER CAPITAL RESERVE FUND 107New customers are required to pay a System Development Charge (SDC) when connecting for the first time to the District wastewater collection and treatment systems. The Sanitary Sewer Capital Reserve Fund collects and tracks revenue for the sanitary SDCs. The revenues are expended in support of sanitary sewer projects and related debt service by means of transfers to the Sanitary Sewer Construction Fund (Fund 112) and the Master Plan Update Debt Service Fund (Fund 111).
Historically, SDCs constituted a substantial revenue source for the District. However, SDCs are a volatile revenue source dependent on the local economy and development climate.
The sanitary sewer SDC is proposed to increase from $5,800 to $6,085 per Equivalent Dwelling Unit to more accurately reflect the cost of construction.
FY 2019 FY 2020 FY 2021 RESOURCE OR REQUIREMENTS OBJECT FY 2022 FY 2022 FY 2022ACTUAL ACTUAL REVISED BUDGET CATEGORY CODE PROPOSED APPROVED ADOPTED
RESOURCES:REIMBURSEMENT
$2,924,598 $2,247,908 $2,102,900 CWS - District Wide 41010 $2,490,40010,440,635 10,194,703 8,110,100 Cities 41020 6,860,200
1,632,000 533,136 732,100 CWS Industrial 41100 187,10091,800 0 97,300 City Industrial 41110 100,000
IMPROVEMENT1,701,665 1,345,993 1,258,400 CWS - District Wide 41200 1,495,000
190,634 148,700 175,300 CWS - Local 41205 165,3006,246,804 6,140,104 4,868,000 Cities 41210 4,033,000
971,986 320,035 432,000 CWS Industrial 41300 107,10054,674 501 2,800 City Industrial 41310 5,500
912,709 434,935 435,200 Interest on Investments 44020 363,90021,550,293 19,107,898 27,332,100 Beginning Balance 31100 23,031,722
0 (147,192) 0 Restatements 021,550,293 18,960,706 27,332,100 Beginning Balance, as restated 23,031,722
$46,717,798 $40,326,721 $45,546,200 TOTAL RESOURCES $38,839,222 $0 $0
REQUIREMENTS:$15,400,000 $7,500,000 $8,000,000 Transfer to Fund 111 57111 $9,350,600
12,209,900 5,630,200 11,126,400 Transfer to Fund 112 57112 10,528,0000 0 1,500,000 Contingency 58100 1,500,000
19,107,898 27,196,521 24,919,800 Ending Fund Balance 31100 17,460,622
$46,717,798 $40,326,721 $45,546,200 TOTAL REQUIREMENTS $38,839,222 $0 $0
FUND107▼ Sanitary Sewer Capital Reserve Fund Summary

CLEAN WATER SERVICES • FY 2021-22 PROPOSED BUDGET PAGE 114
SURFACE WATER MANAGEMENT CAPITAL RESERVE FUND 207As with the sanitary sewer collection and treatment system, new customers are required to pay an SDC when they become a part of the District’s SWM system. Similar to the Sanitary Capital Reserve Fund, SWM SDC revenues are accounted for in this fund. The revenues are transferred to the SWM Construction Fund – 212 to spend on SWM capital projects.
The SWM SDC is increasing in FY 2021-22 from $560 to $585 per Equivalent Service Unit to more accurately reflect the cost on SWM capital projects.
FY 2019 FY 2020 FY 2021 RESOURCE OR REQUIREMENTS OBJECT FY 2022 FY 2022 FY 2022ACTUAL ACTUAL REVISED BUDGET CATEGORY CODE PROPOSED APPROVED ADOPTED
RESOURCES:Connection Fees
$24,700 $41,578 $47,000 Quality 41410 $40,000228,700 101,184 183,100 Quantity 41400 105,000288,575 322,906 135,700 Fees in Lieu Received 41413 75,000
56,455 39,723 26,900 Interest on Investments 44020 35,6001,245,274 1,768,704 2,062,700 Beginning Balance 31100 2,252,222
0 (11,674) 0 Restatements 01,245,274 1,757,030 2,062,700 Beginning Balance, as restated 2,252,222
$1,843,704 $2,262,421 $2,455,400 TOTAL RESOURCES $2,507,822 $0 $0
REQUIREMENTS:$75,000 $75,000 $75,000 Transfer to Fund 212 57212 $75,000
0 0 30,000 Contingency 58100 30,0001,768,704 2,187,421 2,350,400 Ending Fund Balance 31100 2,402,822
$1,843,704 $2,262,421 $2,455,400 TOTAL REQUIREMENTS $2,507,822 $0 $0
FUND207▼ Surface Water Management Capital Reserve Fund Summary

CLEAN WATER SERVICES • FY 2021-22 PROPOSED BUDGET PAGE 115
Debt Service Funds
The District budget includes two funds that provide payment for long-term bonded debt.
● Master Plan Update Service Fund 111
● Revenue Pension Bond Fund 114
As of June 30, 2021, principal outstanding on sewer revenue bond debt is $141,605,000 and $10,155,000 in revenue pension bonds. Resources and requirements for each fund are identified in this section.
MASTER PLAN UPDATE DEBT SERVICE FUND 111The Master Plan Update Debt Service Fund provides for repayment of revenue bonded debt incurred in support of projects identified in the District’s 1985 and 2006 Master Plan Updates; the 1990, 1993 and 2008 Facilities Plans and Updates; and a portion of treatment plant improvements identified in the Capital Improvement Program.
As a result of major changes in the municipal bond market during Fiscal Year 2008-09, the District opted to hold cash bond reserves to meet bond covenant requirements for its Series 2010B, 2011A and 2011B issues instead of issuing surety reserve policies. The reserved funds are housed in Fund 111 as a restricted portion of the Ending Fund Balance. Future bond issues may include the addition of cash bond reserves as well.

CLEAN WATER SERVICES • FY 2021-22 PROPOSED BUDGET PAGE 116
FY 2019 FY 2020 FY 2021 RESOURCE OR REQUIREMENTS OBJECT FY 2022 FY 2022 FY 2022ACTUAL ACTUAL REVISED BUDGET CATEGORY CODE PROPOSED APPROVED ADOPTED
RESOURCES:$5,066,700 $9,409,700 $9,129,500 Transfer from Fund 101 49101 $7,769,90015,400,000 7,500,000 8,000,000 Transfer from Fund 107 49107 9,350,600
866,570 429,982 413,200 Interest on Investments 44020 323,8001,445,011 1,397,431 1,442,000 Series 2010B Build America Bond Subsidy 43050 1,380,900
21,106,980 23,418,597 22,300,300 Beginning Balance 31100 20,488,9740 (167,122) 0 Restatement 0
21,106,980 23,251,475 22,300,300 Beginning Balance, as restated 20,488,974
$43,885,261 $41,988,588 $41,285,000 TOTAL RESOURCES $39,314,174 $0 $0
REQUIREMENTS:Series 2009A ($58,755,000)
$3,130,000 $3,290,000 $0 Principal 56100 $0242,750 82,250 0 Interest 56105 0
Series 2010B ($90,260,000)3,475,000 3,575,000 3,680,000 Principal 56100 3,790,0004,444,415 4,286,540 4,120,500 Interest 56105 3,945,700
Series 2011A (Refunding Series 2001) ($30,255,000)3,210,000 3,375,000 3,540,000 Principal 56100 3,720,000
612,000 447,375 274,500 Interest 56105 93,000Series 2011B ($50,000,000)
1,965,000 2,060,000 2,165,000 Principal 56100 2,275,0001,726,250 1,635,450 1,529,800 Interest 56105 1,418,900
Series 2016A (Refunding Series 2009A) ($33,335,000)0 0 3,180,000 Principal 56100 3,340,000
1,661,250 1,661,250 1,581,800 Interest 56105 1,418,800
0 0 0 Bond Issuance Costs 56105 00 0 1,050,000 Contingency 58100 1,050,000
Ending Fund Balance14,019,949 7,648,203 7,648,203 Restricted - Debt Reserve 31100 7,648,203
9,398,647 13,927,520 12,515,197 Unrestricted 31100 10,614,571$43,885,261 $41,988,588 $41,285,000 TOTAL REQUIREMENTS $39,314,174 $0 $0
FUND111▼ Master Plan Update Debt Service
The District’s rate covenants on outstanding revenue debt require debt service coverage ratios of at least 1.2 times annual debt service on senior lien parity obligations plus 1.0 times annual debt service on subordinate lien parity obligations. Bond coverage as of June 30, 2020, was 4.84 for senior bonds. The District has no subordinate debt outstanding.

CLEAN WATER SERVICES • FY 2021-22 PROPOSED BUDGET PAGE 117
REVENUE PENSION BOND FUND 114The Revenue Pension Bond Fund provides payment of the Series 2004 Revenue Pension Bonds, which were issued in July 2004. The proceeds of these bonds were used to finance the unfunded actuarial liability of approximately $16 million generated by shortfalls in PERS. The District elected to fund this liability through the sale of bonds at historically low market rates.
FY 2019 FY 2020 FY 2021 RESOURCE OR REQUIREMENTS OBJECT FY 2022 FY 2022 FY 2022ACTUAL ACTUAL REVISED BUDGET CATEGORY CODE PROPOSED APPROVED ADOPTED
RESOURCES:$1,534,700 $1,597,100 $1,664,800 Transfer from Fund 101 49101 $1,731,800
25,725 13,811 12,300 Interest on Investments 44020 10,200600,343 626,140 626,100 Beginning Balance 31100 643,894
0 (4,757) 0 Restatement 0600,343 621,383 626,100 Beginning Balance, as restated 643,894
$2,160,768 $2,232,294 $2,303,200 TOTAL RESOURCES $2,385,894 $0 $0
REQUIREMENTS:Series 2004 Revenue Pension Bond
$770,472 $870,000 $990,000 Principal 56100 $1,125,000764,156 728,900 676,600 Interest 56105 617,100
0 0 75,000 Contingency 58100 75,000626,140 633,394 561,600 Ending Fund Balance 31100 568,794
$2,160,768 $2,232,294 $2,303,200 TOTAL REQUIREMENTS $2,385,894 $0 $0
FUND114▼ Revenue Pension Bond Fund


CLEAN WATER SERVICES • FY 2021-22 PROPOSED BUDGET PAGE 119
Business Services
The Business Services Department (BSD) is composed of the administrative programs that support District operations and services provided to customers — Office of the Chief Executive Officer, Legal Services, Government Affairs, Communications & Community Engagement, Human Resources, Risk & Insurance Management, Business Strategy & Performance Management, Digital Solutions, Finance & Accounting, and Research & Innovation. Two new programs are being added in FY 2021-22: Financial Strategy & Performance Management and Business

CLEAN WATER SERVICES • FY 2021-22 PROPOSED BUDGET PAGE 120
Opportunities & Operations.
Business Services is committed to preventing and slowing the spread of the coronavirus and implemented a variety of strategies to protect our employees and their families and to ensure the District continues to provide essential lifeline services to our customers. Staff works remotely as much as is appropriate, taking advantage of virtual resources to conduct business. Other onsite staff are on staggered shifts when appropriate to reduce employee overlap.
The FY 2021-22 budget includes an additional 12 FTE as compared to the FY 2020-21 revised budget. Six FTEs are new positions, eight are transfers from other departments to support operational structure changes; two FTE are transferring out of BSD to other departments. Five new positions in Digital Solutions, Research & Innovation, Business Opportunities & Operations, and Communications & Community Engagement are conversions of temporary positions where the workload has proven to be sustained and long-term. The other new position is for a paralegal in the Legal program to fill a need created by the transfer of an existing FTE into the new Business Opportunities & Operations program. The outgoing FTE include a transfer from Digital Solutions into Regulatory Affairs Administration and a transfer from Office of the CEO into the new Regional Utilities Services Department.
Office of the Chief Executive Officer The Office of the CEO program is responsible for developing strategy initiatives and performance measurements as well as implementing the policy direction provided by the Board of Directors and advisory input from the Clean Water Services Advisory Commission. The office of the CEO is also responsible for overall management of District operations, intergovernmental coordination with co-implementer cities, Washington County and other jurisdictions, as well as the strategic administration of Integrated Planning and Performance Excellence.
Legal Services Clean Water Services is provided legal advice by its in-house legal department regarding the complex and dynamic legal, regulatory and business matters related to wastewater treatment, stormwater management, watershed enhancement and general water resource recovery issues. Legal Services provides proactive and practical advice to other departments and divisions to assist their business needs while protecting the legal interests of the District. Members of the Legal department draft a variety of documents including contracts, easements, ordinances and intergovernmental agreements
CLEAN WATER SERVICES • FY 2021-22 PROPOSED BUDGET PAGE 121
and answer questions about the purchasing rules, procurements, contracts, real property, environmental and municipal law, construction disputes, permits, and other legal matters. The General Counsel retains and manages outside legal counsel on complex issues or litigation when needed.
Government AffairsThe Government Affairs program manages local, state and federal government relations and legislative affairs; serves as a liaison with District departments and programs; and coordinates administrative functions for the District administrative office, the Board of Directors and the Clean Water Services Advisory Commission.
Communications & Community EngagementThe Communications & Community Engagement program is responsible for communications, marketing, education and public involvement to build awareness, support and credibility with the general public, environmental groups, business community, media, volunteers, academia, employees and key opinion leaders. Staff engages audiences in capital projects, facility expansions and major District initiatives; builds transformational partnerships with the education community and key watershed stakeholder groups, coordinates organization development and culture, and manages the District’s corporate communications, employee engagement, equity, public involvement and student education strategies.
Human Resources The Human Resources program is responsible for planning, developing and implementing employee processes and programs that allow Clean Water Services to remain efficient and innovative while promoting collaboration, continuous learning and employee well-being. Responsibilities include benefits and wellness; employee relations management; recruitment, selection and onboarding; diversity, equity and inclusion; classification and compensation; labor relations to include contract interpretation and dispute resolution; employee training and development; performance evaluations; reporting and analytics; administration of human resources policies and procedures; and District compliance with state and federal employment laws.
Risk & Insurance Management The Risk & Insurance Management program serves to support the strategic objectives of Clean Water Services by bringing a systematic and principled approach to identifying, analyzing, mitigating and preventing risk at all organizational levels. This is

CLEAN WATER SERVICES • FY 2021-22 PROPOSED BUDGET PAGE 122
accomplished through risk identification, evaluation and control, aimed to reduce the frequency and severity of adverse events to the District. Focus areas include loss prevention and employee safety programs, risk financing through commercial and self-insurance programs, emergency management, claims management, and management of the District’s captive, Clean Water Insurance Company, LLC.
Business Strategy & Performance Management This program manages and promotes the Performance Excellence, Business Strategy, Roadmap, Knowledge and Performance Management, and Goal Sharing programs to drive forward the District’s mission, vision and values. These program elements are essential to measuring performance and business improvement to ensure delivery of the District’s Strategic Plan.
Digital Solutions The Digital Solutions program develops and manages the District’s software and hardware infrastructure, data analytics and data visualizations systems, Geographic Information System mapping and business intelligence systems. These systems store and manage

CLEAN WATER SERVICES • FY 2021-22 PROPOSED BUDGET PAGE 123
data, which is an asset to the entire District. In addition, these systems transform data into decision support systems for operation optimization, asset management, stormwater and watershed management, customer support, and research and innovation. The Digital Solutions program develops and implements best practices to protect the District’s digital infrastructure and reduce vulnerabilities.
Finance & Accounting The Finance & Accounting program is responsible for strategic financial planning and direction, and financial accounting and reporting. Finance & Accounting provides services related to external financial reporting through the Annual Financial Report, general ledger accounting, internal financial reporting, accounts payable and receivable, payroll, and utility billing and collections. This group manages budget planning, development and administration; capital improvement program development and project accounting; and bond issuance and debt management. This group works closely with the Financial Strategy & Performance Management team in cost of services analysis, rate and fee setting, and financial forecasting.
Financial Strategy & Performance Management This program develops the strategic financial modeling and forecasting, cost of services analysis, rate and fee setting, cost and overhead allocations, and financial performance metrics and dashboards. An integral component of this program is to coordinate with the District’s partners to drive transparency and understanding of the District long-term financial strategy and performance for cost allocation, rate and fee setting, and cost of services.
Business Opportunities & Operations The Business Opportunities & Operations program includes managing the procurement function for the District, which includes purchasing and contracting for goods, services and construction. Procurement responsibilities include assisting District staff in conducting competitive purchasing and contracting processes and developing and ensuring compliance with District purchasing policies. The program also includes identifying and pursuing District business opportunities, including internal opportunities to improve business processes and programs and external opportunities to advance the District’s business interests.

CLEAN WATER SERVICES • FY 2021-22 PROPOSED BUDGET PAGE 124
Research & InnovationThe Research & Innovation program promotes improved technologies and processes to maintain and improve the water quality of the Tualatin River Watershed. The R&I program seeks to optimize plant and restoration operations, develop and adopt new innovative technologies, verify operational data for purchase or design of new technologies and improve regulatory compliance.

CLEAN WATER SERVICES • FY 2021-22 PROPOSED BUDGET PAGE 125
CWS Department Expenditure SummaryBudget Year: 2022
OBJECT CODE FY 2019 ACTUAL FY 2020 ACTUAL FY 2021 REVISED BUDGET
FY 2022 PROPOSED BUDGET
Change from FY21 Budget
51100 5,193,756 5,842,427 8,189,400 9,704,200
51130 317,466 516,270 977,400 513,700
51140 47,871 24,986 5,000 5,000
51600 1,871,219 2,161,758 3,077,300 3,855,200
51761 158 0 0 0
51900 0 0 800 800
51910 11,160 11,160 11,100 11,100
51915 23,655 25,748 25,000 29,600
7,465,285 8,582,349 12,286,000 14,119,600 14.9%
52110 140,348 0 0 0
52120 16,768 0 0 0
52125 0 0 0 0
52130 53,568 0 0 0
52140 5,592 0 0 0
52150 5,896 0 0 0
52160 2,020 0 0 0
52170 17,356 0 0 0
52205 593,248 148,516 389,000 146,500
52215 56,110 0 0 0
52220 50,000 50,000 51,500 53,000
52240 611,113 513,075 905,700 1,240,300
52270 1,537,972 1,669,344 1,815,200 1,368,900
52305 14,043 13,967 20,300 21,800
52310 5,639 10,183 36,100 41,100
52315 33 0 0 0
52320 11,274 0 0 0
52325 0 38 2,000 92,000
52330 493 57 0 0
52335 39,904 631 0 0
52350 34,978 39,956 8,900 13,900
52360 745 3,299 3,900 3,900
52375 856 1,861 2,700 3,200
52380 1,242 7,475 0 500
52385 47,781 100,795 19,000 35,000
52405 99,592 179,460 137,500 237,100
52410 52,662 78,247 88,100 89,000
52420 23,387 22,622 27,000 27,000
52425 679,033 766,246 830,400 1,289,000
52430 5,169 2,036 9,300 9,300
52435 56,718 61,812 55,700 56,700
52440 2,809 2,006 0 0
52445 221,253 185,115 235,000 260,000
52475 2,274 162 500 500
52480 67,523 52,951 62,600 67,600
52485 75,114 71,100 59,300 63,300
52486 4,613 260 800 800
52487 7,886 4,491 9,700 16,200
52495 141,895 305,268 300,400 313,400
52500 2,051 425 0 0
52515 8,236 8,923 10,000 10,000
52550 2,938 2,938 5,000 5,000
52605 2,361 72 0 0
52610 284,596 57,502 140,000 140,000
52620 5,579 0 0 0
52630 450 79 0 0
52705 1,366,698 1,760,774 2,138,000 3,192,000
6,359,814 6,121,683 7,363,600 8,797,000 19.5%
13,825,100 14,704,032 19,649,600 22,916,600 16.6%TOTAL EXPENDITURE
MATERIALS & SERVICES SUBTOTAL
Insurance
Repair & Maintenance Services
Non-vehicle Equipment Repair & Maintenance
Computer Repair & Maintenance
Bond Trustee Fees
Equipment Rental
Bank Service Charge
Other Materials & Services
Permits, Licenses & Fees
Travel Expense
Fleet Charges
Private Mileage
Fueling Contract
Training & Education
Telecom Internal
Telephone Services
Software Licenses & Support
Publication Notices
Printing
Dues & Memberships
Books, Subscriptions & Publications
Tri-Met Subsidy
Software Expensed
Computer Equipment Expensed
Small Tools
Safety Equipment
Postage & Freight
Repair & Maintenance Supplies
Construction & Building Supplies
Gas, Oil, Lubrication
Janitorial Supplies
Tech & Scientific Supplies
Other Government Services
Office Supplies
Operating Supplies
Professional Services
Landscape Services
Audit & Accounting Services
Sewer Charges
Contracted Services
Garbage
Surface Water Management Charge
Other Utility Services
Water
Purchased Water
Natural Gas
Mobile Computing Allowance
PERSONNEL EXPENSE SUBTOTAL
Electricity
Tuition Reimbursement
Other Employee Allowances
Auto Allowance
Other Personnel Expenses
Wages & Other Pay
Temporary
Business Services Department
OBJECT CODE DESCRIPTION
Overtime
BUSINESSSERVICES▼ Department Summary
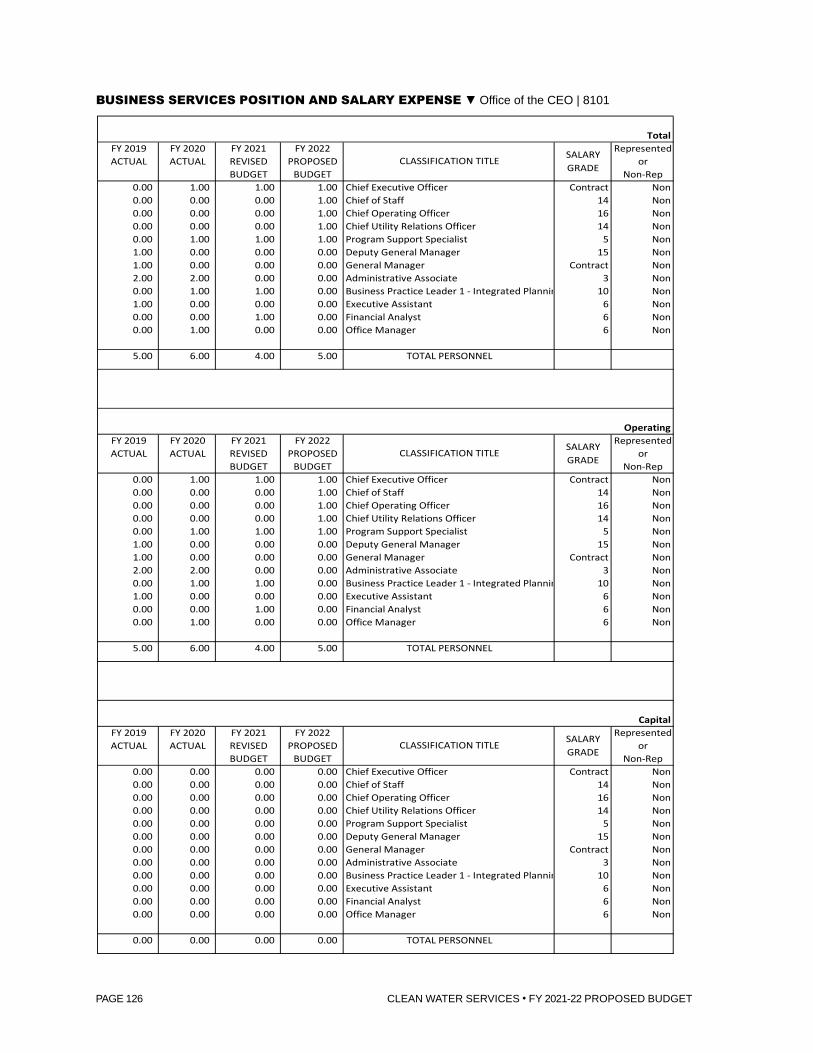
CLEAN WATER SERVICES • FY 2021-22 PROPOSED BUDGET PAGE 126
BUSINESS SERVICES DEPARTMENTPOSITION AND SALARY EXPENSE OFFICE OF THE CEO 8101
TotalFY 2019 FY 2020 FY 2021 FY 2022 RepresentedACTUAL ACTUAL REVISED PROPOSED or
BUDGET BUDGET Non-Rep0.00 1.00 1.00 1.00 Chief Executive Officer Contract Non0.00 0.00 0.00 1.00 Chief of Staff 14 Non0.00 0.00 0.00 1.00 Chief Operating Officer 16 Non0.00 0.00 0.00 1.00 Chief Utility Relations Officer 14 Non0.00 1.00 1.00 1.00 Program Support Specialist 5 Non1.00 0.00 0.00 0.00 Deputy General Manager 15 Non1.00 0.00 0.00 0.00 General Manager Contract Non2.00 2.00 0.00 0.00 Administrative Associate 3 Non0.00 1.00 1.00 0.00 Business Practice Leader 1 - Integrated Planning 10 Non1.00 0.00 0.00 0.00 Executive Assistant 6 Non0.00 0.00 1.00 0.00 Financial Analyst 6 Non0.00 1.00 0.00 0.00 Office Manager 6 Non
5.00 6.00 4.00 5.00 TOTAL PERSONNEL
OperatingFY 2019 FY 2020 FY 2021 FY 2022 RepresentedACTUAL ACTUAL REVISED PROPOSED or
BUDGET BUDGET Non-Rep0.00 1.00 1.00 1.00 Chief Executive Officer Contract Non0.00 0.00 0.00 1.00 Chief of Staff 14 Non0.00 0.00 0.00 1.00 Chief Operating Officer 16 Non0.00 0.00 0.00 1.00 Chief Utility Relations Officer 14 Non0.00 1.00 1.00 1.00 Program Support Specialist 5 Non1.00 0.00 0.00 0.00 Deputy General Manager 15 Non1.00 0.00 0.00 0.00 General Manager Contract Non2.00 2.00 0.00 0.00 Administrative Associate 3 Non0.00 1.00 1.00 0.00 Business Practice Leader 1 - Integrated Planning 10 Non1.00 0.00 0.00 0.00 Executive Assistant 6 Non0.00 0.00 1.00 0.00 Financial Analyst 6 Non0.00 1.00 0.00 0.00 Office Manager 6 Non
5.00 6.00 4.00 5.00 TOTAL PERSONNEL
CapitalFY 2019 FY 2020 FY 2021 FY 2022 RepresentedACTUAL ACTUAL REVISED PROPOSED or
BUDGET BUDGET Non-Rep0.00 0.00 0.00 0.00 Chief Executive Officer Contract Non0.00 0.00 0.00 0.00 Chief of Staff 14 Non0.00 0.00 0.00 0.00 Chief Operating Officer 16 Non0.00 0.00 0.00 0.00 Chief Utility Relations Officer 14 Non0.00 0.00 0.00 0.00 Program Support Specialist 5 Non0.00 0.00 0.00 0.00 Deputy General Manager 15 Non0.00 0.00 0.00 0.00 General Manager Contract Non0.00 0.00 0.00 0.00 Administrative Associate 3 Non0.00 0.00 0.00 0.00 Business Practice Leader 1 - Integrated Planning 10 Non0.00 0.00 0.00 0.00 Executive Assistant 6 Non0.00 0.00 0.00 0.00 Financial Analyst 6 Non0.00 0.00 0.00 0.00 Office Manager 6 Non
0.00 0.00 0.00 0.00 TOTAL PERSONNEL
CLASSIFICATION TITLE
CLASSIFICATION TITLE
CLASSIFICATION TITLE
SALARY GRADE
SALARY GRADE
SALARY GRADE
BUSINESSSERVICESPOSITIONANDSALARYEXPENSE▼ Office of the CEO | 8101

CLEAN WATER SERVICES • FY 2021-22 PROPOSED BUDGET PAGE 127
FY 2020 ACTUAL
FY 2021 REVISED BUDGET OBJECT CODE DESCRIPTION OBJECT
CODEFY 2022
PROPOSEDFY 2022
APPROVEDFY 2022
ADOPTED636,216 507,600 Wages & Other Pay 51100 1,003,600
122,177 100,000 Temporary 51130 0
788 0 Overtime 51140 0
224,119 187,700 Other Personnel Expenses 51600 334,300
0 0 Tuition Reimbursement 51761 0
0 0 Other Employee Allowances 51900 200
3,720 3,700 Auto Allowance 51910 7,400
3,775 1,600 Mobile Computing Allowance 51915 1,600
990,794 800,600 1,347,100
0 0 Electricity 52110 0
0 0 Water 52120 0
0 0 Purchased Water 52125 0
0 0 Natural Gas 52130 0
0 0 Garbage 52140 0
0 0 Surface Water Management Charge 52150 0
0 0 Other Utility Services 52160 0
0 0 Sewer Charges 52170 0
14,004 100,000 Contracted Services 52205 0
0 0 Landscape Services 52215 0
0 0 Audit & Accounting Services 52220 0
30,657 15,000 Professional Services 52240 100,000
503,890 0 Other Government Services 52270 0
10,227 1,500 Office Supplies 52305 1,500
808 2,000 Operating Supplies 52310 5,000
0 0 Gas, Oil, Lubrication 52315 0
0 0 Janitorial Supplies 52320 0
0 0 Tech & Scientific Supplies 52325 0
0 0 Repair & Maintenance Supplies 52330 0
0 0 Construction & Building Supplies 52335 0
658 0 Small Tools 52350 0
0 0 Safety Equipment 52360 0
82 0 Postage & Freight 52375 0
0 0 Software Expensed 52380 0
434 5,000 Computer Equipment Expensed 52385 5,000
148,284 2,000 Dues & Memberships 52405 5,300
2,869 2,500 Books, Subscriptions & Publications 52410 2,500
0 0 Tri-Met Subsidy 52420 0
0 0 Software Licenses & Support 52425 0
0 0 Publication Notices 52430 0
103 0 Printing 52435 0
0 0 Telecom Internal 52440 0
0 0 Telephone Services 52445 0
0 0 Fueling Contract 52475 0
10,073 3,500 Training & Education 52480 5,600
18,422 12,500 Travel Expense 52485 16,000
0 0 Fleet Charges 52486 0
169 900 Private Mileage 52487 900
21,186 12,000 Other Materials & Services 52495 12,000
0 0 Permits, Licenses & Fees 52500 0
0 0 Bank Service Charge 52515 0
0 0 Franchise Fees 52530 0
0 0 Payment Adjustment to Cities 52540 0
0 0 Bond Trustee Fees 52550 0
0 0 Equipment Rental 52605 0
0 0 Repair & Maintenance Services 52610 0
0 0 Non-vehicle Equipment Repair & Maintenance 52620 0
0 0 Computer Repair & Maintenance 52630 0
0 0 Insurance 52705 0
761,865 156,900 153,800
1,752,660 957,500 1,500,9001,429,861 TOTAL EXPENDITURE
666,498 MATERIALS & SERVICES SUBTOTAL
0
0
0
0
0
0
0
0
0
0
11,319
11,500
0
862
18,126
0
0
0
2,025
0
10
0
65
79
0
3,271
62,468
0
160
2,107
0
1,562
4,115
0
0
0
23,717
490,529
0
34,582
0
0
0
0
0
0
0
3,180
763,363 PERSONNEL EXPENSE SUBTOTAL
0
0
Business Services Department
Expenditure Summary 8101 - Office of the CEO
174,380
0
0
3,720
FY 2019 ACTUAL
523,871
48,330
9,882
BUSINESSSERVICESEXPENDITURESUMMARY▼ Office of the CEO | 8101

CLEAN WATER SERVICES • FY 2021-22 PROPOSED BUDGET PAGE 128
BUSINESS SERVICES DEPARTMENTPOSITION AND SALARY EXPENSE LEGAL SERVICES 8102
TotalFY 2019 FY 2020 FY 2021 FY 2022 RepresentedACTUAL ACTUAL REVISED PROPOSED or
BUDGET BUDGET Non-Rep1.00 1.00 1.00 0.00 Contracts Coordinator 6 Non1.00 1.00 1.00 1.00 General Counsel 13 Non0.00 0.00 0.00 1.00 Paralegal 9 Non1.00 1.00 1.00 1.00 Senior Assistant Legal Counsel 11 Non
3.00 3.00 3.00 3.00 TOTAL PERSONNEL
OperatingFY 2019 FY 2020 FY 2021 FY 2022 RepresentedACTUAL ACTUAL REVISED PROPOSED or
BUDGET BUDGET Non-Rep1.00 1.00 1.00 0.00 Contracts Coordinator 6 Non1.00 1.00 1.00 1.00 General Counsel 13 Non0.00 0.00 0.00 1.00 Paralegal 9 Non1.00 1.00 1.00 1.00 Senior Assistant Legal Counsel 11 Non
3.00 3.00 3.00 3.00 TOTAL PERSONNEL
CapitalFY 2019 FY 2020 FY 2021 FY 2022 RepresentedACTUAL ACTUAL REVISED PROPOSED or
BUDGET BUDGET Non-Rep0.00 0.00 0.00 0.00 Contracts Coordinator 6 Non0.00 0.00 0.00 0.00 General Counsel 13 Non0.00 0.00 0.00 0.00 Paralegal 9 Non0.00 0.00 0.00 0.00 Senior Assistant Legal Counsel 11 Non
0.00 0.00 0.00 0.00 TOTAL PERSONNEL
CLASSIFICATION TITLE SALARY GRADE
CLASSIFICATION TITLE SALARY GRADE
CLASSIFICATION TITLE SALARY GRADE
BUSINESSSERVICESPOSITIONANDSALARYEXPENSE▼ Legal Services | 8102

CLEAN WATER SERVICES • FY 2021-22 PROPOSED BUDGET PAGE 129
FY 2020 ACTUAL
FY 2021 REVISED BUDGET OBJECT CODE DESCRIPTION OBJECT
CODEFY 2022
PROPOSEDFY 2022
APPROVEDFY 2022
ADOPTED461,075 466,000 Wages & Other Pay 51100 489,500
27,921 25,000 Temporary 51130 25,000
0 0 Overtime 51140 0
161,288 166,700 Other Personnel Expenses 51600 178,600
0 0 Tuition Reimbursement 51761 0
0 0 Other Employee Allowances 51900 0
3,720 3,700 Auto Allowance 51910 3,700
840 800 Mobile Computing Allowance 51915 800
654,844 662,200 697,600
0 0 Electricity 52110 0
0 0 Water 52120 0
0 0 Purchased Water 52125 0
0 0 Natural Gas 52130 0
0 0 Garbage 52140 0
0 0 Surface Water Management Charge 52150 0
0 0 Other Utility Services 52160 0
0 0 Sewer Charges 52170 0
0 22,000 Contracted Services 52205 22,000
0 0 Landscape Services 52215 0
0 0 Audit & Accounting Services 52220 0
30,318 40,000 Professional Services 52240 50,000
0 4,100 Other Government Services 52270 4,100
194 300 Office Supplies 52305 300
9 0 Operating Supplies 52310 0
0 0 Gas, Oil, Lubrication 52315 0
0 0 Janitorial Supplies 52320 0
0 0 Tech & Scientific Supplies 52325 0
0 0 Repair & Maintenance Supplies 52330 0
0 0 Construction & Building Supplies 52335 0
0 0 Small Tools 52350 0
0 0 Safety Equipment 52360 0
116 0 Postage & Freight 52375 0
0 0 Software Expensed 52380 0
2,087 0 Computer Equipment Expensed 52385 0
1,391 1,500 Dues & Memberships 52405 1,500
1,095 1,500 Books, Subscriptions & Publications 52410 1,500
0 0 Tri-Met Subsidy 52420 0
2,000 0 Software Licenses & Support 52425 0
58 0 Publication Notices 52430 0
0 0 Printing 52435 0
0 0 Telecom Internal 52440 0
0 0 Telephone Services 52445 0
0 0 Fueling Contract 52475 0
1,690 3,300 Training & Education 52480 3,300
77 2,000 Travel Expense 52485 2,000
0 0 Fleet Charges 52486 0
105 1,000 Private Mileage 52487 1,000
563 500 Other Materials & Services 52495 500
0 0 Permits, Licenses & Fees 52500 0
0 0 Bank Service Charge 52515 0
0 0 Franchise Fees 52530 0
0 0 Payment Adjustment to Cities 52540 0
0 0 Bond Trustee Fees 52550 0
0 0 Equipment Rental 52605 0
0 0 Repair & Maintenance Services 52610 0
0 0 Non-vehicle Equipment Repair & Maintenance 52620 0
0 0 Computer Repair & Maintenance 52630 0
0 0 Insurance 52705 0
39,702 76,200 86,200
694,546 738,400 783,800661,238 TOTAL EXPENDITURE
34,012 MATERIALS & SERVICES SUBTOTAL
0
0
0
0
0
0
0
0
0
0
4,103
5,663
0
553
126
0
0
0
0
0
224
659
0
45
0
1,714
2,104
0
0
276
0
175
0
0
0
0
8,259
0
0
10,112
0
0
0
0
0
0
0
805
627,226 PERSONNEL EXPENSE SUBTOTAL
0
0
Business Services Department
Expenditure Summary 8102 - Legal Services
157,674
0
0
3,720
FY 2019 ACTUAL
443,017
21,558
451
BUSINESSSERVICESEXPENDITURESUMMARY▼ Legal Services | 8102

CLEAN WATER SERVICES • FY 2021-22 PROPOSED BUDGET PAGE 130
BUSINESS SERVICES DEPARTMENTPOSITION AND SALARY EXPENSE GOVERNMENT AFFAIRS 8110
TotalFY 2019 FY 2020 FY 2021 FY 2022 RepresentedACTUAL ACTUAL REVISED PROPOSED or
BUDGET BUDGET Non-Rep0.00 0.00 1.00 0.00 Chief of Staff 14 Non0.00 0.00 1.00 1.00 Administrative Associate 3 Non1.00 1.00 0.00 0.00 Graphics Specialist 5 Non0.00 0.85 0.00 0.00 Government & Public Affairs Director 12 Non1.00 0.15 0.00 0.00 Government & Public Affairs Manager 11 Non0.00 0.00 1.00 1.00 Office Manager 6 Non0.00 1.00 0.00 0.00 Policy Analyst 6 Non1.00 2.00 0.00 0.00 Public Affairs Specialist 5 Non1.00 1.00 0.00 0.00 Public Involvement Coordinator 7 Non2.00 2.00 0.00 0.00 Sr Public Affairs Specialist 6 Non0.00 0.00 1.00 1.00 Sr Policy Analyst 8 Non0.00 0.00 1.00 1.00 Technical Editor & Communications Specialist 5 Non1.00 1.00 0.00 0.00 Communications Supervisor 7 Non0.00 1.00 0.00 0.00 Communications & Marketing Manager 8 Non
7.00 10.00 5.00 4.00 TOTAL PERSONNEL
OperatingFY 2019 FY 2020 FY 2021 FY 2022 RepresentedACTUAL ACTUAL REVISED PROPOSED or
BUDGET BUDGET Non-Rep0.00 0.00 1.00 0.00 Chief of Staff 14 Non0.00 0.00 1.00 1.00 Administrative Associate 3 Non1.00 1.00 0.00 0.00 Graphics Specialist 5 Non0.00 0.85 0.00 0.00 Government & Public Affairs Director 12 Non0.85 0.00 0.00 0.00 Government & Public Affairs Manager 11 Non0.00 0.00 1.00 1.00 Office Manager 6 Non0.00 1.00 0.00 0.00 Policy Analyst 6 Non1.00 2.00 0.00 0.00 Public Affairs Specialist 5 Non0.60 0.60 0.00 0.00 Public Involvement Coordinator 7 Non2.00 2.00 0.00 0.00 Sr Public Affairs Specialist 6 Non0.00 0.00 1.00 1.00 Sr Policy Analyst 8 Non0.00 0.00 1.00 1.00 Technical Editor & Communications Specialist 5 Non1.00 1.00 0.00 0.00 Communications Supervisor 7 Non0.00 1.00 0.00 0.00 Communications & Marketing Manager 8 Non
6.45 9.45 5.00 4.00 TOTAL PERSONNEL
CapitalFY 2019 FY 2020 FY 2019 FY 2022 RepresentedACTUAL ACTUAL REVISED PROPOSED or
BUDGET BUDGET Non-Rep0.00 0.00 0.00 0.00 Chief of Staff 14 Non0.00 0.00 0.00 0.00 Administrative Associate 3 Non0.00 0.00 0.00 0.00 Graphics Specialist 5 Non0.00 0.00 0.00 0.00 Government & Public Affairs Director 12 Non0.15 0.15 0.00 0.00 Government & Public Affairs Manager 11 Non0.00 0.00 0.00 0.00 Office Manager 6 Non0.00 0.00 0.00 0.00 Policy Analyst 6 Non0.00 0.00 0.00 0.00 Public Affairs Specialist 5 Non0.40 0.40 0.00 0.00 Public Involvement Coordinator 7 Non0.00 0.00 0.00 0.00 Sr Public Affairs Specialist 6 Non0.00 0.00 0.00 0.00 Sr Policy Analyst 8 Non0.00 0.00 0.00 0.00 Technical Editor & Communications Specialist 5 Non0.00 0.00 0.00 0.00 Communications Supervisor 7 Non0.00 0.00 0.00 0.00 Communications & Marketing Manager 8 Non
0.55 0.55 0.00 0.00 TOTAL PERSONNEL
CLASSIFICATION TITLE SALARY GRADE
CLASSIFICATION TITLE SALARY GRADE
CLASSIFICATION TITLE SALARY GRADE
BUSINESSSERVICESPOSITIONANDSALARYEXPENSE▼ Government Affairs | 8110

CLEAN WATER SERVICES • FY 2021-22 PROPOSED BUDGET PAGE 131
FY 2020 ACTUAL
FY 2021 REVISED BUDGET OBJECT CODE DESCRIPTION OBJECT
CODEFY 2022
PROPOSEDFY 2022
APPROVEDFY 2022
ADOPTED763,588 523,100 Wages & Other Pay 51100 362,200
93,341 119,000 Temporary 51130 0
2,225 2,000 Overtime 51140 2,000
312,071 212,700 Other Personnel Expenses 51600 172,000
0 0 Tuition Reimbursement 51761 0
0 0 Other Employee Allowances 51900 0
0 0 Auto Allowance 51910 0
5,670 1,600 Mobile Computing Allowance 51915 800
1,176,896 858,400 537,000
0 0 Electricity 52110 0
0 0 Water 52120 0
0 0 Purchased Water 52125 0
0 0 Natural Gas 52130 0
0 0 Garbage 52140 0
0 0 Surface Water Management Charge 52150 0
0 0 Other Utility Services 52160 0
0 0 Sewer Charges 52170 0
0 15,000 Contracted Services 52205 6,500
0 0 Landscape Services 52215 0
0 0 Audit & Accounting Services 52220 0
274,927 45,000 Professional Services 52240 20,000
37,878 600,000 Other Government Services 52270 149,800
1,090 12,500 Office Supplies 52305 12,500
36 10,500 Operating Supplies 52310 10,500
0 0 Gas, Oil, Lubrication 52315 0
0 0 Janitorial Supplies 52320 0
0 0 Tech & Scientific Supplies 52325 0
0 0 Repair & Maintenance Supplies 52330 0
0 0 Construction & Building Supplies 52335 0
150 500 Small Tools 52350 500
0 0 Safety Equipment 52360 0
533 400 Postage & Freight 52375 400
0 0 Software Expensed 52380 0
2,087 0 Computer Equipment Expensed 52385 0
14,633 100,000 Dues & Memberships 52405 181,000
1,146 1,000 Books, Subscriptions & Publications 52410 400
0 0 Tri-Met Subsidy 52420 0
1,072 1,300 Software Licenses & Support 52425 1,300
0 400 Publication Notices 52430 400
57,043 1,500 Printing 52435 1,500
0 0 Telecom Internal 52440 0
0 0 Telephone Services 52445 0
162 0 Fueling Contract 52475 0
9,925 4,100 Training & Education 52480 2,000
10,765 7,000 Travel Expense 52485 3,500
260 0 Fleet Charges 52486 0
1,221 1,000 Private Mileage 52487 1,000
259,845 10,000 Other Materials & Services 52495 45,000
275 0 Permits, Licenses & Fees 52500 0
0 0 Bank Service Charge 52515 0
0 0 Franchise Fees 52530 0
0 0 Payment Adjustment to Cities 52540 0
0 0 Bond Trustee Fees 52550 0
0 0 Equipment Rental 52605 0
0 0 Repair & Maintenance Services 52610 0
0 0 Non-vehicle Equipment Repair & Maintenance 52620 0
30 0 Computer Repair & Maintenance 52630 0
0 0 Insurance 52705 0
673,078 810,200 436,300
1,849,974 1,668,600 973,3001,553,911 TOTAL EXPENDITURE
590,690 MATERIALS & SERVICES SUBTOTAL
0
0
0
0
0
0
0
1,287
0
0
8,064
21,735
1,678
1,389
108,139
0
0
125
1,255
0
422
41
50,939
142
623
6,892
15,461
0
0
920
0
2,183
254
33
0
0
335,470
31,039
0
2,599
0
0
0
0
0
0
0
5,167
963,221 PERSONNEL EXPENSE SUBTOTAL
0
0
Business Services Department
Expenditure Summary 8110 - Government Affairs
245,761
0
0
0
FY 2019 ACTUAL
637,452
71,661
3,180
BUSINESSSERVICESEXPENDITURESUMMARY▼ Government Affairs | 8110

CLEAN WATER SERVICES • FY 2021-22 PROPOSED BUDGET PAGE 132
BUSINESS SERVICES DEPARTMENTPOSITION AND SALARY EXPENSE 8112
TotalFY 2019 FY 2020 FY 2021 FY 2022 RepresentedACTUAL ACTUAL REVISED PROPOSED or
BUDGET BUDGET Non-Rep0.00 0.00 1.00 1.00 Communications & Marketing Manager 8 Non0.00 0.00 2.00 2.00 Graphics Specialist 5 Non0.00 0.00 0.00 1.00 Program Support Specialist 5 Non0.00 0.00 1.00 1.00 Public Affairs Manager 10 Non0.00 0.00 2.00 2.00 Public Affairs Specialist 5 Non0.00 0.00 2.00 2.00 Public Involvement Coordinator 7 Non0.00 0.00 2.00 2.00 Sr Public Affairs Specialist 6 Non0.00 0.00 0.00 1.00 Volunteer & Education Specialist 5 Non
0.00 0.00 10.00 12.00 TOTAL PERSONNEL
OperatingFY 2019 FY 2020 FY 2021 FY 2022 RepresentedACTUAL ACTUAL REVISED PROPOSED or
BUDGET BUDGET Non-Rep0.00 0.00 1.00 1.00 Communications & Marketing Manager 8 Non0.00 0.00 2.00 2.00 Graphics Specialist 5 Non0.00 0.00 0.00 1.00 Program Support Specialist 5 Non0.00 0.00 1.00 1.00 Public Affairs Manager 10 Non0.00 0.00 2.00 2.00 Public Affairs Specialist 5 Non0.00 0.00 1.60 1.60 Public Involvement Coordinator 7 Non0.00 0.00 2.00 2.00 Sr Public Affairs Specialist 6 Non0.00 0.00 0.00 1.00 Volunteer & Education Specialist 5 Non
0.00 0.00 9.60 11.60 TOTAL PERSONNEL
CapitalFY 2019 FY 2020 FY 2019 FY 2022 RepresentedACTUAL ACTUAL REVISED PROPOSED or
BUDGET BUDGET Non-Rep0.00 0.00 0.00 0.00 Communications & Marketing Manager 8 Non0.00 0.00 0.00 0.00 Graphics Specialist 5 Non0.00 0.00 0.00 0.00 Program Support Specialist 5 Non0.00 0.00 0.00 0.00 Public Affairs Manager 10 Non0.00 0.00 0.00 0.00 Public Affairs Specialist 5 Non0.00 0.00 0.40 0.40 Public Involvement Coordinator 7 Non0.00 0.00 0.00 0.00 Sr Public Affairs Specialist 6 Non0.00 0.00 0.00 0.00 Volunteer & Education Specialist 5 Non
0.00 0.00 0.40 0.40 TOTAL PERSONNEL
CLASSIFICATION TITLE SALARY GRADE
COMMUNICATIONS & COMMUNITY ENGAGEMENT
CLASSIFICATION TITLE SALARY GRADE
CLASSIFICATION TITLE SALARY GRADE
POSITIONANDSALARYEXPENSE▼ Communications & Community Engagement | 8112

CLEAN WATER SERVICES • FY 2021-22 PROPOSED BUDGET PAGE 133
FY 2020 ACTUAL
FY 2021 REVISED BUDGET OBJECT CODE DESCRIPTION OBJECT
CODEFY 2022
PROPOSEDFY 2022
APPROVEDFY 2022
ADOPTED0 904,300 Wages & Other Pay 51100 1,146,300
0 150,400 Temporary 51130 129,200
0 2,000 Overtime 51140 2,000
0 360,700 Other Personnel Expenses 51600 471,800
0 0 Tuition Reimbursement 51761 0
0 0 Other Employee Allowances 51900 0
0 0 Auto Allowance 51910 0
0 4,800 Mobile Computing Allowance 51915 5,600
0 1,422,200 1,754,900
0 0 Electricity 52110 0
0 0 Water 52120 0
0 0 Purchased Water 52125 0
0 0 Natural Gas 52130 0
0 0 Garbage 52140 0
0 0 Surface Water Management Charge 52150 0
0 0 Other Utility Services 52160 0
0 0 Sewer Charges 52170 0
0 29,000 Contracted Services 52205 17,000
0 0 Landscape Services 52215 0
0 0 Audit & Accounting Services 52220 0
0 350,700 Professional Services 52240 375,300
0 15,000 Other Government Services 52270 15,000
0 1,000 Office Supplies 52305 1,000
0 1,100 Operating Supplies 52310 1,100
0 0 Gas, Oil, Lubrication 52315 0
0 0 Janitorial Supplies 52320 0
0 0 Tech & Scientific Supplies 52325 0
0 0 Repair & Maintenance Supplies 52330 0
0 0 Construction & Building Supplies 52335 0
0 0 Small Tools 52350 0
0 0 Safety Equipment 52360 0
0 1,000 Postage & Freight 52375 1,000
0 0 Software Expensed 52380 0
0 0 Computer Equipment Expensed 52385 0
0 12,200 Dues & Memberships 52405 2,200
0 2,000 Books, Subscriptions & Publications 52410 2,000
0 0 Tri-Met Subsidy 52420 0
0 10,000 Software Licenses & Support 52425 10,000
0 400 Publication Notices 52430 400
0 47,400 Printing 52435 47,400
0 0 Telecom Internal 52440 0
0 0 Telephone Services 52445 0
0 500 Fueling Contract 52475 500
0 4,400 Training & Education 52480 4,400
0 4,500 Travel Expense 52485 4,500
0 800 Fleet Charges 52486 800
0 1,500 Private Mileage 52487 1,500
0 243,500 Other Materials & Services 52495 216,500
0 0 Permits, Licenses & Fees 52500 0
0 0 Bank Service Charge 52515 0
0 0 Franchise Fees 52530 0
0 0 Payment Adjustment to Cities 52540 0
0 0 Bond Trustee Fees 52550 0
0 0 Equipment Rental 52605 0
0 0 Repair & Maintenance Services 52610 0
0 0 Non-vehicle Equipment Repair & Maintenance 52620 0
0 0 Computer Repair & Maintenance 52630 0
0 0 Insurance 52705 0
0 725,000 700,600
0 2,147,200 2,455,5000 TOTAL EXPENDITURE
0 MATERIALS & SERVICES SUBTOTAL
0
0
0
0
0
0
0
0
0
0
0
0
0
0
0
0
0
0
0
0
0
0
0
0
0
0
0
0
0
0
0
0
0
0
0
0
0
0
0
0
0
0
0
0
0
0
0
0
0 PERSONNEL EXPENSE SUBTOTAL
0
0
Business Services Department
Expenditure Summary 8112 - Communications & Community Engagement
0
0
0
0
FY 2019 ACTUAL
0
0
0
BUSINESSSERVICESEXPENDITURESUMMARY▼ Communications & Community Engagement | 8112
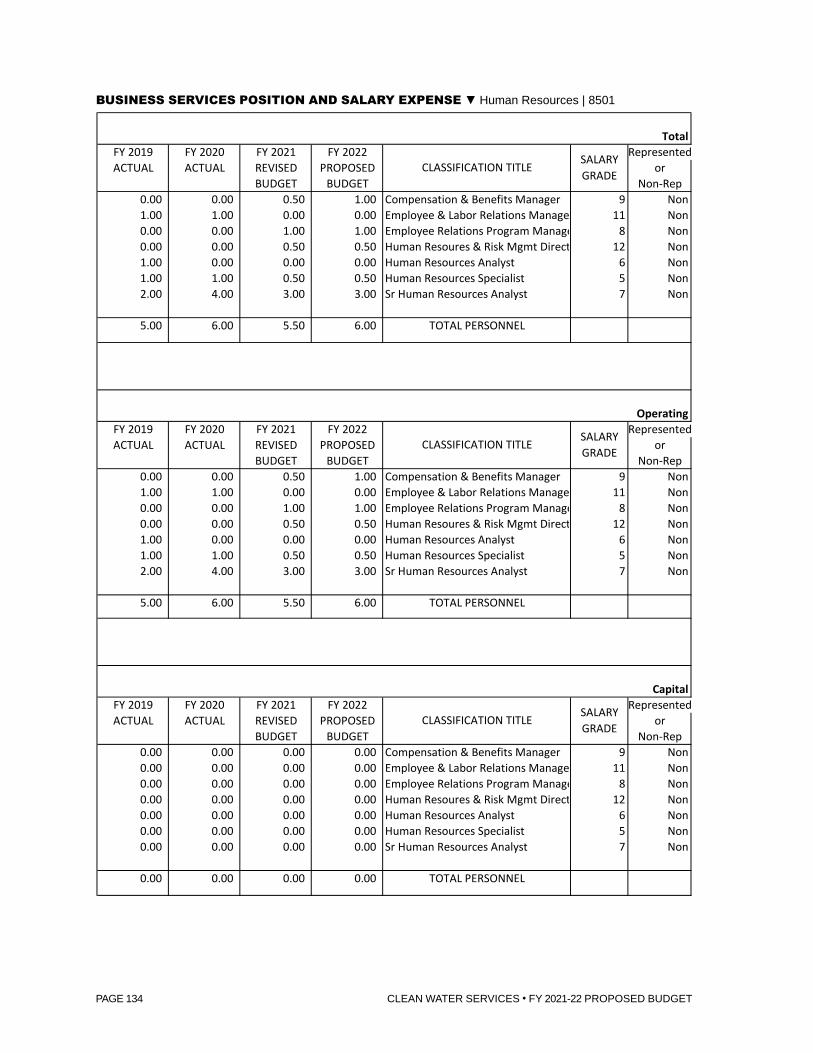
CLEAN WATER SERVICES • FY 2021-22 PROPOSED BUDGET PAGE 134
BUSINESS SERVICES DEPARTMENTPOSITION AND SALARY EXPENSE HUMAN RESOURCES 8501
TotalFY 2019 FY 2020 FY 2021 FY 2022 RepresentedACTUAL ACTUAL REVISED PROPOSED or
BUDGET BUDGET Non-Rep0.00 0.00 0.50 1.00 Compensation & Benefits Manager 9 Non1.00 1.00 0.00 0.00 Employee & Labor Relations Manager 11 Non0.00 0.00 1.00 1.00 Employee Relations Program Manager 8 Non0.00 0.00 0.50 0.50 Human Resoures & Risk Mgmt Director 12 Non1.00 0.00 0.00 0.00 Human Resources Analyst 6 Non1.00 1.00 0.50 0.50 Human Resources Specialist 5 Non2.00 4.00 3.00 3.00 Sr Human Resources Analyst 7 Non
5.00 6.00 5.50 6.00 TOTAL PERSONNEL
OperatingFY 2019 FY 2020 FY 2021 FY 2022 RepresentedACTUAL ACTUAL REVISED PROPOSED or
BUDGET BUDGET Non-Rep0.00 0.00 0.50 1.00 Compensation & Benefits Manager 9 Non1.00 1.00 0.00 0.00 Employee & Labor Relations Manager 11 Non0.00 0.00 1.00 1.00 Employee Relations Program Manager 8 Non0.00 0.00 0.50 0.50 Human Resoures & Risk Mgmt Director 12 Non1.00 0.00 0.00 0.00 Human Resources Analyst 6 Non1.00 1.00 0.50 0.50 Human Resources Specialist 5 Non2.00 4.00 3.00 3.00 Sr Human Resources Analyst 7 Non
5.00 6.00 5.50 6.00 TOTAL PERSONNEL
CapitalFY 2019 FY 2020 FY 2021 FY 2022 RepresentedACTUAL ACTUAL REVISED PROPOSED or
BUDGET BUDGET Non-Rep0.00 0.00 0.00 0.00 Compensation & Benefits Manager 9 Non0.00 0.00 0.00 0.00 Employee & Labor Relations Manager 11 Non0.00 0.00 0.00 0.00 Employee Relations Program Manager 8 Non0.00 0.00 0.00 0.00 Human Resoures & Risk Mgmt Director 12 Non0.00 0.00 0.00 0.00 Human Resources Analyst 6 Non0.00 0.00 0.00 0.00 Human Resources Specialist 5 Non0.00 0.00 0.00 0.00 Sr Human Resources Analyst 7 Non
0.00 0.00 0.00 0.00 TOTAL PERSONNEL
CLASSIFICATION TITLE SALARY GRADE
CLASSIFICATION TITLE SALARY GRADE
CLASSIFICATION TITLE SALARY GRADE
BUSINESSSERVICESPOSITIONANDSALARYEXPENSE▼ Human Resources | 8501

CLEAN WATER SERVICES • FY 2021-22 PROPOSED BUDGET PAGE 135
FY 2020 ACTUAL
FY 2021 REVISED BUDGET OBJECT CODE DESCRIPTION OBJECT
CODEFY 2022
PROPOSEDFY 2022
APPROVEDFY 2022
ADOPTED472,424 617,700 Wages & Other Pay 51100 688,700
51,837 50,000 Temporary 51130 75,000
240 0 Overtime 51140 0
132,705 206,700 Other Personnel Expenses 51600 237,700
0 0 Tuition Reimbursement 51761 0
0 0 Other Employee Allowances 51900 0
0 0 Auto Allowance 51910 0
840 800 Mobile Computing Allowance 51915 400
658,047 875,200 1,001,800
0 0 Electricity 52110 0
0 0 Water 52120 0
0 0 Purchased Water 52125 0
0 0 Natural Gas 52130 0
0 0 Garbage 52140 0
0 0 Surface Water Management Charge 52150 0
0 0 Other Utility Services 52160 0
0 0 Sewer Charges 52170 0
266 0 Contracted Services 52205 600
0 0 Landscape Services 52215 0
0 0 Audit & Accounting Services 52220 0
42,877 130,000 Professional Services 52240 230,000
0 0 Other Government Services 52270 0
182 500 Office Supplies 52305 500
595 0 Operating Supplies 52310 0
0 0 Gas, Oil, Lubrication 52315 0
0 0 Janitorial Supplies 52320 0
0 0 Tech & Scientific Supplies 52325 0
0 0 Repair & Maintenance Supplies 52330 0
0 0 Construction & Building Supplies 52335 0
985 0 Small Tools 52350 0
0 0 Safety Equipment 52360 0
56 0 Postage & Freight 52375 0
0 0 Software Expensed 52380 0
4,608 0 Computer Equipment Expensed 52385 0
1,046 1,100 Dues & Memberships 52405 1,100
400 300 Books, Subscriptions & Publications 52410 300
0 0 Tri-Met Subsidy 52420 27,000
0 0 Software Licenses & Support 52425 0
1,313 3,500 Publication Notices 52430 3,500
47 200 Printing 52435 200
0 0 Telecom Internal 52440 0
0 0 Telephone Services 52445 0
0 0 Fueling Contract 52475 0
6,364 12,500 Training & Education 52480 12,500
2,235 3,500 Travel Expense 52485 3,500
0 0 Fleet Charges 52486 0
608 400 Private Mileage 52487 400
10,280 15,000 Other Materials & Services 52495 15,000
0 0 Permits, Licenses & Fees 52500 0
0 0 Bank Service Charge 52515 0
0 0 Franchise Fees 52530 0
0 0 Payment Adjustment to Cities 52540 0
0 0 Bond Trustee Fees 52550 0
0 0 Equipment Rental 52605 0
0 0 Repair & Maintenance Services 52610 0
0 0 Non-vehicle Equipment Repair & Maintenance 52620 0
0 0 Computer Repair & Maintenance 52630 0
0 0 Insurance 52705 0
71,861 167,000 294,600
729,908 1,042,200 1,296,400783,778 TOTAL EXPENDITURE
134,842 MATERIALS & SERVICES SUBTOTAL
0
0
0
0
0
0
0
0
0
0
2,556
2,660
0
424
9,100
0
0
0
79
0
0
632
0
32
0
0
1,274
0
0
434
0
125
0
0
0
0
117,527
0
0
0
0
0
0
0
0
0
0
805
648,936 PERSONNEL EXPENSE SUBTOTAL
0
0
Business Services Department
Expenditure Summary 8501 - Human Resources
143,720
0
0
0
FY 2019 ACTUAL
486,393
18,018
0
BUSINESSSERVICESEXPENDITURESUMMARY▼ Human Resources | 8501

CLEAN WATER SERVICES • FY 2021-22 PROPOSED BUDGET PAGE 136
BUSINESS SERVICES DEPARTMENTPOSITION AND SALARY EXPENSE RISK & INSURANCE MGMT 8502
TotalFY 2019 FY 2020 FY 2021 FY 2022 RepresentedACTUAL ACTUAL REVISED PROPOSED or
BUDGET BUDGET Non-Rep0.00 0.00 0.50 0.00 Compensation & Benefits Manager 9 Non0.00 0.00 0.50 0.50 Human Resoures & Risk Mgmt Director 12 Non0.00 0.00 0.50 0.50 Human Resources Specialist 5 Non0.00 0.00 0.00 1.00 Operations Analyst 1 6 Non1.00 1.00 0.00 0.00 Risk and Benefits Manager 9 Non1.00 1.00 1.00 1.00 Risk & Safety Analyst 6 Non0.00 1.00 1.00 1.00 Sr Risk Management Analyst 7 Non
2.00 3.00 3.50 4.00
OperatingFY 2019 FY 2020 FY 2021 FY 2022 RepresentedACTUAL ACTUAL REVISED PROPOSED or
BUDGET BUDGET Non-Rep0.00 0.00 0.50 0.00 Compensation & Benefits Manager 9 Non0.00 0.00 0.50 0.50 Human Resoures & Risk Mgmt Director 12 Non0.00 0.00 0.50 0.50 Human Resources Specialist 5 Non0.00 0.00 0.00 1.00 Operations Analyst 1 6 Non1.00 1.00 0.00 0.00 Risk and Benefits Manager 9 Non1.00 1.00 1.00 1.00 Risk & Safety Analyst 6 Non0.00 1.00 1.00 1.00 Sr Risk Management Analyst 7 Non
2.00 3.00 3.50 4.00
CapitalFY 2019 FY 2020 FY 2021 FY 2022 RepresentedACTUAL ACTUAL REVISED PROPOSED or
BUDGET BUDGET Non-Rep0.00 0.00 0.00 0.00 Compensation & Benefits Manager 9 Non0.00 0.00 0.00 0.00 Human Resoures & Risk Mgmt Director 12 Non0.00 0.00 0.00 0.00 Human Resources Specialist 5 Non0.00 0.00 0.00 0.00 Operations Analyst 1 6 Non0.00 0.00 0.00 0.00 Risk and Benefits Manager 9 Non0.00 0.00 0.00 0.00 Risk & Safety Analyst 6 Non0.00 0.00 0.00 0.00 Sr Risk Management Analyst 7 Non
0.00 0.00 0.00 0.00
CLASSIFICATION TITLE SALARY GRADE
TOTAL PERSONNEL
CLASSIFICATION TITLE SALARY GRADE
TOTAL PERSONNEL
CLASSIFICATION TITLE SALARY GRADE
TOTAL PERSONNEL
BUSINESSSERVICESPOSITIONANDSALARYEXPENSE▼ Risk & Insurance Management | 8502

CLEAN WATER SERVICES • FY 2021-22 PROPOSED BUDGET PAGE 137
FY 2020 ACTUAL
FY 2021 REVISED BUDGET OBJECT CODE DESCRIPTION OBJECT
CODEFY 2022
PROPOSEDFY 2022
APPROVEDFY 2022
ADOPTED161,837 402,300 Wages & Other Pay 51100 457,200
107,352 75,000 Temporary 51130 75,000
311 1,000 Overtime 51140 1,000
88,029 166,300 Other Personnel Expenses 51600 195,200
0 0 Tuition Reimbursement 51761 0
0 0 Other Employee Allowances 51900 200
0 0 Auto Allowance 51910 0
1,330 1,600 Mobile Computing Allowance 51915 2,800
358,859 646,200 731,400
0 0 Electricity 52110 0
0 0 Water 52120 0
0 0 Purchased Water 52125 0
0 0 Natural Gas 52130 0
0 0 Garbage 52140 0
0 0 Surface Water Management Charge 52150 0
0 0 Other Utility Services 52160 0
0 0 Sewer Charges 52170 0
106,536 120,000 Contracted Services 52205 39,400
0 0 Landscape Services 52215 0
0 0 Audit & Accounting Services 52220 0
45,796 85,000 Professional Services 52240 85,000
0 0 Other Government Services 52270 0
264 200 Office Supplies 52305 200
0 0 Operating Supplies 52310 0
0 0 Gas, Oil, Lubrication 52315 0
0 0 Janitorial Supplies 52320 0
0 0 Tech & Scientific Supplies 52325 0
0 0 Repair & Maintenance Supplies 52330 0
0 0 Construction & Building Supplies 52335 0
30 1,500 Small Tools 52350 1,500
3,003 3,900 Safety Equipment 52360 3,900
58 100 Postage & Freight 52375 100
0 0 Software Expensed 52380 0
2,344 0 Computer Equipment Expensed 52385 0
5,615 9,000 Dues & Memberships 52405 14,000
0 0 Books, Subscriptions & Publications 52410 0
22,622 27,000 Tri-Met Subsidy 52420 0
0 0 Software Licenses & Support 52425 0
0 500 Publication Notices 52430 500
37 200 Printing 52435 200
0 0 Telecom Internal 52440 0
0 0 Telephone Services 52445 0
0 0 Fueling Contract 52475 0
1,339 1,300 Training & Education 52480 1,300
2,369 1,700 Travel Expense 52485 1,700
0 0 Fleet Charges 52486 0
803 1,000 Private Mileage 52487 1,000
238 10,000 Other Materials & Services 52495 10,000
150 0 Permits, Licenses & Fees 52500 0
0 0 Bank Service Charge 52515 0
0 0 Franchise Fees 52530 0
0 0 Payment Adjustment to Cities 52540 0
0 0 Bond Trustee Fees 52550 0
0 0 Equipment Rental 52605 0
0 0 Repair & Maintenance Services 52610 0
0 0 Non-vehicle Equipment Repair & Maintenance 52620 0
0 0 Computer Repair & Maintenance 52630 0
1,760,774 2,138,000 Insurance 52705 3,192,000
1,951,977 2,399,400 3,350,800
2,310,836 3,045,600 4,082,2001,890,101 TOTAL EXPENDITURE
1,580,489 MATERIALS & SERVICES SUBTOTAL
0
1,366,698
0
0
0
0
0
0
0
0
1,075
2,182
0
1,442
408
0
0
0
0
23,387
0
158
200
94
0
1,909
7,988
0
0
878
745
241
0
0
0
0
42,404
0
0
130,681
0
0
0
0
0
0
0
1,610
309,612 PERSONNEL EXPENSE SUBTOTAL
0
0
Business Services Department
Expenditure Summary 8502 - Risk & Insurance Management
66,242
0
0
0
FY 2019 ACTUAL
205,276
36,484
0
BUSINESSSERVICESEXPENDITURESUMMARY▼ Risk & Insurance Management | 8502

CLEAN WATER SERVICES • FY 2021-22 PROPOSED BUDGET PAGE 138
BUSINESS SERVICES DEPARTMENTPOSITION AND SALARY EXPENSE BUSINESS STRATEGY & PERFORMANCE SYSTEMS 8500
TotalFY 2019 FY 2020 FY 2021 FY 2022 RepresentedACTUAL ACTUAL REVISED PROPOSED or
BUDGET BUDGET Non-Rep1.00 0.00 0.00 0.00 Administrative Associate 3 Non1.00 0.00 0.00 0.00 Business Operations Director 13 Non0.00 1.00 0.00 0.00 Business Strategy & Performance Systems Director 13 Non0.00 1.00 1.00 1.00 Business Practice Leader 1 - Strategy, Performance 10 Non0.00 1.00 0.00 0.00 Business Practice Leader 2 - Strategy, Performance 11 Non0.00 1.00 1.00 1.00 Program Support Specialist 5 Non
2.00 4.00 2.00 2.00 TOTAL PERSONNEL
OperatingFY 2019 FY 2020 FY 2021 FY 2022 RepresentedACTUAL ACTUAL REVISED PROPOSED or
BUDGET BUDGET Non-Rep1.00 0.00 0.00 0.00 Administrative Associate 3 Non1.00 0.00 0.00 0.00 Business Operations Director 13 Non0.00 1.00 0.00 0.00 Business Strategy & Performance Systems Director 13 Non0.00 1.00 1.00 1.00 Business Practice Leader 1 - Strategy, Performance 10 Non0.00 1.00 0.00 0.00 Business Practice Leader 2 - Strategy, Performance 11 Non0.00 1.00 1.00 1.00 Program Support Specialist 5 Non
2.00 4.00 2.00 2.00 TOTAL PERSONNEL
CapitalFY 2019 FY 2020 FY 2021 FY 2022 RepresentedACTUAL ACTUAL REVISED PROPOSED or
BUDGET BUDGET Non-Rep0.00 0.00 0.00 0.00 Administrative Associate 3 Non0.00 0.00 0.00 0.00 Business Operations Director 13 Non0.00 0.00 0.00 0.00 Business Strategy & Performance Systems Director 13 Non0.00 0.00 0.00 0.00 Business Practice Leader 1 - Strategy, Performance 10 Non0.00 0.00 0.00 0.00 Business Practice Leader 2 - Strategy, Performance 11 Non0.00 0.00 0.00 0.00 Program Support Specialist 5 Non
0.00 0.00 0.00 0.00 TOTAL PERSONNEL
CLASSIFICATION TITLE SALARY GRADE
CLASSIFICATION TITLE SALARY GRADE
CLASSIFICATION TITLE SALARY GRADE
POSITIONANDSALARYEXPENSE▼ Business Strategy & Performance Systems | 8500

CLEAN WATER SERVICES • FY 2021-22 PROPOSED BUDGET PAGE 139
FY 2020 ACTUAL
FY 2021 REVISED BUDGET OBJECT CODE DESCRIPTION OBJECT
CODEFY 2022
PROPOSEDFY 2022
APPROVEDFY 2022
ADOPTED404,541 609,800 Wages & Other Pay 51100 235,800
50,351 25,000 Temporary 51130 25,000
0 0 Overtime 51140 0
124,151 226,300 Other Personnel Expenses 51600 86,200
0 0 Tuition Reimbursement 51761 0
0 0 Other Employee Allowances 51900 0
3,720 3,700 Auto Allowance 51910 0
921 1,000 Mobile Computing Allowance 51915 0
583,684 865,800 347,000
0 0 Electricity 52110 0
0 0 Water 52120 0
0 0 Purchased Water 52125 0
0 0 Natural Gas 52130 0
0 0 Garbage 52140 0
0 0 Surface Water Management Charge 52150 0
0 0 Other Utility Services 52160 0
0 0 Sewer Charges 52170 0
0 0 Contracted Services 52205 0
0 0 Landscape Services 52215 0
0 0 Audit & Accounting Services 52220 0
65,654 75,000 Professional Services 52240 75,000
0 0 Other Government Services 52270 0
523 600 Office Supplies 52305 600
0 0 Operating Supplies 52310 0
0 0 Gas, Oil, Lubrication 52315 0
0 0 Janitorial Supplies 52320 0
0 0 Tech & Scientific Supplies 52325 0
0 0 Repair & Maintenance Supplies 52330 0
0 0 Construction & Building Supplies 52335 0
88 300 Small Tools 52350 300
0 0 Safety Equipment 52360 0
0 0 Postage & Freight 52375 0
177 0 Software Expensed 52380 0
2,631 0 Computer Equipment Expensed 52385 0
400 700 Dues & Memberships 52405 18,500
735 300 Books, Subscriptions & Publications 52410 300
0 0 Tri-Met Subsidy 52420 0
39,852 0 Software Licenses & Support 52425 0
75 0 Publication Notices 52430 0
2,109 300 Printing 52435 300
0 0 Telecom Internal 52440 0
0 0 Telephone Services 52445 0
0 0 Fueling Contract 52475 0
4,887 5,500 Training & Education 52480 5,500
14,329 7,500 Travel Expense 52485 7,500
0 0 Fleet Charges 52486 0
0 500 Private Mileage 52487 500
4,955 2,000 Other Materials & Services 52495 2,000
0 0 Permits, Licenses & Fees 52500 0
0 0 Bank Service Charge 52515 0
0 0 Franchise Fees 52530 0
0 0 Payment Adjustment to Cities 52540 0
0 0 Bond Trustee Fees 52550 0
0 0 Equipment Rental 52605 0
0 0 Repair & Maintenance Services 52610 0
0 0 Non-vehicle Equipment Repair & Maintenance 52620 0
49 0 Computer Repair & Maintenance 52630 0
0 0 Insurance 52705 0
136,464 92,700 110,500
720,148 958,500 457,500581,966 TOTAL EXPENDITURE
109,477 MATERIALS & SERVICES SUBTOTAL
450
0
0
0
0
0
0
0
0
0
8,590
14,747
0
359
3,095
0
0
0
310
0
5,619
0
148
35
0
6,910
817
0
0
515
0
0
29
0
0
0
67,854
0
0
0
0
0
0
0
0
0
0
813
472,488 PERSONNEL EXPENSE SUBTOTAL
0
0
Business Services Department
Expenditure Summary 8500 - Business Strategy & Performance Systems
115,393
0
0
3,720
FY 2019 ACTUAL
256,902
84,786
10,875
EXPENDITURESUMMARY▼ Business Strategy & Performance Systems | 8500

CLEAN WATER SERVICES • FY 2021-22 PROPOSED BUDGET PAGE 140
BUSINESS SERVICES DEPARTMENTPOSITION AND SALARY EXPENSE DIGITAL SOLUTIONS 8305
TotalFY 2019 FY 2020 FY 2021 FY 2022 RepresentedACTUAL ACTUAL REVISED PROPOSED or
BUDGET BUDGET Non-Rep0.00 1.00 1.00 1.00 Business Practice Leader 2 - Digital Solutions 11 Non0.00 0.00 0.00 0.00 Business Systems Analyst 1 6 Non2.00 2.00 2.00 2.00 Database Administrator 9 Non0.00 1.00 1.00 0.00 Data Management Analyst 8 Non0.00 1.00 1.00 1.00 Digital Solutions Opportunities Manager 10 Non1.00 1.00 2.00 2.00 Information Technology Enterprise Architect 9 Non0.00 0.00 1.00 1.00 Information Technology Systems Manager 10 Non1.00 1.00 1.00 2.00 Information Technology Technician 4 Non1.00 0.00 0.00 0.00 Information Systems Division Manager 11 Non2.00 0.00 0.00 0.00 Information Systems Manager 10 Non2.00 3.00 3.00 3.00 Information Technology Analyst 8 Non1.00 1.00 1.00 1.00 Programmer Analyst 8 Non3.00 4.00 3.00 3.00 Software Engineer 9 Non
13.00 15.00 16.00 16.00 TOTAL PERSONNEL
OperatingFY 2019 FY 2020 FY 2021 FY 2022 RepresentedACTUAL ACTUAL REVISED PROPOSED or
BUDGET BUDGET Non-Rep0.00 1.00 1.00 1.00 Business Practice Leader 2 - Digital Solutions 11 Non0.00 0.00 0.00 0.00 Business Systems Analyst 1 6 Non2.00 2.00 2.00 2.00 Database Administrator 9 Non0.00 1.00 1.00 0.00 Data Management Analyst 8 Non0.00 1.00 1.00 1.00 Digital Solutions Opportunities Manager 10 Non1.00 1.00 2.00 2.00 Information Technology Enterprise Architect 9 Non0.00 0.00 1.00 1.00 Information Technology Systems Manager 10 Non1.00 1.00 1.00 2.00 Information Technology Technician 4 Non1.00 0.00 0.00 0.00 Information Systems Division Manager 11 Non2.00 0.00 0.00 0.00 Information Systems Manager 10 Non2.00 3.00 3.00 3.00 Information Technology Analyst 8 Non1.00 1.00 1.00 1.00 Programmer Analyst 8 Non3.00 4.00 3.00 3.00 Software Engineer 9 Non
13.00 14.00 16.00 16.00 TOTAL PERSONNEL
CapitalFY 2019 FY 2020 FY 2021 FY 2022 RepresentedACTUAL ACTUAL REVISED PROPOSED or
BUDGET BUDGET Non-Rep0.00 0.00 0.00 0.00 Business Practice Leader 2 - Digital Solutions 11 Non0.00 0.00 0.00 0.00 Business Systems Analyst 1 6 Non0.00 0.00 0.00 0.00 Data Management Analyst 8 Non0.00 0.00 0.00 0.00 Database Administrator 9 Non0.00 0.00 0.00 0.00 Digital Solutions Opportunities Manager 10 Non0.00 0.00 0.00 0.00 Information Technology Enterprise Architect 9 Non0.00 0.00 0.00 0.00 Information Technology Systems Manager 10 Non0.00 0.00 0.00 0.00 Information Technology Technician 4 Non0.00 0.00 0.00 0.00 Information Systems Division Manager 11 Non0.00 0.00 0.00 0.00 Information Systems Manager 10 Non0.00 0.00 0.00 0.00 Information Technology Analyst 8 Non0.00 0.00 0.00 0.00 Programmer Analyst 8 Non0.00 0.00 0.00 0.00 Software Engineer 9 Non
0.00 0.00 0.00 0.00 TOTAL PERSONNEL
CLASSIFICATION TITLE SALARY GRADE
CLASSIFICATION TITLE SALARY GRADE
CLASSIFICATION TITLE SALARY GRADE
BUSINESSSERVICESPOSITIONANDSALARYEXPENSE▼ Digital Solutions | 8305

CLEAN WATER SERVICES • FY 2021-22 PROPOSED BUDGET PAGE 141
FY 2020 ACTUAL
FY 2021 REVISED BUDGET OBJECT CODE DESCRIPTION OBJECT
CODEFY 2022
PROPOSEDFY 2022
APPROVEDFY 2022
ADOPTED1,768,097 1,914,300 Wages & Other Pay 51100 2,010,300
53,421 70,000 Temporary 51130 25,000
20,727 0 Overtime 51140 0
616,554 683,500 Other Personnel Expenses 51600 767,600
0 0 Tuition Reimbursement 51761 0
0 0 Other Employee Allowances 51900 0
0 0 Auto Allowance 51910 0
9,851 8,800 Mobile Computing Allowance 51915 10,000
2,468,651 2,676,600 2,812,900
0 0 Electricity 52110 0
0 0 Water 52120 0
0 0 Purchased Water 52125 0
0 0 Natural Gas 52130 0
0 0 Garbage 52140 0
0 0 Surface Water Management Charge 52150 0
0 0 Other Utility Services 52160 0
0 0 Sewer Charges 52170 0
27,710 30,000 Contracted Services 52205 30,000
0 0 Landscape Services 52215 0
0 0 Audit & Accounting Services 52220 0
4,000 45,000 Professional Services 52240 150,000
0 0 Other Government Services 52270 0
396 1,500 Office Supplies 52305 1,500
6,886 500 Operating Supplies 52310 500
0 0 Gas, Oil, Lubrication 52315 0
0 0 Janitorial Supplies 52320 0
38 0 Tech & Scientific Supplies 52325 0
57 0 Repair & Maintenance Supplies 52330 0
526 0 Construction & Building Supplies 52335 0
37,683 5,000 Small Tools 52350 10,000
296 0 Safety Equipment 52360 0
760 0 Postage & Freight 52375 0
7,298 0 Software Expensed 52380 0
84,399 10,000 Computer Equipment Expensed 52385 25,000
400 1,000 Dues & Memberships 52405 1,000
71,565 80,000 Books, Subscriptions & Publications 52410 80,000
0 0 Tri-Met Subsidy 52420 0
723,322 819,100 Software Licenses & Support 52425 1,275,700
395 0 Publication Notices 52430 0
84 100 Printing 52435 100
2,006 0 Telecom Internal 52440 0
185,115 235,000 Telephone Services 52445 260,000
0 0 Fueling Contract 52475 0
15,708 22,500 Training & Education 52480 22,500
19,468 11,100 Travel Expense 52485 11,100
0 0 Fleet Charges 52486 0
683 1,800 Private Mileage 52487 1,800
5,856 2,000 Other Materials & Services 52495 2,000
0 0 Permits, Licenses & Fees 52500 0
0 0 Bank Service Charge 52515 0
0 0 Franchise Fees 52530 0
0 0 Payment Adjustment to Cities 52540 0
0 0 Bond Trustee Fees 52550 0
72 0 Equipment Rental 52605 0
57,502 140,000 Repair & Maintenance Services 52610 140,000
0 0 Non-vehicle Equipment Repair & Maintenance 52620 0
0 0 Computer Repair & Maintenance 52630 0
0 0 Insurance 52705 0
1,252,224 1,404,600 2,011,200
3,720,874 4,081,200 4,824,1003,308,109 TOTAL EXPENDITURE
1,194,828 MATERIALS & SERVICES SUBTOTAL
0
0
0
0
0
117,391
5,579
23
0
0
25,980
10,497
0
1,244
1,025
2,809
221,253
0
48,627
0
674,374
436
41
10
619
23,479
428
113
0
27,509
0
1,223
723
0
0
0
1,238
0
0
30,207
0
0
0
0
0
0
0
8,557
2,113,281 PERSONNEL EXPENSE SUBTOTAL
0
0
Business Services Department
Expenditure Summary 8305 - Digital Solutions
517,945
158
0
0
FY 2019 ACTUAL
1,562,788
820
23,012
BUSINESSSERVICESEXPENDITURESUMMARY▼ Digital Solutions | 8305
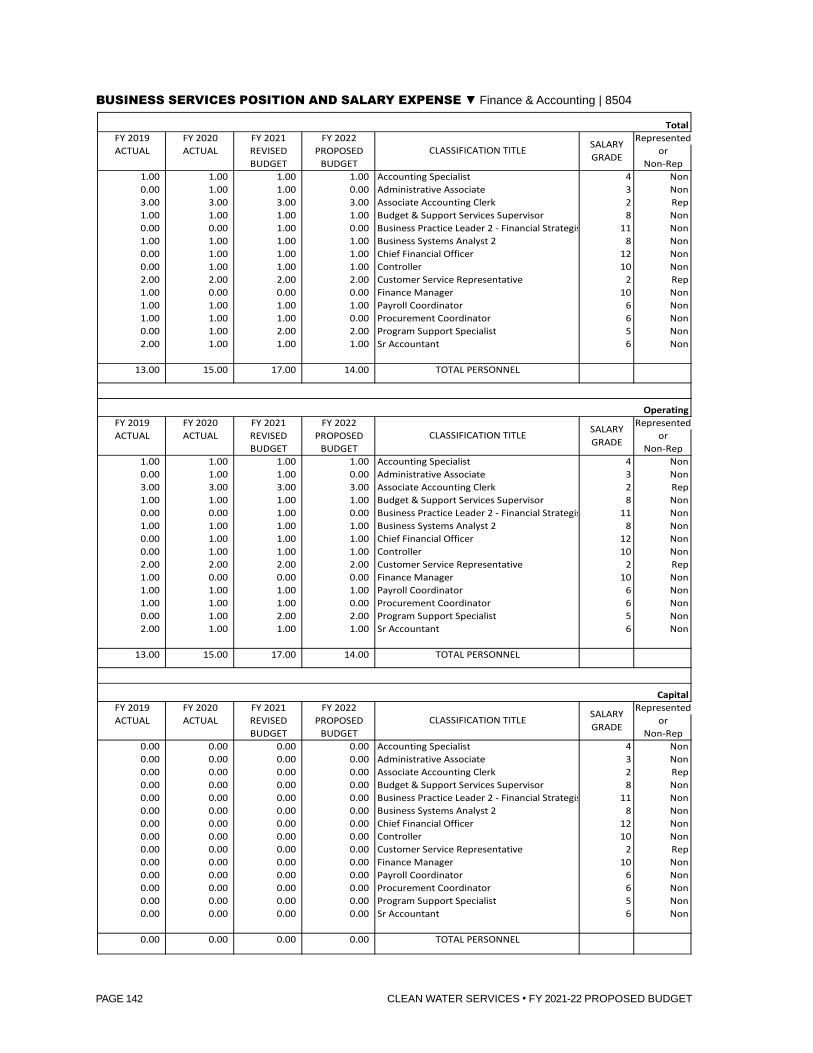
CLEAN WATER SERVICES • FY 2021-22 PROPOSED BUDGET PAGE 142
BUSINESS SERVICES DEPARTMENTPOSITION AND SALARY EXPENSE FINANCE & ACCOUNTING 8504
TotalFY 2019 FY 2020 FY 2021 FY 2022 RepresentedACTUAL ACTUAL REVISED PROPOSED or
BUDGET BUDGET Non-Rep1.00 1.00 1.00 1.00 Accounting Specialist 4 Non0.00 1.00 1.00 0.00 Administrative Associate 3 Non3.00 3.00 3.00 3.00 Associate Accounting Clerk 2 Rep1.00 1.00 1.00 1.00 Budget & Support Services Supervisor 8 Non0.00 0.00 1.00 0.00 Business Practice Leader 2 - Financial Strategist 11 Non1.00 1.00 1.00 1.00 Business Systems Analyst 2 8 Non0.00 1.00 1.00 1.00 Chief Financial Officer 12 Non0.00 1.00 1.00 1.00 Controller 10 Non2.00 2.00 2.00 2.00 Customer Service Representative 2 Rep1.00 0.00 0.00 0.00 Finance Manager 10 Non1.00 1.00 1.00 1.00 Payroll Coordinator 6 Non1.00 1.00 1.00 0.00 Procurement Coordinator 6 Non0.00 1.00 2.00 2.00 Program Support Specialist 5 Non2.00 1.00 1.00 1.00 Sr Accountant 6 Non
13.00 15.00 17.00 14.00 TOTAL PERSONNEL
OperatingFY 2019 FY 2020 FY 2021 FY 2022 RepresentedACTUAL ACTUAL REVISED PROPOSED or
BUDGET BUDGET Non-Rep1.00 1.00 1.00 1.00 Accounting Specialist 4 Non0.00 1.00 1.00 0.00 Administrative Associate 3 Non3.00 3.00 3.00 3.00 Associate Accounting Clerk 2 Rep1.00 1.00 1.00 1.00 Budget & Support Services Supervisor 8 Non0.00 0.00 1.00 0.00 Business Practice Leader 2 - Financial Strategist 11 Non1.00 1.00 1.00 1.00 Business Systems Analyst 2 8 Non0.00 1.00 1.00 1.00 Chief Financial Officer 12 Non0.00 1.00 1.00 1.00 Controller 10 Non2.00 2.00 2.00 2.00 Customer Service Representative 2 Rep1.00 0.00 0.00 0.00 Finance Manager 10 Non1.00 1.00 1.00 1.00 Payroll Coordinator 6 Non1.00 1.00 1.00 0.00 Procurement Coordinator 6 Non0.00 1.00 2.00 2.00 Program Support Specialist 5 Non2.00 1.00 1.00 1.00 Sr Accountant 6 Non
13.00 15.00 17.00 14.00 TOTAL PERSONNEL
CapitalFY 2019 FY 2020 FY 2021 FY 2022 RepresentedACTUAL ACTUAL REVISED PROPOSED or
BUDGET BUDGET Non-Rep0.00 0.00 0.00 0.00 Accounting Specialist 4 Non0.00 0.00 0.00 0.00 Administrative Associate 3 Non0.00 0.00 0.00 0.00 Associate Accounting Clerk 2 Rep0.00 0.00 0.00 0.00 Budget & Support Services Supervisor 8 Non0.00 0.00 0.00 0.00 Business Practice Leader 2 - Financial Strategist 11 Non0.00 0.00 0.00 0.00 Business Systems Analyst 2 8 Non0.00 0.00 0.00 0.00 Chief Financial Officer 12 Non0.00 0.00 0.00 0.00 Controller 10 Non0.00 0.00 0.00 0.00 Customer Service Representative 2 Rep0.00 0.00 0.00 0.00 Finance Manager 10 Non0.00 0.00 0.00 0.00 Payroll Coordinator 6 Non0.00 0.00 0.00 0.00 Procurement Coordinator 6 Non0.00 0.00 0.00 0.00 Program Support Specialist 5 Non0.00 0.00 0.00 0.00 Sr Accountant 6 Non
0.00 0.00 0.00 0.00 TOTAL PERSONNEL
CLASSIFICATION TITLE SALARY GRADE
CLASSIFICATION TITLE SALARY GRADE
CLASSIFICATION TITLE SALARY GRADE
BUSINESSSERVICESPOSITIONANDSALARYEXPENSE▼ Finance & Accounting | 8504

CLEAN WATER SERVICES • FY 2021-22 PROPOSED BUDGET PAGE 143
FY 2020 ACTUAL
FY 2021 REVISED BUDGET OBJECT CODE DESCRIPTION OBJECT
CODEFY 2022
PROPOSEDFY 2022
APPROVEDFY 2022
ADOPTED1,174,648 1,565,400 Wages & Other Pay 51100 1,336,600
9,871 47,000 Temporary 51130 50,000
695 0 Overtime 51140 0
502,840 647,800 Other Personnel Expenses 51600 609,100
0 0 Tuition Reimbursement 51761 0
0 400 Other Employee Allowances 51900 0
0 0 Auto Allowance 51910 0
2,520 2,400 Mobile Computing Allowance 51915 3,200
1,690,573 2,263,000 1,998,900
0 0 Electricity 52110 0
0 0 Water 52120 0
0 0 Purchased Water 52125 0
0 0 Natural Gas 52130 0
0 0 Garbage 52140 0
0 0 Surface Water Management Charge 52150 0
0 0 Other Utility Services 52160 0
0 0 Sewer Charges 52170 0
0 30,000 Contracted Services 52205 0
0 0 Landscape Services 52215 0
50,000 51,500 Audit & Accounting Services 52220 53,000
18,846 120,000 Professional Services 52240 80,000
1,127,576 1,196,100 Other Government Services 52270 1,200,000
1,092 2,200 Office Supplies 52305 2,200
1,850 2,000 Operating Supplies 52310 2,000
0 0 Gas, Oil, Lubrication 52315 0
0 0 Janitorial Supplies 52320 0
0 0 Tech & Scientific Supplies 52325 0
0 0 Repair & Maintenance Supplies 52330 0
105 0 Construction & Building Supplies 52335 0
362 600 Small Tools 52350 600
0 0 Safety Equipment 52360 0
256 1,200 Postage & Freight 52375 1,200
0 0 Software Expensed 52380 0
2,206 4,000 Computer Equipment Expensed 52385 4,000
7,692 9,000 Dues & Memberships 52405 3,800
437 500 Books, Subscriptions & Publications 52410 500
0 0 Tri-Met Subsidy 52420 0
0 0 Software Licenses & Support 52425 0
195 4,500 Publication Notices 52430 4,500
2,388 6,000 Printing 52435 6,000
0 0 Telecom Internal 52440 0
0 0 Telephone Services 52445 0
0 0 Fueling Contract 52475 0
2,966 5,500 Training & Education 52480 4,900
3,435 4,500 Travel Expense 52485 3,900
0 0 Fleet Charges 52486 0
902 1,600 Private Mileage 52487 1,600
2,345 5,400 Other Materials & Services 52495 5,400
0 0 Permits, Licenses & Fees 52500 0
8,923 10,000 Bank Service Charge 52515 10,000
0 0 Franchise Fees 52530 0
0 0 Payment Adjustment to Cities 52540 0
2,938 5,000 Bond Trustee Fees 52550 5,000
0 0 Equipment Rental 52605 0
0 0 Repair & Maintenance Services 52610 0
0 0 Non-vehicle Equipment Repair & Maintenance 52620 0
0 0 Computer Repair & Maintenance 52630 0
0 0 Insurance 52705 0
1,234,513 1,459,600 1,388,600
2,925,086 3,722,600 3,387,5002,703,656 TOTAL EXPENDITURE
1,136,498 MATERIALS & SERVICES SUBTOTAL
0
0
0
2,938
0
0
0
0
8,236
0
5,837
6,132
0
1,614
1,834
0
0
0
365
0
0
3,243
5,326
419
0
3,605
8,704
0
0
1,628
0
7,922
403
0
0
0
11,887
1,016,404
0
0
0
50,000
0
0
0
0
0
2,719
1,567,159 PERSONNEL EXPENSE SUBTOTAL
0
0
Business Services Department
Expenditure Summary 8504 - Finance & Accounting
450,103
0
0
0
FY 2019 ACTUAL
1,078,057
35,810
471
BUSINESSSERVICESEXPENDITURESUMMARY▼ Finance & Accounting | 8504

CLEAN WATER SERVICES • FY 2021-22 PROPOSED BUDGET PAGE 144
BUSINESS SERVICES DEPARTMENTPOSITION AND SALARY EXPENSE FINANCIAL STRATEGY & PERFORMANCE MANAGEMENT 8600
TotalFY 2019 FY 2020 FY 2021 FY 2022 RepresentedACTUAL ACTUAL REVISED PROPOSED or
BUDGET BUDGET Non-Rep0.00 0.00 0.00 1.00 Financial Analyst 6 Non0.00 0.00 0.00 1.00 Business Practice Leader 2 - Utility
Financial Strategist11 Non
0.00 0.00 0.00 2.00 TOTAL PERSONNEL
OperatingFY 2019 FY 2020 FY 2021 FY 2022 RepresentedACTUAL ACTUAL REVISED PROPOSED or
BUDGET BUDGET Non-Rep0.00 0.00 0.00 1.00 Financial Analyst 6 Non0.00 0.00 0.00 1.00 Business Practice Leader 2 - Utility
Financial Strategist11 Non
0.00 0.00 0.00 2.00 TOTAL PERSONNEL
CapitalFY 2019 FY 2020 FY 2021 FY 2022 RepresentedACTUAL ACTUAL REVISED PROPOSED or
BUDGET BUDGET Non-Rep0.00 0.00 0.00 0.00 Financial Analyst 6 Non0.00 0.00 0.00 0.00 Business Practice Leader 2 - Utility
Financial Strategist11 Non
0.00 0.00 0.00 0.00 TOTAL PERSONNEL
CLASSIFICATION TITLE SALARY GRADE
CLASSIFICATION TITLE SALARY GRADE
CLASSIFICATION TITLE SALARY GRADE
BUSINESSSERVICESPOSITIONANDSALARYEXPENSE▼ Financial Strategy & Perf Mgmt | 8600

CLEAN WATER SERVICES • FY 2021-22 PROPOSED BUDGET PAGE 145
FY 2020 ACTUAL
FY 2021 REVISED BUDGET OBJECT CODE DESCRIPTION OBJECT
CODEFY 2022
PROPOSEDFY 2022
APPROVEDFY 2022
ADOPTED0 0 Wages & Other Pay 51100 269,900
0 0 Temporary 51130 0
0 0 Overtime 51140 0
0 0 Other Personnel Expenses 51600 81,600
0 0 Tuition Reimbursement 51761 0
0 0 Other Employee Allowances 51900 0
0 0 Auto Allowance 51910 0
0 0 Mobile Computing Allowance 51915 800
0 0 352,300
0 0 Electricity 52110 0
0 0 Water 52120 0
0 0 Purchased Water 52125 0
0 0 Natural Gas 52130 0
0 0 Garbage 52140 0
0 0 Surface Water Management Charge 52150 0
0 0 Other Utility Services 52160 0
0 0 Sewer Charges 52170 0
0 0 Contracted Services 52205 0
0 0 Landscape Services 52215 0
0 0 Audit & Accounting Services 52220 0
0 0 Professional Services 52240 50,000
0 0 Other Government Services 52270 0
0 0 Office Supplies 52305 1,000
0 0 Operating Supplies 52310 2,000
0 0 Gas, Oil, Lubrication 52315 0
0 0 Janitorial Supplies 52320 0
0 0 Tech & Scientific Supplies 52325 0
0 0 Repair & Maintenance Supplies 52330 0
0 0 Construction & Building Supplies 52335 0
0 0 Small Tools 52350 0
0 0 Safety Equipment 52360 0
0 0 Postage & Freight 52375 0
0 0 Software Expensed 52380 0
0 0 Computer Equipment Expensed 52385 500
0 0 Dues & Memberships 52405 500
0 0 Books, Subscriptions & Publications 52410 500
0 0 Tri-Met Subsidy 52420 0
0 0 Software Licenses & Support 52425 1,000
0 0 Publication Notices 52430 0
0 0 Printing 52435 500
0 0 Telecom Internal 52440 0
0 0 Telephone Services 52445 0
0 0 Fueling Contract 52475 0
0 0 Training & Education 52480 2,000
0 0 Travel Expense 52485 2,000
0 0 Fleet Charges 52486 0
0 0 Private Mileage 52487 500
0 0 Other Materials & Services 52495 2,000
0 0 Permits, Licenses & Fees 52500 0
0 0 Bank Service Charge 52515 0
0 0 Franchise Fees 52530 0
0 0 Payment Adjustment to Cities 52540 0
0 0 Bond Trustee Fees 52550 0
0 0 Equipment Rental 52605 0
0 0 Repair & Maintenance Services 52610 0
0 0 Non-vehicle Equipment Repair & Maintenance 52620 0
0 0 Computer Repair & Maintenance 52630 0
0 0 Insurance 52705 0
0 0 62,500
0 0 414,8000 TOTAL EXPENDITURE
0 MATERIALS & SERVICES SUBTOTAL
0
0
0
0
0
0
0
0
0
0
0
0
0
0
0
0
0
0
0
0
0
0
0
0
0
0
0
0
0
0
0
0
0
0
0
0
0
0
0
0
0
0
0
0
0
0
0
0
0 PERSONNEL EXPENSE SUBTOTAL
0
0
Business Services Department
Expenditure Summary 8503 - Financial Strategy & Performance Management
0
0
0
0
FY 2019 ACTUAL
0
0
0
BUSINESSSERVICESEXPENDITURESUMMARY▼ Financial Strategy & Performance Mgmt | 8600

CLEAN WATER SERVICES • FY 2021-22 PROPOSED BUDGET PAGE 146
BUSINESS SERVICES DEPARTMENTPOSITION AND SALARY EXPENSE BUSINESS OPPORTUNITIES & OPERATIONS 8503
TotalFY 2019 FY 2020 FY 2021 FY 2022 RepresentedACTUAL ACTUAL REVISED PROPOSED or
BUDGET BUDGET Non-Rep0.00 0.00 0.00 2.00 Administrative Assistant 4 Non0.00 0.00 0.00 1.00 Business Opportunities Manager 11 Non0.00 0.00 0.00 1.00 Contracts Coordinator 6 Non0.00 0.00 0.00 1.00 Procurement Coordinator 6 Non0.00 0.00 0.00 3.00 Program Support Specialist 5 Non
0.00 0.00 0.00 8.00 TOTAL PERSONNEL
OperatingFY 2019 FY 2020 FY 2021 FY 2022 RepresentedACTUAL ACTUAL REVISED PROPOSED or
BUDGET BUDGET Non-Rep0.00 0.00 0.00 2.00 Administrative Assistant 4 Non0.00 0.00 0.00 1.00 Business Opportunities Manager 11 Non0.00 0.00 0.00 1.00 Contracts Coordinator 6 Non0.00 0.00 0.00 1.00 Procurement Coordinator 6 Non0.00 0.00 0.00 3.00 Program Support Specialist 5 Non
0.00 0.00 0.00 8.00 TOTAL PERSONNEL
CapitalFY 2019 FY 2020 FY 2021 FY 2022 RepresentedACTUAL ACTUAL REVISED PROPOSED or
BUDGET BUDGET Non-Rep0.00 0.00 0.00 0.00 Administrative Assistant 4 Non0.00 0.00 0.00 0.00 Business Opportunities Manager 11 Non0.00 0.00 0.00 0.00 Contracts Coordinator 6 Non0.00 0.00 0.00 0.00 Procurement Coordinator 6 Non0.00 0.00 0.00 0.00 Program Support Specialist 5 Non
0.00 0.00 0.00 0.00 TOTAL PERSONNEL
CLASSIFICATION TITLE SALARY GRADE
CLASSIFICATION TITLE SALARY GRADE
CLASSIFICATION TITLE SALARY GRADE
BUSINESSSERVICESPOSITIONANDSALARYEXPENSE▼ Bus. Opportunities & Operations | 8503
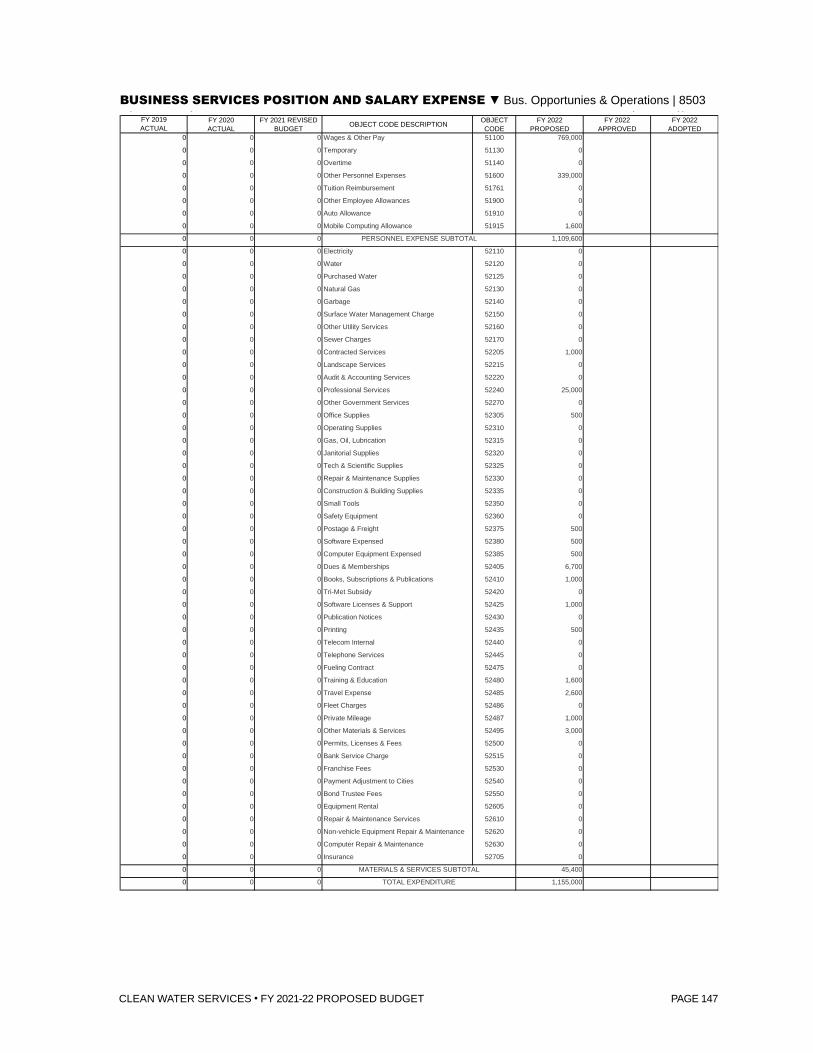
CLEAN WATER SERVICES • FY 2021-22 PROPOSED BUDGET PAGE 147
FY 2020 ACTUAL
FY 2021 REVISED BUDGET OBJECT CODE DESCRIPTION OBJECT
CODEFY 2022
PROPOSEDFY 2022
APPROVEDFY 2022
ADOPTED0 0 Wages & Other Pay 51100 769,000
0 0 Temporary 51130 0
0 0 Overtime 51140 0
0 0 Other Personnel Expenses 51600 339,000
0 0 Tuition Reimbursement 51761 0
0 0 Other Employee Allowances 51900 0
0 0 Auto Allowance 51910 0
0 0 Mobile Computing Allowance 51915 1,600
0 0 1,109,600
0 0 Electricity 52110 0
0 0 Water 52120 0
0 0 Purchased Water 52125 0
0 0 Natural Gas 52130 0
0 0 Garbage 52140 0
0 0 Surface Water Management Charge 52150 0
0 0 Other Utility Services 52160 0
0 0 Sewer Charges 52170 0
0 0 Contracted Services 52205 1,000
0 0 Landscape Services 52215 0
0 0 Audit & Accounting Services 52220 0
0 0 Professional Services 52240 25,000
0 0 Other Government Services 52270 0
0 0 Office Supplies 52305 500
0 0 Operating Supplies 52310 0
0 0 Gas, Oil, Lubrication 52315 0
0 0 Janitorial Supplies 52320 0
0 0 Tech & Scientific Supplies 52325 0
0 0 Repair & Maintenance Supplies 52330 0
0 0 Construction & Building Supplies 52335 0
0 0 Small Tools 52350 0
0 0 Safety Equipment 52360 0
0 0 Postage & Freight 52375 500
0 0 Software Expensed 52380 500
0 0 Computer Equipment Expensed 52385 500
0 0 Dues & Memberships 52405 6,700
0 0 Books, Subscriptions & Publications 52410 1,000
0 0 Tri-Met Subsidy 52420 0
0 0 Software Licenses & Support 52425 1,000
0 0 Publication Notices 52430 0
0 0 Printing 52435 500
0 0 Telecom Internal 52440 0
0 0 Telephone Services 52445 0
0 0 Fueling Contract 52475 0
0 0 Training & Education 52480 1,600
0 0 Travel Expense 52485 2,600
0 0 Fleet Charges 52486 0
0 0 Private Mileage 52487 1,000
0 0 Other Materials & Services 52495 3,000
0 0 Permits, Licenses & Fees 52500 0
0 0 Bank Service Charge 52515 0
0 0 Franchise Fees 52530 0
0 0 Payment Adjustment to Cities 52540 0
0 0 Bond Trustee Fees 52550 0
0 0 Equipment Rental 52605 0
0 0 Repair & Maintenance Services 52610 0
0 0 Non-vehicle Equipment Repair & Maintenance 52620 0
0 0 Computer Repair & Maintenance 52630 0
0 0 Insurance 52705 0
0 0 45,400
0 0 1,155,0000 TOTAL EXPENDITURE
0 MATERIALS & SERVICES SUBTOTAL
0
0
0
0
0
0
0
0
0
0
0
0
0
0
0
0
0
0
0
0
0
0
0
0
0
0
0
0
0
0
0
0
0
0
0
0
0
0
0
0
0
0
0
0
0
0
0
0
0 PERSONNEL EXPENSE SUBTOTAL
0
0
Business Services Department
Expenditure Summary 8503 - Business Operations & Opportunities
0
0
0
0
FY 2019 ACTUAL
0
0
0
BUSINESSSERVICESPOSITIONANDSALARYEXPENSE▼ Bus. Opportunies & Operations | 8503

CLEAN WATER SERVICES • FY 2021-22 PROPOSED BUDGET PAGE 148
BUSINESS SERVICES DEPARTMENTPOSITION AND SALARY EXPENSE RESEARCH & INNOVATION 8113
TotalFY 2019 FY 2020 FY 2021 FY 2022 RepresentedACTUAL ACTUAL REVISED PROPOSED or
BUDGET BUDGET Non-Rep0.00 0.00 0.00 1.00 Administrative Associate 3 Non0.00 0.00 1.00 1.00 Operations Analyst 1 6 Non0.00 0.00 0.00 1.00 Operations Specialist - Research 5 Non0.00 0.00 1.00 1.00 Research & Innovation Director 13 Non0.00 0.00 1.00 1.00 Senior Engineer 9 Non0.00 0.00 1.00 1.00 Senior Operations Analyst 9 Non0.00 0.00 1.00 1.00 Water Resources Analyst - Regulatory 8 Non0.00 0.00 1.00 1.00 Water Resources Program Manager 9 Non
0.00 0.00 6.00 8.00 TOTAL PERSONNEL
OperatingFY 2019 FY 2020 FY 2021 FY 2022 RepresentedACTUAL ACTUAL REVISED PROPOSED or
BUDGET BUDGET Non-Rep0.00 0.00 0.00 1.00 Administrative Associate 3 Non0.00 0.00 1.00 1.00 Operations Analyst 1 6 Non0.00 0.00 0.00 1.00 Operations Specialist - Research 5 Non0.00 0.00 1.00 1.00 Research & Innovation Director 13 Non0.00 0.00 1.00 1.00 Senior Engineer 9 Non0.00 0.00 1.00 1.00 Senior Operations Analyst 9 Non0.00 0.00 1.00 1.00 Water Resources Analyst - Regulatory 8 Non0.00 0.00 1.00 1.00 Water Resources Program Manager 9 Non
0.00 0.00 6.00 8.00 TOTAL PERSONNEL
CapitalFY 2019 FY 2020 FY 2021 FY 2022 RepresentedACTUAL ACTUAL REVISED PROPOSED or
BUDGET BUDGET Non-Rep0.00 0.00 0.00 0.00 Administrative Associate 3 Non0.00 0.00 0.00 0.00 Operations Analyst 1 6 Non0.00 0.00 0.00 0.00 Operations Specialist - Research 5 Non0.00 0.00 0.00 0.00 Research & Innovation Director 13 Non0.00 0.00 0.00 0.00 Senior Engineer 9 Non0.00 0.00 0.00 0.00 Senior Operations Analyst 9 Non0.00 0.00 0.00 0.00 Water Resources Analyst - Regulatory 8 Non0.00 0.00 0.00 0.00 Water Resources Program Manager 9 Non
0.00 0.00 0.00 0.00 TOTAL PERSONNEL
CLASSIFICATION TITLE SALARY GRADE
CLASSIFICATION TITLE SALARY GRADE
CLASSIFICATION TITLE SALARY GRADE
BUSINESSSERVICESPOSITIONANDSALARYEXPENSE▼ Research & Innovation | 8113

CLEAN WATER SERVICES • FY 2021-22 PROPOSED BUDGET PAGE 149
FY 2020 ACTUAL
FY 2021 REVISED BUDGET OBJECT CODE DESCRIPTION OBJECT
CODEFY 2022
PROPOSEDFY 2022
APPROVEDFY 2022
ADOPTED0 678,900 Wages & Other Pay 51100 935,100
0 316,000 Temporary 51130 109,500
0 0 Overtime 51140 0
0 218,900 Other Personnel Expenses 51600 382,100
0 0 Tuition Reimbursement 51761 0
0 400 Other Employee Allowances 51900 400
0 0 Auto Allowance 51910 0
0 1,600 Mobile Computing Allowance 51915 2,000
0 1,215,800 1,429,100
0 0 Electricity 52110 0
0 0 Water 52120 0
0 0 Purchased Water 52125 0
0 0 Natural Gas 52130 0
0 0 Garbage 52140 0
0 0 Surface Water Management Charge 52150 0
0 0 Other Utility Services 52160 0
0 0 Sewer Charges 52170 0
0 43,000 Contracted Services 52205 30,000
0 0 Landscape Services 52215 0
0 0 Audit & Accounting Services 52220 0
0 0 Professional Services 52240 0
0 0 Other Government Services 52270 0
0 0 Office Supplies 52305 0
0 20,000 Operating Supplies 52310 20,000
0 0 Gas, Oil, Lubrication 52315 0
0 0 Janitorial Supplies 52320 0
0 2,000 Tech & Scientific Supplies 52325 92,000
0 0 Repair & Maintenance Supplies 52330 0
0 0 Construction & Building Supplies 52335 0
0 1,000 Small Tools 52350 1,000
0 0 Safety Equipment 52360 0
0 0 Postage & Freight 52375 0
0 0 Software Expensed 52380 0
0 0 Computer Equipment Expensed 52385 0
0 1,000 Dues & Memberships 52405 1,500
0 0 Books, Subscriptions & Publications 52410 0
0 0 Tri-Met Subsidy 52420 0
0 0 Software Licenses & Support 52425 0
0 0 Publication Notices 52430 0
0 0 Printing 52435 0
0 0 Telecom Internal 52440 0
0 0 Telephone Services 52445 0
0 0 Fueling Contract 52475 0
0 0 Training & Education 52480 2,000
0 5,000 Travel Expense 52485 5,000
0 0 Fleet Charges 52486 0
0 0 Private Mileage 52487 5,000
0 0 Other Materials & Services 52495 0
0 0 Permits, Licenses & Fees 52500 0
0 0 Bank Service Charge 52515 0
0 0 Franchise Fees 52530 0
0 0 Payment Adjustment to Cities 52540 0
0 0 Bond Trustee Fees 52550 0
0 0 Equipment Rental 52605 0
0 0 Repair & Maintenance Services 52610 0
0 0 Non-vehicle Equipment Repair & Maintenance 52620 0
0 0 Computer Repair & Maintenance 52630 0
0 0 Insurance 52705 0
0 72,000 156,500
0 1,287,800 1,585,6000 TOTAL EXPENDITURE
0 MATERIALS & SERVICES SUBTOTAL
0
0
0
0
0
0
0
0
0
0
0
0
0
0
0
0
0
0
0
0
0
0
0
0
0
0
0
0
0
0
0
0
0
0
0
0
0
0
0
0
0
0
0
0
0
0
0
0
0 PERSONNEL EXPENSE SUBTOTAL
0
0
Business Services Department
Expenditure Summary 8113 - Research & Innovation
0
0
0
0
FY 2019 ACTUAL
0
0
0
BUSINESSSERVICESEXPENDITURESUMMARY▼ Research & Innovation | 8113

CLEAN WATER SERVICES • FY 2021-22 PROPOSED BUDGET PAGE 150
BUSINESS SERVICES DEPARTMENTPOSITION AND SALARY EXPENSE ABC BUILDING 8507
TotalFY 2018 FY 2019 FY 2020 FY 2021 RepresentedACTUAL ACTUAL BUDGET PROPOSED or
Non-Rep0.00 0.00 0.00 0.000.00 0.00 0.00 0.00
0.00 0.00 0.00 0.00 TOTAL PERSONNEL
OperatingFY 2018 FY 2019 FY 2020 FY 2021 RepresentedACTUAL ACTUAL BUDGET PROPOSED or
Non-Rep0.00 0.00 0.00 0.000.00 0.00 0.00 0.00
0.00 0.00 0.00 0.00 TOTAL PERSONNEL
CapitalFY 2018 FY 2019 FY 2020 FY 2021 RepresentedACTUAL ACTUAL BUDGET PROPOSED or
Non-Rep0.00 0.00 0.00 0.000.00 0.00 0.00 0.00
0.00 0.00 0.00 0.00 TOTAL PERSONNEL
CLASSIFICATION TITLE SALARY GRADE
CLASSIFICATION TITLE SALARY GRADE
CLASSIFICATION TITLE SALARY GRADE
No FTE in this program
BUSINESSSERVICESPOSITIONANDSALARYEXPENSE▼ Building Maintenance - ABC | 8507

CLEAN WATER SERVICES • FY 2021-22 PROPOSED BUDGET PAGE 151
FY 2020 ACTUAL
FY 2021 REVISED BUDGET OBJECT CODE DESCRIPTION OBJECT
CODEFY 2022
PROPOSEDFY 2022
APPROVEDFY 2022
ADOPTED0 0 Wages & Other Pay 51100 0
0 0 Temporary 51130 0
0 0 Overtime 51140 0
0 0 Other Personnel Expenses 51600 0
0 0 Tuition Reimbursement 51761 0
0 0 Other Employee Allowances 51900 0
0 0 Auto Allowance 51910 0
0 0 Mobile Computing Allowance 51915 0
0 0 0
0 0 Electricity 52110 0
0 0 Water 52120 0
0 0 Purchased Water 52125 0
0 0 Natural Gas 52130 0
0 0 Garbage 52140 0
0 0 Surface Water Management Charge 52150 0
0 0 Other Utility Services 52160 0
0 0 Sewer Charges 52170 0
0 0 Contracted Services 52205 0
0 0 Landscape Services 52215 0
0 0 Audit & Accounting Services 52220 0
0 0 Professional Services 52240 0
0 0 Other Government Services 52270 0
0 0 Office Supplies 52305 0
0 0 Operating Supplies 52310 0
0 0 Gas, Oil, Lubrication 52315 0
0 0 Janitorial Supplies 52320 0
0 0 Tech & Scientific Supplies 52325 0
0 0 Repair & Maintenance Supplies 52330 0
0 0 Construction & Building Supplies 52335 0
0 0 Small Tools 52350 0
0 0 Safety Equipment 52360 0
0 0 Postage & Freight 52375 0
0 0 Software Expensed 52380 0
0 0 Computer Equipment Expensed 52385 0
0 0 Dues & Memberships 52405 0
0 0 Books, Subscriptions & Publications 52410 0
0 0 Tri-Met Subsidy 52420 0
0 0 Software Licenses & Support 52425 0
0 0 Publication Notices 52430 0
0 0 Printing 52435 0
0 0 Telecom Internal 52440 0
0 0 Telephone Services 52445 0
0 0 Fueling Contract 52475 0
0 0 Training & Education 52480 0
0 0 Travel Expense 52485 0
0 0 Fleet Charges 52486 0
0 0 Private Mileage 52487 0
0 0 Other Materials & Services 52495 0
0 0 Permits, Licenses & Fees 52500 0
0 0 Bank Service Charge 52515 0
0 0 Franchise Fees 52530 0
0 0 Payment Adjustment to Cities 52540 0
0 0 Bond Trustee Fees 52550 0
0 0 Equipment Rental 52605 0
0 0 Repair & Maintenance Services 52610 0
0 0 Non-vehicle Equipment Repair & Maintenance 52620 0
0 0 Computer Repair & Maintenance 52630 0
0 0 Insurance 52705 0
0 0 0
0 0 0912,480 TOTAL EXPENDITURE
912,480 MATERIALS & SERVICES SUBTOTAL
0
0
0
0
2,361
167,204
0
740
0
0
0
0
2,935
0
42
0
0
2,149
0
0
(1,616)
0
0
0
0
0
349
380
39,744
710
0
612
115
0
11,274
0
2,758
0
17,356
385,066
56,110
0
0
53,568
5,592
5,896
2,020
0
0 PERSONNEL EXPENSE SUBTOTAL
140,348
16,768
Business Services Department
Expenditure Summary 8507 - Building Maintenance - ABC Building
0
0
0
0
FY 2019 ACTUAL
0
0
0
BUSINESSSERVICESEXPENDITURESUMMARY▼ Building Maintenance - ABC | 8507


CLEAN WATER SERVICES • FY 2021-22 PROPOSED BUDGET PAGE 153
Enterprise Asset & Technical Services
Enterprise Asset & Technical Services Department (EATS) provides asset management, planning and implementation of asset replacement and renewal projects; provides technical engineering (mechanical, electrical and instrumentation) to support District operations and maintenance activities; designs and maintains the automation and controls systems; and manages the maintenance and services for all District buildings and facilities. To provide these services the department is organized into five areas: Administration, Asset Management, Technical Support, Control Systems and
CLEAN WATER SERVICES • FY 2021-22 PROPOSED BUDGET PAGE 154
Facilities. These groups are responsible for extending the useful life of assets, optimizing treatment processes and operations, and improving the efficiency and effectiveness of maintenance.
EATS is a new department beginning in FY 2021-22, created by merging multiple programs from the Water Resource Recovery Operations & Services and Utility Operations & Services departments to better provide services across the District. Centralized management will lower costs and improve productivity through systems standardization, economies of scale, sharing of resources, and by reducing duplication of efforts. The results will be increased support infrastructure reliability through smooth and consistent implementation of best practices, processes and procedures.
The FY 2021-22 EATS budget reflects the transfer of 22 existing FTE from Water Resource Recovery Operations & Services and the transfer of three existing FTE from Utility Operations & Services. No new or additional FTE are included in the department’s base budget.
Asset ManagementThe District tracks more than 15,000 assets with a computerized maintenance management information system. Key management objectives are to extend the useful life of assets and to repair or replace them before they fail, thereby maximizing the value of the investments and performance reliability. This program is responsible for performing condition assessments and life cycle analyses to provide critical information for responsible planning for the amount and timing of funding the capital renewal program.
Technical Support Conveyance and treatment of wastewater is accomplished with many hundreds of motor-driven pumps, blowers and other specialized equipment, configured with complex instrumentation for automatic control and redundancy at the water resource recovery facilities and pump stations. High level mechanical, electrical and instrumentation technical expertise is essential for the reliable operation and maintenance of the equipment and support piping, electrical distribution systems, and controls systems networks. This program is responsible for design input, maintenance support, construction inspection, and commissioning of this equipment and systems.

CLEAN WATER SERVICES • FY 2021-22 PROPOSED BUDGET PAGE 155
Control Systems Operation of the water resource recovery facilities is highly automated through supervisory control and data acquisition (SCADA) systems. Real time process control is accomplished through programmable logic controllers (PLCs). Telemetry systems monitor condition and status of the pump stations and collection system. This program is responsible for the design, implementation and maintenance of the hardware and software for these control systems.
FacilitiesDistrict staff and operations are distributed at multiple campus locations across the District’s service area. At these campuses, facilities include the occupied buildings for staff offices and services, unoccupied buildings for treatment processes, and associated grounds. This program is responsible for maintenance, service, and renovation of the building envelopes and interiors, utilities and support systems, and hardscaping.


CLEAN WATER SERVICES • FY 2021-22 PROPOSED BUDGET PAGE 157
OBJECT CODE FY 2019 ACTUAL FY 2020 ACTUAL FY 2021 REVISED BUDGET
FY 2022 PROPOSED BUDGET
Change from FY21 Budget
51100 0 0 0 2,815,100
51130 0 0 0 50,000
51140 0 0 0 5,000
51600 0 0 0 1,038,800
51900 0 0 0 3,600
51915 0 0 0 11,600
0 0 0 3,924,100
52110 0 0 0 108,500
52120 0 0 0 43,500
52130 0 0 0 64,000
52140 0 0 0 16,400
52150 0 0 0 34,500
52160 0 0 0 2,900
52170 0 0 0 39,500
52205 0 0 0 574,000
52215 0 0 0 103,500
52240 0 0 0 25,000
52260 0 0 0 45,000
52310 0 0 0 254,000
52315 0 0 0 1,000
52320 0 0 0 30,000
52330 0 0 0 60,000
52335 0 0 0 87,500
52350 0 0 0 5,000
52375 0 0 0 300
52385 0 0 0 1,200
52405 0 0 0 1,500
52410 0 0 0 1,100
52430 0 0 0 1,000
52475 0 0 0 4,000
52480 0 0 0 10,800
52485 0 0 0 2,000
52486 0 0 0 12,500
52487 0 0 0 6,400
52495 0 0 0 200
52500 0 0 0 3,600
52510 0 0 0 35,000
52605 0 0 0 4,000
52610 0 0 0 241,000
0 0 0 1,818,900
0 0 0 5,743,000
Wages & Other Pay
Temporary
CWS Department Expenditure SummaryBudget Year: 2022
OBJECT CODE DESCRIPTION
Other Employee Allowances
Overtime
Other Personnel Expenses
Water
Natural Gas
Mobile Computing Allowance
PERSONNEL EXPENSE SUBTOTAL
Electricity
Sewer Charges
Contracted Services
Garbage
Surface Water Management Charge
Other Utility Services
Professional Services
Laundry
Landscape Services
Gas, Oil, Lubrication
Janitorial Supplies
Operating Supplies
Small Tools
Postage & Freight
Repair & Maintenance Supplies
Construction & Building Supplies
Dues & Memberships
Books, Subscriptions & Publications
Computer Equipment Expensed
Publication Notices
Travel Expense
Fleet Charges
Private Mileage
Fueling Contract
Training & Education
Taxes, Assessments & Liens
Other Materials & Services
Permits, Licenses & Fees
Repair & Maintenance Services
Equipment Rental
TOTAL EXPENDITURE
Enterprise Asset & Technical Services
MATERIALS & SERVICES SUBTOTAL
ENTERPRISE ASSET & TECHNICAL & SERVICES ▼ Department Summary

CLEAN WATER SERVICES • FY 2021-22 PROPOSED BUDGET PAGE 158
ENTERPRISE ASSET & TECHNICAL SERVICESPOSITION AND SALARY EXPENSE ADMINISTRATION 8364
TotalFY 2019 FY 2020 FY 2021 FY 2022 RepresentedACTUAL ACTUAL REVISED PROPOSED or
BUDGET BUDGET Non-Rep0.00 0.00 0.00 1.00 Building & Facilities Services Manager 10 Non0.00 0.00 0.00 1.00 Engineer 8 Non0.00 0.00 0.00 1.00 Enterprise Asset Technical Services Director 12 Non0.00 0.00 0.00 1.00 Principal Engineer 10 Non0.00 0.00 0.00 1.00 Principal Engineer - I&C/Automation 10 Non
0.00 0.00 0.00 5.00 TOTAL PERSONNEL
OperatingFY 2019 FY 2020 FY 2021 FY 2022 RepresentedACTUAL ACTUAL REVISED PROPOSED or
BUDGET BUDGET Non-Rep0.00 0.00 0.00 1.00 Building & Facilities Services Manager 10 Non0.00 0.00 0.00 1.00 Engineer 8 Non0.00 0.00 0.00 1.00 Enterprise Asset Technical Services Director 12 Non0.00 0.00 0.00 1.00 Principal Engineer 10 Non0.00 0.00 0.00 1.00 Principal Engineer - I&C/Automation 10 Non
0.00 0.00 0.00 5.00 TOTAL PERSONNEL
CapitalFY 2019 FY 2020 FY 2021 FY 2022 RepresentedACTUAL ACTUAL REVISED PROPOSED or
BUDGET BUDGET Non-Rep0.00 0.00 0.00 0.00 Building & Facilities Services Manager 10 Non0.00 0.00 0.00 0.00 Engineer 8 Non0.00 0.00 0.00 0.00 Enterprise Asset Technical Services Director 12 Non0.00 0.00 0.00 0.00 Principal Engineer 10 Non0.00 0.00 0.00 0.00 Principal Engineer - I&C/Automation 10 Non
0.00 0.00 0.00 0.00 TOTAL PERSONNEL
CLASSIFICATION TITLE SALARY GRADE
CLASSIFICATION TITLE SALARY GRADE
CLASSIFICATION TITLE SALARY GRADE
EATSPOSITIONANDSALARYEXPENSE▼ Administration | 8364

CLEAN WATER SERVICES • FY 2021-22 PROPOSED BUDGET PAGE 159
FY 2020 ACTUAL
FY 2021 REVISED BUDGET OBJECT CODE DESCRIPTION OBJECT
CODEFY 2022
PROPOSEDFY 2022
PROPOSEDFY 2022
PROPOSED0 0 Wages & Other Pay 51100 790,500
0 0 Temporary 51130 0
0 0 Overtime 51140 0
0 0 Other Personnel Expenses 51600 256,700
0 0 Other Employee Allowances 51900 400
0 0 Mobile Computing Allowance 51915 2,400
0 0 1,050,000
0 0 Electricity 52110 0
0 0 Water 52120 0
0 0 Natural Gas 52130 0
0 0 Garbage 52140 0
0 0 Surface Water Management Charge 52150 0
0 0 Other Utility Services 52160 0
0 0 Sewer Charges 52170 0
0 0 Contracted Services 52205 0
0 0 Landscape Services 52215 0
0 0 Professional Services 52240 0
0 0 Laundry 52260 0
0 0 Operating Supplies 52310 0
0 0 Gas, Oil, Lubrication 52315 0
0 0 Janitorial Supplies 52320 0
0 0 Repair & Maintenance Supplies 52330 0
0 0 Construction & Building Supplies 52335 0
0 0 Small Tools 52350 0
0 0 Postage & Freight 52375 0
0 0 Computer Equipment Expensed 52385 0
0 0 Dues & Memberships 52405 0
0 0 Books, Subscriptions & Publications 52410 0
0 0 Publication Notices 52430 0
0 0 Fueling Contract 52475 0
0 0 Training & Education 52480 3,200
0 0 Travel Expense 52485 2,000
0 0 Fleet Charges 52486 0
0 0 Private Mileage 52487 0
0 0 Other Materials & Services 52495 0
0 0 Permits, Licenses & Fees 52500 0
0 0 Taxes, Assessments & Liens 52510 0
0 0 Equipment Rental 52605 0
0 0 Repair & Maintenance Services 52610 0
0 0 5,200
0 0 1,055,2000 TOTAL EXPENDITURE
0 MATERIALS & SERVICES SUBTOTAL
0
0
0
0
0
0
0
0
0
0
0
0
0
0
0
0
0
0
0
0
0
0
0
0
0
0
0
0
0
0
0
0 PERSONNEL EXPENSE SUBTOTAL
0
0
0
0
FY 2019 ACTUAL
0
0
0
Enterprise Asset & Technical Services
Expenditure Summary 8364 - EATS AdministrationEATSEXPENDITURESUMMARY▼ Administration | 8364

CLEAN WATER SERVICES • FY 2021-22 PROPOSED BUDGET PAGE 160
ENTERPRISE ASSET & TECHNICAL SERVICESPOSITION AND SALARY EXPENSE ASSET MANAGEMENT 8362
TotalFY 2019 FY 2020 FY 2021 FY 2022 RepresentedACTUAL ACTUAL REVISED PROPOSED or
BUDGET BUDGET Non-Rep0.00 0.00 0.00 1.00 Asset Management System Analyst 8 Non0.00 0.00 0.00 1.00 Building & Facilities Supervisor 8 Non0.00 0.00 0.00 1.00 Field Engineer - Electrical 8 Non0.00 0.00 0.00 1.00 Operations Analyst 1 6 Non0.00 0.00 0.00 1.00 Senior Operations Analyst 9 Non0.00 0.00 0.00 1.00 Software Engineer 9 Non0.00 0.00 0.00 2.00 Storekeeper 2 5 Rep
0.00 0.00 0.00 8.00 TOTAL PERSONNEL
OperatingFY 2019 FY 2020 FY 2021 FY 2022 RepresentedACTUAL ACTUAL REVISED PROPOSED or
BUDGET BUDGET Non-Rep0.00 0.00 0.00 1.00 Asset Management System Analyst 8 Non0.00 0.00 0.00 1.00 Building & Facilities Supervisor 8 Non0.00 0.00 0.00 1.00 Field Engineer - Electrical 8 Non0.00 0.00 0.00 1.00 Operations Analyst 1 6 Non0.00 0.00 0.00 1.00 Senior Operations Analyst 9 Non0.00 0.00 0.00 1.00 Software Engineer 9 Non0.00 0.00 0.00 2.00 Storekeeper 2 5 Rep
0.00 0.00 0.00 8.00 TOTAL PERSONNEL
CapitalFY 2019 FY 2020 FY 2021 FY 2022 RepresentedACTUAL ACTUAL REVISED PROPOSED or
BUDGET BUDGET Non-Rep0.00 0.00 0.00 0.00 Asset Management System Analyst 8 Non0.00 0.00 0.00 0.00 Building & Facilities Supervisor 8 Non0.00 0.00 0.00 0.00 Field Engineer - Electrical 8 Non0.00 0.00 0.00 0.00 Operations Analyst 1 6 Non0.00 0.00 0.00 0.00 Senior Operations Analyst 9 Non0.00 0.00 0.00 0.00 Software Engineer 9 Non0.00 0.00 0.00 0.00 Storekeeper 2 5 Rep
0.00 0.00 0.00 0.00 TOTAL PERSONNEL
CLASSIFICATION TITLE SALARY GRADE
CLASSIFICATION TITLE SALARY GRADE
CLASSIFICATION TITLE SALARY GRADE
EATSPOSITIONANDSALARYEXPENSE▼ Asset Management | 8362

CLEAN WATER SERVICES • FY 2021-22 PROPOSED BUDGET PAGE 161
FY 2020 ACTUAL
FY 2021 REVISED BUDGET OBJECT CODE DESCRIPTION OBJECT
CODEFY 2022
PROPOSEDFY 2022
PROPOSEDFY 2022
PROPOSED0 0 Wages & Other Pay 51100 802,800
0 0 Temporary 51130 0
0 0 Overtime 51140 5,000
0 0 Other Personnel Expenses 51600 310,000
0 0 Other Employee Allowances 51900 1,600
0 0 Mobile Computing Allowance 51915 3,600
0 0 1,123,000
0 0 Electricity 52110 0
0 0 Water 52120 0
0 0 Natural Gas 52130 0
0 0 Garbage 52140 3,000
0 0 Surface Water Management Charge 52150 0
0 0 Other Utility Services 52160 0
0 0 Sewer Charges 52170 0
0 0 Contracted Services 52205 250,000
0 0 Landscape Services 52215 0
0 0 Professional Services 52240 25,000
0 0 Laundry 52260 45,000
0 0 Operating Supplies 52310 250,000
0 0 Gas, Oil, Lubrication 52315 1,000
0 0 Janitorial Supplies 52320 15,000
0 0 Repair & Maintenance Supplies 52330 0
0 0 Construction & Building Supplies 52335 0
0 0 Small Tools 52350 5,000
0 0 Postage & Freight 52375 300
0 0 Computer Equipment Expensed 52385 1,200
0 0 Dues & Memberships 52405 0
0 0 Books, Subscriptions & Publications 52410 400
0 0 Publication Notices 52430 0
0 0 Fueling Contract 52475 2,500
0 0 Training & Education 52480 800
0 0 Travel Expense 52485 0
0 0 Fleet Charges 52486 5,500
0 0 Private Mileage 52487 2,900
0 0 Other Materials & Services 52495 200
0 0 Permits, Licenses & Fees 52500 2,600
0 0 Taxes, Assessments & Liens 52510 0
0 0 Equipment Rental 52605 2,000
0 0 Repair & Maintenance Services 52610 0
0 0 612,400
0 0 1,735,4000 TOTAL EXPENDITURE
0 MATERIALS & SERVICES SUBTOTAL
0
0
0
0
0
0
0
0
0
0
0
0
0
0
0
0
0
0
0
0
0
0
0
0
0
0
0
0
0
0
0
0 PERSONNEL EXPENSE SUBTOTAL
0
0
0
0
FY 2019 ACTUAL
0
0
0
Enterprise Asset & Technical Services
Expenditure Summary 8362 - Asset ManagementEATSEXPENDITURESUMMARY▼ Asset Management | 8362

CLEAN WATER SERVICES • FY 2021-22 PROPOSED BUDGET PAGE 162
ENTERPRISE ASSET & TECHNICAL SERVICESPOSITION AND SALARY EXPENSE CONTROL SYSTEMS 8353
TotalFY 2019 FY 2020 FY 2021 FY 2022 RepresentedACTUAL ACTUAL REVISED PROPOSED or
BUDGET BUDGET Non-Rep0.00 0.00 0.00 2.00 Field Engineer - Automation & Controls 8 Non0.00 0.00 0.00 1.00 Senior Field Engineer - Automation & Controls 9 Non
0.00 0.00 0.00 3.00 TOTAL PERSONNEL
OperatingFY 2019 FY 2020 FY 2021 FY 2022 RepresentedACTUAL ACTUAL REVISED PROPOSED or
BUDGET BUDGET Non-Rep0.00 0.00 0.00 2.00 Field Engineer - Automation & Controls 8 Non0.00 0.00 0.00 1.00 Senior Field Engineer - Automation & Controls 9 Non
0.00 0.00 0.00 3.00 TOTAL PERSONNEL
CapitalFY 2019 FY 2020 FY 2021 FY 2022 RepresentedACTUAL ACTUAL REVISED PROPOSED or
BUDGET BUDGET Non-Rep0.00 0.00 0.00 0.00 Field Engineer - Automation & Controls 8 Non0.00 0.00 0.00 0.00 Senior Field Engineer - Automation & Controls 9 Non
0.00 0.00 0.00 0.00 TOTAL PERSONNEL
CLASSIFICATION TITLE SALARY GRADE
CLASSIFICATION TITLE SALARY GRADE
CLASSIFICATION TITLE SALARY GRADE
EATSPOSITIONANDSALARYEXPENSE▼ Control Systems | 8353

CLEAN WATER SERVICES • FY 2021-22 PROPOSED BUDGET PAGE 163
FY 2020 ACTUAL
FY 2021 REVISED BUDGET OBJECT CODE DESCRIPTION OBJECT
CODEFY 2022
PROPOSEDFY 2022
PROPOSEDFY 2022
PROPOSED0 0 Wages & Other Pay 51100 276,300
0 0 Temporary 51130 0
0 0 Overtime 51140 0
0 0 Other Personnel Expenses 51600 80,500
0 0 Other Employee Allowances 51900 600
0 0 Mobile Computing Allowance 51915 2,400
0 0 359,800
0 0 Electricity 52110 0
0 0 Water 52120 0
0 0 Natural Gas 52130 0
0 0 Garbage 52140 0
0 0 Surface Water Management Charge 52150 0
0 0 Other Utility Services 52160 0
0 0 Sewer Charges 52170 0
0 0 Contracted Services 52205 0
0 0 Landscape Services 52215 0
0 0 Professional Services 52240 0
0 0 Laundry 52260 0
0 0 Operating Supplies 52310 2,000
0 0 Gas, Oil, Lubrication 52315 0
0 0 Janitorial Supplies 52320 0
0 0 Repair & Maintenance Supplies 52330 0
0 0 Construction & Building Supplies 52335 0
0 0 Small Tools 52350 0
0 0 Postage & Freight 52375 0
0 0 Computer Equipment Expensed 52385 0
0 0 Dues & Memberships 52405 1,000
0 0 Books, Subscriptions & Publications 52410 0
0 0 Publication Notices 52430 0
0 0 Fueling Contract 52475 0
0 0 Training & Education 52480 2,500
0 0 Travel Expense 52485 0
0 0 Fleet Charges 52486 0
0 0 Private Mileage 52487 1,500
0 0 Other Materials & Services 52495 0
0 0 Permits, Licenses & Fees 52500 0
0 0 Taxes, Assessments & Liens 52510 0
0 0 Equipment Rental 52605 0
0 0 Repair & Maintenance Services 52610 0
0 0 7,000
0 0 366,8000 TOTAL EXPENDITURE
0 MATERIALS & SERVICES SUBTOTAL
0
0
0
0
0
0
0
0
0
0
0
0
0
0
0
0
0
0
0
0
0
0
0
0
0
0
0
0
0
0
0
0 PERSONNEL EXPENSE SUBTOTAL
0
0
0
0
FY 2019 ACTUAL
0
0
0
Enterprise Asset & Technical Services
Expenditure Summary 8353 - Control SystemsEATS EXPENDITURE SUMMARY ▼ Control Systems | 8353

CLEAN WATER SERVICES • FY 2021-22 PROPOSED BUDGET PAGE 164
ENTERPRISE ASSET & TECHNICAL SERVICESPOSITION AND SALARY EXPENSE TECHNICAL SUPPORT 8363
TotalFY 2019 FY 2020 FY 2021 FY 2022 RepresentedACTUAL ACTUAL REVISED PROPOSED or
BUDGET BUDGET Non-Rep0.00 0.00 0.00 1.00 Engineering Technician 3 6 Rep0.00 0.00 0.00 1.00 Field Engineer - Commissioning & Startup 8 Non0.00 0.00 0.00 1.00 Field Engineer - Inspection 8 Non0.00 0.00 0.00 2.00 Senior Engineer 9 Non
0.00 0.00 0.00 5.00 TOTAL PERSONNEL
OperatingFY 2019 FY 2020 FY 2021 FY 2022 RepresentedACTUAL ACTUAL REVISED PROPOSED or
BUDGET BUDGET Non-Rep0.00 0.00 0.00 1.00 Engineering Technician 3 6 Non0.00 0.00 0.00 1.00 Field Engineer - Commissioning & Startup 8 Non0.00 0.00 0.00 1.00 Field Engineer - Inspection 8 Non0.00 0.00 0.00 2.00 Senior Engineer 9 Non
0.00 0.00 0.00 5.00 TOTAL PERSONNEL
CapitalFY 2019 FY 2020 FY 2021 FY 2022 RepresentedACTUAL ACTUAL REVISED PROPOSED or
BUDGET BUDGET Non-Rep0.00 0.00 0.00 0.00 Engineering Technician 3 6 Non0.00 0.00 0.00 0.00 Field Engineer - Commissioning & Startup 8 Non0.00 0.00 0.00 0.00 Field Engineer - Inspection 8 Non0.00 0.00 0.00 0.00 Senior Engineer 9 Non
0.00 0.00 0.00 0.00 TOTAL PERSONNEL
CLASSIFICATION TITLE SALARY GRADE
CLASSIFICATION TITLE SALARY GRADE
CLASSIFICATION TITLE SALARY GRADE
EATSPOSITIONANDSALARYEXPENSE▼ Technical Support | 8363

CLEAN WATER SERVICES • FY 2021-22 PROPOSED BUDGET PAGE 165
FY 2020 ACTUAL
FY 2021 REVISED BUDGET OBJECT CODE DESCRIPTION OBJECT
CODEFY 2022
PROPOSEDFY 2022
PROPOSEDFY 2022
PROPOSED0 0 Wages & Other Pay 51100 594,600
0 0 Temporary 51130 25,000
0 0 Overtime 51140 0
0 0 Other Personnel Expenses 51600 253,100
0 0 Other Employee Allowances 51900 400
0 0 Mobile Computing Allowance 51915 800
0 0 873,900
0 0 Electricity 52110 0
0 0 Water 52120 0
0 0 Natural Gas 52130 0
0 0 Garbage 52140 0
0 0 Surface Water Management Charge 52150 0
0 0 Other Utility Services 52160 0
0 0 Sewer Charges 52170 0
0 0 Contracted Services 52205 0
0 0 Landscape Services 52215 0
0 0 Professional Services 52240 0
0 0 Laundry 52260 0
0 0 Operating Supplies 52310 2,000
0 0 Gas, Oil, Lubrication 52315 0
0 0 Janitorial Supplies 52320 0
0 0 Repair & Maintenance Supplies 52330 0
0 0 Construction & Building Supplies 52335 0
0 0 Small Tools 52350 0
0 0 Postage & Freight 52375 0
0 0 Computer Equipment Expensed 52385 0
0 0 Dues & Memberships 52405 500
0 0 Books, Subscriptions & Publications 52410 700
0 0 Publication Notices 52430 0
0 0 Fueling Contract 52475 0
0 0 Training & Education 52480 4,300
0 0 Travel Expense 52485 0
0 0 Fleet Charges 52486 0
0 0 Private Mileage 52487 2,000
0 0 Other Materials & Services 52495 0
0 0 Permits, Licenses & Fees 52500 0
0 0 Taxes, Assessments & Liens 52510 0
0 0 Equipment Rental 52605 0
0 0 Repair & Maintenance Services 52610 0
0 0 9,500
0 0 883,4000 TOTAL EXPENDITURE
0 MATERIALS & SERVICES SUBTOTAL
0
0
0
0
0
0
0
0
0
0
0
0
0
0
0
0
0
0
0
0
0
0
0
0
0
0
0
0
0
0
0
0 PERSONNEL EXPENSE SUBTOTAL
0
0
0
0
FY 2019 ACTUAL
0
0
0
Enterprise Asset & Technical Services
Expenditure Summary 8363 - Technical SupportEATSEXPENDITURESUMMARY▼ Technical Support | 8363

CLEAN WATER SERVICES • FY 2021-22 PROPOSED BUDGET PAGE 166
ENTERPRISE ASSET & TECHNICAL SERVICESPOSITION AND SALARY EXPENSE FACILITIES DIVISION 091
TotalFY 2019 FY 2020 FY 2021 FY 2022 RepresentedACTUAL ACTUAL REVISED PROPOSED or
BUDGET BUDGET Non-Rep0.00 0.00 0.00 1.00 Administrative Assistant 4 Non0.00 0.00 0.00 1.00 Facilities Maintenance Technician 3 Rep0.00 0.00 0.00 1.00 Operations Coordinator 5 Non0.00 0.00 0.00 1.00 Senior Engineer 9 Non
0.00 0.00 0.00 4.00 TOTAL PERSONNEL
OperatingFY 2019 FY 2020 FY 2021 FY 2022 RepresentedACTUAL ACTUAL REVISED PROPOSED or
BUDGET BUDGET Non-Rep0.00 0.00 0.00 1.00 Administrative Assistant 4 Non0.00 0.00 0.00 1.00 Facilities Maintenance Technician 3 Rep0.00 0.00 0.00 1.00 Operations Coordinator 5 Non0.00 0.00 0.00 1.00 Senior Engineer 9 Non
0.00 0.00 0.00 4.00 TOTAL PERSONNEL
CapitalFY 2019 FY 2020 FY 2021 FY 2022 RepresentedACTUAL ACTUAL REVISED PROPOSED or
BUDGET BUDGET Non-Rep0.00 0.00 0.00 0.00 Administrative Assistant 4 Non0.00 0.00 0.00 0.00 Facilities Maintenance Technician 3 Rep0.00 0.00 0.00 0.00 Operations Coordinator 5 Non0.00 0.00 0.00 0.00 Senior Engineer 9 Non
0.00 0.00 0.00 0.00 TOTAL PERSONNEL
CLASSIFICATION TITLE SALARY GRADE
CLASSIFICATION TITLE SALARY GRADE
CLASSIFICATION TITLE SALARY GRADE
EATSPOSITIONANDSALARYEXPENSE▼ Facilities | 091-

CLEAN WATER SERVICES • FY 2021-22 PROPOSED BUDGET PAGE 167
FY 2020 ACTUAL
FY 2021 REVISED BUDGET OBJECT CODE DESCRIPTION OBJECT
CODEFY 2022
PROPOSEDFY 2022
PROPOSEDFY 2022
PROPOSED0 0 Wages & Other Pay 51100 350,900
0 0 Temporary 51130 25,000
0 0 Overtime 51140 0
0 0 Other Personnel Expenses 51600 138,500
0 0 Other Employee Allowances 51900 600
0 0 Mobile Computing Allowance 51915 2,400
0 0 517,400
0 0 Electricity 52110 108,500
0 0 Water 52120 43,500
0 0 Natural Gas 52130 64,000
0 0 Garbage 52140 13,400
0 0 Surface Water Management Charge 52150 34,500
0 0 Other Utility Services 52160 2,900
0 0 Sewer Charges 52170 39,500
0 0 Contracted Services 52205 324,000
0 0 Landscape Services 52215 103,500
0 0 Professional Services 52240 0
0 0 Laundry 52260 0
0 0 Operating Supplies 52310 0
0 0 Gas, Oil, Lubrication 52315 0
0 0 Janitorial Supplies 52320 15,000
0 0 Repair & Maintenance Supplies 52330 60,000
0 0 Construction & Building Supplies 52335 87,500
0 0 Small Tools 52350 0
0 0 Postage & Freight 52375 0
0 0 Computer Equipment Expensed 52385 0
0 0 Dues & Memberships 52405 0
0 0 Books, Subscriptions & Publications 52410 0
0 0 Publication Notices 52430 1,000
0 0 Fueling Contract 52475 1,500
0 0 Training & Education 52480 0
0 0 Travel Expense 52485 0
0 0 Fleet Charges 52486 7,000
0 0 Private Mileage 52487 0
0 0 Other Materials & Services 52495 0
0 0 Permits, Licenses & Fees 52500 1,000
0 0 Taxes, Assessments & Liens 52510 35,000
0 0 Equipment Rental 52605 2,000
0 0 Repair & Maintenance Services 52610 241,000
0 0 1,184,800
0 0 1,702,2000 TOTAL EXPENDITURE
091 - Facilities Division
MATERIALS & SERVICES SUBTOTAL0
0
0
0
0
0
0
0
0
0
0
0
0
0
0
0
0
0
0
0
0
0
0
0
0
0
0
0
0
0
PERSONNEL EXPENSE SUBTOTAL
0
0
0
0
0
0
0
0
0
Enterprise Asset & Technical Services
Expenditure SummaryFY 2019 ACTUAL
0
EATS EXPENDITURE SUMMARY ▼ Facilities | 091-

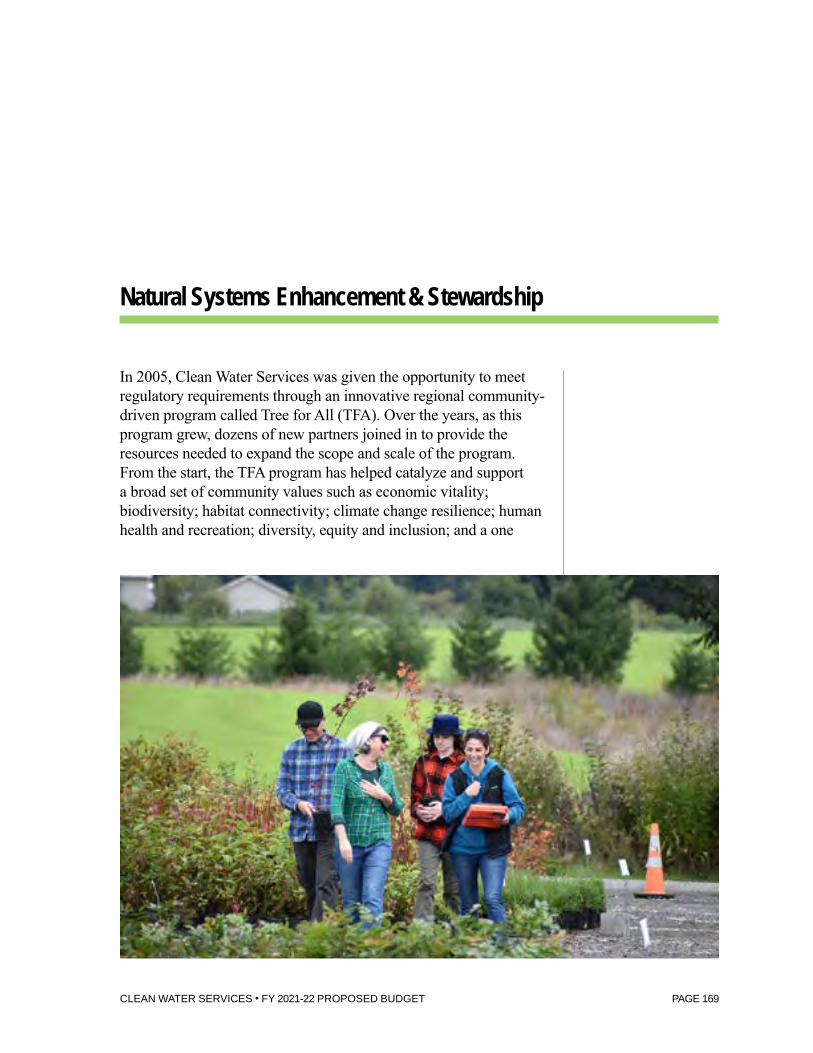
CLEAN WATER SERVICES • FY 2021-22 PROPOSED BUDGET PAGE 169
Natural Systems Enhancement & Stewardship
In 2005, Clean Water Services was given the opportunity to meet regulatory requirements through an innovative regional community-driven program called Tree for All (TFA). Over the years, as this program grew, dozens of new partners joined in to provide the resources needed to expand the scope and scale of the program. From the start, the TFA program has helped catalyze and support a broad set of community values such as economic vitality; biodiversity; habitat connectivity; climate change resilience; human health and recreation; diversity, equity and inclusion; and a one

CLEAN WATER SERVICES • FY 2021-22 PROPOSED BUDGET PAGE 170
water philosophy.
As a regional services provider, the Natural Systems Enhancement and Stewardship Department (NSES) is able to leverage millions of dollars for streamside enhancement from voluntary incentive Farm Bill programs; conservation districts; local parks and open space providers; city, state and federal governments; and more than two dozen nonprofit partners. Together these collective resources produce landscape-scale results (150 river miles enhanced with more than 14 million native plants) while supporting rural and urban economies and creating a resilient watershed. The department includes the Administration program and three new operating programs: Landscape Strategies, Project Delivery and Stewardship.
In partnership with Tree for All partners, NSES manages the People Protecting People program that supplies PPE to at-risk community groups, business recovery centers and agricultural workers.
NSES is committed to preventing and slowing the spread of the coronavirus and implemented a variety of strategies to protect employees and their families and to ensure the District continues to provide essential lifeline services to our customers. Staff use their vehicles as their primary office or work remotely as much as is appropriate, taking advantage of virtual resources to conduct business.
The FY 2021-22 budget includes an additional five FTE as compared to the FY 2020-21 revised budget. Two FTEs are new positions; three are transfers from the UOPS department to support operational structure changes. One of the new positions is a conversion of a temporary position, an Operations Coordinator, where the workload has proven to be sustained and long-term. The other new position is a Water Resources Program Manager in the new Project Delivery program.
NSES initiated an in-depth department assessment in January 2021 and decided to split the existing Operations program into three new operating programs. These programs will be formally created and staff assigned during the 2021-22 budget year. The Administration program supports the operating groups.
With great success comes new challenges and opportunities for NSES and Tree for All partners (www.jointreeforall.org). These challenges include the stewardship needs of more than 700 projects, expansion of DEI efforts through programs like Paseos Verdes and work on Butternut Creek, and expansion of landscape/watershed resilience strategies in rural and urban communities.
During this reorganization NSES will continue its existing

CLEAN WATER SERVICES • FY 2021-22 PROPOSED BUDGET PAGE 171
programming and, when given the opportunity, catalyze the power of transformational partnerships and outcomes like People Protecting People. These opportunities bring new TFA partners and an opportunity to connect with the rich cultural diversity of the region.
Landscape StrategiesThis program implements focused planning of integrated conservation strategies that assemble the resources and partnerships needed for a healthy and resilient watershed. Key elements of this work include:
● Integration of surface water regulations with natural systems. ● Strategic partnerships development. ● Subbasin management strategies. ● Information and technology tools.

CLEAN WATER SERVICES • FY 2021-22 PROPOSED BUDGET PAGE 172
Project DeliveryThis program brings together multidisciplinary partnerships to plan and execute urban and rural projects that support a healthy and resilient watershed. Key elements of this work include:
● Project development. ● Ecological enhancement. ● System improvements. ● Water resources management.
Stewardship ServicesThis program creates the network of community partners needed to provide cost-effective management of natural system assets for a healthy and resilient watershed. Key elements of this work include:
● Community partnerships. ● Long-term site preservation and maintenance. ● Resident programs. ● Natural systems response.
AdministrationThis program includes senior management for the department and traditional administrative support for the operating programs and support services. Staff provides general and fiscal management of the department’s programs.

CLEAN WATER SERVICES • FY 2021-22 PROPOSED BUDGET PAGE 173
OBJECT CODE FY 2019 ACTUAL FY 2020 ACTUAL FY 2021 REVISED BUDGET
FY 2022 PROPOSED BUDGET
Change from FY21 Budget
51100 1,345,465 1,380,952 2,135,200 2,528,900
51130 175,342 283,859 234,800 274,000
51140 1,956 6,715 0 0
51600 287,982 382,355 788,800 996,900
51900 1,044 2,100 2,000 2,600
51915 8,748 8,930 8,800 9,600
1,820,536 2,064,911 3,169,600 3,812,000 20.3%
52110 1,530 1,091 1,800 1,800
52140 582 0 0 0
52205 610,486 567,815 590,000 590,000
52240 14,264 3,206 30,000 30,000
52270 1,184,743 1,070,826 1,850,000 2,010,000
52305 951 1,231 1,000 1,000
52310 246 316 0 0
52315 452 574 0 0
52330 482 522 1,000 1,000
52335 93 0 0 0
52350 12,521 12,513 15,000 40,000
52360 770 127 2,000 2,000
52375 28 387 0 0
52380 4,990 15 0 0
52385 6,796 4,883 0 0
52405 7,635 6,609 8,000 7,000
52410 413 362 800 800
52425 285 749 2,000 2,000
52435 212 2,841 0 0
52470 7,835 8,013 10,000 25,000
52475 7,044 4,299 6,400 7,500
52480 28,410 15,972 22,000 22,000
52485 52,333 34,158 18,700 18,700
52486 8,796 11,500 9,000 9,000
52487 5,386 5,476 5,000 5,000
52495 214,766 320,383 404,000 404,000
52500 636 158 600 600
52510 9,563 9,728 12,000 10,000
52610 1,175 0 1,000 1,000
52620 0 0 1,000 1,000
2,183,423 2,083,752 2,991,300 3,189,400 6.6%
4,003,960 4,148,663 6,160,900 7,001,400 13.6%
Wages & Other Pay
Temporary
CWS Department Expenditure SummaryBudget Year: 2022
OBJECT CODE DESCRIPTION
Other Employee Allowances
Overtime
Other Personnel Expenses
Mobile Computing Allowance
PERSONNEL EXPENSE SUBTOTAL
Electricity
Contracted Services
Garbage
Professional Services
Gas, Oil, Lubrication
Other Government Services
Office Supplies
Operating Supplies
Small Tools
Safety Equipment
Postage & Freight
Repair & Maintenance Supplies
Construction & Building Supplies
Dues & Memberships
Books, Subscriptions & Publications
Software Expensed
Computer Equipment Expensed
Software Licenses & Support
Printing
Travel Expense
Fleet Charges
Private Mileage
Land & Building Rent
Fueling Contract
Training & Education
Taxes, Assessments & Liens
Other Materials & Services
Permits, Licenses & Fees
Repair & Maintenance Services
Non-vehicle Equipment Repair & Maintenance
TOTAL EXPENDITURE
Natural System Enhancement & Stewardship
MATERIALS & SERVICES SUBTOTAL
NATURALSYSTEMSENHANCEMENT&STEWARDSHIP▼ Department Summary

CLEAN WATER SERVICES • FY 2021-22 PROPOSED BUDGET PAGE 174
NATURAL SYSTEMS ENHANCEMENT & STEWARDSHIPPOSITION AND SALARY EXPENSE NATURAL SYSTEMS ENHANCEMENT & STEWARDSHIP 8233
TotalFY 2019 FY 2020 FY 2021 FY 2022 SALARY RepresentedACTUAL ACTUAL REVISED PROPOSED GRADE or
BUDGET BUDGET Non-Rep0.00 0.00 0.75 1.00 NSES Director 13 Non1.00 1.00 1.00 0.25 Operations Coordinator 5 Non0.00 0.00 0.00 0.25 Landscape Division Manager 11 Non0.00 0.00 0.00 0.25 Project Delivery Division Manager 11 Non0.00 0.00 0.00 0.25 Stewardship Services Division Manager 11 Non0.75 0.75 0.00 0.00 Watershed Mgmnt Dept Director 13 Non0.25 0.25 0.25 0.00 Water Supply Project Manager 11 Non0.25 0.25 0.25 0.00 Watershed Division Manager 11 Non
2.25 2.25 2.25 2.00 TOTAL PERSONNEL
OperatingFY 2019 FY 2020 FY 2021 FY 2022 SALARY RepresentedACTUAL ACTUAL REVISED PROPOSED GRADE or
BUDGET BUDGET Non-Rep0.00 0.00 0.75 1.00 NSES Director 13 Non1.00 1.00 1.00 0.25 Operations Coordinator 5 Non0.00 0.00 0.00 0.25 Landscape Division Manager 11 Non0.00 0.00 0.00 0.25 Project Delivery Division Manager 11 Non0.00 0.00 0.00 0.25 Stewardship Services Division Manager 11 Non0.75 0.75 0.00 0.00 Watershed Mgmnt Dept Director 13 Non0.25 0.25 0.25 0.00 Water Supply Project Manager 11 Non0.25 0.25 0.25 0.00 Watershed Division Manager 11 Non
2.25 2.25 2.25 2.00 TOTAL PERSONNEL
CapitalFY 2019 FY 2020 FY 2021 FY 2022 SALARY RepresentedACTUAL ACTUAL REVISED PROPOSED GRADE or
BUDGET BUDGET Non-Rep0.00 0.00 0.00 0.00 NSES Director 13 Non0.00 0.00 0.00 0.00 Operations Coordinator 5 Non0.00 0.00 0.00 0.00 Landscape Division Manager 11 Non0.00 0.00 0.00 0.00 Project Delivery Division Manager 11 Non0.00 0.00 0.00 0.00 Stewardship Services Division Manager 11 Non0.00 0.00 0.00 0.00 Watershed Mgmnt Dept Director 13 Non0.00 0.00 0.00 0.00 Water Supply Project Manager 11 Non0.00 0.00 0.00 0.00 Watershed Division Manager 11 Non
0.00 0.00 0.00 0.00 TOTAL PERSONNEL
CLASSIFICATION TITLE
CLASSIFICATION TITLE
CLASSIFICATION TITLE
NSESPOSITIONANDSALARYEXPENSE▼ Administration | 8233

CLEAN WATER SERVICES • FY 2021-22 PROPOSED BUDGET PAGE 175
FY 2020 ACTUAL
FY 2021 REVISED BUDGET OBJECT CODE DESCRIPTION OBJECT
CODEFY 2022
PROPOSEDFY 2022
APPROVEDFY 2022
ADOPTED233,577 313,800 Wages & Other Pay 51100 284,700
108,576 120,000 Temporary 51130 0
679 0 Overtime 51140 0
72,415 123,600 Other Personnel Expenses 51600 139,600
0 0 Other Employee Allowances 51900 0
1,046 1,000 Mobile Computing Allowance 51915 1,000
416,293 558,400 425,300
0 0 Electricity 52110 1,800
0 0 Garbage 52140 0
0 0 Contracted Services 52205 0
0 0 Professional Services 52240 0
0 0 Other Government Services 52270 0
185 1,000 Office Supplies 52305 1,000
17 0 Operating Supplies 52310 0
0 0 Gas, Oil, Lubrication 52315 0
0 0 Repair & Maintenance Supplies 52330 0
0 0 Construction & Building Supplies 52335 0
692 0 Small Tools 52350 0
0 0 Safety Equipment 52360 2,000
55 0 Postage & Freight 52375 0
0 0 Software Expensed 52380 0
0 0 Computer Equipment Expensed 52385 0
3,572 6,000 Dues & Memberships 52405 7,000
55 800 Books, Subscriptions & Publications 52410 800
0 0 Software Licenses & Support 52425 0
2,841 0 Printing 52435 0
0 0 Land & Building Rent 52470 0
260 600 Fueling Contract 52475 7,500
6,029 2,000 Training & Education 52480 7,000
5,229 4,500 Travel Expense 52485 18,700
297 0 Fleet Charges 52486 9,000
608 1,000 Private Mileage 52487 5,000
2,867 4,000 Other Materials & Services 52495 14,000
0 0 Permits, Licenses & Fees 52500 0
0 0 Taxes, Assessments & Liens 52510 0
0 0 Repair & Maintenance Services 52610 0
0 0 Non-vehicle Equipment Repair & Maintenance 52620 0
22,706 19,900 73,800
439,000 578,300 499,100
Natural System Enhancement & Stewardship
Expenditure Summary 8233 - Natural Systems Enhancement & Stewardship Administration
63,362
0
FY 2019 ACTUAL
227,509
68,569
1,124
0
1,006
361,570 PERSONNEL EXPENSE SUBTOTAL
0
0
5,055
0
0
93
2,923
770
732
56
21
413
0
212
28
0
0
5,200
3,957
8,873
628
683
3,469
0
397
0
0
399
0
395,480 TOTAL EXPENDITURE
33,910 MATERIALS & SERVICES SUBTOTAL
NSESEXPENDITURESUMMARY▼ Administration | 8233
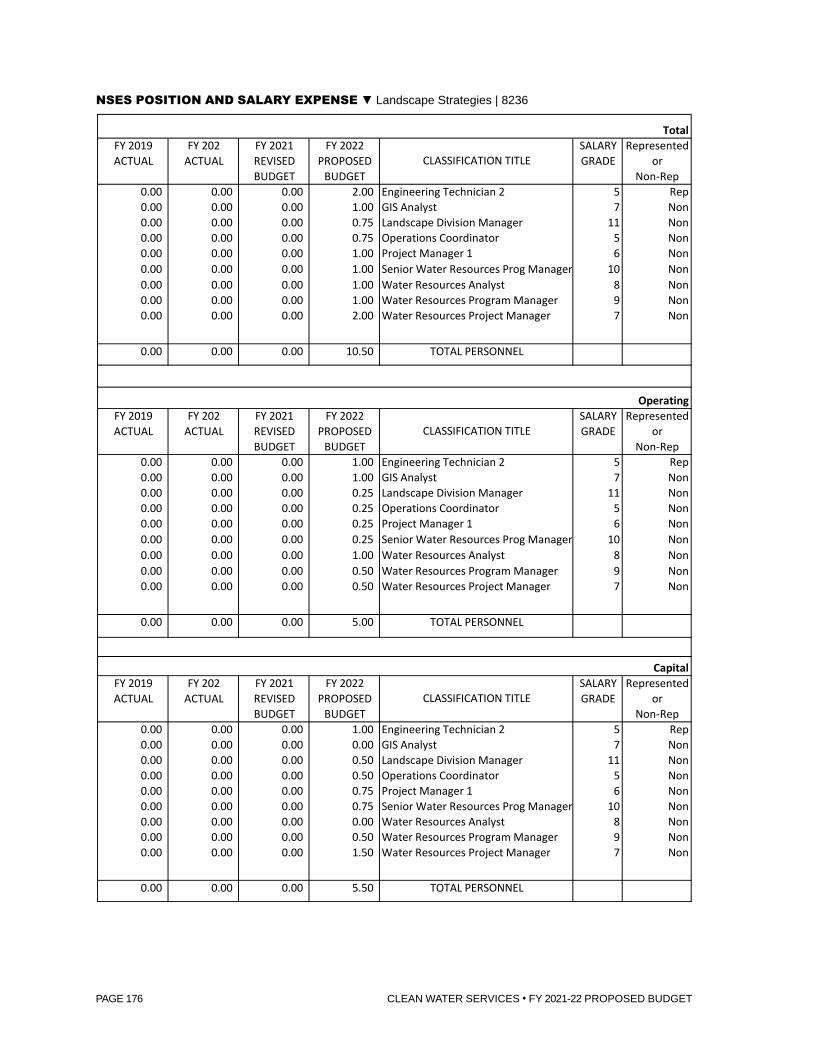
CLEAN WATER SERVICES • FY 2021-22 PROPOSED BUDGET PAGE 176
NATURAL SYSTEMS ENHANCEMENT & STEWARDSHIPPOSITION AND SALARY EXPENSE LANDSCAPE STRATEGIES 8236
TotalFY 2019 FY 202 FY 2021 FY 2022 SALARY RepresentedACTUAL ACTUAL REVISED PROPOSED GRADE or
BUDGET BUDGET Non-Rep0.00 0.00 0.00 2.00 Engineering Technician 2 5 Rep0.00 0.00 0.00 1.00 GIS Analyst 7 Non0.00 0.00 0.00 0.75 Landscape Division Manager 11 Non0.00 0.00 0.00 0.75 Operations Coordinator 5 Non0.00 0.00 0.00 1.00 Project Manager 1 6 Non0.00 0.00 0.00 1.00 Senior Water Resources Prog Manager 10 Non0.00 0.00 0.00 1.00 Water Resources Analyst 8 Non0.00 0.00 0.00 1.00 Water Resources Program Manager 9 Non0.00 0.00 0.00 2.00 Water Resources Project Manager 7 Non
0.00 0.00 0.00 10.50 TOTAL PERSONNEL
OperatingFY 2019 FY 202 FY 2021 FY 2022 SALARY RepresentedACTUAL ACTUAL REVISED PROPOSED GRADE or
BUDGET BUDGET Non-Rep0.00 0.00 0.00 1.00 Engineering Technician 2 5 Rep0.00 0.00 0.00 1.00 GIS Analyst 7 Non0.00 0.00 0.00 0.25 Landscape Division Manager 11 Non0.00 0.00 0.00 0.25 Operations Coordinator 5 Non0.00 0.00 0.00 0.25 Project Manager 1 6 Non0.00 0.00 0.00 0.25 Senior Water Resources Prog Manager 10 Non0.00 0.00 0.00 1.00 Water Resources Analyst 8 Non0.00 0.00 0.00 0.50 Water Resources Program Manager 9 Non0.00 0.00 0.00 0.50 Water Resources Project Manager 7 Non
0.00 0.00 0.00 5.00 TOTAL PERSONNEL
CapitalFY 2019 FY 202 FY 2021 FY 2022 SALARY RepresentedACTUAL ACTUAL REVISED PROPOSED GRADE or
BUDGET BUDGET Non-Rep0.00 0.00 0.00 1.00 Engineering Technician 2 5 Rep0.00 0.00 0.00 0.00 GIS Analyst 7 Non0.00 0.00 0.00 0.50 Landscape Division Manager 11 Non0.00 0.00 0.00 0.50 Operations Coordinator 5 Non0.00 0.00 0.00 0.75 Project Manager 1 6 Non0.00 0.00 0.00 0.75 Senior Water Resources Prog Manager 10 Non0.00 0.00 0.00 0.00 Water Resources Analyst 8 Non0.00 0.00 0.00 0.50 Water Resources Program Manager 9 Non0.00 0.00 0.00 1.50 Water Resources Project Manager 7 Non
0.00 0.00 0.00 5.50 TOTAL PERSONNEL
CLASSIFICATION TITLE
CLASSIFICATION TITLE
CLASSIFICATION TITLE
NSESPOSITIONANDSALARYEXPENSE▼ Landscape Strategies | 8236

CLEAN WATER SERVICES • FY 2021-22 PROPOSED BUDGET PAGE 177
FY 2020 ACTUAL
FY 2021 REVISED BUDGET OBJECT CODE DESCRIPTION OBJECT
CODEFY 2022
PROPOSEDFY 2022
APPROVEDFY 2022
ADOPTED0 0 Wages & Other Pay 51100 856,100
0 0 Temporary 51130 64,000
0 0 Overtime 51140 0
0 0 Other Personnel Expenses 51600 271,200
0 0 Other Employee Allowances 51900 800
0 0 Mobile Computing Allowance 51915 2,600
0 0 1,194,700
0 0 Electricity 52110 0
0 0 Garbage 52140 0
0 0 Contracted Services 52205 100,000
0 0 Professional Services 52240 30,000
0 0 Other Government Services 52270 50,000
0 0 Office Supplies 52305 0
0 0 Operating Supplies 52310 0
0 0 Gas, Oil, Lubrication 52315 0
0 0 Repair & Maintenance Supplies 52330 0
0 0 Construction & Building Supplies 52335 0
0 0 Small Tools 52350 40,000
0 0 Safety Equipment 52360 0
0 0 Postage & Freight 52375 0
0 0 Software Expensed 52380 0
0 0 Computer Equipment Expensed 52385 0
0 0 Dues & Memberships 52405 0
0 0 Books, Subscriptions & Publications 52410 0
0 0 Software Licenses & Support 52425 2,000
0 0 Printing 52435 0
0 0 Land & Building Rent 52470 0
0 0 Fueling Contract 52475 0
0 0 Training & Education 52480 5,000
0 0 Travel Expense 52485 0
0 0 Fleet Charges 52486 0
0 0 Private Mileage 52487 0
0 0 Other Materials & Services 52495 50,000
0 0 Permits, Licenses & Fees 52500 0
0 0 Taxes, Assessments & Liens 52510 0
0 0 Repair & Maintenance Services 52610 0
0 0 Non-vehicle Equipment Repair & Maintenance 52620 0
0 0 277,000
0 0 1,471,700
Natural System Enhancement & Stewardship
Expenditure Summary 8236 - Landscape Strategies
0
0
FY 2019 ACTUAL
0
0
0
0
0
0 PERSONNEL EXPENSE SUBTOTAL
0
0
0
0
0
0
0
0
0
0
0
0
0
0
0
0
0
0
0
0
0
0
0
0
0
0
0
0
0
0 TOTAL EXPENDITURE
0 MATERIALS & SERVICES SUBTOTAL
NSESEXPENDITURESUMMARY▼ Landscape Strategies | 8236

CLEAN WATER SERVICES • FY 2021-22 PROPOSED BUDGET PAGE 178
NATURAL SYSTEMS ENHANCEMENT & STEWARDSHIPPOSITION AND SALARY EXPENSE PROJECT DELIVERY 8237
TotalFY 2019 FY 202 FY 2021 FY 2022 SALARY RepresentedACTUAL ACTUAL REVISED PROPOSED GRADE or
BUDGET BUDGET Non-Rep0.00 0.00 0.00 1.00 Engineer 8 Non0.00 0.00 0.00 1.00 Engineering Project Coordinator 7 Non0.00 0.00 0.00 1.00 Engineering Technician 3 6 Rep0.00 0.00 0.00 1.00 Operations Coordinator 5 Non0.00 0.00 0.00 1.00 Principal Engineer 10 Non0.00 0.00 0.00 0.75 Project Delivery Division Manager 11 Non0.00 0.00 0.00 1.00 Senior Engineer 9 Non0.00 0.00 0.00 2.00 Water Resources Analyst 8 Non0.00 0.00 0.00 1.00 Water Resources Program Manager 9 Non0.00 0.00 0.00 1.50 Water Resources Project Manager 7 Non0.00 0.00 0.00 1.00 Water Resources Specialist 4 Rep
0.00 0.00 0.00 12.25 TOTAL PERSONNEL
OperatingFY 2019 FY 202 FY 2021 FY 2022 SALARY RepresentedACTUAL ACTUAL REVISED PROPOSED GRADE or
BUDGET BUDGET Non-Rep0.00 0.00 0.00 0.50 Engineer 8 Non0.00 0.00 0.00 0.25 Engineering Project Coordinator 7 Non0.00 0.00 0.00 0.50 Engineering Technician 3 6 Rep0.00 0.00 0.00 0.50 Operations Coordinator 5 Non0.00 0.00 0.00 0.25 Principal Engineer 10 Non0.00 0.00 0.00 0.25 Project Delivery Division Manager 11 Non0.00 0.00 0.00 0.50 Senior Engineer 9 Non0.00 0.00 0.00 1.00 Water Resources Analyst 8 Non0.00 0.00 0.00 0.50 Water Resources Program Manager 9 Non0.00 0.00 0.00 0.50 Water Resources Project Manager 7 Non0.00 0.00 0.00 0.75 Water Resources Specialist 4 Rep
0.00 0.00 0.00 5.50 TOTAL PERSONNEL
CapitalFY 2019 FY 202 FY 2021 FY 2022 SALARY RepresentedACTUAL ACTUAL REVISED PROPOSED GRADE or
BUDGET BUDGET Non-Rep0.00 0.00 0.00 0.50 Engineer 8 Non0.00 0.00 0.00 0.75 Engineering Project Coordinator 7 Non0.00 0.00 0.00 0.50 Engineering Technician 3 6 Rep0.00 0.00 0.00 0.50 Operations Coordinator 5 Non0.00 0.00 0.00 0.75 Principal Engineer 10 Non0.00 0.00 0.00 0.50 Project Delivery Division Manager 11 Non0.00 0.00 0.00 0.50 Senior Engineer 9 Non0.00 0.00 0.00 1.00 Water Resources Analyst 8 Non0.00 0.00 0.00 0.50 Water Resources Program Manager 9 Non0.00 0.00 0.00 1.00 Water Resources Project Manager 7 Non0.00 0.00 0.00 0.25 Water Resources Specialist 4 Rep
0.00 0.00 0.00 6.75 TOTAL PERSONNEL
CLASSIFICATION TITLE
CLASSIFICATION TITLE
CLASSIFICATION TITLE
NSESPOSITIONANDSALARYEXPENSE▼ Project Delivery | 8237

CLEAN WATER SERVICES • FY 2021-22 PROPOSED BUDGET PAGE 179
FY 2020 ACTUAL
FY 2021 REVISED BUDGET OBJECT CODE DESCRIPTION OBJECT
CODEFY 2022
PROPOSEDFY 2022
APPROVEDFY 2022
ADOPTED0 0 Wages & Other Pay 51100 1,114,000
0 0 Temporary 51130 150,000
0 0 Overtime 51140 0
0 0 Other Personnel Expenses 51600 458,900
0 0 Other Employee Allowances 51900 1,100
0 0 Mobile Computing Allowance 51915 4,600
0 0 1,728,600
0 0 Electricity 52110 0
0 0 Garbage 52140 0
0 0 Contracted Services 52205 150,000
0 0 Professional Services 52240 0
0 0 Other Government Services 52270 210,000
0 0 Office Supplies 52305 0
0 0 Operating Supplies 52310 0
0 0 Gas, Oil, Lubrication 52315 0
0 0 Repair & Maintenance Supplies 52330 0
0 0 Construction & Building Supplies 52335 0
0 0 Small Tools 52350 0
0 0 Safety Equipment 52360 0
0 0 Postage & Freight 52375 0
0 0 Software Expensed 52380 0
0 0 Computer Equipment Expensed 52385 0
0 0 Dues & Memberships 52405 0
0 0 Books, Subscriptions & Publications 52410 0
0 0 Software Licenses & Support 52425 0
0 0 Printing 52435 0
0 0 Land & Building Rent 52470 0
0 0 Fueling Contract 52475 0
0 0 Training & Education 52480 5,000
0 0 Travel Expense 52485 0
0 0 Fleet Charges 52486 0
0 0 Private Mileage 52487 0
0 0 Other Materials & Services 52495 40,000
0 0 Permits, Licenses & Fees 52500 0
0 0 Taxes, Assessments & Liens 52510 0
0 0 Repair & Maintenance Services 52610 0
0 0 Non-vehicle Equipment Repair & Maintenance 52620 0
0 0 405,000
0 0 2,133,600
Natural System Enhancement & Stewardship
Expenditure Summary 8237 - Project Delivery
0
0
FY 2019 ACTUAL
0
0
0
0
0
0 PERSONNEL EXPENSE SUBTOTAL
0
0
0
0
0
0
0
0
0
0
0
0
0
0
0
0
0
0
0
0
0
0
0
0
0
0
0
0
0
0 TOTAL EXPENDITURE
0 MATERIALS & SERVICES SUBTOTAL
NSESEXPENDITURESUMMARY▼ Project Delivery | 8237

CLEAN WATER SERVICES • FY 2021-22 PROPOSED BUDGET PAGE 180
NATURAL SYSTEMS ENHANCEMENT & STEWARDSHIPPOSITION AND SALARY EXPENSE STEWARDSHIP 8238
TotalFY 2019 FY 202 FY 2021 FY 2022 SALARY RepresentedACTUAL ACTUAL REVISED PROPOSED GRADE or
BUDGET BUDGET Non-Rep0.00 0.00 0.00 0.75 Stewardship Services Division Manager 11 Non0.00 0.00 0.00 2.00 Project Manager 1 6 Non0.00 0.00 0.00 0.50 Water Resources Project Manager 7 Non0.00 0.00 0.00 1.00 Water Resources Specialist 4 Rep
0.00 0.00 0.00 4.25 TOTAL PERSONNEL
OperatingFY 2019 FY 202 FY 2021 FY 2022 SALARY RepresentedACTUAL ACTUAL REVISED PROPOSED GRADE or
BUDGET BUDGET Non-Rep0.00 0.00 0.00 0.50 Stewardship Services Division Manager 11 Non0.00 0.00 0.00 1.00 Project Manager 1 6 Non0.00 0.00 0.00 0.25 Water Resources Project Manager 7 Non0.00 0.00 0.00 0.75 Water Resources Specialist 4 Rep
0.00 0.00 0.00 2.50 TOTAL PERSONNEL
CapitalFY 2019 FY 202 FY 2021 FY 2022 SALARY RepresentedACTUAL ACTUAL REVISED PROPOSED GRADE or
BUDGET BUDGET Non-Rep0.00 0.00 0.00 0.25 Stewardship Services Division Manager 11 Non0.00 0.00 0.00 1.00 Project Manager 1 6 Non0.00 0.00 0.00 0.25 Water Resources Project Manager 7 Non0.00 0.00 0.00 0.25 Water Resources Specialist 4 Rep
0.00 0.00 0.00 1.75 TOTAL PERSONNEL
CLASSIFICATION TITLE
CLASSIFICATION TITLE
CLASSIFICATION TITLE
NSESPOSITIONANDSALARYEXPENSE▼ Stewardship | 8238

CLEAN WATER SERVICES • FY 2021-22 PROPOSED BUDGET PAGE 181
FY 2020 ACTUAL
FY 2021 REVISED BUDGET OBJECT CODE DESCRIPTION OBJECT
CODEFY 2022
PROPOSEDFY 2022
APPROVEDFY 2022
ADOPTED0 0 Wages & Other Pay 51100 274,100
0 0 Temporary 51130 60,000
0 0 Overtime 51140 0
0 0 Other Personnel Expenses 51600 127,200
0 0 Other Employee Allowances 51900 700
0 0 Mobile Computing Allowance 51915 1,400
0 0 463,400
0 0 Electricity 52110 0
0 0 Garbage 52140 0
0 0 Contracted Services 52205 340,000
0 0 Professional Services 52240 0
0 0 Other Government Services 52270 1,750,000
0 0 Office Supplies 52305 0
0 0 Operating Supplies 52310 0
0 0 Gas, Oil, Lubrication 52315 0
0 0 Repair & Maintenance Supplies 52330 1,000
0 0 Construction & Building Supplies 52335 0
0 0 Small Tools 52350 0
0 0 Safety Equipment 52360 0
0 0 Postage & Freight 52375 0
0 0 Software Expensed 52380 0
0 0 Computer Equipment Expensed 52385 0
0 0 Dues & Memberships 52405 0
0 0 Books, Subscriptions & Publications 52410 0
0 0 Software Licenses & Support 52425 0
0 0 Printing 52435 0
0 0 Land & Building Rent 52470 25,000
0 0 Fueling Contract 52475 0
0 0 Training & Education 52480 5,000
0 0 Travel Expense 52485 0
0 0 Fleet Charges 52486 0
0 0 Private Mileage 52487 0
0 0 Other Materials & Services 52495 300,000
0 0 Permits, Licenses & Fees 52500 600
0 0 Taxes, Assessments & Liens 52510 10,000
0 0 Repair & Maintenance Services 52610 1,000
0 0 Non-vehicle Equipment Repair & Maintenance 52620 1,000
0 0 2,433,600
0 0 2,897,000
Natural System Enhancement & Stewardship
Expenditure Summary 8238 - Stewardship
0
0
FY 2019 ACTUAL
0
0
0
0
0
0 PERSONNEL EXPENSE SUBTOTAL
0
0
0
0
0
0
0
0
0
0
0
0
0
0
0
0
0
0
0
0
0
0
0
0
0
0
0
0
0
0 TOTAL EXPENDITURE
0 MATERIALS & SERVICES SUBTOTAL
NSESEXPENDITURESUMMARY▼ Stewardship | 8238
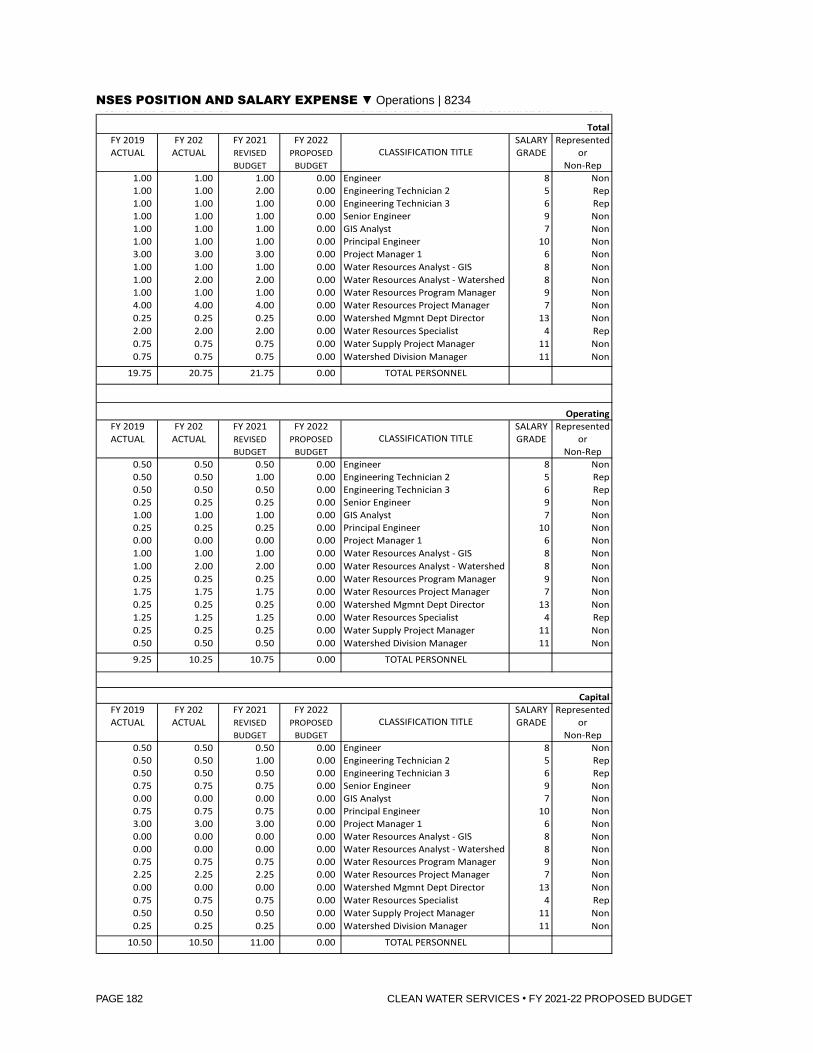
CLEAN WATER SERVICES • FY 2021-22 PROPOSED BUDGET PAGE 182
NATURAL SYSTEMS ENHANCEMENT & STEWARDSHIPPOSITION AND SALARY EXPENSE NATURAL SYSTEMS ENHANCEMENT & STEWARDSHIP 8234
TotalFY 2019 FY 202 FY 2021 FY 2022 SALARY RepresentedACTUAL ACTUAL REVISED PROPOSED GRADE or
BUDGET BUDGET Non-Rep1.00 1.00 1.00 0.00 Engineer 8 Non1.00 1.00 2.00 0.00 Engineering Technician 2 5 Rep1.00 1.00 1.00 0.00 Engineering Technician 3 6 Rep1.00 1.00 1.00 0.00 Senior Engineer 9 Non1.00 1.00 1.00 0.00 GIS Analyst 7 Non1.00 1.00 1.00 0.00 Principal Engineer 10 Non3.00 3.00 3.00 0.00 Project Manager 1 6 Non1.00 1.00 1.00 0.00 Water Resources Analyst - GIS 8 Non1.00 2.00 2.00 0.00 Water Resources Analyst - Watershed 8 Non1.00 1.00 1.00 0.00 Water Resources Program Manager 9 Non4.00 4.00 4.00 0.00 Water Resources Project Manager 7 Non0.25 0.25 0.25 0.00 Watershed Mgmnt Dept Director 13 Non2.00 2.00 2.00 0.00 Water Resources Specialist 4 Rep0.75 0.75 0.75 0.00 Water Supply Project Manager 11 Non0.75 0.75 0.75 0.00 Watershed Division Manager 11 Non
19.75 20.75 21.75 0.00 TOTAL PERSONNEL
OperatingFY 2019 FY 202 FY 2021 FY 2022 SALARY RepresentedACTUAL ACTUAL REVISED PROPOSED GRADE or
BUDGET BUDGET Non-Rep0.50 0.50 0.50 0.00 Engineer 8 Non0.50 0.50 1.00 0.00 Engineering Technician 2 5 Rep0.50 0.50 0.50 0.00 Engineering Technician 3 6 Rep0.25 0.25 0.25 0.00 Senior Engineer 9 Non1.00 1.00 1.00 0.00 GIS Analyst 7 Non0.25 0.25 0.25 0.00 Principal Engineer 10 Non0.00 0.00 0.00 0.00 Project Manager 1 6 Non1.00 1.00 1.00 0.00 Water Resources Analyst - GIS 8 Non1.00 2.00 2.00 0.00 Water Resources Analyst - Watershed 8 Non0.25 0.25 0.25 0.00 Water Resources Program Manager 9 Non1.75 1.75 1.75 0.00 Water Resources Project Manager 7 Non0.25 0.25 0.25 0.00 Watershed Mgmnt Dept Director 13 Non1.25 1.25 1.25 0.00 Water Resources Specialist 4 Rep0.25 0.25 0.25 0.00 Water Supply Project Manager 11 Non0.50 0.50 0.50 0.00 Watershed Division Manager 11 Non9.25 10.25 10.75 0.00 TOTAL PERSONNEL
CapitalFY 2019 FY 202 FY 2021 FY 2022 SALARY RepresentedACTUAL ACTUAL REVISED PROPOSED GRADE or
BUDGET BUDGET Non-Rep0.50 0.50 0.50 0.00 Engineer 8 Non0.50 0.50 1.00 0.00 Engineering Technician 2 5 Rep0.50 0.50 0.50 0.00 Engineering Technician 3 6 Rep0.75 0.75 0.75 0.00 Senior Engineer 9 Non0.00 0.00 0.00 0.00 GIS Analyst 7 Non0.75 0.75 0.75 0.00 Principal Engineer 10 Non3.00 3.00 3.00 0.00 Project Manager 1 6 Non0.00 0.00 0.00 0.00 Water Resources Analyst - GIS 8 Non0.00 0.00 0.00 0.00 Water Resources Analyst - Watershed 8 Non0.75 0.75 0.75 0.00 Water Resources Program Manager 9 Non2.25 2.25 2.25 0.00 Water Resources Project Manager 7 Non0.00 0.00 0.00 0.00 Watershed Mgmnt Dept Director 13 Non0.75 0.75 0.75 0.00 Water Resources Specialist 4 Rep0.50 0.50 0.50 0.00 Water Supply Project Manager 11 Non0.25 0.25 0.25 0.00 Watershed Division Manager 11 Non
10.50 10.50 11.00 0.00 TOTAL PERSONNEL
CLASSIFICATION TITLE
CLASSIFICATION TITLE
CLASSIFICATION TITLE
NSESPOSITIONANDSALARYEXPENSE▼ Operations | 8234
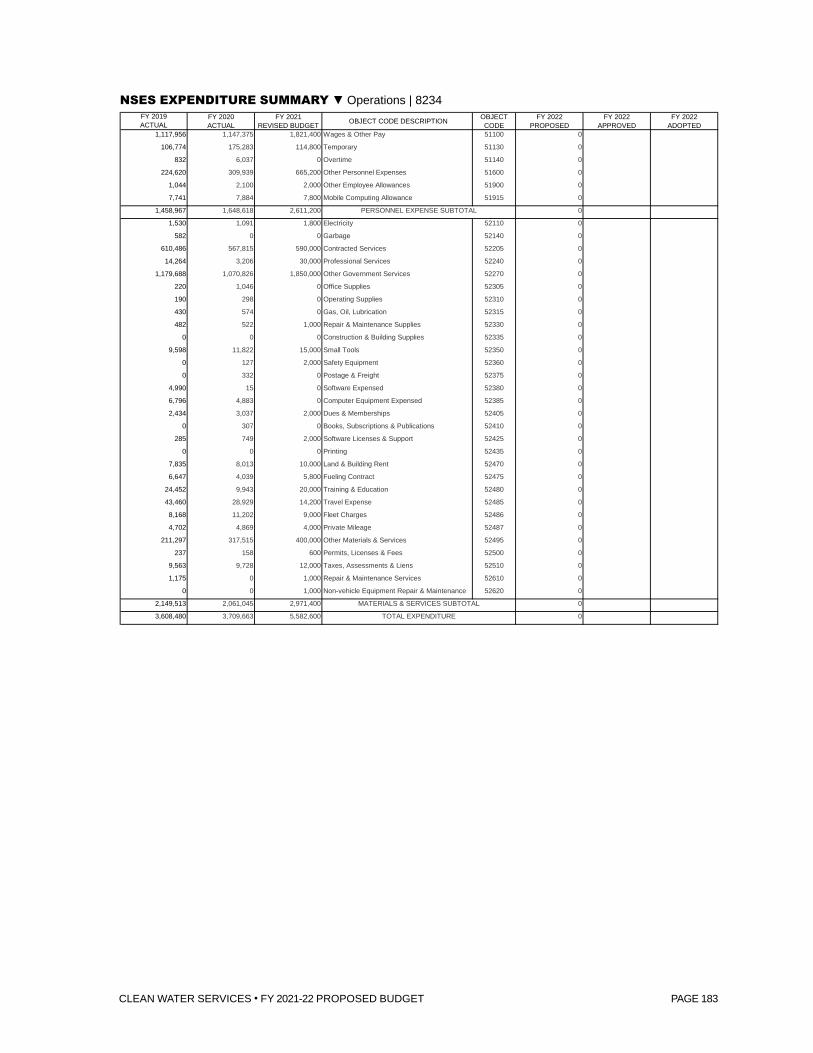
CLEAN WATER SERVICES • FY 2021-22 PROPOSED BUDGET PAGE 183
FY 2020 ACTUAL
FY 2021 REVISED BUDGET OBJECT CODE DESCRIPTION OBJECT
CODEFY 2022
PROPOSEDFY 2022
APPROVEDFY 2022
ADOPTED1,147,375 1,821,400 Wages & Other Pay 51100 0
175,283 114,800 Temporary 51130 0
6,037 0 Overtime 51140 0
309,939 665,200 Other Personnel Expenses 51600 0
2,100 2,000 Other Employee Allowances 51900 0
7,884 7,800 Mobile Computing Allowance 51915 0
1,648,618 2,611,200 0
1,091 1,800 Electricity 52110 0
0 0 Garbage 52140 0
567,815 590,000 Contracted Services 52205 0
3,206 30,000 Professional Services 52240 0
1,070,826 1,850,000 Other Government Services 52270 0
1,046 0 Office Supplies 52305 0
298 0 Operating Supplies 52310 0
574 0 Gas, Oil, Lubrication 52315 0
522 1,000 Repair & Maintenance Supplies 52330 0
0 0 Construction & Building Supplies 52335 0
11,822 15,000 Small Tools 52350 0
127 2,000 Safety Equipment 52360 0
332 0 Postage & Freight 52375 0
15 0 Software Expensed 52380 0
4,883 0 Computer Equipment Expensed 52385 0
3,037 2,000 Dues & Memberships 52405 0
307 0 Books, Subscriptions & Publications 52410 0
749 2,000 Software Licenses & Support 52425 0
0 0 Printing 52435 0
8,013 10,000 Land & Building Rent 52470 0
4,039 5,800 Fueling Contract 52475 0
9,943 20,000 Training & Education 52480 0
28,929 14,200 Travel Expense 52485 0
11,202 9,000 Fleet Charges 52486 0
4,869 4,000 Private Mileage 52487 0
317,515 400,000 Other Materials & Services 52495 0
158 600 Permits, Licenses & Fees 52500 0
9,728 12,000 Taxes, Assessments & Liens 52510 0
0 1,000 Repair & Maintenance Services 52610 0
0 1,000 Non-vehicle Equipment Repair & Maintenance 52620 0
2,061,045 2,971,400 0
3,709,663 5,582,600 0
Natural System Enhancement & Stewardship
Expenditure Summary 8234 - Natural Systems Enhancement & Stewardship Operations
224,620
1,044
FY 2019 ACTUAL
1,117,956
106,774
832
582
7,741
1,458,967 PERSONNEL EXPENSE SUBTOTAL
1,530
14,264
1,179,688
610,486
482
0
9,598
0
220
190
430
0
285
0
0
4,990
6,796
2,434
24,452
43,460
8,168
4,702
211,297
7,835
6,647
1,175
0
237
9,563
3,608,480 TOTAL EXPENDITURE
2,149,513 MATERIALS & SERVICES SUBTOTAL
NSESEXPENDITURESUMMARY▼ Operations | 8234


CLEAN WATER SERVICES • FY 2021-22 PROPOSED BUDGET PAGE 185
Regional Utilities Services
The Regional Utilities Services Department (RUSD) is responsible for customer relations, economic development and community planning, strategic integrated planning and policy development and utility intergovernmental relations. Staff in these programs manage and administer the District’s intergovernmental agreements (IGAs) with its co-implementing cities, Washington County, City of Portland and other partners, develop the policies and standards for new development and build transformative relationships with land use and community development, public works and engineering

CLEAN WATER SERVICES • FY 2021-22 PROPOSED BUDGET PAGE 186
programs at our partner agencies. The department manages private development permitting, environmental and engineering design plan review and construction oversight. The department consists of Administration, Development Services and Systems Delivery Planning Services.
RUSD is a new department beginning in FY 2021-22, created by reorganizing multiple programs within Utility Operations & Services and the Office of the CEO to better provide services across the District.
The FY 2021-22 RUSD budget reflects the transfer of 31 existing FTE from Utility Operations & Services and one FTE from Business Services as well as two new FTE. One of the new positions is a conversion of a temporary position, an Administrative Assistant in UOPS, where the workload has proven to be sustained and long-term. The other new position is a Policy Coordinator in the Administration program to assist with integrated planning.
Administration This program includes the senior management for the department. Staff provides general and fiscal management of the department’s programs and interacts with external agencies on a wide variety of technical and policy issues. The program is responsible for developing high level policy and relationship strategies using an integrative approach. This work includes interaction with community and professional organizations and collaborative efforts with other jurisdictions through the Co-Implementer Committee, Capital Improvement Plan Prioritization and Coordinating Committee and other partnering efforts. It also includes long-range strategic planning and policy development around climate adaptation, sustainability and resilience.
Development Services Development Services provides local program services related to private development within the unincorporated area and cities of Banks, Durham, Gaston, King City and North Plains. These local program services include technical research and customer service; plan review, administration and inspection of vegetated corridor improvements, erosion control, sanitary sewer, and stormwater quality and quantity facilities; and permit issuance for sanitary sewer, surface water and erosion control. Also included in the division is the administration of the private stormwater quality facilities inspection program.

CLEAN WATER SERVICES • FY 2021-22 PROPOSED BUDGET PAGE 187
The program provides regional program services to the entire service area and all cities including environmental plan review, acting as DEQ’s agent for the 1200-C erosion control permit program, technical assistance, interpretation and training on the Design and Construction Standards, and performing oversight of plan reviews across all the co-implementer programs to ensure consistency in application of the Standards. The division maintains the record mapping system for the sanitary and surface water systems including regular import of information from the co-implementers. Along with Systems Delivery Planning Services, Development Services facilitates and coordinates the implementation of both local and regional infrastructure projects between District and co-implementer private development projects and participates in coordinated long-range systems and land use planning efforts.
Systems Planning Systems Planning leads the regional integration of Districtwide capital planning and analysis, coordinates interagency capital improvement design and construction, and assists with the integration of developer-constructed infrastructure to assure capacity for growth in both the sanitary and storm sewer systems. Along with Development Services, Systems Planning facilitates and coordinates the implementation of local and regional infrastructure projects between District and co-implementer private development projects and participates in coordinated long-range systems and land use planning efforts, including providing Geographic Information System analysis services supporting District programs. The program also provides regional quality control, compliance oversight and coordinated performance reporting of plan review, erosion control and vegetated corridor inspection programs across the District.


CLEAN WATER SERVICES • FY 2021-22 PROPOSED BUDGET PAGE 189
OBJECT CODE FY 2019 ACTUAL FY 2020 ACTUAL FY 2021 REVISED BUDGET
FY 2022 PROPOSED BUDGET
Change from FY21 Budget
51100 0 0 0 3,299,100
51130 0 0 0 95,000
51140 0 0 0 6,000
51600 0 0 0 1,318,800
51900 0 0 0 3,000
51915 0 0 0 4,400
0 0 0 4,726,300
52240 0 0 0 460,000
52250 0 0 0 14,000
52270 0 0 0 456,000
52305 0 0 0 3,000
52350 0 0 0 1,300
52360 0 0 0 200
52405 0 0 0 7,800
52410 0 0 0 700
52430 0 0 0 1,000
52435 0 0 0 5,900
52475 0 0 0 10,500
52480 0 0 0 9,600
52485 0 0 0 9,500
52486 0 0 0 6,500
52487 0 0 0 4,800
52495 0 0 0 13,500
52515 0 0 0 13,000
52630 0 0 0 3,000
0 0 0 1,020,300
0 0 0 5,746,600
Wages & Other Pay
Temporary
CWS Department Expenditure SummaryBudget Year: 2022
OBJECT CODE DESCRIPTION
Other Employee Allowances
Overtime
Other Personnel Expenses
Mobile Computing Allowance
PERSONNEL EXPENSE SUBTOTAL
Professional Services
Recording Fees
Other Government Services
Office Supplies
Small Tools
Safety Equipment
Dues & Memberships
Books, Subscriptions & Publications
Publication Notices
Printing
Travel Expense
Fleet Charges
Private Mileage
Fueling Contract
Training & Education
Bank Service Charge
Other Materials & Services
Computer Repair & Maintenance
TOTAL EXPENDITURE
Regional Utilities Services Department
MATERIALS & SERVICES SUBTOTAL
REGIONALUTILITIESSERVICES▼ Department Summary

CLEAN WATER SERVICES • FY 2021-22 PROPOSED BUDGET PAGE 190
REGIONAL UTILITIES SERVICESPOSITION AND SALARY EXPENSE ADMINISTRATION 8201
TotalFY 2019 FY 2020 FY 2021 FY 2022 RepresentedACTUAL ACTUAL REVISED PROPOSED or
BUDGET BUDGET Non-Rep0.00 0.00 0.00 1.00 Administrative Assistant 4 Non0.00 0.00 0.00 1.00 Business Practice Leader 1 - Integrated Planning 10 Non0.00 0.00 0.00 1.00 Planning & Development Services Division Manager 11 Non0.00 0.00 0.00 1.00 Policy Coordinator 6 Non0.00 0.00 0.00 1.00 Systems Planning Division Manager 11 Non
0.00 0.00 0.00 5.00 TOTAL PERSONNEL
OperatingFY 2019 FY 2020 FY 2021 FY 2022 RepresentedACTUAL ACTUAL REVISED PROPOSED or
BUDGET BUDGET Non-Rep0.00 0.00 0.00 0.75 Administrative Assistant 4 Non0.00 0.00 0.00 1.00 Business Practice Leader 1 - Integrated Planning 10 Non0.00 0.00 0.00 0.85 Planning & Development Services Division Manager 11 Non0.00 0.00 0.00 1.00 Policy Coordinator 6 Non0.00 0.00 0.00 0.85 Systems Planning Division Manager 11 Non
0.00 0.00 0.00 4.45 TOTAL PERSONNEL
CapitalFY 2019 FY 2020 FY 2021 FY 2022 RepresentedACTUAL ACTUAL REVISED PROPOSED or
BUDGET BUDGET Non-Rep0.00 0.00 0.00 0.25 Administrative Assistant 4 Non0.00 0.00 0.00 0.00 Business Practice Leader 1 - Integrated Planning 10 Non0.00 0.00 0.00 0.15 Planning & Development Services Division Manager 11 Non0.00 0.00 0.00 0.00 Policy Coordinator 6 Non0.00 0.00 0.00 0.15 Systems Planning Division Manager 11 Non
0.00 0.00 0.00 0.55 TOTAL PERSONNEL
CLASSIFICATION TITLE SALARY GRADE
CLASSIFICATION TITLE SALARY GRADE
CLASSIFICATION TITLE SALARY GRADE
RUSDPOSITIONANDSALARYEXPENSE▼ Administration | 8201

CLEAN WATER SERVICES • FY 2021-22 PROPOSED BUDGET PAGE 191
FY 2020 ACTUAL
FY 2021 REVISED BUDGET OBJECT CODE DESCRIPTION OBJECT
CODEFY 2022
PROPOSEDFY 2022
APPROVEDFY 2022
ADOPTED0 0 Wages & Other Pay 51100 662,900
0 0 Temporary 51130 0
0 0 Overtime 51140 0
0 0 Other Personnel Expenses 51600 268,500
0 0 Other Employee Allowances 51900 200
0 0 Mobile Computing Allowance 51915 2,400
0 0 934,000
0 0 Professional Services 52240 210,000
0 0 Recording Fees 52250 0
0 0 Other Government Services 52270 455,000
0 0 Office Supplies 52305 1,000
0 0 Small Tools 52350 0
0 0 Safety Equipment 52360 0
0 0 Dues & Memberships 52405 4,000
0 0 Books, Subscriptions & Publications 52410 300
0 0 Publication Notices 52430 0
0 0 Printing 52435 300
0 0 Fueling Contract 52475 0
0 0 Training & Education 52480 2,000
0 0 Travel Expense 52485 3,300
0 0 Fleet Charges 52486 0
0 0 Private Mileage 52487 3,600
0 0 Other Materials & Services 52495 5,000
0 0 Bank Service Charge 52515 0
0 0 Franchise Fees 52530 0
0 0 Payment Adjustment to Cities 52540 0
0 0 Computer Repair & Maintenance 52630 0
0 0 684,500
0 0 1,618,5000 TOTAL EXPENDITURE
0 MATERIALS & SERVICES SUBTOTAL
0
0
0
0
0
0
0
0
0
0
0
0
0
0
0
0
0
0
0
0
0
0 PERSONNEL EXPENSE SUBTOTAL
0
0
FY 2019 ACTUAL
0
0
0
Regional Utilities Services Department
Expenditure Summary 8201 - AdministrationRUSDEXPENDITURESUMMARY▼ Administration | 8201

CLEAN WATER SERVICES • FY 2021-22 PROPOSED BUDGET PAGE 192
REGIONAL UTILITIES SERVICESPOSITION AND SALARY EXPENSE DEVELOPMENT SERVICES 8225
TotalFY 2019 FY 2020 FY 2021 FY 2022 RepresentedACTUAL ACTUAL REVISED PROPOSED or
BUDGET BUDGET Non-Rep0.00 0.00 0.00 1.00 Business Systems Analyst 2 8 Non0.00 0.00 0.00 1.00 Construction Inspection Supervisor 8 Non0.00 0.00 0.00 5.00 Construction Inspector 2 5 Rep0.00 0.00 0.00 1.00 Construction Inspector 3 6 Rep0.00 0.00 0.00 1.40 Development Services Program Manager 9 Non0.00 0.00 0.00 1.10 Engineering Technician 2 5 Rep0.00 0.00 0.00 1.90 Engineering Technician 3 6 Rep0.00 0.00 0.00 1.00 GIS Analyst 7 Non0.00 0.00 0.00 1.00 GIS Specialist 6 Non0.00 0.00 0.00 2.00 Permits Technician 2 3 Rep0.00 0.00 0.00 1.00 Permit/Mapping Supervisor 8 Non0.00 0.00 0.00 3.00 Plan Reviewer 7 Non0.00 0.00 0.00 1.00 Senior Plan Reviewer 8 Non0.00 0.00 0.00 1.00 Technical Services Specialist 2 5 Rep0.00 0.00 0.00 1.00 Technical Services Specialist 3 6 Rep
0.00 0.00 0.00 23.50 TOTAL PERSONNEL
OperatingFY 2019 FY 2020 FY 2021 FY 2022 RepresentedACTUAL ACTUAL REVISED PROPOSED or
BUDGET BUDGET Non-Rep0.00 0.00 0.00 1.00 Business Systems Analyst 2 8 Non0.00 0.00 0.00 1.00 Construction Inspection Supervisor 8 Non0.00 0.00 0.00 5.00 Construction Inspector 2 5 Rep0.00 0.00 0.00 1.00 Construction Inspector 3 6 Rep0.00 0.00 0.00 1.40 Development Services Program Manager 9 Non0.00 0.00 0.00 1.00 Engineering Technician 2 5 Rep0.00 0.00 0.00 1.90 Engineering Technician 3 6 Rep0.00 0.00 0.00 1.00 GIS Analyst 7 Non0.00 0.00 0.00 1.00 GIS Specialist 6 Non0.00 0.00 0.00 2.00 Permits Technician 2 3 Rep0.00 0.00 0.00 1.00 Permit/Mapping Supervisor 8 Non0.00 0.00 0.00 3.00 Plan Reviewer 7 Non0.00 0.00 0.00 1.00 Senior Plan Reviewer 8 Non0.00 0.00 0.00 1.00 Technical Services Specialist 2 5 Rep0.00 0.00 0.00 1.00 Technical Services Specialist 3 6 Rep
0.00 0.00 0.00 23.30 TOTAL PERSONNEL
CapitalFY 2019 FY 2020 FY 2021 FY 2022 RepresentedACTUAL ACTUAL REVISED PROPOSED or
BUDGET BUDGET Non-Rep0.00 0.00 0.00 0.00 Business Systems Analyst 2 8 Non0.00 0.00 0.00 0.00 Construction Inspection Supervisor 8 Non0.00 0.00 0.00 0.00 Construction Inspector 2 5 Rep0.00 0.00 0.00 0.00 Construction Inspector 3 6 Rep0.00 0.00 0.00 0.10 Development Services Program Manager 9 Non0.00 0.00 0.00 0.00 Engineering Technician 2 5 Rep0.00 0.00 0.00 0.10 Engineering Technician 3 6 Rep0.00 0.00 0.00 0.00 GIS Analyst 7 Non0.00 0.00 0.00 0.00 GIS Specialist 6 Non0.00 0.00 0.00 0.00 Permits Technician 2 3 Rep0.00 0.00 0.00 0.00 Permit/Mapping Supervisor 8 Non0.00 0.00 0.00 0.00 Plan Reviewer 7 Non0.00 0.00 0.00 0.00 Senior Plan Reviewer 8 Non0.00 0.00 0.00 0.00 Technical Services Specialist 2 5 Rep0.00 0.00 0.00 0.00 Technical Services Specialist 3 6 Rep
0.00 0.00 0.00 0.20 TOTAL PERSONNEL
CLASSIFICATION TITLE SALARY GRADE
CLASSIFICATION TITLE SALARY GRADE
CLASSIFICATION TITLE SALARY GRADE
RUSDPOSITIONANDSALARYEXPENSE▼ Development Services | 8225

CLEAN WATER SERVICES • FY 2021-22 PROPOSED BUDGET PAGE 193
FY 2020 ACTUAL
FY 2021 REVISED BUDGET OBJECT CODE DESCRIPTION OBJECT
CODEFY 2022
PROPOSEDFY 2022
APPROVEDFY 2022
ADOPTED0 0 Wages & Other Pay 51100 2,248,600
0 0 Temporary 51130 95,000
0 0 Overtime 51140 6,000
0 0 Other Personnel Expenses 51600 958,100
0 0 Other Employee Allowances 51900 2,400
0 0 Mobile Computing Allowance 51915 1,000
0 0 3,311,100
0 0 Professional Services 52240 200,000
0 0 Recording Fees 52250 14,000
0 0 Other Government Services 52270 1,000
0 0 Office Supplies 52305 2,000
0 0 Small Tools 52350 1,100
0 0 Safety Equipment 52360 0
0 0 Dues & Memberships 52405 1,500
0 0 Books, Subscriptions & Publications 52410 400
0 0 Publication Notices 52430 1,000
0 0 Printing 52435 2,000
0 0 Fueling Contract 52475 10,000
0 0 Training & Education 52480 4,600
0 0 Travel Expense 52485 3,700
0 0 Fleet Charges 52486 5,500
0 0 Private Mileage 52487 400
0 0 Other Materials & Services 52495 3,000
0 0 Bank Service Charge 52515 13,000
0 0 Franchise Fees 52530 0
0 0 Payment Adjustment to Cities 52540 0
0 0 Computer Repair & Maintenance 52630 3,000
0 0 266,200
0 0 3,577,3000 TOTAL EXPENDITURE
0 MATERIALS & SERVICES SUBTOTAL
0
0
0
0
0
0
0
0
0
0
0
0
0
0
0
0
0
0
0
0
0
0 PERSONNEL EXPENSE SUBTOTAL
0
0
FY 2019 ACTUAL
0
0
0
Regional Utilities Services Department
Expenditure Summary 8225 - Development ServicesRUSDEXPENDITURESUMMARY▼ Development Services | 8225

CLEAN WATER SERVICES • FY 2021-22 PROPOSED BUDGET PAGE 194
UTILITY OPERATIONS & SERVICES DEPARTMENTPOSITION AND SALARY EXPENSE SYSTEMS PLANNING 8226
TotalFY 2019 FY 2020 FY 2021 FY 2022 RepresentedACTUAL ACTUAL REVISED PROPOSED or
BUDGET BUDGET Non-Rep0.00 0.00 0.00 0.50 Development Services Program Manager 9 Non0.00 0.00 0.00 2.00 Engineer 8 Non0.00 0.00 0.00 1.00 Inspection Program Manager 7 Non0.00 0.00 0.00 1.00 Senior Engineer 9 Non0.00 0.00 0.00 1.00 Water Resources Program Manager 9 Non
0.00 0.00 0.00 5.50 TOTAL PERSONNEL
OperatingFY 2019 FY 2020 FY 2021 FY 2022 RepresentedACTUAL ACTUAL REVISED PROPOSED or
BUDGET BUDGET Non-Rep0.00 0.00 0.00 0.50 Development Services Program Manager 9 Non0.00 0.00 0.00 0.80 Engineer 8 Non0.00 0.00 0.00 1.00 Inspection Program Manager 7 Non0.00 0.00 0.00 0.75 Senior Engineer 9 Non0.00 0.00 0.00 1.00 Water Resources Program Manager 9 Non
0.00 0.00 0.00 4.05 TOTAL PERSONNEL
CapitalFY 2019 FY 2020 FY 2021 FY 2022 RepresentedACTUAL ACTUAL REVISED PROPOSED or
BUDGET BUDGET Non-Rep0.00 0.00 0.00 0.00 Development Services Program Manager 9 Non0.00 0.00 0.00 1.20 Engineer 8 Non0.00 0.00 0.00 0.00 Inspection Program Manager 7 Non0.00 0.00 0.00 0.25 Senior Engineer 9 Non0.00 0.00 0.00 0.00 Water Resources Program Manager 9 Non
0.00 0.00 0.00 1.45 TOTAL PERSONNEL
CLASSIFICATION TITLE SALARY GRADE
CLASSIFICATION TITLE SALARY GRADE
CLASSIFICATION TITLE SALARY GRADE
RUSDPOSITIONANDSALARYEXPENSE▼ Systems Planning | 8226

CLEAN WATER SERVICES • FY 2021-22 PROPOSED BUDGET PAGE 195
FY 2020 ACTUAL
FY 2021 REVISED BUDGET OBJECT CODE DESCRIPTION OBJECT
CODEFY 2022
PROPOSEDFY 2022
APPROVEDFY 2022
ADOPTED0 0 Wages & Other Pay 51100 387,600
0 0 Temporary 51130 0
0 0 Overtime 51140 0
0 0 Other Personnel Expenses 51600 92,200
0 0 Other Employee Allowances 51900 400
0 0 Mobile Computing Allowance 51915 1,000
0 0 481,200
0 0 Professional Services 52240 50,000
0 0 Recording Fees 52250 0
0 0 Other Government Services 52270 0
0 0 Office Supplies 52305 0
0 0 Small Tools 52350 200
0 0 Safety Equipment 52360 200
0 0 Dues & Memberships 52405 2,300
0 0 Books, Subscriptions & Publications 52410 0
0 0 Publication Notices 52430 0
0 0 Printing 52435 3,600
0 0 Fueling Contract 52475 500
0 0 Training & Education 52480 3,000
0 0 Travel Expense 52485 2,500
0 0 Fleet Charges 52486 1,000
0 0 Private Mileage 52487 800
0 0 Other Materials & Services 52495 5,500
0 0 Bank Service Charge 52515 0
0 0 Franchise Fees 52530 0
0 0 Payment Adjustment to Cities 52540 0
0 0 Computer Repair & Maintenance 52630 0
0 0 69,600
0 0 550,8000 TOTAL EXPENDITURE
0 MATERIALS & SERVICES SUBTOTAL
0
0
0
0
0
0
0
0
0
0
0
0
0
0
0
0
0
0
0
0
0
0 PERSONNEL EXPENSE SUBTOTAL
0
0
FY 2019 ACTUAL
0
0
0
Regional Utilities Services Department
Expenditure Summary 8226 - Systems PlanningRUSDEXPENDITURESUMMARY▼ Systems Planning | 8226


CLEAN WATER SERVICES • FY 2021-22 PROPOSED BUDGET PAGE 197
Regulatory Affairs
The Regulatory Affairs Department (RAD) conducts research and analyzes water quality data, updates the Tualatin Total Maximum Daily Loads (TMDL), performs compliance and monitoring, and provides input on the development of state and federal regulations. RAD includes Administration, Environmental Services and Laboratory Services.
RAD is committed to preventing and slowing the spread of the coronavirus and implemented a variety of strategies to protect employees and their families and ensure Clean Water Services

CLEAN WATER SERVICES • FY 2021-22 PROPOSED BUDGET PAGE 198
(District) continues to provide essential lifeline services to our customers. Staff work remotely as much as is appropriate, taking advantage of virtual resources to conduct business. Environmental Services staff are on staggered work shifts to reduce employee overlap. Laboratory staff work in single-person suites and sampling crews travel solo in District vehicles or scale procedures for a single employee.
The FY 2021-22 budget includes two new FTE as compared to the FY 2020-21 revised budget. One new position is a Laboratory Specialist, which historically has been filled as a temporary position. The other new FTE is a transfer of an existing Data Management Analyst FTE from Digital Solutions into RAD Administration.
Administration The Administration program provides technical, scientific, regulatory and policy support to the District. This support includes analyzing environmental data related to the protection of public and watershed health, implementing the Tualatin River TMDL and implementing and complying with the District’s watershed-based National Pollutant Discharge Elimination System (NPDES) wastewater discharge permit.
The program tracks, evaluates and influences the development of state and federal environmental regulations; and prepares, reviews and coordinates reports related to monitoring, effluent discharges, noncompliance incidents and permit compliance. The Administration program coordinates, tracks and reports on the District’s Water Quality Credit Trading Program for temperature and manages the release of stored water for flow augmentation within the Tualatin River Watershed. The program oversees the District’s intergovernmental agreements related to flow and water quality monitoring and flow augmentation with the Department of Environmental Quality, the U.S. Geological Survey, the Joint Water Commission and the District 18 Watermaster.
The Administration program coordinates and supports scientific studies conducted by the U.S. Geological Survey in the Tualatin River Watershed to understand watershed processes and evaluate the effectiveness of future management practices. Administration staff also participates in organizations that support clean water and water quality, providing input, support and comments for meetings, workshops and conferences.

CLEAN WATER SERVICES • FY 2021-22 PROPOSED BUDGET PAGE 199
Laboratory Services The Laboratory Services staff conducts environmental sampling and analysis for the District and provides fundamental data for critical decision-making in areas such as health of the watershed, performance of the water resource recovery facilities and compliance with environmental regulations. The Laboratory staff performs over 200,000 water quality analyses per year and conducts extensive sampling, continuous monitoring and numerous field measurements. This work supports activities across the District including cleaning wastewater, source control, conveyance, stormwater and Tualatin watershed management. The Laboratory staff routinely analyzes samples for nutrients such as nitrogen, phosphorus, sulfur and potassium; for E. coli bacteria; and for dozens of metals at trace levels including copper, lead, silver, cadmium and zinc. Staff is capable of measuring mercury at extremely low levels: 0.2 parts per trillion. Laboratory staff has developed and implemented methods to measure disinfection by-products at low levels to support development of a regulatory strategy.

CLEAN WATER SERVICES • FY 2021-22 PROPOSED BUDGET PAGE 200
Environmental ServicesThe Environmental Services program responds to complaints about pollution entering waterways or conveyance systems across the District. The group maintains the District’s illicit discharge response program and provides technical assistance to fire and emergency response authorities for spills or surface water cleanup concerns. It also provides outreach and education.
Environmental Services regulates industrial users to protect public health, worker health and safety, municipal infrastructure, water quality and biosolids. The group regulates commercial establishments and industries that discharge into the sanitary sewer system, including those located in co-implementer cities. It also regulates the disposal of septic tank pumpage and chemical toilet waste at the District’s water resource recovery facilities. The program implements the industrial pretreatment program mandated by the federal Clean Water Act, including permitting and inspecting significant industrial discharges. Environmental Service acts as DEQ’s agent for the 1200-Z NPDES industrial stormwater permitting and compliance program and implements the commercial and industrial stormwater programs. The program also leads pollution prevention activities for the District.

CLEAN WATER SERVICES • FY 2021-22 PROPOSED BUDGET PAGE 201
OBJECT CODE FY 2019 ACTUAL FY 2020 ACTUAL FY 2021 REVISED BUDGET
FY 2022 PROPOSED BUDGET
Change from FY21 Budget
51100 2,994,906 2,863,287 2,999,700 3,307,100
51130 248,179 357,652 205,500 149,000
51140 61,728 34,573 67,100 67,100
51170 0 0 9,500 9,500
51600 1,154,649 1,165,176 1,259,600 1,382,000
51761 7,292 2,655 38,200 14,000
51900 1,740 6,225 4,200 4,600
51915 8,295 7,185 5,600 4,800
4,476,791 4,436,752 4,589,400 4,938,100 7.6%
52205 35,424 14,181 13,000 13,000
52240 972,507 981,824 1,660,000 1,270,000
52260 8,906 7,740 7,000 7,000
52305 3,555 4,049 2,500 2,500
52310 26,787 46,570 46,000 46,000
52315 0 20 0 0
52325 304,407 310,894 350,300 385,300
52330 6,657 2,868 5,000 5,000
52335 0 39 0 0
52350 4,509 3,720 5,000 5,000
52360 981 645 0 0
52375 968 6,479 1,000 1,000
52385 11,326 2,495 6,000 6,000
52405 4,566 3,026 6,400 4,800
52410 42 0 700 700
52425 31,778 37,127 15,000 0
52430 464 0 1,500 1,500
52435 1,085 1,771 3,000 2,000
52475 8,537 8,149 8,000 9,000
52480 22,054 16,382 21,800 19,800
52485 51,603 30,281 15,900 15,900
52486 10,403 10,215 10,500 9,500
52487 9,214 3,867 9,500 9,500
52495 5,944 20,308 1,000 1,000
52500 287,537 340,817 520,000 520,000
52505 0 0 6,000 6,000
52610 888 0 0 0
52620 23,736 7,481 30,000 30,000
52630 185 0 0 0
1,834,064 1,860,949 2,745,100 2,370,500 -13.6%
6,310,855 6,297,701 7,334,500 7,308,600 -0.4%
Wages & Other Pay
Temporary
CWS Department Expenditure SummaryBudget Year: 2022
OBJECT CODE DESCRIPTION
Tuition Reimbursement
Other Employee Allowances
Overtime
Out of Class Straight Time
Other Personnel Expenses
Mobile Computing Allowance
PERSONNEL EXPENSE SUBTOTAL
Contracted Services
Professional Services
Laundry
Gas, Oil, Lubrication
Tech & Scientific Supplies
Office Supplies
Operating Supplies
Small Tools
Safety Equipment
Postage & Freight
Repair & Maintenance Supplies
Construction & Building Supplies
Dues & Memberships
Books, Subscriptions & Publications
Computer Equipment Expensed
Software Licenses & Support
Publication Notices
Printing
Travel Expense
Fleet Charges
Private Mileage
Fueling Contract
Training & Education
Other Materials & Services
Permits, Licenses & Fees
Public Information
Repair & Maintenance Services
Non-vehicle Equipment Repair & Maintenance
Computer Repair & Maintenance
TOTAL EXPENDITURE
Regulatory Affairs Department
MATERIALS & SERVICES SUBTOTAL
REGULATORYAFFAIRS▼ Department Summary

CLEAN WATER SERVICES • FY 2021-22 PROPOSED BUDGET PAGE 202
REGULATORY AFFAIRS DEPARTMENTPOSITION AND SALARY EXPENSE ADMINISTRATION 8210
TotalFY 2019 FY 2020 FY 2021 FY 2022 RepresentedACTUAL ACTUAL REVISED PROPOSED or
BUDGET BUDGET Non-Rep1.00 1.00 0.00 0.00 Asst Regulatory Affairs Dept Director 12 Non0.00 0.00 1.00 1.00 Compliance & Permitting Manager 10 Non0.00 0.00 0.00 1.00 Data Management Analyst 8 Non1.00 0.00 0.00 0.00 Principal Engineer 10 Non1.00 1.00 1.00 1.00 Regulatory Affairs Director 13 Non0.00 0.00 1.00 1.00 Regulatory Affairs Services Manager 12 Non1.00 1.00 1.00 1.00 Operations Analyst 1 6 Non1.00 1.00 0.00 0.00 Water Resources Prog Manager 9 Non5.00 4.00 2.00 2.00 Water Resources Analyst - Regulatory 8 Non1.00 1.00 1.00 1.00 Administrative Associate 3 Non
11.00 9.00 7.00 8.00 TOTAL PERSONNEL
OperatingFY 2019 FY 2020 FY 2021 FY 2022 RepresentedACTUAL ACTUAL REVISED PROPOSED or
BUDGET BUDGET Non-Rep1.00 1.00 0.00 0.00 Asst Regulatory Affairs Dept Director 12 Non0.00 0.00 1.00 1.00 Compliance & Permitting Manager 10 Non0.00 0.00 0.00 1.00 Data Management Analyst 8 Non1.00 0.00 0.00 0.00 Principal Engineer 10 Non1.00 1.00 1.00 1.00 Regulatory Affairs Director 13 Non0.00 0.00 1.00 1.00 Regulatory Affairs Services Manager 12 Non1.00 1.00 1.00 1.00 Operations Analyst 1 6 Non1.00 1.00 0.00 0.00 Water Resources Prog Manager 9 Non5.00 4.00 2.00 2.00 Water Resources Analyst - Regulatory 8 Non1.00 1.00 1.00 1.00 Administrative Associate 3 Non
11.00 9.00 7.00 8.00 TOTAL PERSONNEL
CapitalFY 2019 FY 2020 FY 2021 FY 2022 RepresentedACTUAL ACTUAL REVISED PROPOSED or
BUDGET BUDGET Non-Rep0.00 0.00 0.00 0.00 Asst Regulatory Affairs Dept Director 12 Non0.00 0.00 0.00 0.00 Compliance & Permitting Manager 10 Non0.00 0.00 0.00 0.00 Data Management Analyst 8 Non0.00 0.00 0.00 0.00 Principal Engineer 10 Non0.00 0.00 0.00 0.00 Regulatory Affairs Director 13 Non0.00 0.00 0.00 0.00 Regulatory Affairs Services Manager 12 Non0.00 0.00 0.00 0.00 Operations Analyst 1 6 Non0.00 0.00 0.00 0.00 Water Resources Prog Manager 9 Non0.00 0.00 0.00 0.00 Water Resources Analyst - Regulatory 8 Non0.00 0.00 0.00 0.00 Administrative Associate 3 Non
0.00 0.00 0.00 0.00 TOTAL PERSONNEL
CLASSIFICATION TITLE SALARY GRADE
CLASSIFICATION TITLE SALARY GRADE
CLASSIFICATION TITLE SALARY GRADE
REGULATORYAFFAIRSPOSITIONANDSALARYEXPENSE▼ Administration | 8210

CLEAN WATER SERVICES • FY 2021-22 PROPOSED BUDGET PAGE 203
FY 2020 ACTUAL
FY 2021 REVISED BUDGET OBJECT CODE DESCRIPTION OBJECT
CODEFY 2022
PROPOSEDFY 2022
APPROVEDFY 2022
ADOPTED972,026 882,300 Wages & Other Pay 51100 1,026,800
293,994 30,000 Temporary 51130 0
1,570 0 Overtime 51140 0
0 0 Out of Class Straight Time 51170 0
359,967 309,500 Other Personnel Expenses 51600 323,000
1,905 30,000 Tuition Reimbursement 51761 10,000
450 0 Other Employee Allowances 51900 0
3,075 2,000 Mobile Computing Allowance 51915 2,000
1,632,987 1,253,800 1,361,800
14,131 0 Contracted Services 52205 0
775,758 1,470,000 Professional Services 52240 965,000
0 0 Laundry 52260 0
139 0 Office Supplies 52305 0
526 0 Operating Supplies 52310 0
20 0 Gas, Oil, Lubrication 52315 0
1,439 2,000 Tech & Scientific Supplies 52325 2,000
2,491 0 Repair & Maintenance Supplies 52330 0
0 0 Construction & Building Supplies 52335 0
578 0 Small Tools 52350 0
0 0 Safety Equipment 52360 0
100 0 Postage & Freight 52375 0
0 0 Computer Equipment Expensed 52385 0
1,821 1,800 Dues & Memberships 52405 1,800
0 500 Books, Subscriptions & Publications 52410 500
4,704 0 Software Licenses & Support 52425 0
0 0 Publication Notices 52430 0
204 1,000 Printing 52435 1,000
0 0 Fueling Contract 52475 0
11,016 7,000 Training & Education 52480 5,000
26,017 7,500 Travel Expense 52485 7,500
0 0 Fleet Charges 52486 0
3,094 4,000 Private Mileage 52487 4,000
19,366 1,000 Other Materials & Services 52495 1,000
340,617 514,000 Permits, Licenses & Fees 52500 514,000
0 0 Public Information 52505 0
0 0 Repair & Maintenance Services 52610 0
0 0 Non-vehicle Equipment Repair & Maintenance 52620 0
0 0 Computer Repair & Maintenance 52630 0
1,202,021 2,008,800 1,501,800
2,835,008 3,262,600 2,863,6002,894,189 TOTAL EXPENDITURE
1,197,887 MATERIALS & SERVICES SUBTOTAL
185
0
0
287,137
0
10,566
40,571
0
4,423
3,990
0
42
0
199
41
76
5,540
1,553
40
0
766
0
87
60
0
5,628
802,360
0
34,624
3,720
1,696,302 PERSONNEL EXPENSE SUBTOTAL
0
378,096
5,792
0
FY 2019 ACTUAL
1,172,207
134,672
1,814
Regulatory Affairs Department
Expenditure Summary 8210 - Regulatory Affairs AdministrationREGULATORYAFFAIRSEXPENDITURESUMMARY▼ Administration | 8210

CLEAN WATER SERVICES • FY 2021-22 PROPOSED BUDGET PAGE 204
REGULATORY AFFAIRS DEPARTMENTPOSITION AND SALARY EXPENSE ENVIRONMENTAL SERVICES 8212
TotalFY 2019 FY 2020 FY 2021 FY 2022 SALARY RepresentedACTUAL ACTUAL REVISED PROPOSED GRADE or
BUDGET BUDGET Non-Rep1.00 1.00 1.00 1.00 Environmental Services Specialist 1 4 Rep6.00 6.00 6.00 6.00 Environmental Services Specialist 2 6 Rep0.00 1.00 1.00 1.00 Environmental Services Supervisor 7 Non
7.00 8.00 8.00 8.00 TOTAL PERSONNEL
OperatingFY 2019 FY 2020 FY 2021 FY 2022 SALARY RepresentedACTUAL ACTUAL REVISED PROPOSED GRADE or
BUDGET BUDGET Non-Rep1.00 1.00 1.00 1.00 Environmental Services Specialist 1 4 Rep6.00 6.00 6.00 6.00 Environmental Services Specialist 2 6 Rep0.00 1.00 1.00 1.00 Environmental Services Supervisor 7 Non
7.00 8.00 8.00 8.00 TOTAL PERSONNEL
CapitalFY 2019 FY 2020 FY 2021 FY 2022 SALARY RepresentedACTUAL ACTUAL REVISED PROPOSED GRADE or
BUDGET BUDGET Non-Rep0.00 0.00 0.00 0.00 Environmental Services Specialist 1 4 Rep0.00 0.00 0.00 0.00 Environmental Services Specialist 2 6 Rep0.00 0.00 0.00 0.00 Environmental Services Supervisor 7 Non
0.00 0.00 0.00 0.00 TOTAL PERSONNEL
CLASSIFICATION TITLE
CLASSIFICATION TITLE
CLASSIFICATION TITLE
REGULATORYAFFAIRSPOSITIONANDSALARYEXPENSE▼ Environmental Services | 8212

CLEAN WATER SERVICES • FY 2021-22 PROPOSED BUDGET PAGE 205
FY 2020 ACTUAL
FY 2021 REVISED BUDGET OBJECT CODE DESCRIPTION OBJECT
CODEFY 2022
PROPOSEDFY 2022
APPROVEDFY 2022
ADOPTED542,748 692,700 Wages & Other Pay 51100 712,700
28,500 61,500 Temporary 51130 45,000
6,922 30,000 Overtime 51140 30,000
0 3,500 Out of Class Straight Time 51170 3,500
230,466 305,900 Other Personnel Expenses 51600 324,900
0 8,200 Tuition Reimbursement 51761 4,000
1,575 1,400 Other Employee Allowances 51900 1,400
1,800 2,000 Mobile Computing Allowance 51915 2,000
812,012 1,105,200 1,123,500
0 13,000 Contracted Services 52205 13,000
115,913 0 Professional Services 52240 140,000
0 0 Laundry 52260 0
575 0 Office Supplies 52305 0
2,166 10,000 Operating Supplies 52310 10,000
0 0 Gas, Oil, Lubrication 52315 0
0 0 Tech & Scientific Supplies 52325 5,000
38 0 Repair & Maintenance Supplies 52330 0
0 0 Construction & Building Supplies 52335 0
1,957 2,000 Small Tools 52350 2,000
0 0 Safety Equipment 52360 0
58 0 Postage & Freight 52375 0
2,495 0 Computer Equipment Expensed 52385 0
885 4,100 Dues & Memberships 52405 2,500
0 200 Books, Subscriptions & Publications 52410 200
32,423 0 Software Licenses & Support 52425 0
0 1,500 Publication Notices 52430 1,500
1,567 2,000 Printing 52435 1,000
3,465 4,000 Fueling Contract 52475 4,000
2,663 9,800 Training & Education 52480 9,800
1,557 4,900 Travel Expense 52485 4,900
4,325 4,000 Fleet Charges 52486 4,000
200 3,500 Private Mileage 52487 3,500
266 0 Other Materials & Services 52495 0
0 0 Permits, Licenses & Fees 52500 0
0 6,000 Public Information 52505 6,000
0 0 Repair & Maintenance Services 52610 0
0 0 Non-vehicle Equipment Repair & Maintenance 52620 0
0 0 Computer Repair & Maintenance 52630 0
170,552 65,000 207,400
982,563 1,170,200 1,330,900862,619 TOTAL EXPENDITURE
81,142 MATERIALS & SERVICES SUBTOTAL
0
38
0
0
0
4,007
3,420
6,591
1,643
1,392
3,322
0
30,878
185
914
84
0
2,523
8
0
194
0
109
904
0
0
24,928
0
0
2,160
781,477 PERSONNEL EXPENSE SUBTOTAL
0
214,763
0
335
FY 2019 ACTUAL
501,293
41,557
21,369
Regulatory Affairs Department
Expenditure Summary 8212 - Environmental ServicesREGULATORYAFFAIRSEXPENDITURESUMMARY▼ Environmental Services | 8212

CLEAN WATER SERVICES • FY 2021-22 PROPOSED BUDGET PAGE 206
REGULATORY AFFAIRS DEPARTMENTPOSITION AND SALARY EXPENSE LABORATORY SERVICES 8232
TotalFY 2019 FY 2020 FY 2021 FY 2022 RepresentedACTUAL ACTUAL REVISED PROPOSED or
BUDGET BUDGET Non-Rep2.00 2.00 2.00 2.00 Laboratory Technician 3 Rep0.00 0.00 1.00 1.00 Laboratory Manager 9 Non1.00 0.00 0.00 0.00 Laboratory Services Division Manager 11 Non
12.00 13.00 10.00 11.00 Laboratory Specialist 5 Rep1.00 1.00 0.00 0.00 Laboratory Supervisor 8 Non1.00 1.00 1.00 1.00 Lab Systems & QA/QC Coord 7 Non0.00 0.00 4.00 4.00 Senior Laboratory Specialist 6 Rep0.00 1.00 0.00 0.00 Senior Operations Analyst 9 Non
17.00 18.00 18.00 19.00 TOTAL PERSONNEL
OperatingFY 2019 FY 2020 FY 2021 FY 2022 RepresentedACTUAL ACTUAL REVISED PROPOSED or
BUDGET BUDGET Non-Rep2.00 2.00 2.00 2.00 Laboratory Technician 3 Rep0.00 0.00 1.00 1.00 Laboratory Manager 9 Non1.00 0.00 0.00 0.00 Laboratory Services Division Manager 11 Non
12.00 13.00 10.00 11.00 Laboratory Specialist 5 Rep1.00 1.00 0.00 0.00 Laboratory Supervisor 8 Non1.00 1.00 1.00 1.00 Lab Systems & QA/QC Coord 7 Non0.00 0.00 4.00 4.00 Senior Laboratory Specialist 6 Rep0.00 1.00 0.00 0.00 Senior Operations Analyst 9 Non
17.00 18.00 18.00 19.00 TOTAL PERSONNEL
CapitalFY 2019 FY 2020 FY 2021 FY 2022 RepresentedACTUAL ACTUAL REVISED PROPOSED or
BUDGET BUDGET Non-Rep0.00 0.00 0.00 0.00 Laboratory Technician 3 Rep0.00 0.00 0.00 0.00 Laboratory Manager 9 Non0.00 0.00 0.00 0.00 Laboratory Services Division Manager 11 Non0.00 0.00 0.00 0.00 Laboratory Specialist 5 Rep0.00 0.00 0.00 0.00 Laboratory Supervisor 8 Non0.00 0.00 0.00 0.00 Lab Systems & QA/QC Coord 7 Non0.00 0.00 0.00 0.00 Senior Laboratory Specialist 6 Rep0.00 0.00 0.00 0.00 Senior Operations Analyst 9 Non
0.00 0.00 0.00 0.00 TOTAL PERSONNEL
CLASSIFICATION TITLE SALARY GRADE
CLASSIFICATION TITLE SALARY GRADE
CLASSIFICATION TITLE SALARY GRADE
REGULATORYAFFAIRSPOSITIONANDSALARYEXPENSE▼ Laboratory Services | 8232

CLEAN WATER SERVICES • FY 2021-22 PROPOSED BUDGET PAGE 207
FY 2020 ACTUAL
FY 2021 REVISED BUDGET OBJECT CODE DESCRIPTION OBJECT
CODEFY 2022
PROPOSEDFY 2022
APPROVEDFY 2022
ADOPTED1,348,512 1,424,700 Wages & Other Pay 51100 1,567,600
35,157 114,000 Temporary 51130 104,000
26,081 37,100 Overtime 51140 37,100
0 6,000 Out of Class Straight Time 51170 6,000
574,742 644,200 Other Personnel Expenses 51600 734,100
750 0 Tuition Reimbursement 51761 0
4,200 2,800 Other Employee Allowances 51900 3,200
2,310 1,600 Mobile Computing Allowance 51915 800
1,991,753 2,230,400 2,452,800
50 0 Contracted Services 52205 0
90,153 190,000 Professional Services 52240 165,000
7,740 7,000 Laundry 52260 7,000
3,335 2,500 Office Supplies 52305 2,500
43,879 36,000 Operating Supplies 52310 36,000
0 0 Gas, Oil, Lubrication 52315 0
309,455 348,300 Tech & Scientific Supplies 52325 378,300
338 5,000 Repair & Maintenance Supplies 52330 5,000
39 0 Construction & Building Supplies 52335 0
1,185 3,000 Small Tools 52350 3,000
645 0 Safety Equipment 52360 0
6,322 1,000 Postage & Freight 52375 1,000
0 6,000 Computer Equipment Expensed 52385 6,000
320 500 Dues & Memberships 52405 500
0 0 Books, Subscriptions & Publications 52410 0
0 15,000 Software Licenses & Support 52425 0
0 0 Publication Notices 52430 0
0 0 Printing 52435 0
4,684 4,000 Fueling Contract 52475 5,000
2,703 5,000 Training & Education 52480 5,000
2,708 3,500 Travel Expense 52485 3,500
5,890 6,500 Fleet Charges 52486 5,500
574 2,000 Private Mileage 52487 2,000
676 0 Other Materials & Services 52495 0
200 6,000 Permits, Licenses & Fees 52500 6,000
0 0 Public Information 52505 0
0 0 Repair & Maintenance Services 52610 0
7,481 30,000 Non-vehicle Equipment Repair & Maintenance 52620 30,000
0 0 Computer Repair & Maintenance 52630 0
488,377 671,300 661,300
2,480,130 2,901,700 3,114,1002,554,047 TOTAL EXPENDITURE
555,035 MATERIALS & SERVICES SUBTOTAL
0
850
23,736
400
0
7,481
7,612
3,812
3,148
562
5,214
0
900
80
130
808
5,786
490
6,609
0
3,549
981
3,359
25,823
0
298,779
145,218
8,906
800
2,415
1,999,012 PERSONNEL EXPENSE SUBTOTAL
0
561,791
1,500
1,405
FY 2019 ACTUAL
1,321,406
71,950
38,545
Regulatory Affairs Department
Expenditure Summary 8232 - Laboratory ServicesREGULATORYAFFAIRSEXPENDITURESUMMARY▼ Laboratory Services | 8232


CLEAN WATER SERVICES • FY 2021-22 PROPOSED BUDGET PAGE 209
Utility Operations & Services
The Utility Operations & Services Department (UOPS) is responsible for the design, construction oversight, operations and maintenance of the District’s surface water and sanitary conveyance systems. The department includes Administration, Conveyance Engineering and Field Operations.
UOPS is committed to preventing and slowing the spread of the coronavirus and implemented a variety of strategies to protect employees and their families and to ensure the District continues to provide essential lifeline services to our customers. Staff travel

CLEAN WATER SERVICES • FY 2021-22 PROPOSED BUDGET PAGE 210
solo in District vehicles as much as possible and inspectors use their vehicles as their primary offices. Other staff work remotely as much as is appropriate, taking advantage of virtual resources to conduct business. Some Field Operations staff work out of temporary facilities to reduce employee overlap and congestion in the workplace.
The FY 2021-22 UOPS budget includes an additional two FTE as compared to the FY 2020-21 revised budget. One of the new positions is a conversion of a temporary position, an Administrative Associate, where the workload has proven to be sustained and long-term. The other new position is an Engineering Project Coordinator in the Conveyance Engineering program. The FY 2021-22 budget transfers two programs, Development Services and Systems Planning, from UOPS into the new Regional Utilities Services Department.
Administration This program includes the senior management for the department and administrative and technical support staff for Field Operations. Staff provides general and fiscal management of the department’s programs and interacts with external agencies on a wide variety of technical and policy issues.
Conveyance Engineering The Conveyance Engineering program provides administration, design and construction management of the District’s Capital Improvement Program for both sanitary and surface water management (SWM) systems. The services provided by this group are driven by the need to comply with legal mandates, protect public health, protect beneficial uses and meet public demands for efficient responsive service.
Projects implemented by Conveyance Engineering include small diameter (21-inch and smaller) local sanitary sewer and storm and surface water system extensions and capacity upgrades serving the unincorporated area and the cities of Banks, Durham, Gaston, King City and North Plains. These local projects are funded with rates and System Development Charges and implemented through the Capital Improvement Plan and local SWM Small Works Program or privately funded by benefited property owners through Local Improvement Districts and Reimbursement Districts.
The program is also responsible for administration, design and construction management of large diameter (24-inch and larger) regional sanitary sewer projects, regional water quality facilities with more than an acre of treatment area, coordination and

CLEAN WATER SERVICES • FY 2021-22 PROPOSED BUDGET PAGE 211
management of the regional inflow and infiltration abatement program. Regional system evaluation, computer modeling and sanitary and storm and surface water system masterplanning are also part of the regional services provided by the program.
Field Operations The Field Operations division maintains the public storm and sanitary sewer collection systems. The division includes the System Repair, System Maintenance, Local Repair & Construction, TV/Flow Monitoring and SWM Surface Facility Maintenance operational programs.
The operational programs perform Local Maintenance Program activities defined under the Performance Standards on the public storm and sanitary systems serving the unincorporated area and the cities of Banks, Durham, Gaston, King City and North Plains. These activities include emergency response, cleaning and performing TV inspection of public storm and sanitary sewer pipes, cleaning catch basins and water quality manholes, sweeping streets and maintaining water quality facilities. The Local Program also includes repairing damaged or deteriorated infrastructure and construction of short line extensions, catch basin and inlet

CLEAN WATER SERVICES • FY 2021-22 PROPOSED BUDGET PAGE 212
installations and stream corridor enhancements. Catch basin and street sweeping debris handling is also under the Local Maintenance Program. Cities using the District-operated Materials Processing Yard pay for those services with fees set under the District’s Rates and Charges. The division also performs ditch maintenance and limited culvert repairs on roads within the Urban Road Maintenance District (URMD) under an annual contract with Washington County.
Field Operations performs Regional Maintenance Program activities throughout the entire service area, including all cities. These activities include management and maintenance of the systemwide flow monitoring and rain gauge network, chemical root control, repair and rehabilitation of the collection system, sealing lines and manholes to reduce inflow and infiltration, maintenance of the large diameter (24-inch and larger) sanitary sewer system and maintenance and reconstruction of regional water quality facilities with a treatment area of one acre and larger.
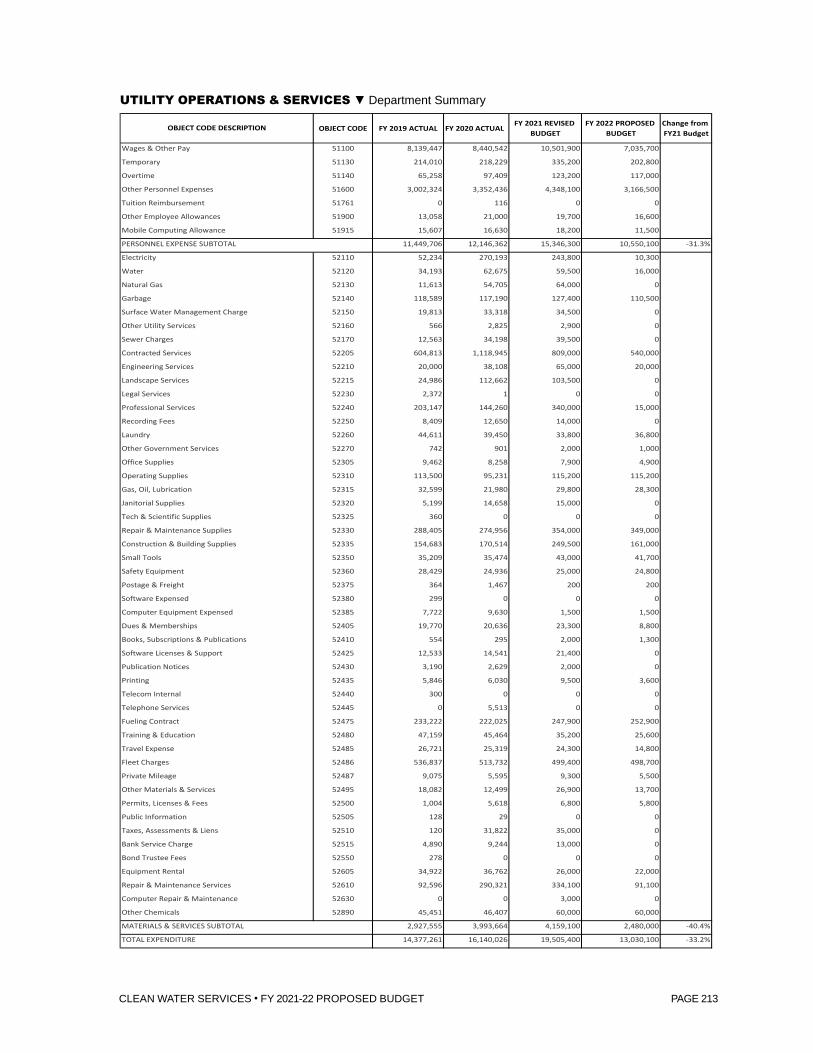
CLEAN WATER SERVICES • FY 2021-22 PROPOSED BUDGET PAGE 213
OBJECT CODE FY 2019 ACTUAL FY 2020 ACTUAL FY 2021 REVISED BUDGET
FY 2022 PROPOSED BUDGET
Change from FY21 Budget
51100 8,139,447 8,440,542 10,501,900 7,035,700
51130 214,010 218,229 335,200 202,800
51140 65,258 97,409 123,200 117,000
51600 3,002,324 3,352,436 4,348,100 3,166,500
51761 0 116 0 0
51900 13,058 21,000 19,700 16,600
51915 15,607 16,630 18,200 11,500
11,449,706 12,146,362 15,346,300 10,550,100 -31.3%
52110 52,234 270,193 243,800 10,300
52120 34,193 62,675 59,500 16,000
52130 11,613 54,705 64,000 0
52140 118,589 117,190 127,400 110,500
52150 19,813 33,318 34,500 0
52160 566 2,825 2,900 0
52170 12,563 34,198 39,500 0
52205 604,813 1,118,945 809,000 540,000
52210 20,000 38,108 65,000 20,000
52215 24,986 112,662 103,500 0
52230 2,372 1 0 0
52240 203,147 144,260 340,000 15,000
52250 8,409 12,650 14,000 0
52260 44,611 39,450 33,800 36,800
52270 742 901 2,000 1,000
52305 9,462 8,258 7,900 4,900
52310 113,500 95,231 115,200 115,200
52315 32,599 21,980 29,800 28,300
52320 5,199 14,658 15,000 0
52325 360 0 0 0
52330 288,405 274,956 354,000 349,000
52335 154,683 170,514 249,500 161,000
52350 35,209 35,474 43,000 41,700
52360 28,429 24,936 25,000 24,800
52375 364 1,467 200 200
52380 299 0 0 0
52385 7,722 9,630 1,500 1,500
52405 19,770 20,636 23,300 8,800
52410 554 295 2,000 1,300
52425 12,533 14,541 21,400 0
52430 3,190 2,629 2,000 0
52435 5,846 6,030 9,500 3,600
52440 300 0 0 0
52445 0 5,513 0 0
52475 233,222 222,025 247,900 252,900
52480 47,159 45,464 35,200 25,600
52485 26,721 25,319 24,300 14,800
52486 536,837 513,732 499,400 498,700
52487 9,075 5,595 9,300 5,500
52495 18,082 12,499 26,900 13,700
52500 1,004 5,618 6,800 5,800
52505 128 29 0 0
52510 120 31,822 35,000 0
52515 4,890 9,244 13,000 0
52550 278 0 0 0
52605 34,922 36,762 26,000 22,000
52610 92,596 290,321 334,100 91,100
52630 0 0 3,000 0
52890 45,451 46,407 60,000 60,000
2,927,555 3,993,664 4,159,100 2,480,000 -40.4%
14,377,261 16,140,026 19,505,400 13,030,100 -33.2%
Wages & Other Pay
Temporary
CWS Department Expenditure SummaryBudget Year: 2022
OBJECT CODE DESCRIPTION
Tuition Reimbursement
Other Employee Allowances
Overtime
Other Personnel Expenses
Water
Natural Gas
Mobile Computing Allowance
PERSONNEL EXPENSE SUBTOTAL
Electricity
Sewer Charges
Contracted Services
Engineering Services
Garbage
Surface Water Management Charge
Other Utility Services
Professional Services
Recording Fees
Laundry
Landscape Services
Legal Services
Gas, Oil, Lubrication
Janitorial Supplies
Tech & Scientific Supplies
Other Government Services
Office Supplies
Operating Supplies
Small Tools
Safety Equipment
Postage & Freight
Repair & Maintenance Supplies
Construction & Building Supplies
Dues & Memberships
Books, Subscriptions & Publications
Software Expensed
Computer Equipment Expensed
Telecom Internal
Telephone Services
Software Licenses & Support
Publication Notices
Printing
Travel Expense
Fleet Charges
Private Mileage
Fueling Contract
Training & Education
Taxes, Assessments & Liens
Bank Service Charge
Other Materials & Services
Permits, Licenses & Fees
Public Information
Repair & Maintenance Services
Computer Repair & Maintenance
Bond Trustee Fees
Equipment Rental
TOTAL EXPENDITURE
Utility Operations & Services Department
Other Chemicals
MATERIALS & SERVICES SUBTOTAL
UTILITYOPERATIONS&SERVICES▼ Department Summary

CLEAN WATER SERVICES • FY 2021-22 PROPOSED BUDGET PAGE 214
UTILITY OPERATIONS & SERVICES DEPARTMENTPOSITION AND SALARY EXPENSE ADMINISTRATION 8370
TotalFY 2019 FY 2020 FY 2021 FY 2022 RepresentedACTUAL ACTUAL REVISED PROPOSED or
BUDGET BUDGET Non-Rep2.00 2.00 2.00 3.00 Administrative Associate 3 Non0.00 0.00 0.00 1.00 Field Operations Division Manager 11 Non0.00 0.00 1.00 1.00 Fleet Maintenance Technician 5 Rep0.00 0.00 1.00 1.00 Operations Analyst 1 6 Non2.00 2.00 2.00 2.00 Operations Coordinator 5 Non1.00 1.00 1.00 1.00 Sr Management Analyst 8 Non0.00 0.00 0.00 1.00 Utility Operations & Services Manager 12 Non
5.00 5.00 7.00 10.00 TOTAL PERSONNEL
OperatingFY 2019 FY 2020 FY 2021 FY 2022 RepresentedACTUAL ACTUAL REVISED PROPOSED or
BUDGET BUDGET Non-Rep2.00 2.00 2.00 3.00 Administrative Associate 3 Non0.00 0.00 0.00 1.00 Field Operations Division Manager 11 Non0.00 0.00 1.00 1.00 Fleet Maintenance Technician 5 Rep0.00 0.00 1.00 1.00 Operations Analyst 1 6 Non2.00 2.00 2.00 2.00 Operations Coordinator 5 Non1.00 1.00 1.00 1.00 Sr Management Analyst 8 Non0.00 0.00 0.00 1.00 Utility Operations & Services Manager 12 Non
5.00 5.00 7.00 10.00 TOTAL PERSONNEL
CapitalFY 2019 FY 2020 FY 2021 FY 2022 RepresentedACTUAL ACTUAL REVISED PROPOSED or
BUDGET BUDGET Non-Rep0.00 0.00 0.00 0.00 Administrative Associate 3 Non0.00 0.00 0.00 0.00 Field Operations Division Manager 11 Non0.00 0.00 0.00 0.00 Fleet Maintenance Technician 5 Rep0.00 0.00 0.00 0.00 Operations Analyst 1 6 Non0.00 0.00 0.00 0.00 Operations Coordinator 5 Non0.00 0.00 0.00 0.00 Sr Management Analyst 8 Non0.00 0.00 0.00 0.00 Utility Operations & Services Manager 12 Non
0.00 0.00 0.00 0.00 TOTAL PERSONNEL
CLASSIFICATION TITLE SALARY GRADE
CLASSIFICATION TITLE SALARY GRADE
CLASSIFICATION TITLE SALARY GRADE
UOPSPOSITIONANDSALARYEXPENSE▼ Administration | 8370

CLEAN WATER SERVICES • FY 2021-22 PROPOSED BUDGET PAGE 215
FY 2020 ACTUAL
FY 2021 REVISED BUDGET OBJECT CODE DESCRIPTION OBJECT
CODEFY 2022
PROPOSEDFY 2022
APPROVEDFY 2022
ADOPTED396,760 466,800 Wages & Other Pay 51100 1,004,400
16,402 67,000 Temporary 51130 0
2,149 6,000 Overtime 51140 6,000
186,464 221,800 Other Personnel Expenses 51600 460,600
0 0 Tuition Reimbursement 51761 0
150 0 Other Employee Allowances 51900 600
1,680 1,800 Mobile Computing Allowance 51915 3,500
603,605 763,400 1,475,100
0 0 Electricity 52110 0
0 0 Water 52120 0
0 0 Natural Gas 52130 0
0 0 Garbage 52140 0
0 0 Surface Water Management Charge 52150 0
0 0 Other Utility Services 52160 0
0 0 Sewer Charges 52170 0
243,592 320,000 Contracted Services 52205 300,000
0 0 Engineering Services 52210 0
0 0 Landscape Services 52215 0
0 0 Legal Services 52230 0
0 0 Professional Services 52240 0
0 0 Recording Fees 52250 0
1,447 2,300 Laundry 52260 2,300
0 0 Other Government Services 52270 0
2,664 4,500 Office Supplies 52305 4,500
77,594 92,000 Operating Supplies 52310 92,000
2,276 2,300 Gas, Oil, Lubrication 52315 2,300
0 0 Janitorial Supplies 52320 0
0 0 Tech & Scientific Supplies 52325 0
544 2,500 Repair & Maintenance Supplies 52330 2,500
659 0 Construction & Building Supplies 52335 0
944 3,000 Small Tools 52350 3,000
4,643 8,000 Safety Equipment 52360 8,000
0 200 Postage & Freight 52375 200
0 0 Software Expensed 52380 0
2,344 0 Computer Equipment Expensed 52385 0
1,419 1,200 Dues & Memberships 52405 1,500
0 800 Books, Subscriptions & Publications 52410 800
12,550 21,400 Software Licenses & Support 52425 0
0 0 Publication Notices 52430 0
0 3,000 Printing 52435 3,000
0 0 Telecom Internal 52440 0
5,513 0 Telephone Services 52445 0
3,503 3,400 Fueling Contract 52475 3,400
10,100 4,300 Training & Education 52480 4,900
3,520 2,000 Travel Expense 52485 3,100
6,539 6,400 Fleet Charges 52486 4,000
224 0 Private Mileage 52487 1,000
5,093 5,500 Other Materials & Services 52495 5,500
325 500 Permits, Licenses & Fees 52500 500
0 0 Public Information 52505 0
120 0 Taxes, Assessments & Liens 52510 0
0 0 Bank Service Charge 52515 0
0 0 Franchise Fees 52530 0
0 0 Payment Adjustment to Cities 52540 0
0 0 Bond Trustee Fees 52550 0
0 0 Equipment Rental 52605 0
5,874 0 Repair & Maintenance Services 52610 0
0 0 Computer Repair & Maintenance 52630 0
0 0 Other Chemicals 52890 0
391,485 483,300 442,500
995,091 1,246,700 1,917,6001,278,184 TOTAL EXPENDITURE
681,741 MATERIALS & SERVICES SUBTOTAL
0
0
0
0
0
49,393
298
2
120
0
0
7,991
3,891
7,950
27
5,837
0
0
2,172
279
12,139
0
0
0
299
2,848
1,427
110
1,332
1,183
4,849
5,474
91,403
3,158
5,199
0
0
0
0
1,714
0
12,563
344,836
0
24,986
11,613
2,676
19,813
566
1,505
596,443 PERSONNEL EXPENSE SUBTOTAL
37,634
17,958
174,495
0
0
FY 2019 ACTUAL
392,874
22,083
5,486
Utility Operations & Services Department
Expenditure Summary 8370 - Utility Operations AdministrationUOPSEXPENDITURESUMMARY▼ Administration | 8370

CLEAN WATER SERVICES • FY 2021-22 PROPOSED BUDGET PAGE 216
UTILITY OPERATIONS & SERVICES DEPARTMENTPOSITION AND SALARY EXPENSE CAPITAL PROJECTS ADMINISTRATION 8224
TotalFY 2019 FY 2020 FY 2021 FY 2022 RepresentedACTUAL ACTUAL REVISED PROPOSED or
BUDGET BUDGET Non-Rep1.00 0.00 0.00 0.00 Administrative Assistant 4 Non3.00 3.00 3.00 3.00 Construction Inspector 3 6 Rep1.00 1.00 1.00 1.00 Easement Acquisition Specialist 6 Non5.00 5.00 5.00 2.00 Engineer 8 Non2.00 2.00 0.00 1.00 Engineering Project Coordinator 7 Non2.00 2.00 2.00 2.00 Engineering Technician 3 6 Rep0.00 0.00 2.00 2.00 Principal Engineer 10 Non0.00 1.00 1.00 0.00 Program Support Specialist 5 Non3.00 3.00 3.00 2.00 Senior Engineer 9 Non1.00 1.00 1.00 1.00 Water Resources Project Manager 7 Non
18.00 18.00 18.00 14.00 TOTAL PERSONNEL
OperatingFY 2019 FY 2020 FY 2021 FY 2022 RepresentedACTUAL ACTUAL REVISED PROPOSED or
BUDGET BUDGET Non-Rep0.70 0.00 0.00 0.00 Administrative Assistant 4 Non0.60 0.60 0.60 0.60 Construction Inspector 3 6 Rep0.25 0.25 0.25 0.25 Easement Acquisition Specialist 6 Non1.20 1.20 1.20 0.60 Engineer 8 Non0.70 0.70 0.00 0.50 Engineering Project Coordinator 7 Non0.60 0.60 0.60 0.60 Engineering Technician 3 6 Rep0.00 0.00 1.00 1.00 Principal Engineer 10 Non0.00 0.70 0.70 0.00 Program Support Specialist 5 Non0.80 0.80 0.80 0.75 Senior Engineer 9 Non0.00 0.00 0.00 0.00 Water Resources Project Manager 7 Non
4.85 4.85 5.15 4.30 TOTAL PERSONNEL
CapitalFY 2019 FY 2020 FY 2021 FY 2022 RepresentedACTUAL ACTUAL REVISED PROPOSED or
BUDGET BUDGET Non-Rep0.30 0.00 0.00 0.00 Administrative Assistant 4 Non2.40 2.40 2.40 2.40 Construction Inspector 3 6 Rep0.75 0.75 0.75 0.75 Easement Acquisition Specialist 6 Non3.80 3.80 3.80 1.40 Engineer 8 Non1.30 1.30 0.00 0.50 Engineering Project Coordinator 7 Non1.40 1.40 1.40 1.40 Engineering Technician 3 6 Rep0.00 0.00 1.00 1.00 Principal Engineer 10 Non0.00 0.30 0.30 0.00 Program Support Specialist 5 Non2.20 2.20 2.20 1.25 Senior Engineer 9 Non1.00 1.00 1.00 1.00 Water Resources Project Manager 7 Non
13.15 13.15 12.85 9.70 TOTAL PERSONNEL
CLASSIFICATION TITLE SALARY GRADE
CLASSIFICATION TITLE SALARY GRADE
CLASSIFICATION TITLE SALARY GRADE
UOPSPOSITIONANDSALARYEXPENSE▼ Conveyance Engineering | 8224
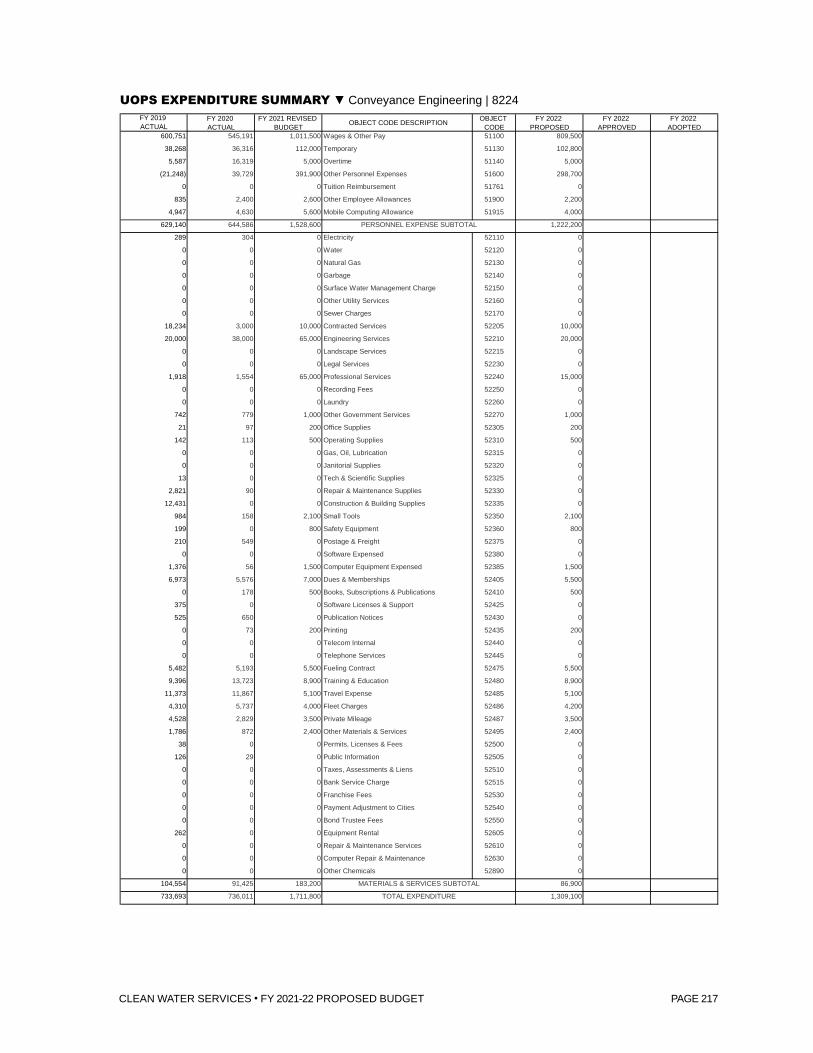
CLEAN WATER SERVICES • FY 2021-22 PROPOSED BUDGET PAGE 217
FY 2020 ACTUAL
FY 2021 REVISED BUDGET OBJECT CODE DESCRIPTION OBJECT
CODEFY 2022
PROPOSEDFY 2022
APPROVEDFY 2022
ADOPTED545,191 1,011,500 Wages & Other Pay 51100 809,500
36,316 112,000 Temporary 51130 102,800
16,319 5,000 Overtime 51140 5,000
39,729 391,900 Other Personnel Expenses 51600 298,700
0 0 Tuition Reimbursement 51761 0
2,400 2,600 Other Employee Allowances 51900 2,200
4,630 5,600 Mobile Computing Allowance 51915 4,000
644,586 1,528,600 1,222,200
304 0 Electricity 52110 0
0 0 Water 52120 0
0 0 Natural Gas 52130 0
0 0 Garbage 52140 0
0 0 Surface Water Management Charge 52150 0
0 0 Other Utility Services 52160 0
0 0 Sewer Charges 52170 0
3,000 10,000 Contracted Services 52205 10,000
38,000 65,000 Engineering Services 52210 20,000
0 0 Landscape Services 52215 0
0 0 Legal Services 52230 0
1,554 65,000 Professional Services 52240 15,000
0 0 Recording Fees 52250 0
0 0 Laundry 52260 0
779 1,000 Other Government Services 52270 1,000
97 200 Office Supplies 52305 200
113 500 Operating Supplies 52310 500
0 0 Gas, Oil, Lubrication 52315 0
0 0 Janitorial Supplies 52320 0
0 0 Tech & Scientific Supplies 52325 0
90 0 Repair & Maintenance Supplies 52330 0
0 0 Construction & Building Supplies 52335 0
158 2,100 Small Tools 52350 2,100
0 800 Safety Equipment 52360 800
549 0 Postage & Freight 52375 0
0 0 Software Expensed 52380 0
56 1,500 Computer Equipment Expensed 52385 1,500
5,576 7,000 Dues & Memberships 52405 5,500
178 500 Books, Subscriptions & Publications 52410 500
0 0 Software Licenses & Support 52425 0
650 0 Publication Notices 52430 0
73 200 Printing 52435 200
0 0 Telecom Internal 52440 0
0 0 Telephone Services 52445 0
5,193 5,500 Fueling Contract 52475 5,500
13,723 8,900 Training & Education 52480 8,900
11,867 5,100 Travel Expense 52485 5,100
5,737 4,000 Fleet Charges 52486 4,200
2,829 3,500 Private Mileage 52487 3,500
872 2,400 Other Materials & Services 52495 2,400
0 0 Permits, Licenses & Fees 52500 0
29 0 Public Information 52505 0
0 0 Taxes, Assessments & Liens 52510 0
0 0 Bank Service Charge 52515 0
0 0 Franchise Fees 52530 0
0 0 Payment Adjustment to Cities 52540 0
0 0 Bond Trustee Fees 52550 0
0 0 Equipment Rental 52605 0
0 0 Repair & Maintenance Services 52610 0
0 0 Computer Repair & Maintenance 52630 0
0 0 Other Chemicals 52890 0
91,425 183,200 86,900
736,011 1,711,800 1,309,100733,693 TOTAL EXPENDITURE
104,554 MATERIALS & SERVICES SUBTOTAL
0
0
0
0
262
0
38
126
0
0
0
9,396
11,373
4,310
4,528
1,786
0
0
5,482
0
375
525
0
210
0
1,376
6,973
2,821
12,431
984
199
21
142
0
0
13
0
1,918
0
0
742
0
18,234
20,000
0
0
0
0
0
4,947
629,140 PERSONNEL EXPENSE SUBTOTAL
289
0
(21,248)
0
835
FY 2019 ACTUAL
600,751
38,268
5,587
Utility Operations & Services Department
Expenditure Summary 8224 - Conveyance EngineeringUOPSEXPENDITURESUMMARY▼ Conveyance Engineering | 8224

CLEAN WATER SERVICES • FY 2021-22 PROPOSED BUDGET PAGE 218
UTILITY OPERATIONS & SERVICES DEPARTMENTPOSITION AND SALARY EXPENSE SYSTEM REPAIR 8371
TotalFY 2019 FY 2020 FY 2021 FY 2022 RepresentedACTUAL ACTUAL REVISED PROPOSED or
BUDGET BUDGET Non-Rep13.00 13.00 13.00 13.00 Field Construction/Maintenance Tech 2 5 Rep
1.00 1.00 1.00 1.00 Field Constr/Maint Supervisor 7 Non
14.00 14.00 14.00 14.00 TOTAL PERSONNEL
OperatingFY 2019 FY 2020 FY 2021 FY 2022 RepresentedACTUAL ACTUAL REVISED PROPOSED or
BUDGET BUDGET Non-Rep5.20 5.20 5.20 5.20 Field Construction/Maintenance Tech 2 5 Rep0.80 0.80 0.80 0.80 Field Constr/Maint Supervisor 7 Non
6.00 6.00 6.00 6.00 TOTAL PERSONNEL
CapitalFY 2019 FY 2020 FY 2021 FY 2022 RepresentedACTUAL ACTUAL REVISED PROPOSED or
BUDGET BUDGET Non-Rep7.80 7.80 7.80 7.80 Field Construction/Maintenance Tech 2 5 Rep0.20 0.20 0.20 0.20 Field Constr/Maint Supervisor 7 Non
8.00 8.00 8.00 8.00 TOTAL PERSONNEL
CLASSIFICATION TITLE SALARY GRADE
CLASSIFICATION TITLE SALARY GRADE
CLASSIFICATION TITLE SALARY GRADE
UOPSPOSITIONANDSALARYEXPENSE▼ System Repair | 8371

CLEAN WATER SERVICES • FY 2021-22 PROPOSED BUDGET PAGE 219
FY 2020 ACTUAL
FY 2021 REVISED BUDGET OBJECT CODE DESCRIPTION OBJECT
CODEFY 2022
PROPOSEDFY 2022
APPROVEDFY 2022
ADOPTED565,080 817,300 Wages & Other Pay 51100 835,200
0 0 Temporary 51130 0
10,393 25,000 Overtime 51140 25,000
236,017 340,300 Other Personnel Expenses 51600 349,100
0 0 Tuition Reimbursement 51761 0
3,300 2,800 Other Employee Allowances 51900 2,800
840 800 Mobile Computing Allowance 51915 800
815,629 1,186,200 1,212,900
0 0 Electricity 52110 0
0 0 Water 52120 0
0 0 Natural Gas 52130 0
182 2,000 Garbage 52140 2,000
0 0 Surface Water Management Charge 52150 0
0 0 Other Utility Services 52160 0
0 0 Sewer Charges 52170 0
2,753 15,000 Contracted Services 52205 10,000
0 0 Engineering Services 52210 0
0 0 Landscape Services 52215 0
0 0 Legal Services 52230 0
0 0 Professional Services 52240 0
0 0 Recording Fees 52250 0
7,318 7,000 Laundry 52260 7,000
0 0 Other Government Services 52270 0
94 0 Office Supplies 52305 0
87 1,000 Operating Supplies 52310 1,000
11,966 12,000 Gas, Oil, Lubrication 52315 12,000
0 0 Janitorial Supplies 52320 0
0 0 Tech & Scientific Supplies 52325 0
20,086 45,000 Repair & Maintenance Supplies 52330 45,000
58,340 100,000 Construction & Building Supplies 52335 100,000
5,570 9,200 Small Tools 52350 9,200
1,820 2,000 Safety Equipment 52360 2,000
0 0 Postage & Freight 52375 0
0 0 Software Expensed 52380 0
0 0 Computer Equipment Expensed 52385 0
360 300 Dues & Memberships 52405 300
13 0 Books, Subscriptions & Publications 52410 0
0 0 Software Licenses & Support 52425 0
0 0 Publication Notices 52430 0
0 0 Printing 52435 0
0 0 Telecom Internal 52440 0
0 0 Telephone Services 52445 0
40,962 43,000 Fueling Contract 52475 45,000
3,736 2,700 Training & Education 52480 2,700
1,009 2,000 Travel Expense 52485 2,000
83,058 90,000 Fleet Charges 52486 90,000
257 1,000 Private Mileage 52487 1,000
939 300 Other Materials & Services 52495 300
250 500 Permits, Licenses & Fees 52500 500
0 0 Public Information 52505 0
0 0 Taxes, Assessments & Liens 52510 0
0 0 Bank Service Charge 52515 0
0 0 Franchise Fees 52530 0
0 0 Payment Adjustment to Cities 52540 0
0 0 Bond Trustee Fees 52550 0
5,533 5,000 Equipment Rental 52605 5,000
0 0 Repair & Maintenance Services 52610 0
0 0 Computer Repair & Maintenance 52630 0
0 0 Other Chemicals 52890 0
244,332 338,000 335,000
1,059,961 1,524,200 1,547,9001,013,180 TOTAL EXPENDITURE
309,967 MATERIALS & SERVICES SUBTOTAL
0
0
0
0
0
0
0
0
0
0
0
5,494
1,195
95,210
500
1,143
0
0
40,991
0
0
0
0
0
0
0
682
33,326
96,866
7,846
8
168
824
14,284
0
0
0
0
0
8,377
0
0
3,053
0
0
0
0
0
0
805
703,212 PERSONNEL EXPENSE SUBTOTAL
0
0
167,004
0
1,909
FY 2019 ACTUAL
526,835
0
6,659
Utility Operations & Services Department
Expenditure Summary 8371 - System RepairUOPSEXPENDITURESUMMARY▼ System Repair | 8371

CLEAN WATER SERVICES • FY 2021-22 PROPOSED BUDGET PAGE 220
UTILITY OPERATIONS & SERVICES DEPARTMENTPOSITION AND SALARY EXPENSE SYSTEM MAINTENANCE 8373
TotalFY 2019 FY 2020 FY 2021 FY 2022 RepresentedACTUAL ACTUAL REVISED PROPOSED or
BUDGET BUDGET Non-Rep14.00 14.00 14.00 14.00 Field Construction/Maintenance Tech 2 5 Rep
1.00 1.00 1.00 1.00 Field Constr/Maint Supervisor 7 Non
15.00 15.00 15.00 15.00 TOTAL PERSONNEL
OperatingFY 2019 FY 2020 FY 2021 FY 2022 RepresentedACTUAL ACTUAL REVISED PROPOSED or
BUDGET BUDGET Non-Rep14.00 14.00 14.00 14.00 Field Construction/Maintenance Tech 2 5 Rep
1.00 1.00 1.00 1.00 Field Constr/Maint Supervisor 7 Non
15.00 15.00 15.00 15.00 TOTAL PERSONNEL
CapitalFY 2019 FY 2020 FY 2021 FY 2022 RepresentedACTUAL ACTUAL REVISED PROPOSED or
BUDGET BUDGET Non-Rep0.00 0.00 0.00 0.00 Field Construction/Maintenance Tech 2 5 Rep0.00 0.00 0.00 0.00 Field Constr/Maint Supervisor 7 Non
0.00 0.00 0.00 0.00 TOTAL PERSONNEL
CLASSIFICATION TITLE SALARY GRADE
CLASSIFICATION TITLE SALARY GRADE
CLASSIFICATION TITLE SALARY GRADE
UOPSPOSITIONANDSALARYEXPENSE▼ System Maintenance | 8373

CLEAN WATER SERVICES • FY 2021-22 PROPOSED BUDGET PAGE 221
FY 2020 ACTUAL
FY 2021 REVISED BUDGET OBJECT CODE DESCRIPTION OBJECT
CODEFY 2022
PROPOSEDFY 2022
APPROVEDFY 2022
ADOPTED1,043,320 1,162,900 Wages & Other Pay 51100 1,189,400
46,209 50,000 Temporary 51130 50,000
9,318 25,000 Overtime 51140 25,000
494,966 543,600 Other Personnel Expenses 51600 571,900
0 0 Tuition Reimbursement 51761 0
3,375 3,000 Other Employee Allowances 51900 3,000
840 800 Mobile Computing Allowance 51915 800
1,598,029 1,785,300 1,840,100
0 0 Electricity 52110 0
17,394 16,000 Water 52120 16,000
0 0 Natural Gas 52130 0
59,716 50,000 Garbage 52140 60,000
0 0 Surface Water Management Charge 52150 0
0 0 Other Utility Services 52160 0
0 0 Sewer Charges 52170 0
108,939 100,000 Contracted Services 52205 100,000
0 0 Engineering Services 52210 0
0 0 Landscape Services 52215 0
0 0 Legal Services 52230 0
0 0 Professional Services 52240 0
0 0 Recording Fees 52250 0
11,137 8,000 Laundry 52260 10,000
0 0 Other Government Services 52270 0
448 0 Office Supplies 52305 0
374 700 Operating Supplies 52310 700
2,851 4,000 Gas, Oil, Lubrication 52315 4,000
0 0 Janitorial Supplies 52320 0
0 0 Tech & Scientific Supplies 52325 0
57,338 69,000 Repair & Maintenance Supplies 52330 69,000
63 0 Construction & Building Supplies 52335 0
3,589 3,000 Small Tools 52350 3,000
7,505 4,000 Safety Equipment 52360 4,000
0 0 Postage & Freight 52375 0
0 0 Software Expensed 52380 0
332 0 Computer Equipment Expensed 52385 0
150 1,000 Dues & Memberships 52405 500
0 0 Books, Subscriptions & Publications 52410 0
0 0 Software Licenses & Support 52425 0
0 0 Publication Notices 52430 0
0 400 Printing 52435 400
0 0 Telecom Internal 52440 0
0 0 Telephone Services 52445 0
51,565 60,000 Fueling Contract 52475 65,000
2,835 2,000 Training & Education 52480 2,000
0 800 Travel Expense 52485 800
188,592 150,000 Fleet Charges 52486 165,000
74 0 Private Mileage 52487 0
305 200 Other Materials & Services 52495 200
2,380 2,500 Permits, Licenses & Fees 52500 2,500
0 0 Public Information 52505 0
0 0 Taxes, Assessments & Liens 52510 0
0 0 Bank Service Charge 52515 0
0 0 Franchise Fees 52530 0
0 0 Payment Adjustment to Cities 52540 0
0 0 Bond Trustee Fees 52550 0
8,482 2,000 Equipment Rental 52605 2,000
901 3,100 Repair & Maintenance Services 52610 3,100
0 0 Computer Repair & Maintenance 52630 0
46,407 45,000 Other Chemicals 52890 45,000
571,377 521,700 553,200
2,169,406 2,307,000 2,393,3002,120,927 TOTAL EXPENDITURE
559,482 MATERIALS & SERVICES SUBTOTAL
45,451
0
0
0
29,000
3,039
68
0
0
0
0
2,270
2,180
172,992
169
493
0
0
56,817
0
0
0
590
0
0
0
1,702
44,641
1,058
1,729
12,656
85
146
7,080
0
0
0
0
0
11,932
0
0
108,519
0
0
0
40,629
0
0
805
1,561,446 PERSONNEL EXPENSE SUBTOTAL
0
16,236
472,499
0
2,352
FY 2019 ACTUAL
1,018,761
54,486
12,542
Utility Operations & Services Department
Expenditure Summary 8373 - System MaintenanceUOPSEXPENDITURESUMMARY▼ System Maintenance | 8373

CLEAN WATER SERVICES • FY 2021-22 PROPOSED BUDGET PAGE 222
UTILITY OPERATIONS & SERVICES DEPARTMENTPOSITION AND SALARY EXPENSE TV/FLOW MONITORING 8375
TotalFY 2019 FY 2020 FY 2021 FY 2022 RepresentedACTUAL ACTUAL REVISED PROPOSED or
BUDGET BUDGET Non-Rep13.00 13.00 12.00 12.00 Field Construction/Maintenance Tech 2 5 Rep
1.00 1.00 1.00 1.00 Field Construction/Maint Supervisor 7 Non
14.00 14.00 13.00 13.00 TOTAL PERSONNEL
OperatingFY 2019 FY 2020 FY 2021 FY 2022 RepresentedACTUAL ACTUAL REVISED PROPOSED or
BUDGET BUDGET Non-Rep13.00 13.00 12.00 12.00 Field Construction/Maintenance Tech 2 5 Rep
1.00 1.00 1.00 1.00 Field Construction/Maint Supervisor 7 Non
14.00 14.00 13.00 13.00 TOTAL PERSONNEL
CapitalFY 2019 FY 2020 FY 2021 FY 2022 RepresentedACTUAL ACTUAL REVISED PROPOSED or
BUDGET BUDGET Non-Rep0.00 0.00 0.00 0.00 Field Construction/Maintenance Tech 2 5 Rep0.00 0.00 0.00 0.00 Field Construction/Maint Supervisor 7 Non
0.00 0.00 0.00 0.00 TOTAL PERSONNEL
CLASSIFICATION TITLE SALARY GRADE
CLASSIFICATION TITLE SALARY GRADE
CLASSIFICATION TITLE SALARY GRADE
4/6/2021
UOPSPOSITIONANDSALARYEXPENSE▼ TV/Flow Monitoring | 8375

CLEAN WATER SERVICES • FY 2021-22 PROPOSED BUDGET PAGE 223
FY 2020 ACTUAL
FY 2021 REVISED BUDGET OBJECT CODE DESCRIPTION OBJECT
CODEFY 2022
PROPOSEDFY 2022
APPROVEDFY 2022
ADOPTED1,073,146 1,142,200 Wages & Other Pay 51100 1,054,700
0 0 Temporary 51130 0
6,447 11,000 Overtime 51140 11,000
492,439 512,600 Other Personnel Expenses 51600 485,200
0 0 Tuition Reimbursement 51761 0
3,075 2,800 Other Employee Allowances 51900 2,600
840 800 Mobile Computing Allowance 51915 800
1,575,946 1,669,400 1,554,300
11,177 10,300 Electricity 52110 10,300
0 0 Water 52120 0
0 0 Natural Gas 52130 0
0 0 Garbage 52140 0
0 0 Surface Water Management Charge 52150 0
0 0 Other Utility Services 52160 0
0 0 Sewer Charges 52170 0
145,529 15,000 Contracted Services 52205 15,000
0 0 Engineering Services 52210 0
0 0 Landscape Services 52215 0
0 0 Legal Services 52230 0
0 0 Professional Services 52240 0
0 0 Recording Fees 52250 0
5,502 4,900 Laundry 52260 4,900
0 0 Other Government Services 52270 0
47 200 Office Supplies 52305 200
10 500 Operating Supplies 52310 500
0 0 Gas, Oil, Lubrication 52315 0
0 0 Janitorial Supplies 52320 0
0 0 Tech & Scientific Supplies 52325 0
16,825 22,500 Repair & Maintenance Supplies 52330 22,500
0 0 Construction & Building Supplies 52335 0
4,319 5,200 Small Tools 52350 5,200
0 0 Safety Equipment 52360 0
899 0 Postage & Freight 52375 0
0 0 Software Expensed 52380 0
0 0 Computer Equipment Expensed 52385 0
240 500 Dues & Memberships 52405 500
0 0 Books, Subscriptions & Publications 52410 0
0 0 Software Licenses & Support 52425 0
0 0 Publication Notices 52430 0
0 0 Printing 52435 0
0 0 Telecom Internal 52440 0
0 0 Telephone Services 52445 0
15,524 20,000 Fueling Contract 52475 23,000
1,780 2,300 Training & Education 52480 2,300
565 600 Travel Expense 52485 600
29,215 33,000 Fleet Charges 52486 33,000
206 0 Private Mileage 52487 0
0 0 Other Materials & Services 52495 0
0 0 Permits, Licenses & Fees 52500 0
0 0 Public Information 52505 0
0 0 Taxes, Assessments & Liens 52510 0
0 0 Bank Service Charge 52515 0
0 0 Franchise Fees 52530 0
0 0 Payment Adjustment to Cities 52540 0
0 0 Bond Trustee Fees 52550 0
0 0 Equipment Rental 52605 0
46,768 80,000 Repair & Maintenance Services 52610 80,000
0 0 Computer Repair & Maintenance 52630 0
0 15,000 Other Chemicals 52890 15,000
278,607 210,000 213,000
1,854,553 1,879,400 1,767,3001,706,914 TOTAL EXPENDITURE
157,571 MATERIALS & SERVICES SUBTOTAL
0
0
0
0
0
40,164
0
0
0
0
0
5,733
0
29,829
114
0
0
0
19,332
0
0
0
0
0
0
0
825
25,107
0
6,502
0
60
25
0
0
0
0
0
0
5,643
0
0
13,741
0
0
0
0
0
0
805
1,549,344 PERSONNEL EXPENSE SUBTOTAL
10,496
0
468,779
0
1,947
FY 2019 ACTUAL
1,067,878
0
9,935
Utility Operations & Services Department
Expenditure Summary 8375 - TV/Flow MonitoringUOPSEXPENDITURESUMMARY▼ TV/Flow Monitoring | 8375

CLEAN WATER SERVICES • FY 2021-22 PROPOSED BUDGET PAGE 224
UTILITY OPERATIONS & SERVICES DEPARTMENTPOSITION AND SALARY EXPENSE LOCAL REPAIR & CONSTRUCTION 8380
TotalFY 2019 FY 2020 FY 2021 FY 2022 RepresentedACTUAL ACTUAL REVISED PROPOSED or
BUDGET BUDGET Non-Rep10.00 10.00 10.00 10.00 Field Construction/Maintenance Tech 2 5 Rep
1.00 1.00 1.00 1.00 Field Construction/Maint Supervisor 7 Non
11.00 11.00 11.00 11.00 TOTAL PERSONNEL
OperatingFY 2019 FY 2020 FY 2021 FY 2022 RepresentedACTUAL ACTUAL REVISED PROPOSED or
BUDGET BUDGET Non-Rep9.00 9.00 9.00 9.00 Field Construction/Maintenance Tech 2 5 Rep1.00 1.00 1.00 1.00 Field Construction/Maint Supervisor 7 Non
10.00 10.00 10.00 10.00 TOTAL PERSONNEL
CapitalFY 2019 FY 2020 FY 2021 FY 2022 RepresentedACTUAL ACTUAL REVISED PROPOSED or
BUDGET BUDGET Non-Rep1.00 1.00 1.00 1.00 Field Construction/Maintenance Tech 2 5 Rep0.00 0.00 0.00 0.00 Field Construction/Maint Supervisor 7 Non
1.00 1.00 1.00 1.00 TOTAL PERSONNEL
CLASSIFICATION TITLE SALARY GRADE
CLASSIFICATION TITLE SALARY GRADE
CLASSIFICATION TITLE SALARY GRADE
UOPSPOSITIONANDSALARYEXPENSE▼ Local Repair & Construction | 8380

CLEAN WATER SERVICES • FY 2021-22 PROPOSED BUDGET PAGE 225
FY 2020 ACTUAL
FY 2021 REVISED BUDGET OBJECT CODE DESCRIPTION OBJECT
CODEFY 2022
PROPOSEDFY 2022
APPROVEDFY 2022
ADOPTED718,426 828,300 Wages & Other Pay 51100 864,800
51,803 50,000 Temporary 51130 50,000
5,807 20,000 Overtime 51140 20,000
329,911 373,000 Other Personnel Expenses 51600 403,800
116 0 Tuition Reimbursement 51761 0
2,475 2,200 Other Employee Allowances 51900 2,200
840 800 Mobile Computing Allowance 51915 800
1,109,378 1,274,300 1,341,600
419 0 Electricity 52110 0
0 0 Water 52120 0
0 0 Natural Gas 52130 0
8,132 7,000 Garbage 52140 8,500
0 0 Surface Water Management Charge 52150 0
0 0 Other Utility Services 52160 0
0 0 Sewer Charges 52170 0
37,775 45,000 Contracted Services 52205 45,000
0 0 Engineering Services 52210 0
0 0 Landscape Services 52215 0
0 0 Legal Services 52230 0
0 0 Professional Services 52240 0
0 0 Recording Fees 52250 0
5,444 4,600 Laundry 52260 4,600
0 0 Other Government Services 52270 0
11 0 Office Supplies 52305 0
733 2,500 Operating Supplies 52310 2,500
843 5,000 Gas, Oil, Lubrication 52315 3,500
0 0 Janitorial Supplies 52320 0
0 0 Tech & Scientific Supplies 52325 0
177,108 195,000 Repair & Maintenance Supplies 52330 195,000
5 2,000 Construction & Building Supplies 52335 1,000
11,950 9,200 Small Tools 52350 9,200
10,968 10,000 Safety Equipment 52360 10,000
0 0 Postage & Freight 52375 0
0 0 Software Expensed 52380 0
360 0 Computer Equipment Expensed 52385 0
300 200 Dues & Memberships 52405 200
0 0 Books, Subscriptions & Publications 52410 0
0 0 Software Licenses & Support 52425 0
0 0 Publication Notices 52430 0
0 0 Printing 52435 0
0 0 Telecom Internal 52440 0
0 0 Telephone Services 52445 0
30,193 30,000 Fueling Contract 52475 34,000
3,022 2,300 Training & Education 52480 2,300
649 1,900 Travel Expense 52485 1,900
72,850 62,500 Fleet Charges 52486 62,500
0 0 Private Mileage 52487 0
176 0 Other Materials & Services 52495 300
2,150 2,000 Permits, Licenses & Fees 52500 2,000
0 0 Public Information 52505 0
0 0 Taxes, Assessments & Liens 52510 0
0 0 Bank Service Charge 52515 0
0 0 Franchise Fees 52530 0
0 0 Payment Adjustment to Cities 52540 0
0 0 Bond Trustee Fees 52550 0
18,064 10,000 Equipment Rental 52605 10,000
0 0 Repair & Maintenance Services 52610 0
0 0 Computer Repair & Maintenance 52630 0
0 0 Other Chemicals 52890 0
381,152 389,200 392,500
1,490,530 1,663,500 1,734,1001,445,129 TOTAL EXPENDITURE
379,383 MATERIALS & SERVICES SUBTOTAL
0
0
0
0
1,373
0
600
0
0
0
0
4,782
1,993
69,761
129
484
300
0
28,991
0
0
0
0
0
0
0
350
176,514
2,124
8,545
10,717
67
864
2,322
0
0
0
0
0
6,040
0
0
56,708
0
0
0
6,312
0
0
805
1,065,747 PERSONNEL EXPENSE SUBTOTAL
406
0
307,616
0
2,059
FY 2019 ACTUAL
735,184
15,249
4,833
Utility Operations & Services Department
Expenditure Summary 8380 - Local Repair & ConstructionUOPSEXPENDITURESUMMARY▼ Local Repair & Construction | 8380

CLEAN WATER SERVICES • FY 2021-22 PROPOSED BUDGET PAGE 226
UTILITY OPERATIONS & SERVICES DEPARTMENTPOSITION AND SALARY EXPENSE SWM/SURFACE FACILITY MAINTENANCE 8383
TotalFY 2019 FY 2020 FY 2021 FY 2022 RepresentedACTUAL ACTUAL REVISED PROPOSED or
BUDGET BUDGET Non-Rep14.00 15.00 15.00 15.00 Field Construction/Maintenance Tech 2 5 Rep
1.00 1.00 1.00 1.00 Field Construction/Maint Supervisor 7 Non
15.00 16.00 16.00 16.00 TOTAL PERSONNEL
OperatingFY 2019 FY 2020 FY 2021 FY 2022 RepresentedACTUAL ACTUAL REVISED PROPOSED or
BUDGET BUDGET Non-Rep14.00 15.00 15.00 15.00 Field Construction/Maintenance Tech 2 5 Rep
1.00 1.00 1.00 1.00 Field Construction/Maint Supervisor 7 Non
15.00 16.00 16.00 16.00 TOTAL PERSONNEL
CapitalFY 2019 FY 2020 FY 2021 FY 2022 RepresentedACTUAL ACTUAL REVISED PROPOSED or
BUDGET BUDGET Non-Rep0.00 0.00 0.00 0.00 Field Construction/Maintenance Tech 2 5 Rep0.00 0.00 0.00 0.00 Field Construction/Maint Supervisor 7 Non
0.00 0.00 0.00 0.00 TOTAL PERSONNEL
CLASSIFICATION TITLE SALARY GRADE
CLASSIFICATION TITLE SALARY GRADE
CLASSIFICATION TITLE SALARY GRADE
UOPSPOSITIONANDSALARYEXPENSE▼ SWM Surface Facility Maintenance | 8383

CLEAN WATER SERVICES • FY 2021-22 PROPOSED BUDGET PAGE 227
FY 2020 ACTUAL
FY 2021 REVISED BUDGET OBJECT CODE DESCRIPTION OBJECT
CODEFY 2022
PROPOSEDFY 2022
APPROVEDFY 2022
ADOPTED1,094,167 1,245,200 Wages & Other Pay 51100 1,277,700
0 42,000 Temporary 51130 0
19,729 25,000 Overtime 51140 25,000
509,675 567,200 Other Personnel Expenses 51600 597,200
0 0 Tuition Reimbursement 51761 0
3,750 3,200 Other Employee Allowances 51900 3,200
840 800 Mobile Computing Allowance 51915 800
1,628,162 1,883,400 1,903,900
3,696 0 Electricity 52110 0
0 0 Water 52120 0
0 0 Natural Gas 52130 0
32,109 55,000 Garbage 52140 40,000
0 0 Surface Water Management Charge 52150 0
0 0 Other Utility Services 52160 0
0 0 Sewer Charges 52170 0
53,928 60,000 Contracted Services 52205 60,000
0 0 Engineering Services 52210 0
0 0 Landscape Services 52215 0
1 0 Legal Services 52230 0
0 0 Professional Services 52240 0
0 0 Recording Fees 52250 0
8,601 7,000 Laundry 52260 8,000
0 0 Other Government Services 52270 0
0 0 Office Supplies 52305 0
15,419 18,000 Operating Supplies 52310 18,000
4,045 6,500 Gas, Oil, Lubrication 52315 6,500
0 0 Janitorial Supplies 52320 0
0 0 Tech & Scientific Supplies 52325 0
2,965 20,000 Repair & Maintenance Supplies 52330 15,000
49,825 60,000 Construction & Building Supplies 52335 60,000
4,465 10,000 Small Tools 52350 10,000
0 0 Safety Equipment 52360 0
0 0 Postage & Freight 52375 0
0 0 Software Expensed 52380 0
0 0 Computer Equipment Expensed 52385 0
296 300 Dues & Memberships 52405 300
0 0 Books, Subscriptions & Publications 52410 0
0 0 Software Licenses & Support 52425 0
0 0 Publication Notices 52430 0
0 0 Printing 52435 0
0 0 Telecom Internal 52440 0
0 0 Telephone Services 52445 0
63,527 74,000 Fueling Contract 52475 77,000
285 2,500 Training & Education 52480 2,500
1,556 1,300 Travel Expense 52485 1,300
117,389 140,000 Fleet Charges 52486 140,000
0 0 Private Mileage 52487 0
267 5,000 Other Materials & Services 52495 5,000
115 300 Permits, Licenses & Fees 52500 300
0 0 Public Information 52505 0
0 0 Taxes, Assessments & Liens 52510 0
0 0 Bank Service Charge 52515 0
0 0 Franchise Fees 52530 0
0 0 Payment Adjustment to Cities 52540 0
0 0 Bond Trustee Fees 52550 0
4,134 8,000 Equipment Rental 52605 5,000
538 10,000 Repair & Maintenance Services 52610 8,000
0 0 Computer Repair & Maintenance 52630 0
0 0 Other Chemicals 52890 0
363,162 477,900 456,900
1,991,324 2,361,300 2,360,8002,071,350 TOTAL EXPENDITURE
444,725 MATERIALS & SERVICES SUBTOTAL
0
0
0
0
4,287
0
0
0
0
0
0
730
496
151,467
0
600
0
0
67,289
0
0
0
0
0
0
0
561
1,556
40,871
7,689
0
0
20,071
5,754
0
347
0
0
0
10,904
0
0
59,721
0
0
0
68,972
0
0
805
1,626,625 PERSONNEL EXPENSE SUBTOTAL
3,409
0
493,039
0
2,868
FY 2019 ACTUAL
1,092,510
20,166
17,238
Utility Operations & Services Department
Expenditure Summary 8383 - SWM Surface Facility MaintenanceUOPSEXPENDITURESUMMARY▼ SWM Surface Facility Maintenance | 8383

CLEAN WATER SERVICES • FY 2021-22 PROPOSED BUDGET PAGE 228
UTILITY OPERATIONS & SERVICES DEPARTMENTPOSITION AND SALARY EXPENSE ADMINISTRATION 8201
TotalFY 2019 FY 2020 FY 2021 FY 2022 RepresentedACTUAL ACTUAL REVISED PROPOSED or
BUDGET BUDGET Non-Rep0.00 1.00 1.00 0.00 Managing Director - Utility Operations & Services 14 Non0.00 1.00 1.00 0.00 Building & Facilities Services Manager 10 Non1.00 1.00 1.00 0.00 Engineering Division Manager 11 Non1.00 0.00 0.00 0.00 Conveyance Sys Dept Director LT 13 Non1.00 1.00 1.00 0.00 Field Operations Division Manager 11 Non1.00 1.00 1.00 0.00 Planning & Development Svcs Division Mgr 11 Non0.00 0.00 1.00 0.00 Utility Operations Services Manager 12 Non
4.00 5.00 6.00 0.00 TOTAL PERSONNEL
OperatingFY 2019 FY 2020 FY 2021 FY 2022 RepresentedACTUAL ACTUAL REVISED PROPOSED or
BUDGET BUDGET Non-Rep0.00 0.85 0.85 0.00 Managing Director - Utility Operations & Services 14 Non0.00 1.00 1.00 0.00 Building & Facilities Services Manager 10 Non0.85 0.85 0.85 0.00 Engineering Division Manager 11 Non0.85 0.00 0.00 0.00 Conveyance Sys Dept Director LT 13 Non0.85 0.85 0.85 0.00 Field Operations Division Manager 11 Non0.85 0.85 0.85 0.00 Planning & Development Svcs Division Mgr 11 Non0.00 0.00 0.85 Utility Operations Services Manager 12 Non
3.40 2.55 5.25 0.00 TOTAL PERSONNEL
CapitalFY 2019 FY 2020 FY 2021 FY 2022 RepresentedACTUAL ACTUAL REVISED PROPOSED or
BUDGET BUDGET Non-Rep0.00 0.15 0.15 0.00 Managing Director - Utility Operations & Services 14 Non0.00 0.00 0.00 0.00 Building & Facilities Services Manager 10 Non0.15 0.15 0.15 0.00 Engineering Division Manager 11 Non0.15 0.00 0.00 0.00 Conveyance Sys Dept Director LT 13 Non0.15 0.15 0.15 0.00 Field Operations Division Manager 11 Non0.15 0.15 0.15 0.00 Planning & Development Svcs Division Mgr 11 Non0.00 0.00 0.15 0.00 Utility Operations Services Manager 12 Non
0.60 0.45 0.75 0.00 TOTAL PERSONNEL
CLASSIFICATION TITLE SALARY GRADE
CLASSIFICATION TITLE SALARY GRADE
CLASSIFICATION TITLE SALARY GRADE
UOPSPOSITIONANDSALARYEXPENSE▼ Utility Operations & Services Administration | 8201

CLEAN WATER SERVICES • FY 2021-22 PROPOSED BUDGET PAGE 229
FY 2020 ACTUAL
FY 2021 REVISED BUDGET OBJECT CODE DESCRIPTION OBJECT
CODEFY 2022
PROPOSEDFY 2022
APPROVEDFY 2022
ADOPTED789,681 990,000 Wages & Other Pay 51100 0
42,825 0 Temporary 51130 0
6,935 0 Overtime 51140 0
239,834 313,400 Other Personnel Expenses 51600 0
0 0 Tuition Reimbursement 51761 0
300 0 Other Employee Allowances 51900 0
4,200 4,000 Mobile Computing Allowance 51915 0
1,083,775 1,307,400 0
0 0 Electricity 52110 0
0 0 Water 52120 0
0 0 Natural Gas 52130 0
0 0 Garbage 52140 0
0 0 Surface Water Management Charge 52150 0
0 0 Other Utility Services 52160 0
0 0 Sewer Charges 52170 0
0 0 Contracted Services 52205 0
0 0 Engineering Services 52210 0
0 0 Landscape Services 52215 0
0 0 Legal Services 52230 0
2,428 25,000 Professional Services 52240 0
0 0 Recording Fees 52250 0
0 0 Laundry 52260 0
0 0 Other Government Services 52270 0
1,175 1,000 Office Supplies 52305 0
9 0 Operating Supplies 52310 0
0 0 Gas, Oil, Lubrication 52315 0
0 0 Janitorial Supplies 52320 0
0 0 Tech & Scientific Supplies 52325 0
0 0 Repair & Maintenance Supplies 52330 0
434 0 Construction & Building Supplies 52335 0
304 0 Small Tools 52350 0
0 0 Safety Equipment 52360 0
20 0 Postage & Freight 52375 0
0 0 Software Expensed 52380 0
0 0 Computer Equipment Expensed 52385 0
9,719 9,000 Dues & Memberships 52405 0
104 300 Books, Subscriptions & Publications 52410 0
375 0 Software Licenses & Support 52425 0
0 0 Publication Notices 52430 0
651 300 Printing 52435 0
0 0 Telecom Internal 52440 0
0 0 Telephone Services 52445 0
0 0 Fueling Contract 52475 0
3,819 2,600 Training & Education 52480 0
3,940 4,400 Travel Expense 52485 0
0 0 Fleet Charges 52486 0
1,339 3,600 Private Mileage 52487 0
2,389 5,000 Other Materials & Services 52495 0
15 0 Permits, Licenses & Fees 52500 0
0 0 Public Information 52505 0
0 0 Taxes, Assessments & Liens 52510 0
0 0 Bank Service Charge 52515 0
0 0 Franchise Fees 52530 0
0 0 Payment Adjustment to Cities 52540 0
0 0 Bond Trustee Fees 52550 0
0 0 Equipment Rental 52605 0
0 0 Repair & Maintenance Services 52610 0
0 0 Computer Repair & Maintenance 52630 0
0 0 Other Chemicals 52890 0
26,719 51,200 0
1,110,494 1,358,600 0888,824 TOTAL EXPENDITURE
30,853 MATERIALS & SERVICES SUBTOTAL
0
0
0
0
0
0
0
0
0
0
0
2,258
3,246
0
2,699
3,614
0
0
0
0
19
1,161
265
123
0
3,498
5,043
0
0
19
0
1,410
0
0
0
0
2,372
5,063
65
0
0
0
0
0
0
0
0
0
0
3,290
857,971 PERSONNEL EXPENSE SUBTOTAL
0
0
183,679
0
0
FY 2019 ACTUAL
660,187
9,983
833
Utility Operations & Services Department
Expenditure Summary 8201 - Utility Operations & Services AdministrationUOPSEXPENDITURESUMMARY▼ Utility Operations & Services Administration | 8201

CLEAN WATER SERVICES • FY 2021-22 PROPOSED BUDGET PAGE 230
UTILITY OPERATIONS & SERVICES DEPARTMENTPOSITION AND SALARY EXPENSE DEVELOPMENT RELATED SERVICES 8225
TotalFY 2019 FY 2020 FY 2021 FY 2022 RepresentedACTUAL ACTUAL REVISED PROPOSED or
BUDGET BUDGET Non-Rep1.00 1.00 0.00 0.00 Construction Inspection Supervisor 8 Non5.00 5.00 0.00 0.00 Construction Inspector 2 5 Rep1.00 1.00 0.00 0.00 Construction Inspector 3 6 Rep1.00 1.00 1.00 0.00 Development Services Supervisor 9 Non1.00 1.00 1.00 0.00 Engineering Technician 2 5 Rep2.00 2.00 2.00 0.00 Engineering Technician 3 6 Rep1.00 1.00 1.00 0.00 GIS Analyst 7 Non0.00 1.00 1.00 0.00 GIS Specialist 6 Non2.00 2.00 2.00 0.00 Permits Technician 2 3 Rep1.00 1.00 1.00 0.00 Permit/Mapping Supervisor 8 Non2.00 2.00 3.00 0.00 Plan Reviewer 7 Non1.00 1.00 1.00 0.00 Senior Water Resources Program Manager 10 Non0.00 0.00 1.00 0.00 Senior Plan Reviewer 8 Non2.00 2.00 2.00 0.00 Water Resources Program Manager 9 Non1.00 1.00 1.00 0.00 Business Systems Analyst 2 8 Non
21.00 22.00 17.00 0.00 TOTAL PERSONNEL
OperatingFY 2019 FY 2020 FY 2021 FY 2022 RepresentedACTUAL ACTUAL REVISED PROPOSED or
BUDGET BUDGET Non-Rep1.00 1.00 0.00 0.00 Construction Inspection Supervisor 8 Non5.00 5.00 0.00 0.00 Construction Inspector 2 5 Rep1.00 1.00 0.00 0.00 Construction Inspector 3 6 Rep0.90 0.90 0.90 0.00 Development Services Supervisor 9 Non1.00 1.00 1.00 0.00 Engineering Technician 2 5 Rep1.90 1.90 1.90 0.00 Engineering Technician 3 6 Rep1.00 1.00 1.00 0.00 GIS Analyst 7 Non0.00 1.00 1.00 0.00 GIS Specialist 6 Non2.00 2.00 2.00 0.00 Permits Technician 2 3 Rep1.00 1.00 1.00 0.00 Permit/Mapping Supervisor 8 Non2.00 2.00 3.00 0.00 Plan Reviewer 7 Non1.00 1.00 1.00 0.00 Senior Water Resources Program Manager 10 Non0.00 0.00 1.00 0.00 Senior Plan Reviewer 8 Non1.70 1.70 1.70 0.00 Water Resources Program Manager 9 Non1.00 1.00 1.00 0.00 Business Systems Analyst 2 8 Non
20.50 21.50 16.50 0.00 TOTAL PERSONNEL
CapitalFY 2019 FY 2020 FY 2021 FY 2022 RepresentedACTUAL ACTUAL REVISED PROPOSED or
BUDGET BUDGET Non-Rep0.00 0.00 0.00 0.00 Construction Inspection Supervisor 8 Non0.00 0.00 0.00 0.00 Construction Inspector 2 5 Rep0.00 0.00 0.00 0.00 Construction Inspector 3 6 Rep0.10 0.10 0.10 0.00 Development Services Supervisor 9 Non0.00 0.00 0.00 0.00 Engineering Technician 2 5 Rep0.10 0.10 0.10 0.00 Engineering Technician 3 6 Rep0.00 0.00 0.00 0.00 GIS Analyst 7 Non0.00 0.00 0.00 0.00 GIS Specialist 6 Non0.00 0.00 0.00 0.00 Permits Technician 2 3 Rep0.00 0.00 0.00 0.00 Permit/Mapping Supervisor 8 Rep0.00 0.00 0.00 0.00 Plan Reviewer 7 Non0.00 0.00 0.00 0.00 Senior Water Resources Program Manager 10 Non0.00 0.00 0.00 0.00 Senior Plan Reviewer 8 Non0.30 0.30 0.30 0.00 Water Resources Program Manager 9 Non0.00 0.00 0.00 0.00 Business Systems Analyst 2 8 Non
0.50 0.50 0.50 0.00 TOTAL PERSONNEL
CLASSIFICATION TITLE SALARY GRADE
CLASSIFICATION TITLE SALARY GRADE
CLASSIFICATION TITLE SALARY GRADE
UOPSPOSITIONANDSALARYEXPENSE▼ Development Related Services | 8225

CLEAN WATER SERVICES • FY 2021-22 PROPOSED BUDGET PAGE 231
FY 2020 ACTUAL
FY 2021 REVISED BUDGET OBJECT CODE DESCRIPTION OBJECT
CODEFY 2022
PROPOSEDFY 2022
APPROVEDFY 2022
ADOPTED1,856,784 1,726,100 Wages & Other Pay 51100 0
24,675 14,200 Temporary 51130 0
20,233 6,700 Overtime 51140 0
699,199 622,900 Other Personnel Expenses 51600 0
0 0 Tuition Reimbursement 51761 0
1,800 1,200 Other Employee Allowances 51900 0
1,560 2,000 Mobile Computing Allowance 51915 0
2,604,251 2,373,100 0
0 0 Electricity 52110 0
0 0 Water 52120 0
0 0 Natural Gas 52130 0
0 0 Garbage 52140 0
0 0 Surface Water Management Charge 52150 0
0 0 Other Utility Services 52160 0
0 0 Sewer Charges 52170 0
0 0 Contracted Services 52205 0
0 0 Engineering Services 52210 0
0 0 Landscape Services 52215 0
0 0 Legal Services 52230 0
140,278 200,000 Professional Services 52240 0
12,650 14,000 Recording Fees 52250 0
0 0 Laundry 52260 0
122 1,000 Other Government Services 52270 0
1,939 2,000 Office Supplies 52305 0
875 0 Operating Supplies 52310 0
0 0 Gas, Oil, Lubrication 52315 0
0 0 Janitorial Supplies 52320 0
0 0 Tech & Scientific Supplies 52325 0
0 0 Repair & Maintenance Supplies 52330 0
30 0 Construction & Building Supplies 52335 0
1,161 300 Small Tools 52350 0
0 0 Safety Equipment 52360 0
0 0 Postage & Freight 52375 0
0 0 Software Expensed 52380 0
4,319 0 Computer Equipment Expensed 52385 0
2,432 1,500 Dues & Memberships 52405 0
0 400 Books, Subscriptions & Publications 52410 0
0 0 Software Licenses & Support 52425 0
1,654 1,000 Publication Notices 52430 0
4,011 2,000 Printing 52435 0
0 0 Telecom Internal 52440 0
0 0 Telephone Services 52445 0
10,121 10,000 Fueling Contract 52475 0
4,634 4,600 Training & Education 52480 0
1,763 3,700 Travel Expense 52485 0
5,554 5,500 Fleet Charges 52486 0
337 400 Private Mileage 52487 0
870 3,000 Other Materials & Services 52495 0
140 0 Permits, Licenses & Fees 52500 0
0 0 Public Information 52505 0
0 0 Taxes, Assessments & Liens 52510 0
9,244 13,000 Bank Service Charge 52515 0
0 0 Franchise Fees 52530 0
0 0 Payment Adjustment to Cities 52540 0
0 0 Bond Trustee Fees 52550 0
0 0 Equipment Rental 52605 0
1,370 0 Repair & Maintenance Services 52610 0
0 3,000 Computer Repair & Maintenance 52630 0
0 0 Other Chemicals 52890 0
203,501 265,400 0
2,807,752 2,638,500 02,560,965 TOTAL EXPENDITURE
234,035 MATERIALS & SERVICES SUBTOTAL
0
0
0
278
0
0
0
0
0
4,890
0
7,525
1,780
5,091
707
1,878
0
0
11,695
275
0
925
4,731
31
0
0
1,536
4,330
0
712
0
2,178
24
0
0
0
0
177,105
8,345
0
0
0
0
0
0
0
0
0
0
1,495
2,326,930 PERSONNEL EXPENSE SUBTOTAL
0
0
615,766
0
1,087
FY 2019 ACTUAL
1,652,659
53,775
2,147
Utility Operations & Services Department
Expenditure Summary 8225 - Development Related ServicesUOPSEXPENDITURESUMMARY▼ Development Related Services | 8225

CLEAN WATER SERVICES • FY 2021-22 PROPOSED BUDGET PAGE 232
UTILITY OPERATIONS & SERVICES DEPARTMENTPOSITION AND SALARY EXPENSE SYSTEMS DELIVERY PLANNING 8226
TotalFY 2019 2019 FY 2021 FY 2022 RepresentedACTUAL ACTUAL REVISED PROPOSED or
BUDGET BUDGET Non-Rep0.00 0.00 1.00 0.00 Construction Inspection Supervisor 8 Non0.00 0.00 5.00 0.00 Construction Inspector 2 5 Rep0.00 0.00 1.00 0.00 Construction Inspector 3 6 Rep1.00 1.00 1.00 0.00 Development Services Supervisor 9 Non1.00 1.00 1.00 0.00 Engineering Technician 2 5 Rep1.00 1.00 1.00 0.00 Inspection Program Manager 7 Non1.00 1.00 0.00 0.00 Plan Reviewer 7 Non0.00 0.00 1.00 0.00 Technical Services Specialist 3 6 Rep
4.00 4.00 11.00 0.00 TOTAL PERSONNEL
OperatingFY 2019 2019 FY 2021 FY 2022 RepresentedACTUAL ACTUAL REVISED PROPOSED or
BUDGET BUDGET Non-Rep0.00 0.00 1.00 0.00 Construction Inspection Supervisor 8 Non0.00 0.00 5.00 0.00 Construction Inspector 2 5 Rep0.00 0.00 1.00 0.00 Construction Inspector 3 6 Rep1.00 1.00 1.00 0.00 Development Services Supervisor 9 Non1.00 1.00 1.00 0.00 Engineering Technician 2 5 Rep1.00 1.00 1.00 0.00 Inspection Program Manager 7 Non1.00 1.00 0.00 0.00 Plan Reviewer 7 Non0.00 0.00 1.00 0.00 Technical Services Specialist 3 6 Rep
4.00 4.00 11.00 0.00 TOTAL PERSONNEL
CapitalFY 2019 2019 FY 2021 FY 2022 RepresentedACTUAL ACTUAL REVISED PROPOSED or
BUDGET BUDGET Non-Rep0.00 0.00 0.00 0.00 Construction Inspection Supervisor 8 Non0.00 0.00 0.00 0.00 Construction Inspector 2 5 Rep0.00 0.00 0.00 0.00 Construction Inspector 3 6 Rep0.00 0.00 0.00 0.00 Development Services Supervisor 9 Non0.00 0.00 0.00 0.00 Engineering Technician 2 5 Rep0.00 0.00 0.00 0.00 Inspection Program Manager 7 Non0.00 0.00 0.00 0.00 Plan Reviewer 7 Non0.00 0.00 0.00 0.00 Technical Services Specialist 3 6 Rep
0.00 0.00 0.00 0.00 TOTAL PERSONNEL
CLASSIFICATION TITLE SALARY GRADE
CLASSIFICATION TITLE SALARY GRADE
CLASSIFICATION TITLE SALARY GRADE
UOPSPOSITIONANDSALARYEXPENSE▼ Systems Delivery Planning | 8226

CLEAN WATER SERVICES • FY 2021-22 PROPOSED BUDGET PAGE 233
FY 2020 ACTUAL
FY 2021 REVISED BUDGET OBJECT CODE DESCRIPTION OBJECT
CODEFY 2022
PROPOSEDFY 2022
APPROVEDFY 2022
ADOPTED355,050 965,100 Wages & Other Pay 51100 0
0 0 Temporary 51130 0
0 (500) Overtime 51140 0
123,955 391,000 Other Personnel Expenses 51600 0
0 0 Tuition Reimbursement 51761 0
375 1,400 Other Employee Allowances 51900 0
360 800 Mobile Computing Allowance 51915 0
479,740 1,357,800 0
0 0 Electricity 52110 0
0 0 Water 52120 0
0 0 Natural Gas 52130 0
0 0 Garbage 52140 0
0 0 Surface Water Management Charge 52150 0
0 0 Other Utility Services 52160 0
0 0 Sewer Charges 52170 0
0 0 Contracted Services 52205 0
0 0 Engineering Services 52210 0
0 0 Landscape Services 52215 0
0 0 Legal Services 52230 0
0 50,000 Professional Services 52240 0
0 0 Recording Fees 52250 0
0 0 Laundry 52260 0
0 0 Other Government Services 52270 0
12 0 Office Supplies 52305 0
0 0 Operating Supplies 52310 0
0 0 Gas, Oil, Lubrication 52315 0
0 0 Janitorial Supplies 52320 0
0 0 Tech & Scientific Supplies 52325 0
0 0 Repair & Maintenance Supplies 52330 0
0 0 Construction & Building Supplies 52335 0
460 1,000 Small Tools 52350 0
0 200 Safety Equipment 52360 0
0 0 Postage & Freight 52375 0
0 0 Software Expensed 52380 0
2,220 0 Computer Equipment Expensed 52385 0
146 2,300 Dues & Memberships 52405 0
0 0 Books, Subscriptions & Publications 52410 0
0 0 Software Licenses & Support 52425 0
325 0 Publication Notices 52430 0
0 3,600 Printing 52435 0
0 0 Telecom Internal 52440 0
0 0 Telephone Services 52445 0
283 500 Fueling Contract 52475 0
1,530 3,000 Training & Education 52480 0
450 2,500 Travel Expense 52485 0
308 1,000 Fleet Charges 52486 0
213 800 Private Mileage 52487 0
0 5,500 Other Materials & Services 52495 0
0 0 Permits, Licenses & Fees 52500 0
0 0 Public Information 52505 0
0 0 Taxes, Assessments & Liens 52510 0
0 0 Bank Service Charge 52515 0
0 0 Franchise Fees 52530 0
0 0 Payment Adjustment to Cities 52540 0
0 0 Bond Trustee Fees 52550 0
0 0 Equipment Rental 52605 0
0 0 Repair & Maintenance Services 52610 0
0 0 Computer Repair & Maintenance 52630 0
0 0 Other Chemicals 52890 0
5,948 70,400 0
485,688 1,428,200 0558,094 TOTAL EXPENDITURE
25,246 MATERIALS & SERVICES SUBTOTAL
0
0
0
0
0
0
0
0
0
0
0
980
567
228
201
2,246
0
0
454
0
0
579
260
0
0
0
672
0
0
0
0
0
0
0
0
0
0
19,060
0
0
0
0
0
0
0
0
0
0
0
345
532,848 PERSONNEL EXPENSE SUBTOTAL
0
0
140,695
0
0
FY 2019 ACTUAL
391,808
0
0
Utility Operations & Services Department
Expenditure Summary 8226 - Systems Delivery PlanningUOPSEXPENDITURESUMMARY▼ Systems Delivery Planning | 8226

CLEAN WATER SERVICES • FY 2021-22 PROPOSED BUDGET PAGE 234
UTILITY OPERATIONS & SERVICES DEPARTMENTPOSITION AND SALARY EXPENSE BUILDING MAINTENANCE - FIELD OPERATIONS 8508
TotalFY 2019 FY 2020 FY 2021 FY 2022 RepresentedACTUAL ACTUAL REVISED PROPOSED or
BUDGET BUDGET Non-Rep0.00 0.00 0.00 0.000.00 0.00 0.00 0.00
0.00 0.00 0.00 0.00 TOTAL PERSONNEL
OperatingFY 2019 FY 2020 FY 2021 FY 2022 RepresentedACTUAL ACTUAL REVISED PROPOSED or
BUDGET BUDGET Non-Rep0.00 0.00 0.00 0.000.00 0.00 0.00 0.00
0.00 0.00 0.00 0.00 TOTAL PERSONNEL
CapitalFY 2019 FY 2020 FY 2021 FY 2022 RepresentedACTUAL ACTUAL REVISED PROPOSED or
BUDGET BUDGET Non-Rep0.00 0.00 0.00 0.000.00 0.00 0.00 0.00
0.00 0.00 0.00 0.00 TOTAL PERSONNEL
CLASSIFICATION TITLE SALARY GRADE
CLASSIFICATION TITLE SALARY GRADE
CLASSIFICATION TITLE SALARY GRADE
No FTE in this program
UOPSPOSITIONANDSALARYEXPENSE▼ Building Maintenance - Field Operations Facility | 8508

CLEAN WATER SERVICES • FY 2021-22 PROPOSED BUDGET PAGE 235
FY 2020 ACTUAL
FY 2021 REVISED BUDGET OBJECT CODE DESCRIPTION OBJECT
CODEFY 2022
PROPOSEDFY 2022
APPROVEDFY 2022
ADOPTED0 0 Wages & Other Pay 51100 0
0 0 Temporary 51130 0
0 0 Overtime 51140 0
0 0 Other Personnel Expenses 51600 0
0 0 Tuition Reimbursement 51761 0
0 0 Other Employee Allowances 51900 0
0 0 Mobile Computing Allowance 51915 0
0 0 0
35,358 30,000 Electricity 52110 0
17,830 12,000 Water 52120 0
10,718 11,500 Natural Gas 52130 0
2,702 2,800 Garbage 52140 0
4,770 6,500 Surface Water Management Charge 52150 0
71 0 Other Utility Services 52160 0
7,803 11,000 Sewer Charges 52170 0
78,262 50,000 Contracted Services 52205 0
0 0 Engineering Services 52210 0
14,254 12,000 Landscape Services 52215 0
0 0 Legal Services 52230 0
0 0 Professional Services 52240 0
0 0 Recording Fees 52250 0
0 0 Laundry 52260 0
0 0 Other Government Services 52270 0
0 0 Office Supplies 52305 0
0 0 Operating Supplies 52310 0
0 0 Gas, Oil, Lubrication 52315 0
4,717 3,500 Janitorial Supplies 52320 0
0 0 Tech & Scientific Supplies 52325 0
0 0 Repair & Maintenance Supplies 52330 0
9,216 10,000 Construction & Building Supplies 52335 0
0 0 Small Tools 52350 0
0 0 Safety Equipment 52360 0
0 0 Postage & Freight 52375 0
0 0 Software Expensed 52380 0
0 0 Computer Equipment Expensed 52385 0
0 0 Dues & Memberships 52405 0
0 0 Books, Subscriptions & Publications 52410 0
0 0 Software Licenses & Support 52425 0
0 0 Publication Notices 52430 0
0 0 Printing 52435 0
0 0 Telecom Internal 52440 0
0 0 Telephone Services 52445 0
0 0 Fueling Contract 52475 0
0 0 Training & Education 52480 0
0 0 Travel Expense 52485 0
0 0 Fleet Charges 52486 0
0 0 Private Mileage 52487 0
540 0 Other Materials & Services 52495 0
103 0 Permits, Licenses & Fees 52500 0
0 0 Public Information 52505 0
0 0 Taxes, Assessments & Liens 52510 0
0 0 Bank Service Charge 52515 0
0 0 Franchise Fees 52530 0
0 0 Payment Adjustment to Cities 52540 0
0 0 Bond Trustee Fees 52550 0
0 0 Equipment Rental 52605 0
45,017 45,000 Repair & Maintenance Services 52610 0
0 0 Computer Repair & Maintenance 52630 0
0 0 Other Chemicals 52890 0
231,359 194,300 0
231,359 194,300 00 TOTAL EXPENDITURE
0 MATERIALS & SERVICES SUBTOTAL
0
0
0
0
0
0
0
0
0
0
0
0
0
0
0
0
0
0
0
0
0
0
0
0
0
0
0
0
0
0
0
0
0
0
0
0
0
0
0
0
0
0
0
0
0
0
0
0
0
0
0 PERSONNEL EXPENSE SUBTOTAL
0
0
0
0
0
FY 2019 ACTUAL
0
0
0
Utility Operations & Services Department
Expenditure Summary 8508 - Building Maintenance - Field Operations FacilityUOPSEXPENDITURESUMMARY▼ Building Maintenance - Field Operations Facility | 8508

CLEAN WATER SERVICES • FY 2021-22 PROPOSED BUDGET PAGE 236
UTILITY OPERATIONS & SERVICES DEPARTMENTPOSITION AND SALARY EXPENSE BUILDING MAINTENANCE - MATERIALS HANDLING YARD 8509
TotalFY 2019 FY 2020 FY 2021 FY 2022 RepresentedACTUAL ACTUAL REVISED PROPOSED or
BUDGET BUDGET Non-Rep0.00 0.00 0.00 0.000.00 0.00 0.00 0.00
0.00 0.00 0.00 0.00 TOTAL PERSONNEL
OperatingFY 2019 FY 2020 FY 2021 FY 2022 RepresentedACTUAL ACTUAL REVISED PROPOSED or
BUDGET BUDGET Non-Rep0.00 0.00 0.00 0.000.00 0.00 0.00 0.00
0.00 0.00 0.00 0.00 TOTAL PERSONNEL
CapitalFY 2019 FY 2020 FY 2021 FY 2022 RepresentedACTUAL ACTUAL REVISED PROPOSED or
BUDGET BUDGET Non-Rep0.00 0.00 0.00 0.000.00 0.00 0.00 0.00
0.00 0.00 0.00 0.00 TOTAL PERSONNEL
CLASSIFICATION TITLE SALARY GRADE
CLASSIFICATION TITLE SALARY GRADE
No FTE in this program
CLASSIFICATION TITLE SALARY GRADE
UOPSPOSITIONANDSALARYEXPENSE▼ Building Maintenance - Materials Handling Yard | 8509

CLEAN WATER SERVICES • FY 2021-22 PROPOSED BUDGET PAGE 237
FY 2020 ACTUAL
FY 2021 REVISED BUDGET OBJECT CODE DESCRIPTION OBJECT
CODEFY 2022
PROPOSEDFY 2022
APPROVEDFY 2022
ADOPTED0 0 Wages & Other Pay 51100 0
0 0 Temporary 51130 0
0 0 Overtime 51140 0
0 0 Other Personnel Expenses 51600 0
0 0 Tuition Reimbursement 51761 0
0 0 Other Employee Allowances 51900 0
0 0 Mobile Computing Allowance 51915 0
0 0 0
4,397 5,500 Electricity 52110 0
5,542 6,000 Water 52120 0
0 0 Natural Gas 52130 0
121 600 Garbage 52140 0
14,872 14,000 Surface Water Management Charge 52150 0
579 700 Other Utility Services 52160 0
666 1,500 Sewer Charges 52170 0
1,667 8,000 Contracted Services 52205 0
0 0 Engineering Services 52210 0
14,542 11,500 Landscape Services 52215 0
0 0 Legal Services 52230 0
0 0 Professional Services 52240 0
0 0 Recording Fees 52250 0
0 0 Laundry 52260 0
0 0 Other Government Services 52270 0
0 0 Office Supplies 52305 0
0 0 Operating Supplies 52310 0
0 0 Gas, Oil, Lubrication 52315 0
120 1,500 Janitorial Supplies 52320 0
0 0 Tech & Scientific Supplies 52325 0
0 0 Repair & Maintenance Supplies 52330 0
1,214 5,500 Construction & Building Supplies 52335 0
0 0 Small Tools 52350 0
0 0 Safety Equipment 52360 0
0 0 Postage & Freight 52375 0
0 0 Software Expensed 52380 0
0 0 Computer Equipment Expensed 52385 0
0 0 Dues & Memberships 52405 0
0 0 Books, Subscriptions & Publications 52410 0
0 0 Software Licenses & Support 52425 0
0 0 Publication Notices 52430 0
0 0 Printing 52435 0
0 0 Telecom Internal 52440 0
0 0 Telephone Services 52445 0
0 0 Fueling Contract 52475 0
0 0 Training & Education 52480 0
0 0 Travel Expense 52485 0
0 0 Fleet Charges 52486 0
0 0 Private Mileage 52487 0
0 0 Other Materials & Services 52495 0
0 0 Permits, Licenses & Fees 52500 0
0 0 Public Information 52505 0
0 0 Taxes, Assessments & Liens 52510 0
0 0 Bank Service Charge 52515 0
0 0 Franchise Fees 52530 0
0 0 Payment Adjustment to Cities 52540 0
0 0 Bond Trustee Fees 52550 0
0 0 Equipment Rental 52605 0
5,353 6,000 Repair & Maintenance Services 52610 0
0 0 Computer Repair & Maintenance 52630 0
0 0 Other Chemicals 52890 0
49,074 60,800 0
49,074 60,800 00 TOTAL EXPENDITURE
0 MATERIALS & SERVICES SUBTOTAL
0
0
0
0
0
0
0
0
0
0
0
0
0
0
0
0
0
0
0
0
0
0
0
0
0
0
0
0
0
0
0
0
0
0
0
0
0
0
0
0
0
0
0
0
0
0
0
0
0
0
0 PERSONNEL EXPENSE SUBTOTAL
0
0
0
0
0
FY 2019 ACTUAL
0
0
0
Utility Operations & Services Department
Expenditure Summary 8509 Building Maintenance - Materials Handling YardUOPSEXPENDITURESUMMARY▼ Building Maintenance - Materials Handling Yard | 8509

CLEAN WATER SERVICES • FY 2021-22 PROPOSED BUDGET PAGE 238
UTILITY OPERATIONS & SERVICES DEPARTMENTPOSITION AND SALARY EXPENSE BUILDING MAINTENANCE - TUALATIN RIVER FARM 8510
TotalFY 2019 FY 2020 FY 2021 FY 2022 RepresentedACTUAL ACTUAL REVISED PROPOSED or
BUDGET BUDGET Non-Rep0.00 0.00 0.00 0.000.00 0.00 0.00 0.00
0.00 0.00 0.00 0.00 TOTAL PERSONNEL
OperatingFY 2019 FY 2020 FY 2021 FY 2022 RepresentedACTUAL ACTUAL REVISED PROPOSED or
BUDGET BUDGET Non-Rep0.00 0.00 0.00 0.000.00 0.00 0.00 0.00
0.00 0.00 0.00 0.00 TOTAL PERSONNEL
CapitalFY 2019 FY 2020 FY 2021 FY 2022 RepresentedACTUAL ACTUAL REVISED PROPOSED or
BUDGET BUDGET Non-Rep0.00 0.00 0.00 0.000.00 0.00 0.00 0.00
0.00 0.00 0.00 0.00 TOTAL PERSONNEL
CLASSIFICATION TITLE SALARY GRADE
CLASSIFICATION TITLE SALARY GRADE
No FTE in this program
CLASSIFICATION TITLE SALARY GRADE
UOPSPOSITIONANDSALARYEXPENSE▼ Building Maintenance - Tualatin River Farm | 8510

CLEAN WATER SERVICES • FY 2021-22 PROPOSED BUDGET PAGE 239
FY 2020 ACTUAL
FY 2021 REVISED BUDGET OBJECT CODE DESCRIPTION OBJECT
CODEFY 2022
PROPOSEDFY 2022
APPROVEDFY 2022
ADOPTED0 0 Wages & Other Pay 51100 0
0 0 Temporary 51130 0
0 0 Overtime 51140 0
0 0 Other Personnel Expenses 51600 0
0 0 Tuition Reimbursement 51761 0
0 0 Other Employee Allowances 51900 0
0 0 Mobile Computing Allowance 51915 0
0 0 0
702 1,000 Electricity 52110 0
0 0 Water 52120 0
0 0 Natural Gas 52130 0
7,097 2,000 Garbage 52140 0
0 0 Surface Water Management Charge 52150 0
0 0 Other Utility Services 52160 0
0 0 Sewer Charges 52170 0
1,779 6,000 Contracted Services 52205 0
108 0 Engineering Services 52210 0
0 0 Landscape Services 52215 0
0 0 Legal Services 52230 0
0 0 Professional Services 52240 0
0 0 Recording Fees 52250 0
0 0 Laundry 52260 0
0 0 Other Government Services 52270 0
0 0 Office Supplies 52305 0
18 0 Operating Supplies 52310 0
0 0 Gas, Oil, Lubrication 52315 0
0 0 Janitorial Supplies 52320 0
0 0 Tech & Scientific Supplies 52325 0
0 0 Repair & Maintenance Supplies 52330 0
0 2,000 Construction & Building Supplies 52335 0
0 0 Small Tools 52350 0
0 0 Safety Equipment 52360 0
0 0 Postage & Freight 52375 0
0 0 Software Expensed 52380 0
0 0 Computer Equipment Expensed 52385 0
0 0 Dues & Memberships 52405 0
0 0 Books, Subscriptions & Publications 52410 0
0 0 Software Licenses & Support 52425 0
0 0 Publication Notices 52430 0
0 0 Printing 52435 0
0 0 Telecom Internal 52440 0
0 0 Telephone Services 52445 0
0 0 Fueling Contract 52475 0
0 0 Training & Education 52480 0
0 0 Travel Expense 52485 0
0 0 Fleet Charges 52486 0
0 0 Private Mileage 52487 0
616 0 Other Materials & Services 52495 0
0 0 Permits, Licenses & Fees 52500 0
0 0 Public Information 52505 0
0 0 Taxes, Assessments & Liens 52510 0
0 0 Bank Service Charge 52515 0
0 0 Franchise Fees 52530 0
0 0 Payment Adjustment to Cities 52540 0
0 0 Bond Trustee Fees 52550 0
0 0 Equipment Rental 52605 0
4,227 5,000 Repair & Maintenance Services 52610 0
0 0 Computer Repair & Maintenance 52630 0
0 0 Other Chemicals 52890 0
14,547 16,000 0
14,547 16,000 00 TOTAL EXPENDITURE
0 MATERIALS & SERVICES SUBTOTAL
0
0
0
0
0
0
0
0
0
0
0
0
0
0
0
0
0
0
0
0
0
0
0
0
0
0
0
0
0
0
0
0
0
0
0
0
0
0
0
0
0
0
0
0
0
0
0
0
0
0
0 PERSONNEL EXPENSE SUBTOTAL
0
0
0
0
0
FY 2019 ACTUAL
0
0
0
Utility Operations & Services Department
Expenditure Summary 8510 - Building Maintenance - Tualatin River FarmUOPSEXPENDITURESUMMARY▼ Building Maintenance - Tualatin River Farm | 8510

CLEAN WATER SERVICES • FY 2021-22 PROPOSED BUDGET PAGE 240
UTILITY OPERATIONS & SERVICES DEPARTMENTPOSITION AND SALARY EXPENSE BUILDING MAINTENANCE - FERNHILL RESEARCH CENTER 8511
TotalFY 2019 FY 2020 FY 2021 FY 2022 RepresentedACTUAL ACTUAL REVISED PROPOSED or
BUDGET BUDGET Non-Rep0.00 0.00 0.00 0.000.00 0.00 0.00 0.00
0.00 0.00 0.00 0.00 TOTAL PERSONNEL
OperatingFY 2019 FY 2020 FY 2021 FY 2022 RepresentedACTUAL ACTUAL REVISED PROPOSED or
BUDGET BUDGET Non-Rep0.00 0.00 0.00 0.000.00 0.00 0.00 0.00
0.00 0.00 0.00 0.00 TOTAL PERSONNEL
CapitalFY 2019 FY 2020 FY 2021 FY 2022 RepresentedACTUAL ACTUAL REVISED PROPOSED or
BUDGET BUDGET Non-Rep0.00 0.00 0.00 0.000.00 0.00 0.00 0.00
0.00 0.00 0.00 0.00 TOTAL PERSONNEL
CLASSIFICATION TITLE SALARY GRADE
CLASSIFICATION TITLE SALARY GRADE
No FTE in this program
CLASSIFICATION TITLE SALARY GRADE
UOPSPOSITIONANDSALARYEXPENSE▼ Building Maintenance - Fernhill Research Center | 8511

CLEAN WATER SERVICES • FY 2021-22 PROPOSED BUDGET PAGE 241
FY 2020 ACTUAL
FY 2021 REVISED BUDGET OBJECT CODE DESCRIPTION OBJECT
CODEFY 2022
PROPOSEDFY 2022
APPROVEDFY 2022
ADOPTED0 0 Wages & Other Pay 51100 0
0 0 Temporary 51130 0
0 0 Overtime 51140 0
0 0 Other Personnel Expenses 51600 0
0 0 Tuition Reimbursement 51761 0
0 0 Other Employee Allowances 51900 0
0 0 Mobile Computing Allowance 51915 0
0 0 0
75,731 72,000 Electricity 52110 0
8,038 10,000 Water 52120 0
6,320 7,500 Natural Gas 52130 0
2,095 2,500 Garbage 52140 0
7,482 7,000 Surface Water Management Charge 52150 0
183 0 Other Utility Services 52160 0
10,896 12,000 Sewer Charges 52170 0
4,307 30,000 Contracted Services 52205 0
0 0 Engineering Services 52210 0
28,650 30,000 Landscape Services 52215 0
0 0 Legal Services 52230 0
0 0 Professional Services 52240 0
0 0 Recording Fees 52250 0
0 0 Laundry 52260 0
0 0 Other Government Services 52270 0
0 0 Office Supplies 52305 0
0 0 Operating Supplies 52310 0
0 0 Gas, Oil, Lubrication 52315 0
0 0 Janitorial Supplies 52320 0
0 0 Tech & Scientific Supplies 52325 0
0 0 Repair & Maintenance Supplies 52330 0
13 10,000 Construction & Building Supplies 52335 0
0 0 Small Tools 52350 0
0 0 Safety Equipment 52360 0
0 0 Postage & Freight 52375 0
0 0 Software Expensed 52380 0
0 0 Computer Equipment Expensed 52385 0
0 0 Dues & Memberships 52405 0
0 0 Books, Subscriptions & Publications 52410 0
0 0 Software Licenses & Support 52425 0
0 0 Publication Notices 52430 0
0 0 Printing 52435 0
0 0 Telecom Internal 52440 0
0 0 Telephone Services 52445 0
0 0 Fueling Contract 52475 0
0 0 Training & Education 52480 0
0 0 Travel Expense 52485 0
0 0 Fleet Charges 52486 0
0 0 Private Mileage 52487 0
0 0 Other Materials & Services 52495 0
120 0 Permits, Licenses & Fees 52500 0
0 0 Public Information 52505 0
31,702 35,000 Taxes, Assessments & Liens 52510 0
0 0 Bank Service Charge 52515 0
0 0 Franchise Fees 52530 0
0 0 Payment Adjustment to Cities 52540 0
0 0 Bond Trustee Fees 52550 0
0 0 Equipment Rental 52605 0
37,244 35,000 Repair & Maintenance Services 52610 0
0 0 Computer Repair & Maintenance 52630 0
0 0 Other Chemicals 52890 0
212,782 251,000 0
212,782 251,000 00 TOTAL EXPENDITURE
0 MATERIALS & SERVICES SUBTOTAL
0
0
0
0
0
0
0
0
0
0
0
0
0
0
0
0
0
0
0
0
0
0
0
0
0
0
0
0
0
0
0
0
0
0
0
0
0
0
0
0
0
0
0
0
0
0
0
0
0
0
0 PERSONNEL EXPENSE SUBTOTAL
0
0
0
0
0
FY 2019 ACTUAL
0
0
0
Utility Operations & Services Department
Expenditure Summary 8511 - Building Maintenance Fernhill Research CenterUOPSEXPENDITURESUMMARY▼ Building Maintenance - Fernhill Research Center | 8511
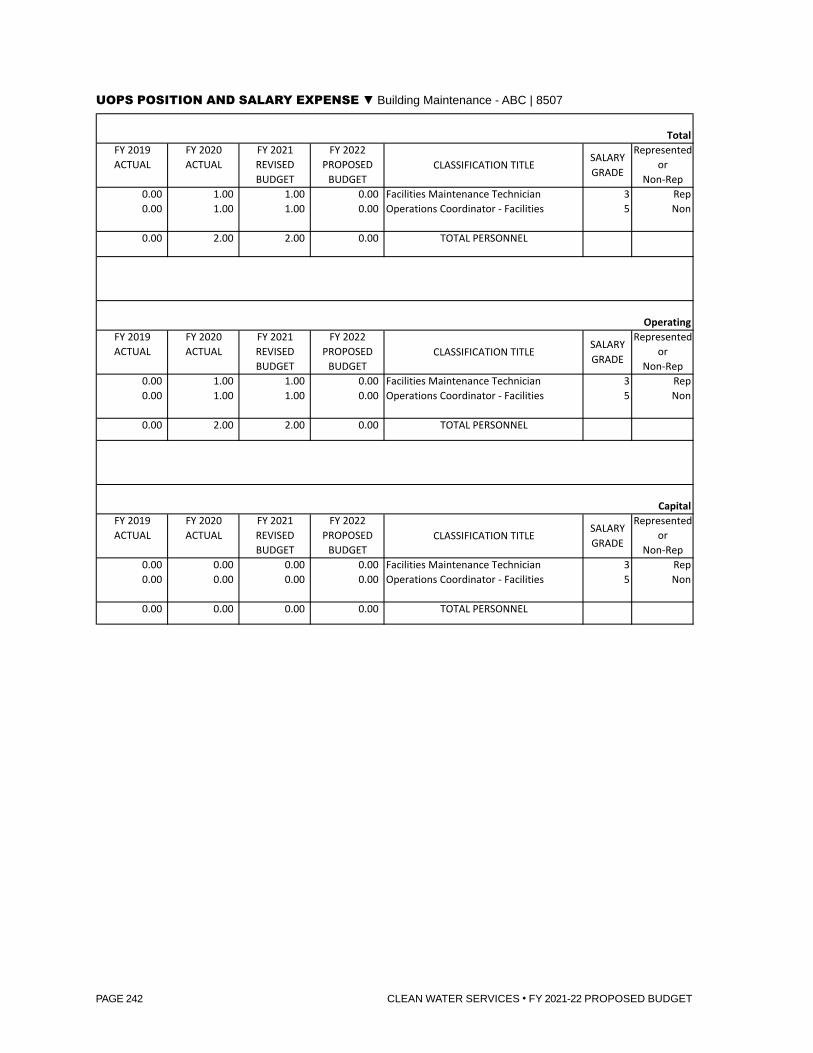
CLEAN WATER SERVICES • FY 2021-22 PROPOSED BUDGET PAGE 242
UTILITY OPERATIONS & SERVICES DEPARTMENTPOSITION AND SALARY EXPENSE BUILDING MAINTENANCE - ABC BUILDING 8507
TotalFY 2019 FY 2020 FY 2021 FY 2022 RepresentedACTUAL ACTUAL REVISED PROPOSED or
BUDGET BUDGET Non-Rep0.00 1.00 1.00 0.00 Facilities Maintenance Technician 3 Rep0.00 1.00 1.00 0.00 Operations Coordinator - Facilities 5 Non
0.00 2.00 2.00 0.00 TOTAL PERSONNEL
OperatingFY 2019 FY 2020 FY 2021 FY 2022 RepresentedACTUAL ACTUAL REVISED PROPOSED or
BUDGET BUDGET Non-Rep0.00 1.00 1.00 0.00 Facilities Maintenance Technician 3 Rep0.00 1.00 1.00 0.00 Operations Coordinator - Facilities 5 Non
0.00 2.00 2.00 0.00 TOTAL PERSONNEL
CapitalFY 2019 FY 2020 FY 2021 FY 2022 RepresentedACTUAL ACTUAL REVISED PROPOSED or
BUDGET BUDGET Non-Rep0.00 0.00 0.00 0.00 Facilities Maintenance Technician 3 Rep0.00 0.00 0.00 0.00 Operations Coordinator - Facilities 5 Non
0.00 0.00 0.00 0.00 TOTAL PERSONNEL
CLASSIFICATION TITLE SALARY GRADE
CLASSIFICATION TITLE SALARY GRADE
CLASSIFICATION TITLE SALARY GRADE
UOPSPOSITIONANDSALARYEXPENSE▼ Building Maintenance - ABC | 8507

CLEAN WATER SERVICES • FY 2021-22 PROPOSED BUDGET PAGE 243
FY 2020 ACTUAL
FY 2021 REVISED BUDGET OBJECT CODE DESCRIPTION OBJECT
CODEFY 2022
PROPOSEDFY 2022
APPROVEDFY 2022
ADOPTED2,937 146,500 Wages & Other Pay 51100 0
0 0 Temporary 51130 0
78 0 Overtime 51140 0
247 70,400 Other Personnel Expenses 51600 0
0 0 Tuition Reimbursement 51761 0
0 500 Other Employee Allowances 51900 0
0 0 Mobile Computing Allowance 51915 0
3,262 217,400 0
138,409 125,000 Electricity 52110 0
13,871 15,500 Water 52120 0
37,668 45,000 Natural Gas 52130 0
5,035 5,500 Garbage 52140 0
6,195 7,000 Surface Water Management Charge 52150 0
1,992 2,200 Other Utility Services 52160 0
14,833 15,000 Sewer Charges 52170 0
437,413 150,000 Contracted Services 52205 0
0 0 Engineering Services 52210 0
55,216 50,000 Landscape Services 52215 0
0 0 Legal Services 52230 0
0 0 Professional Services 52240 0
0 0 Recording Fees 52250 0
0 0 Laundry 52260 0
0 0 Other Government Services 52270 0
1,770 0 Office Supplies 52305 0
0 0 Operating Supplies 52310 0
0 0 Gas, Oil, Lubrication 52315 0
9,821 10,000 Janitorial Supplies 52320 0
0 0 Tech & Scientific Supplies 52325 0
0 0 Repair & Maintenance Supplies 52330 0
50,716 60,000 Construction & Building Supplies 52335 0
2,554 0 Small Tools 52350 0
0 0 Safety Equipment 52360 0
0 0 Postage & Freight 52375 0
0 0 Software Expensed 52380 0
0 0 Computer Equipment Expensed 52385 0
0 0 Dues & Memberships 52405 0
0 0 Books, Subscriptions & Publications 52410 0
1,616 0 Software Licenses & Support 52425 0
0 1,000 Publication Notices 52430 0
1,295 0 Printing 52435 0
0 0 Telecom Internal 52440 0
0 0 Telephone Services 52445 0
1,153 1,500 Fueling Contract 52475 0
0 0 Training & Education 52480 0
0 0 Travel Expense 52485 0
4,489 7,000 Fleet Charges 52486 0
116 0 Private Mileage 52487 0
433 0 Other Materials & Services 52495 0
20 1,000 Permits, Licenses & Fees 52500 0
0 0 Public Information 52505 0
0 0 Taxes, Assessments & Liens 52510 0
0 0 Bank Service Charge 52515 0
0 0 Franchise Fees 52530 0
0 0 Payment Adjustment to Cities 52540 0
0 0 Bond Trustee Fees 52550 0
549 1,000 Equipment Rental 52605 0
143,029 150,000 Repair & Maintenance Services 52610 0
0 0 Computer Repair & Maintenance 52630 0
0 0 Other Chemicals 52890 0
928,192 646,700 0
931,454 864,100 00 TOTAL EXPENDITURE
0 MATERIALS & SERVICES SUBTOTAL
0
0
0
0
0
0
0
0
0
0
0
0
0
0
0
0
0
0
0
0
0
0
0
0
0
0
0
0
0
0
0
0
0
0
0
0
0
0
0
0
0
0
0
0
0
0
0
0
0
0
0 PERSONNEL EXPENSE SUBTOTAL
0
0
0
0
0
FY 2019 ACTUAL
0
0
0
Utility Operations & Services Department
Expenditure Summary 8507 - Building Maintenance - ABC BuildingUOPSEXPENDITURESUMMARY▼ Building Maintenance - ABC | 8507


CLEAN WATER SERVICES • FY 2021-22 PROPOSED BUDGET PAGE 245
Water Resource Recovery Operations & Services
The Water Resource Recovery Operations & Services Department (WRRD) provides operation, maintenance and engineering for the District’s four water resource recovery facilities and 43 pump stations. Close to 62 million gallons of wastewater per day, on average, are pumped and treated to some of the highest standards in the nation. The water is then returned to the environment in the Tualatin River or reused for irrigation on golf courses, parks and sports fields. Solids removed from the wastewater are processed and used as soil amendments on farm land and nutrients are

CLEAN WATER SERVICES • FY 2021-22 PROPOSED BUDGET PAGE 246
recovered and sold as a premium fertilizer. Digester gas produced in processing the solids is the fuel for cogeneration systems that offset approximately 47% of the electrical energy and 70% of the natural gas energy used by the facilities.
The department is organized into five operating programs that deliver on the core functions of conveying and treating wastewater: Durham; Rock Creek; Hillsboro/Forest Grove; Pump Stations; and Biosolids, Reuse and Fernhill. Two programs support the operating groups: Treatment Plant Services and Administration.
WRRD is committed to preventing and slowing the spread of the coronavirus and implemented a variety of strategies to protect employees and their families and to ensure the District continues to provide essential lifeline services to our customers. Onsite staff are on staggered work shifts to reduce employee overlap. Other staff work remotely as much as is appropriate, taking advantage of virtual resources to conduct business.
The FY 2021-22 budget includes the addition of five new FTE. Three new FTE are conversions of temporary Plant Maintenance Technician and Landscape Specialist positions where the workload has proven to be sustained and long-term. The other two positions are for trainee FTEs in the Mechanical Maintenance and Electrical & Instrumentation programs at the Durham facility.
The FY 2021-22 budget transfers 22 FTE from WRRD into the new Enterprise Asset & Technical Services Department, one Operations Analyst FTE into the Risk & Insurance Management program in Business Services Department, four FTE into the new Business Operations & Opportunities program in BSD. In FY 2021-22, the Chief Operating Officer position will transfer from WRRD to the Office of the CEO.
Durham Durham is a tertiary wastewater treatment plant that treats an average annual flow of 21.4 mgd (million gallons per day). This program is responsible for day-to-day operation of the Durham Water Resource Recovery Facility, including process control, and mechanical, electrical, and instrumentation maintenance.
Rock Creek Rock Creek is a tertiary wastewater treatment plant that treats an average annual flow of 36.2 mgd. This program is responsible for day-to-day operation of the Rock Creek Water Resource Recovery Facility, including process control, and mechanical, electrical, and instrumentation maintenance.

CLEAN WATER SERVICES • FY 2021-22 PROPOSED BUDGET PAGE 247
Hillsboro and Forest Grove Hillsboro and Forest Grove are secondary treatment plants that treat an average of 4.4 mgd and 3.9 mgd, respectively. This program is responsible for day-to-day operation of the Hillsboro and Forest Grove water resource recovery facilities, including process control, and mechanical, electrical, and instrumentation maintenance
Pump StationsThe majority of flow to the water resource recovery facilities is conveyed by gravity pipelines. However, due to topography or distance, pump stations are required to either lift the flow to gravity lines that can transport the flow to the water resource recovery facilities or to directly feed them via force mains. This program is responsible for the day-to-day operation of the pump stations, including mechanical, electrical and instrumentation maintenance.
Biosolids, Reuse and FernhillThis program provides resource recovery of outputs from the treatment plants. Solids removed from the treatment plants are stabilized and converted to Class B biosolids, which are land applied as a beneficial agricultural soil amendment. During the summer, approximately 57 million gallons of effluent are utilized for

CLEAN WATER SERVICES • FY 2021-22 PROPOSED BUDGET PAGE 248
urban, irrigation. The Fernhill Natural Treatment System cools the effluent from the Forest Grove Water Resource Recovery Facility before discharge to the Tualatin River, while enhancing valuable wetland habitat in the process.
Treatment Plant ServicesThis program provides engineering for project delivery and for technology development and research. Project delivery includes facility planning, project design and construction management. Technology development and research includes evaluating and piloting new, innovative treatment processes, sensor technologies, and process control strategies to determine what should be implemented full scale.
AdministrationThis program includes senior management of the department and traditional administrative support for the operating programs and support services. Senior management provide policy and strategic planning for growth and regulatory compliance, as well as technical and fiscal management of the department’s operating programs.

CLEAN WATER SERVICES • FY 2021-22 PROPOSED BUDGET PAGE 249
OBJECT CODE FY 2019 ACTUAL FY 2020 ACTUAL FY 2021 REVISED BUDGET
FY 2022 PROPOSED BUDGET
Change from FY21 Budget
51100 8,924,541 9,243,005 12,858,800 9,891,600
51130 713,593 654,195 444,900 289,000
51140 283,267 277,070 225,000 224,000
51600 2,794,902 3,115,051 5,079,900 3,853,600
51761 864 939 0 0
51900 14,783 22,725 22,100 21,100
51910 7,440 7,440 7,400 3,700
51915 41,845 45,845 45,400 36,300
12,781,235 13,366,270 18,683,500 14,319,300 -23.4%
52110 2,929,702 2,562,027 2,994,500 3,000,500
52120 213,938 201,324 229,600 212,900
52130 229,580 180,031 133,000 187,000
52140 255,676 268,381 266,000 275,000
52150 23,820 24,535 20,400 20,400
52160 2,536 2,606 4,000 4,000
52170 13,431 19,518 0 0
52205 2,027,403 1,826,869 2,166,500 1,934,500
52210 28,819 25,346 0 0
52215 555,970 564,286 567,000 594,000
52230 0 261 0 0
52240 65,439 133,957 140,000 115,000
52250 111 0 0 0
52260 53,823 44,551 45,000 0
52305 15,639 12,978 16,800 16,800
52310 417,613 427,324 448,100 186,100
52315 70,106 75,246 95,000 109,000
52320 12,036 12,668 15,000 0
52325 135 3,843 5,000 5,000
52330 1,485,086 1,352,442 1,395,000 1,360,000
52335 10,488 20,257 0 0
52350 68,021 49,922 65,000 67,500
52360 14,008 35,765 15,000 20,000
52375 5,965 3,656 5,100 4,800
52380 0 20 0 500
52385 39,404 9,386 6,200 5,000
52395 23,971 39,731 0 0
52405 19,502 14,224 22,600 15,800
52410 5,131 4,642 9,900 8,800
52425 67,887 69,450 60,400 2,700
52430 861 200 500 500
52435 556 1,985 1,500 1,500
52445 0 0 200 200
52475 371,318 288,049 324,300 323,700
52480 43,137 50,424 56,400 42,600
52485 67,538 40,352 38,500 32,500
52486 59,241 50,647 48,300 41,600
52487 27,642 24,290 43,300 33,400
52495 48,205 44,247 43,200 37,000
52500 17,270 8,104 34,400 31,800
52510 2,714 2,913 3,100 3,100
52515 2,439 2,374 0 0
52605 26,964 24,140 51,600 54,600
52610 4,750 6,769 0 0
52805 81,113 0 0 0
52810 1,071,987 1,024,035 1,083,000 961,000
52815 (1,990) (130) 0 0
52820 410,749 261,976 280,000 308,000
52825 698,487 518,284 650,000 445,000
52835 241,336 272,009 375,000 368,000
52840 552,825 599,910 513,000 583,000
52845 1,050,580 667,566 730,000 570,000
52850 280,603 277,081 281,000 300,000
52860 0 74,408 65,000 80,000
52865 0 0 0 275,000
52890 100,732 55,957 115,500 170,500
13,814,298 12,280,834 13,462,900 12,808,300 -4.9%
26,595,532 25,647,104 32,146,400 27,127,600 -15.6%
Wages & Other Pay
Temporary
CWS Department Expenditure SummaryBudget Year: 2022
OBJECT CODE DESCRIPTION
Tuition Reimbursement
Other Employee Allowances
Auto Allowance
Overtime
Other Personnel Expenses
Water
Natural Gas
Mobile Computing Allowance
PERSONNEL EXPENSE SUBTOTAL
Electricity
Sewer Charges
Contracted Services
Engineering Services
Garbage
Surface Water Management Charge
Other Utility Services
Professional Services
Recording Fees
Laundry
Landscape Services
Legal Services
Gas, Oil, Lubrication
Janitorial Supplies
Tech & Scientific Supplies
Office Supplies
Operating Supplies
Small Tools
Safety Equipment
Postage & Freight
Repair & Maintenance Supplies
Construction & Building Supplies
Dues & Memberships
Books, Subscriptions & Publications
Software Expensed
Computer Equipment Expensed
Inventory Adjustments
Telephone Services
Software Licenses & Support
Publication Notices
Printing
Travel Expense
Fleet Charges
Private Mileage
Fueling Contract
Training & Education
Taxes, Assessments & Liens
Bank Service Charge
Other Materials & Services
Permits, Licenses & Fees
Repair & Maintenance Services
Equipment Rental
Ferric Chloride
Alum
Polymers - Thickening
Polymers - Dewatering
TOTAL EXPENDITURE
Water Resource Recovery Operations & Services Department
Other Chemicals
MATERIALS & SERVICES SUBTOTAL
Sodium Bisulfite
Sulfuric Acid
Magnesium Chloride
Sodium Hydroxide
Sodium Hypochlorite
Lime
Polymers - Tertiary
WATER RESOURCE RECOVERY OPERATIONS & SERVICES ▼ Dept Summary

CLEAN WATER SERVICES • FY 2021-22 PROPOSED BUDGET PAGE 250
WATER RESOURCE RECOVERY OPERATIONS & SERVICES DEPARTMENTPOSITION AND SALARY EXPENSE ADMINISTRATION 8301
TotalFY 2019 FY 2020 FY 2021 FY 2022 RepresentedACTUAL ACTUAL REVISED PROPOSED or
BUDGET BUDGET Non-Rep2.00 1.00 1.00 0.00 Administrative Assistant 4 Non2.00 2.00 3.00 2.00 Administrative Associate 3 Non1.00 1.00 1.00 0.00 Business Opportunities Manager 11 Non0.00 0.00 1.00 0.00 Chief Operating Officer 16 Non1.00 0.00 0.00 0.00 Engineering Project Coordinator 7 Non0.00 0.00 1.00 0.00 Enterprise Asset Services Manager 11 Non1.00 0.00 0.00 0.00 Loss Prevention Technician 6 Non2.00 0.00 0.00 0.00 Operations Division Manager 11 Non0.00 0.00 0.00 0.00 Plant Superintendent 1 8 Non0.00 1.00 1.00 1.00 Plant Superintendent 2 10 Non0.00 2.00 3.00 3.00 Plant Superintendent 3 11 Non0.00 1.00 1.00 0.00 Program Support Specialist 5 Non0.00 2.00 1.00 1.00 Treatment Plant Services Manager 12 Non1.00 0.00 0.00 0.00 Wastewater Treatment Dept Dir LT 13 Non0.00 0.00 1.00 1.00 Water Resource Recovery Services Manager 12 Non0.00 1.00 1.00 1.00 Reuse Manager 9 Non1.00 0.00 0.00 0.00 Electrical, Instrumentation & Controls Division Manager 11 Non1.00 0.00 0.00 0.00 Mechanical Maintenance & Facilities Division Manager 11 Non0.00 1.00 0.00 0.00 Managing Director - Water Resource Recovery
Operations & Services14 Non
12.00 12.00 15.00 9.00 TOTAL PERSONNEL
OperatingFY 2019 FY 2020 FY 2021 FY 2022 RepresentedACTUAL ACTUAL REVISED PROPOSED or
BUDGET BUDGET Non-Rep0.00 0.00 0.00 0.00 Administrative Assistant 4 Non1.00 1.00 1.50 1.00 Administrative Associate 3 Non0.50 0.50 0.50 0.00 Business Opportunities Manager 11 Non0.00 0.00 1.00 0.00 Chief Operating Officer 16 Non0.50 0.00 0.00 0.00 Engineering Project Coordinator 7 Non0.00 0.00 0.50 0.00 Enterprise Asset Services Manager 11 Non0.50 0.00 0.00 0.00 Loss Prevention Technician 6 Non1.00 0.00 0.00 0.00 Operations Division Manager 11 Non0.00 0.00 0.00 0.00 Plant Superintendent 1 8 Non0.00 1.00 1.00 1.00 Plant Superintendent 2 10 Non0.00 2.00 3.00 3.00 Plant Superintendent 3 11 Non0.00 0.00 0.00 0.00 Program Support Specialist 5 Non0.00 1.00 0.00 0.00 Treatment Plant Services Manager 12 Non1.00 0.00 0.00 0.00 Wastewater Treatment Dept Dir LT 13 Non0.00 0.00 1.00 1.00 Water Resource Recovery Services Manager 12 Non0.00 1.00 1.00 1.00 Reuse Manager 9 Non1.00 0.00 0.00 0.00 Electrical, Instrumentation & Controls Division Manager 11 Non1.00 0.00 0.00 0.00 Mechanical Maintenance & Facilities Division Manager 11 Non0.00 1.00 0.00 0.00 Managing Director - Water Resource Recovery
Operations & Services14 Non
6.50 7.50 9.50 7.00 TOTAL PERSONNEL
CapitalFY 2019 FY 2020 FY 2021 FY 2022 RepresentedACTUAL ACTUAL REVISED PROPOSED or
BUDGET BUDGET Non-Rep2.00 1.00 1.00 0.00 Administrative Assistant 4 Non1.00 1.00 1.50 1.00 Administrative Associate 3 Non0.50 0.50 0.50 0.00 Business Opportunities Manager 11 Non0.00 0.00 0.00 0.00 Chief Operating Officer 16 Non0.50 0.00 0.00 0.00 Engineering Project Coordinator 7 Non0.00 0.00 0.50 0.00 Enterprise Asset Services Manager 11 Non0.50 0.00 0.00 0.00 Loss Prevention Technician 6 Non0.00 0.00 0.00 0.00 Operations Division Manager 11 Non0.00 0.00 0.00 0.00 Plant Superintendent 1 8 Non0.00 0.00 0.00 0.00 Plant Superintendent 2 10 Non0.00 0.00 0.00 0.00 Plant Superintendent 3 11 Non0.00 1.00 1.00 0.00 Program Support Specialist 5 Non1.00 1.00 1.00 1.00 Treatment Plant Services Manager 12 Non0.00 0.00 0.00 0.00 Reuse Manager 9 Non0.00 0.00 0.00 0.00 Wastewater Treatment Dept Dir LT 13 Non0.00 0.00 0.00 0.00 Water Resource Recovery Services Manager 12 Non0.00 0.00 0.00 0.00 Reuse Program Manager 8 Non0.00 0.00 0.00 0.00 Electrical, Instrumentation & Controls Division Manager 11 Non0.00 0.00 0.00 0.00 Mechanical Maintenance & Facilities Division Manager 11 Non0.00 0.00 0.00 0.00 Managing Director - Water Resource Recovery
Operations & Services14 Non
5.50 4.50 5.50 2.00 TOTAL PERSONNEL
CLASSIFICATION TITLE SALARY GRADE
CLASSIFICATION TITLE SALARY GRADE
CLASSIFICATION TITLE SALARY GRADE
WRRDPOSITIONANDSALARYEXPENSE▼ Administration | 8301

CLEAN WATER SERVICES • FY 2021-22 PROPOSED BUDGET PAGE 251
FY 2020 ACTUAL
FY 2021 REVISED BUDGET OBJECT CODE DESCRIPTION OBJECT
CODEFY 2022
PROPOSEDFY 2022
APPROVEDFY 2022
ADOPTED1,165,647 1,602,300 Wages & Other Pay 51100 1,001,300
33,871 50,000 Temporary 51130 55,000
108 2,000 Overtime 51140 2,000
306,193 657,800 Other Personnel Expenses 51600 325,900
0 0 Tuition Reimbursement 51761 0
450 800 Other Employee Allowances 51900 600
7,440 7,400 Auto Allowance 51910 3,700
5,215 5,600 Mobile Computing Allowance 51915 4,000
1,518,924 2,325,900 1,392,500
0 0 Electricity 52110 0
0 0 Water 52120 0
0 0 Natural Gas 52130 0
0 0 Garbage 52140 0
0 0 Surface Water Management Charge 52150 0
0 0 Other Utility Services 52160 0
0 0 Sewer Charges 52170 0
7,209 22,500 Contracted Services 52205 15,000
0 0 Engineering Services 52210 0
0 0 Landscape Services 52215 0
0 0 Legal Services 52230 0
22,949 15,000 Professional Services 52240 15,000
0 0 Recording Fees 52250 0
0 0 Laundry 52260 0
9,144 10,000 Office Supplies 52305 10,000
5,491 10,000 Operating Supplies 52310 7,000
50 0 Gas, Oil, Lubrication 52315 0
0 0 Janitorial Supplies 52320 0
0 0 Tech & Scientific Supplies 52325 0
273 0 Repair & Maintenance Supplies 52330 0
0 0 Construction & Building Supplies 52335 0
2,788 500 Small Tools 52350 500
33,190 15,000 Safety Equipment 52360 20,000
85 300 Postage & Freight 52375 300
0 0 Software Expensed 52380 500
1,964 2,000 Computer Equipment Expensed 52385 2,000
0 0 Inventory Adjustments 52395 0
2,835 7,500 Dues & Memberships 52405 3,200
2,193 2,000 Books, Subscriptions & Publications 52410 2,000
548 500 Software Licenses & Support 52425 500
200 0 Publication Notices 52430 0
476 1,000 Printing 52435 1,000
0 0 Telephone Services 52445 0
1,551 1,100 Fueling Contract 52475 800
8,881 6,000 Training & Education 52480 3,000
11,833 10,000 Travel Expense 52485 6,000
653 0 Fleet Charges 52486 0
1,622 3,000 Private Mileage 52487 3,000
34,509 33,000 Other Materials & Services 52495 27,000
1,217 1,000 Permits, Licenses & Fees 52500 1,000
2,839 3,000 Taxes, Assessments & Liens 52510 3,000
0 0 Bank Service Charge 52515 0
11 0 Equipment Rental 52605 0
1,465 0 Repair & Maintenance Services 52610 0
0 0 Polymers - Thickening 52805 0
0 0 Polymers - Dewatering 52810 0
0 0 Polymers - Tertiary 52815 0
0 0 Ferric Chloride 52820 0
0 0 Alum 52825 0
0 0 Sodium Hydroxide 52835 0
0 0 Sodium Hypochlorite 52840 0
0 0 Lime 52845 0
0 0 Sodium Bisulfite 52850 0
0 0 Sulfuric Acid 52860 0
0 0 Magnesium Chloride 52865 0
0 0 Other Chemicals 52890 0
153,974 143,400 120,800
1,672,898 2,469,300 1,513,3001,501,769 TOTAL EXPENDITURE
115,733 MATERIALS & SERVICES SUBTOTAL
0
0
0
0
0
0
0
0
0
0
0
0
0
0
950
2,714
0
9,999
14,993
0
3,492
24,690
0
0
2,676
1,116
0
223
81
0
1,633
0
2,724
4,082
284
915
13,883
8,407
9,830
0
0
0
0
7,868
0
0
0
5,174
0
0
0
0
0
0
5,390
1,386,036 PERSONNEL EXPENSE SUBTOTAL
0
0
277,267
0
600
7,440
FY 2019 ACTUAL
1,094,797
0
542
Water Resource Recovery Operations & Services
Expenditure Summary 8301 - Water Resource Recovery Admin
Mar 31, 2021 12:47 PM Page 1
WRRD EXPENDITURE SUMMARY ▼ Administration | 8301

CLEAN WATER SERVICES • FY 2021-22 PROPOSED BUDGET PAGE 252
WATER RESOURCE RECOVERY OPERATIONS & SERVICES DEPARTMENTPOSITION AND SALARY EXPENSE DURHAM OPERATIONS 8311
TotalFY 2019 FY 2020 FY 2021 FY 2022 RepresentedACTUAL ACTUAL REVISED PROPOSED or
BUDGET BUDGET Non-Rep0.50 0.00 0.00 0.00 Operations Analyst 1 5 Non1.00 0.00 1.00 1.00 Operations Analyst 2 8 Non0.00 1.00 1.00 1.00 Operations Supervisor 8 Non1.00 0.00 0.00 0.00 Plant Manager 8 Non0.00 1.00 1.00 1.00 Sr Operations Analyst 9 Non1.00 1.00 1.00 1.00 Senior Operator 6 Rep
13.00 13.00 13.00 13.00 Wastewater Plant Operator 2 5 Rep
16.50 16.00 17.00 17.00 TOTAL PERSONNEL
OperatingFY 2019 FY 2020 FY 2021 FY 2022 RepresentedACTUAL ACTUAL REVISED PROPOSED or
BUDGET BUDGET Non-Rep0.50 0.00 0.00 0.00 Operations Analyst 1 5 Non1.00 0.00 1.00 1.00 Operations Analyst 2 8 Non0.00 1.00 1.00 1.00 Operations Supervisor 8 Non1.00 0.00 0.00 0.00 Plant Manager 8 Non0.00 1.00 1.00 1.00 Sr Operations Analyst 9 Non1.00 1.00 1.00 1.00 Senior Operator 6 Rep
13.00 13.00 13.00 13.00 Wastewater Plant Operator 2 5 Rep
16.50 16.00 17.00 17.00 TOTAL PERSONNEL
CapitalFY 2019 FY 2020 FY 2021 FY 2022 RepresentedACTUAL ACTUAL REVISED PROPOSED or
BUDGET BUDGET Non-Rep0.00 0.00 0.00 0.00 Operations Analyst 1 5 Non0.00 0.00 0.00 0.00 Operations Analyst 2 8 Non0.00 0.00 0.00 0.00 Operations Supervisor 8 Non0.00 0.00 0.00 0.00 Plant Manager 8 Non0.00 0.00 0.00 0.00 Sr Operations Analyst 9 Non0.00 0.00 0.00 0.00 Senior Operator 6 Rep0.00 0.00 0.00 0.00 Wastewater Plant Operator 2 5 Rep
0.00 0.00 0.00 0.00 TOTAL PERSONNEL
CLASSIFICATION TITLE SALARY GRADE
CLASSIFICATION TITLE SALARY GRADE
CLASSIFICATION TITLE SALARY GRADE
WRRDPOSITIONANDSALARYEXPENSE▼ Durham | 8311

CLEAN WATER SERVICES • FY 2021-22 PROPOSED BUDGET PAGE 253
FY 2020 ACTUAL
FY 2021 REVISED BUDGET OBJECT CODE DESCRIPTION OBJECT
CODEFY 2022
PROPOSEDFY 2022
APPROVEDFY 2022
ADOPTED1,341,820 1,448,100 Wages & Other Pay 51100 1,505,200
40,303 51,000 Temporary 51130 50,000
68,600 60,000 Overtime 51140 50,000
580,703 602,400 Other Personnel Expenses 51600 642,600
0 0 Tuition Reimbursement 51761 0
3,600 3,000 Other Employee Allowances 51900 3,200
0 0 Auto Allowance 51910 0
2,520 2,400 Mobile Computing Allowance 51915 2,400
2,037,546 2,166,900 2,253,400
686,729 742,000 Electricity 52110 754,500
55,639 79,200 Water 52120 55,000
57,776 51,000 Natural Gas 52130 46,000
108,023 120,000 Garbage 52140 132,000
15,279 14,000 Surface Water Management Charge 52150 14,000
1,295 3,000 Other Utility Services 52160 3,000
15,730 0 Sewer Charges 52170 0
48,061 70,000 Contracted Services 52205 70,000
0 0 Engineering Services 52210 0
0 0 Landscape Services 52215 0
0 0 Legal Services 52230 0
0 5,000 Professional Services 52240 5,000
0 0 Recording Fees 52250 0
2,157 0 Laundry 52260 0
2,415 0 Office Supplies 52305 0
51,332 65,000 Operating Supplies 52310 60,000
166 0 Gas, Oil, Lubrication 52315 0
0 0 Janitorial Supplies 52320 0
945 0 Tech & Scientific Supplies 52325 0
11,491 5,000 Repair & Maintenance Supplies 52330 5,000
0 0 Construction & Building Supplies 52335 0
1,767 2,500 Small Tools 52350 2,500
356 0 Safety Equipment 52360 0
157 0 Postage & Freight 52375 0
0 0 Software Expensed 52380 0
0 0 Computer Equipment Expensed 52385 0
33,394 0 Inventory Adjustments 52395 0
1,110 1,600 Dues & Memberships 52405 1,600
108 1,500 Books, Subscriptions & Publications 52410 1,500
0 0 Software Licenses & Support 52425 0
0 0 Publication Notices 52430 0
533 0 Printing 52435 0
0 0 Telephone Services 52445 0
0 100 Fueling Contract 52475 100
3,164 3,600 Training & Education 52480 3,600
5,790 3,000 Travel Expense 52485 3,000
0 200 Fleet Charges 52486 200
856 2,000 Private Mileage 52487 2,000
3,061 500 Other Materials & Services 52495 500
439 5,000 Permits, Licenses & Fees 52500 5,000
0 0 Taxes, Assessments & Liens 52510 0
280 0 Bank Service Charge 52515 0
1,500 1,800 Equipment Rental 52605 1,800
0 0 Repair & Maintenance Services 52610 0
0 0 Polymers - Thickening 52805 0
468,070 530,000 Polymers - Dewatering 52810 441,000
(130) 0 Polymers - Tertiary 52815 0
85,137 88,000 Ferric Chloride 52820 108,000
156,192 245,000 Alum 52825 195,000
123,170 115,000 Sodium Hydroxide 52835 123,000
269,930 270,000 Sodium Hypochlorite 52840 310,000
235,321 230,000 Lime 52845 270,000
92,158 88,000 Sodium Bisulfite 52850 90,000
33,107 34,000 Sulfuric Acid 52860 35,000
0 0 Magnesium Chloride 52865 125,000
16,917 20,000 Other Chemicals 52890 31,000
2,589,423 2,796,000 2,894,300
4,626,969 4,962,900 5,147,7004,951,304 TOTAL EXPENDITURE
2,953,813 MATERIALS & SERVICES SUBTOTAL
246,793
89,857
0
0
18,634
(123)
219,842
216,569
105,977
294,246
0
553,253
0
190
1,706
0
0
3,892
5,235
367
1,586
5,033
0
0
155
0
33
0
0
0
19,579
27,577
1,451
257
14
17,646
0
2,374
55,633
100
0
0
0
75
0
0
13,431
76,008
0
0
45,926
107,636
14,601
1,185
2,415
1,997,490 PERSONNEL EXPENSE SUBTOTAL
737,166
69,909
555,894
0
2,697
0
FY 2019 ACTUAL
1,317,770
51,040
67,675
Water Resource Recovery Operations & Services
Expenditure Summary 8311 - Durham Operations
Mar 31, 2021 12:47 PM Page 2
WRRDEXPENDITURESUMMARY▼ Durham | 8311

CLEAN WATER SERVICES • FY 2021-22 PROPOSED BUDGET PAGE 254
WATER RESOURCE RECOVERY OPERATIONS & SERVICES DEPARTMENTPOSITION AND SALARY EXPENSE ROCK CREEK OPERATIONS 8312
TotalFY 2019 FY 2020 FY 2021 FY 2022 RepresentedACTUAL ACTUAL REVISED PROPOSED or
BUDGET BUDGET Non-Rep0.50 0.00 0.00 0.00 Operations Analyst 1 5 Non0.00 1.00 1.00 1.00 Operations Analyst 2 8 Non0.00 1.00 1.00 1.00 Operations Supervisor 8 Non1.00 0.00 0.00 0.00 Plant Manager 8 Non1.00 0.00 0.00 0.00 Sr Operations Analyst 9 Non1.00 1.00 1.00 1.00 Senior Operator 6 Rep
13.00 13.00 13.00 13.00 Wastewater Plant Operator 2 5 Rep
16.50 16.00 16.00 16.00 TOTAL PERSONNEL
OperatingFY 2019 FY 2020 FY 2021 FY 2022 RepresentedACTUAL ACTUAL REVISED PROPOSED or
BUDGET BUDGET Non-Rep0.50 0.00 0.00 0.00 Operations Analyst 1 5 Non0.00 1.00 1.00 1.00 Operations Analyst 2 8 Non0.00 1.00 1.00 1.00 Operations Supervisor 8 Non1.00 0.00 0.00 0.00 Plant Manager 8 Non1.00 0.00 0.00 0.00 Sr Operations Analyst 9 Non1.00 1.00 1.00 1.00 Senior Operator 6 Rep
13.00 13.00 13.00 13.00 Wastewater Plant Operator 2 5 Rep
16.50 16.00 16.00 16.00 TOTAL PERSONNEL
CapitalFY 2019 FY 2020 FY 2021 FY 2022 RepresentedACTUAL ACTUAL REVISED PROPOSED or
BUDGET BUDGET Non-Rep0.00 0.00 0.00 0.00 Operations Analyst 1 5 Non0.00 0.00 0.00 0.00 Operations Analyst 2 8 Non0.00 0.00 0.00 0.00 Operations Supervisor 8 Non0.00 0.00 0.00 0.00 Plant Manager 8 Non0.00 0.00 0.00 0.00 Sr Operations Analyst 9 Non0.00 0.00 0.00 0.00 Senior Operator 6 Rep0.00 0.00 0.00 0.00 Wastewater Plant Operator 2 5 Rep
0.00 0.00 0.00 0.00 TOTAL PERSONNEL
CLASSIFICATION TITLE SALARY GRADE
CLASSIFICATION TITLE SALARY GRADE
CLASSIFICATION TITLE SALARY GRADE
WRRDPOSITIONANDSALARYEXPENSE▼ Rock Creek Operations | 8312

CLEAN WATER SERVICES • FY 2021-22 PROPOSED BUDGET PAGE 255
FY 2020 ACTUAL
FY 2021 REVISED BUDGET OBJECT CODE DESCRIPTION OBJECT
CODEFY 2022
PROPOSEDFY 2022
APPROVEDFY 2022
ADOPTED1,206,902 1,286,900 Wages & Other Pay 51100 1,320,600
41,526 51,000 Temporary 51130 52,000
66,042 60,000 Overtime 51140 60,000
529,192 563,000 Other Personnel Expenses 51600 602,300
262 0 Tuition Reimbursement 51761 0
3,300 3,200 Other Employee Allowances 51900 3,200
0 0 Auto Allowance 51910 0
1,330 800 Mobile Computing Allowance 51915 1,600
1,848,554 1,964,900 2,039,700
1,041,652 1,377,000 Electricity 52110 1,327,000
13,850 16,900 Water 52120 16,900
108,152 65,000 Natural Gas 52130 125,000
129,781 110,000 Garbage 52140 110,000
0 0 Surface Water Management Charge 52150 0
0 0 Other Utility Services 52160 0
0 0 Sewer Charges 52170 0
839 25,000 Contracted Services 52205 25,000
0 0 Engineering Services 52210 0
0 0 Landscape Services 52215 0
0 0 Legal Services 52230 0
4,416 5,000 Professional Services 52240 5,000
0 0 Recording Fees 52250 0
0 0 Laundry 52260 0
0 0 Office Supplies 52305 0
52,401 58,000 Operating Supplies 52310 58,000
0 0 Gas, Oil, Lubrication 52315 0
0 0 Janitorial Supplies 52320 0
0 0 Tech & Scientific Supplies 52325 0
0 5,000 Repair & Maintenance Supplies 52330 5,000
0 0 Construction & Building Supplies 52335 0
1,303 1,000 Small Tools 52350 1,000
0 0 Safety Equipment 52360 0
4 0 Postage & Freight 52375 0
0 0 Software Expensed 52380 0
2,249 0 Computer Equipment Expensed 52385 0
5,693 0 Inventory Adjustments 52395 0
1,955 1,600 Dues & Memberships 52405 1,600
237 1,500 Books, Subscriptions & Publications 52410 1,500
0 0 Software Licenses & Support 52425 0
0 0 Publication Notices 52430 0
0 0 Printing 52435 0
0 0 Telephone Services 52445 0
0 0 Fueling Contract 52475 0
3,271 3,600 Training & Education 52480 3,600
497 3,000 Travel Expense 52485 3,000
0 0 Fleet Charges 52486 0
176 2,200 Private Mileage 52487 1,200
638 500 Other Materials & Services 52495 500
168 10,000 Permits, Licenses & Fees 52500 10,000
0 0 Taxes, Assessments & Liens 52510 0
2,094 0 Bank Service Charge 52515 0
1,838 1,800 Equipment Rental 52605 1,800
257 0 Repair & Maintenance Services 52610 0
0 0 Polymers - Thickening 52805 0
555,965 553,000 Polymers - Dewatering 52810 520,000
0 0 Polymers - Tertiary 52815 0
176,839 192,000 Ferric Chloride 52820 200,000
362,092 405,000 Alum 52825 250,000
130,936 200,000 Sodium Hydroxide 52835 200,000
323,258 231,000 Sodium Hypochlorite 52840 261,000
432,245 500,000 Lime 52845 300,000
184,923 193,000 Sodium Bisulfite 52850 210,000
41,300 31,000 Sulfuric Acid 52860 45,000
0 0 Magnesium Chloride 52865 150,000
0 14,500 Other Chemicals 52890 54,500
3,579,028 4,006,600 3,886,600
5,427,582 5,971,500 5,926,3006,272,234 TOTAL EXPENDITURE
4,490,309 MATERIALS & SERVICES SUBTOTAL
803,787
190,745
0
0
38,213
(1,867)
190,907
481,918
97,753
250,677
81,113
518,733
1,800
0
4,920
0
2,439
5,502
10,747
0
393
1,700
0
0
1,678
0
33
96
1,468
0
1,714
(3,767)
2,456
2,816
0
457
0
0
60,221
0
0
0
0
0
0
0
0
21,868
0
0
167,263
108,115
0
0
1,610
1,781,925 PERSONNEL EXPENSE SUBTOTAL
1,427,879
18,532
487,925
0
2,165
0
FY 2019 ACTUAL
1,178,101
36,209
75,915
Water Resource Recovery Operations & Services
Expenditure Summary 8312 - Rock Creek Operations
Mar 31, 2021 12:47 PM Page 3
WRRD EXPENDITURE SUMMARY ▼ Rock Creek Operations | 8312

CLEAN WATER SERVICES • FY 2021-22 PROPOSED BUDGET PAGE 256
WATER RESOURCE RECOVERY OPERATIONS & SERVICES DEPARTMENTPOSITION AND SALARY EXPENSE HILLSBORO OPERATIONS 8314
TotalFY 2019 FY 2020 FY 2021 FY 2022 RepresentedACTUAL ACTUAL REVISED PROPOSED or
BUDGET BUDGET Non-Rep0.00 0.50 0.50 1.00 Electrical & Instrumentation Tech 6 Rep0.50 0.50 0.50 0.50 Operations Analyst 2 8 Non1.00 1.00 1.00 1.00 Plant Maintenance Technician 2 5 Rep0.50 0.00 0.00 0.00 Plant Manager 8 Non0.00 0.50 0.00 0.00 Plant Superintendent 1 8 Non0.50 0.50 0.50 0.50 Senior Operator 6 Rep2.00 2.00 1.50 2.50 Wastewater Plant Operator 2 5 Rep
4.50 5.00 4.00 5.50 TOTAL PERSONNEL
OperatingFY 2019 FY 2020 FY 2021 FY 2022 RepresentedACTUAL ACTUAL REVISED PROPOSED or
BUDGET BUDGET Non-Rep0.00 0.50 0.50 1.00 Electrical & Instrumentation Tech 6 Rep0.50 0.50 0.50 0.50 Operations Analyst 2 8 Non1.00 1.00 1.00 1.00 Plant Maintenance Technician 2 5 Rep0.50 0.00 0.00 0.00 Plant Manager 8 Non0.00 0.50 0.00 0.00 Plant Superintendent 1 8 Non0.50 0.50 0.50 0.50 Senior Operator 6 Rep2.00 2.00 1.50 2.50 Wastewater Plant Operator 2 5 Rep
4.50 5.00 4.00 5.50 TOTAL PERSONNEL
CapitalFY 2019 FY 2020 FY 2021 FY 2022 RepresentedACTUAL ACTUAL REVISED PROPOSED or
BUDGET BUDGET Non-Rep0.00 0.00 0.00 0.00 Electrical & Instrumentation Tech 6 Rep0.00 0.00 0.00 0.00 Operations Analyst 2 8 Non0.00 0.00 0.00 0.00 Plant Maintenance Technician 2 5 Rep0.00 0.00 0.00 0.00 Plant Manager 8 Non0.00 0.00 0.00 0.00 Plant Superintendent 1 8 Non0.00 0.00 0.00 0.00 Senior Operator 6 Rep0.00 0.00 0.00 0.00 Wastewater Plant Operator 2 5 Rep
0.00 0.00 0.00 0.00 TOTAL PERSONNEL
CLASSIFICATION TITLE SALARY GRADE
CLASSIFICATION TITLE SALARY GRADE
CLASSIFICATION TITLE SALARY GRADE
WRRDPOSITIONANDSALARYEXPENSE▼ Hillsboro Operations & Maintenance | 8314

CLEAN WATER SERVICES • FY 2021-22 PROPOSED BUDGET PAGE 257
FY 2020 ACTUAL
FY 2021 REVISED BUDGET OBJECT CODE DESCRIPTION OBJECT
CODEFY 2022
PROPOSEDFY 2022
APPROVEDFY 2022
ADOPTED309,357 404,000 Wages & Other Pay 51100 486,000
0 25,500 Temporary 51130 0
10,192 12,000 Overtime 51140 12,000
124,774 156,000 Other Personnel Expenses 51600 203,400
0 0 Tuition Reimbursement 51761 0
1,275 800 Other Employee Allowances 51900 1,100
0 0 Auto Allowance 51910 0
1,260 800 Mobile Computing Allowance 51915 800
446,858 599,100 703,300
164,024 192,000 Electricity 52110 204,500
34,506 28,500 Water 52120 31,000
3,686 5,000 Natural Gas 52130 5,000
12,632 18,000 Garbage 52140 18,000
5,297 2,700 Surface Water Management Charge 52150 2,700
257 0 Other Utility Services 52160 0
0 0 Sewer Charges 52170 0
17,363 20,000 Contracted Services 52205 20,000
0 0 Engineering Services 52210 0
0 0 Landscape Services 52215 0
0 0 Legal Services 52230 0
0 0 Professional Services 52240 0
0 0 Recording Fees 52250 0
0 0 Laundry 52260 0
0 0 Office Supplies 52305 0
5,478 5,000 Operating Supplies 52310 5,000
880 1,000 Gas, Oil, Lubrication 52315 1,000
0 0 Janitorial Supplies 52320 0
0 0 Tech & Scientific Supplies 52325 0
58,172 70,000 Repair & Maintenance Supplies 52330 70,000
0 0 Construction & Building Supplies 52335 0
524 1,500 Small Tools 52350 1,500
0 0 Safety Equipment 52360 0
0 0 Postage & Freight 52375 0
0 0 Software Expensed 52380 0
0 0 Computer Equipment Expensed 52385 0
0 0 Inventory Adjustments 52395 0
98 200 Dues & Memberships 52405 200
0 0 Books, Subscriptions & Publications 52410 0
0 0 Software Licenses & Support 52425 0
0 0 Publication Notices 52430 0
76 0 Printing 52435 0
0 0 Telephone Services 52445 0
943 1,000 Fueling Contract 52475 1,500
(388) 1,000 Training & Education 52480 1,000
0 300 Travel Expense 52485 300
773 2,000 Fleet Charges 52486 1,500
0 1,000 Private Mileage 52487 1,000
1,000 0 Other Materials & Services 52495 0
0 1,000 Permits, Licenses & Fees 52500 1,000
0 0 Taxes, Assessments & Liens 52510 0
0 0 Bank Service Charge 52515 0
0 5,000 Equipment Rental 52605 5,000
0 0 Repair & Maintenance Services 52610 0
0 0 Polymers - Thickening 52805 0
0 0 Polymers - Dewatering 52810 0
0 0 Polymers - Tertiary 52815 0
0 0 Ferric Chloride 52820 0
0 0 Alum 52825 0
8,277 20,000 Sodium Hydroxide 52835 15,000
0 2,000 Sodium Hypochlorite 52840 2,000
0 0 Lime 52845 0
0 0 Sodium Bisulfite 52850 0
0 0 Sulfuric Acid 52860 0
0 0 Magnesium Chloride 52865 0
0 10,000 Other Chemicals 52890 10,000
313,597 387,200 397,200
760,455 986,300 1,100,500857,751 TOTAL EXPENDITURE
329,508 MATERIALS & SERVICES SUBTOTAL
0
0
0
0
0
0
0
0
27,262
1,740
0
0
0
0
0
0
0
0
0
1,920
0
5
0
1,191
0
0
0
0
0
0
598
0
80
56,721
0
166
0
0
4,274
1,196
0
0
0
0
0
0
0
9,709
0
0
3,417
20,646
5,424
325
1,208
528,244 PERSONNEL EXPENSE SUBTOTAL
169,807
25,026
148,684
0
75
0
FY 2019 ACTUAL
369,693
0
8,584
Water Resource Recovery Operations & Services
Expenditure Summary 8314 - Hillsboro Operations & Maintenance
Mar 31, 2021 12:47 PM Page 4
WRRDEXPENDITURESUMMARY▼ Hillsboro Operations & Maintenance | 8314
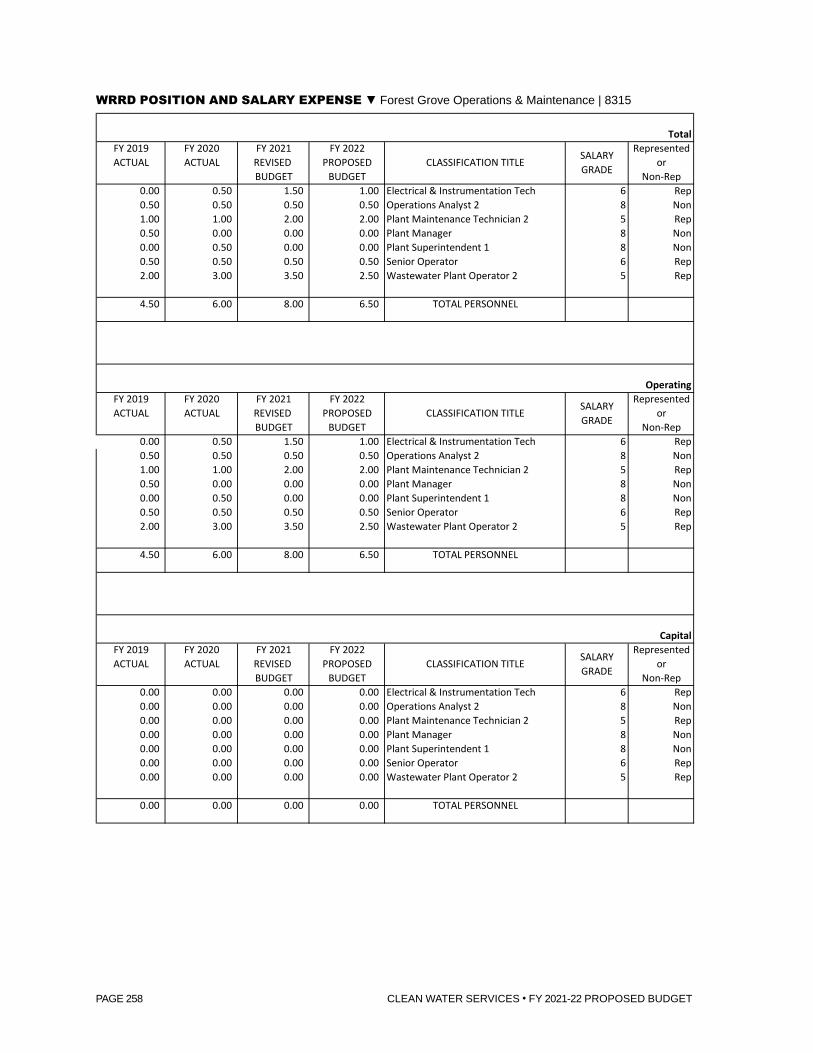
CLEAN WATER SERVICES • FY 2021-22 PROPOSED BUDGET PAGE 258
WATER RESOURCE RECOVERY OPERATIONS & SERVICES DEPARTMENTPOSITION AND SALARY EXPENSE FOREST GROVE OPERATIONS 8315
TotalFY 2019 FY 2020 FY 2021 FY 2022 RepresentedACTUAL ACTUAL REVISED PROPOSED or
BUDGET BUDGET Non-Rep0.00 0.50 1.50 1.00 Electrical & Instrumentation Tech 6 Rep0.50 0.50 0.50 0.50 Operations Analyst 2 8 Non1.00 1.00 2.00 2.00 Plant Maintenance Technician 2 5 Rep0.50 0.00 0.00 0.00 Plant Manager 8 Non0.00 0.50 0.00 0.00 Plant Superintendent 1 8 Non0.50 0.50 0.50 0.50 Senior Operator 6 Rep2.00 3.00 3.50 2.50 Wastewater Plant Operator 2 5 Rep
4.50 6.00 8.00 6.50 TOTAL PERSONNEL
OperatingFY 2019 FY 2020 FY 2021 FY 2022 RepresentedACTUAL ACTUAL REVISED PROPOSED or
BUDGET BUDGET Non-Rep0.00 0.50 1.50 1.00 Electrical & Instrumentation Tech 6 Rep0.50 0.50 0.50 0.50 Operations Analyst 2 8 Non1.00 1.00 2.00 2.00 Plant Maintenance Technician 2 5 Rep0.50 0.00 0.00 0.00 Plant Manager 8 Non0.00 0.50 0.00 0.00 Plant Superintendent 1 8 Non0.50 0.50 0.50 0.50 Senior Operator 6 Rep2.00 3.00 3.50 2.50 Wastewater Plant Operator 2 5 Rep
4.50 6.00 8.00 6.50 TOTAL PERSONNEL
CapitalFY 2019 FY 2020 FY 2021 FY 2022 RepresentedACTUAL ACTUAL REVISED PROPOSED or
BUDGET BUDGET Non-Rep0.00 0.00 0.00 0.00 Electrical & Instrumentation Tech 6 Rep0.00 0.00 0.00 0.00 Operations Analyst 2 8 Non0.00 0.00 0.00 0.00 Plant Maintenance Technician 2 5 Rep0.00 0.00 0.00 0.00 Plant Manager 8 Non0.00 0.00 0.00 0.00 Plant Superintendent 1 8 Non0.00 0.00 0.00 0.00 Senior Operator 6 Rep0.00 0.00 0.00 0.00 Wastewater Plant Operator 2 5 Rep
0.00 0.00 0.00 0.00 TOTAL PERSONNEL
CLASSIFICATION TITLE SALARY GRADE
CLASSIFICATION TITLE SALARY GRADE
CLASSIFICATION TITLE SALARY GRADE
WRRDPOSITIONANDSALARYEXPENSE▼ Forest Grove Operations & Maintenance | 8315

CLEAN WATER SERVICES • FY 2021-22 PROPOSED BUDGET PAGE 259
FY 2020 ACTUAL
FY 2021 REVISED BUDGET OBJECT CODE DESCRIPTION OBJECT
CODEFY 2022
PROPOSEDFY 2022
APPROVEDFY 2022
ADOPTED510,643 654,300 Wages & Other Pay 51100 582,200
18,258 25,500 Temporary 51130 52,000
13,572 17,000 Overtime 51140 17,000
208,196 268,900 Other Personnel Expenses 51600 260,400
230 0 Tuition Reimbursement 51761 0
1,050 1,100 Other Employee Allowances 51900 1,000
0 0 Auto Allowance 51910 0
1,260 1,600 Mobile Computing Allowance 51915 1,600
753,210 968,400 914,200
362,337 313,500 Electricity 52110 323,500
71,763 80,000 Water 52120 80,000
8,546 8,000 Natural Gas 52130 8,000
12,928 15,000 Garbage 52140 15,000
1,961 2,200 Surface Water Management Charge 52150 2,200
414 0 Other Utility Services 52160 0
3,788 0 Sewer Charges 52170 0
35,732 30,000 Contracted Services 52205 40,000
0 0 Engineering Services 52210 0
800 0 Landscape Services 52215 0
0 0 Legal Services 52230 0
0 0 Professional Services 52240 0
0 0 Recording Fees 52250 0
0 0 Laundry 52260 0
25 500 Office Supplies 52305 500
44,297 20,100 Operating Supplies 52310 20,100
0 1,000 Gas, Oil, Lubrication 52315 1,000
0 0 Janitorial Supplies 52320 0
0 0 Tech & Scientific Supplies 52325 0
112,094 100,000 Repair & Maintenance Supplies 52330 100,000
0 0 Construction & Building Supplies 52335 0
1,595 1,500 Small Tools 52350 1,500
865 0 Safety Equipment 52360 0
0 0 Postage & Freight 52375 0
0 0 Software Expensed 52380 0
425 0 Computer Equipment Expensed 52385 0
0 0 Inventory Adjustments 52395 0
660 1,000 Dues & Memberships 52405 1,000
0 0 Books, Subscriptions & Publications 52410 0
0 0 Software Licenses & Support 52425 0
0 0 Publication Notices 52430 0
63 0 Printing 52435 0
0 0 Telephone Services 52445 0
418 400 Fueling Contract 52475 400
3,147 2,000 Training & Education 52480 2,000
2,538 1,500 Travel Expense 52485 1,500
1,072 1,400 Fleet Charges 52486 1,200
1,975 4,000 Private Mileage 52487 4,000
848 1,500 Other Materials & Services 52495 1,500
134 1,500 Permits, Licenses & Fees 52500 1,500
0 0 Taxes, Assessments & Liens 52510 0
0 0 Bank Service Charge 52515 0
5,810 5,000 Equipment Rental 52605 5,000
158 0 Repair & Maintenance Services 52610 0
0 0 Polymers - Thickening 52805 0
0 0 Polymers - Dewatering 52810 0
0 0 Polymers - Tertiary 52815 0
0 0 Ferric Chloride 52820 0
0 0 Alum 52825 0
9,626 40,000 Sodium Hydroxide 52835 30,000
6,722 10,000 Sodium Hypochlorite 52840 10,000
0 0 Lime 52845 0
0 0 Sodium Bisulfite 52850 0
0 0 Sulfuric Acid 52860 0
0 0 Magnesium Chloride 52865 0
0 10,000 Other Chemicals 52890 10,000
690,741 650,100 659,900
1,443,950 1,618,500 1,574,1001,043,923 TOTAL EXPENDITURE
499,354 MATERIALS & SERVICES SUBTOTAL
0
0
0
0
5,437
0
0
0
10,344
6,161
0
0
4,531
0
840
0
0
1,075
1,828
258
3,061
1,740
0
421
0
0
0
0
0
0
598
0
760
54,077
0
2,206
0
0
8,137
10
0
0
0
0
0
0
0
11,220
0
0
11,312
14,455
1,866
414
1,208
544,569 PERSONNEL EXPENSE SUBTOTAL
289,365
69,239
146,776
0
265
0
FY 2019 ACTUAL
345,710
34,473
16,138
Water Resource Recovery Operations & Services
Expenditure Summary 8315 - Forest Grove Operations & Maintenance
Mar 31, 2021 12:47 PM Page 5
WRRDEXPENDITURESUMMARY▼ Forest Grove Operations & Maintenance | 8315

CLEAN WATER SERVICES • FY 2021-22 PROPOSED BUDGET PAGE 260
WATER RESOURCE RECOVERY OPERATIONS & SERVICES DEPARTMENTPOSITION AND SALARY EXPENSE TECHNOLOGY DEVELOPMENT & RESEARCH 8316
TotalFY 2019 FY 2020 FY 2021 FY 2022 RepresentedACTUAL ACTUAL REVISED PROPOSED or
BUDGET BUDGET Non-Rep0.00 0.00 1.00 1.00 Operations Analyst 1 6 Non1.00 1.00 1.00 1.00 Operations Analyst 2 8 Non2.00 2.00 2.00 2.00 Principal Engineer 10 Non0.00 1.00 1.00 1.00 Sr Operations Analyst 9 Non0.00 0.00 1.00 1.00 Water Resources Program Manager 9 Non
3.00 4.00 6.00 6.00 TOTAL PERSONNEL
OperatingFY 2019 FY 2020 FY 2021 FY 2022 RepresentedACTUAL ACTUAL REVISED PROPOSED or
BUDGET BUDGET Non-Rep0.00 0.00 0.75 0.75 Operations Analyst 1 6 Non0.90 0.90 0.90 0.90 Operations Analyst 2 8 Non0.70 0.70 0.70 0.70 Principal Engineer 10 Non0.00 1.00 1.00 1.00 Sr Operations Analyst 9 Non0.00 0.00 0.50 0.50 Water Resources Program Manager 9 Non
1.60 2.60 3.85 3.85 TOTAL PERSONNEL
CapitalFY 2019 FY 2020 FY 2021 FY 2022 RepresentedACTUAL ACTUAL REVISED PROPOSED or
BUDGET BUDGET Non-Rep0.00 0.00 0.25 0.25 Operations Analyst 1 6 Non0.10 0.10 0.10 0.10 Operations Analyst 2 8 Non1.30 1.30 1.30 1.30 Principal Engineer 10 Non0.00 0.00 0.00 0.00 Sr Operations Analyst 9 Non0.00 0.00 0.50 0.50 Water Resources Program Manager 9 Non
1.40 1.40 2.15 2.15 TOTAL PERSONNEL
CLASSIFICATION TITLE SALARY GRADE
CLASSIFICATION TITLE SALARY GRADE
CLASSIFICATION TITLE SALARY GRADE
WRRDPOSITIONANDSALARYEXPENSE▼ Technology Development & Research | 8316

CLEAN WATER SERVICES • FY 2021-22 PROPOSED BUDGET PAGE 261
FY 2020 ACTUAL
FY 2021 REVISED BUDGET OBJECT CODE DESCRIPTION OBJECT
CODEFY 2022
PROPOSEDFY 2022
APPROVEDFY 2022
ADOPTED114,587 697,600 Wages & Other Pay 51100 358,300
107,291 54,700 Temporary 51130 30,000
0 0 Overtime 51140 0
(47,480) 232,700 Other Personnel Expenses 51600 55,100
0 0 Tuition Reimbursement 51761 0
450 200 Other Employee Allowances 51900 400
0 0 Auto Allowance 51910 0
3,325 3,400 Mobile Computing Allowance 51915 5,100
178,174 988,600 448,900
0 0 Electricity 52110 0
0 0 Water 52120 0
0 0 Natural Gas 52130 0
0 0 Garbage 52140 0
0 0 Surface Water Management Charge 52150 0
0 0 Other Utility Services 52160 0
0 0 Sewer Charges 52170 0
0 15,000 Contracted Services 52205 0
0 0 Engineering Services 52210 0
0 0 Landscape Services 52215 0
0 0 Legal Services 52230 0
24,100 25,000 Professional Services 52240 15,000
0 0 Recording Fees 52250 0
0 0 Laundry 52260 0
0 0 Office Supplies 52305 0
20,501 20,000 Operating Supplies 52310 20,000
0 0 Gas, Oil, Lubrication 52315 0
0 0 Janitorial Supplies 52320 0
2,743 5,000 Tech & Scientific Supplies 52325 5,000
0 0 Repair & Maintenance Supplies 52330 0
0 0 Construction & Building Supplies 52335 0
451 500 Small Tools 52350 500
0 0 Safety Equipment 52360 0
0 0 Postage & Freight 52375 0
20 0 Software Expensed 52380 0
0 0 Computer Equipment Expensed 52385 0
0 0 Inventory Adjustments 52395 0
924 1,400 Dues & Memberships 52405 1,400
0 0 Books, Subscriptions & Publications 52410 0
0 0 Software Licenses & Support 52425 0
0 0 Publication Notices 52430 0
0 0 Printing 52435 0
0 0 Telephone Services 52445 0
0 0 Fueling Contract 52475 0
3,636 5,500 Training & Education 52480 5,500
9,276 8,000 Travel Expense 52485 8,000
0 0 Fleet Charges 52486 0
2,402 5,000 Private Mileage 52487 5,000
0 0 Other Materials & Services 52495 0
0 0 Permits, Licenses & Fees 52500 0
0 0 Taxes, Assessments & Liens 52510 0
0 0 Bank Service Charge 52515 0
0 0 Equipment Rental 52605 0
0 0 Repair & Maintenance Services 52610 0
0 0 Polymers - Thickening 52805 0
0 0 Polymers - Dewatering 52810 0
0 0 Polymers - Tertiary 52815 0
0 0 Ferric Chloride 52820 0
0 0 Alum 52825 0
0 0 Sodium Hydroxide 52835 0
0 0 Sodium Hypochlorite 52840 0
0 0 Lime 52845 0
0 0 Sodium Bisulfite 52850 0
0 0 Sulfuric Acid 52860 0
0 0 Magnesium Chloride 52865 0
0 11,000 Other Chemicals 52890 0
64,054 96,400 60,400
242,228 1,085,000 509,300219,609 TOTAL EXPENDITURE
60,723 MATERIALS & SERVICES SUBTOTAL
0
0
0
0
0
0
0
0
0
0
0
0
0
0
0
0
0
3,800
12,737
0
2,789
3,052
0
0
100
0
0
0
0
0
0
0
1,549
0
0
873
0
0
12,973
0
0
0
0
22,850
0
0
0
0
0
0
0
0
0
0
2,415
158,885 PERSONNEL EXPENSE SUBTOTAL
0
0
(32,058)
0
0
0
FY 2019 ACTUAL
119,542
68,986
0
Water Resource Recovery Operations & Services
Expenditure Summary 8316 - Technology Development & Research
Mar 31, 2021 12:47 PM Page 6
WRRDEXPENDITURESUMMARY▼ Technology Development & Research | 8316

CLEAN WATER SERVICES • FY 2021-22 PROPOSED BUDGET PAGE 262
WATER RESOURCE RECOVERY OPERATIONS & SERVICES DEPARTMENTPOSITION AND SALARY EXPENSE DURHAM MECHANICAL MAINTENANCE 8361
TotalFY 2019 FY 2020 FY 2021 FY 2022 RepresentedACTUAL ACTUAL REVISED PROPOSED or
BUDGET BUDGET Non-Rep1.00 1.00 1.00 0.00 Engineering Project Coordinator 7 Non1.00 1.00 1.00 1.00 Mechanical Maint Supervisor 7 Non7.00 8.00 7.00 8.00 Plant Maintenance Technician 2 5 Rep0.00 0.00 0.00 1.00 Plant Maintenance Technician Trainee 1 Rep0.50 0.50 0.00 0.00 Sr Engineer - Mechanical 9 Non1.00 1.00 1.00 1.00 Sr Plant Maintenance Technician 6 Rep
10.50 11.50 10.00 11.00 TOTAL PERSONNEL
OperatingFY 2019 FY 2020 FY 2021 FY 2022 RepresentedACTUAL ACTUAL REVISED PROPOSED or
BUDGET BUDGET Non-Rep1.00 1.00 1.00 0.00 Engineering Project Coordinator 7 Non1.00 1.00 1.00 1.00 Mechanical Maint Supervisor 7 Non7.00 8.00 7.00 8.00 Plant Maintenance Technician 2 5 Rep0.00 0.00 0.00 1.00 Plant Maintenance Technician Trainee 1 Rep0.25 0.25 0.00 0.00 Sr Engineer - Mechanical 9 Non1.00 1.00 1.00 1.00 Sr Plant Maintenance Technician 6 Rep
9.25 11.25 10.00 11.00 TOTAL PERSONNEL
CapitalFY 2019 FY 2020 FY 2021 FY 2022 RepresentedACTUAL ACTUAL REVISED PROPOSED or
BUDGET BUDGET Non-Rep0.00 0.00 0.00 0.00 Engineering Project Coordinator 7 Non0.00 0.00 0.00 0.00 Mechanical Maint Supervisor 7 Non0.00 0.00 0.00 0.00 Plant Maintenance Technician 2 5 Rep0.00 0.00 0.00 0.00 Plant Maintenance Technician Trainee 1 Rep0.25 0.25 0.00 0.00 Sr Engineer - Mechanical 9 Non0.00 0.00 0.00 0.00 Sr Plant Maintenance Technician 6 Rep
0.25 0.25 0.00 0.00 TOTAL PERSONNEL
CLASSIFICATION TITLE SALARY GRADE
CLASSIFICATION TITLE SALARY GRADE
CLASSIFICATION TITLE SALARY GRADE
WRRDPOSITIONANDSALARYEXPENSE▼ Durham Mechanical Maintenance | 8361

CLEAN WATER SERVICES • FY 2021-22 PROPOSED BUDGET PAGE 263
FY 2020 ACTUAL
FY 2021 REVISED BUDGET OBJECT CODE DESCRIPTION OBJECT
CODEFY 2022
PROPOSEDFY 2022
APPROVEDFY 2022
ADOPTED847,484 887,600 Wages & Other Pay 51100 934,400
20,641 52,000 Temporary 51130 0
38,344 10,000 Overtime 51140 10,000
344,605 375,200 Other Personnel Expenses 51600 407,600
0 0 Tuition Reimbursement 51761 0
2,250 1,800 Other Employee Allowances 51900 2,000
0 0 Auto Allowance 51910 0
2,940 2,400 Mobile Computing Allowance 51915 1,600
1,256,264 1,329,000 1,355,600
0 0 Electricity 52110 0
0 0 Water 52120 0
0 0 Natural Gas 52130 0
5,018 0 Garbage 52140 0
0 0 Surface Water Management Charge 52150 0
0 0 Other Utility Services 52160 0
0 0 Sewer Charges 52170 0
63,843 80,000 Contracted Services 52205 90,000
0 0 Engineering Services 52210 0
0 0 Landscape Services 52215 0
0 0 Legal Services 52230 0
0 0 Professional Services 52240 0
0 0 Recording Fees 52250 0
0 0 Laundry 52260 0
0 0 Office Supplies 52305 0
297 0 Operating Supplies 52310 0
43,364 45,000 Gas, Oil, Lubrication 52315 54,000
0 0 Janitorial Supplies 52320 0
0 0 Tech & Scientific Supplies 52325 0
337,579 275,000 Repair & Maintenance Supplies 52330 275,000
0 0 Construction & Building Supplies 52335 0
10,483 15,000 Small Tools 52350 15,000
516 0 Safety Equipment 52360 0
1,912 2,000 Postage & Freight 52375 2,000
0 0 Software Expensed 52380 0
0 1,000 Computer Equipment Expensed 52385 1,000
0 0 Inventory Adjustments 52395 0
0 0 Dues & Memberships 52405 0
79 0 Books, Subscriptions & Publications 52410 0
0 0 Software Licenses & Support 52425 0
0 0 Publication Notices 52430 0
0 0 Printing 52435 0
0 0 Telephone Services 52445 0
350 700 Fueling Contract 52475 1,000
7,084 10,000 Training & Education 52480 10,000
0 1,200 Travel Expense 52485 1,200
98 800 Fleet Charges 52486 800
433 1,000 Private Mileage 52487 1,000
0 0 Other Materials & Services 52495 0
0 1,500 Permits, Licenses & Fees 52500 1,500
0 0 Taxes, Assessments & Liens 52510 0
0 0 Bank Service Charge 52515 0
4,750 5,500 Equipment Rental 52605 5,500
1,990 0 Repair & Maintenance Services 52610 0
0 0 Polymers - Thickening 52805 0
0 0 Polymers - Dewatering 52810 0
0 0 Polymers - Tertiary 52815 0
0 0 Ferric Chloride 52820 0
0 0 Alum 52825 0
0 0 Sodium Hydroxide 52835 0
0 0 Sodium Hypochlorite 52840 0
0 0 Lime 52845 0
0 0 Sodium Bisulfite 52850 0
0 0 Sulfuric Acid 52860 0
0 0 Magnesium Chloride 52865 0
0 0 Other Chemicals 52890 0
477,796 438,700 458,000
1,734,060 1,767,700 1,813,6001,720,209 TOTAL EXPENDITURE
483,290 MATERIALS & SERVICES SUBTOTAL
0
0
0
0
0
0
0
0
0
0
0
0
4,715
1,825
1,508
0
0
6,598
0
538
1,342
64
0
1,079
0
0
0
0
3,153
0
2,848
0
195
348,460
0
11,425
0
0
3,761
44,844
0
0
0
0
0
0
0
50,936
0
0
0
0
0
0
2,818
1,236,919 PERSONNEL EXPENSE SUBTOTAL
0
0
311,373
0
1,951
0
FY 2019 ACTUAL
840,852
36,236
43,690
Water Resource Recovery Operations & Services
Expenditure Summary 8361 - Durham Mechanical Maintenance
Mar 31, 2021 12:47 PM Page 7
WRRDEXPENDITURESUMMARY▼ Durham Mechanical Maintenance | 8361

CLEAN WATER SERVICES • FY 2021-22 PROPOSED BUDGET PAGE 264
WATER RESOURCE RECOVERY OPERATIONS & SERVICES DEPARTMENTPOSITION AND SALARY EXPENSE PUMP STATIONS 8343
TotalFY 2019 FY 2020 FY 2021 FY 2022 RepresentedACTUAL ACTUAL REVISED PROPOSED or
BUDGET BUDGET Non-Rep0.00 1.00 1.00 1.00 Electrical & Instrumentation Technician 6 Rep0.00 1.00 1.00 1.00 Landscape Program Supervisor 7 Non1.00 1.00 1.00 1.00 Mechanical Maint Supervisor 7 Non3.00 4.00 4.00 4.00 Plant Maintenance Technician 2 5 Rep1.00 1.00 1.00 1.00 Sr Plant Maintenance Technician 6 Rep
5.00 8.00 8.00 8.00 TOTAL PERSONNEL
OperatingFY 2019 FY 2020 FY 2021 FY 2022 RepresentedACTUAL ACTUAL REVISED PROPOSED or
BUDGET BUDGET Non-Rep0.00 1.00 1.00 1.00 Electrical & Instrumentation Technician 6 Rep0.00 0.50 0.50 0.50 Landscape Program Supervisor 7 Non1.00 1.00 1.00 1.00 Mechanical Maint Supervisor 7 Non3.00 4.00 4.00 4.00 Plant Maintenance Technician 2 5 Rep1.00 1.00 1.00 1.00 Sr Plant Maintenance Technician 6 Rep
5.00 7.50 7.50 7.50 TOTAL PERSONNEL
CapitalFY 2019 FY 2020 FY 2021 FY 2022 RepresentedACTUAL ACTUAL REVISED PROPOSED or
BUDGET BUDGET Non-Rep0.00 0.00 0.00 0.00 Electrical & Instrumentation Technician 6 Rep0.00 0.50 0.50 0.50 Landscape Program Supervisor 7 Non0.00 0.00 0.00 0.00 Mechanical Maint Supervisor 7 Non0.00 0.00 0.00 0.00 Plant Maintenance Technician 2 5 Rep0.00 0.00 0.00 0.00 Sr Plant Maintenance Technician 6 Rep
0.00 0.50 0.50 0.50 TOTAL PERSONNEL
CLASSIFICATION TITLE SALARY GRADE
CLASSIFICATION TITLE SALARY GRADE
CLASSIFICATION TITLE SALARY GRADE
WRRDPOSITIONANDSALARYEXPENSE▼ Pump Stations | 8343

CLEAN WATER SERVICES • FY 2021-22 PROPOSED BUDGET PAGE 265
FY 2020 ACTUAL
FY 2021 REVISED BUDGET OBJECT CODE DESCRIPTION OBJECT
CODEFY 2022
PROPOSEDFY 2022
APPROVEDFY 2022
ADOPTED638,536 737,300 Wages & Other Pay 51100 706,700
0 0 Temporary 51130 0
24,733 20,000 Overtime 51140 30,000
237,629 296,100 Other Personnel Expenses 51600 297,200
0 0 Tuition Reimbursement 51761 0
1,650 1,600 Other Employee Allowances 51900 1,600
0 0 Auto Allowance 51910 0
3,290 3,200 Mobile Computing Allowance 51915 3,200
905,838 1,058,200 1,038,700
293,077 350,000 Electricity 52110 375,000
25,567 25,000 Water 52120 30,000
0 0 Natural Gas 52130 0
0 0 Garbage 52140 0
1,999 1,500 Surface Water Management Charge 52150 1,500
640 1,000 Other Utility Services 52160 1,000
0 0 Sewer Charges 52170 0
45,250 127,000 Contracted Services 52205 110,000
0 0 Engineering Services 52210 0
493,648 492,000 Landscape Services 52215 519,000
261 0 Legal Services 52230 0
0 0 Professional Services 52240 0
0 0 Recording Fees 52250 0
0 0 Laundry 52260 0
179 0 Office Supplies 52305 0
633 0 Operating Supplies 52310 0
6,072 17,000 Gas, Oil, Lubrication 52315 17,000
0 0 Janitorial Supplies 52320 0
0 0 Tech & Scientific Supplies 52325 0
110,414 150,000 Repair & Maintenance Supplies 52330 130,000
2,900 0 Construction & Building Supplies 52335 0
6,301 7,000 Small Tools 52350 7,000
0 0 Safety Equipment 52360 0
0 0 Postage & Freight 52375 0
0 0 Software Expensed 52380 0
0 0 Computer Equipment Expensed 52385 0
0 0 Inventory Adjustments 52395 0
42 800 Dues & Memberships 52405 800
0 0 Books, Subscriptions & Publications 52410 0
24,963 0 Software Licenses & Support 52425 0
0 0 Publication Notices 52430 0
0 0 Printing 52435 0
0 0 Telephone Services 52445 0
10,778 13,000 Fueling Contract 52475 13,000
1,519 2,000 Training & Education 52480 2,000
0 200 Travel Expense 52485 200
35,506 25,000 Fleet Charges 52486 25,000
109 2,200 Private Mileage 52487 2,200
886 0 Other Materials & Services 52495 0
5,389 5,500 Permits, Licenses & Fees 52500 5,500
74 100 Taxes, Assessments & Liens 52510 100
0 0 Bank Service Charge 52515 0
329 10,000 Equipment Rental 52605 15,000
0 0 Repair & Maintenance Services 52610 0
0 0 Polymers - Thickening 52805 0
0 0 Polymers - Dewatering 52810 0
0 0 Polymers - Tertiary 52815 0
0 0 Ferric Chloride 52820 0
0 0 Alum 52825 0
0 0 Sodium Hydroxide 52835 0
0 0 Sodium Hypochlorite 52840 0
0 0 Lime 52845 0
0 0 Sodium Bisulfite 52850 0
0 0 Sulfuric Acid 52860 0
0 0 Magnesium Chloride 52865 0
39,039 50,000 Other Chemicals 52890 65,000
1,105,575 1,279,300 1,319,300
2,011,413 2,337,500 2,358,0001,223,405 TOTAL EXPENDITURE
628,776 MATERIALS & SERVICES SUBTOTAL
0
0
0
0
38,448
0
0
0
0
0
0
0
2,659
0
5,389
0
0
120
0
38,576
541
747
0
14,318
0
27,175
0
0
0
0
0
0
615
93,821
0
4,715
0
182
498
6,604
0
0
0
0
0
0
0
64,340
0
4,142
0
0
1,930
612
1,610
594,629 PERSONNEL EXPENSE SUBTOTAL
292,113
31,232
154,407
0
607
0
FY 2019 ACTUAL
366,171
61,965
9,869
Water Resource Recovery Operations & Services
Expenditure Summary 8343 - Pump Stations
Mar 31, 2021 12:47 PM Page 8
WRRDEXPENDITURESUMMARY▼ Pump Stations | 8343
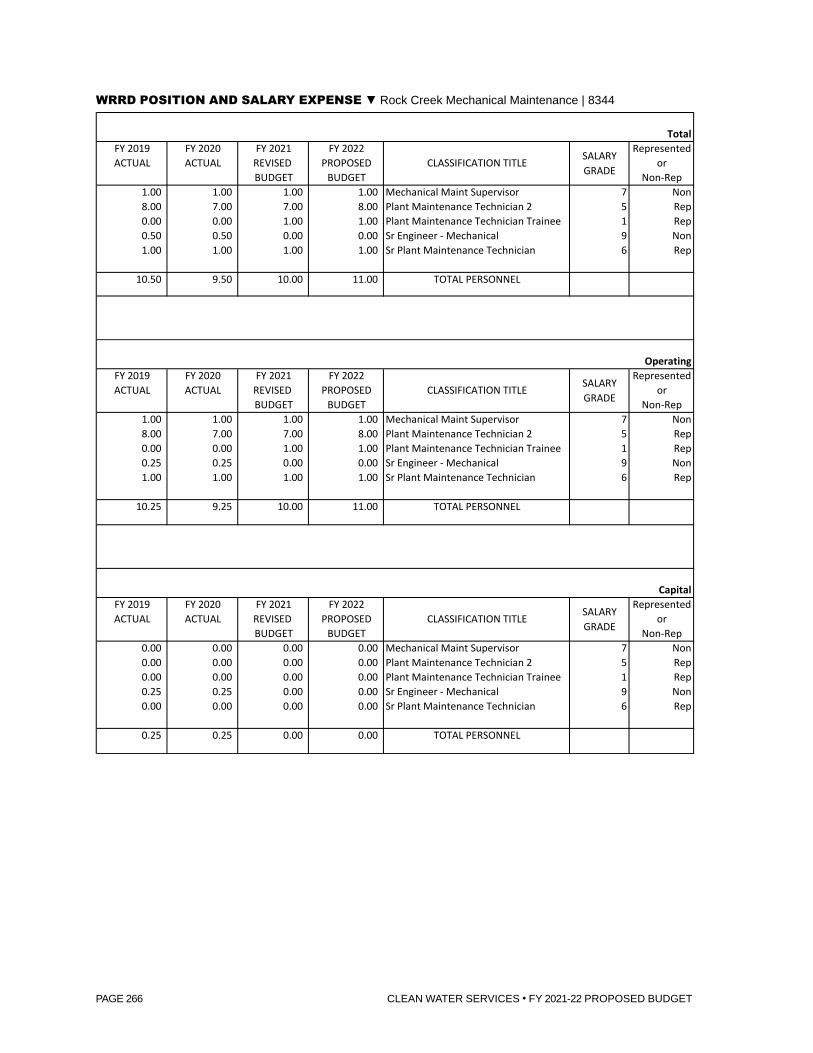
CLEAN WATER SERVICES • FY 2021-22 PROPOSED BUDGET PAGE 266
WATER RESOURCE RECOVERY OPERATIONS & SERVICES DEPARTMENTPOSITION AND SALARY EXPENSE ROCK CREEK MECHANICAL MAINTENANCE 8344
TotalFY 2019 FY 2020 FY 2021 FY 2022 RepresentedACTUAL ACTUAL REVISED PROPOSED or
BUDGET BUDGET Non-Rep1.00 1.00 1.00 1.00 Mechanical Maint Supervisor 7 Non8.00 7.00 7.00 8.00 Plant Maintenance Technician 2 5 Rep0.00 0.00 1.00 1.00 Plant Maintenance Technician Trainee 1 Rep0.50 0.50 0.00 0.00 Sr Engineer - Mechanical 9 Non1.00 1.00 1.00 1.00 Sr Plant Maintenance Technician 6 Rep
10.50 9.50 10.00 11.00 TOTAL PERSONNEL
OperatingFY 2019 FY 2020 FY 2021 FY 2022 RepresentedACTUAL ACTUAL REVISED PROPOSED or
BUDGET BUDGET Non-Rep1.00 1.00 1.00 1.00 Mechanical Maint Supervisor 7 Non8.00 7.00 7.00 8.00 Plant Maintenance Technician 2 5 Rep0.00 0.00 1.00 1.00 Plant Maintenance Technician Trainee 1 Rep0.25 0.25 0.00 0.00 Sr Engineer - Mechanical 9 Non1.00 1.00 1.00 1.00 Sr Plant Maintenance Technician 6 Rep
10.25 9.25 10.00 11.00 TOTAL PERSONNEL
CapitalFY 2019 FY 2020 FY 2021 FY 2022 RepresentedACTUAL ACTUAL REVISED PROPOSED or
BUDGET BUDGET Non-Rep0.00 0.00 0.00 0.00 Mechanical Maint Supervisor 7 Non0.00 0.00 0.00 0.00 Plant Maintenance Technician 2 5 Rep0.00 0.00 0.00 0.00 Plant Maintenance Technician Trainee 1 Rep0.25 0.25 0.00 0.00 Sr Engineer - Mechanical 9 Non0.00 0.00 0.00 0.00 Sr Plant Maintenance Technician 6 Rep
0.25 0.25 0.00 0.00 TOTAL PERSONNEL
CLASSIFICATION TITLE SALARY GRADE
CLASSIFICATION TITLE SALARY GRADE
CLASSIFICATION TITLE SALARY GRADE
WRRDPOSITIONANDSALARYEXPENSE▼ Rock Creek Mechanical Maintenance | 8344

CLEAN WATER SERVICES • FY 2021-22 PROPOSED BUDGET PAGE 267
FY 2020 ACTUAL
FY 2021 REVISED BUDGET OBJECT CODE DESCRIPTION OBJECT
CODEFY 2022
PROPOSEDFY 2022
APPROVEDFY 2022
ADOPTED720,122 817,900 Wages & Other Pay 51100 846,100
32,587 57,100 Temporary 51130 0
15,861 10,000 Overtime 51140 10,000
302,726 350,800 Other Personnel Expenses 51600 367,200
0 0 Tuition Reimbursement 51761 0
1,875 1,600 Other Employee Allowances 51900 2,000
0 0 Auto Allowance 51910 0
1,260 800 Mobile Computing Allowance 51915 800
1,074,431 1,238,200 1,226,100
0 0 Electricity 52110 0
0 0 Water 52120 0
0 0 Natural Gas 52130 0
0 0 Garbage 52140 0
0 0 Surface Water Management Charge 52150 0
0 0 Other Utility Services 52160 0
0 0 Sewer Charges 52170 0
54,805 60,000 Contracted Services 52205 100,000
0 0 Engineering Services 52210 0
0 0 Landscape Services 52215 0
0 0 Legal Services 52230 0
0 0 Professional Services 52240 0
0 0 Recording Fees 52250 0
0 0 Laundry 52260 0
0 0 Office Supplies 52305 0
32 0 Operating Supplies 52310 0
23,322 30,000 Gas, Oil, Lubrication 52315 36,000
0 0 Janitorial Supplies 52320 0
0 0 Tech & Scientific Supplies 52325 0
340,060 350,000 Repair & Maintenance Supplies 52330 350,000
0 0 Construction & Building Supplies 52335 0
11,696 15,000 Small Tools 52350 20,000
178 0 Safety Equipment 52360 0
1,498 2,000 Postage & Freight 52375 2,000
0 0 Software Expensed 52380 0
0 0 Computer Equipment Expensed 52385 0
0 0 Inventory Adjustments 52395 0
285 0 Dues & Memberships 52405 0
0 0 Books, Subscriptions & Publications 52410 0
0 0 Software Licenses & Support 52425 0
0 0 Publication Notices 52430 0
0 0 Printing 52435 0
0 0 Telephone Services 52445 0
978 900 Fueling Contract 52475 1,400
5,910 3,000 Training & Education 52480 3,000
0 500 Travel Expense 52485 500
36 500 Fleet Charges 52486 500
1,299 1,000 Private Mileage 52487 1,000
321 0 Other Materials & Services 52495 0
93 800 Permits, Licenses & Fees 52500 800
0 0 Taxes, Assessments & Liens 52510 0
0 0 Bank Service Charge 52515 0
1,582 10,000 Equipment Rental 52605 10,000
2,900 0 Repair & Maintenance Services 52610 0
0 0 Polymers - Thickening 52805 0
0 0 Polymers - Dewatering 52810 0
0 0 Polymers - Tertiary 52815 0
0 0 Ferric Chloride 52820 0
0 0 Alum 52825 0
0 0 Sodium Hydroxide 52835 0
0 0 Sodium Hypochlorite 52840 0
0 0 Lime 52845 0
0 0 Sodium Bisulfite 52850 0
0 0 Sulfuric Acid 52860 0
0 0 Magnesium Chloride 52865 0
0 0 Other Chemicals 52890 0
444,995 473,700 525,200
1,519,426 1,711,900 1,751,3001,446,243 TOTAL EXPENDITURE
437,177 MATERIALS & SERVICES SUBTOTAL
0
0
0
0
0
0
0
0
0
0
0
0
8,477
2,735
74
0
0
5,417
1,188
428
2,126
986
0
1,132
0
0
0
0
1,228
0
0
0
1,468
318,438
0
9,159
0
30
398
15,996
0
0
0
0
0
0
0
67,897
0
0
0
0
0
0
1,208
1,009,066 PERSONNEL EXPENSE SUBTOTAL
0
0
274,105
0
1,670
0
FY 2019 ACTUAL
695,652
15,119
21,314
Water Resource Recovery Operations & Services
Expenditure Summary 8344 - Rock Creek Mechanical Maintenance
Mar 31, 2021 12:47 PM Page 9
WRRDEXPENDITURESUMMARY▼ Rock Creek Mechanical Maintenance | 8344

CLEAN WATER SERVICES • FY 2021-22 PROPOSED BUDGET PAGE 268
WATER RESOURCE RECOVERY OPERATIONS & SERVICES DEPARTMENTPOSITION AND SALARY EXPENSE BIOSOLIDS/REUSE/FERNHILL 8331
TotalFY 2019 FY 2020 FY 2021 FY 2022 RepresentedACTUAL ACTUAL REVISED PROPOSED or
BUDGET BUDGET Non-Rep1.00 0.00 0.00 0.00 Landscape Coordinator 6 Non0.00 0.00 1.00 2.00 Landscape Specialist 4 Rep1.00 0.00 0.00 0.00 Reuse Manager 8 Non1.00 1.00 1.00 1.00 Operations Analyst 2 8 Non0.00 1.00 1.00 1.00 Sr Landscape Specialist 6 Non
3.00 2.00 3.00 4.00 TOTAL PERSONNEL
OperatingFY 2019 FY 2020 FY 2021 FY 2022 RepresentedACTUAL ACTUAL REVISED PROPOSED or
BUDGET BUDGET Non-Rep1.00 0.00 0.00 0.00 Landscape Coordinator 6 Non0.00 0.00 1.00 2.00 Landscape Specialist 4 Rep0.50 0.00 0.00 0.00 Reuse Manager 8 Non1.00 1.00 1.00 1.00 Operations Analyst 2 8 Non0.00 1.00 1.00 1.00 Sr Landscape Specialist 6 Non
2.50 2.00 3.00 4.00 TOTAL PERSONNEL
CapitalFY 2019 FY 2020 FY 2021 FY 2022 RepresentedACTUAL ACTUAL REVISED PROPOSED or
BUDGET BUDGET Non-Rep0.00 0.00 0.00 0.00 Landscape Coordinator 6 Non0.00 0.00 0.00 0.00 Landscape Specialist 4 Rep0.50 0.00 0.00 0.00 Reuse Manager 8 Non0.00 0.00 0.00 0.00 Operations Analyst 2 8 Non0.00 0.00 0.00 0.00 Sr Landscape Specialist 6 Non
0.50 0.00 0.00 0.00 TOTAL PERSONNEL
CLASSIFICATION TITLE SALARY GRADE
CLASSIFICATION TITLE SALARY GRADE
CLASSIFICATION TITLE SALARY GRADE
WRRDPOSITIONANDSALARYEXPENSE▼ Biosolids/Reuse/Fernhill | 8331

CLEAN WATER SERVICES • FY 2021-22 PROPOSED BUDGET PAGE 269
FY 2020 ACTUAL
FY 2021 REVISED BUDGET OBJECT CODE DESCRIPTION OBJECT
CODEFY 2022
PROPOSEDFY 2022
APPROVEDFY 2022
ADOPTED113,622 254,100 Wages & Other Pay 51100 299,000
95,838 68,100 Temporary 51130 50,000
820 0 Overtime 51140 0
52,343 100,400 Other Personnel Expenses 51600 142,300
0 0 Tuition Reimbursement 51761 0
450 400 Other Employee Allowances 51900 800
0 0 Auto Allowance 51910 0
1,715 1,600 Mobile Computing Allowance 51915 1,600
264,789 424,600 493,700
654 0 Electricity 52110 0
0 0 Water 52120 0
0 0 Natural Gas 52130 0
0 0 Garbage 52140 0
0 0 Surface Water Management Charge 52150 0
0 0 Other Utility Services 52160 0
0 0 Sewer Charges 52170 0
1,251,635 1,400,000 Contracted Services 52205 1,400,000
0 0 Engineering Services 52210 0
69,227 75,000 Landscape Services 52215 75,000
0 0 Legal Services 52230 0
60,528 60,000 Professional Services 52240 60,000
0 0 Recording Fees 52250 0
0 0 Laundry 52260 0
0 0 Office Supplies 52305 0
265 0 Operating Supplies 52310 0
0 0 Gas, Oil, Lubrication 52315 0
0 0 Janitorial Supplies 52320 0
0 0 Tech & Scientific Supplies 52325 0
18,289 0 Repair & Maintenance Supplies 52330 0
17,169 0 Construction & Building Supplies 52335 0
5,065 6,000 Small Tools 52350 6,000
71 0 Safety Equipment 52360 0
0 0 Postage & Freight 52375 0
0 0 Software Expensed 52380 0
0 0 Computer Equipment Expensed 52385 0
0 0 Inventory Adjustments 52395 0
2,813 2,000 Dues & Memberships 52405 2,000
0 500 Books, Subscriptions & Publications 52410 500
0 0 Software Licenses & Support 52425 0
0 0 Publication Notices 52430 0
838 0 Printing 52435 0
0 200 Telephone Services 52445 200
266,557 300,000 Fueling Contract 52475 300,000
5,394 3,000 Training & Education 52480 3,000
2,350 2,000 Travel Expense 52485 2,000
5,499 4,500 Fleet Charges 52486 4,500
3,113 2,000 Private Mileage 52487 2,000
81 500 Other Materials & Services 52495 500
0 0 Permits, Licenses & Fees 52500 0
0 0 Taxes, Assessments & Liens 52510 0
0 0 Bank Service Charge 52515 0
8,327 2,000 Equipment Rental 52605 2,000
0 0 Repair & Maintenance Services 52610 0
0 0 Polymers - Thickening 52805 0
0 0 Polymers - Dewatering 52810 0
0 0 Polymers - Tertiary 52815 0
0 0 Ferric Chloride 52820 0
0 0 Alum 52825 0
0 0 Sodium Hydroxide 52835 0
0 0 Sodium Hypochlorite 52840 0
0 0 Lime 52845 0
0 0 Sodium Bisulfite 52850 0
0 0 Sulfuric Acid 52860 0
0 0 Magnesium Chloride 52865 0
0 0 Other Chemicals 52890 0
1,717,876 1,857,700 1,857,700
1,982,665 2,282,300 2,351,4002,295,022 TOTAL EXPENDITURE
1,950,580 MATERIALS & SERVICES SUBTOTAL
0
0
0
0
0
0
0
0
0
0
0
0
0
0
330
0
0
879
3,739
7,559
758
840
0
343,246
132
0
0
0
0
0
1,695
0
4,052
11,461
10,103
2,464
0
0
3,097
0
0
135
0
0
0
0
0
1,494,347
0
65,743
0
0
0
0
2,205
344,441 PERSONNEL EXPENSE SUBTOTAL
0
0
53,789
0
377
0
FY 2019 ACTUAL
174,629
108,207
5,234
Water Resource Recovery Operations & Services
Expenditure Summary 8331 - Biosolids/Reuse/Fernhill
Mar 31, 2021 12:47 PM Page 10
WRRDEXPENDITURESUMMARY▼ Biosolids/Reuse/Fernhill | 8331

CLEAN WATER SERVICES • FY 2021-22 PROPOSED BUDGET PAGE 270
WATER RESOURCE RECOVERY OPERATIONS & SERVICES DEPARTMENTPOSITION AND SALARY EXPENSE TPS ENGINEERING 8211
TotalFY 2019 FY 2020 FY 2021 FY 2022 RepresentedACTUAL ACTUAL REVISED PROPOSED or
BUDGET BUDGET Non-Rep3.00 4.00 4.00 3.00 Construction Coordinator 8 Non0.00 0.00 0.00 1.00 Engineer 8 Non1.00 1.00 1.00 1.00 Engineering Technician 3 6 Rep1.00 1.00 1.00 1.00 Engineering Project Coordinator 7 Non5.00 5.00 5.00 5.00 Principal Engineer 10 Non1.00 0.00 0.00 0.00 Senior Operations Analyst 9 Non2.00 2.00 2.00 2.00 Senior Engineer 9 Non
13.00 13.00 13.00 13.00 TOTAL PERSONNEL
OperatingFY 2019 FY 2020 FY 2021 FY 2022 RepresentedACTUAL ACTUAL REVISED PROPOSED or
BUDGET BUDGET Non-Rep0.00 0.00 0.00 0.00 Construction Coordinator 8 Non0.00 0.00 0.00 0.00 Engineer 8 Non0.50 0.50 0.50 0.50 Engineering Technician 3 6 Rep0.00 0.00 0.00 0.00 Engineering Project Coordinator 7 Non0.00 0.00 0.00 0.00 Principal Engineer 10 Non0.00 0.00 0.00 0.00 Senior Operations Analyst 9 Non0.00 0.00 0.00 0.00 Senior Engineer 9 Non
0.50 0.50 0.50 0.50 TOTAL PERSONNEL
CapitalFY 2019 FY 2020 FY 2021 FY 2022 RepresentedACTUAL ACTUAL REVISED PROPOSED or
BUDGET BUDGET Non-Rep3.00 4.00 4.00 3.00 Construction Coordinator 8 Non0.00 0.00 0.00 1.00 Engineer 8 Non0.50 0.50 0.50 0.50 Engineering Technician 3 6 Rep1.00 1.00 1.00 1.00 Engineering Project Coordinator 7 Non5.00 5.00 5.00 5.00 Principal Engineer 10 Non1.00 0.00 0.00 0.00 Senior Operations Analyst 9 Non2.00 2.00 2.00 2.00 Senior Engineer 9 Non
12.50 12.50 12.50 12.50 TOTAL PERSONNEL
CLASSIFICATION TITLE SALARY GRADE
CLASSIFICATION TITLE SALARY GRADE
CLASSIFICATION TITLE SALARY GRADE
WRRDPOSITIONANDSALARYEXPENSE▼ TPS Engineering | 8211

CLEAN WATER SERVICES • FY 2021-22 PROPOSED BUDGET PAGE 271
FY 2020 ACTUAL
FY 2021 REVISED BUDGET OBJECT CODE DESCRIPTION OBJECT
CODEFY 2022
PROPOSEDFY 2022
APPROVEDFY 2022
ADOPTED53,672 495,800 Wages & Other Pay 51100 562,300
196,184 10,000 Temporary 51130 0
969 5,000 Overtime 51140 5,000
(272,599) 149,700 Other Personnel Expenses 51600 46,300
0 0 Tuition Reimbursement 51761 0
1,575 2,000 Other Employee Allowances 51900 2,000
0 0 Auto Allowance 51910 0
7,880 8,800 Mobile Computing Allowance 51915 8,000
(12,318) 671,300 623,600
13,553 20,000 Electricity 52110 16,000
0 0 Water 52120 0
1,870 4,000 Natural Gas 52130 3,000
0 0 Garbage 52140 0
0 0 Surface Water Management Charge 52150 0
0 0 Other Utility Services 52160 0
0 0 Sewer Charges 52170 0
0 5,000 Contracted Services 52205 5,000
0 0 Engineering Services 52210 0
0 0 Landscape Services 52215 0
0 0 Legal Services 52230 0
8,554 20,000 Professional Services 52240 15,000
0 0 Recording Fees 52250 0
0 0 Laundry 52260 0
17 6,000 Office Supplies 52305 6,000
1,377 8,000 Operating Supplies 52310 8,000
0 0 Gas, Oil, Lubrication 52315 0
0 0 Janitorial Supplies 52320 0
0 0 Tech & Scientific Supplies 52325 0
38 0 Repair & Maintenance Supplies 52330 0
0 0 Construction & Building Supplies 52335 0
560 500 Small Tools 52350 500
0 0 Safety Equipment 52360 0
0 500 Postage & Freight 52375 500
0 0 Software Expensed 52380 0
2,404 2,000 Computer Equipment Expensed 52385 2,000
0 0 Inventory Adjustments 52395 0
2,344 4,000 Dues & Memberships 52405 3,000
357 2,300 Books, Subscriptions & Publications 52410 2,300
1,200 7,200 Software Licenses & Support 52425 2,200
0 500 Publication Notices 52430 500
0 500 Printing 52435 500
0 0 Telephone Services 52445 0
699 1,100 Fueling Contract 52475 1,100
6,550 3,900 Training & Education 52480 3,900
4,696 6,000 Travel Expense 52485 6,000
698 1,400 Fleet Charges 52486 1,100
9,028 12,500 Private Mileage 52487 10,000
1,554 6,000 Other Materials & Services 52495 6,000
0 0 Permits, Licenses & Fees 52500 0
0 0 Taxes, Assessments & Liens 52510 0
0 0 Bank Service Charge 52515 0
0 0 Equipment Rental 52605 0
0 0 Repair & Maintenance Services 52610 0
0 0 Polymers - Thickening 52805 0
0 0 Polymers - Dewatering 52810 0
0 0 Polymers - Tertiary 52815 0
0 0 Ferric Chloride 52820 0
0 0 Alum 52825 0
0 0 Sodium Hydroxide 52835 0
0 0 Sodium Hypochlorite 52840 0
0 0 Lime 52845 0
0 0 Sodium Bisulfite 52850 0
0 0 Sulfuric Acid 52860 0
0 0 Magnesium Chloride 52865 0
0 0 Other Chemicals 52890 0
55,501 111,400 92,600
43,183 782,700 716,20091,089 TOTAL EXPENDITURE
80,228 MATERIALS & SERVICES SUBTOTAL
0
0
0
0
0
0
0
0
0
0
0
0
0
0
49
0
0
5,411
10,229
1,043
7,868
5,847
0
1,238
269
5,866
0
238
0
0
7,892
0
2,666
18
0
2,111
0
4,614
4,098
0
0
0
0
4,096
0
0
0
1,644
0
0
1,662
0
0
0
7,280
10,861 PERSONNEL EXPENSE SUBTOTAL
13,371
0
(334,933)
0
1,350
0
FY 2019 ACTUAL
55,600
280,521
1,043
Water Resource Recovery Operations & Services
Expenditure Summary 8211 - TPS Engineering
Mar 31, 2021 12:47 PM Page 11
WRRDEXPENDITURESUMMARY▼ TPS Engineering | 8211

CLEAN WATER SERVICES • FY 2021-22 PROPOSED BUDGET PAGE 272
WATER RESOURCE RECOVERY OPERATIONS & SERVICES DEPARTMENTPOSITION AND SALARY EXPENSE DURHAM E&I MAINTENANCE 8351
TotalFY 2019 FY 2020 FY 2021 FY 2022 RepresentedACTUAL ACTUAL REVISED PROPOSED or
BUDGET BUDGET Non-Rep3.00 3.00 3.00 3.00 Electrician 2 6 Rep1.00 0.00 0.00 0.00 Electrical & Instrumentation Technician 6 Rep3.00 3.00 3.00 3.00 Instrument Technician 2 6 Rep0.00 0.00 0.00 1.00 Instrument Technician Trainee 1 Rep1.00 1.00 1.00 1.00 Electrical & Instrumentation Supervisor 8 Non0.50 0.50 1.00 0.00 Field Engineer - Electrical 8 Non0.50 0.50 0.00 0.00 Field Engineer - Inspection 8 Non0.00 0.00 0.50 0.00 Principal Engineer 10 Non0.50 0.50 0.00 0.00 Senior Engineer - Electrical 9 Non
9.50 8.50 8.50 8.00 TOTAL PERSONNEL
OperatingFY 2019 FY 2020 FY 2021 FY 2022 RepresentedACTUAL ACTUAL REVISED PROPOSED or
BUDGET BUDGET Non-Rep3.00 3.00 3.00 3.00 Electrician 2 6 Rep1.00 0.00 0.00 0.00 Electrical & Instrumentation Technician 6 Rep3.00 3.00 3.00 3.00 Instrument Technician 2 6 Rep0.00 0.00 0.00 1.00 Instrument Technician Trainee 1 Rep1.00 1.00 1.00 1.00 Electrical & Instrumentation Supervisor 8 Non0.50 0.50 0.50 0.00 Field Engineer - Electrical 8 Non0.00 0.00 0.00 0.00 Field Engineer - Inspection 8 Non0.00 0.00 0.00 0.00 Principal Engineer 10 Non0.00 0.00 0.00 0.00 Senior Engineer - Electrical 9 Non
8.50 7.50 7.50 8.00 TOTAL PERSONNEL
CapitalFY 2019 FY 2020 FY 2021 FY 2022 RepresentedACTUAL ACTUAL REVISED PROPOSED or
BUDGET BUDGET Non-Rep0.00 0.00 0.00 0.00 Electrician 2 6 Rep0.00 0.00 0.00 0.00 Electrical & Instrumentation Technician 6 Rep0.00 0.00 0.00 0.00 Instrument Technician 2 6 Rep
Instrument Technician Trainee 1 Rep0.00 0.00 0.00 0.00 Electrical & Instrumentation Supervisor 8 Non0.00 0.00 0.50 0.00 Field Engineer - Electrical 8 Non0.50 0.50 0.00 0.00 Field Engineer - Inspection 8 Non0.00 0.00 0.50 0.00 Principal Engineer 10 Non0.50 0.50 0.00 0.00 Senior Engineer - Electrical 9 Non
1.00 1.00 1.00 0.00 TOTAL PERSONNEL
CLASSIFICATION TITLE SALARY GRADE
CLASSIFICATION TITLE SALARY GRADE
CLASSIFICATION TITLE SALARY GRADE
WRRDPOSITIONANDSALARYEXPENSE▼ Durham E&I Maintenance | 8351

CLEAN WATER SERVICES • FY 2021-22 PROPOSED BUDGET PAGE 273
FY 2020 ACTUAL
FY 2021 REVISED BUDGET OBJECT CODE DESCRIPTION OBJECT
CODEFY 2022
PROPOSEDFY 2022
APPROVEDFY 2022
ADOPTED402,435 556,700 Wages & Other Pay 51100 586,900
67,696 0 Temporary 51130 0
21,975 16,000 Overtime 51140 20,000
143,576 208,000 Other Personnel Expenses 51600 223,500
0 0 Tuition Reimbursement 51761 0
1,350 1,500 Other Employee Allowances 51900 1,600
0 0 Auto Allowance 51910 0
2,393 2,400 Mobile Computing Allowance 51915 2,000
639,425 784,600 834,000
0 0 Electricity 52110 0
0 0 Water 52120 0
0 0 Natural Gas 52130 0
0 0 Garbage 52140 0
0 0 Surface Water Management Charge 52150 0
0 0 Other Utility Services 52160 0
0 0 Sewer Charges 52170 0
29,831 57,000 Contracted Services 52205 34,500
0 0 Engineering Services 52210 0
0 0 Landscape Services 52215 0
0 0 Legal Services 52230 0
0 0 Professional Services 52240 0
0 0 Recording Fees 52250 0
0 0 Laundry 52260 0
1,117 300 Office Supplies 52305 300
638 4,000 Operating Supplies 52310 4,000
0 0 Gas, Oil, Lubrication 52315 0
0 0 Janitorial Supplies 52320 0
0 0 Tech & Scientific Supplies 52325 0
158,220 220,000 Repair & Maintenance Supplies 52330 205,000
187 0 Construction & Building Supplies 52335 0
4,188 5,000 Small Tools 52350 7,500
504 0 Safety Equipment 52360 0
0 0 Postage & Freight 52375 0
0 0 Software Expensed 52380 0
0 0 Computer Equipment Expensed 52385 0
0 0 Inventory Adjustments 52395 0
191 500 Dues & Memberships 52405 500
984 500 Books, Subscriptions & Publications 52410 500
2,606 2,700 Software Licenses & Support 52425 0
0 0 Publication Notices 52430 0
0 0 Printing 52435 0
0 0 Telephone Services 52445 0
2,143 2,000 Fueling Contract 52475 2,500
495 1,000 Training & Education 52480 1,000
0 500 Travel Expense 52485 500
278 2,500 Fleet Charges 52486 2,500
29 500 Private Mileage 52487 500
753 500 Other Materials & Services 52495 500
423 3,500 Permits, Licenses & Fees 52500 3,500
0 0 Taxes, Assessments & Liens 52510 0
0 0 Bank Service Charge 52515 0
0 2,500 Equipment Rental 52605 2,500
0 0 Repair & Maintenance Services 52610 0
0 0 Polymers - Thickening 52805 0
0 0 Polymers - Dewatering 52810 0
0 0 Polymers - Tertiary 52815 0
0 0 Ferric Chloride 52820 0
0 0 Alum 52825 0
0 0 Sodium Hydroxide 52835 0
0 0 Sodium Hypochlorite 52840 0
0 0 Lime 52845 0
0 0 Sodium Bisulfite 52850 0
0 0 Sulfuric Acid 52860 0
0 0 Magnesium Chloride 52865 0
0 0 Other Chemicals 52890 0
202,586 303,000 265,800
842,011 1,087,600 1,099,8001,151,559 TOTAL EXPENDITURE
306,388 MATERIALS & SERVICES SUBTOTAL
0
0
0
0
0
0
0
0
0
0
0
0
0
0
0
0
0
0
2,434
3,491
829
625
0
2,644
0
0
795
0
0
0
0
0
264
265,259
88
6,070
125
13
1,121
0
0
0
0
618
0
0
0
22,013
0
0
0
0
0
0
3,293
845,170 PERSONNEL EXPENSE SUBTOTAL
0
0
173,060
0
1,025
0
FY 2019 ACTUAL
643,856
4,161
19,776
Water Resource Recovery Operations & Services
Expenditure Summary 8351 - Durham E&I Maintenance
Mar 31, 2021 12:47 PM Page 12
WRRDEXPENDITURESUMMARY▼ Durham E&I Maintenance | 8351
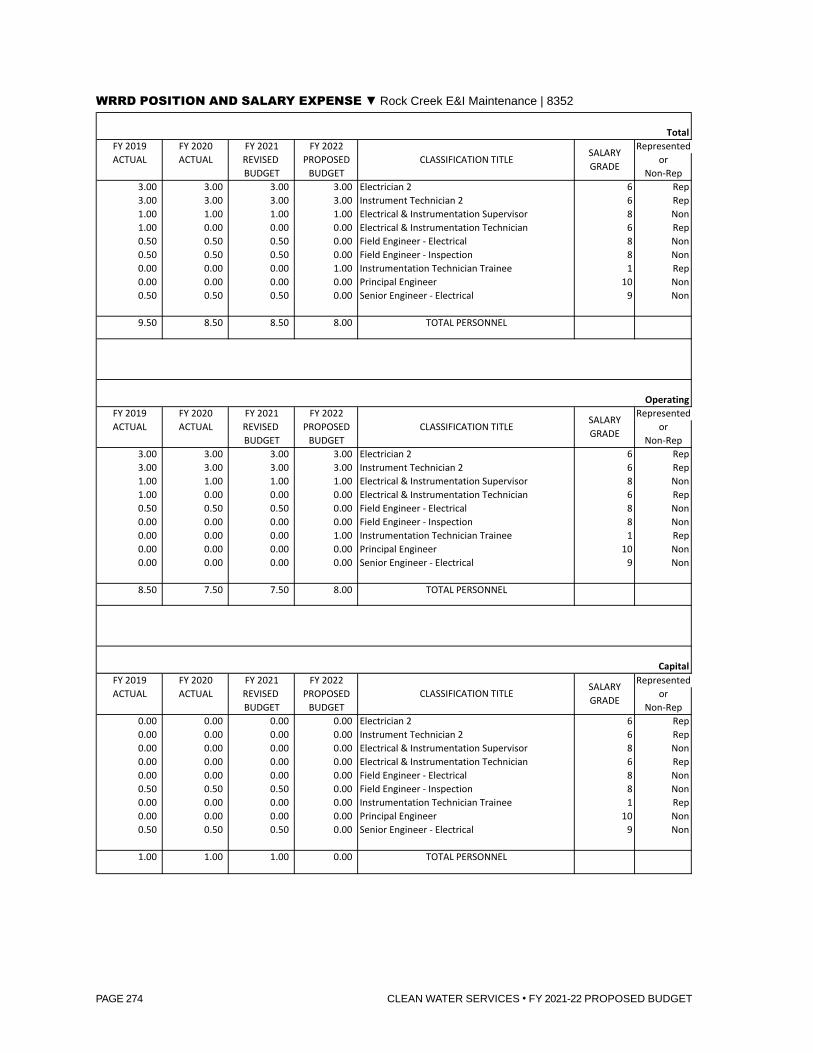
CLEAN WATER SERVICES • FY 2021-22 PROPOSED BUDGET PAGE 274
WATER RESOURCE RECOVERY OPERATIONS & SERVICES DEPARTMENTPOSITION AND SALARY EXPENSE ROCK CREEK E&I MAINTENANCE 8352
TotalFY 2019 FY 2020 FY 2021 FY 2022 RepresentedACTUAL ACTUAL REVISED PROPOSED or
BUDGET BUDGET Non-Rep3.00 3.00 3.00 3.00 Electrician 2 6 Rep3.00 3.00 3.00 3.00 Instrument Technician 2 6 Rep1.00 1.00 1.00 1.00 Electrical & Instrumentation Supervisor 8 Non1.00 0.00 0.00 0.00 Electrical & Instrumentation Technician 6 Rep0.50 0.50 0.50 0.00 Field Engineer - Electrical 8 Non0.50 0.50 0.50 0.00 Field Engineer - Inspection 8 Non0.00 0.00 0.00 1.00 Instrumentation Technician Trainee 1 Rep0.00 0.00 0.00 0.00 Principal Engineer 10 Non0.50 0.50 0.50 0.00 Senior Engineer - Electrical 9 Non
9.50 8.50 8.50 8.00 TOTAL PERSONNEL
OperatingFY 2019 FY 2020 FY 2021 FY 2022 RepresentedACTUAL ACTUAL REVISED PROPOSED or
BUDGET BUDGET Non-Rep3.00 3.00 3.00 3.00 Electrician 2 6 Rep3.00 3.00 3.00 3.00 Instrument Technician 2 6 Rep1.00 1.00 1.00 1.00 Electrical & Instrumentation Supervisor 8 Non1.00 0.00 0.00 0.00 Electrical & Instrumentation Technician 6 Rep0.50 0.50 0.50 0.00 Field Engineer - Electrical 8 Non0.00 0.00 0.00 0.00 Field Engineer - Inspection 8 Non0.00 0.00 0.00 1.00 Instrumentation Technician Trainee 1 Rep0.00 0.00 0.00 0.00 Principal Engineer 10 Non0.00 0.00 0.00 0.00 Senior Engineer - Electrical 9 Non
8.50 7.50 7.50 8.00 TOTAL PERSONNEL
CapitalFY 2019 FY 2020 FY 2021 FY 2022 RepresentedACTUAL ACTUAL REVISED PROPOSED or
BUDGET BUDGET Non-Rep0.00 0.00 0.00 0.00 Electrician 2 6 Rep0.00 0.00 0.00 0.00 Instrument Technician 2 6 Rep0.00 0.00 0.00 0.00 Electrical & Instrumentation Supervisor 8 Non0.00 0.00 0.00 0.00 Electrical & Instrumentation Technician 6 Rep0.00 0.00 0.00 0.00 Field Engineer - Electrical 8 Non0.50 0.50 0.50 0.00 Field Engineer - Inspection 8 Non0.00 0.00 0.00 0.00 Instrumentation Technician Trainee 1 Rep0.00 0.00 0.00 0.00 Principal Engineer 10 Non0.50 0.50 0.50 0.00 Senior Engineer - Electrical 9 Non
1.00 1.00 1.00 0.00 TOTAL PERSONNEL
CLASSIFICATION TITLE
CLASSIFICATION TITLE
CLASSIFICATION TITLE
SALARY GRADE
SALARY GRADE
SALARY GRADE
WRRDPOSITIONANDSALARYEXPENSE▼ Rock Creek E&I Maintenance | 8352

CLEAN WATER SERVICES • FY 2021-22 PROPOSED BUDGET PAGE 275
FY 2020 ACTUAL
FY 2021 REVISED BUDGET OBJECT CODE DESCRIPTION OBJECT
CODEFY 2022
PROPOSEDFY 2022
APPROVEDFY 2022
ADOPTED621,834 863,900 Wages & Other Pay 51100 702,600
0 0 Temporary 51130 0
15,708 8,000 Overtime 51140 8,000
227,943 316,300 Other Personnel Expenses 51600 279,800
0 0 Tuition Reimbursement 51761 0
1,650 1,300 Other Employee Allowances 51900 1,600
0 0 Auto Allowance 51910 0
3,308 3,200 Mobile Computing Allowance 51915 3,600
870,442 1,192,700 995,600
0 0 Electricity 52110 0
0 0 Water 52120 0
0 0 Natural Gas 52130 0
0 0 Garbage 52140 0
0 0 Surface Water Management Charge 52150 0
0 0 Other Utility Services 52160 0
0 0 Sewer Charges 52170 0
11,124 5,000 Contracted Services 52205 25,000
0 0 Engineering Services 52210 0
0 0 Landscape Services 52215 0
0 0 Legal Services 52230 0
0 0 Professional Services 52240 0
0 0 Recording Fees 52250 0
0 0 Laundry 52260 0
0 0 Office Supplies 52305 0
1,720 4,000 Operating Supplies 52310 4,000
0 0 Gas, Oil, Lubrication 52315 0
0 0 Janitorial Supplies 52320 0
0 0 Tech & Scientific Supplies 52325 0
172,256 220,000 Repair & Maintenance Supplies 52330 220,000
0 0 Construction & Building Supplies 52335 0
3,125 4,000 Small Tools 52350 4,000
84 0 Safety Equipment 52360 0
0 0 Postage & Freight 52375 0
0 0 Software Expensed 52380 0
0 0 Computer Equipment Expensed 52385 0
0 0 Inventory Adjustments 52395 0
449 500 Dues & Memberships 52405 500
0 500 Books, Subscriptions & Publications 52410 500
0 0 Software Licenses & Support 52425 0
0 0 Publication Notices 52430 0
0 0 Printing 52435 0
0 0 Telephone Services 52445 0
1,505 1,500 Fueling Contract 52475 1,900
1,440 1,000 Training & Education 52480 1,000
1,679 300 Travel Expense 52485 300
3,906 4,500 Fleet Charges 52486 4,300
518 500 Private Mileage 52487 500
55 500 Other Materials & Services 52495 500
0 2,000 Permits, Licenses & Fees 52500 2,000
0 0 Taxes, Assessments & Liens 52510 0
0 0 Bank Service Charge 52515 0
(7) 6,000 Equipment Rental 52605 6,000
0 0 Repair & Maintenance Services 52610 0
0 0 Polymers - Thickening 52805 0
0 0 Polymers - Dewatering 52810 0
0 0 Polymers - Tertiary 52815 0
0 0 Ferric Chloride 52820 0
0 0 Alum 52825 0
0 0 Sodium Hydroxide 52835 0
0 0 Sodium Hypochlorite 52840 0
0 0 Lime 52845 0
0 0 Sodium Bisulfite 52850 0
0 0 Sulfuric Acid 52860 0
0 0 Magnesium Chloride 52865 0
0 0 Other Chemicals 52890 0
197,853 250,300 270,500
1,068,295 1,443,000 1,266,1001,409,090 TOTAL EXPENDITURE
266,411 MATERIALS & SERVICES SUBTOTAL
0
0
0
0
0
0
0
0
0
0
0
0
4,783
0
0
0
0
445
1,492
2,400
774
1,125
0
1,676
0
143
0
0
0
0
0
0
420
245,241
0
3,361
0
19
4,533
0
0
0
0
0
0
0
0
0
0
0
0
0
0
0
3,485
1,142,678 PERSONNEL EXPENSE SUBTOTAL
0
0
274,719
0
1,077
0
FY 2019 ACTUAL
849,909
0
13,488
Water Resource Recovery Operations & Services
Expenditure Summary 8352 - Rock Creek E&I Maintenance
Mar 31, 2021 12:47 PM Page 13
WRRDEXPENDITURESUMMARY▼ Rock Creek E&I Maintenance | 8352

CLEAN WATER SERVICES • FY 2021-22 PROPOSED BUDGET PAGE 276
WATER RESOURCE RECOVERY OPERATIONS & SERVICES DEPARTMENTPOSITION AND SALARY EXPENSE ASSET MANAGEMENT 8362
TotalFY 2019 FY 2020 FY 2021 FY 2022 RepresentedACTUAL ACTUAL REVISED PROPOSED or
BUDGET BUDGET Non-Rep1.00 0.00 0.00 0.00 Asset Manager 8 Non0.00 1.00 1.00 0.00 Asset Management Systems Analyst 8 Non0.00 0.00 1.00 0.00 Building & Facilities Supervisor 8 Non0.00 1.00 1.00 0.00 Engineer 8 Non0.00 1.00 0.00 0.00 Engineering Tech 3 6 Rep1.00 0.00 0.00 0.00 Landscape Program Supervisor 7 Non0.00 2.00 1.00 0.00 Operations Analyst 1 6 Non0.00 0.00 1.00 0.00 Program Support Specialist 5 Non0.00 0.00 1.00 0.00 Senior Engineer 9 Non0.00 1.00 1.00 0.00 Sr Operations Analyst 9 Non2.00 2.00 2.00 0.00 Storekeeper 2 5 Rep1.00 1.00 0.00 0.00 Wastewater Treatment Support Supervisor 7 Non
5.00 9.00 9.00 0.00 TOTAL PERSONNEL
OperatingFY 2019 FY 2020 FY 2021 FY 2022 RepresentedACTUAL ACTUAL REVISED PROPOSED or
BUDGET BUDGET Non-Rep0.50 0.00 0.00 0.00 Asset Manager 8 Non0.00 0.50 0.50 0.00 Asset Management Systems Analyst 8 Non0.00 0.00 1.00 0.00 Building & Facilities Supervisor 8 Non0.00 1.00 1.00 0.00 Engineer 8 Non0.00 1.00 0.00 0.00 Engineering Tech 3 6 Rep0.50 0.00 0.00 0.00 Landscape Program Supervisor 7 Non0.00 0.50 0.50 0.00 Operations Analyst 1 6 Non0.00 0.00 1.00 0.00 Program Support Specialist 5 Non0.00 0.00 1.00 0.00 Senior Engineer 9 Non0.00 0.00 0.00 0.00 Sr Operations Analyst 9 Non2.00 2.00 2.00 0.00 Storekeeper 2 5 Rep1.00 1.00 0.00 0.00 Wastewater Treatment Support Supervisor 7 Non
4.00 6.00 7.00 0.00 TOTAL PERSONNEL
CapitalFY 2019 FY 2020 FY 2021 FY 2022 RepresentedACTUAL ACTUAL REVISED PROPOSED or
BUDGET BUDGET Non-Rep0.50 0.00 0.00 0.00 Asset Manager 8 Non0.00 0.50 0.50 0.00 Asset Management Systems Analyst 8 Non0.00 0.00 0.00 0.00 Building & Facilities Supervisor 8 Non0.00 0.00 0.00 0.00 Engineer 8 Non0.00 0.00 0.00 0.00 Engineering Tech 3 6 Rep0.50 0.00 0.00 0.00 Landscape Program Supervisor 7 Non0.00 1.50 0.50 0.00 Operations Analyst 1 6 Non0.00 0.00 0.00 0.00 Program Support Specialist 5 Non0.00 0.00 0.00 0.00 Senior Engineer 9 Non0.00 1.00 1.00 0.00 Sr Operations Analyst 9 Non0.00 0.00 0.00 0.00 Storekeeper 2 5 Rep0.00 0.00 0.00 0.00 Wastewater Treatment Support Supervisor 7 Non
1.00 3.00 2.00 0.00 TOTAL PERSONNEL
CLASSIFICATION TITLE SALARY GRADE
CLASSIFICATION TITLE SALARY GRADE
CLASSIFICATION TITLE SALARY GRADE
WRRDPOSITIONANDSALARYEXPENSE▼ Asset Management | 8362

CLEAN WATER SERVICES • FY 2021-22 PROPOSED BUDGET PAGE 277
FY 2020 ACTUAL
FY 2021 REVISED BUDGET OBJECT CODE DESCRIPTION OBJECT
CODEFY 2022
PROPOSEDFY 2022
APPROVEDFY 2022
ADOPTED601,844 843,100 Wages & Other Pay 51100 0
0 0 Temporary 51130 0
146 5,000 Overtime 51140 0
204,413 334,500 Other Personnel Expenses 51600 0
0 0 Tuition Reimbursement 51761 0
1,350 1,400 Other Employee Allowances 51900 0
0 0 Auto Allowance 51910 0
5,095 4,000 Mobile Computing Allowance 51915 0
812,848 1,188,000 0
0 0 Electricity 52110 0
0 0 Water 52120 0
0 0 Natural Gas 52130 0
0 3,000 Garbage 52140 0
0 0 Surface Water Management Charge 52150 0
0 0 Other Utility Services 52160 0
0 0 Sewer Charges 52170 0
261,176 250,000 Contracted Services 52205 0
0 0 Engineering Services 52210 0
610 0 Landscape Services 52215 0
0 0 Legal Services 52230 0
2,971 10,000 Professional Services 52240 0
0 0 Recording Fees 52250 0
42,395 45,000 Laundry 52260 0
81 0 Office Supplies 52305 0
238,697 250,000 Operating Supplies 52310 0
1,393 1,000 Gas, Oil, Lubrication 52315 0
12,668 15,000 Janitorial Supplies 52320 0
154 0 Tech & Scientific Supplies 52325 0
33,557 0 Repair & Maintenance Supplies 52330 0
0 0 Construction & Building Supplies 52335 0
75 5,000 Small Tools 52350 0
0 0 Safety Equipment 52360 0
0 300 Postage & Freight 52375 0
0 0 Software Expensed 52380 0
2,344 1,200 Computer Equipment Expensed 52385 0
0 0 Inventory Adjustments 52395 0
419 0 Dues & Memberships 52405 0
0 400 Books, Subscriptions & Publications 52410 0
0 0 Software Licenses & Support 52425 0
0 0 Publication Notices 52430 0
0 0 Printing 52435 0
0 0 Telephone Services 52445 0
2,127 2,500 Fueling Contract 52475 0
320 1,500 Training & Education 52480 0
1,694 500 Travel Expense 52485 0
2,128 5,500 Fleet Charges 52486 0
2,026 2,900 Private Mileage 52487 0
458 200 Other Materials & Services 52495 0
240 2,600 Permits, Licenses & Fees 52500 0
0 0 Taxes, Assessments & Liens 52510 0
0 0 Bank Service Charge 52515 0
0 2,000 Equipment Rental 52605 0
0 0 Repair & Maintenance Services 52610 0
0 0 Polymers - Thickening 52805 0
0 0 Polymers - Dewatering 52810 0
0 0 Polymers - Tertiary 52815 0
0 0 Ferric Chloride 52820 0
0 0 Alum 52825 0
0 0 Sodium Hydroxide 52835 0
0 0 Sodium Hypochlorite 52840 0
0 0 Lime 52845 0
0 0 Sodium Bisulfite 52850 0
0 0 Sulfuric Acid 52860 0
0 0 Magnesium Chloride 52865 0
0 0 Other Chemicals 52890 0
605,533 598,600 0
1,418,381 1,786,600 01,707,371 TOTAL EXPENDITURE
1,115,469 MATERIALS & SERVICES SUBTOTAL
0
0
0
0
0
0
0
0
0
0
0
0
0
0
1,504
0
0
0
1,842
2,660
1,999
1,587
0
4,373
121
0
0
0
36
0
2,848
0
253
84,404
0
6,455
0
0
246,904
1,356
12,036
0
0
0
111
53,823
0
202,248
0
486,085
0
4,825
0
0
4,025
591,902 PERSONNEL EXPENSE SUBTOTAL
0
0
163,350
432
473
0
FY 2019 ACTUAL
423,622
0
0
Water Resource Recovery Operations & Services
Expenditure Summary 8362 - Asset Management
Mar 31, 2021 12:47 PM Page 14
WRRDEXPENDITURESUMMARY▼ Asset Management | 8362

CLEAN WATER SERVICES • FY 2021-22 PROPOSED BUDGET PAGE 278
WATER RESOURCE RECOVERY OPERATIONS & SERVICES DEPARTMENTPOSITION AND SALARY EXPENSE CONTROLS SYSTEMS 8353
TotalFY 2019 FY 2020 FY 2021 FY 2022 RepresentedACTUAL ACTUAL REVISED PROPOSED or
BUDGET BUDGET Non-Rep4.00 3.00 2.00 0.00 Field Engineer - Automations & Controls 8 Non0.00 1.00 1.00 0.00 Field Engineer - Commissioning & Startup 8 Non0.00 1.00 0.00 0.00 Principal Engineer - I&C/Automation 10 Non1.00 1.00 1.00 0.00 Software Engineer 9 Non0.00 0.00 1.00 0.00 Senior Field Engineer - A&C 9 Non1.00 1.00 1.00 0.00 Sr Engineer - I&C 9 Non
6.00 7.00 6.00 0.00 TOTAL PERSONNEL
OperatingFY 2019 FY 2020 FY 2021 FY 2022 RepresentedACTUAL ACTUAL REVISED PROPOSED or
BUDGET BUDGET Non-Rep1.50 1.00 1.00 0.00 Field Engineer - Automations & Controls 8 Non0.00 0.50 0.50 0.00 Field Engineer - Commissioning & Startup 8 Non0.00 0.50 0.00 0.00 Principal Engineer - I&C/Automation 10 Non1.00 1.00 1.00 0.00 Software Engineer 9 Non0.00 0.00 0.50 0.00 Senior Field Engineer - A&C 9 Non0.50 0.50 0.50 0.00 Sr Engineer - I&C 9 Non
3.00 3.50 3.50 0.00 TOTAL PERSONNEL
CapitalFY 2019 FY 2020 FY 2021 FY 2022 RepresentedACTUAL ACTUAL REVISED PROPOSED or
BUDGET BUDGET Non-Rep2.50 2.00 1.00 0.00 Field Engineer - Automations & Controls 8 Non0.00 0.50 0.50 0.00 Field Engineer - Commissioning & Startup 8 Non0.00 0.50 0.00 0.00 Principal Engineer - I&C/Automation 10 Non0.00 0.00 0.00 0.00 Software Engineer 9 Non0.00 0.00 0.50 0.00 Senior Field Engineer - A&C 9 Non0.50 0.50 0.50 0.00 Sr Engineer - I&C 9 Non
3.00 3.50 2.50 0.00 TOTAL PERSONNEL
CLASSIFICATION TITLE SALARY GRADE
CLASSIFICATION TITLE SALARY GRADE
CLASSIFICATION TITLE SALARY GRADE
WRRDPOSITIONANDSALARYEXPENSE▼ Control Systems | 8353

CLEAN WATER SERVICES • FY 2021-22 PROPOSED BUDGET PAGE 279
FY 2020 ACTUAL
FY 2021 REVISED BUDGET OBJECT CODE DESCRIPTION OBJECT
CODEFY 2022
PROPOSEDFY 2022
APPROVEDFY 2022
ADOPTED594,500 747,000 Wages & Other Pay 51100 0
0 0 Temporary 51130 0
0 0 Overtime 51140 0
172,835 265,800 Other Personnel Expenses 51600 0
447 0 Tuition Reimbursement 51761 0
450 800 Other Employee Allowances 51900 0
0 0 Auto Allowance 51910 0
3,055 2,800 Mobile Computing Allowance 51915 0
771,287 1,016,400 0
0 0 Electricity 52110 0
0 0 Water 52120 0
0 0 Natural Gas 52130 0
0 0 Garbage 52140 0
0 0 Surface Water Management Charge 52150 0
0 0 Other Utility Services 52160 0
0 0 Sewer Charges 52170 0
0 0 Contracted Services 52205 0
25,346 0 Engineering Services 52210 0
0 0 Landscape Services 52215 0
0 0 Legal Services 52230 0
10,440 0 Professional Services 52240 0
0 0 Recording Fees 52250 0
0 0 Laundry 52260 0
0 0 Office Supplies 52305 0
4,167 2,000 Operating Supplies 52310 0
0 0 Gas, Oil, Lubrication 52315 0
0 0 Janitorial Supplies 52320 0
0 0 Tech & Scientific Supplies 52325 0
0 0 Repair & Maintenance Supplies 52330 0
0 0 Construction & Building Supplies 52335 0
0 0 Small Tools 52350 0
0 0 Safety Equipment 52360 0
0 0 Postage & Freight 52375 0
0 0 Software Expensed 52380 0
0 0 Computer Equipment Expensed 52385 0
0 0 Inventory Adjustments 52395 0
100 1,000 Dues & Memberships 52405 0
684 0 Books, Subscriptions & Publications 52410 0
40,134 50,000 Software Licenses & Support 52425 0
0 0 Publication Notices 52430 0
0 0 Printing 52435 0
0 0 Telephone Services 52445 0
0 0 Fueling Contract 52475 0
0 5,000 Training & Education 52480 0
0 500 Travel Expense 52485 0
0 0 Fleet Charges 52486 0
704 1,500 Private Mileage 52487 0
82 0 Other Materials & Services 52495 0
0 0 Permits, Licenses & Fees 52500 0
0 0 Taxes, Assessments & Liens 52510 0
0 0 Bank Service Charge 52515 0
0 0 Equipment Rental 52605 0
0 0 Repair & Maintenance Services 52610 0
0 0 Polymers - Thickening 52805 0
0 0 Polymers - Dewatering 52810 0
0 0 Polymers - Tertiary 52815 0
0 0 Ferric Chloride 52820 0
0 0 Alum 52825 0
0 0 Sodium Hydroxide 52835 0
0 0 Sodium Hypochlorite 52840 0
0 0 Lime 52845 0
0 0 Sodium Bisulfite 52850 0
0 0 Sulfuric Acid 52860 0
0 0 Magnesium Chloride 52865 0
0 0 Other Chemicals 52890 0
81,657 60,000 0
852,944 1,076,400 0704,795 TOTAL EXPENDITURE
96,377 MATERIALS & SERVICES SUBTOTAL
0
0
0
0
0
0
0
0
0
0
0
0
0
0
0
0
0
0
1,074
0
84
163
0
0
0
33,588
0
0
0
0
0
0
551
30
0
0
0
0
2,136
0
0
0
0
29,932
0
0
0
0
28,819
0
0
0
0
0
1,677
608,418 PERSONNEL EXPENSE SUBTOTAL
0
0
140,543
432
450
0
FY 2019 ACTUAL
448,638
16,677
0
Water Resource Recovery Operations & Services
Expenditure Summary 8353 - Control Systems
Mar 31, 2021 12:47 PM Page 15
WRRDEXPENDITURESUMMARY▼ Control Systems | 8353

CLEAN WATER SERVICES • FY 2021-22 PROPOSED BUDGET PAGE 280
WATER RESOURCE RECOVERY OPERATIONS & SERVICES DEPARTMENTPOSITION AND SALARY EXPENSE TECHNICAL SUPPORT 8363
TotalFY 2019 FY 2020 FY 2021 FY 2022 RepresentedACTUAL ACTUAL REVISED PROPOSED or
BUDGET BUDGET Non-Rep0.00 0.00 1.00 0.00 Engineering Technician 3 6 Rep0.00 0.00 1.00 0.00 Field Engineer - Inspection 8 Non0.00 0.00 1.00 0.00 Operations Analyst 1 6 Non0.00 0.00 1.00 0.00 Principal Engineer - I&C/Automation 10 Non0.00 0.00 1.00 0.00 Senior Engineer 9 Non
0.00 0.00 5.00 0.00 TOTAL PERSONNEL
OperatingFY 2019 FY 2020 FY 2021 FY 2022 RepresentedACTUAL ACTUAL REVISED PROPOSED or
BUDGET BUDGET Non-Rep0.00 0.00 1.00 0.00 Engineering Technician 3 6 Rep0.00 0.00 0.50 0.00 Field Engineer - Inspection 8 Non0.00 0.00 0.50 0.00 Operations Analyst 1 6 Non0.00 0.00 0.50 0.00 Principal Engineer - I&C/Automation 10 Non0.00 0.00 1.00 0.00 Senior Engineer 9 Non
0.00 0.00 3.50 0.00 TOTAL PERSONNEL
CapitalFY 2019 FY 2020 FY 2021 FY 2022 RepresentedACTUAL ACTUAL REVISED PROPOSED or
BUDGET BUDGET Non-Rep0.00 0.00 0.00 0.00 Engineering Technician 3 6 Rep0.00 0.00 0.50 0.00 Field Engineer - Inspection 8 Non0.00 0.00 0.50 0.00 Operations Analyst 1 6 Non0.00 0.00 0.50 0.00 Principal Engineer - I&C/Automation 10 Non0.00 0.00 0.00 0.00 Senior Engineer 9 Non
0.00 0.00 1.50 0.00 TOTAL PERSONNEL
CLASSIFICATION TITLE SALARY GRADE
CLASSIFICATION TITLE SALARY GRADE
CLASSIFICATION TITLE SALARY GRADE
WRRDPOSITIONANDSALARYEXPENSE▼ Technical Support | 8363
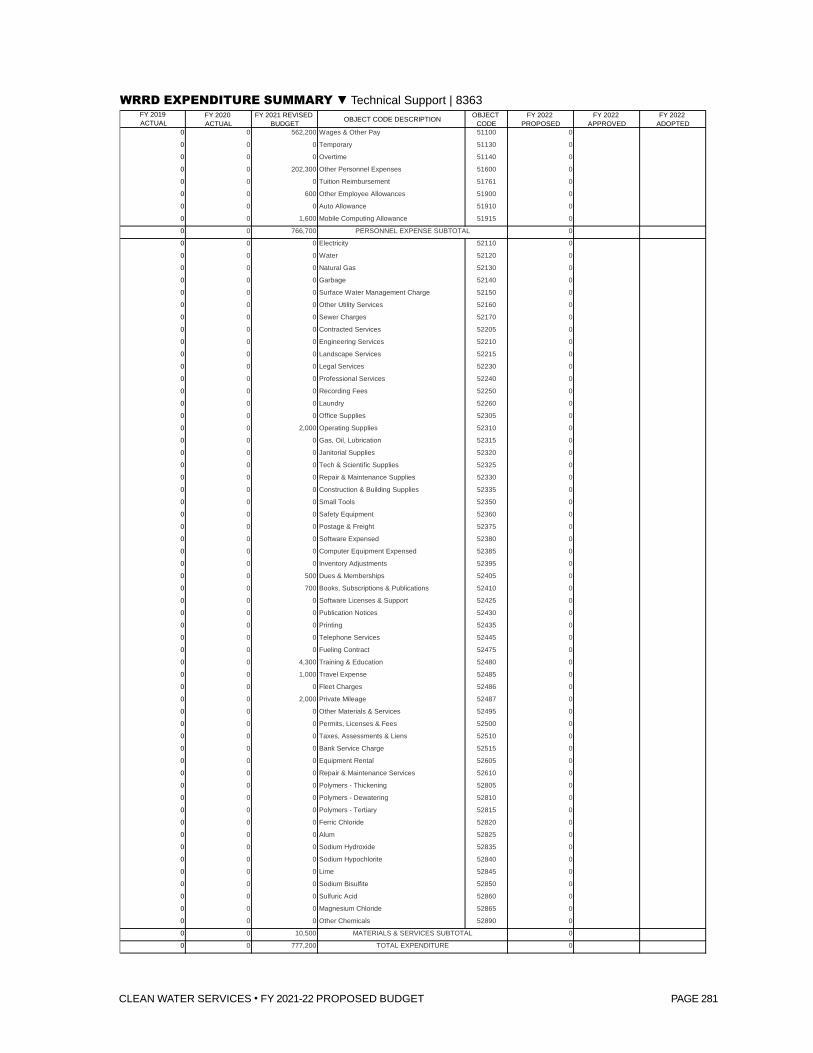
CLEAN WATER SERVICES • FY 2021-22 PROPOSED BUDGET PAGE 281
FY 2020 ACTUAL
FY 2021 REVISED BUDGET OBJECT CODE DESCRIPTION OBJECT
CODEFY 2022
PROPOSEDFY 2022
APPROVEDFY 2022
ADOPTED0 562,200 Wages & Other Pay 51100 0
0 0 Temporary 51130 0
0 0 Overtime 51140 0
0 202,300 Other Personnel Expenses 51600 0
0 0 Tuition Reimbursement 51761 0
0 600 Other Employee Allowances 51900 0
0 0 Auto Allowance 51910 0
0 1,600 Mobile Computing Allowance 51915 0
0 766,700 0
0 0 Electricity 52110 0
0 0 Water 52120 0
0 0 Natural Gas 52130 0
0 0 Garbage 52140 0
0 0 Surface Water Management Charge 52150 0
0 0 Other Utility Services 52160 0
0 0 Sewer Charges 52170 0
0 0 Contracted Services 52205 0
0 0 Engineering Services 52210 0
0 0 Landscape Services 52215 0
0 0 Legal Services 52230 0
0 0 Professional Services 52240 0
0 0 Recording Fees 52250 0
0 0 Laundry 52260 0
0 0 Office Supplies 52305 0
0 2,000 Operating Supplies 52310 0
0 0 Gas, Oil, Lubrication 52315 0
0 0 Janitorial Supplies 52320 0
0 0 Tech & Scientific Supplies 52325 0
0 0 Repair & Maintenance Supplies 52330 0
0 0 Construction & Building Supplies 52335 0
0 0 Small Tools 52350 0
0 0 Safety Equipment 52360 0
0 0 Postage & Freight 52375 0
0 0 Software Expensed 52380 0
0 0 Computer Equipment Expensed 52385 0
0 0 Inventory Adjustments 52395 0
0 500 Dues & Memberships 52405 0
0 700 Books, Subscriptions & Publications 52410 0
0 0 Software Licenses & Support 52425 0
0 0 Publication Notices 52430 0
0 0 Printing 52435 0
0 0 Telephone Services 52445 0
0 0 Fueling Contract 52475 0
0 4,300 Training & Education 52480 0
0 1,000 Travel Expense 52485 0
0 0 Fleet Charges 52486 0
0 2,000 Private Mileage 52487 0
0 0 Other Materials & Services 52495 0
0 0 Permits, Licenses & Fees 52500 0
0 0 Taxes, Assessments & Liens 52510 0
0 0 Bank Service Charge 52515 0
0 0 Equipment Rental 52605 0
0 0 Repair & Maintenance Services 52610 0
0 0 Polymers - Thickening 52805 0
0 0 Polymers - Dewatering 52810 0
0 0 Polymers - Tertiary 52815 0
0 0 Ferric Chloride 52820 0
0 0 Alum 52825 0
0 0 Sodium Hydroxide 52835 0
0 0 Sodium Hypochlorite 52840 0
0 0 Lime 52845 0
0 0 Sodium Bisulfite 52850 0
0 0 Sulfuric Acid 52860 0
0 0 Magnesium Chloride 52865 0
0 0 Other Chemicals 52890 0
0 10,500 0
0 777,200 00 TOTAL EXPENDITURE
0 MATERIALS & SERVICES SUBTOTAL
0
0
0
0
0
0
0
0
0
0
0
0
0
0
0
0
0
0
0
0
0
0
0
0
0
0
0
0
0
0
0
0
0
0
0
0
0
0
0
0
0
0
0
0
0
0
0
0
0
0
0
0
0
0
0
0 PERSONNEL EXPENSE SUBTOTAL
0
0
0
0
0
0
FY 2019 ACTUAL
0
0
0
Water Resource Recovery Operations & Services
Expenditure Summary 8363 - Technical Support
Mar 31, 2021 12:47 PM Page 16
WRRDEXPENDITURESUMMARY▼ Technical Support | 8363


CLEAN WATER SERVICES • FY 2021-22 PROPOSED BUDGET PAGE 283
Appendix


CLEAN WATER SERVICES • FY 2021-22 PROPOSED BUDGET PAGE 285
Personnel Services51110 Full Time Regular Salaries51130 Temporary51140 Overtime51600 Other Personnel Expense
(OPE)51900 Other Employee
Allowances51910 Automobile Allowance
Materials and Services52110 Electricity52120 Water52130 Natural Gas52140 Garbage52150 Surface Water
Management52160 Other Utility Services 52170 Sewer Utility Services52205 Contract Services Other52210 Engineering Services52215 Landscape Services52240 Professional Services52220 Audit and Accounting
Services52230 Legal Services52250 Recording Fees52260 Laundry Services 52270 Other Governmental
Services
52305 Office Supplies52310 Operating Supplies52315 Gas, oil, lubrication52320 Janitorial Supplies52325 Tech & Scientific Supplies52375 Postage and Freight52330 Repair & Maintenance
Supplies52335 Construction & Building
Supplies 52340 Parts Equipment52350 Small Tools52360 Safety Equipment 52380 Software Expensed52385 Computer Equipment
52405 Dues, Memberships, Certifications52410 Books, Subsc. &
Publications52425 Software Licenses
&Support52430 Publication Notices 52435 Printing & Duplicating 52440 Telecom Internal 52445 Telephone Service52470 Building & Land Rental 52475 Fuel Contract
52480 Training & Education52485 Travel Expense 52486 Fleet Charges52487 Private Mileage 52495 Other Materials and
Services52500 Permits, Licenses & Fees 52505 Public Information52510 Taxes, Assessment, Liens52515 Bank Service Charge 52525 Finance Petty Cash Short
52605 Equipment Rental52610 Repair & Maintenance
Services 52630 Computer R&M 52705 Insurance 52720 Property Damage 52735 General Liability
52805 Polymers52820 Ferric Chloride 52825 Alum 52810 Polymers 52815 Liquid Oxygen 52835 Sodium Hydroxide52840 Sodium Hypochlorite 52845 Lime 52850 Sodium Bisulfite 52890 Other Chemicals
Capital Outlay - 5500055200 Land Purchase 55220 Easements 55300 Buildings and Structures 55400 Machinery and 55130 Office Equipment 55120 Data Processing
Equipment 55500 Trucks and Autos55600 Plant Equipment 55700 Construction & Maint.
Equip.
Other Expenditures52905 Bad Debt Expense 56200 Principal-Long Term 56205 Interest – Long Term
Contracts 57102 Transfer to Fund 10257106 Transfer to Fund 10657111 Transfer to Fund 11157112 Transfer to Fund 11257115 Transfer to Fund 11557206 Transfer to Fund 20657212 Transfer to Fund 21258100 Operating Contingency
CHART OF ACCOUNTS

CLEAN WATER SERVICES • FY 2021-22 PROPOSED BUDGET PAGE 286
SA
NIT
AR
Y S
EW
ER
CA
PIT
AL
PR
OJE
CT
LIS
T
FY 2
020
Act
ual
FY 2
021
Bud
get
FY 2
021
Rev
ised
FY 2
022
Proj
ecte
dFY
202
3Pr
ojec
ted
FY 2
024
Proj
ecte
dFY
202
5Pr
ojec
ted
FY 2
026
Proj
ecte
dFY
202
2-20
26Pr
ojec
ted
6905
UTI
LITY
BIL
LIN
G C
USTO
MER
IN
FORM
ATI
ON
SYS
TEM
REP
LAC
EMEN
T$1
06,7
13$4
,515
,000
$2,7
50,0
00$3
,000
,000
$0$0
$0$0
$3,0
00,0
00
7083
AC
CO
UN
TS P
AYA
BLE
AU
TOM
ATI
ON
SO
FTW
ARE
$0$7
5,00
0$7
,200
$0$0
$0$0
$0$0
$106
,713
$4,5
90,0
00$2
,757
,200
$3,0
00,0
00$0
$0$0
$0$3
,000
,000
CAPI
TAL
OU
TLAY
FY 2
021-
22$0
$0$0
$288
,500
$0$0
$0$0
$288
,500
2021
CAPI
TAL
OU
TLAY
FY 2
020-
21$0
$339
,100
$0$0
$0$0
$0$0
$0
$0$3
39,1
00$0
$288
,500
$0$0
$0$0
$288
,500
DIG
ITAL
SO
LUTI
ON
S S
ECU
RIT
Y ASSES
SM
ENT
$0$2
5,00
0$0
$25,
000
$25,
000
$25,
000
$25,
000
$0$1
00,0
00
$0$2
5,00
0$0
$25,
000
$25,
000
$25,
000
$25,
000
$0$1
00,0
00
7027
IT C
OM
MU
NIC
ATI
ON
S A
SSET
LIF
E-C
YCLE
C
OSTS
$83,
700
$100
,000
$0$1
20,0
00$1
00,0
00$1
00,0
00$1
00,0
00$0
$420
,000
7028
IT E
ND
USER
DEV
ICE
ASSET
LIF
E C
YCLE
$6,2
96$6
0,00
0$0
$60,
000
$60,
000
$60,
000
$60,
000
$0$2
40,0
00
7029
IT S
ERVER
ASSET
LIF
E C
YCLE
CO
STS
$93,
847
$100
,000
$0$1
00,0
00$1
00,0
00$1
00,0
00$7
5,00
0$0
$375
,000
7030
IT S
TORAG
E ASSET
LIF
E C
YCLE
CO
STS
$38,
808
$70,
000
$0$7
0,00
0$1
25,0
00$5
0,00
0$5
0,00
0$0
$295
,000
7082
SEC
URIT
Y C
AM
ERA L
IFEC
YCLE
$0$2
5,00
0$0
$25,
000
$25,
000
$25,
000
$25,
000
$0$1
00,0
00
$222
,651
$355
,000
$0$3
75,0
00$4
10,0
00$3
35,0
00$3
10,0
00$0
$1,4
30,0
00
FIBER
OPT
IC O
PPO
RTU
NIT
IES
$0$8
0,00
0$0
$80,
000
$80,
000
$80,
000
$80,
000
$0$3
20,0
00
$0$8
0,00
0$0
$80,
000
$80,
000
$80,
000
$80,
000
$0$3
20,0
00
DU
RH
AM
LIQ
UID
S A
ND
SO
LID
S P
OW
ER
DIS
TRIB
UTI
ON
UPG
RAD
E$0
$575
,000
$0$6
00,0
00$6
50,0
00$9
00,0
00$6
50,0
00$0
$2,8
00,0
00
DU
RH
AM
PLA
NT
RO
AD
REP
AIR
& R
EPLA
CEM
ENT
$0$0
$0$0
$145
,000
$109
,000
$60,
000
$60,
000
$374
,000
7096
DU
RH
AM
CO
GEN
ERATI
ON
& F
OG
SEC
ON
D
POW
ER T
RAN
SFO
RM
ER U
NIT
$0$2
75,0
00$2
5,00
0$3
35,0
00$0
$0$0
$0$3
35,0
00
$0$8
50,0
00$2
5,00
0$9
35,0
00$7
95,0
00$1
,009
,000
$710
,000
$60,
000
$3,5
09,0
00
ABC
2nd
FLO
OR S
PAC
E M
OD
IFIC
ATI
ON
S$0
$0$0
$150
,000
$0$0
$0$0
$150
,000
ABC
HVAC
BO
ILER
REP
LAC
EMEN
T$0
$0$0
$100
,000
$400
,000
$0$0
$0$5
00,0
00
CIP
Inde
xLin
e of
Bus
ines
s: Sa
nita
ryPr
ojec
t Typ
e: C
apita
l
Hom
e Po
rtfo
lio
Act
ive
Pro
ject
s
Bu
sin
ess
Svc
s -
Fin
ance
- B
usi
nes
s A
pp
lica
tio
ns
Bu
sin
ess
Svc
s -
Fin
ance
- F
inan
ce
Dig
ital
Sol
uti
on
s -
Bu
sin
ess
Ap
pli
cati
on
s
Dig
ital
Sol
uti
on
s -
Infr
astr
uct
ure
- R
epla
cem
ent
Dig
ital
Sol
uti
on
s -
Infr
astr
uct
ure
- S
up
por
t
EA
TS
- D
urh
am E
A
EA
TS
- F
acili
ties
EA
FIN
AL
San
i CIP
Ind
ex.x
lsx
Pag
e 1
of 1
6

CLEAN WATER SERVICES • FY 2021-22 PROPOSED BUDGET PAGE 287
FY 2
020
Act
ual
FY 2
021
Bud
get
FY 2
021
Rev
ised
FY 2
022
Proj
ecte
dFY
202
3Pr
ojec
ted
FY 2
024
Proj
ecte
dFY
202
5Pr
ojec
ted
FY 2
026
Proj
ecte
dFY
202
2-20
26Pr
ojec
ted
Hom
e Po
rtfo
lio
ABC
PARKIN
G L
OT
SEC
URIT
Y G
ATE
S$0
$0$0
$125
,000
$0$0
$0$0
$125
,000
FIEL
D O
PERATI
ON
S R
OO
F REP
LAC
EMEN
T$0
$0$0
$50,
000
$200
,000
$0$0
$0$2
50,0
00
4894
CM
MS S
OFT
WARE
PAC
KAG
E$7
5,45
7$5
0,00
0$0
$50,
000
$0$0
$0$0
$50,
000
6956
FAC
ILIT
IES R
EPLA
CEM
ENT
& R
ENEW
AL
$31,
121
$500
,000
$500
,000
$285
,000
$300
,000
$300
,000
$300
,000
$0$1
,185
,000
$106
,578
$550
,000
$500
,000
$760
,000
$900
,000
$300
,000
$300
,000
$0$2
,260
,000
TUALA
TIN
RIV
ER F
ARM
FAC
ILIT
Y U
PGRAD
ES$0
$0$8
5,00
0$2
5,00
0$2
5,00
0$2
5,00
0$2
5,00
0$2
5,00
0$1
25,0
00
6793
ABC
FAC
ILIT
Y U
PGRAD
ES$7
94,0
73$4
65,0
00$3
80,0
00$2
00,0
00$9
05,0
00$7
75,0
00$1
25,0
00$1
25,0
00$2
,130
,000
6809
FIEL
D O
PERATI
ON
S M
ERLO
FAC
ILIT
Y IM
PRO
VEM
ENTS
$3,0
76$2
50,0
00$2
5,00
0$1
50,0
00$7
00,0
00$2
,650
,000
$2,6
25,0
00$0
$6,1
25,0
00
6909
TUALA
TIN
RIV
ER F
ARM
IM
PRO
VEM
ENTS
$625
,630
$0$1
65,0
00$1
00,0
00$1
,000
,000
$7,5
00,0
00$5
5,00
0$0
$8,6
55,0
00
6931
FIEL
D O
PS F
AC
ILIT
Y U
PGRAD
ES$5
0,81
4$1
95,0
00$1
29,0
00$2
05,0
00$1
65,0
00$9
0,00
0$9
0,00
0$9
0,00
0$6
40,0
00
6965
SPR
ING
ER S
TREE
T FA
CIL
ITY
IMPR
OVEM
ENTS
$274
$100
,000
$25,
000
$45,
000
$800
,000
$0$0
$0$8
45,0
00
7018
INN
OVATI
ON
CEN
TER (
TTM
Bui
ldin
g Rem
odel
)$1
24,6
78$0
$400
,000
$800
,000
$12,
300,
000
$11,
250,
000
$250
,000
$6,5
00,0
00$3
1,10
0,00
0
7052
SPR
ING
ER F
AC
ILIT
Y U
PGRAD
ES$0
$25,
000
$51,
000
$55,
000
$25,
000
$25,
000
$25,
000
$25,
000
$155
,000
7053
RES
EARC
H I
NN
OVATI
ON
PARTN
ERS
LABO
RATO
RY
FAC
ILIT
Y U
PGRAD
ES$6
5,76
4$6
0,00
0$3
50,0
00$9
0,00
0$7
5,00
0$7
5,00
0$7
5,00
0$7
5,00
0$3
90,0
00
$1,6
64,3
09$1
,095
,000
$1,6
10,0
00$1
,670
,000
$15,
995,
000
$22,
390,
000
$3,2
70,0
00$6
,840
,000
$50,
165,
000
7031
FORES
T G
RO
VE
REU
SE
& E
LEC
TRIC
AL
CO
MPL
EX P
RO
JEC
T$2
54,0
19$1
,750
,000
$3,3
50,0
00$0
$0$0
$0$0
$0
$254
,019
$1,7
50,0
00$3
,350
,000
$0$0
$0$0
$0$0
HIL
LSBO
RO
ELE
CTR
ICAL
SW
ITC
HG
EAR &
M
OTO
R C
ON
TRO
L C
ENTE
R R
EPLA
CEM
ENT
$0$0
$0$5
00,0
00$2
00,0
00$0
$0$0
$700
,000
$0$0
$0$5
00,0
00$2
00,0
00$0
$0$0
$700
,000
RO
CK C
REE
K C
HEM
ICAL
BU
ILD
ING
MAU
REP
LAC
EMEN
T$0
$0$0
$0$0
$0$2
45,0
00$0
$245
,000
RO
CK C
REE
K M
LR P
UM
P REP
LAC
EMEN
T$0
$40,
000
$0$0
$0$0
$0$0
$0
RO
CK C
REE
K N
aOH
TAN
K R
EPLA
CEM
ENT
$0$0
$0$0
$0$0
$0$0
$0
RO
CK C
REE
K U
PPER
TER
TIARY
SW
ITC
HG
EAR S
REP
LAC
EMEN
T$0
$0$0
$650
,000
$0$0
$0$0
$650
,000
RO
CK C
REE
K W
EST
SID
E PO
WER
D
ISTR
IBU
TIO
N E
XPA
NSIO
N$0
$0$0
$0$0
$0$0
$0$0
7085
RO
CK C
REE
K I
PS V
FD R
EPLA
CEM
ENT
$0$4
00,0
00$5
0,00
0$5
50,0
00$5
50,0
00$5
50,0
00$5
50,0
00$5
50,0
00$2
,750
,000
$0$4
40,0
00$5
0,00
0$1
,200
,000
$550
,000
$550
,000
$795
,000
$550
,000
$3,6
45,0
00
DIG
ITAL
MED
IA D
ATA
BASE
SO
FTW
ARE
$0$5
0,00
0$0
$0$0
$0$0
$0$0
$0$5
0,00
0$0
$0$0
$0$0
$0$0
EA
TS
- F
acili
ties
Man
agem
ent
Pro
ject
s
EA
TS
- F
ores
t G
rove
EA
EA
TS
- H
ills
bor
o E
A
EA
TS
- R
ock
Cre
ek E
A
Gov
ern
men
t &
Pu
bli
c A
ffai
rs -
Bu
sin
ess
Ap
pli
cati
on
s
FIN
AL
San
i CIP
Ind
ex.x
lsx
Pag
e 2
of 1
6

CLEAN WATER SERVICES • FY 2021-22 PROPOSED BUDGET PAGE 288
FY 2
020
Act
ual
FY 2
021
Bud
get
FY 2
021
Rev
ised
FY 2
022
Proj
ecte
dFY
202
3Pr
ojec
ted
FY 2
024
Proj
ecte
dFY
202
5Pr
ojec
ted
FY 2
026
Proj
ecte
dFY
202
2-20
26Pr
ojec
ted
Hom
e Po
rtfo
lio
WEB
SIT
E RED
EVEL
OPM
ENT
$0$0
$0$2
25,0
00$0
$0$0
$0$2
25,0
00
$0$0
$0$2
25,0
00$0
$0$0
$0$2
25,0
00
7105
RIS
K M
AN
AG
EMEN
T SO
FTW
ARE
$0$7
5,00
0$1
50,0
00$0
$0$0
$0$0
$0
$0$7
5,00
0$1
50,0
00$0
$0$0
$0$0
$0
7015
LAB I
NSTR
UM
ENTS
REP
LAC
EMEN
T$0
$123
,000
$0$2
20,5
00$0
$0$0
$0$2
20,5
00
$0$1
23,0
00$0
$220
,500
$0$0
$0$0
$220
,500
JAC
KSO
N B
OTT
OM
- C
OYO
TE H
ILL
WET
LAN
DS
& R
EUSE
IMPR
OVEM
ENTS
$0$0
$0$2
00,0
00$3
00,0
00$3
00,0
00$1
50,0
00$0
$950
,000
6465
Fore
st G
rove
Pro
pert
y En
hanc
emen
ts$1
66,8
73$1
00,0
00$1
00,0
00$1
00,0
00$1
00,0
00$1
00,0
00$1
00,0
00$0
$400
,000
6475
JAC
KSO
N B
OTT
OM
PRO
PERTY
EN
HAN
CEM
ENTS
$159
,693
$0$0
$0$0
$0$0
$0$0
6678
NATU
RAL
SYS
TEM
RES
OU
RC
E PA
RTN
ERSH
IPS
$0$1
25,0
00$0
$250
,000
$250
,000
$250
,000
$250
,000
$0$1
,000
,000
7037
JAC
KSO
N B
OTT
OM
- D
AVIS
TO
OL
WET
LAN
DS &
REU
SE
IMPR
OVEM
ENTS
$50,
097
$70,
000
$70,
000
$150
,000
$70,
000
$70,
000
$70,
000
$0$3
60,0
00
$376
,663
$295
,000
$170
,000
$700
,000
$720
,000
$720
,000
$570
,000
$0$2
,710
,000
6483
LON
G R
AN
GE
WATE
R S
UPP
LY P
LAN
$6,4
53,3
56$2
,360
,500
$533
,000
$1,5
00,0
00$1
,000
,000
$1,0
00,0
00$1
,000
,000
$1,0
00,0
00$5
,500
,000
7060
LAKE
OSW
EGO
CO
RP
STO
RED
WATE
R$0
$0$0
$0$0
$0$0
$0$0
$6,4
53,3
56$2
,360
,500
$533
,000
$1,5
00,0
00$1
,000
,000
$1,0
00,0
00$1
,000
,000
$1,0
00,0
00$5
,500
,000
GALE
S C
REE
K -
BALM
GRO
VE
RES
TORATI
ON
$0$0
$0$7
5,00
0$6
35,0
00$4
35,0
00$2
5,00
0$2
5,00
0$1
,195
,000
NATU
RAL
SYS
TEM
IM
PRO
VEM
ENTS
- S
AN
I$0
$250
,000
$0$1
00,0
00$1
00,0
00$1
00,0
00$1
00,0
00$0
$400
,000
TUALA
TIN
RIV
ER F
LOO
DPL
AIN
RES
TORATI
ON
$0$0
$0$1
00,0
00$0
$0$0
$0$1
00,0
00
4943
WET
LAN
D M
ITIG
ATI
ON
MO
NIT
ORIN
G
(SAN
ITARY)
$37,
459
$307
,000
$185
,000
$167
,200
$123
,200
$83,
600
$55,
000
$0$4
29,0
00
6529
NATU
RAL
SYS
TEM
REG
ION
AL
SER
VIC
ES$4
73,1
99$6
00,0
00$7
00,0
00$6
52,3
00$3
75,6
50$3
49,2
50$2
26,6
00$0
$1,6
03,8
00
6530
CO
LLABO
RATI
VE
REG
ION
AL
RES
TORATI
ON
$842
,813
$831
,000
$715
,000
$610
,000
$731
,500
$561
,000
$215
,700
$126
,500
$2,2
44,7
00
6555
SPR
ING
VIL
LE T
RIB
, RO
CK C
REE
K -
185
TH T
O
KAIS
ER -
SAN
I$3
5,55
0$3
5,00
0$3
5,00
0$6
0,00
0$5
5,00
0$5
5,00
0$5
5,00
0$0
$225
,000
6683
RES
TORATI
ON
MAN
AG
EMEN
T SYS
TEM
S$1
41,1
11$2
50,0
00$2
50,0
00$7
5,00
0$0
$0$0
$0$7
5,00
0
6855
LOC
AL
RES
TORATI
ON
PARTN
ERSH
IPS
$814
,722
$1,4
00,0
00$1
,650
,000
$832
,700
$531
,300
$449
,900
$348
,700
$102
,300
$2,2
64,9
00
6856
TUALA
TIN
RIV
ER R
EFU
GE
RES
TORATI
ON
$1,0
48,2
25$1
,370
,000
$695
,000
$1,5
09,2
00$2
56,3
00$2
14,5
00$1
98,0
00$1
70,5
00$2
,348
,500
6864
WAPA
TO L
AKE
REF
UG
E RES
TORATI
ON
$286
,994
$460
,000
$0$5
50,0
00$4
60,0
00$4
30,0
00$4
30,0
00$0
$1,8
70,0
00
7033
CO
LLABO
RATI
VE
RES
TORATI
ON
PH
ASE
2$1
51,4
13$1
45,0
00$2
38,1
00$2
78,3
00$2
18,3
50$2
26,0
50$8
3,60
0$4
9,50
0$8
55,8
00
Gov
ern
men
t &
Pu
bli
c A
ffai
rs -
Off
ice
of
the
CE
O
Hu
man
Res
ourc
es -
Bu
sin
ess
Ap
pli
cati
on
s
Lab
orat
ory
- R
egu
lato
ry A
ffai
rs
NS
ES
- C
WS
Pro
per
ty I
mp
rove
men
ts
NS
ES
- F
low
Res
tora
tio
n a
nd
Reu
se
NS
ES
- N
SES
En
han
cem
ent
FIN
AL
San
i CIP
Ind
ex.x
lsx
Pag
e 3
of 1
6
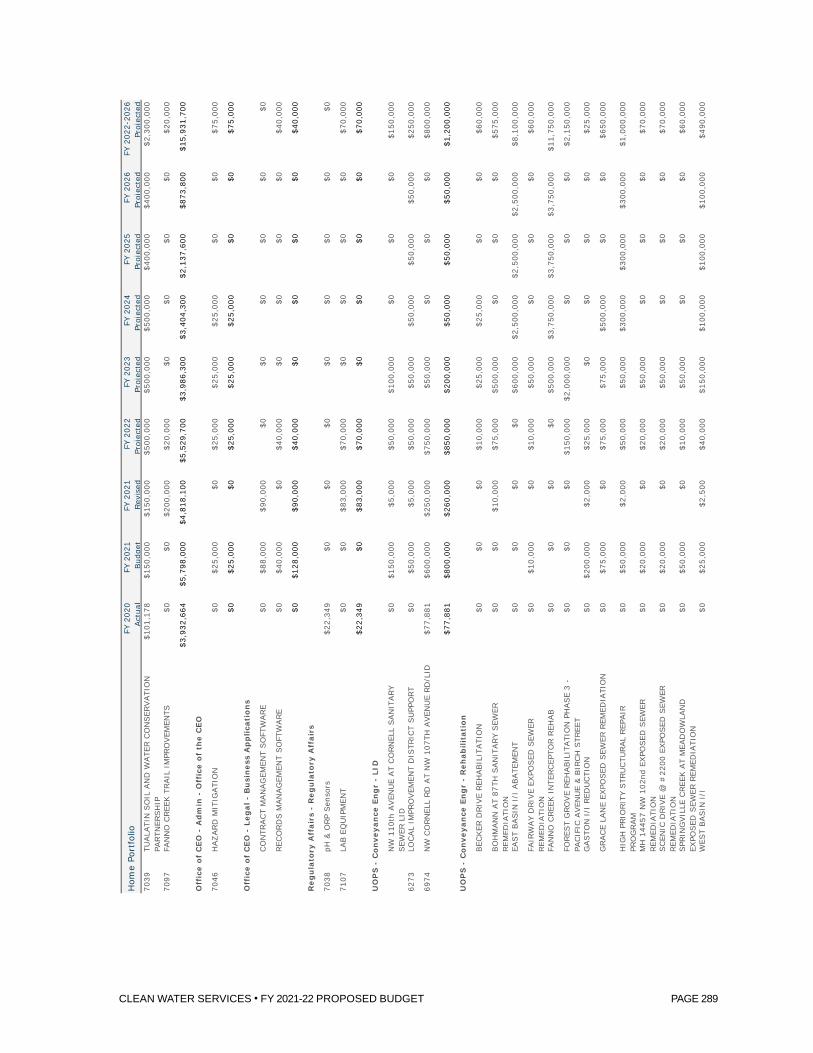
CLEAN WATER SERVICES • FY 2021-22 PROPOSED BUDGET PAGE 289
FY 2
020
Act
ual
FY 2
021
Bud
get
FY 2
021
Rev
ised
FY 2
022
Proj
ecte
dFY
202
3Pr
ojec
ted
FY 2
024
Proj
ecte
dFY
202
5Pr
ojec
ted
FY 2
026
Proj
ecte
dFY
202
2-20
26Pr
ojec
ted
Hom
e Po
rtfo
lio
7039
TUALA
TIN
SO
IL A
ND
WATE
R C
ON
SER
VATI
ON
PA
RTN
ERSH
IP$1
01,1
78$1
50,0
00$1
50,0
00$5
00,0
00$5
00,0
00$5
00,0
00$4
00,0
00$4
00,0
00$2
,300
,000
7097
FAN
NO
CREE
K T
RAIL
IM
PRO
VEM
ENTS
$0$0
$200
,000
$20,
000
$0$0
$0$0
$20,
000
$3,9
32,6
64$5
,798
,000
$4,8
18,1
00$5
,529
,700
$3,9
86,3
00$3
,404
,300
$2,1
37,6
00$8
73,8
00$1
5,93
1,70
0
7046
HAZARD
MIT
IGATI
ON
$0$2
5,00
0$0
$25,
000
$25,
000
$25,
000
$0$0
$75,
000
$0$2
5,00
0$0
$25,
000
$25,
000
$25,
000
$0$0
$75,
000
CO
NTR
AC
T M
AN
AG
EMEN
T SO
FTW
ARE
$0$8
8,00
0$9
0,00
0$0
$0$0
$0$0
$0
REC
ORD
S M
AN
AG
EMEN
T SO
FTW
ARE
$0$4
0,00
0$0
$40,
000
$0$0
$0$0
$40,
000
$0$1
28,0
00$9
0,00
0$4
0,00
0$0
$0$0
$0$4
0,00
0
7038
pH &
ORP
Sen
sors
$22,
349
$0$0
$0$0
$0$0
$0$0
7107
LAB E
QU
IPM
ENT
$0$0
$83,
000
$70,
000
$0$0
$0$0
$70,
000
$22,
349
$0$8
3,00
0$7
0,00
0$0
$0$0
$0$7
0,00
0
NW
110
th A
VEN
UE
AT
CO
RN
ELL
SAN
ITARY
SEW
ER L
ID$0
$150
,000
$5,0
00$5
0,00
0$1
00,0
00$0
$0$0
$150
,000
6273
LOC
AL
IMPR
OVEM
ENT
DIS
TRIC
T SU
PPO
RT
$0$5
0,00
0$5
,000
$50,
000
$50,
000
$50,
000
$50,
000
$50,
000
$250
,000
6974
NW
CO
RN
ELL
RD
AT
NW
107
TH A
VEN
UE
RD
/LID
$77,
881
$600
,000
$250
,000
$750
,000
$50,
000
$0$0
$0$8
00,0
00
$77,
881
$800
,000
$260
,000
$850
,000
$200
,000
$50,
000
$50,
000
$50,
000
$1,2
00,0
00
BEC
KER
DRIV
E REH
ABIL
ITATI
ON
$0$0
$0$1
0,00
0$2
5,00
0$2
5,00
0$0
$0$6
0,00
0
BO
HM
AN
N A
T 87
TH S
AN
ITARY
SEW
ER
REM
EDIA
TIO
N$0
$0$1
0,00
0$7
5,00
0$5
00,0
00$0
$0$0
$575
,000
EAST
BASIN
I/I
ABATE
MEN
T$0
$0$0
$0$6
00,0
00$2
,500
,000
$2,5
00,0
00$2
,500
,000
$8,1
00,0
00
FAIR
WAY
DRIV
E EX
POSED
SEW
ER
REM
EDIA
TIO
N$0
$10,
000
$0$1
0,00
0$5
0,00
0$0
$0$0
$60,
000
FAN
NO
CREE
K I
NTE
RC
EPTO
R R
EHAB
$0$0
$0$0
$500
,000
$3,7
50,0
00$3
,750
,000
$3,7
50,0
00$1
1,75
0,00
0
FORES
T G
RO
VE
REH
ABIL
ITATI
ON
PH
ASE
3 -
PAC
IFIC
AVEN
UE
& B
IRC
H S
TREE
T$0
$0$0
$150
,000
$2,0
00,0
00$0
$0$0
$2,1
50,0
00
GASTO
N I
/I R
EDU
CTI
ON
$0$2
00,0
00$2
,000
$25,
000
$0$0
$0$0
$25,
000
GRAC
E LA
NE
EXPO
SED
SEW
ER R
EMED
IATI
ON
$0$7
5,00
0$0
$75,
000
$75,
000
$500
,000
$0$0
$650
,000
HIG
H P
RIO
RIT
Y STR
UC
TURAL
REP
AIR
PR
OG
RAM
$0$5
0,00
0$2
,000
$50,
000
$50,
000
$300
,000
$300
,000
$300
,000
$1,0
00,0
00
MH
144
57 N
W 1
02nd
EXPO
SED
SEW
ER
REM
EDIA
TIO
N$0
$20,
000
$0$2
0,00
0$5
0,00
0$0
$0$0
$70,
000
SC
ENIC
DRIV
E @
#22
00 E
XPO
SED
SEW
ER
REM
EDIA
TIO
N$0
$20,
000
$0$2
0,00
0$5
0,00
0$0
$0$0
$70,
000
SPR
ING
VIL
LE C
REE
K A
T M
EAD
OW
LAN
D
EXPO
SED
SEW
ER R
EMED
IATI
ON
$0$5
0,00
0$0
$10,
000
$50,
000
$0$0
$0$6
0,00
0
WES
T BASIN
I/I
$0$2
5,00
0$2
,500
$40,
000
$150
,000
$100
,000
$100
,000
$100
,000
$490
,000
Off
ice
of
CE
O -
Ad
min
- O
ffic
e o
f th
e C
EO
Off
ice
of
CE
O -
Leg
al -
Bu
sin
ess
Ap
pli
cati
on
s
Reg
ula
tory
Aff
airs
- R
egu
lato
ry A
ffai
rs
UO
PS
- C
on
veya
nce
En
gr
- LI
D
UO
PS
- C
on
veya
nce
En
gr
- R
ehab
ilit
atio
n
FIN
AL
San
i CIP
Ind
ex.x
lsx
Pag
e 4
of 1
6

CLEAN WATER SERVICES • FY 2021-22 PROPOSED BUDGET PAGE 290
FY 2
020
Act
ual
FY 2
021
Bud
get
FY 2
021
Rev
ised
FY 2
022
Proj
ecte
dFY
202
3Pr
ojec
ted
FY 2
024
Proj
ecte
dFY
202
5Pr
ojec
ted
FY 2
026
Proj
ecte
dFY
202
2-20
26Pr
ojec
ted
Hom
e Po
rtfo
lio
6298
LARG
E TR
UN
KLI
NE
I/I
$1,8
07$0
$0$1
00,0
00$1
00,0
00$1
00,0
00$1
00,0
00$1
00,0
00$5
00,0
00
6332
REH
ABIL
ITATI
ON
MASTE
R P
LAN
NIN
G$7
0,18
2$0
$45,
000
$70,
000
$70,
000
$70,
000
$70,
000
$70,
000
$350
,000
6653
EXPO
SED
LATE
RALS
PRO
GRAM
$57,
517
$20,
000
$10,
000
$70,
000
$155
,000
$430
,000
$760
,000
$640
,000
$2,0
55,0
00
6767
BRO
AD
MO
OR S
AN
ITARY
SEW
ER R
EPLA
CEM
ENT
$272
,155
$250
,000
$100
,000
$250
,000
$0$0
$0$0
$250
,000
6918
ALO
HA I
/I$0
$0$0
$5,0
00$0
$0$0
$0$5
,000
6977
CAN
YON
CREE
K S
EWER
IM
PRO
VEM
ENTS
$2,0
81$0
$0$0
$50,
000
$210
,000
$0$0
$260
,000
6981
MO
NTC
LAIR
AREA
SEW
ER R
EPAIR
$566
$50,
000
$10,
000
$20,
000
$350
,000
$1,0
00,0
00$0
$0$1
,370
,000
6982
GARD
EN H
OM
E SEW
ER R
EHABIL
ITATI
ON
PH
ASE
2$5
,292
$675
,000
$165
,000
$600
,000
$0$0
$0$0
$600
,000
6994
RYA
N S
TREE
T SW
ALE
EXPO
SED
SEW
ER$4
9,79
7$1
20,0
00$5
,000
$115
,000
$0$0
$0$0
$115
,000
7041
B S
TREE
T PU
MP
STA
TIO
N I
&I
ABATE
MEN
T$4
4,66
1$1
5,00
0$1
,000
$2,5
00$0
$0$0
$0$2
,500
7048
CED
AR H
ILLS
REH
ABIL
ITATI
ON
PH
ASE
3$1
9,08
1$1
,525
,000
$150
,000
$570
,000
$1,0
00,0
00$0
$0$0
$1,5
70,0
00
7049
MAIN
AN
D 2
3rd
I/I
REH
AB
$16,
735
$750
,000
$75,
000
$750
,000
$0$0
$0$0
$750
,000
$539
,874
$3,8
55,0
00$5
77,5
00$3
,037
,500
$5,8
25,0
00$8
,985
,000
$7,5
80,0
00$7
,460
,000
$32,
887,
500
192n
d AVE
SAN
ITARY
SEW
ER U
PGRAD
E$0
$0$0
$0$0
$0$0
$0$0
BARN
ES R
OAD
SAN
ITARY
UPG
RAD
E$0
$0$0
$0$0
$0$0
$0$0
BEA
VER
TON
TRU
NK S
AN
ITARY
UPG
RAD
E$0
$250
,000
$0$2
50,0
00$3
50,0
00$0
$0$0
$600
,000
BU
TTER
NU
T C
REE
K S
CH
OO
L SAN
ITARY
UPG
RAD
E$0
$0$0
$0$0
$0$0
$0$0
CABER
NET
STR
EET
SAN
ITARY
UPG
RAD
E$0
$0$0
$0$0
$0$0
$0$0
CRO
SS C
REE
K T
RU
NK S
OU
TH R
-140
$0$0
$0$0
$170
,000
$500
,000
$1,5
00,0
00$0
$2,1
70,0
00
DEV
ELO
PMEN
T REL
ATE
D P
RO
JEC
TS$0
$1,5
08,0
00$8
00,0
00$3
,000
,000
$3,0
00,0
00$3
,000
,000
$3,0
00,0
00$3
,000
,000
$15,
000,
000
DIS
TRIC
T SH
ARE
OF
CIT
Y PR
OJE
CTS
$4,3
27,5
91$4
,097
,000
$5,5
00,0
00$3
,000
,000
$3,0
00,0
00$3
,000
,000
$3,0
00,0
00$3
,000
,000
$15,
000,
000
FAIR
FIEL
D S
T SAN
ITARY
UPG
RAD
E$0
$0$0
$0$0
$0$0
$0$0
FOO
THIL
L D
R (
CO
MM
ON
WEA
LTH
LAKE)
SAN
ITARY
UPG
RAD
E$0
$0$0
$0$1
50,0
00$0
$0$0
$150
,000
HEL
VET
IA P
UM
P STA
TIO
N G
RAVIT
Y SEW
ER
EXTE
NSIO
N$0
$0$0
$0$0
$0$0
$0$0
ICM
-TEC
H I
MPR
OVEM
ENTS
$0$0
$0$1
00,0
00$0
$0$0
$0$1
00,0
00
KIN
G C
ITY
AN
NEX
ATI
ON
AREA
E-W
TRU
NK
$0$0
$0$1
50,0
00$0
$0$0
$0$1
50,0
00
LARG
E D
IAM
ETER
CO
NVEY
AN
CE
CAPA
CIT
Y U
PGRAD
ES$0
$0$0
$0$1
,000
,000
$2,0
00,0
00$5
,000
,000
$10,
000,
000
$18,
000,
000
MET
ZG
ER/F
AN
NO
IN
TERC
EPTO
R U
ND
ER R
RX (
D-
340)
$0$0
$0$0
$500
,000
$4,0
00,0
00$1
,800
,000
$0$6
,300
,000
RO
CK C
REE
K -
REL
OC
ATI
ON
AT
BET
HAN
Y LA
KE
$0$0
$0$0
$40,
000
$400
,000
$0$0
$440
,000
SAN
ITARY
AD
JUSTM
ENTS
FO
R H
IGH
WAY
217
WID
ENIN
G$0
$0$0
$75,
000
$0$0
$0$0
$75,
000
SH
AW
ST
& 1
98th
SAN
ITARY
UPG
RAD
E$0
$0$0
$0$0
$0$0
$0$0
SH
ERW
OO
D T
RU
NK I
MPR
OVEM
ENTS
- S
OU
TH
OF
WASH
ING
TON
ST
$0$0
$0$0
$0$0
$0$2
50,0
00$2
50,0
00
UO
PS
- C
on
veya
nce
En
gr
- S
anit
ary
Co
llec
tio
n S
yste
m
FIN
AL
San
i CIP
Ind
ex.x
lsx
Pag
e 5
of 1
6

CLEAN WATER SERVICES • FY 2021-22 PROPOSED BUDGET PAGE 291
FY 2
020
Act
ual
FY 2
021
Bud
get
FY 2
021
Rev
ised
FY 2
022
Proj
ecte
dFY
202
3Pr
ojec
ted
FY 2
024
Proj
ecte
dFY
202
5Pr
ojec
ted
FY 2
026
Proj
ecte
dFY
202
2-20
26Pr
ojec
ted
Hom
e Po
rtfo
lio
SH
ERW
OO
D T
RU
NK I
MPR
OVEM
ENTS
-RO
Y RO
GER
S R
D T
O W
ASH
ING
TON
ST
$0$0
$0$0
$0$0
$0$5
00,0
00$5
00,0
00
SO
UTH
CO
OPE
R M
OU
NTA
IN S
AN
ITARY
MASTE
R
PLAN
PH
ASES
2&
3$0
$0$0
$0$0
$0$0
$0$0
WASH
ING
TON
STR
EET
SAN
ITARY
UPG
RAD
E$0
$0$0
$0$0
$0$0
$0$0
WES
T U
NIO
N S
AN
ITARY
UPG
RAD
E$0
$0$0
$0$0
$0$0
$0$0
6283
UTI
LITY
REL
OC
ATI
ON
$14,
084
$75,
000
$0$7
5,00
0$7
5,00
0$7
5,00
0$7
5,00
0$7
5,00
0$3
75,0
00
6399
LOC
AL
SAN
ITARY
SEW
ER U
PGRAD
ES$1
5,20
0$2
5,00
0$5
,000
$100
,000
$100
,000
$100
,000
$100
,000
$100
,000
$500
,000
6656
SYS
TEM
CAPA
CIT
Y ASSES
SM
ENTS
$33,
668
$350
,000
$15,
000
$0$0
$0$0
$0$0
6763
SAN
ITARY
SEW
ER M
ASTE
R P
LAN
S F
OR
EXPA
NSIO
N A
REA
S$1
1,05
7$1
10,0
00$0
$10,
000
$10,
000
$10,
000
$10,
000
$10,
000
$50,
000
6804
NW
185
TH S
EWER
EXTE
NSIO
N A
T SPR
ING
VIL
LE
RO
AD
$19,
744
$0$0
$0$0
$0$0
$0$0
6826
CED
AR M
ILL
TRU
NK R
ELO
CATI
ON
AT
MU
RRAY/
WALK
ER$2
,218
,634
$655
,000
$200
,000
$485
,000
$0$0
$0$0
$485
,000
6828
FOO
THIL
LS P
ARK S
EWER
IM
PRO
VEM
ENTS
$38,
883
$90,
000
$120
,000
$0$0
$0$0
$0$0
6882
CED
AR M
ILL
TRU
NK U
PGRAD
E JE
NKIN
S T
O
BEA
VER
TON
IN
TERC
EPTO
R$9
41,5
55$2
,500
,000
$2,0
00,0
00$8
,000
,000
$5,0
00,0
00$1
00,0
00$0
$0$1
3,10
0,00
0
6922
HALL
BLV
D L
ATE
RAL
(R-1
10)
$0$1
,813
,000
$1,8
13,0
00$1
,429
,000
$0$0
$0$0
$1,4
29,0
00
6924
1911
/193
6 AN
D T
URN
ER C
REE
K S
AN
ITARY
SEW
ER I
/I A
BATE
MEN
T$0
$385
,000
$690
,000
$0$0
$0$0
$0$0
6966
BRO
OKM
AN
TRU
NK S
EWER
EXTE
NSIO
N$3
30,6
87$1
,100
,000
$45,
000
$700
,000
$1,2
50,0
00$5
,150
,000
$5,0
50,0
00$0
$12,
150,
000
6985
NO
RTH
HIL
LSBO
RO
IN
DU
STR
IAL
WEI
BEL
C
REE
K G
RAVIT
Y$3
58,9
25$5
,000
$0$2
5,00
0$5
0,00
0$5
00,0
00$0
$0$5
75,0
00
6993
SW
198
th A
VEN
UE
SAN
ITARY
SEW
ER
REL
OC
ATI
ON
$0$0
$0$0
$0$0
$0$0
$0
6996
MID
DLE
BRO
OK-B
RO
OKM
AN
SEW
ER E
XTE
NSIO
N$5
,687
$1,0
00,0
00$3
50,0
00$5
00,0
00$0
$0$0
$0$5
00,0
00
7009
DAW
SO
N T
RU
NK S
ITE
D C
ON
NEC
TIO
N$4
,492
$10,
000
$7,5
00$5
0,00
0$5
50,0
00$0
$0$0
$600
,000
7023
UPP
ER T
UALA
TIN
IN
TERC
EPTO
R C
APA
CIT
Y IM
PRO
VEM
ENTS
AT
99W
$219
,979
$300
,000
$150
,000
$1,6
25,0
00$0
$0$0
$0$1
,625
,000
7032
BRIG
HTO
N P
UM
P STA
TIO
N D
ECO
MM
ISSIO
NIN
G$1
8,48
3$0
$0$0
$150
,000
$125
,000
$0$0
$275
,000
7035
WAIB
LE C
REE
K S
EWER
EXTE
NSIO
N$6
15,6
02$5
00,0
00$3
07,5
00$0
$0$0
$0$0
$0
7059
RO
CK C
REE
K T
RU
NK P
HASE
1$0
$0$5
85,0
00$0
$0$0
$0$0
$0
7063
SW
MM
TO
IC
M S
AN
ITARY
SEW
ER M
OD
EL
CO
NVER
SIO
N$0
$200
,000
$0$0
$0$0
$0$0
$0
7067
NYB
ERG
SAN
I TR
UN
K R
EHAB
$0$0
$225
,000
$311
,000
$0$0
$0$0
$311
,000
7068
WATS
ON
AN
D M
ILLI
KAN
SAN
ITARY
IMPR
OVEM
ENTS
$0$0
$5,0
00$4
10,0
00$0
$0$0
$0$4
10,0
00
7069
SW
105
TH A
VEN
UE
SAN
ITARY
SEW
ER
UPS
IZIN
G$0
$0$0
$90,
000
$0$0
$0$0
$90,
000
7104
BEN
DEM
EER T
RU
NK S
EWER
UPG
RAD
E$0
$0$5
0,00
0$0
$0$0
$0$0
$0
7106
MARTI
NAZZI
SAN
ITARY
SEW
ER U
PSIZ
ING
PH
ASE
1$0
$0$2
15,0
00$6
26,8
00$0
$0$0
$0$6
26,8
00
$9,1
74,2
71$1
4,97
3,00
0$1
3,08
3,00
0$2
1,01
1,80
0$1
5,39
5,00
0$1
8,96
0,00
0$1
9,53
5,00
0$1
6,93
5,00
0$9
1,83
6,80
0
7081
SEW
ER S
URVEI
LLAN
CE
LAB
$0$0
$0$0
$0$0
$0$0
$0
UO
PS
- F
acili
ties
Man
agem
ent
- C
WS
Pro
per
ty I
mp
rove
men
ts
FIN
AL
San
i CIP
Ind
ex.x
lsx
Pag
e 6
of 1
6

CLEAN WATER SERVICES • FY 2021-22 PROPOSED BUDGET PAGE 292
FY 2
020
Act
ual
FY 2
021
Bud
get
FY 2
021
Rev
ised
FY 2
022
Proj
ecte
dFY
202
3Pr
ojec
ted
FY 2
024
Proj
ecte
dFY
202
5Pr
ojec
ted
FY 2
026
Proj
ecte
dFY
202
2-20
26Pr
ojec
ted
Hom
e Po
rtfo
lio
$0$0
$0$0
$0$0
$0$0
$0
CO
NVEY
AN
CE
STR
UC
TURES
FALL
PRO
TEC
TIO
N
IMPR
OVEM
ENTS
$0$0
$0$5
5,00
0$0
$0$0
$0$5
5,00
0
FIEL
D O
PERATI
ON
S E
QU
IPM
ENT
REP
LAC
EMEN
TS$0
$287
,000
$58,
000
$200
,000
$0$6
0,00
0$0
$0$2
60,0
00
FIEL
D O
PERATI
ON
S S
AFE
TY E
QU
IPM
ENT
$0$0
$0$7
0,00
0$0
$0$0
$0$7
0,00
0
UO
PS A
SSET
MAN
AG
EMEN
T STU
DY
$0$0
$0$1
00,0
00$5
0,00
0$0
$0$0
$150
,000
6377
FLO
W M
ON
ITO
RIN
G E
QU
IPM
ENT
REN
EWAL
PRO
GRAM
$94,
245
$110
,000
$110
,000
$110
,000
$110
,000
$110
,000
$120
,000
$120
,000
$570
,000
6777
RO
OT
LIST
RED
UC
TIO
N$0
$120
,000
$60,
000
$120
,000
$120
,000
$120
,000
$120
,000
$120
,000
$600
,000
7042
MATE
RIA
L PR
OC
ESSIN
G Y
ARD
PH
ASE
2$2
24,7
12$5
5,00
0$2
0,00
0$5
5,00
0$0
$0$0
$0$5
5,00
0
7062
TV H
WY
SAN
ITARY
SEW
ER R
EHABIL
ITATI
ON
$232
$20,
000
$29,
000
$0$0
$0$0
$0$0
7086
CO
MM
UN
ICATI
ON
MO
DER
NIZ
ATI
ON
AN
D
UPG
RAD
ES$0
$65,
000
$79,
000
$190
,000
$65,
000
$0$0
$0$2
55,0
00
$319
,189
$657
,000
$356
,000
$900
,000
$345
,000
$290
,000
$240
,000
$240
,000
$2,0
15,0
00
6221
SAN
ITARY
LIG
HT
& M
EDIU
M D
UTY
VEH
ICLE
AD
DIT
ION
S$3
3,91
3$2
7,50
0$0
$27,
500
$0$0
$0$0
$27,
500
6303
SAN
ITARY
HEA
VY
DU
TY T
RU
CK/E
QU
IPM
ENT
AD
DIT
ION
S$3
9,90
2$0
$0$0
$0$0
$0$0
$0
$73,
815
$27,
500
$0$2
7,50
0$0
$0$0
$0$2
7,50
0
6840
SAN
ITARY
LIG
HT
& M
EDIU
M D
UTY
VEH
ICLE
REP
LAC
EMEN
T$1
94,2
75$2
21,5
00$1
45,0
00$3
36,0
00$3
35,0
00$2
71,0
00$2
82,8
00$3
23,5
00$1
,548
,300
6841
SAN
ITARY
HEA
VY
DU
TY V
EHIC
LE
REP
LAC
EMEN
T$1
,142
,662
$594
,000
$620
,000
$650
,000
$790
,000
$642
,000
$699
,500
$232
,500
$3,0
14,0
00
$1,3
36,9
37$8
15,5
00$7
65,0
00$9
86,0
00$1
,125
,000
$913
,000
$982
,300
$556
,000
$4,5
62,3
00
CM
MS M
IGRATI
ON
$0$0
$0$0
$0$0
$0$0
$0
CO
NSTR
UC
TIO
N M
AN
AG
EMEN
T SO
FTW
ARE
$0$4
0,00
0$0
$0$0
$0$0
$0$0
$0$4
0,00
0$0
$0$0
$0$0
$0$0
FORES
T G
RO
VE
WES
T AG
LAN
DS
DEV
ELO
PMEN
T$0
$0$0
$220
,000
$230
,000
$750
,000
$750
,000
$1,0
00,0
00$2
,950
,000
$0$0
$0$2
20,0
00$2
30,0
00$7
50,0
00$7
50,0
00$1
,000
,000
$2,9
50,0
00
DU
RH
AM
CH
EM L
AB H
VAC
REP
LAC
MEN
T$0
$0$0
$125
,000
$0$0
$0$0
$125
,000
DU
RH
AM
FU
ND
106
UM
BREL
LA -
MU
LTI-
DIS
CIP
LIN
ARY
$0$0
$0$5
00,0
00$3
50,0
00$3
50,0
00$3
50,0
00$3
50,0
00$1
,900
,000
DU
RH
AM
IPS
HVAC
REP
AIR
S$0
$0$0
$250
,000
$0$0
$0$0
$250
,000
DU
RH
AM
IPS
MV V
FD 1
- C
ON
TRO
L U
PGRAD
E$0
$0$0
$50,
000
$0$0
$0$0
$50,
000
DU
RH
AM
LIQ
UID
S C
ON
TRO
L BU
ILD
ING
U
PGRAD
E$0
$0$0
$0$2
25,0
00$0
$0$0
$225
,000
UO
PS
- F
ield
Op
s -
Fiel
d O
per
atio
ns
UO
PS
- F
ield
Op
s -
Flee
t
UO
PS
- F
ield
Op
s -
Rep
lace
men
t an
d R
enew
al (
Flee
t)
WR
RD
- B
usi
nes
s A
pp
lica
tio
ns
WR
RD
- C
WS
Pro
per
ty I
mp
rove
men
ts
WR
RD
- D
urh
am
FIN
AL
San
i CIP
Ind
ex.x
lsx
Pag
e 7
of 1
6

CLEAN WATER SERVICES • FY 2021-22 PROPOSED BUDGET PAGE 293
FY 2
020
Act
ual
FY 2
021
Bud
get
FY 2
021
Rev
ised
FY 2
022
Proj
ecte
dFY
202
3Pr
ojec
ted
FY 2
024
Proj
ecte
dFY
202
5Pr
ojec
ted
FY 2
026
Proj
ecte
dFY
202
2-20
26Pr
ojec
ted
Hom
e Po
rtfo
lio
DU
RH
AM
OD
OR C
ON
TRO
L PH
ASE
3$0
$0$0
$250
,000
$1,2
50,0
00$1
,000
,000
$0$0
$2,5
00,0
00
DU
RH
AM
PH
ASE
6B -
New
Dig
este
r$0
$0$0
$0$0
$1,0
00,0
00$4
,950
,000
$4,9
50,0
00$1
0,90
0,00
0
DU
RH
AM
PRIM
ARY
SLU
DG
E PS
REH
AB
$0$0
$0$1
00,0
00$1
,100
,000
$0$0
$0$1
,200
,000
DU
RH
AM
RAS P
UM
P VALV
ES A
ND
PIP
ING
REP
LAC
EMEN
T$0
$0$0
$220
,000
$0$0
$0$0
$220
,000
DU
RH
AM
REP
LAC
E BAC
K-U
P AIR
CO
MPR
ESSO
R$0
$0$0
$85,
000
$0$0
$0$0
$85,
000
DU
RH
AM
REP
LAC
E H
EAD
WO
RKS M
AKE
UP
AIR
U
NIT
S$0
$0$0
$135
,000
$0$0
$0$0
$135
,000
DU
RH
AM
SLU
DG
E SC
REE
NIN
G$0
$0$0
$0$2
00,0
00$1
,500
,000
$0$0
$1,7
00,0
00
DU
RH
AM
SO
LID
S B
UIL
DIN
G P
OLY
MER
REH
AB
$0$1
50,0
00$0
$0$0
$0$0
$0$0
DU
RH
AM
SO
LID
S B
UIL
DIN
G U
PPER
DRAIN
REP
AIR
$0$0
$0$1
00,0
00$0
$0$0
$0$1
00,0
00
DU
RH
AM
TH
IRD
BO
ILER
AT
DC
-2$0
$0$0
$0$0
$175
,000
$0$0
$175
,000
DU
RH
AM
UN
ISO
N B
AC
K-U
P C
HIL
LER
$0$0
$0$1
50,0
00$0
$0$0
$0$1
50,0
00
DU
RH
AM
WAREH
OU
SIN
G &
LO
GIS
TIC
AL
SU
PPO
RT
BU
ILD
ING
$0$0
$0$1
50,0
00$0
$0$0
$0$1
50,0
00
DU
RH
AM
WO
MEN
S L
OC
KER
RO
OM
IM
PRO
VEM
ENTS
$0$0
$0$2
00,0
00$0
$0$0
$0$2
00,0
00
6368
DU
RH
AM
MIS
CEL
LAN
EOU
S U
PGRAD
ES$4
63,0
64$2
00,0
00$2
80,0
00$3
00,0
00$2
50,0
00$2
50,0
00$2
50,0
00$0
$1,0
50,0
00
6687
DU
RH
AM
O&
M B
UIL
DIN
G R
EMO
DEL
/REH
AB
$194
,863
$0$0
$0$0
$0$0
$0$0
6757
DU
RH
AM
PH
ASE
5B3
- Sec
onda
ry C
apac
ity
Expa
nsio
n$1
2,60
7,25
3$6
,000
,000
$7,7
07,0
00$0
$0$0
$0$0
$0
6788
DU
RH
AM
PH
ASE
5A2
- TP
S B
uild
ing
Reh
ab$4
9,92
3$0
$0$0
$0$0
$0$0
$0
6789
DU
RH
AM
PH
ASE
5C -
Ter
tiary
Cla
rific
atio
n Im
prov
emen
ts$2
3,83
8$1
00,0
00$0
$0$0
$0$6
00,0
00$6
,325
,000
$6,9
25,0
00
6834
DU
RH
AM
PH
ASE
6 -
Ferm
ente
r/W
AS
stor
age/
mis
c.$3
90,2
36$0
$295
,000
$750
,000
$10,
000,
000
$0$0
$0$1
0,75
0,00
0
6844
DU
RH
AM
EN
GIN
E REB
UIL
D$1
60,7
56$1
75,0
00$1
75,0
00$1
75,0
00$1
75,0
00$1
,500
,000
$0$0
$1,8
50,0
00
6893
DU
RH
AM
PH
ASE
6C -
Slu
dge
Dew
ater
ing
Rep
lace
men
t/Reb
uild
$242
,425
$130
,000
$0$1
30,0
00$0
$0$0
$0$1
30,0
00
6919
DU
RH
AM
DIG
ESTE
R G
AS S
YSTE
M
IMPR
OVEM
ENTS
$362
,156
$0$3
99$0
$0$0
$0$0
$0
6941
DU
RH
AM
OSTA
RA D
RYE
R R
EPLA
CEM
ENT
&
HVAC
IM
PRO
VEM
ENTS
$467
,614
$370
,000
$605
,000
$0$0
$0$0
$0$0
6946
DU
RH
AM
BAC
KW
ASH
PU
MPI
NG
M
OD
IFIC
ATI
ON
S$1
0,47
3$8
25,0
00$5
20,0
00$5
82,0
00$0
$0$0
$0$5
82,0
00
6980
DU
RH
AM
LIM
E SYS
TEM
MO
DIF
ICATI
ON
S$3
13,7
66$2
,000
,000
$1,5
06,0
00$1
,000
,000
$0$0
$0$0
$1,0
00,0
00
6992
DU
RH
AM
FO
G T
AN
K R
ETRO
FIT
$265
,473
$1,0
00,0
00$1
,650
,000
$1,5
50,0
00$0
$0$0
$0$1
,550
,000
7017
DU
RH
AM
FAC
ILIT
Y PL
AN
$370
,972
$645
,000
$940
,365
$0$0
$0$0
$0$0
7019
DU
RH
AM
O&
M P
ARKIN
G L
OT
& M
AIN
TEN
AN
CE
STO
RAG
E$8
8,11
9$2
5,00
0$3
20,0
00$3
55,0
00$0
$0$0
$0$3
55,0
00
7021
DU
RH
AM
PO
LYM
ER F
EED
SYS
TEM
REP
LAC
EMEN
T$2
28,3
60$0
$0$0
$0$0
$0$0
$0
7045
DU
RH
AM
WASSTR
IP I
MPR
OVEM
ENTS
$534
,744
$2,9
50,0
00$2
,330
,000
$2,0
00,0
00$0
$0$0
$0$2
,000
,000
7064
DU
RH
AM
BI-
SU
LFATE
HVAC
REP
LAC
EMEN
T$0
$150
,000
$105
,000
$0$0
$0$0
$0$0
7065
DU
RH
AM
REP
LAC
E M
UA-6
001
$0$1
30,0
00$1
25,0
00$0
$0$0
$0$0
$0
FIN
AL
San
i CIP
Ind
ex.x
lsx
Pag
e 8
of 1
6

CLEAN WATER SERVICES • FY 2021-22 PROPOSED BUDGET PAGE 294
FY 2
020
Act
ual
FY 2
021
Bud
get
FY 2
021
Rev
ised
FY 2
022
Proj
ecte
dFY
202
3Pr
ojec
ted
FY 2
024
Proj
ecte
dFY
202
5Pr
ojec
ted
FY 2
026
Proj
ecte
dFY
202
2-20
26Pr
ojec
ted
Hom
e Po
rtfo
lio
7070
DU
RH
AM
SO
LID
S B
UIL
DIN
G D
RAIN
SYS
TEM
REH
AB
$0$1
00,0
00$2
00,0
00$5
50,0
00$0
$0$0
$0$5
50,0
00
7071
DU
RH
AM
GRIT
SYS
TEM
REH
ABIL
ITATI
ON
$0$6
00,0
00$2
50,0
00$1
,270
,000
$0$0
$0$0
$1,2
70,0
00
7094
DU
RH
AM
IPS
BIO
FILT
ER R
ETRO
FIT
$0$0
$800
,000
$0$0
$0$0
$0$0
$16,
774,
035
$15,
550,
000
$17,
808,
764
$10,
977,
000
$13,
550,
000
$5,7
75,0
00$6
,150
,000
$11,
625,
000
$48,
077,
000
SC
AD
A/C
ON
TRO
L U
PGRAD
E FO
R F
G A
ND
HB
$0$0
$0$0
$0$0
$0$0
$0
6983
PRO
CES
S,
INN
OVATI
ON
, EN
ERG
Y PR
OJE
CTS
$110
,571
$75,
000
$0$0
$0$0
$0$0
$0
$110
,571
$75,
000
$0$0
$0$0
$0$0
$0
RO
CK C
REE
K M
ECH
AN
ICAL
STO
RAG
E BU
ILD
ING
$0$5
0,00
0$2
0,00
0$1
50,0
00$0
$0$0
$0$1
50,0
00
RO
CK C
REE
K O
&M
BU
ILD
ING
PRES
SU
RE
WASH
ER A
REA
IM
PRO
VEM
ENTS
$0$7
5,00
0$1
0,00
0$7
5,00
0$0
$0$0
$0$7
5,00
0
6371
FAC
ILIT
IES M
ISC
ELLA
NEO
US U
PGRAD
ES$1
52,2
83$2
00,0
00$0
$200
,000
$200
,000
$200
,000
$200
,000
$200
,000
$1,0
00,0
00
7036
LAN
DSC
APE
IM
PRO
VEM
ENTS
AN
D U
PGRAD
ES$4
21,0
24$6
25,0
00$4
00,0
00$7
50,0
00$6
50,0
00$3
50,0
00$3
50,0
00$2
00,0
00$2
,300
,000
7050
RO
CK C
REE
K C
HEM
ICAL
& D
IGES
TER
ELEV
ATO
RS I
MPR
OVEM
ENTS
$2,1
74$3
00,0
00$5
0,00
0$3
00,0
00$2
50,0
00$0
$0$0
$550
,000
$575
,481
$1,2
50,0
00$4
80,0
00$1
,475
,000
$1,1
00,0
00$5
50,0
00$5
50,0
00$4
00,0
00$4
,075
,000
FERN
HIL
L IN
TERAC
TIVE
VIE
WIN
G P
LATF
ORM
$0$0
$0$0
$150
,000
$750
,000
$0$0
$900
,000
FERN
HIL
L N
TS O
UTL
ET I
MPR
OVEM
ENTS
$0$0
$0$5
0,00
0$0
$0$0
$0$5
0,00
0
FORES
T G
RO
VE
FUN
D 1
06 U
MBREL
LA -
MU
LTI-
DIS
CIP
LIN
ARY
$0$0
$0$2
25,0
00$2
25,0
00$2
25,0
00$2
25,0
00$2
25,0
00$1
,125
,000
FORES
T G
RO
VE
INFL
UEN
T SC
REE
NIN
GS
IMPR
OVEM
ENT
$0$0
$0$0
$0$1
00,0
00$1
,100
,000
$1,1
00,0
00$2
,300
,000
FORES
T G
RO
VE
REC
YCLE
D W
ATE
R F
AC
ILIT
Y$0
$0$0
$0$0
$0$6
0,00
0$5
20,0
00$5
80,0
00
FORES
T G
RO
VE
SEC
ON
DARY
EXPA
NSIO
N$0
$0$0
$100
,000
$100
,000
$5,5
00,0
00$5
,500
,000
$0$1
1,20
0,00
0
6374
FORES
T G
RO
VE
MIS
CEL
LAN
EOU
S U
PGRAD
ES$2
4,32
8$1
00,0
00$3
0,00
0$1
00,0
00$1
00,0
00$1
00,0
00$1
00,0
00$1
00,0
00$5
00,0
00
6699
FERN
HIL
L N
TS U
PPER
WET
LAN
DS
$47,
124
$0$0
$0$1
50,0
00$2
00,0
00$3
,200
,000
$3,3
00,0
00$6
,850
,000
6792
FORES
T G
RO
VE
EFFL
UEN
T PU
MP
STA
TIO
N$2
83,9
52$5
00,0
00$1
,850
,000
$9,1
00,0
00$2
,100
,000
$0$0
$0$1
1,20
0,00
0
6814
FORES
T G
RO
VE
AD
MIN
ISTR
ATI
ON
BU
ILD
ING
IM
PRO
VEM
ENTS
$1,0
20,8
00$0
$20,
000
$0$0
$0$0
$0$0
6849
FERN
HIL
L M
ISC
ELLA
NEO
US I
MPR
OVEM
ENTS
$321
,010
$300
,000
$0$3
00,0
00$3
00,0
00$3
00,0
00$3
00,0
00$0
$1,2
00,0
00
6866
FORES
T G
RO
VE
AER
ATI
ON
BASIN
M
OD
IFIC
ATI
ON
S$6
56$0
$0$0
$50,
000
$700
,000
$0$0
$750
,000
6896
FORES
T G
RO
VE
SO
LID
S T
REA
TMEN
T ALT
ERN
ATI
VES
PRO
JEC
T$5
7,94
1$1
50,0
00$5
0,00
0$0
$0$4
00,0
00$3
,200
,000
$2,2
00,0
00$5
,800
,000
6897
FERN
HIL
L PA
RKIN
G L
OT
& L
AN
DSC
APE
$65,
588
$0$0
$0$0
$0$0
$0$0
6916
FERN
HIL
L LA
ND
SC
APE
IM
PRO
VEM
ENTS
$50,
402
$0$0
$0$0
$0$0
$0$0
6925
FORES
T G
RO
VE
SEC
ON
DARY
CLA
RIF
IERS
$1,3
27,8
46$7
,700
,000
$9,8
00,0
00$1
,100
,000
$0$0
$0$0
$1,1
00,0
00
6953
FORES
T G
RO
VE
MIS
C.
SEC
ON
DARY
TREA
TMEN
T IM
PRO
VEM
ENTS
$167
,743
$500
,000
$50,
000
$50,
000
$0$0
$0$0
$50,
000
WR
RD
- E
lect
rica
l &
In
stru
men
tati
on
WR
RD
- F
acili
ties
WR
RD
- F
ores
t G
rove
FIN
AL
San
i CIP
Ind
ex.x
lsx
Pag
e 9
of 1
6

CLEAN WATER SERVICES • FY 2021-22 PROPOSED BUDGET PAGE 295
FY 2
020
Act
ual
FY 2
021
Bud
get
FY 2
021
Rev
ised
FY 2
022
Proj
ecte
dFY
202
3Pr
ojec
ted
FY 2
024
Proj
ecte
dFY
202
5Pr
ojec
ted
FY 2
026
Proj
ecte
dFY
202
2-20
26Pr
ojec
ted
Hom
e Po
rtfo
lio
6959
FERN
HIL
L VO
LUN
TEER
& V
ISIT
OR
IMPR
OVEM
ENTS
$651
,118
$50,
000
$0$3
5,00
0$3
5,00
0$3
5,00
0$0
$0$1
05,0
00
7040
FERN
HIL
L U
PPER
PO
OL
LAN
DSC
APE
$123
,482
$0$0
$0$0
$0$0
$0$0
7066
FERN
HIL
L IN
TERAC
TIVE
NATU
RE
LEARN
ING
PR
OJE
CT
$0$4
50,0
00$0
$0$4
15,0
00$0
$0$0
$415
,000
$4,1
41,9
90$9
,750
,000
$11,
800,
000
$11,
060,
000
$3,6
25,0
00$8
,310
,000
$13,
685,
000
$7,4
45,0
00$4
4,12
5,00
0
HIL
LSBO
RO
AD
MIN
ISTR
ATI
ON
BU
ILD
ING
IM
PRO
VEM
ENTS
$0$0
$0$0
$50,
000
$800
,000
$2,2
00,0
00$0
$3,0
50,0
00
HIL
LSBO
RO
CAU
STI
C T
AN
K A
DD
ITIO
N$0
$0$0
$250
,000
$0$0
$0$0
$250
,000
HIL
LSBO
RO
FU
ND
106
UM
BREL
LA -
MU
LTI-
DIS
CIP
LIN
ARY
$0$0
$0$2
00,0
00$2
00,0
00$2
00,0
00$2
00,0
00$2
00,0
00$1
,000
,000
HIL
LSBO
RO
GRIT
PU
MPI
NG
AN
D S
EPARATO
R$0
$0$0
$0$0
$0$0
$0$0
HIL
LSBO
RO
NATU
RAL
TREA
TMEN
T SYS
TEM
$0$0
$0$0
$0$0
$0$0
$0
HIL
LSBO
RO
SO
LID
S H
AN
DLI
NG
IM
PRO
VEM
ENTS
$0$0
$0$0
$0$0
$50,
000
$250
,000
$300
,000
6373
HIL
LSBO
RO
MIS
CEL
LAN
EOU
S U
PGRAD
ES$6
0,04
6$1
00,0
00$1
00,0
00$1
00,0
00$1
00,0
00$1
00,0
00$1
00,0
00$1
00,0
00$5
00,0
00
7047
HIL
LSBO
RO
HIG
H H
EAD
PU
MP
STA
TIO
N A
ND
C
ON
TRO
L G
ATE
MO
DIF
ICATI
ON
S$0
$140
,000
$150
,000
$650
,000
$2,8
00,0
00$0
$0$0
$3,4
50,0
00
7075
HIL
LSBO
RO
EN
TRY
GATE
$0$2
30,0
00$4
00,0
00$0
$0$0
$0$0
$0
$60,
046
$470
,000
$650
,000
$1,2
00,0
00$3
,150
,000
$1,1
00,0
00$2
,550
,000
$550
,000
$8,5
50,0
00
REC
YCLE
D W
ATE
R M
ISC
ELLA
NEO
US U
PGRAD
ES$0
$0$0
$0$0
$0$0
$0$0
TUALA
TIN
RIV
ER F
ARM
REU
SE
PIPE
$0$0
$0$0
$0$0
$0$0
$0
TVID
REC
YCLE
D W
ATE
R P
IPEL
INE
$0$0
$0$0
$0$0
$0$0
$0
6408
WATE
R R
IGH
TS$0
$20,
000
$0$0
$0$0
$0$0
$0
6780
ELEC
TRO
NIC
OPE
RATO
RS M
AN
UAL
$218
,755
$50,
000
$0$0
$0$0
$0$0
$0
6871
FAC
ILIT
Y W
AYF
IND
ING
& I
NTE
RPR
ETIV
E IM
PRO
VEM
ENTS
$69,
607
$150
,000
$80,
000
$0$0
$0$0
$0$0
$288
,362
$220
,000
$80,
000
$0$0
$0$0
$0$0
18th
AVEN
UE
PUM
P STA
TIO
N &
FO
RC
EMAIN
$0$0
$0$0
$0$0
$0$2
00,0
00$2
00,0
00
ALO
HA 3
PU
MP
STA
TIO
N U
PGRAD
E$0
$0$0
$0$0
$0$0
$0$0
BAN
KS F
ORC
E M
AIN
LO
CATI
ON
$0$0
$0$0
$0$0
$0$0
$0
BO
RLA
ND
PU
MP
STA
TIO
N U
PGRAD
E$0
$0$0
$75,
000
$375
,000
$0$0
$0$4
50,0
00
BU
TTER
NU
T C
REE
K P
UM
P STA
TIO
N P
HASE
2$0
$0$0
$0$0
$0$1
00,0
00$4
,000
,000
$4,1
00,0
00
BU
TTER
NU
T PU
MP
STA
TIO
N 3
PU
MP
STA
TIO
N$0
$0$0
$0$0
$0$0
$0$0
CED
AR S
TREE
T PU
MP
STA
TIO
N U
PGRAD
E$0
$0$0
$135
,000
$0$0
$0$0
$135
,000
CH
ICKEN
CREE
K P
UM
P STA
TIO
N &
FO
RC
EMAIN
$0$0
$0$0
$0$2
50,0
00$8
00,0
00$1
0,50
0,00
0$1
1,55
0,00
0
CH
ILD
S P
UM
P STA
TIO
N R
EPLA
CEM
ENT
$0$0
$0$0
$0$0
$0$0
$0
WR
RD
- H
ills
bor
o
WR
RD
- M
isce
llan
eou
s (T
reat
men
t)
WR
RD
- P
um
p S
tati
on
s (T
reat
men
t)
FIN
AL
San
i CIP
Ind
ex.x
lsx
Pag
e 10
of
16
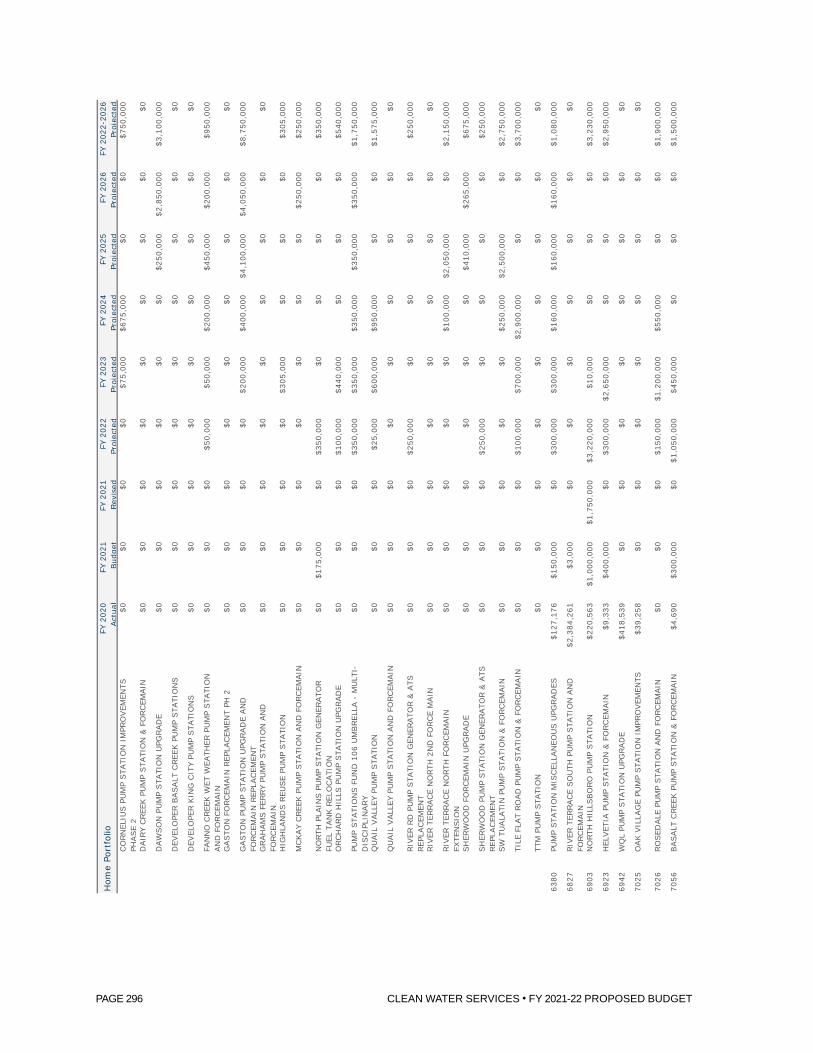
CLEAN WATER SERVICES • FY 2021-22 PROPOSED BUDGET PAGE 296
FY 2
020
Act
ual
FY 2
021
Bud
get
FY 2
021
Rev
ised
FY 2
022
Proj
ecte
dFY
202
3Pr
ojec
ted
FY 2
024
Proj
ecte
dFY
202
5Pr
ojec
ted
FY 2
026
Proj
ecte
dFY
202
2-20
26Pr
ojec
ted
Hom
e Po
rtfo
lio
CO
RN
ELIU
S P
UM
P STA
TIO
N I
MPR
OVEM
ENTS
PH
ASE
2$0
$0$0
$0$7
5,00
0$6
75,0
00$0
$0$7
50,0
00
DAIR
Y C
REE
K P
UM
P STA
TIO
N &
FO
RC
EMAIN
$0$0
$0$0
$0$0
$0$0
$0
DAW
SO
N P
UM
P STA
TIO
N U
PGRAD
E$0
$0$0
$0$0
$0$2
50,0
00$2
,850
,000
$3,1
00,0
00
DEV
ELO
PER B
ASALT
CREE
K P
UM
P STA
TIO
NS
$0$0
$0$0
$0$0
$0$0
$0
DEV
ELO
PER K
ING
CIT
Y PU
MP
STA
TIO
NS
$0$0
$0$0
$0$0
$0$0
$0
FAN
NO
CREE
K W
ET W
EATH
ER P
UM
P STA
TIO
N
AN
D F
ORC
EMAIN
$0$0
$0$5
0,00
0$5
0,00
0$2
00,0
00$4
50,0
00$2
00,0
00$9
50,0
00
GASTO
N F
ORC
EMAIN
REP
LAC
EMEN
T PH
2$0
$0$0
$0$0
$0$0
$0$0
GASTO
N P
UM
P STA
TIO
N U
PGRAD
E AN
D
FORC
EMAIN
REP
LAC
EMEN
T$0
$0$0
$0$2
00,0
00$4
00,0
00$4
,100
,000
$4,0
50,0
00$8
,750
,000
GRAH
AM
S F
ERRY
PUM
P STA
TIO
N A
ND
FO
RC
EMAIN
$0$0
$0$0
$0$0
$0$0
$0
HIG
HLA
ND
S R
EUSE
PUM
P STA
TIO
N$0
$0$0
$0$3
05,0
00$0
$0$0
$305
,000
MC
KAY
CREE
K P
UM
P STA
TIO
N A
ND
FO
RC
EMAIN
$0$0
$0$0
$0$0
$0$2
50,0
00$2
50,0
00
NO
RTH
PLA
INS P
UM
P STA
TIO
N G
ENER
ATO
R
FUEL
TAN
K R
ELO
CATI
ON
$0$1
75,0
00$0
$350
,000
$0$0
$0$0
$350
,000
ORC
HARD
HIL
LS P
UM
P STA
TIO
N U
PGRAD
E$0
$0$0
$100
,000
$440
,000
$0$0
$0$5
40,0
00
PUM
P STA
TIO
NS F
UN
D 1
06 U
MBREL
LA -
MU
LTI-
DIS
CIP
LIN
ARY
$0$0
$0$3
50,0
00$3
50,0
00$3
50,0
00$3
50,0
00$3
50,0
00$1
,750
,000
QU
AIL
VALL
EY P
UM
P STA
TIO
N$0
$0$0
$25,
000
$600
,000
$950
,000
$0$0
$1,5
75,0
00
QU
AIL
VALL
EY P
UM
P STA
TIO
N A
ND
FO
RC
EMAIN
$0$0
$0$0
$0$0
$0$0
$0
RIV
ER R
D P
UM
P STA
TIO
N G
ENER
ATO
R &
ATS
REP
LAC
EMEN
T$0
$0$0
$250
,000
$0$0
$0$0
$250
,000
RIV
ER T
ERRAC
E N
ORTH
2N
D F
ORC
E M
AIN
$0$0
$0$0
$0$0
$0$0
$0
RIV
ER T
ERRAC
E N
ORTH
FO
RC
EMAIN
EX
TEN
SIO
N$0
$0$0
$0$0
$100
,000
$2,0
50,0
00$0
$2,1
50,0
00
SH
ERW
OO
D F
ORC
EMAIN
UPG
RAD
E$0
$0$0
$0$0
$0$4
10,0
00$2
65,0
00$6
75,0
00
SH
ERW
OO
D P
UM
P STA
TIO
N G
ENER
ATO
R &
ATS
REP
LAC
EMEN
T$0
$0$0
$250
,000
$0$0
$0$0
$250
,000
SW
TU
ALA
TIN
PU
MP
STA
TIO
N &
FO
RC
EMAIN
$0$0
$0$0
$0$2
50,0
00$2
,500
,000
$0$2
,750
,000
TILE
FLA
T RO
AD
PU
MP
STA
TIO
N &
FO
RC
EMAIN
$0$0
$0$1
00,0
00$7
00,0
00$2
,900
,000
$0$0
$3,7
00,0
00
TTM
PU
MP
STA
TIO
N$0
$0$0
$0$0
$0$0
$0$0
6380
PUM
P STA
TIO
N M
ISC
ELLA
NEO
US U
PGRAD
ES$1
27,1
76$1
50,0
00$0
$300
,000
$300
,000
$160
,000
$160
,000
$160
,000
$1,0
80,0
00
6827
RIV
ER T
ERRAC
E SO
UTH
PU
MP
STA
TIO
N A
ND
FO
RC
EMAIN
$2,3
84,2
61$3
,000
$0$0
$0$0
$0$0
$0
6903
NO
RTH
HIL
LSBO
RO
PU
MP
STA
TIO
N$2
20,5
63$1
,000
,000
$1,7
50,0
00$3
,220
,000
$10,
000
$0$0
$0$3
,230
,000
6923
HEL
VET
IA P
UM
P STA
TIO
N &
FO
RC
EMAIN
$9,3
33$4
00,0
00$0
$300
,000
$2,6
50,0
00$0
$0$0
$2,9
50,0
00
6942
WQ
L PU
MP
STA
TIO
N U
PGRAD
E$4
18,5
39$0
$0$0
$0$0
$0$0
$0
7025
OAK V
ILLA
GE
PUM
P STA
TIO
N I
MPR
OVEM
ENTS
$39,
258
$0$0
$0$0
$0$0
$0$0
7026
RO
SED
ALE
PU
MP
STA
TIO
N A
ND
FO
RC
EMAIN
$0$0
$0$1
50,0
00$1
,200
,000
$550
,000
$0$0
$1,9
00,0
00
7056
BASALT
CREE
K P
UM
P STA
TIO
N &
FO
RC
EMAIN
$4,6
90$3
00,0
00$0
$1,0
50,0
00$4
50,0
00$0
$0$0
$1,5
00,0
00
FIN
AL
San
i CIP
Ind
ex.x
lsx
Pag
e 11
of
16
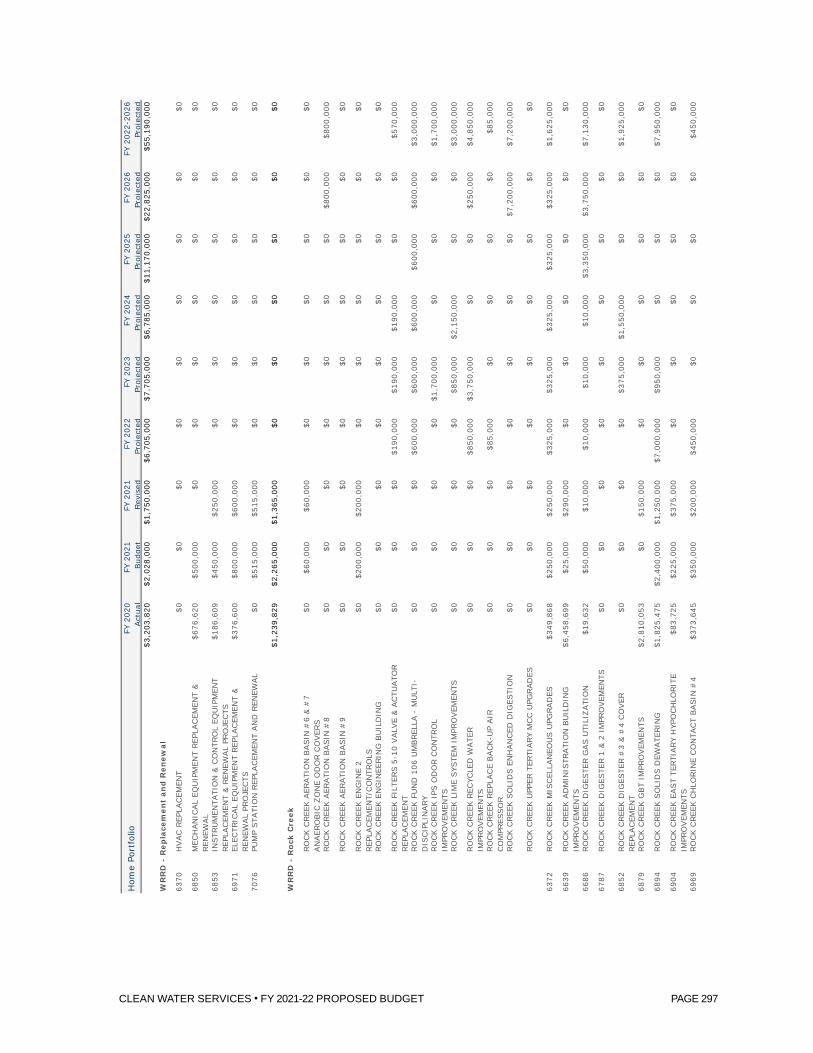
CLEAN WATER SERVICES • FY 2021-22 PROPOSED BUDGET PAGE 297
FY 2
020
Act
ual
FY 2
021
Bud
get
FY 2
021
Rev
ised
FY 2
022
Proj
ecte
dFY
202
3Pr
ojec
ted
FY 2
024
Proj
ecte
dFY
202
5Pr
ojec
ted
FY 2
026
Proj
ecte
dFY
202
2-20
26Pr
ojec
ted
Hom
e Po
rtfo
lio
$3,2
03,8
20$2
,028
,000
$1,7
50,0
00$6
,705
,000
$7,7
05,0
00$6
,785
,000
$11,
170,
000
$22,
825,
000
$55,
190,
000
6370
HVAC
REP
LAC
EMEN
T$0
$0$0
$0$0
$0$0
$0$0
6850
MEC
HAN
ICAL
EQU
IPM
ENT
REP
LAC
EMEN
T &
REN
EWAL
$676
,620
$500
,000
$0$0
$0$0
$0$0
$0
6853
INSTR
UM
ENTA
TIO
N &
CO
NTR
OL
EQU
IPM
ENT
REP
LAC
EMEN
T &
REN
EWAL
PRO
JEC
TS$1
86,6
09$4
50,0
00$2
50,0
00$0
$0$0
$0$0
$0
6971
ELEC
TRIC
AL
EQU
IPM
ENT
REP
LAC
EMEN
T &
REN
EWAL
PRO
JEC
TS$3
76,6
00$8
00,0
00$6
00,0
00$0
$0$0
$0$0
$0
7076
PUM
P STA
TIO
N R
EPLA
CEM
ENT
AN
D R
ENEW
AL
$0$5
15,0
00$5
15,0
00$0
$0$0
$0$0
$0
$1,2
39,8
29$2
,265
,000
$1,3
65,0
00$0
$0$0
$0$0
$0
RO
CK C
REE
K A
ERATI
ON
BASIN
#6
& #
7 AN
AER
OBIC
ZO
NE
OD
OR C
OVER
S$0
$60,
000
$60,
000
$0$0
$0$0
$0$0
RO
CK C
REE
K A
ERATI
ON
BASIN
#8
$0$0
$0$0
$0$0
$0$8
00,0
00$8
00,0
00
RO
CK C
REE
K A
ERATI
ON
BASIN
#9
$0$0
$0$0
$0$0
$0$0
$0
RO
CK C
REE
K E
NG
INE
2 REP
LAC
EMEN
T/C
ON
TRO
LS$0
$200
,000
$200
,000
$0$0
$0$0
$0$0
RO
CK C
REE
K E
NG
INEE
RIN
G B
UIL
DIN
G$0
$0$0
$0$0
$0$0
$0$0
RO
CK C
REE
K F
ILTE
RS 5
-10
VALV
E &
AC
TUATO
R
REP
LAC
EMEN
T$0
$0$0
$190
,000
$190
,000
$190
,000
$0$0
$570
,000
RO
CK C
REE
K F
UN
D 1
06 U
MBREL
LA -
MU
LTI-
DIS
CIP
LIN
ARY
$0$0
$0$6
00,0
00$6
00,0
00$6
00,0
00$6
00,0
00$6
00,0
00$3
,000
,000
RO
CK C
REE
K I
PS O
DO
R C
ON
TRO
L IM
PRO
VEM
ENTS
$0$0
$0$0
$1,7
00,0
00$0
$0$0
$1,7
00,0
00
RO
CK C
REE
K L
IME
SYS
TEM
IM
PRO
VEM
ENTS
$0$0
$0$0
$850
,000
$2,1
50,0
00$0
$0$3
,000
,000
RO
CK C
REE
K R
ECYC
LED
WATE
R
IMPR
OVEM
ENTS
$0$0
$0$8
50,0
00$3
,750
,000
$0$0
$250
,000
$4,8
50,0
00
RO
CK C
REE
K R
EPLA
CE
BAC
K-U
P AIR
C
OM
PRES
SO
R$0
$0$0
$85,
000
$0$0
$0$0
$85,
000
RO
CK C
REE
K S
OLI
DS E
NH
AN
CED
DIG
ESTI
ON
$0$0
$0$0
$0$0
$0$7
,200
,000
$7,2
00,0
00
RO
CK C
REE
K U
PPER
TER
TIARY
MC
C U
PGRAD
ES$0
$0$0
$0$0
$0$0
$0$0
6372
RO
CK C
REE
K M
ISC
ELLA
NEO
US U
PGRAD
ES$3
49,8
68$2
50,0
00$2
50,0
00$3
25,0
00$3
25,0
00$3
25,0
00$3
25,0
00$3
25,0
00$1
,625
,000
6639
RO
CK C
REE
K A
DM
INIS
TRATI
ON
BU
ILD
ING
IM
PRO
VEM
ENTS
$6,4
58,6
99$2
5,00
0$2
90,0
00$0
$0$0
$0$0
$0
6686
RO
CK C
REE
K D
IGES
TER G
AS U
TILI
ZATI
ON
$19,
632
$50,
000
$10,
000
$10,
000
$10,
000
$10,
000
$3,3
50,0
00$3
,750
,000
$7,1
30,0
00
6787
RO
CK C
REE
K D
IGES
TER 1
& 2
IM
PRO
VEM
ENTS
$0$0
$0$0
$0$0
$0$0
$0
6852
RO
CK C
REE
K D
IGES
TER #
3 &
#4
CO
VER
REP
LAC
EMEN
T$0
$0$0
$0$3
75,0
00$1
,550
,000
$0$0
$1,9
25,0
00
6879
RO
CK C
REE
K G
BT
IMPR
OVEM
ENTS
$2,8
10,0
53$0
$150
,000
$0$0
$0$0
$0$0
6894
RO
CK C
REE
K S
OLI
DS D
EWATE
RIN
G$1
,825
,475
$2,4
00,0
00$1
,250
,000
$7,0
00,0
00$9
50,0
00$0
$0$0
$7,9
50,0
00
6904
RO
CK C
REE
K E
AST
TERTI
ARY
HYP
OC
HLO
RIT
E IM
PRO
VEM
ENTS
$83,
725
$225
,000
$375
,000
$0$0
$0$0
$0$0
6969
RO
CK C
REE
K C
HLO
RIN
E C
ON
TAC
T BASIN
#4
$373
,645
$350
,000
$200
,000
$450
,000
$0$0
$0$0
$450
,000
WR
RD
- R
epla
cem
ent
and
Ren
ewal
WR
RD
- R
ock
Cre
ek
FIN
AL
San
i CIP
Ind
ex.x
lsx
Pag
e 12
of
16

CLEAN WATER SERVICES • FY 2021-22 PROPOSED BUDGET PAGE 298
FY 2
020
Act
ual
FY 2
021
Bud
get
FY 2
021
Rev
ised
FY 2
022
Proj
ecte
dFY
202
3Pr
ojec
ted
FY 2
024
Proj
ecte
dFY
202
5Pr
ojec
ted
FY 2
026
Proj
ecte
dFY
202
2-20
26Pr
ojec
ted
Hom
e Po
rtfo
lio
6970
RO
CK C
REE
K F
ILTE
R I
MPR
OVEM
ENTS
$139
,806
$0$2
5,00
0$0
$0$0
$0$0
$0
7012
RO
CK C
REE
K P
RIM
ARY
CLA
RIF
IER #
4$3
75,9
26$2
,500
,000
$300
,000
$1,7
50,0
00$9
,250
,000
$2,2
00,0
00$0
$0$1
3,20
0,00
0
7016
RO
CK C
REE
K C
HEM
ICAL
BU
ILD
ING
LABRATO
RY
$59,
751
$650
,000
$650
,000
$175
,000
$0$0
$0$0
$175
,000
7024
RO
CK C
REE
K H
OT
WATE
R S
YSTE
M
IMPR
OVEM
ENTS
$28,
652
$250
,000
$75,
000
$50,
000
$300
,000
$225
,000
$0$0
$575
,000
7054
WES
T BASIN
MASTE
R P
LAN
$32,
403
$250
,000
$250
,000
$600
,000
$150
,000
$0$0
$0$7
50,0
00
7061
RO
CK C
REE
K E
AST
TERTI
ARY
CLA
RIC
ON
E C
OATI
NG
$0$4
65,0
00$0
$0$4
00,0
00$0
$0$0
$400
,000
7090
RO
CK C
REE
K D
IGES
TER #
5 &
#6
VALV
ES$0
$175
,000
$400
,000
$315
,000
$0$0
$0$0
$315
,000
7102
RO
CK C
REE
K F
LARE
REH
ABIL
ITATI
ON
$0$2
00,0
00$7
0,00
0$0
$0$0
$0$0
$0
7103
RO
CK C
REE
K O
UTF
ALL
A S
TORM
WATE
R P
UM
P STA
TIO
N$0
$1,0
75,0
00$1
50,0
00$1
,150
,000
$0$0
$0$0
$1,1
50,0
00
7108
RO
CK C
REE
K W
ASTE
AC
TIVATE
D S
LUD
GE
(WAS)
PUM
PIN
G S
YSTE
M I
MPR
OVEM
ENTS
$0$5
0,00
0$5
0,00
0$5
0,00
0$0
$0$0
$0$5
0,00
0
$12,
557,
635
$9,1
75,0
00$4
,755
,000
$13,
600,
000
$18,
850,
000
$7,2
50,0
00$4
,275
,000
$12,
925,
000
$56,
900,
000
$63,
613,
038
$80,
879,
600
$67,
866,
564
$89,
193,
500
$95,
786,
300
$89,
556,
300
$76,
714,
900
$91,
334,
800
$442
,585
,800
2019
CAPI
TAL
OU
TLAY
FY 2
018-
19$9
,500
$0$0
$0$0
$0$0
$0$0
2020
CAPI
TAL
OU
TLAY
FY 2
019-
20$3
34,1
38$0
$0$0
$0$0
$0$0
$0
$343
,638
$0$0
$0$0
$0$0
$0$0
6960
ABC
CH
ILLE
R R
EPLA
CEM
ENT
$0$0
$0$0
$0$0
$0$0
$0
$0$0
$0$0
$0$0
$0$0
$0
6063
IT C
OM
MU
NIC
ATI
ON
S A
SSET
LIF
E-C
YCLE
C
OSTS
$943
$0$0
$0$0
$0$0
$0$0
6106
IT S
TORAG
E ASSET
LIF
E C
YCLE
CO
STS
$0$0
$0$0
$0$0
$0$0
$0
6107
IT S
ERVER
ASSET
LIF
E-C
YCLE
CO
STS
$3,6
86$0
$0$0
$0$0
$0$0
$0
6265
IT E
ND
USER
DEV
ICE
ASSET
LIF
E-C
YCLE
C
OSTS
$0$0
$0$0
$0$0
$0$0
$0
$4,6
29$0
$0$0
$0$0
$0$0
$0
6611
STR
EAM
OPE
RATI
ON
S C
ENTE
R R
ELO
CATI
ON
$0$0
$0$0
$0$0
$0$0
$0
$0$0
$0$0
$0$0
$0$0
$0
6474
FAN
NO
CREE
K -
99W
TO
BO
NIT
A -
SAN
I$1
,383
$0$0
$0$0
$0$0
$0$0
$1,3
83$0
$0$0
$0$0
$0$0
$0
6672
HIG
H P
URIT
Y W
ATE
R P
RO
JEC
T$5
2,34
2$0
$0$0
$0$0
$0$0
$0
Act
ive
Pro
ject
s
Clo
sed
Pro
ject
s
Bu
sin
ess
Svc
s -
Fin
ance
- F
inan
ce
Dig
ital
Sol
uti
on
s -
Faci
litie
s M
anag
emen
t P
roje
cts
Dig
ital
Sol
uti
on
s -
Infr
astr
uct
ure
- R
epla
cem
ent
NS
ES
- C
WS
Pro
per
ty I
mp
rove
men
ts
NS
ES
- N
SES
En
han
cem
ent
Off
ice
of
CE
O -
Ad
min
- O
ffic
e o
f th
e C
EO
FIN
AL
San
i CIP
Ind
ex.x
lsx
Pag
e 13
of
16

CLEAN WATER SERVICES • FY 2021-22 PROPOSED BUDGET PAGE 299
FY 2
020
Act
ual
FY 2
021
Bud
get
FY 2
021
Rev
ised
FY 2
022
Proj
ecte
dFY
202
3Pr
ojec
ted
FY 2
024
Proj
ecte
dFY
202
5Pr
ojec
ted
FY 2
026
Proj
ecte
dFY
202
2-20
26Pr
ojec
ted
Hom
e Po
rtfo
lio
6961
TTM
PRO
PERTY
AC
QU
ISIT
ION
$0$0
$0$0
$0$0
$0$0
$0
$52,
342
$0$0
$0$0
$0$0
$0$0
7011
80th
AVEN
UE
& S
W T
AYL
ORS F
ERRY
SAN
I$8
2,47
2$0
$0$0
$0$0
$0$0
$0
$82,
472
$0$0
$0$0
$0$0
$0$0
6944
SW
83r
d AVEN
UE
AT
GARD
EN H
OM
E SAN
ITARY
SEW
ER E
XTE
NSIO
N$6
5,28
2$0
$0$0
$0$0
$0$0
$0
6948
KIN
G C
ITY
- G
ARD
EN V
ILLA
S S
AN
ITARY
SEW
ER
LID
$20,
706
$0$0
$0$0
$0$0
$0$0
6984
MO
SS S
TREE
T SAN
ITARY
SEW
ER L
ID$2
61,0
36$0
$0$0
$0$0
$0$0
$0
$347
,024
$0$0
$0$0
$0$0
$0$0
6795
UPP
ER T
URN
ER C
REE
K R
EHAB
$0$0
$0$0
$0$0
$0$0
$0
6824
CH
RIS
TIN
E C
T SLI
DE
AN
ALY
SIS
AN
D R
EPAIR
$0$0
$0$0
$0$0
$0$0
$0
6877
GARD
EN H
OM
E SEW
ER R
EHABIL
ITATI
ON
$0$0
$0$0
$0$0
$0$0
$0
6899
CED
AR H
ILLS
REH
ABIL
ITATI
ON
PH
ASE
2$0
$0$0
$0$0
$0$0
$0$0
6914
SO
UTH
WO
OD
REH
ABIL
ITATI
ON
$1,2
42,3
58$0
$6,0
00$0
$0$0
$0$0
$0
6962
19TH
AVE
AN
D M
APL
E STR
EET
I/I
REH
AB
$1,9
89,7
15$0
$1,0
00$0
$0$0
$0$0
$0
6973
FOO
THIL
LS P
ARK I
/I A
BATE
MEN
T IM
PRO
VEM
ENTS
$245
$0$0
$0$0
$0$0
$0$0
6995
GASTO
N M
AN
HO
LE R
ELO
CATI
ON
$48,
764
$0$0
$0$0
$0$0
$0$0
7080
114t
h AVEN
UE
SEW
ER R
EPAIR
$0$7
5,00
0$7
5,00
0$0
$0$0
$0$0
$0
$3,2
81,0
82$7
5,00
0$8
2,00
0$0
$0$0
$0$0
$0
6493
UPP
ER T
UALA
TIN
IN
TERC
EPTO
R (
D-2
50)
$5,6
62,7
97$0
$0$0
$0$0
$0$0
$0
6581
STE
ED C
REE
K S
EWER
UPS
IZE
$0$0
$0$0
$0$0
$0$0
$0
6794
N B
ETH
AN
Y TR
UN
K S
EWER
EXTE
NSIO
N P
HASE
2$0
$0$0
$0$0
$0$0
$0$0
6817
N B
ETH
AN
Y SEW
ER -
SW
EXTE
NSIO
N$0
$0$0
$0$0
$0$0
$0$0
6883
RO
Y RO
GER
S G
RAVIT
Y RIV
ER T
ERRAC
E SO
UTH
PU
MP
STA
TIO
N T
O L
ASIC
H L
AN
E$1
7,88
5$0
$0$0
$0$0
$0$0
$0
6884
BU
LL M
T TR
UN
K I
MPR
OVEM
ENTS
-KIN
G C
ITY
SIP
HO
N T
O S
W M
YRTL
E AVE
$641
,137
$0$0
$0$0
$0$0
$0$0
6895
175T
H &
KEM
MER
SEW
ER E
XTE
NSIO
N$5
4$0
$0$0
$0$0
$0$0
$0
6908
S H
ILLS
BO
RO
TRU
NK S
EWER
$0$0
$0$0
$0$0
$0$0
$0
6972
BET
HAN
Y LA
KE
BER
M -
STU
DY
$26,
988
$0$0
$0$0
$0$0
$0$0
$6,3
48,8
61$0
$0$0
$0$0
$0$0
$0
6627
MATE
RIA
L PR
OC
ESSIN
G Y
ARD
IM
PRO
VEM
ENTS
$0$0
$0$0
$0$0
$0$0
$0
UO
PS
- C
on
veya
nce
En
gr
- C
ity
Man
aged
San
itar
y P
roje
cts
UO
PS
- C
on
veya
nce
En
gr
- LI
D
UO
PS
- C
on
veya
nce
En
gr
- R
ehab
ilit
atio
n
UO
PS
- C
on
veya
nce
En
gr
- S
anit
ary
Co
llec
tio
n S
yste
m
UO
PS
- F
ield
Op
s -
Fiel
d O
per
atio
ns
FIN
AL
San
i CIP
Ind
ex.x
lsx
Pag
e 14
of
16

CLEAN WATER SERVICES • FY 2021-22 PROPOSED BUDGET PAGE 300
FY 2
020
Act
ual
FY 2
021
Bud
get
FY 2
021
Rev
ised
FY 2
022
Proj
ecte
dFY
202
3Pr
ojec
ted
FY 2
024
Proj
ecte
dFY
202
5Pr
ojec
ted
FY 2
026
Proj
ecte
dFY
202
2-20
26Pr
ojec
ted
Hom
e Po
rtfo
lio
$0$0
$0$0
$0$0
$0$0
$0
6755
DU
RH
AM
SO
LID
S B
UIL
DIN
G O
DO
R C
ON
TRO
L M
OD
IFIC
ATI
ON
S-
Phas
e 2
$0$0
$0$0
$0$0
$0$0
$0
6823
DU
RH
AM
HYP
O L
OO
P REP
LAC
EMEN
T/D
AY
TAN
KS
$0$0
$0$0
$0$0
$0$0
$0
6859
DU
RH
AM
OU
TFALL
D R
EPAIR
$0$0
$0$0
$0$0
$0$0
$0
6900
DU
RH
AM
STR
UVIT
E PR
EVEN
TIO
N P
RO
JEC
T$0
$0$0
$0$0
$0$0
$0$0
6907
DU
RH
AM
EFF
LUEN
T SAM
PLER
REL
OC
ATI
ON
$0$0
$0$0
$0$0
$0$0
$0
6920
DU
RH
AM
SU
LFU
REX
H2S
REM
OVAL
SYS
TEM
$0$0
$0$0
$0$0
$0$0
$0
6921
DU
RH
AM
VFA
DEL
IVER
Y SYS
TEM
IM
PRO
VEM
ENTS
$0$0
$0$0
$0$0
$0$0
$0
6933
DU
RH
AM
BO
ILER
CO
NTR
OLS
$118
$0$0
$0$0
$0$0
$0$0
6935
DU
RH
AM
502
0 M
CC
SPA
CE
A/C
UN
IT$0
$0$0
$0$0
$0$0
$0$0
6936
DU
RH
AM
FIL
TER T
UN
NEL
ELE
C R
OO
M A
/C$7
7,64
6$0
$0$0
$0$0
$0$0
$0
6991
DU
RH
AM
PRIM
ARY
SLU
DG
E H
EATI
NG
$5,3
52$0
$0$0
$0$0
$0$0
$0
7091
DU
RH
AM
HYP
O B
ULK
TAN
K R
EPLA
CEM
ENT
$0$2
00,0
00$0
$0$0
$0$0
$0$0
$83,
116
$200
,000
$0$0
$0$0
$0$0
$0
6662
PLAN
T LI
GH
TIN
G U
PGRAD
E/EV
ALU
ATI
ON
$0$0
$0$0
$0$0
$0$0
$0
6967
DU
RH
AM
TRAIN
5 U
NIT
SU
BSTA
TIO
N A
ND
SW
ITC
HG
EAR
$1,5
72,7
08$0
$0$0
$0$0
$0$0
$0
$1,5
72,7
08$0
$0$0
$0$0
$0$0
$0
6698
FERN
HIL
L N
TS W
EST
WET
LAN
DS
$18,
480
$0$0
$0$0
$0$0
$0$0
6750
FERN
HIL
L N
TS S
OU
TH W
ETLA
ND
S$1
21,4
56$0
$0$0
$0$0
$0$0
$0
6880
FORES
T G
RO
VE
OU
TFALL
REP
LAC
EMEN
T$1
,656
,441
$0$0
$0$0
$0$0
$0$0
6952
FORES
T G
RO
VE
SU
PPLE
MEN
TAL
ALK
ALI
NIT
Y$1
,166
$0$0
$0$0
$0$0
$0$0
$1,7
97,5
43$0
$0$0
$0$0
$0$0
$0
6812
HIL
LSBO
RO
OD
OR A
BATE
MEN
T$8
8,36
8$0
$0$0
$0$0
$0$0
$0
6950
HIL
LSBO
RO
EN
TRY
GATE
AN
D C
OLL
ECTI
ON
BO
X M
OD
IFIC
ATI
ON
S$8
46,0
08$1
00,0
00$0
$0$0
$0$0
$0$0
$934
,376
$100
,000
$0$0
$0$0
$0$0
$0
6632
WASSTR
IP P
ATE
NT
AC
QU
ISIT
ION
S$7
,915
$0$0
$0$0
$0$0
$0$0
$7,9
15$0
$0$0
$0$0
$0$0
$0
B-S
TREE
T PU
MP
STA
TIO
N U
PGRAD
E$0
$20,
000
$0$0
$0$0
$0$0
$0
WR
RD
- D
urh
am
WR
RD
- E
lect
rica
l &
In
stru
men
tati
on
WR
RD
- F
ores
t G
rove
WR
RD
- H
ills
bor
o
WR
RD
- M
isce
llan
eou
s (T
reat
men
t)
WR
RD
- P
um
p S
tati
on
s (T
reat
men
t)
FIN
AL
San
i CIP
Ind
ex.x
lsx
Pag
e 15
of
16

CLEAN WATER SERVICES • FY 2021-22 PROPOSED BUDGET PAGE 301
FY 2
020
Act
ual
FY 2
021
Bud
get
FY 2
021
Rev
ised
FY 2
022
Proj
ecte
dFY
202
3Pr
ojec
ted
FY 2
024
Proj
ecte
dFY
202
5Pr
ojec
ted
FY 2
026
Proj
ecte
dFY
202
2-20
26Pr
ojec
ted
Hom
e Po
rtfo
lio
6554
BU
TTER
NU
T PU
MP
STA
TIO
N &
FO
RC
EMAIN
$200
$0$0
$0$0
$0$0
$0$0
6756
GASTO
N F
ORC
EMAIN
REP
LAC
EMEN
T$0
$0$0
$0$0
$0$0
$0$0
6825
DAW
SO
N C
REE
K P
UM
P STA
TIO
N &
GRAVIT
Y SYS
TEM
CAPA
CIT
Y ALT
ERN
ATI
VES
$530
$0$0
$0$0
$0$0
$0$0
6887
OAK V
ILLA
GE
& F
IR G
RO
VE
WET
WEL
L IM
PRO
VEM
ENTS
$422
$0$0
$0$0
$0$0
$0$0
6902
CO
RN
ELIU
S P
UM
P STA
TIO
N I
MPR
OVEM
ENTS
$263
,209
$0$0
$0$0
$0$0
$0$0
$264
,361
$20,
000
$0$0
$0$0
$0$0
$0
6848
ELEC
TRIC
AL
EQU
IPM
ENT
MIS
C U
PGRAD
ES$1
4,57
9$0
$0$0
$0$0
$0$0
$0
6888
DU
RH
AM
CH
EMIC
AL
BU
ILD
ING
MAU
REP
LAC
EMEN
T PR
OJE
CT
$594
,654
$0$0
$0$0
$0$0
$0$0
6926
DIF
FUSER
REP
LAC
EMEN
TS$0
$0$0
$0$0
$0$0
$0$0
6932
VALV
E/G
ATE
& A
CTU
ATO
RS R
EPLA
CEM
ENT
$0$0
$0$0
$0$0
$0$0
$0
7002
RO
CK C
REE
K E
NG
INE
GEN
ERATO
R 2
REP
LAC
EMEN
T$5
,462
$0$0
$0$0
$0$0
$0$0
$614
,695
$0$0
$0$0
$0$0
$0$0
6867
RO
CK C
REE
K R
ESIL
IEN
CY
PLAN
$0$0
$0$0
$0$0
$0$0
$0
6937
RO
CK C
REE
K S
RF
pH R
EDU
CTI
ON
SYS
TEM
$1,9
01$0
$0$0
$0$0
$0$0
$0
$1,9
01$0
$0$0
$0$0
$0$0
$0
$15,
738,
046
$395
,000
$82,
000
$0$0
$0$0
$0$0
$80,
049,
727
$81,
274,
600
$67,
948,
564
$89,
193,
500
$95,
786,
300
$89,
556,
300
$76,
714,
900
$91,
334,
800
$442
,585
,800
$1,0
95,0
00$5
,535
,000
$5,0
65,0
00$1
8,44
0,00
0$2
4,24
9,00
0$5
,075
,000
$7,4
50,0
00$6
0,27
9,00
0
$843
,000
$765
,000
$1,0
13,5
00$1
,125
,000
$913
,000
$982
,300
$556
,000
$4,5
89,8
00
$5,7
90,1
00$3
,080
,200
$4,3
49,0
00$5
40,0
00$4
65,0
00$4
15,0
00$0
$5,7
69,0
00
$6,0
93,0
00$4
,988
,100
$6,2
29,7
00$4
,706
,300
$4,1
24,3
00$2
,707
,600
$873
,800
$18,
641,
700
$2,3
60,5
00$5
33,0
00$1
,500
,000
$1,0
00,0
00$1
,000
,000
$1,0
00,0
00$1
,000
,000
$5,5
00,0
00
$20,
360,
000
$14,
358,
500
$25,
799,
300
$21,
765,
000
$28,
285,
000
$27,
405,
000
$24,
685,
000
$127
,939
,300
$44,
733,
000
$38,
688,
764
$45,
237,
000
$48,
210,
000
$30,
520,
000
$39,
130,
000
$56,
770,
000
$219
,867
,000
$81,
274,
600
$67,
948,
564
$89,
193,
500
$95,
786,
300
$89,
556,
300
$76,
714,
900
$91,
334,
800
$442
,585
,800
WR
RD
- R
epla
cem
ent
and
Ren
ewal
WR
RD
- R
ock
Cre
ek
Clo
sed
Pro
ject
s
All
Pro
ject
s
En
terp
rise
Ass
et &
Tec
hn
ical
Ser
vice
s/Fa
cilit
ies
Flee
t
Su
pp
ort
Nat
ura
l S
yste
ms
Wat
er S
up
ply
Uti
lity
Op
erat
ion
s
Wat
er R
esou
rce
Rec
over
y
TO
TA
L
FIN
AL
San
i CIP
Ind
ex.x
lsx
Pag
e 16
of
16

CLEAN WATER SERVICES • FY 2021-22 PROPOSED BUDGET PAGE 302
SU
RFA
CE
WA
TE
R C
AP
ITA
L P
RO
JEC
T L
IST
FY 2
020
Act
ual
FY 2
021
Bud
get
FY 2
021
Rev
ised
FY 2
022
Proj
ecte
dFY
202
3Pr
ojec
ted
FY 2
024
Proj
ecte
dFY
202
5Pr
ojec
ted
FY 2
026
Proj
ecte
dFY
202
2-20
26Pr
ojec
ted
7022
IoT
SEN
SO
R D
EPLO
YMEN
T$1
15,6
07$1
07,5
00$9
4,70
0$1
18,5
00$0
$0$0
$0$1
18,5
00
$115
,607
$107
,500
$94,
700
$118
,500
$0$0
$0$0
$118
,500
BU
TTER
NU
T C
REE
K N
EAR 2
09TH
STO
RM
WATE
R
MAN
AG
EMEN
T APP
RO
AC
H$0
$0$0
$65,
000
$82,
000
$65,
000
$40,
000
$900
,000
$1,1
52,0
00
4944
WET
LAN
D M
ITIG
ATI
ON
MO
NIT
ORIN
G (
SW
M)
$33,
390
$133
,500
$121
,000
$125
,400
$104
,500
$82,
500
$22,
000
$60,
500
$394
,900
6522
PAYM
ENT
TO P
RO
VID
E PR
OJE
CTS
$8,7
49$5
0,00
0$3
0,00
0$5
0,00
0$5
0,00
0$5
0,00
0$5
0,00
0$0
$200
,000
6706
WES
T BET
HAN
Y C
REE
K E
NH
AN
CEM
ENT
$61,
408
$80,
000
$80,
000
$390
,000
$60,
000
$60,
000
$60,
000
$0$5
70,0
00
6800
SPR
ING
VIL
LE P
AYM
ENT
TO P
RO
VID
E$9
,974
$20,
000
$20,
000
$0$0
$0$0
$0$0
6927
VEG
ETATE
D C
ORRID
OR E
NH
AN
CEM
ENT
$56,
001
$137
,000
$137
,000
$171
,000
$114
,000
$47,
000
$46,
000
$35,
000
$413
,000
$169
,522
$420
,500
$388
,000
$801
,400
$410
,500
$304
,500
$218
,000
$995
,500
$2,7
29,9
00
6957
WATE
RSH
ED V
ISU
ALI
ZATI
ON
& A
SSES
SM
ENT
TOO
LS$0
$0$0
$0$0
$0$0
$0$0
$0$0
$0$0
$0$0
$0$0
$0
SW
M L
ID$0
$25,
000
$0$2
5,00
0$2
5,00
0$2
5,00
0$2
5,00
0$2
5,00
0$1
25,0
00
$0$2
5,00
0$0
$25,
000
$25,
000
$25,
000
$25,
000
$25,
000
$125
,000
6710
ABBEY
CREE
K W
EST
TRIB
REA
CH
D$3
9,41
9$0
$0$0
$0$0
$0$0
$0
$39,
419
$0$0
$0$0
$0$0
$0$0
6838
SW
M L
IGH
T &
MED
IUM
DU
TY V
EHIC
LE
REP
LAC
EMEN
T$7
5,41
0$0
$0$1
63,0
00$0
$71,
500
$0$8
2,20
0$3
16,7
00
$75,
410
$0$0
$163
,000
$0$7
1,50
0$0
$82,
200
$316
,700
103R
D T
O 1
06TH
AVE
STO
RM
IM
PRO
VEM
ENTS
$0$0
$0$0
$0$0
$0$0
$0
108T
H &
LO
ST
PARK S
TORM
IM
PRO
VEM
ENT
$0$1
50,0
00$5
,000
$0$0
$0$1
00,0
00$3
00,0
00$4
00,0
00
165T
H &
FLO
REN
CE
STO
RM
IM
PRO
VEM
ENT
$0$0
$0$0
$0$0
$0$0
$0
UO
PS
- C
on
veya
nce
En
gr
- R
epla
cem
ent
and
Ren
ewal
(Fl
eet)
UO
PS
- C
on
veya
nce
En
gr
- S
torm
wat
er C
onve
yan
ce S
yste
m
Dig
ital
Sol
uti
on
s -
Bu
sin
ess
Ap
pli
cati
on
s
NS
ES
- N
SES
En
han
cem
ent
Reg
ula
tory
- A
dm
in -
Reg
ula
tory
Aff
airs
UO
PS
- C
on
veya
nce
En
gr
- LI
D
UO
PS
- C
on
veya
nce
En
gr
- N
SE
S E
nh
ance
men
t
CIP
Inde
xLin
e of
Bus
ines
s: SW
MPr
ojec
t Typ
e: C
apita
l
Hom
e Po
rtfo
lio
Act
ive
Pro
ject
s
FIN
AL
SW
M I
ndex
.xls
x 3
/18/
2021
10:
57:5
8 AM
P
age
1 of
1

CLEAN WATER SERVICES • FY 2021-22 PROPOSED BUDGET PAGE 303
FY 2
020
Act
ual
FY 2
021
Bud
get
FY 2
021
Rev
ised
FY 2
022
Proj
ecte
dFY
202
3Pr
ojec
ted
FY 2
024
Proj
ecte
dFY
202
5Pr
ojec
ted
FY 2
026
Proj
ecte
dFY
202
2-20
26Pr
ojec
ted
Hom
e Po
rtfo
lio
177T
H &
RIC
HARD
CT
STO
RM
IM
PRO
VEM
ENT
$0$0
$0$0
$0$0
$100
,000
$150
,000
$250
,000
192N
D &
BLA
INE
TER.
STO
RM
IM
PRO
VEM
ENT
$0$0
$0$0
$0$0
$0$0
$0
195t
h AN
D F
ARM
ING
TON
STR
EAM
EN
HAN
CEM
ENT
$0$0
$0$0
$0$0
$0$0
$0
209T
H &
BLA
NTO
N$0
$0$0
$0$2
5,00
0$2
75,0
00$4
00,0
00$0
$700
,000
209T
H A
ND
KIN
NAM
AN
ST
STO
RM
IM
PRO
VEM
ENTS
$0$0
$0$2
5,00
0$3
50,0
00$2
50,0
00$0
$0$6
25,0
00
77TH
(BH
HW
Y TO
BRO
AD
MO
OR T
ERR)
STO
RM
IM
P$0
$0$0
$0$0
$0$0
$0$0
81ST
PLAC
E &
MIL
LER R
D S
TORM
IM
PRO
VEM
ENT
$0$0
$0$0
$0$0
$25,
000
$150
,000
$175
,000
84TH
CT
AN
D C
OPE
LAN
D S
T O
UTF
ALL
RET
RO
FIT
$0$0
$0$0
$0$0
$50,
000
$400
,000
$450
,000
ARRAN
MO
RE
WAY
NEA
R M
ON
TCLA
IR
ELEM
ENTA
RY
STO
RM
IM
PRO
VEM
ENT
$0$0
$0$0
$10,
000
$75,
000
$100
,000
$0$1
85,0
00
BU
TTER
NU
T C
K E
NH
AN
CEM
ENT
AT
BALE
S
PON
D$0
$0$0
$0$0
$0$0
$0$0
CED
AR H
ILLS
BLV
D S
TORM
IM
PRO
VEM
ENT
$0$1
0,00
0$5
,000
$0$0
$0$2
5,00
0$6
50,0
00$6
75,0
00
EDG
EMO
OR &
JEN
KIN
S W
QF
$0$0
$0$0
$0$0
$0$0
$0
FARM
ING
TON
RO
AD
& 2
04TH
$0$0
$0$0
$0$0
$0$0
$0
FED
ERAL
AG
ENC
Y LI
AIS
ON
PER
MIT
TIN
G
SU
PPO
RT
$0$7
5,00
0$7
5,00
0$0
$0$0
$0$0
$0
FLO
W D
ATA
CO
LLEC
TIO
N &
AN
ALY
SIS
$0$0
$0$1
25,0
00$1
25,0
00$5
0,00
0$5
0,00
0$5
0,00
0$4
00,0
00
HO
MEW
OO
D (
LAU
REL
WO
OD
TO
88T
H)
$0$0
$0$0
$0$0
$0$0
$0
JAM
IESO
N R
OAD
STO
RM
WATE
R
IMPR
OVEM
ENTS
$0$0
$0$0
$0$0
$0$0
$0
JAY
ST
& B
URLI
NG
TON
/BO
WER
MAN
DR W
QF
RET
RO
FIT
$0$0
$0$0
$0$0
$0$0
$0
JAYL
EE S
T AN
D 1
89TH
STO
RM
IM
PRO
VEM
ENT
$0$0
$0$0
$0$0
$0$0
$0
KIN
G C
HARLE
S A
ND
QU
EEN
MARY
STO
RM
IM
PRO
VEM
ENT
$0$0
$0$0
$0$5
0,00
0$3
75,0
00$2
5,00
0$4
50,0
00
LAID
LAW
CU
LVER
T$0
$0$0
$0$0
$0$0
$0$0
LAN
DAU
& 8
5TH
STO
RM
IM
PRO
VEM
ENT
$0$0
$0$0
$0$0
$0$0
$0
LAN
EWO
OD
ST
& S
W D
ELM
ON
T AVE
WQ
F RET
RO
FIT
$0$0
$0$0
$0$0
$0$0
$0
MAD
ELIN
E &
186
TH P
L STO
RM
IM
PRO
VEM
ENT
$0$0
$0$0
$0$0
$0$2
25,0
00$2
25,0
00
MAU
I &
90T
H S
TORM
IM
PRO
VEM
ENT
$0$0
$0$0
$0$0
$0$0
$0
MIL
LER R
D S
TORM
IM
PRO
VEM
ENT
$0$0
$0$0
$0$0
$0$0
$0
PETT
YGRO
VE
ST
NEA
R T
ERRA L
IND
A
ELEM
ENTA
RY
STO
RM
IM
PRO
VEM
ENT
$0$0
$0$0
$0$0
$0$2
50,0
00$2
50,0
00
PORTL
AN
D R
EGIO
NAL
AREA
RAIN
FALL
PATT
ERN
STU
DY
$0$4
5,00
0$4
5,00
0$0
$0$0
$0$0
$0
PREL
IMIN
ARY
SU
BBASIN
& S
URFA
CE
WATE
R
PLAN
NIN
G$0
$200
,000
$200
,000
$0$0
$0$0
$0$0
FIN
AL
SW
M I
ndex
.xls
x 3
/18/
2021
10:
57:5
8 AM
P
age
1 of
1

CLEAN WATER SERVICES • FY 2021-22 PROPOSED BUDGET PAGE 304
FY 2
020
Act
ual
FY 2
021
Bud
get
FY 2
021
Rev
ised
FY 2
022
Proj
ecte
dFY
202
3Pr
ojec
ted
FY 2
024
Proj
ecte
dFY
202
5Pr
ojec
ted
FY 2
026
Proj
ecte
dFY
202
2-20
26Pr
ojec
ted
Hom
e Po
rtfo
lio
PRO
GRAM
MATI
C S
UBBASIN
& S
URFA
CE
WATE
R
PLAN
NIN
G$0
$250
,000
$250
,000
$500
,000
$500
,000
$500
,000
$500
,000
$0$2
,000
,000
QU
EEN
MARY
AVE
STO
RM
IM
PRO
VEM
ENT
$0$0
$0$0
$0$0
$0$0
$0
RALE
IGH
SW
IM P
ARK H
ALL
CREE
K
ENH
AN
CEM
ENT
$0$2
5,00
0$2
5,00
0$8
0,00
0$0
$0$0
$0$8
0,00
0
RO
SA R
D A
ND
FARM
ING
TON
RD
STO
RM
IM
PRO
VEM
ENT
$0$0
$0$0
$0$0
$0$4
25,0
00$4
25,0
00
RO
SA R
OAD
AN
D 1
85TH
STO
RM
IM
P$0
$0$0
$0$0
$0$0
$0$0
SC
IEN
CE
PARK D
RIV
E W
QF
$0$0
$0$0
$0$0
$0$0
$0
SKYH
AR D
RIV
E STO
RM
IM
PRO
VEM
ENTS
$0$0
$0$0
$0$0
$0$0
$0
SO
IL I
NFI
LTRATI
ON
EVALU
ATI
ON
$0$0
$0$0
$0$0
$0$0
$0
STA
TE A
GEN
CY
LIAIS
ON
PER
MIT
TIN
G S
UPP
ORT
$0$0
$0$0
$0$0
$0$0
$0
STO
RM
IM
PRO
VEM
ENTS
ON
BREN
TWO
OD
ST,
78
TH A
VE,
LAU
REL
ST
& L
AU
REL
WO
OD
AVE
$0$0
$0$0
$0$0
$0$0
$0
SU
BBASIN
& S
URFA
CE
WATE
R P
LAN
NIN
G
PLAC
EHO
LDER
$0$5
00,0
00$5
00,0
00$5
00,0
00$2
,000
,000
$2,0
00,0
00$2
,000
,000
$0$6
,500
,000
SW
DAN
A C
T N
EAR 2
13TH
$0$0
$0$0
$0$0
$0$0
$0
SW
PARKVIE
W A
VE
TO M
IDEA
LAN
E$0
$0$0
$0$0
$0$0
$0$0
SW
PARRW
AY
DR
$0$0
$0$0
$0$0
$0$0
$0
TV H
WY
AT
192N
D A
VE
STO
RM
IM
PRO
VEM
ENT
$0$0
$0$0
$0$0
$0$1
,700
,000
$1,7
00,0
00
WALK
ER A
ND
WES
TFIE
LD S
TORM
IM
PRO
VEM
ENT
$0$5
0,00
0$5
,000
$0$0
$0$0
$900
,000
$900
,000
YORK A
ND
192
ND
$0$0
$0$0
$0$0
$0$0
$0
4945
SW
M S
MALL
WO
RKS /
STO
RM
MASTE
R
PRO
JEC
T$2
,900
$50,
000
$50,
000
$50,
000
$100
,000
$100
,000
$100
,000
$100
,000
$450
,000
6190
DIS
TRIC
T SH
ARE
OF
DEV
ELO
PMEN
T PR
OJE
CTS
$0$2
5,00
0$2
5,00
0$2
5,00
0$2
5,00
0$2
5,00
0$2
5,00
0$2
5,00
0$1
25,0
00
6237
STO
RM
WATE
R O
UTF
ALL
RET
RO
FIT
PRO
GRAM
$11,
282
$55,
000
$40,
000
$55,
000
$500
,000
$500
,000
$500
,000
$500
,000
$2,0
55,0
00
6346
STO
RM
SEW
ER D
RAIN
AG
E PR
OJE
CTS
$44,
164
$150
,000
$35,
000
$50,
000
$50,
000
$50,
000
$50,
000
$50,
000
$250
,000
6705
TUALA
TIN
RIV
ER U
RBAN
STO
RM
WATE
R T
OO
L C
ALI
BRATI
ON
$35,
104
$100
,000
$150
,000
$100
,000
$50,
000
$0$0
$0$1
50,0
00
6707
ABBEY
CREE
K W
EST
TRIB
BASIN
4$0
$0$0
$0$0
$0$0
$0$0
6711
ABBEY
CREE
K W
EST
TRIB
REA
CH
A$7
33,3
18$2
5,00
0$2
5,00
0$0
$0$0
$0$0
$0
6806
STO
RM
WATE
R C
ON
V R
EAL
TIM
E C
ON
TRO
L$3
,587
$25,
000
$25,
000
$50,
000
$150
,000
$150
,000
$150
,000
$150
,000
$650
,000
6807
TUALA
TIN
-SH
ERW
OO
D R
D W
QF
RET
RO
FIT
$0$0
$0$0
$0$0
$0$0
$0
6869
SO
UTH
WO
OD
PARK G
REE
N S
TREE
T STO
RM
IM
PRO
VEM
ENT
$240
,939
$0$4
,000
$0$0
$0$0
$0$0
6910
BU
TTER
NU
T C
K E
NH
AN
CEM
ENT
AT
WIT
ZIG
RES
ERVO
IR$4
53,4
80$8
50,0
00$6
50,0
00$4
0,00
0$0
$0$0
$0$4
0,00
0
6911
ABBEY
CREE
K W
EST-
REA
CH
C -
RTC
PRO
JEC
T$8
5$1
0,00
0$1
0,00
0$1
50,0
00$5
0,00
0$0
$0$0
$200
,000
FIN
AL
SW
M I
ndex
.xls
x 3
/18/
2021
10:
57:5
8 AM
P
age
1 of
1

CLEAN WATER SERVICES • FY 2021-22 PROPOSED BUDGET PAGE 305
FY 2
020
Act
ual
FY 2
021
Bud
get
FY 2
021
Rev
ised
FY 2
022
Proj
ecte
dFY
202
3Pr
ojec
ted
FY 2
024
Proj
ecte
dFY
202
5Pr
ojec
ted
FY 2
026
Proj
ecte
dFY
202
2-20
26Pr
ojec
ted
Hom
e Po
rtfo
lio
6913
CED
AR M
ILL/
N J
OH
NSO
N P
RO
JEC
T PL
AN
NIN
G$1
39,3
17$4
20,0
00$3
00,0
00$6
10,0
00$4
50,0
00$2
00,0
00$2
25,0
00$0
$1,4
85,0
00
6929
STO
RM
WATE
R T
OXIC
ITY
SO
IL M
IX A
NALY
SIS
$141
$20,
000
$20,
000
$100
,000
$0$0
$0$0
$100
,000
6964
209T
H &
ALE
XAN
DER
STO
RM
IM
PRO
VEM
ENT
$0$4
00,0
00$5
0,00
0$5
0,00
0$2
,000
,000
$25,
000
$0$0
$2,0
75,0
00
6979
PILO
T STO
RM
WATE
R R
ECH
ARG
E PR
OJE
CT
$8,0
31$5
0,00
0$5
0,00
0$1
0,00
0$1
0,00
0$0
$0$0
$20,
000
6990
SH
ERW
OO
D B
RO
OKM
AN
/CED
AR C
REE
K
ASSES
SM
ENT
$109
,751
$50,
000
$30,
000
$150
,000
$350
,000
$60,
000
$0$0
$560
,000
6997
STO
RM
WATE
R B
ASIN
MASTE
R P
LAN
S$9
5,15
5$0
$0$0
$0$0
$0$0
$0
7001
177T
H &
VIN
CEN
T STO
RM
IM
PRO
VEM
ENT
$1,5
73$3
00,0
00$0
$0$0
$0$0
$700
,000
$700
,000
7004
BLA
NTO
N P
IPED
CO
NVEY
AN
CE
$396
,333
$650
,000
$1,4
31,5
00$2
0,00
0$0
$0$0
$0$2
0,00
0
7005
69TH
& R
AIL
RO
AD
STO
RM
IM
P AN
D W
OO
D
CREE
K E
NH
AN
CEM
ENT
$44,
458
$90,
000
$90,
000
$0$0
$0$0
$0$0
7008
PAM
ELA C
T STO
RM
IM
PRO
VEM
ENT
$923
$25,
000
$5,0
00$0
$25,
000
$250
,000
$500
,000
$0$7
75,0
00
7013
199T
H A
ND
JAY
STO
RM
IM
PRO
VEM
ENT
$40,
614
$0$0
$0$0
$0$0
$0$0
7014
JOH
NSO
N A
ND
AU
GU
STA
STO
RM
IM
PRO
VEM
ENT
$24,
592
$200
,000
$5,0
00$0
$375
,000
$300
,000
$0$0
$675
,000
7044
RED
RO
CK C
REE
K S
UBBASIN
$136
,808
$19,
500
$150
,000
$0$0
$0$0
$0$0
7077
RO
CK C
REE
K -
STO
RM
WATE
R M
ASTE
R P
LAN
$0$5
0,00
0$5
0,00
0$0
$0$0
$0$0
$0
7078
209T
H A
ND
IN
DU
STI
AL
DR S
TORM
IM
PRO
VEM
ENTS
$0$1
0,00
0$1
0,00
0$5
0,00
0$2
00,0
00$1
50,0
00$0
$0$4
00,0
00
7079
185T
H N
EAR E
WEN
DR S
TORM
IM
PRO
VEM
ENT
$0$4
0,00
0$5
,000
$0$2
5,00
0$2
25,0
00$0
$0$2
50,0
00
7093
198T
H A
VE
STO
RM
WATE
R T
REA
TMEN
T REA
L TI
ME
CO
NTR
OL
$0$1
00,0
00$5
20,0
00$2
20,0
00$2
20,0
00$0
$0$0
$440
,000
$2,5
22,5
55$5
,019
,500
$4,8
40,5
00$2
,960
,000
$7,5
90,0
00$5
,235
,000
$5,2
75,0
00$6
,750
,000
$27,
810,
000
6799
STO
RM
CM
P C
ON
VEY
AN
CE
REH
AB
$42,
917
$100
,000
$100
,000
$100
,000
$100
,000
$100
,000
$100
,000
$100
,000
$500
,000
6975
ARBO
R L
AKES
DEC
AN
T VAU
LT S
ITE
IMPR
OVEM
ENT
$1,4
50$5
0,00
0$1
0,00
0$1
0,00
0$1
25,0
00$9
5,00
0$0
$0$2
30,0
00
7087
STO
RM
SEW
ER R
EHABIL
ITATI
ON
$0$1
00,0
00$1
00,0
00$1
00,0
00$1
00,0
00$1
00,0
00$1
00,0
00$1
00,0
00$5
00,0
00
$44,
367
$250
,000
$210
,000
$210
,000
$325
,000
$295
,000
$200
,000
$200
,000
$1,2
30,0
00
6222
SW
M L
IGH
T &
MED
IUM
DU
TY V
EHIC
LE
AD
DIT
ION
S$0
$0$0
$0$0
$0$0
$0$0
6304
SW
M H
EAVY
VEH
ICLE
AD
DIT
ION
S$0
$0$0
$0$0
$0$0
$0$0
$0$0
$0$0
$0$0
$0$0
$0
6839
SW
M H
EAVY
VEH
ICLE
REP
LAC
EMEN
T$1
53,6
77$6
48,0
00$6
45,0
00$1
65,0
00$1
66,0
00$0
$165
,000
$570
,000
$1,0
66,0
00
$153
,677
$648
,000
$645
,000
$165
,000
$166
,000
$0$1
65,0
00$5
70,0
00$1
,066
,000
$3,1
20,5
57$6
,470
,500
$6,1
78,2
00$4
,442
,900
$8,5
16,5
00$5
,931
,000
$5,8
83,0
00$8
,622
,700
$33,
396,
100
Act
ive
Pro
ject
s
UO
PS
- F
ield
Op
s -
Fiel
d O
per
atio
ns
UO
PS
- F
ield
Op
s -
Flee
t
UO
PS
- F
ield
Op
s -
Rep
lace
men
t an
d R
enew
al (
Flee
t)
FIN
AL
SW
M I
ndex
.xls
x 3
/18/
2021
10:
57:5
8 AM
P
age
1 of
1
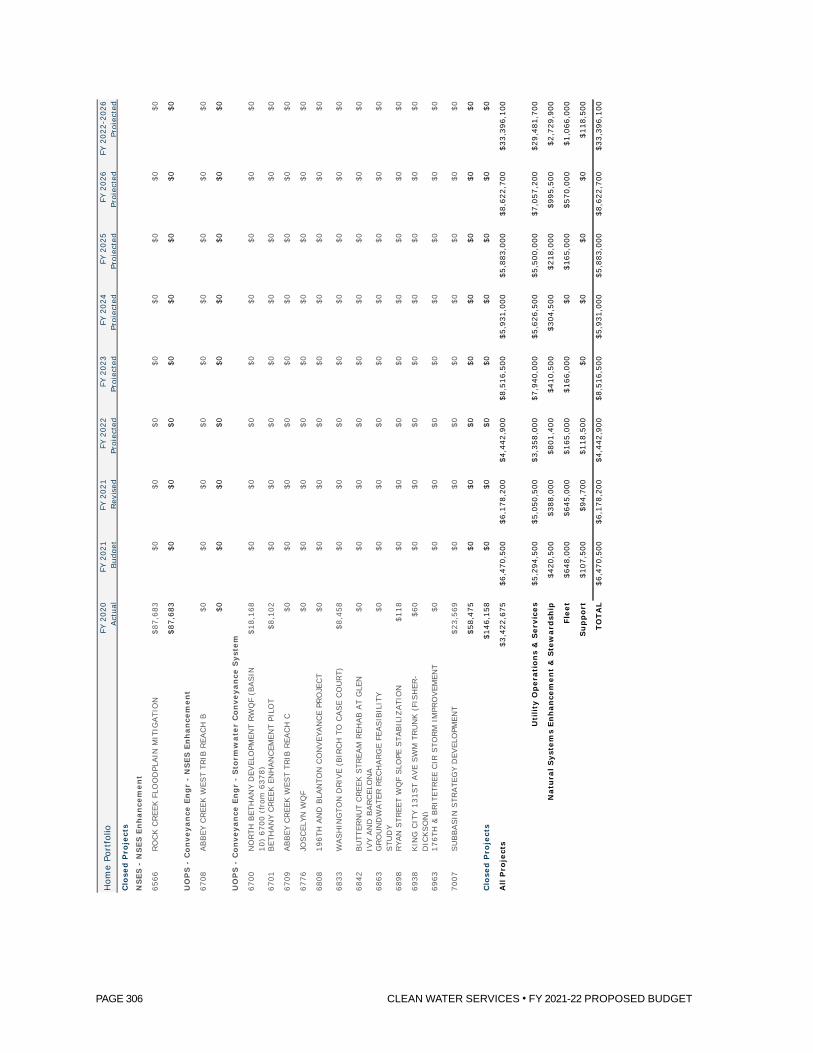
CLEAN WATER SERVICES • FY 2021-22 PROPOSED BUDGET PAGE 306
FY 2
020
Act
ual
FY 2
021
Bud
get
FY 2
021
Rev
ised
FY 2
022
Proj
ecte
dFY
202
3Pr
ojec
ted
FY 2
024
Proj
ecte
dFY
202
5Pr
ojec
ted
FY 2
026
Proj
ecte
dFY
202
2-20
26Pr
ojec
ted
Hom
e Po
rtfo
lio
6566
RO
CK C
REE
K F
LOO
DPL
AIN
MIT
IGATI
ON
$87,
683
$0$0
$0$0
$0$0
$0$0
$87,
683
$0$0
$0$0
$0$0
$0$0
6708
ABBEY
CREE
K W
EST
TRIB
REA
CH
B$0
$0$0
$0$0
$0$0
$0$0
$0$0
$0$0
$0$0
$0$0
$0
6700
NO
RTH
BET
HAN
Y D
EVEL
OPM
ENT
RW
QF
(BASIN
10
) 67
00 (
from
637
8)$1
8,16
8$0
$0$0
$0$0
$0$0
$0
6701
BET
HAN
Y C
REE
K E
NH
AN
CEM
ENT
PILO
T$8
,102
$0$0
$0$0
$0$0
$0$0
6709
ABBEY
CREE
K W
EST
TRIB
REA
CH
C$0
$0$0
$0$0
$0$0
$0$0
6776
JOSC
ELYN
WQ
F$0
$0$0
$0$0
$0$0
$0$0
6808
196T
H A
ND
BLA
NTO
N C
ON
VEY
AN
CE
PRO
JEC
T$0
$0$0
$0$0
$0$0
$0$0
6833
WASH
ING
TON
DRIV
E (B
IRC
H T
O C
ASE
CO
URT)
$8,4
58$0
$0$0
$0$0
$0$0
$0
6842
BU
TTER
NU
T C
REE
K S
TREA
M R
EHAB A
T G
LEN
IV
Y AN
D B
ARC
ELO
NA
$0$0
$0$0
$0$0
$0$0
$0
6863
GRO
UN
DW
ATE
R R
ECH
ARG
E FE
ASIB
ILIT
Y STU
DY
$0$0
$0$0
$0$0
$0$0
$0
6898
RYA
N S
TREE
T W
QF
SLO
PE S
TABIL
IZATI
ON
$118
$0$0
$0$0
$0$0
$0$0
6938
KIN
G C
ITY
131S
T AVE
SW
M T
RU
NK (
FISH
ER-
DIC
KSO
N)
$60
$0$0
$0$0
$0$0
$0$0
6963
176T
H &
BRIT
ETREE
CIR
STO
RM
IM
PRO
VEM
ENT
$0$0
$0$0
$0$0
$0$0
$0
7007
SU
BBASIN
STR
ATE
GY
DEV
ELO
PMEN
T$2
3,56
9$0
$0$0
$0$0
$0$0
$0
$58,
475
$0$0
$0$0
$0$0
$0$0
$146
,158
$0$0
$0$0
$0$0
$0$0
$3,4
22,6
75$6
,470
,500
$6,1
78,2
00$4
,442
,900
$8,5
16,5
00$5
,931
,000
$5,8
83,0
00$8
,622
,700
$33,
396,
100
$5,2
94,5
00$5
,050
,500
$3,3
58,0
00$7
,940
,000
$5,6
26,5
00$5
,500
,000
$7,0
57,2
00$2
9,48
1,70
0
$420
,500
$388
,000
$801
,400
$410
,500
$304
,500
$218
,000
$995
,500
$2,7
29,9
00
$648
,000
$645
,000
$165
,000
$166
,000
$0$1
65,0
00$5
70,0
00$1
,066
,000
$107
,500
$94,
700
$118
,500
$0$0
$0$0
$118
,500
$6,4
70,5
00$6
,178
,200
$4,4
42,9
00$8
,516
,500
$5,9
31,0
00$5
,883
,000
$8,6
22,7
00$3
3,39
6,10
0
Su
pp
ort
TO
TA
L
Clo
sed
Pro
ject
s
All
Pro
ject
s
Uti
lity
Op
erat
ion
s &
Ser
vice
s
Nat
ura
l S
yste
ms
En
han
cem
ent
& S
tew
ard
ship
Flee
t
Clo
sed
Pro
ject
s
NS
ES
- N
SES
En
han
cem
ent
UO
PS
- C
on
veya
nce
En
gr
- N
SE
S E
nh
ance
men
t
UO
PS
- C
on
veya
nce
En
gr
- S
torm
wat
er C
onve
yan
ce S
yste
m
FIN
AL
SW
M I
ndex
.xls
x 3
/18/
2021
10:
57:5
8 AM
P
age
1 of
1

CLEAN WATER SERVICES • FY 2021-22 PROPOSED BUDGET PAGE 307
GLOSSARYaccrual basis of accounting: Method of accounting recognizing transactions when they occur without regard to cash flow timing.
appropriation: The legal authorization to spend and collect funds. The Board of Directors adopts a Resolution and Order setting budget appropriations for the ensuing year. Expenditures cannot legally exceed appropriations, and appropriations lapse at the end of the fiscal year.
approved budget: (see budget phases)
assessed value (AV): The value of a property, as determined by the Department of Assessment and Taxation. AV was used to compute the rate per $1,000 needed to pay the District’s general obligation debt until Fiscal Year 1997-98 when the District chose to come off the tax rolls and retire remaining debt with fund balances and interest earnings.
assessment bond: A funding method that allowed local property owners to finance long-term debt using the credit rating of the District, most often used for Local Improvement Districts. Formerly referred to Bancroft Bonds.
audit: The annual review and report of the financial status and procedures of the District, performed by an outside auditor. The report addresses the financial condition of each fund and compares actual expenditure and revenues to budgeted amounts. The audit also reviews procedures for compliance with statutes.
average daily flow: The average flow in a system during a 24 hour period, expressed in million gallons per day (mgd), and determined for a multiple day period (i.e., month, quarter, year).
balanced budget: A budget in which the resources equal the requirements in every fund.
base charge: The portion of the sanitary sewer service charge based on the fixed costs of service. For an individual account it is calculated by multiplying the number of Equivalent Dwelling Units times the base rate.
basis of accounting and budgeting: For financial reporting purposes the financial statements are presented on a full accrual basis of accounting, where revenues are recorded when they are earned and expenses are recorded at the time liabilities are incurred regardless of the timing of related cash inflows and outflows.
The District’s budget is prepared on a modified accrual basis of accounting where revenues are recognized as soon as they are both

CLEAN WATER SERVICES • FY 2021-22 PROPOSED BUDGET PAGE 308
measureable and available. For financial reporting and operating purposes, the District’s activities are considered to be composed of two enterprise operations and, as such, those activities are reported in two enterprise funds. However, for legal requirements set forth in Oregon Local Budget Law, the District is required to prepare and adopt a budget by individual funds.
benchmarking: A systematic process of searching for best practices, innovative ideas and highly effective operating procedures that leads to superior performance — and then adapting those practices, ideas and procedures to improve the performance of the organization.
biosolids: The general term for all solid by products of the District’s treatment processes. The material can be used in composting, as a soil amendment or applied to farm acreage.
Board of Directors: The five-member policy board for the District, which is also the elected Board of Commissioners for Washington County.
bond rating: A rating based on the issuer’s perceived ability to repay a bond debt. The District continues to maintain favorable bond ratings with Standard and Poor’s Corporation and Moody’s Investors Service, which rated the District’s most recently issued long-term insured revenue bond debt at AAA and Aa1, respectively.
bonded debt: Debt in the form of general obligation or revenue bonds. Repayment is made by revenues from tax collections, operating revenues and/or capital contributions.
Budget Committee: The Board of Directors and five community members appointed by the Board to review the proposed budget. Their action on the proposed budget results in the approved budget.
budget phases: Local budget law and District procedures require that the adopted budget for each fiscal year be the result of a three-step process that requires input by the Board of Directors, Clean Water Services Advisory Commission, District management and citizens before final appropriations are authorized. These steps are:
proposed budget: The document developed by District management based on requests for programs and appropriations from staff and reviewed by the Budget Committee in a public hearings.
approved budget: The proposed budget is reviewed, modified and developed into the approved budget, which is submitted to the Board of Directors for adoption following additional public hearings.

CLEAN WATER SERVICES • FY 2021-22 PROPOSED BUDGET PAGE 309
adopted budget: The acceptance of the approved budget authorizes actual appropriations. Rates and charges, staffing levels and other specific actions are adopted by the Board, in addition to the budget resolution.
budget resolution: The Resolution and Order adopted by the Board of Directors that sets appropriations for the ensuing fiscal year. Expenditures cannot legally exceed appropriations, and appropriations lapse at the end of the fiscal year.
Build America Bond (BAB): Taxable municipal bonds that carry special tax credits and federal subsidies for either the bond issuer or bondholder. The program expired in 2010.
Capital Improvement Program (CIP): A detailed description of projects and capital expenditures that is used to plan for financial requirements and construction needs over a five-year period. The District’s CIP includes projects needed for expanded treatment facilities, collection systems, capital replacement and for SWM facilities. The complete five-year CIP is published in a separate document, but the first year is the basis for all construction and capital outlay expenditures included in the budget in funds 108, 208, 112, 115 and 212. Sometimes referred to as Capital Improvement Plan.
capital outlay: Expenditures for equipment that costs between $5,000 and $50,000.
ccf: 100 cubic feet equals 748 gallons, a measure of volume commonly used by the water industry.
chart of accounts: A coding structure which defines all financial transactions of the District. The chart is sufficiently detailed to track individual revenues and expenditures during the fiscal year for any given project, program, division, department or fund.
Clean Water Act: The common name of the Federal Water Pollution Control Act passed in 1972. The major objective of this Act is to restore and maintain the chemical, physical and biological integrity of the nation’s waters. The Environmental Protection Agency administers this Act.
Clean Water Institute (CWI): Clean Water Institute is a separate legal entity organized as a 501(c)(3) nonprofit. CWI is considered a component unit of Clean Water Services, but is not reported in its financial statements because transactions between CWS and CWI are deemed immaterial. District provides staff and resources for administrative support to CWI. CWI reimburses for these services under the Operating Agreement and related revenues are reported in Fund 101 as Miscellaneous Revenues (40200-42000). District also

CLEAN WATER SERVICES • FY 2021-22 PROPOSED BUDGET PAGE 310
receives payments from CWI to pay down the loan receivable under the Loan Agreement. Interest income is reported in District’s budget in Fund 101 under investment interest income (44020). No District staff draws a salary or benefits from CWI.
Clean Water Insurance Company (CWIC or the Captive): On February 16, 2016, the Clean Water Services Board of Directors instructed the District to form Clean Water Insurance Company, a wholly owned subsidiary of the District, domiciled in the state of Hawaii. The District is the sole member of this captive insurance company. The Captive is a registered Limited Liability Company formed to advance long-term risk management program savings through the use of a formalized self-insurance program that can access the reinsurance markets for additional seismic coverages as well as provide a potential for funding of loss prevention and mitigation projects to further protect District assets or recover from a seismic event. Insurance exposures covered by the Captive include the nonrepresented employee self-insurance dental and vision plans, general liability self-insured retention of $50,000, automobile liability self-insured retention of $50,000, property damage self-insured retention of $5 million, and uninsured risk within these categories up to policy limits.
Clean Water Services Advisory Commission (CWAC): A 15-member commission appointed by the Clean Water Services Board of Directors. CWAC provides policy and program analysis and interpretation to the District and acts as a point of appeal for District policy.
Community Engagement Liaisons Services: An organization that provides language, cultural contextualization and interpretation services for government and private entities that help improve communication, understanding and civic engagement. The program is dedicated to providing underserved communities with consistent training and active involvement with local agencies, associations and partners. Services include engagement, facilitation, translation and subject matter resources.
competitiveness: A District initiative intended to ensure Clean Water Services provides unparalleled value in the services we provide our customers.
connection fee (sanitary): A fee charged by the District to recover expenditures for treatment and collection facilities. The funds are placed in the Capital Reserve Fund (107) and transferred to the Sanitary Sewer Construction Fund (112) and other funds to support improvements to the system. Also referred to as a System Development Charge (SDC).

CLEAN WATER SERVICES • FY 2021-22 PROPOSED BUDGET PAGE 311
connection fee (storm and surface water): Similar to the sanitary fee, the charge supports construction of systems designed to collect surface water runoff (e.g., culverts, detention ponds). Also referred to as fee in lieu of constructing on-site facilities. Also referred to as a System Development Charge (SDC).
consumption based rates (CBR): The rate structure implemented by the District on July 1, 1994, that incorporates a customer’s preceding winter water consumption into the calculation of sanitary sewer bills on the ensuing fiscal year.
contingency: An estimated appropriation in each fund where operations may necessitate spending during the year on items not specifically identified and included in the current budget. Contingency funds must be transferred to another appropriation category via Board resolution or the supplemental budget process prior to expending.
debt service: A fund established to account for payment of general long-term debt principal and interest.
Department of Environmental Quality (DEQ): A department in Oregon state government under the direction of the Environmental Quality Commission and charged with seeking enforcement of state air and water pollution laws.
discretionary resources: Funds that can be spent for virtually any purpose, unlike a grant which must be spent on a specific project. Discretionary resources may be appropriated for any purpose within the restrictions set by the Budget Committee, local budget law and the Board of Directors.
District: Acceptable second reference for Clean Water Services.
effluent: The cleaned wastewater flowing out of sewage treatment plants.
Endangered Species Act (ESA): The Endangered Species Act is federal legislation passed in 1973 designed to protect any species that is in danger of extinction throughout all or significant portion of its range. The U.S. Fish and Wildlife Service and the National Marine Fisheries Service share responsibility for administration of the ESA.
enterprise fund: A fund established to account for operations that are financed and operated in a manner similar to private business enterprises. The fund is usually self-supporting. Examples of enterprise funds are those for swimming pools, airports and parking garages.

CLEAN WATER SERVICES • FY 2021-22 PROPOSED BUDGET PAGE 312
Environmental Protection Agency (EPA): An independent agency in the executive branch of the federal government charged with protecting the environment. Primary functions are to abate and control pollution, conduct research, monitor, set standards and enforce pollution control, and support research and antipollution activities by other governmental, private and public entities.
Equivalent Dwelling Unit (EDU): An average number of fixtures (e.g., sinks) in a residence, which is used to estimate the strength and flow from any type of customer.
Equivalent Service Unit (ESU): The average amount of impervious surface on a single-family residential property (currently equal to 2,640 square feet). Used to calculate the surface water management connection fee and service charge.
expenditure: The cost to the District of goods or services utilized.
facilities plan: Comprehensive plan that reports technical solutions, public values and programs for the long-term achievement of CWS’s mission. The plan was updated in Fiscal Year 2008-09.
Fiscal Year (FY): The period from 12:01 a.m. July 1 to midnight the following June 30.
flow: The continuous movement of liquid (or electric current) from one place to another.
flow meter: A device to measure the amount of flow entering or leaving a particular process.
force main: A pipe that carries wastewater under pressure from a pump to a point of gravity flow downstream.
franchise fee: A fee paid by the District to co-implementer cities to operate within their corporate boundaries.
fund: An independent budgetary, fiscal and accounting entity used to track the expenditure and collection of appropriations for a specified purpose. The District has 13 budgetary funds for operations, reserves, debt management and construction. Nine of the funds make up the District’s Sanitary Sewer Service enterprise operation, while the remaining four funds constitute the surface water management enterprise operation. However, for financial statement reporting purposes, a single unitary disclosure is provided for all budgetary funds.
fund balance: In the case of funds subject to budgetary accounting (which is the case for all of the District’s funds), fund balance represents the excess of the fund’s assets and estimated revenues over its liabilities, reserves and appropriations for the period.

CLEAN WATER SERVICES • FY 2021-22 PROPOSED BUDGET PAGE 313
General Fund: The main operating fund used to account for all financial resources, except those required to be accounted for in another fund.
general obligation debt: Long-term debt that is backed by credit and can be paid by assessment of property taxes.
Geographic Information System (GIS): An information management system based on the geography of an area.
gravity flow: Wastewater flowing by gravity from a higher to a lower elevation.
impeller: A rotating set of vanes in a pump that pumps or lifts water.
infiltration: The water entering a sewer system and service connections through defective pipes, pipe joints, connections, manhole walls, etc. Infiltration does not include inflow.
inflow: The water discharged into a sewer system and service connections from roof leaders, cellar, yard and area drains, foundation drains, drains from springs and swampy areas, manhole covers, cross connections, catch basins, storm waters, surface runoff, etc. Inflow does not include infiltration.
inflow and infiltration (I/I): Inflow and Infiltration, where infiltration is when groundwater enters sanitary sewers through defective pipe joints and broken pipes and inflow is when water enters sanitary sewers from inappropriate connections, causes dilution in sanitary sewers, decreases treatment efficiency, and may cause sewage volumes to exceed design capacity.
influent: Water, wastewater or other liquid flowing into a reservoir, basin or treatment plant.
Low Impact Development Approaches (LIDA): A stormwater management approach that seeks to mitigate the impacts of increased runoff using a set of planning, design and construction approaches and stormwater management practices that promote the use of natural systems for infiltration, evapotranspiration, and reuse of rainwater, and can occur at a wide range of landscape scales.
manhole: An opening in a sewer provided to allow operators or equipment to enter or leave the sewer.
Master Plan Study: The first Master Plan Study was prepared in 1969 to support the District’s formation. The District’s capital improvement program for the first 16 years was based on that study. In general, the term refers to any capital program plans adopted and approved by the Board of Directors.

CLEAN WATER SERVICES • FY 2021-22 PROPOSED BUDGET PAGE 314
Master Plan Update Study: In 1985 the District retained an engineering firm to update the original Master Plan Study. This update focused on the District’s capital requirements for 1985 2005 based on land use regulations and projected development.
materials and services: Expenditure category including costs of commodities, supplies and services provided by sources either outside or within the District (e.g., interfund reimbursements)
Metro: Metropolitan Service District. An elected regional government that provides regionwide planning and coordination to manage growth, infrastructure and development issues that cross jurisdictional boundaries.
Municipal Separate Storm Sewer System (MS4): Includes ditches, curbs, gutters, storm sewers, pipes, tunnels, storm drains and similar means of collecting or conveying runoff that does not connect with a wastewater collection system or treatment plant, discharges into waters of the U.S., and is owned and maintained by a public, “municipal” agency.
National Pollutant Discharge Elimination System (NPDES): Section 402 of the Clean Water Act. The national program for issuing, modifying, revoking and reissuing, terminating, monitoring, and enforcing permits for discharge of pollutants into waterways. An NPDES permit is issued to all point source dischargers. The NPDES permit program controls water pollution by regulating point sources that discharge pollutants into waters of the United States. Individual homes that are connected to a municipal system, use a septic system, or do not have a surface discharge do not need an NPDES permit; however, industrial, municipal and other facilities must obtain permits if their discharges go directly to surface waters.
nutrients: A general term for the components of wastewater that contribute to the growth of plants, including algae and agricultural crops.
object code: The accounting category to which an expenditure or revenue should be charged (e.g., Operating Supplies).
Oregon Association of Clean Water Agencies (ACWA): A private, not-for-profit organization that serves Oregon wastewater treatment and stormwater management agencies and their consultants.
Oregon Revised Statutes (ORS): Codified laws of the State of Oregon published every two years. Each edition incorporates all laws, and changes to the laws, enacted by the Legislative Assembly.

CLEAN WATER SERVICES • FY 2021-22 PROPOSED BUDGET PAGE 315
Other Personal Expense (OPE): Includes wage-related taxes and benefits and the cost of medical insurance for employees. The item is included in each Program Expenditure Summary Table.
overflow: Leak or spill of sewage out of the sewage collection system.
pay plan: Plan specifying the rate of pay for each job classification and employee.
personnel services: Expenses related to the compensation of salaried employees, such as health insurance and Social Security.
potable water: Water that is considered safe for domestic consumption.
processing treatment plant: The treatment plant that treats the sewage from a pump station.
project: A budget unit relating to a defined set of improvements or a study.
project number: An identification number assigned to a project.
proposed budget: (see budget phases)
pump station: A pumping facility that lifts the wastewater flow to a high enough elevation that it can flow by gravity.
rate (sanitary): The rate charged per dwelling unit for a given period of time for collection and treatment of wastewater. The fee pays for operation and maintenance of the water resource recovery facilities and collection system and is a major revenue source for repayment of revenue bonds.
rate (storm and surface water): This fee is billed monthly per Equivalent Service Unit. The revenues directly support a variety of water management, erosion control and system maintenance services.
reasonable rates: The District measures reasonable rates when comparing current rates for a household that uses a winter average of 800 cubic feet of water (ccf) to comparable utilities in the region and to the EPA Wastewater Affordability Index. EPA criteria for reasonable rates is based on a Median Household Income Index. A sanitary sewer rate less than 1% of Median Household Income is considered to be a low burden to the ratepayer; less than 2% of Median Household Income is considered to be a medium burden to the ratepayer.
representative sample: A sample that is nearly identical in content and consistency to the larger body of material being sampled.

CLEAN WATER SERVICES • FY 2021-22 PROPOSED BUDGET PAGE 316
reserves: Refers to the segregation of a portion of fund balance for specific purposes.
resource: Estimated beginning funds on hand plus anticipated receipts.
restricted fund balance: Any portion of ending fund balance of which the use is subject to externally enforceable legal restrictions imposed by creditors, grantors, contributors, laws or regulations of other governments.
revenue bond: Long-term debt paid by annual receipts. The District’s revenue bond is paid with service charge and connection fee revenues.
revised budget: Budget adopted by the governing body that has since been revised via resolution or supplemental budget to meet unexpected needs or to spend revenues not anticipated when the regular budget was adopted.
sample point: A specific point in a stream, creek or river where consistently representative samples can be taken.
service connections: The physical connection of a customer to the sanitary or surface water management systems by a pipe, culvert or drainage way.
sewage: The used water and solids from homes and businesses that flow to a water resource recovery facility.
sewer: A pipe or conduit that carries wastewater or drainage water.
sewerage: The system of sewage collection and treatment works.
sludge: The semiliquid solids from sewage or industrial wastes (raw or treated) in clarifiers or sedimentation basins.
Storm and Surface Water Management Plan: The plan unanimously approved on July 27, 1989, by the Portland Metropolitan Area Local Government Boundary Commission designating CWS as the regional stormwater service provider within CWS boundaries. The plan addressed existing and future stormwater quality and quantity issues in CWS’s service area. Elements of the plan are:
● A comprehensive maintenance program. ● Watershed planning. ● Engineering. ● Public information. ● Financial management. ● Legal support.

CLEAN WATER SERVICES • FY 2021-22 PROPOSED BUDGET PAGE 317
storm sewer: A separate pipe, conduit or open channel that carries runoff from storms, surface drainage and street wash.
Strategic Information System Plan (SISP): A master plan for the development and implementation of the District’s information technology system to ensure that the proper systems and support are in place to meet current and future information technology needs. A SISP requires developing the business process models that will define the business information needs. The SISP also includes development of the information technology architecture model and hardware/software standards, as well as a capital budget and implementation schedule.supplemental budget: A financial plan adopted during a budget period to meet unexpected needs or to appropriate revenues not anticipated when the regular budget was adopted. It cannot be used to authorize a tax.System Development Charge (SDC): (see connection fee)Title 3: The Stream and Floodplain Protection Plan, a section of Metro’s Urban Growth Management Functional Plan. The plan requires local jurisdictions to meet regional performance standards relating to water quality and floodplain management. Key elements of Title 3 compliance are contained in the District’s Standards.Total Maximum Daily Load (TMDL): A quantitative expression of the amount of a pollutant that can be present in a waterbody without causing an impairment of the applicable water quality standard for any portion of that water. TMDL updates are based upon the river meeting water quality standards and the discharges from the treatment plants as the region grows. The Tualatin River TMDL established requirements for controlling total phosphorus at the Rock Creek, Durham and Forest Grove facilities to prevent summer algal blooms that caused high pH levels in the lower Tualatin River. The TMDL was initially developed and issued by the Oregon Department of Environmental Quality (DEQ) in 1988. The phosphorus TMDL was updated in 2001 to account for background phosphorus levels in the basin and in 2012 to enable discharge from the Forest Grove treatment facility and the Natural Treatment System. The District uses a combination of biological treatment processes (bio-P) and chemical addition (alum) to meet the total phosphorus limits.treatment – primary: The treatment process which removes a substantial portion of solids in the wastewater in settling basins.treatment – secondary: Treatment after the primary treatment that adds biological processes to reduce the pollution loading. This treatment mixes oxygen with the wastewater. Three common types

CLEAN WATER SERVICES • FY 2021-22 PROPOSED BUDGET PAGE 318
of secondary treatment facilities are trickling filters, activated sludge tanks and waste stabilization ponds.treatment – tertiary: Treatment after secondary treatment that uses physical, chemical or biological processes to refine the effluent. The processes may include coagulation and sedimentation, filtration and other chemical processes to further reduce nutrients in the wastewater. Tualatin River Farm: Tualatin River Farm is located at 4490 SW Minter Bridge Road in Hillsboro. The facility provides space for the core business needs of Natural Systems Enhancement & Stewardship — native plant handling and growing facilities, structures, irrigation, storage, propagation and office spaces. unappropriated ending fund balance: Unappropriated ending fund balances are requirements, but are not appropriated expenditures. According to Oregon local budget law, ending fund balances and reserves for future expenditures must be included in the totals for each fund in the publication of the budget’s financial summary. This amount cannot be transferred by resolution or used through a supplemental budget, unless necessitated by a qualifying emergency. The purpose of estimating an unappropriated fund balance is to provide a cash or working capital balance with which to begin the following year. urban unincorporated area (UUA): Areas of the county that are not governed by a city. use: The portion of the sanitary sewer charge that is based on a customer’s water consumption.vertical flow wetlands: District is studying vertical flow wetland (VFW) technology to create an alternative, low-cost treatment system to remove ammonia. Ammonia presents a widespread water quality challenge because it is costly to remove at traditional biological treatment facilities. The technology is being developed and demonstrated as a full-scale pilot at the Forest Grove Resource Recovery Facility and the Fernhill wetlands. wastewater: The used water and solids from homes and businesses that flow to a water resource recovery facility. wet well: A compartment or tank where wastewater is collected. The suction pipe of a pump may be connected to the wet well or a submersible pump may be located in the wet well.winter period: The period from November 1 through April 30 that is used to determine winter water use for the consumption-based rate structure. Water consumption during this period is used to calculate the use portion for the following year.

CLEAN WATER SERVICES • FY 2021-22 PROPOSED BUDGET PAGE 319
working capital: Funds based on the difference between estimated revenues to be received and the amount expected to be spent.
ABBREVIATIONSABC Administrative Building Complexacre-ft acre feetACWA Association of Clean Water AgenciesAPWA American Public Works AssociationASR Aquifer Storage and RecoveryAWWA American Water Works AssociationBAB Build America BondBES (City of Portland) Bureau of Environmental ServicesBITC Billing Information Technical CommitteeBMP Best Management PracticeBOD biological oxygen demandBOD Board of DirectorsBOR (United States) Bureau of ReclamationBPR business process reengineeringBRJOC Barney Reservoir Joint Ownership CommissionBSD Business Services DepartmentCAD computer-aided designCBOD carbonaceous biological oxygen demandccf 100 cubic feet (unit of volume often used for water)CEM community engagement master contractCEO Chief Executive OfficerCIP Capital Improvement Program (or Plan)COE (U.S. Army) Corps of EngineersCPO Citizen Participation OrganizationCWAC Clean Water Services Advisory CommissionCWI Clean Water InstituteCWS Clean Water ServicesDEQ (Oregon) Department of Environmental QualityDM DurhamDSL (Oregon) Division of State LandsE & IC Electrical and Instrumentation Controls
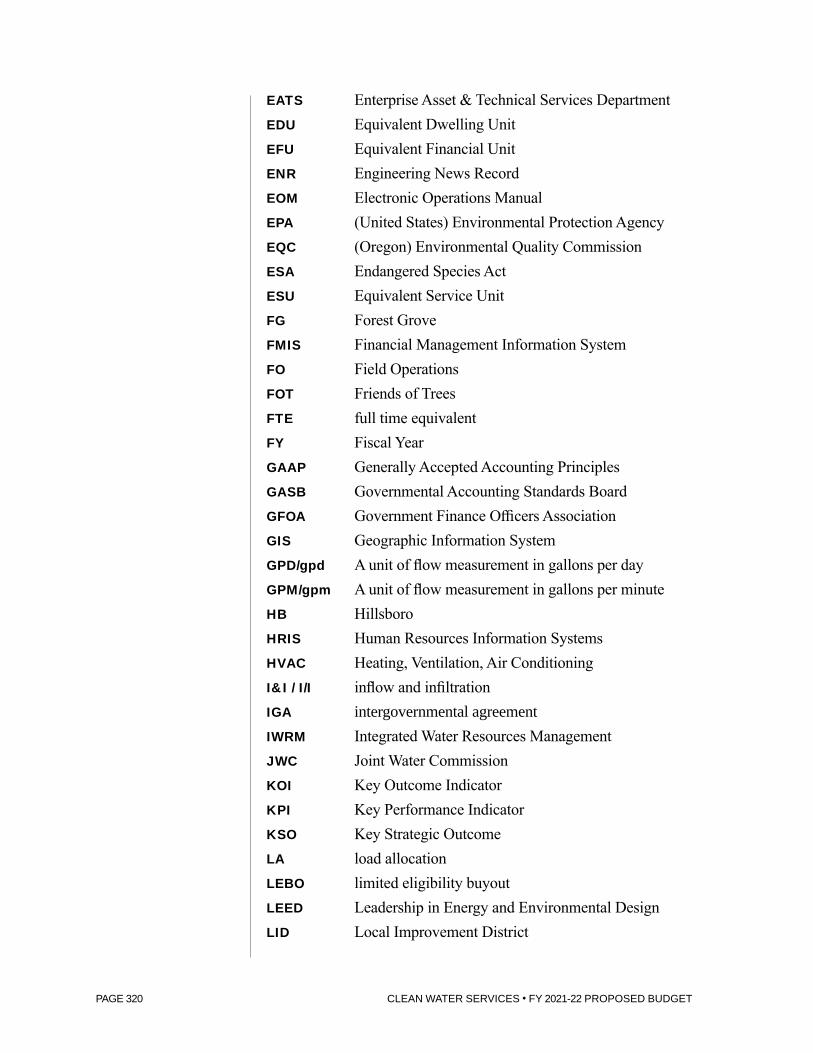
CLEAN WATER SERVICES • FY 2021-22 PROPOSED BUDGET PAGE 320
EATS Enterprise Asset & Technical Services DepartmentEDU Equivalent Dwelling UnitEFU Equivalent Financial UnitENR Engineering News RecordEOM Electronic Operations ManualEPA (United States) Environmental Protection AgencyEQC (Oregon) Environmental Quality CommissionESA Endangered Species ActESU Equivalent Service UnitFG Forest GroveFMIS Financial Management Information SystemFO Field OperationsFOT Friends of TreesFTE full time equivalentFY Fiscal YearGAAP Generally Accepted Accounting PrinciplesGASB Governmental Accounting Standards BoardGFOA Government Finance Officers AssociationGIS Geographic Information SystemGPD/gpd A unit of flow measurement in gallons per dayGPM/gpm A unit of flow measurement in gallons per minuteHB HillsboroHRIS Human Resources Information SystemsHVAC Heating, Ventilation, Air ConditioningI&I / I/I inflow and infiltrationIGA intergovernmental agreementIWRM Integrated Water Resources ManagementJWC Joint Water CommissionKOI Key Outcome IndicatorKPI Key Performance IndicatorKSO Key Strategic OutcomeLA load allocationLEBO limited eligibility buyoutLEED Leadership in Energy and Environmental DesignLID Local Improvement District

CLEAN WATER SERVICES • FY 2021-22 PROPOSED BUDGET PAGE 321
LIDA Low Impact Development ApproachesLIMS Laboratory Information Management SystemLSI Local Sewer ImprovementMGD/mgd million gallons per dayMO Minute Order (Board item)MOU Memorandum of UnderstandingMS4 Municipal Separate Storm Sewer SystemN/A Not available or does not applyNEDC Northwest Environmental Defense CenterNPDES National Pollutant Discharge Elimination SystemNSES Natural Systems Enhancement & Stewardship
DepartmentNTS Natural Treatment SystemO&M operations and maintenanceOAR Oregon Administrative RulesODFW Oregon Department of Fish and WildlifeOGFOA Oregon Government Finance Officers AssociationOGM Office of the General ManagerOPE Other Personnel ExpenseORS Oregon Revised StatutesPERS Public Employee Retirement SystemPLC programmable logic controller (used to control a
variety of functions with multiple inputs)PM project managerPNPCA Pacific Northwest Pollution Control AssociationPSI/psi pounds per square inch (pressure measurement)PSU Portland State UniversityR&O Resolution and OrderRAD Regulatory Affairs DepartmentRC Rock CreekRD Reimbursement District RSMC Regional Stormwater Management ChargeSCADA supervisory control and data acquisition systems SDC System Development ChargeSISP Strategic Information Systems PlanSOD soil oxygen demands

CLEAN WATER SERVICES • FY 2021-22 PROPOSED BUDGET PAGE 322
SOP standard operating procedureSS suspended solidsSSES sewer system evaluation surveySWM Surface Water ManagementTB-PAC Tualatin Basin Public Awareness Committee
(“Partners for Clean Water”)TDS total dissolved solidsTFA Tree for AllTGAT Tualatin Geomorphic Assessment ToolTHPRD Tualatin Hills Park & Recreation DistrictTMDL Total Maximum Daily LoadTPS Treatment Plant ServicesTRWC Tualatin River Watershed CouncilTSS total suspended solidsTSWCD Tualatin Soil and Water Conservation DistrictTVID Tualatin Valley Irrigation DistrictTVWD Tualatin Valley Water DistrictTWEC Tualatin Watershed Enhancement CollaborativeTWC The Wetlands ConservancyUGB Urban Growth BoundaryUOPS Utility Operations & Services DepartmentURMD Urban Road Maintenance District USA Unified Sewerage AgencyUSGS United States Geological SurveyWASSTRIP Waste Activated Sludge Stripping to Remove Internal
PhosphorusWEF Water Environment Federation (formerly WPCF or
Water Pollution Control Federation)WES Water Environment Services (of Clackamas County)WLA waste load allocationWRD (Oregon) Water Resources DepartmentWRI Willamette Restoration InitiativeWRRD Water Resources Recovery Operations & Services
Department
Recommended