Election 2012Ned Monroe
National Association of Manufacturers
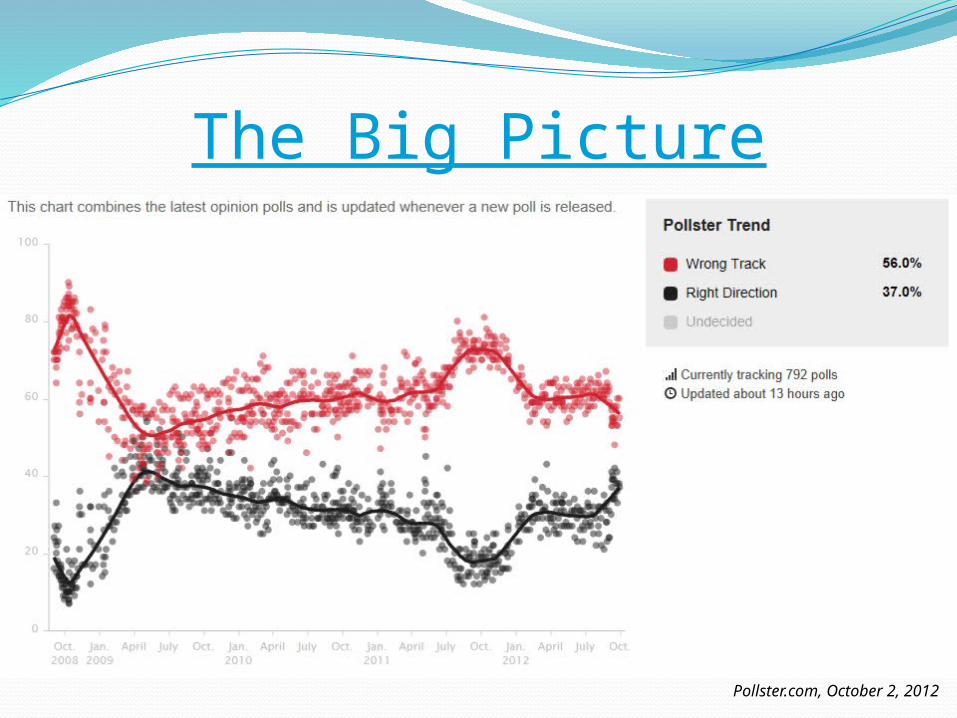
The Big Picture
Pollster.com, October 2, 2012
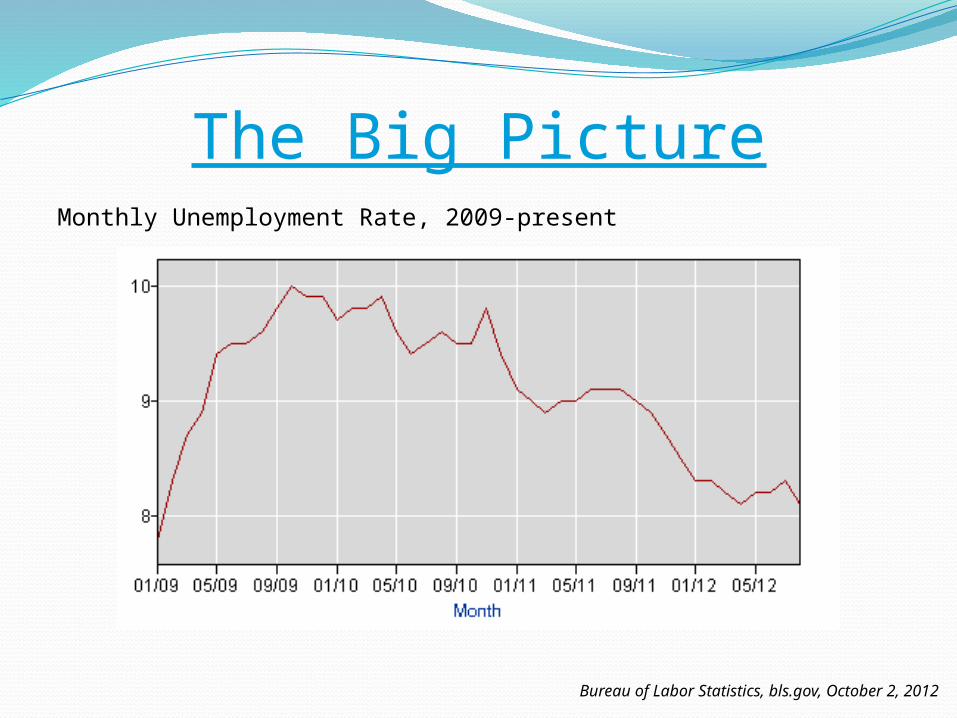
The Big Picture
Bureau of Labor Statistics, bls.gov, October 2, 2012
Monthly Unemployment Rate, 2009-present
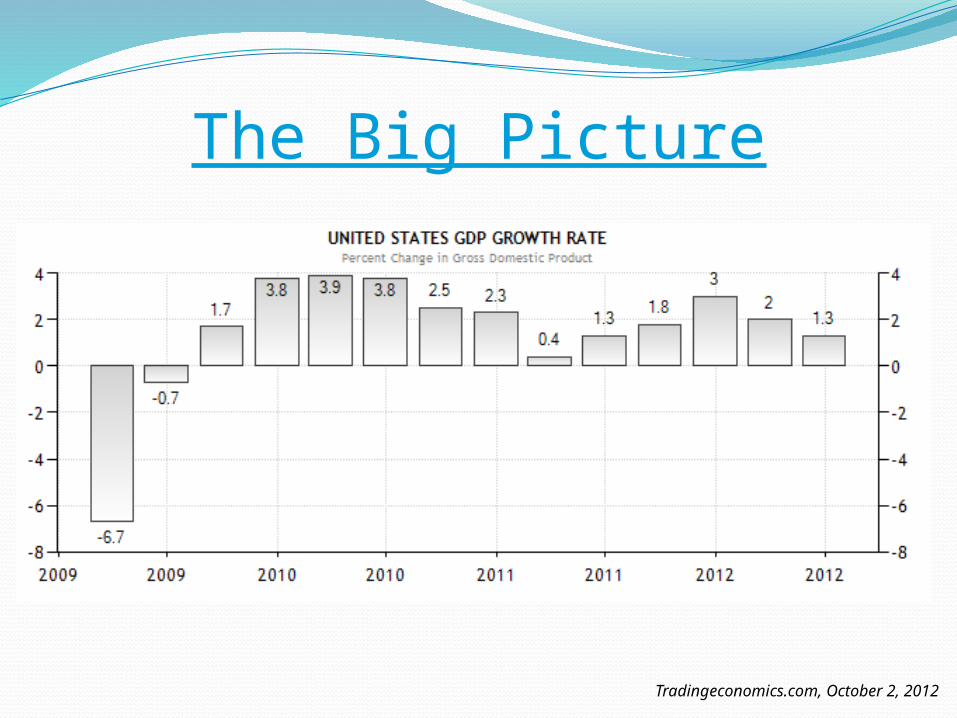
The Big Picture
Tradingeconomics.com, October 2, 2012
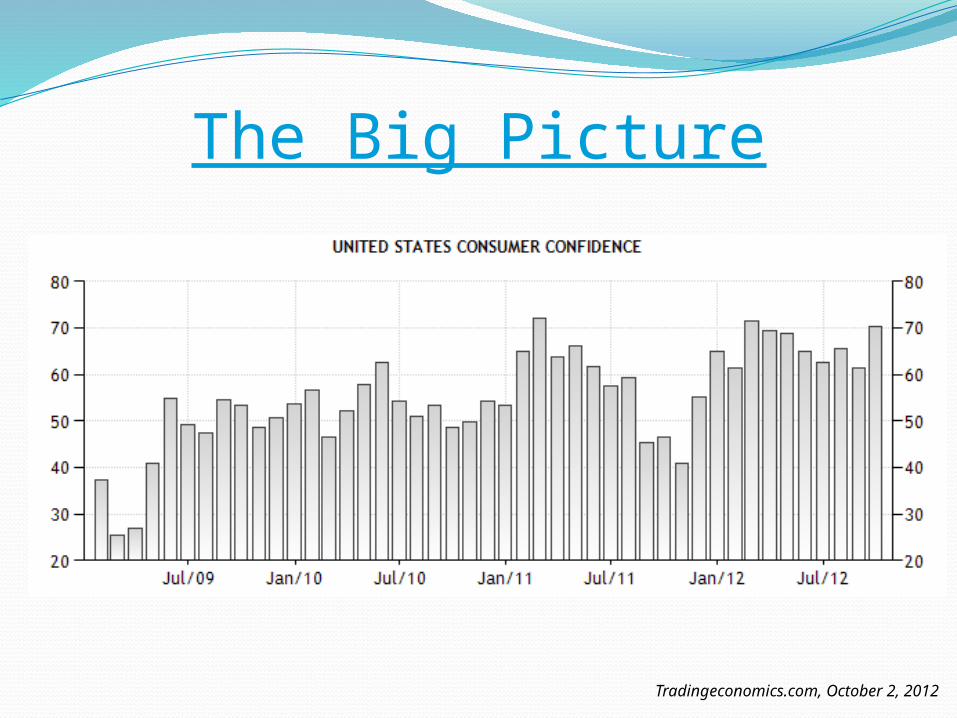
The Big Picture
Tradingeconomics.com, October 2, 2012
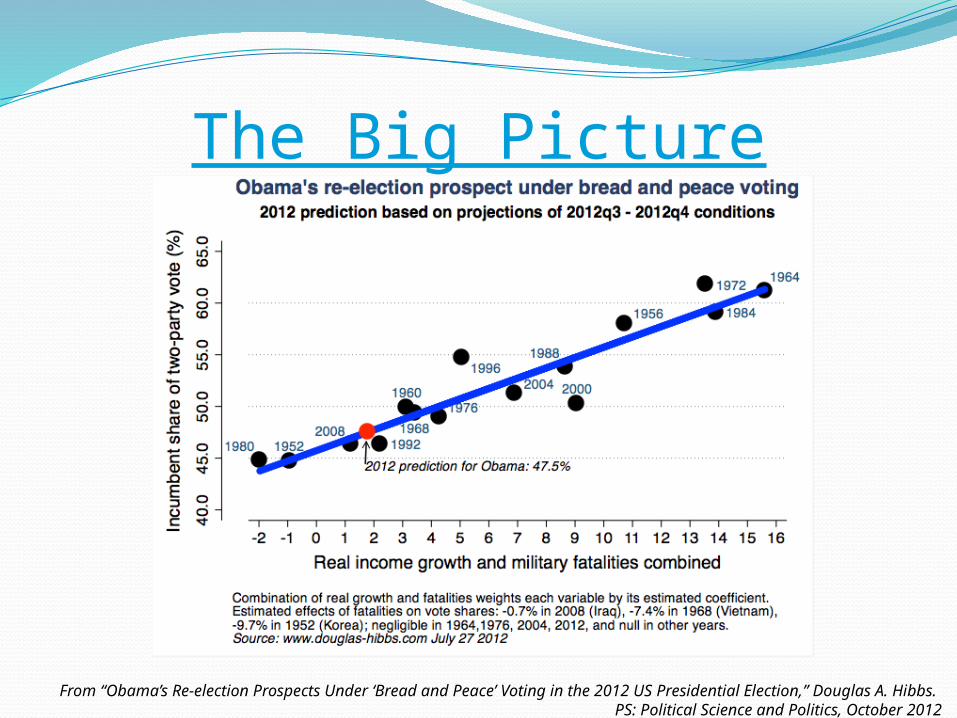
The Big Picture
From “Obama’s Re-election Prospects Under ‘Bread and Peace’ Voting in the 2012 US Presidential Election,” Douglas A. Hibbs.
PS: Political Science and Politics, October 2012
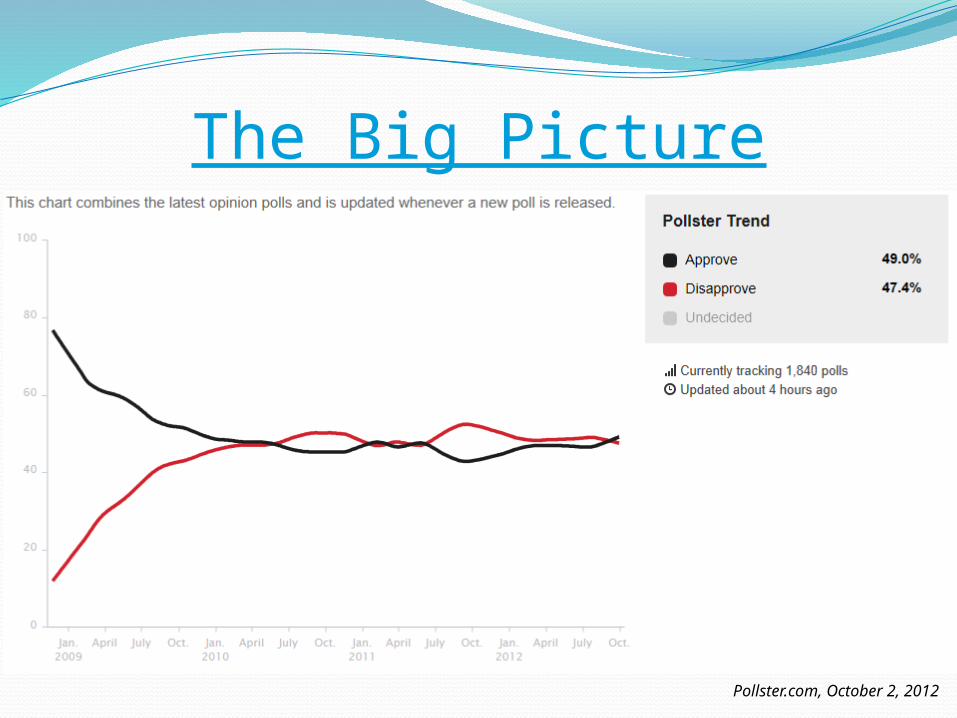
The Big Picture
Pollster.com, October 2, 2012
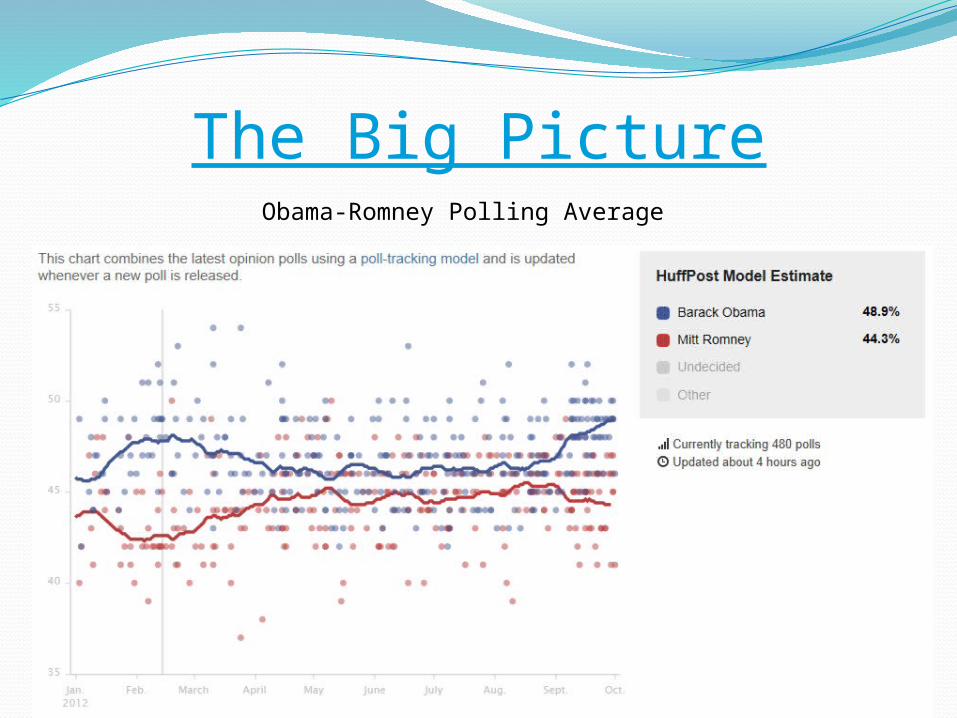
The Big PictureObama-Romney Polling Average
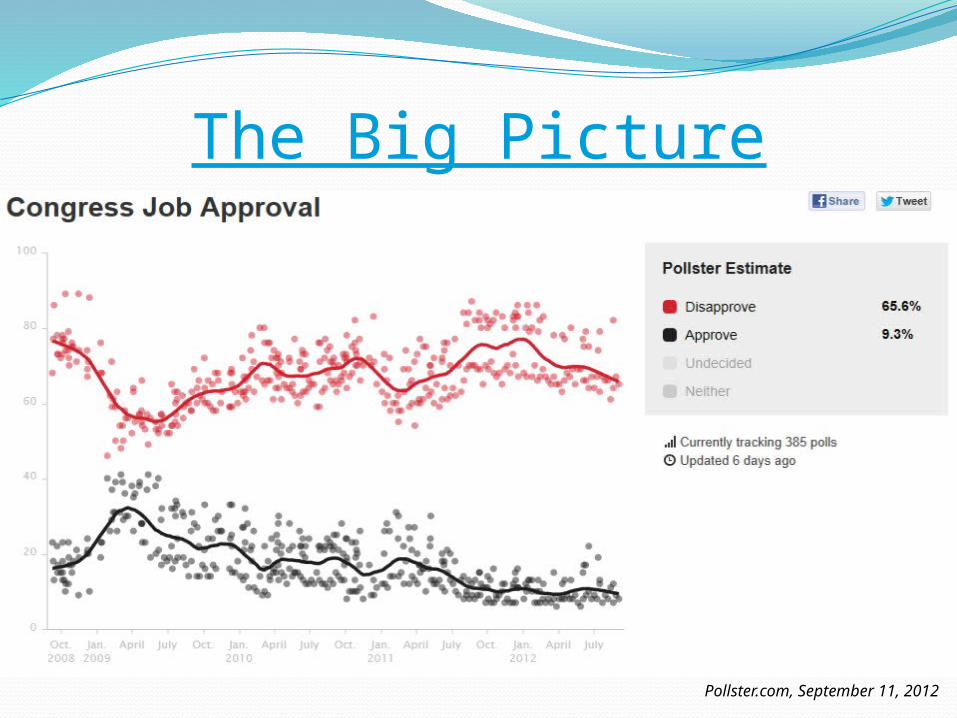
The Big Picture
Pollster.com, September 11, 2012
The Presidential Election
Obama vs. Romney
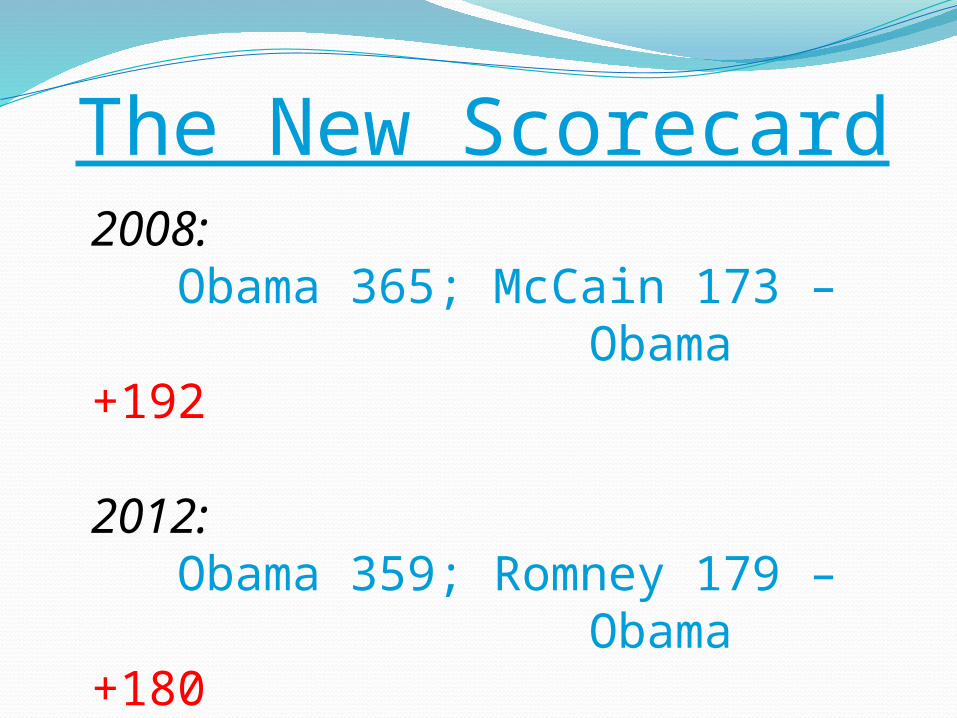
The New Scorecard2008: Obama 365; McCain 173 –
Obama +192
2012: Obama 359; Romney 179 –
Obama +180
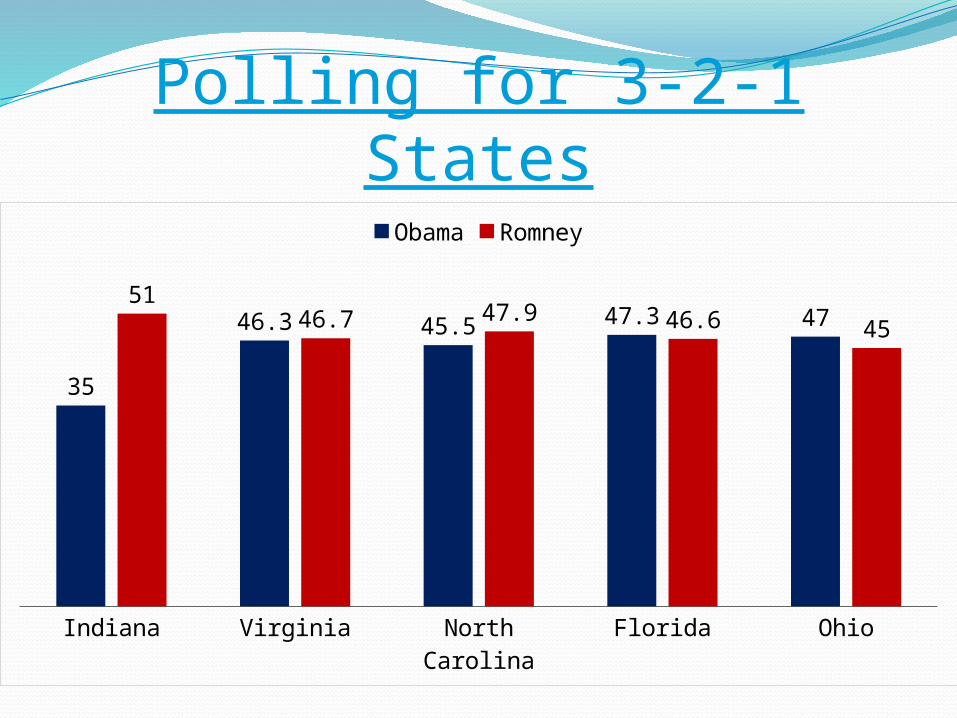
Polling for 3-2-1 States
Indiana Virginia North Carolina
Florida Ohio
35
46.3 45.5 47.3 4751
46.7 47.9 46.6 45
Obama Romney
Indiana – 11 Electoral Votes
Virginia – 13 EV’s
North Carolina – 15 EVs
Florida – 29 EV’s
Ohio – 18 Electoral Votes
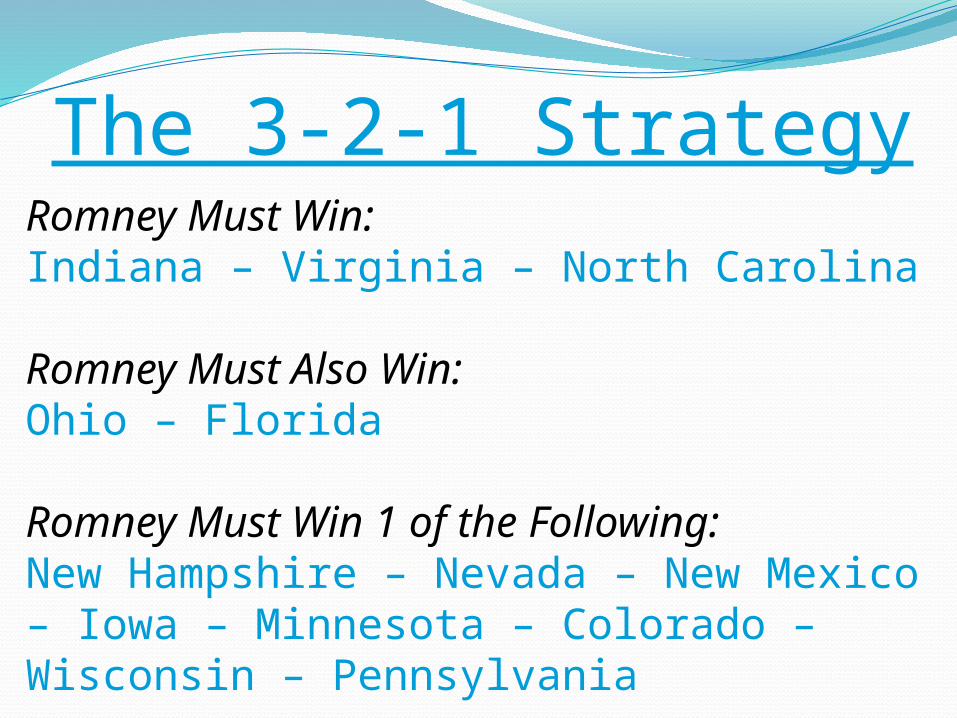
The 3-2-1 StrategyRomney Must Win: Indiana – Virginia – North Carolina
Romney Must Also Win: Ohio – Florida
Romney Must Win 1 of the Following: New Hampshire – Nevada – New Mexico – Iowa – Minnesota – Colorado – Wisconsin – Pennsylvania
NE-2 + One More
New Hampshire IowaPennsylvania ColoradoMichigan New MexicoMinnesota WisconsinNevada
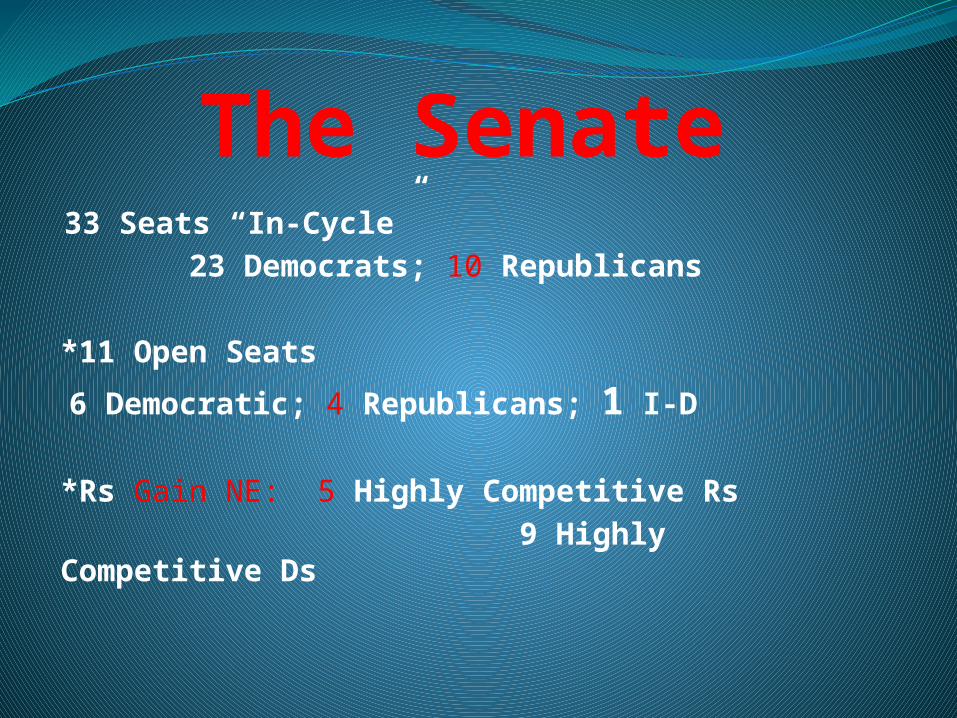
The Senate*33 Seats “In-Cycle” 23 Democrats; 10 Republicans
*11 Open Seats
6 Democratic; 4 Republicans; 1 I-D *Rs Gain NE: 5 Highly Competitive Rs 9 Highly Competitive Ds
The Five Rs
MaineMassachusetts
NevadaIndianaArizona
The Nine Ds
North Dakota WisconsinNebraska OhioMissouri FloridaMontana ConnecticutVirginia
The House*GOP Majority remains constant – 242 seats
*Redistricting Related Changes – about even
*Already 60 Open Seats
Recommended