
DECISION SUPPORT FOR INNOVATION MANAGEMENT: APPLICATION TO THE LIGHTING INDUSTRY
Heinz-Dieter Haustein and Mathias Weber I n t e r n a t i o n a l I n s t i t u t e f o r A p p l i e d S y s t e m s A n a l y s i s , L a x e n b u r g , A u s t r i a
RR-83-29 December 1983
INTERNATIONAL INSTlTUTE FOR APPLIED SYSIXMS ANALYSIS Laxenburg, Austria

International Standard Book Number 3-7045-0050-5
Research Reports, which record research conducted a t IIASA, a r e independently reviewed before publication. However, t he views and opinions they express a r e not necessarily those of t he Insti tute or the National Member Organizations tha t support i t .
Copyright O 1983 International Insti tute for Applied Systems Analysis
All r ights reserved. No part of this publication may be reproduced or transmitted in any form o r by any means, electronic or mechanical, including photocopy, recording, or any informa- tion storage o r retrieval system, without permission in writing from the publisher.
Cover design by Anka James
Printed by Novographic, Vienna. Austria
In today's turbulent economic environment, every decision affecting t h e development of industry necessarily carries an increased risk t h a t the antici- pated economic and social goals will not be achieved. The description of deci- sion making does not always include t h e notion of risk. Sometimes the "vola- tility of cost factors" or changing economies of scale (innovation being t h e primary reason for t h e change) are held responsible for uncertainty about future development. These phenomena are also used to explain t h e decline in capital formation and in decisions to invest tha t we a re currently witnessing.
The economic and decision sciences are trying to cope with this situa- tion by devising more sophisticated methods and procedures for supporting decision making. This Research Report reviews some methods t h a t a re appli- cable to the analysis of innovation patterns, with t h e a im of basing the neces- sary decisions on more sound reasoning. The report then describes t h e appli- cation of some of these methods to innovation management in t h e lighting industry. I t is hoped t h a t their application will resul t in bet ter decisions being made in the allocation of resources for innovation.
Tibor Vasko Lkputy Chairman
of t h e former Management and Technology Area

CONTENTS
SUMMARY
1 INTRODUCTION
2 A REVIEW OF DECISION SUPPORT MODELS AND THEIR RELEVANCE TO INNOVATION MANAGEMENT 2.1 Models for Evaluation and Selection of Innovation Projects 2.2 The Decision Tree as a Basis for the Proposed Model 2.3 Comparison of Models for Multiobjective Decision Making 2.4 Risk Evaluation of Portfolios of Innovation Projects
3 THE LIGHTING INDUSTRY: A CLASSIC EXAMPLE OF INNOVATION 3.1 Developments in Lighting 3.2 Product and Process Innovations 3.3 Classification of Innovations in the Lighting Industry 3.4 Lighting Application Systems
4 A DECISION SUPPORT SYSTEM FOR THE LIGHTING INDUSTRY 4.1 The Basic Approach 4.2 Interactive Mode of Operation 4.3 The Basic Model and Different Versions 4.4 Quantifying Risk and Multiple Objectives 4.5 Computer Programs for Two Versions of the Model 4.6 Results
REFERENCES

Research Report RR-83-29. December 1983
DECISION SUPPORT FOR INNOVATION MANAGEMENT: APPLICATION TO THE LIGHTING INDUSTRY
Heinz-Dieter Haustein and Mathias Weber h t e r n a t i o n a l I n s t i t u t e f o r Applied S y s t e m s Analys i s , L a z e n b u r g , A u s t r i a
Making d e c i s i o n s a b o u t r e s o u r c e a l l o c a t i o n f o r f u t u r e i n n o v a t i o n s is a c h a l l e n g i n g t a s k in b o t h p l a n n e d a n d m a r k e t e c o n o m i e s . Not o n l y c a n s u c h d e c i s i o n s n o t be r e v e r s e d w i t h o u t cons iderable l o s s o f e f f i c iency , b u t t h e dec i - s i o n m a k e r g e n e r a l l y f a c e s a n u m b e r o f con f l i c t ing ob jec t ives . In this r e p o r t the a u t h o r s t r y t o c o m b i n e t w o d i s c i p l i n e s that have b e e n evo lv ing i n d e p e n - d e n t l y f o r a l o n g t i m e : i n n o v a t i o n t h e o r y a n d d e c i s i o n theory . A d e c i s i o n s u p p o r t s y s t e m f o r m a n a g i n g i n n o v a t i o n s should r e f l e c t t h e m u l t i s t a g e n a t u r e o f t h e i n n o v a t i o n p r o c e s s a n d should also be s u i t e d t o m u l t i o b j e c t i v e d e c i s i o n m a k i n g . At t h e s a m e t i m e i t is n e c e s s a r y t o s i m p l i f y t h e r e a l s i t u a - t i o n f o r t h e d e c i s i o n m a k e r in o r d e r t o a p p l y f o r m a l p r o c e d u r e s .
A v e r y p r o m i s i n g s c h e m e is t h e d e c i s i o n t r e e , t h o u g h i t h a s s h o r t c o m - i n g s . Appl ica t ion o f d e c i s i o n t r e e s is c l o s e l y c o n n e c t e d with t h e e v a l u a t i o n process . A l m o s t al l m o d e l s f o r e v a l u a t i n g i n n o v a t i o n p r o j e c t s opera te with o n l y o n e o b j e c t i v e . H o w e v e r , d i s c u s s i o n s with d e c i s i o n m a k e r s in t h e l i g h t - i n g i n d u s t r y , w h i c h s h o w s c lass ic f e a t u r e s o f t h e i n n o v a t i o n p r o c e s s , r e v e d e d t h e n e c e s s i t y t o i n c l u d e a t l e a s t t h r e e ob jec t ives in t h e e v a l u a t i o n . %re f o r e , t h e a u t h o r s h a v e m a d e u s e o f t h e poss ib i l i t i es o f m u l t i o b j e c t i v e d e c i s i o n m a k i n g .
The d e c i s i o n p r o b l e m in this w o r k c o n c e r n s the a l l o c a t i o n of r e s o u r c e s t o i n n o v a t i o n p r o j e c t s f o r t h e 1981-85 five-Year P l a n in the G e r m a n Demo- cra t ic R e p u b l i c . At p r e s e n t the m o d e l f o r e v a l u a t i n g i n n o v a t i o n p r o j e c t s i s based u p o n l i n e a r p r o g r a m m i n g a n d d e c i s i o n t r e e s . It w i l l be i m p r o v e d in close co l labora t ion with d e c i s i o n m a k e r s , u s i n g t h e r e s u l t s of g o d p r o g r a m - m i n g a n d o t h e r a s p e c t s o f d e c i s i o n t h e o r y .
1 INTRODUCTION
At one t ime the decisions t h a t a firm made or, research and develop- ment , investment, production, and marketing were relatively independent of one another . Nowadays, however, i t is clear t h a t every decision mus t take into account the whole process we call innovation. In addition, the changing and often turbulent conditions of t h e world and national markets have intro- duced more risk into decisions to reallocate resources among various innova- tive projects.
In this study we review the main approaches of decision theory to the evaluation and selection of projects and link t h e m with innovation manage- ment . This is the first s tep of a research program tha t is being carried out a t the Economic University of Berlin in the Germari Democratic Republic. The study was promoted by decision makers in t h e lighting industry of the GDR. An analysis of the decision-making process in this industry revealed the need for a decision support system. Our approach is thus tailored t o the needs of this industry. Our ultimate goal is the development and implementation of a decision support system suitable for making decisions about innovation proj- ects a t the level of R&D management using a portfolio approach.
Since innovations a re closely linked to national and international mar- kets and resources, the interaction between governmental innovation policy and the technological policy of the individual firm is important . Although quality and consistency of corporate strategy are essential t o the success of innovation, in practice corporate strategy does not provide complete insurance, because inriovation is a complex phenomenon, touching all spheres of technological, economic, and social activity. We cannot hope to ir~corporate all of these interrelated activities into one quantitative decision support model. Moreover, i t is questionable whether such a n elaborate model would really assist the decision maker in arriving a t bet ter decisions. Iri our view i t would be better to include certain crucial qualitative aspects, in t h e form of judgments concerning expected future s ta tes of the world.
The many factors t h a t influence t h e development of innovation can gen- erally be a t t r ibuted to the innovator,the organization, and the environment. While no list of factors can be exhaustive, a brief survey, presented below, will help t o indicate the advantages and shortcomings of t h e models proposed in the l i tera ture for aiding decision making on innovation projects, including our own app~.oach (Haustein e t aL. 1981).
I. Innovator a. Input, output
a l . Input-related factors: necessary quantities and qualities for production
a2. Output-related factors: knowledge and utilization of properties and possible applications of technique
b. Interaction of innovators b l . Interplay of functional roles t h a t a re necessary to accomplish
innovative activities b2. Characteristics of innovators in these roles
11. Organization c . Resources
c 1. Material resources c2. Human resources c3. Information c4. Capacity c5. Innovative potential
d. Organizational dimensions d l . Relationships with the environment d2. Internal dimensions
e. Organizational measures e l . Planning e2. Control
111. Environment f . Resources
f 1. Natural resources f2. Human resources
g. Competitive situation: t ime factor h . National needs and goals i. Demand
Each factor influences innovative activities in a specific way, depending on the circumstances; no general pattern of influence can be found. The degree of influence also changes over t ime, depending on the stage of the par- ticular innovation. The concept of the efficiency of a factor, i.e. its degree of influence, is derived from a mixture of evidence from empirical studies and results of theoretical reasoning. Hypotheses about the efficiency of various factors are presented by Haustein e t al. (1981).
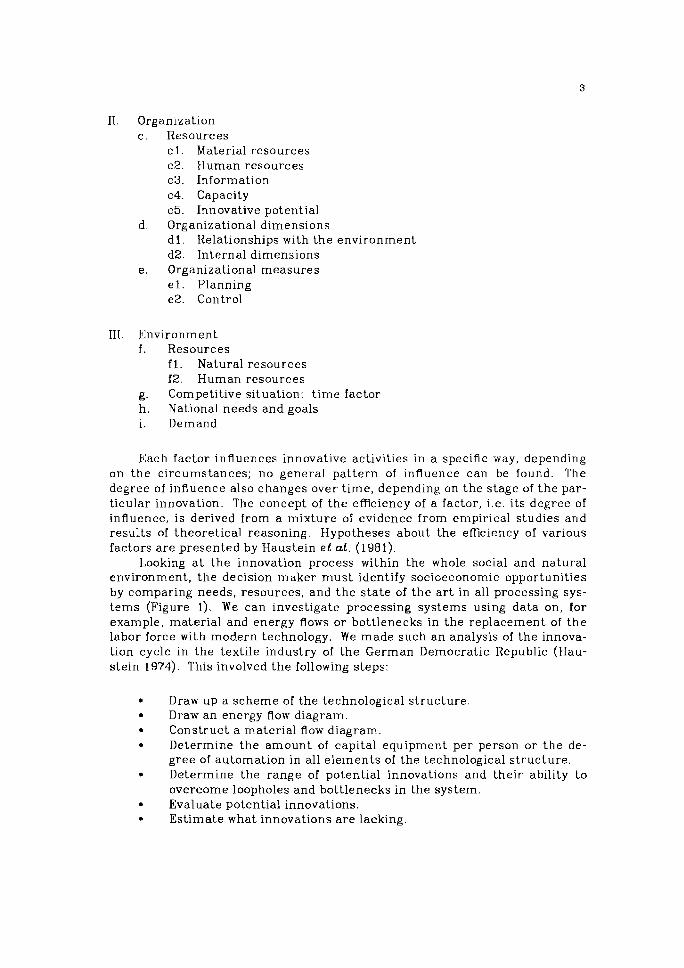
Looking a t the innovation process within the whole social and natural environment, the decision maker mus t identify socioeconomic opportunities by comparing needs, resources, and the s ta te of the a r t in all processing sys- tems (Figure 1). We can investigate processing systems using data on, for example, material and energy flows or bottlenecks in the replacement of the labor force with modern technology. We made such an analysis of the innova- tion cycle in the textile industry of the German Democratic Republic (Hau- stein 1974). This involved the following steps:
Draw up a scheme of the technological s t ructure . Draw an energy flow diagram. Construct ii material flow diagram. Determine the amount of capital equipment per person or the de- gree of automation in all elements of the technological s t ructure . Determine the range of potential innovations and their ability t o overcome loopholes and bottlenecks in the system. Evaluate potential innovations. Estimate what innovations a re lacking.
Processing systems Socioeconomic
FIGURE 1 Socioeconomic opportunities arising from the relationships between needs, resources, and processing systems.
Identify innovations of great importance, i.e. that are able to create new imbalances. Recommend a technological policy for the whole system.
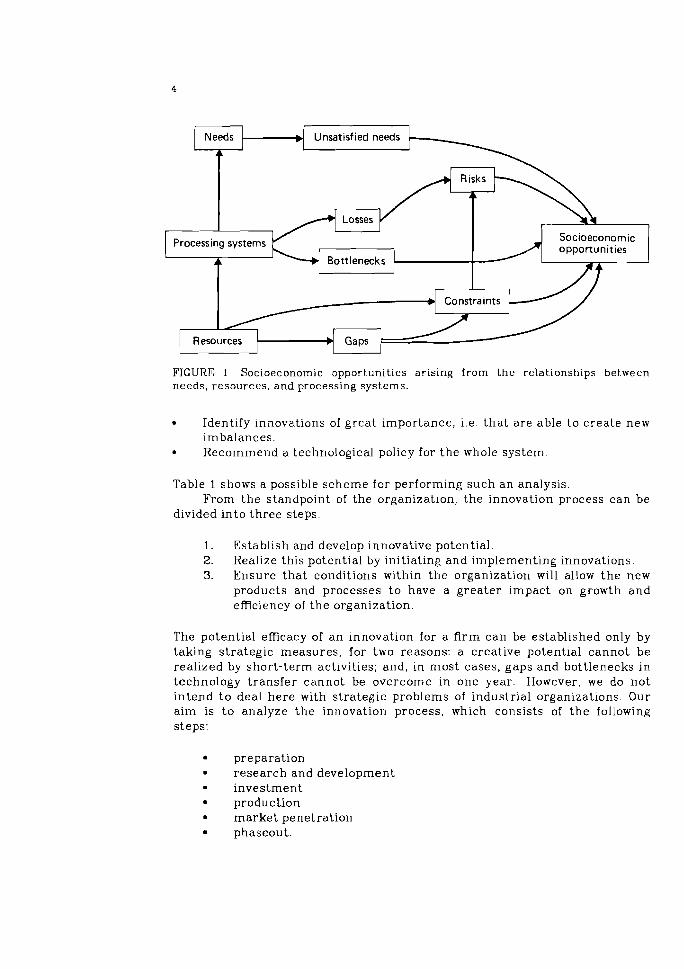
Table 1 shows a possible scheme for performing such an analysis. From the standpoint of the organization, the innovation process can be
divided into three steps:
1. Establish and develop innovative potential. 2. Realize this potential by initiating and implementing innovations. 3. Ensure tha t conditions within the organization will allow the new
products and processes to have a greater impact on growth and efficiency of the organization.
The potential efficacy of a n innovation for a firm can be established only by taking strategic measures, for two reasons: a creative potential cannot be realized by short-term activities; and, in most cases, gaps and bottlenecks in technology transfer cannot be overcome in one year. However, we do not intend t o deal here with strategic problems of industrial organizations. Our aim is to analyze the innovation process, which consists of t he following steps:
preparation research and development investment production market penetration phaseout.
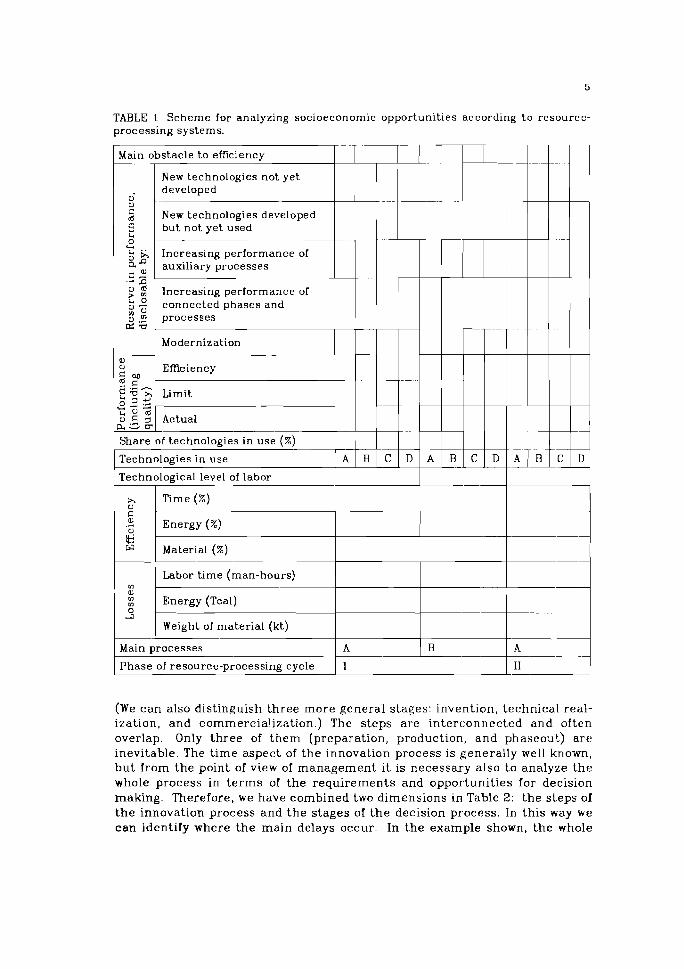
TABLE 1 Scheme for analyzing socioeconomic opportunities according to resource- processing systems.
I Main obstacle to efficiency I I I l I I I l l
Energy (%)
Material (%)
Labor time (man-hours)
1 Energy (Tcal)
Weight of material (kt)
1 Main ~ r o c e s s e s I A 1 B I I Phase of resource-~rocessine cvcle 1 1 I 11 1
(We can also distinguish three more general stages: invention, technical real- ization, and commercialization.) The steps are interconnected and often overlap. Only three of them (preparation, production, and phaseout) are inevitable. The time aspect of the innovation process is generally well known, but from the point of view of management i t is necessary also to analyze the whole process in terms of the requirements and opportunities for decision making. Therefore, we have combined two dimensions in Table 2: the steps of t he innovation process and the stages of the decision process. In this way we can identify where the main delays occur. In the example shown, the whole
innovation cycle from event l a to event 9f lasts more than 19 years. The delay in mass production caused by foreign competitors is relatively high (nine years). The reason for this is the retardation in the first two or three steps of the innovation process and in the preparation of decisions. However, t ime is only one element of the innovation process.
TABLE 2 Congruence between the innovation and decision processes in the textile in- dustry of the German Democratic Republic.
Innovation Decision process process
a. b. c. d. e. f . Total Appear- First Prepara- Decision Start of End of period ance of external Lion of making irnplemen- irnplernen- (yr) problem information decisions tation tation
1. Preparation 1959 2. Research 1962 3. Development 1963 4. Investment 1963
preparation 5. Investment 1964
realization 6. Start of 1967
production 7. Mass 1969
production 8. Market 1973
penetration 9. Phaseout -
Theoretically, i t is not difficult to include i.nput- and output-related fac- tors such as labor, capital equipment, raw materials, technological risk, uni t scale, and funding. Certain relations with the business environment can be modeled fairly accurately, but many other factors have remained outside the project evaluation and selection models reported in the l i terature , such as interplay of functional rules, characteristics of innovative persons, t he econo-mic mechanism, and the management system. We regard such shortcomings to be theoretically ra ther than practically important: a deci- sion maker in a particular firm is probably not very concerned about most of these factors; in his daily work he concentrates on input- and output-related factors.
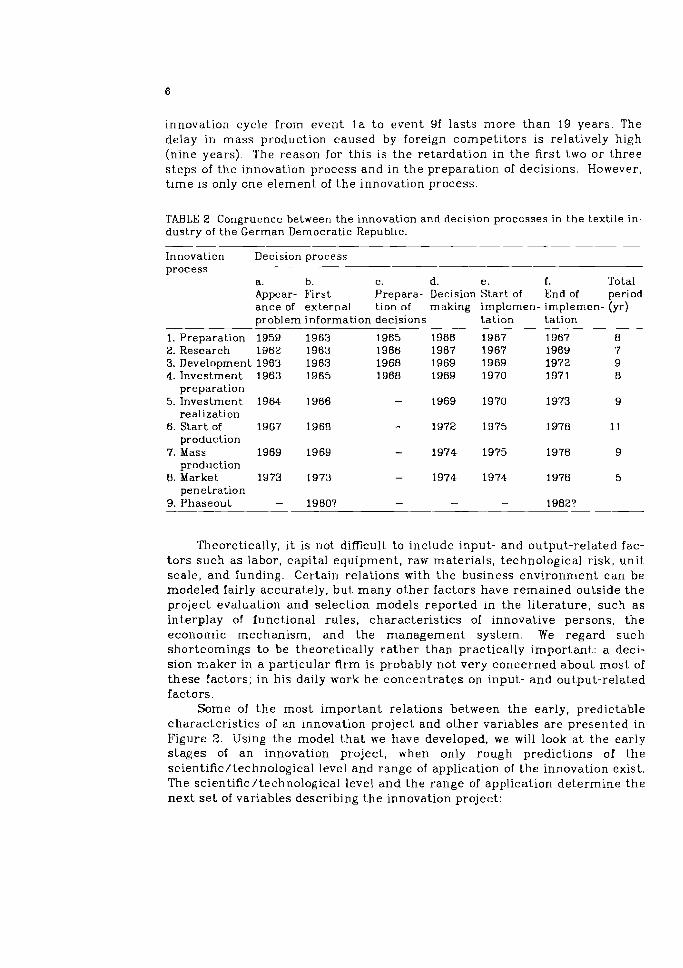
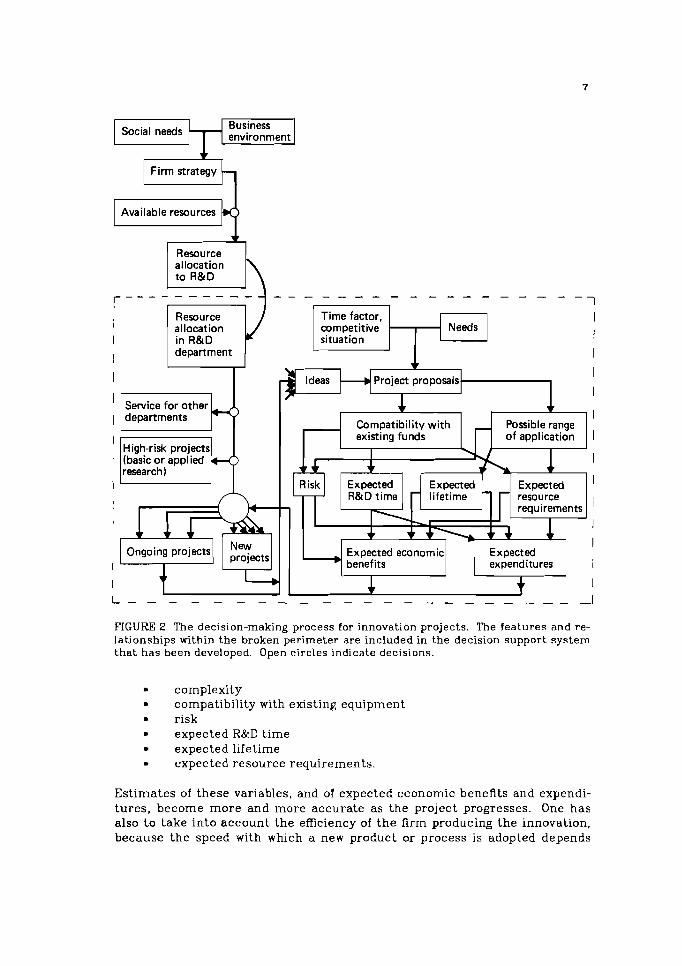
Some of t h e most important relations between the early, predictable characteristics of an innovation project and other variables are presented in Figure 2. Using the model t ha t we have developed, we will look a t the early stages of an innovation project, when only rough predictions of the scientific/ technological level and range of application of the innovation exist. The scientific/technological level and the range of application determine the next s e t of variables describing the innovation project:
- - - - - - - - - -1 I I I
I I
I
I
I
I
I
I
Expected economic I
I
I I L - - - - - - - - - - - - - - - - - - - - - - -I
Social needs
FIGURE 2 The decision-making process for innovation projects. The features and re- lationships within the broken perimeter are included in the decision support system that has been developed. Open circles indicate decisions.
Business
complexity compatibility with existing equipment risk expected R&D time expected lifetime expected resource requirements.
I environment
Estimates of these variables, and of expected economic benefits and expendi- tures, become more and more accurate as the project progresses. One has also t o take into account the efficiency of the firm producing the innovation, because the speed with which a new product or process is adopted depends
greatly on the benefits to the consumer. This is termed the socioeconomic effectiveness of the innovation.
We shall now summarize the features of innovation decisions that should be taken into account when devising a decision support system for innovation management.
Decisions on innovation can only be reversed with considerable losses of efficiency. The further an innovation advances, the more difficult i t becomes to reverse the decision to adopt it , because of the manpower involved. Innovation decisions are affected by problems in all economic activities of the firm, e.g. in investment policy, the hiring of man- power, procurement policy, and market strategy (Hennecke 1975). Great uncertainty about further development of adopted projects, future market conditions, etc. complicates decision making. Even in planned economies, resource allocation cannot be predicted exactly. Decision makers have to deal with many conflicting objectives representing both qualitative and quantitative aspects of business. Measurement and comparison of these objectives combine objective and subjective elements. The importance of experience in these matters cannot be overemphasized. The evaluation of alternatives can change rapidly as a result of unforeseen events. Innovations are created not by chemical reactions, but by people (decision makers, research and development specialists, workers), who form groups with often conflicting goals. To be successful, management must create an atmosphere of commitment to the projects eventually selected and weigh the interests of all groups. An innovation project in the lighting industry normally lasts for three to seven years and consists of many steps, although the methodology described in this article does not consider explicitly steps preceding project proposals or following implementation. Hence making decisions on innovation is by nature dynamic and multistage. Every stage has particular problems and sources of uncertainty. Therefore, a lot of partial decisions have to be made in the iterative process of decision making during a project. Decisioris have to be made within a certain period, sometimes rather brief. Thus decisions are made sequentially; task specifications rnay change over time, either independently or as a result of previous decisions; information available for later deci- sions may be contingent upon the outcomes of earlier decisions; and implications of any decision may affect the future of the project (Rapoport 1975). In a planned economy, innovation decisions depend on consulta- tions with higher levels of administration. The more important the innovation, the more time is needed for consultations.
In this study we cannot consider all levels of innovation management (Twiss 1974, ch. 2) . There are so many peculiarities among different levels of
management tha t no general recommendations can be given. The higher the level in the management hierarchy, the more complex the decisions become. This is reflected in the number of admissible alternative decisions, the number and quantifiability of the objectives, the complexity of the inter- dependences among the objectives, and the scope of long-lasting effects (which is difficult to predict). In addition, a t higher levels the problems fac- ing management become less structured. This considerably affects the appli- cability of economic-mathematical methods to the management of innova- tion projects.
2 A REVIEW OF DECISION SUPPORT MODELS AND THEIR RELEVANCE TO INNOVATION MANAGEMENT
Keen and Morton (1978) define a decision support system (DSS) as computer-based support for management decision makers who are dealing with semistructured problems. The problem of designing an optimal R&D portfolio is often considered unstructured, but this depends in each case on the features of the innovation decisions, which are determined by:
the complexity of the technical field (number and nature of the relations to other scientific disciplines, technical fields, and indus- trial branches); the age and maturity of the most important product and process innovations, which determine the profile of the technical field under consideration and the dynamics of its d.evelopment (there is an excellent study by Filippovskii 1978); the class of innovations prevailing; the position and importance of the technical field (or industrial branch) in the economy as a whole (Haustein and Maier 1980).
Decisions about innovation projects will also display features of uniqueness and/or repetitiveness, with obvious consequences for the degree of support tha t formal models can give.
Important operations in the decision process are comparing resource requirements and availability and assessing the degree to which new projects can meet the goals of the firm. Thus innovation decisions rely on searches for information on previous experience as well as the application of analytic techniques. Some of the steps in decision processes of this type can be partly delegated to the computer for solution by a n interactive mode of operation.
The general approach of DSS star ts with the investigation of the key deci- sions to be made and the determination of which parts of the process are s tructured and which parts rely on subjective judgment. The decision maker then tries to organize st.ructured subproblems for solution by computerized methods on the basis of appropriate models. a
We believe tha t our approach fits well into the concept of DSS. A decision analysis of the proposed innovation projects (based on decision trees) may serve as a convenient starting point for further analysis, using other interac- tive procedures to be discussed later. The first step of the analysis is like the
rational framework of decision making; the second step resembles "satisficing" and is closer to real decision making. We do not see DSS as a replacement for widely accepted management tools but as an extension of them.
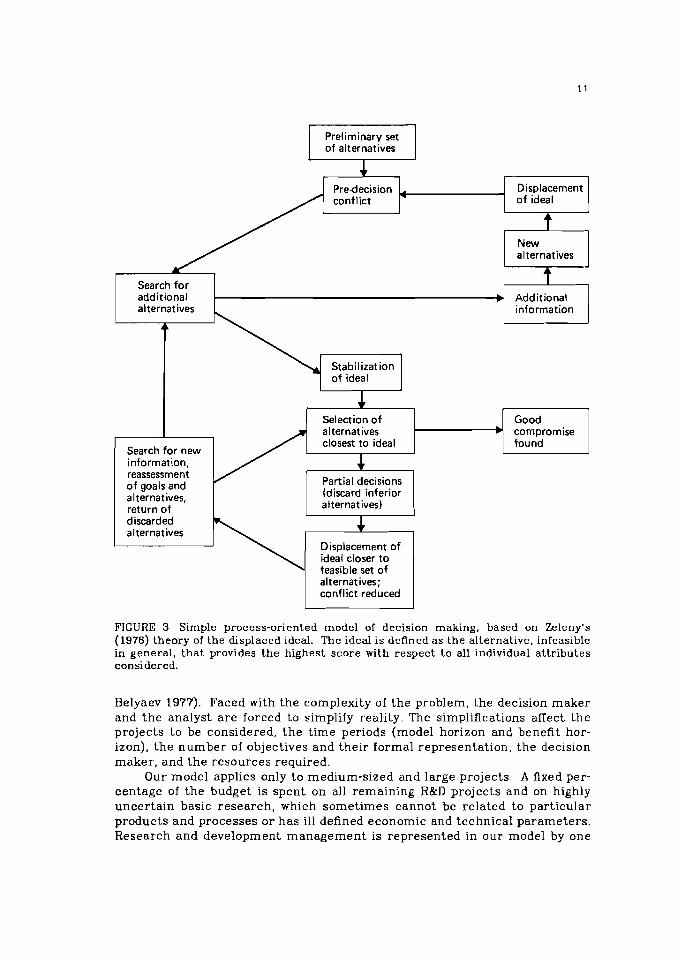
A DSS based only on an outcome-oriented approach is too limited. Like Zeleny (1976), we define a decision as a dynamic process with feedback loops, search detours, sequential exploration of preferred and feasible sets of alter- natives, information gathering, assessment of the structures and goals of the alternatives, and the addition and exclusion of alternatives. Optimization of such a complex system is only possible with a highly simplified model based on many assumptions. Figure 3 presents a simplified version of the process- oriented approach to decision making (details are given by Zeleny 1976).
2.1 Models for Evaluation and Selection of Innovation Projects
A decision support system for innovation management should
combine outcome-oriented and process-oriented approaches; reflect the multistage nature of innovation; reflect the uncertainty affecting innovation; reflect the mutual dependence between innovation projects; take into account the main kinds of resources required in an inno- vation project; be suitable for multiobjective decision making; be more or less compatible with existing planning and management systems; be suitable for man-machine interaction; be based on easily accessible data; be based on existing problem-solving techniques tha t can be easily computerized.
To date no decision support model meeting all these requirements has been constructed.
In practice, the evaluation and selection process consists of a t least two steps. The first is a qualitative screening of the proposed innovation projects. Ranking and scoring can help to reject proposals tha t do not meet certain minimum requirements or that are inferior to other candidates. In this s tep one can adopt risky basic research or applied research projects with highly uncertain economic parameters. A final decision about whether to continue or reject a proposal is delayed until major uncertainties can be clarified or disappear. In the second step, which is quantitative in nature, the proposed methodology is applied to support the final decision.
Our approach to decision support is based on decision trees. We are con- vinced that this methodology can be used by the decision maker to coordi- nate corporate strategy and resource allocation to new and ongoing projects if i t is combined with a model for forecasting long-term effects of innovation projects tha t have been adopted by the firm. The approach is based on cer- tain principles that are common in dynamic and complex situations (e.g.
Preliminary set of alternatives
of ideal
Displacement o f ideal
Predecision conflict
Search for additional
t New alternatives
I 4
,
FIGURE 3 Simple process-oriented model of decision making, based on Zeleny's (1976) theory of the displaced ideal. The ideal is defined as the alternative, infeasible in general, tha t provides the highest score with respect to all individual attributes considered.
I
Belyaev 1977). Faced with the complexity of the problem, the decision maker and the analyst are forced to simplify reality. The simplifications affect the projects to be considered, the time periods (model horizon and benefit hor- izon), the number of objectives and their formal representation, the decision maker, and the resources required.
Our model applies only to medium-sized and large projects. A Axed per- centage of the budget is spent on all remaining R&D projects and on highly uncertain basic research, which sometimes cannot be related to particular products and processes or has ill defined economic and technical parameters. Research and development management is represented in our model by one
b alternatives
Good compromise found
Selection o f alternatives
Additional information
Search for new information, reassessment o f goals and alternatives, return of
closest to ideal
4 Partial decisions (discard inferior alternatives)
discarded alternatives 4
Displacement of ideal closer t o feasible set of alternatives; conflict reduced
decision maker, whose preferences are assumed to be typical of R&D manage- ment as a whole. This assumption may be relaxed in the future
Most of the variables in the proposed model are of a continuous nature. In order to handle the problems, we discretize all continuous variables and functions (for instance, probability distributions) and consider only a limited number of options, in most cases not more than five, including mean and extreme values. This simplification greatly eases the task of assessing the probability of future events, because the decision maker is able to perceive significant differences between the options. In discretizing time, we have selected periods of half a year.
In a dynamic environment, where objectives, sets of feasible alterna- tives, and preferences are constantly changing, optimization of the evalua- tion and selection process over the whole planning horizon is almost impossi- ble. Under such circumstances, it is necessary to make priority decisions. The optimal solution refers only to the first period. Decisions affecting more distant periods will be reconsidered when the information on them becomes more reliable. The decision process is divided into stages, similarly to the innovation process (Table 2). This is the main idea of the law defining the gen- eral s t ructure of the decision-making process for innovation projects in the GDR.
Decisions about innovation projects cannot be made independently, because projects compete for scarce resources, especially for manpower and investments. For this reason, we use a portfolio approach. In order to find an approach appropriate to the problem of decision making in the GDR lighting industry, we shall t ry to split the problem into classes of decision situation, which will throw light upon possible difficulties in handling it . Danilov- Danilyan (1980) based his classification upon a description of the alternatives (good or bad) and a description of the preferences (good or bad), thereby dis- tinguishing four classes of decision situation. In our case the number of feasi- ble alternatives (project proposals) is known, but a description of them in terms of resource requirements, development t ime, probabilities of future events, and short- and long-term effects on the firm and on society can only be rather sketchy, a t least in the early stages of the innovation process. Obviously, preferences are even less clearly defined. Hence our problem belongs to Danilov-llanilyan's class IV (bad descriptions of both alternatives and preferences), like almost all problems in socioeconomic decision making.
Von Winterfeldt and F'ischer (1975) classify decision situations on the basis of three featu-res of the alternatives: the number of attributes, uncer- tainty, and time (Table 3). An optimal portfolio of innovation projects is characterized by the presence of all three complicating features. The works of Danilov-Danilyan and of von Winterfeldt and Fischer indicate tha t appropri- a te models for our case are still. lacking a t present. The only way to apply for- mal methods is to neglect one of the features of the preference system, for instance the time variability
Models for project evaluation and selection have been reviewed else- where (Gear e t al. 1971, Souder 1973a, b, 1978, Clarke 1974, Schwartz 1976) and have been classified by Moore and Baker (1969), Gear e t d. (1971), Souder (1972), and others. Only very few formal models are in use. Successful implementations of project evaluation models have been reported by Souder
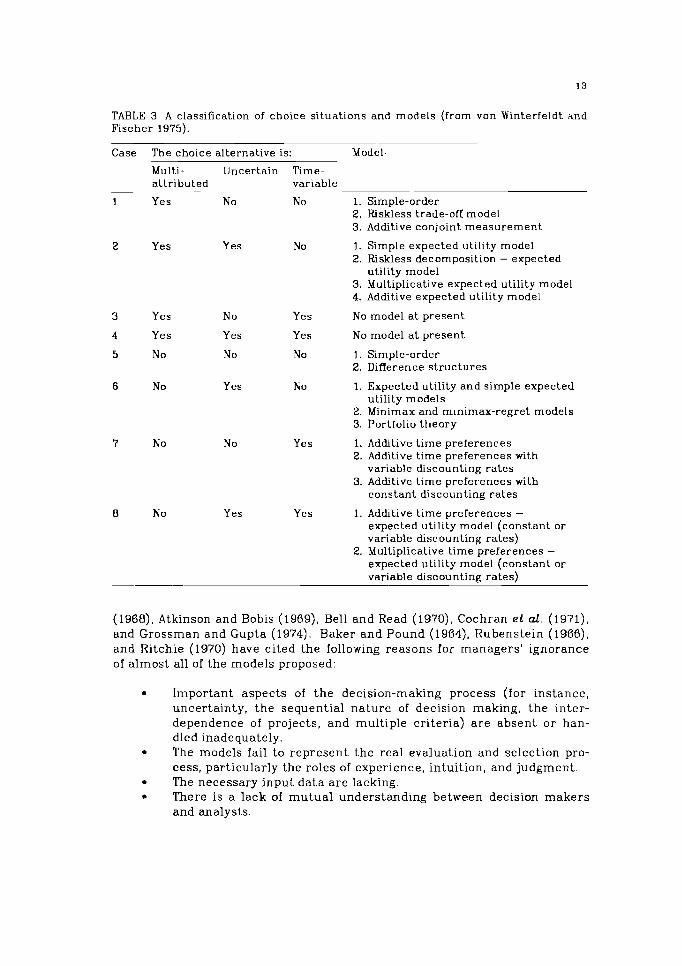
TABLE 3 A classification of choice situations and models (from von Winterfeldt and Fischer 1975).
Case The choice alternative is: Model.
Multi- Uncertain Time- attributed variable
-
1 Yes No No 1. Simple-order 2. Riskless trade-off model 3. Additive conjoint measurement
2 Yes Yes No 1. Simple expected utility model 2. Riskless decomposition - expected
utility model 3. Multiplicative expected utility model 4. Additive expected utility model
3 Yes
4 Yes
5 No
N 0
Yes
No
Yes
Yes No model a t present
Yes No model a t present
No 1. Simple-order 2. Difference structures
KO 1. Expected utility and simple expected utility models
2. Minimax and minimax-regret models 3. Portfolio theory
Yes 1. Additive tirne preferences 2. Additive time preferences with
variable discounting rates 3. Additive time preferences with
constant discounting rates
Yes Yes 1. Additive time preferences - expected utility model (constant or variable discounting rates)
2. Multiplicative time preferences - expected utility model (constant or variable &~coun t ing rates)
(1968), Atkinson and Bobis (1969), Bell and Read (1970), Cochran e t al. (1971). and Grossman and Gupta (1974). Baker and Pound (1964), Rubenstein (1966). and Ritchie (1970) have cited the following reasons for managers' ignorance of almost all of the models proposed:
Important aspects of the decision-making process (for instance, uncertainty, the sequential nature of decision making, the inter- dependence of projects, and multiple criteria) a re absent or han- dled inadequately. The models fail to represent the real evaluation and selection pro- cess, particularly the roles of experience, intuition, and judgment. The necessary input data are lacking. There is a lack of mutual understanding between decision makers and analysts.
2.2 The Decision Tree a s a Basis for the Proposed Model
Recent developments in modeling the evaluation and selection of R&D portfolios are encouraging (Hespos and Strassman 1965, Gear e t al. 1970, 1972, Lockett and Freeman 1970, Allen and Johnson 1971, Gillespie and Gear 1972, Lockett and Gear 1972, Gear and Lockett 1973, cea r 1974, Chiu and Gear 1979). Clarke (1974) stated tha t models involving decision tree analysis have been receiving increasing attention from management scientists. A comprehensive literature survey led us to conclude tha t for our specific pur- pose a model using decision trees is most suitable.
A decision tree is a convenient tool for structuring all of a decision maker's ideas about a prolect. With the help of a decision tree one can represent and analyze a series of partial decisions to be made over time. Decision trees reflect one of the most important features of innovation deci- sions: their sequential character.
A formal method based on decision trees can be applied successfully only when the innovation project has reached a certain degree of maturity and ideas about basic construction, project versions, resource requirements, main sources of uncertainty, development time scale, e tc . are relatively well defined. We assume tha t projects are evaluated and selected over a certain planning horizon, which is divided into periods T. A decision must be made on Nprojects, each of them with a number of possible paths to completion.
Projects can branch out whenever decision nodes or chance nodes occur. A decision node on the time scale is any point a t which the decision maker can influence the progress of the project by making a decision, as a result of which a branch of a given set of possible paths will be selected. Chance nodes are beyond the control of the decision maker and depend on chance events, such as an increase in the price of raw materials or the inability to obtain the necessary machinery within a certain time.
The length of the periods in the model can be chosen so tha t a decision is made a t the beginning of a period. The same assumption can be made about chance events tha t are supposed to occur before a partial decision is made. The resource requirements are assumed to be known for each time interval and for each version of the project. The number of resource types is specific to each case.
Another model assumption requires that the decision maker be able to assign probabilities to the outcomes of a chance node. This problem will be discussed later (Section 2.3.3.1). All combinations of particular decisions and chance events have some result, which is measured according to scales tha t correspond to the chosen multiple objectives.
The presentation of innovation projects in the form of decision trees pro- vides the decision maker with several advantages:
I t allows him to see all projects as a whole. It allows the representation and adequate handling of interrelated decisions tha t occur at different times. I t omits all less important project features.
It forces the decision maker to use notions, judgments, experience, intuition, and quantitative data for constructing decision trees in an interactive manner. It allows early detection of feasible options and bottlenecks. It shows the connections between partial decisions and the main sources of uncertainty. It combines outcome- and process-oriented approaches to decision mak- ing.
Schwartz and Vertinsky (1980) found tha t the selection of R & D projects is largely dependent on project-specific considerations, such as probability of success (technical and commercial), rate of return, and payback period. Broader economic indicators are often ignored. "R&D decision making is ...
stimulated by the opportunity of particular R&D projects rather than being part of an integral environmental adaptation strategy." This observation sup- ports our argument for the application of the decision t ree to the evaluation and selection of innovation projects, because it provides a better representa- tion of project-specific attributes than of environmental ones.
However, we cannot overlook the several weaknesses and problems inherent in this application of decision trees:
a. Decision trees cannot depict accurately the complexity of factors influencing the real decision-making process. This is t rue even of quantitative models. Building qualitative factors into the decision t ree is not easy and is often a matter of subjective judgment. The problem of whether or not i t is possible to apply decision trees to the situation described here is discussed in the li terature. Larichev (1979), for instance, questions the value of decision t ree analysis for unique decisions. On the other hand, many applications can be cited for problems of this kind (Keeney and Raiffa 1976, Bell e t al. 1977, Howard 1980).
b. The construction of a decision t ree is time-consuming. Often deci- sion makers are unwilling to spend the time necessary to answer analysts' questions about their preference systems, or to provide all of t he necessary data a t the same time.
c. It is particularly difficult to construct decision t rees for the very cases where their application would be most useful: in topics of basic and applied research in their early stages. One must be willing to place a certain degree of confidence in both the objectives and the technical/commercial parameters of the projects.
d. Certain methodological problems have to be solved in a specific way for each case. Among them are inclusion of new project proposals in future periods, the length of the planning horizon (the problem of projects that are not completed within the planned period), the interdependence of projects, transfer of resources, and the degree of detail in the decision tree.
e. Decision trees do not take into account strategic considerations, which often greatly influence the selection of innovation projects. A number of important aspects of decision making on innovation proj- ects are not quantifiable. For this reason mathematical models may be misleading in some applications (Roman 1980).
f . Decision trees cannot be used to represent the whole lifetime of an innovation. It is impossible to specify the resource requirements more than five to seven years in advance. The kinds of resources required differ considerably from stage to stage. Hence the analyst is forced to aggregate, thereby losing much of the information available. Only very rough figures can be calculated for models based on decision trees. However, this is t rue of all economic-mathematical models intended for supporting innovation decisions.
g. Sometimes decision trees create the illusion of a freedom of choice, which in reality does not exist because of constraints not formally included in the analysis.
h . The basic model is linear (Section 4).
There are probably other limitations to the approach described in this report, yet, despite its shortcomings, we are convinced tha t the model can be useful for case studies other than t ha t of the lighting industry, with which our work is concerned.
Not every problem can be solved by applying decision t ree methodology alone. For example, Smallwood and Morris (1980) used decision trees only for structuring t he decision; they then used underlying and interconnected mathematical models to generate the numbers. First a t tempts to realize this approach were reported by Gear e t al. (1970). Other models and techniques, widely accepted in industry, have to be used to provide information:
models of innovation diffusion (Mansfield e t al. 1971, Davies 1979); models for forecasting manpower requirements; models of technological substitution (Linstone and Sahal 1976); models for optimal timing of innovations (Barzel 1960, Kamien and Schwartz 1974); scenario analysis.
Much research has been carried out on how to facilitate the application of decision t rees to innovation management. This work is aimed a t
developing efficient met l~ods for analyzing decision t rees (Moskowitz 1971. Marien and Jagetia 1972); synthesizing several approaches, including decision trees (Chapman 1979); developing new methods for extracting subjective probabilities from the decision maker (Yager 1977);
lending a foundation to fuzzy decision analysis (Chang and Pavlidis 1977, Watson e t d. 1979).
On the whole these new efforts mitigate several of the disadvantages of deci- sion t rees and make the trees more useful. However, some recently obtained results do not go beyond the stage of theoretical investigations or laboratory tests and are far from being applicable in business (e.g. Watson e t d. 1979). Finally, these developments rely on equipment tha t - i s not yet widely avail- able, even in large firms (e.g. video projectors) (Levin e t d. 1978).
Chapman (1979) demonstrated the flexibility of decision t ree analysis, combining i t with key characteristics of network approaches. His methodol- ogy "reflects a strong belief in approaches which are interactive, nested, and intuitively driven, integrating model selection and solution in a modular fashion, with diagrams and computations emphasizing communication and robustness rather than precision and generality."
In their combination of fuzzy-sets theory and decision analysis, Watson e t d. (1979) allow for fuzziness in probabilities and utilities. The authors stress the difference between the imprecision of the input data and the uncertainty of the future state of the world. These qualities are modeled in different ways, using fuzzy-sets theory and probability theory, respectively. Critics attack decision analysis for the imprecision of the data provided by the decision maker ("garbage in - garbage out"). This problem cannot be solved simply with a variable-by-variable sensitivity analysis as i t is normally performed, because in reality variables change in combination with one another. Many decision makers are put off by the necessity to provide infor- mation in numerical form. Watson e t al. show tha t this requirement can be diminished or even replaced. I t can be expected that in the future decision makers will provide their assessments of values, utilities, and probabilities in verbal form. The authors point out that they cannot offer an all-purpose tool, bu t that they can outline the general direction for improving decision analysis.
A t Stanford University in California interactive computer graphics a re used t o compose, decompose, simplify, transform, merge, and regenerate net- work pictures, including decision trees. The purpose of this system is to accelerate convergence in man-computer experiments, for example by eas- ing t he task of drawing decision t rees for all projects under consideration. Some of our initial thoughts about the s t ructure of a man-machine system based on decision t rees (Section 4) for the selection of innovation projects have beer1 corroborated by the US study. We plan to use some suggestions in t he report to improve our system.
Similar efforts were reported by Lewis (1975), Leal and Pearl (1977), and Thompson and Kirschner (1978). Lewis's interactive system for editing t ree s t ructures allows insertion, deletion, search, and display of any branch of a given s tructure. Leal and Pearl described an interactive computer program tha t was designed and implemented to elicit decision trees from decision makers. This automation of the tedious process of drawing decision trees in a natural-language conversation between decision maker and computer greatly facilitates the distribution of decision analysis techniques.
The technique of Leal and Pear l does no t depend on the a rea of applica- t ion. All i npu t da ta provided by t h e user are mapped in to one of t h e d a t a types (events , ac t ions , likelihoods, relat ions, e t c . ) . One of t h e biggest disad- vantages of t h e manual eliciting of decision t r e e s is t h e danger of spending too m u c h t i m e on details t h a t a re i r re levant t o t h e final solution Leal a n d Pear l use a n efficient t r e e expansion method t h a t d i rec ts effort toward t h e mos t cr i t ica l t i p node, defined as the node t h a t is m o s t likely t o change t h e first-step solution current ly considered bes t . The t r ee expansion me thod is based on a sensit ivity analysis algorithm and on t h e analogy between decision t r ee el lci tat ion and heur is t ic searching on g a m e t r e e s t h a t was first m e n - t ioned by Leal and Pear l .
A generalization of these efforts i s repor ted by Levin e t al. (1978), who developed a sys t em for interactive computer aiding of group decision making based on decision t rees . Decision t r ees a re cons t ruc ted using value and prob- ability inputs f rom all group members . The sys t em does no t a s sume famil- iari ty of t h e decision makers with decision analysis and coinputer program- ming.
The sys t ems being developed a re becoming increasingly user-friendly and a r e likely t o realize t h e forecast by Matheson and Howard (1968) t h a t "soon t h e logical s t r u c t u r e of any decision analysis migh t be assembled f r o m s tandard components ." While we cannot overlook t h e discrepancy between t h e inspiring opportunit ies opened u p by r e sea rche r s and t h e ac tua l applica- tion of those sys t ems in daily decision making, the genera l direction of com- puterized decision suppor t sys t ems based on decision analysis seems c lear .
2.3 Comparison of Models fo r Multiobjective Decision Making
Almost all models for innovation project evaluation and selection opera te with one objective only. However, discussions with t h e decision mak- e r s in t h e lighting company used for our case s tudy revealed t h e necessity t o include a t leas t t h r e e objective functions, which a r e not commensurable . We shall discuss l a t e r which of the methodologies for multiobjective decision making (MODM) is bes t su i ted for the case s tudy. The excellent reviews by MacCrimmon (1973) and Hwang e t al. (1900) will help t o solve our problem of choice because they a r e based on different classification principles. MacCrim- m o n s t r e s ses t h e s t ruc tu ra l differences between t h e various me thods (Table 4); Hwang e t al. s t r e s s t h e stage a t which t h e information is needed and t h e type of information (Table 5); and Larichev (1979) concen t ra t e s on t h e type of information provided by t h e decision maker and i t s mode of usage (Table 6).
A first g lance a t t h e models proposed in t h e l i t e ra tu re indicates that. t h e following c lasses a r e worth considering for our case s tudy:
t h e me thod of thresholds of incomparabil i ty (Roy a n d Bertier 1971, Roy 1977, Larichev 1979); goal programming (Section 2.3.1);
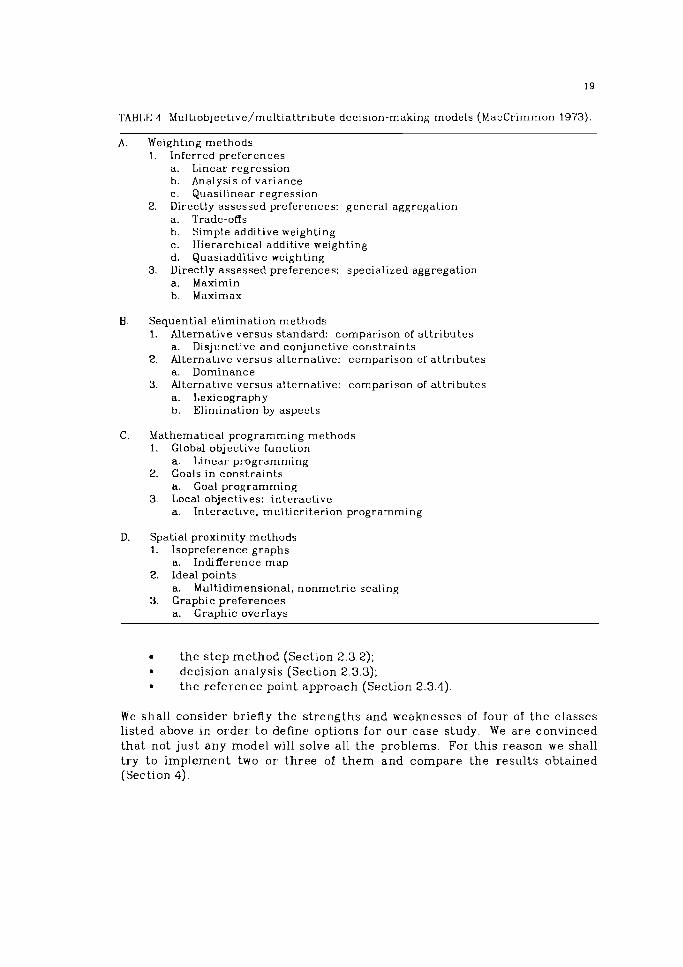
TABLE 4 Multiobjective/multiattribute decision-making models (MacCrimmon 1973)
A. Weighting methods 1. Inferred preferences
a. Linear regression b. Analysis of variance c. Quasilinear regression
2. Directly assessed preferences: general aggregation a. Trade-offs b. Simple additive weighting c. Hierarchical additive weighting d. Quasiadditive weighting
3. Directly assessed preferences: specialized aggregation a. Maximin b. Maximax
B. Sequential elimination methods 1. Alternative versus standard: comparison of attributes
a. Disjunctive and conjunctive constraints 2. Alternative versus alternative: coniparison of attributes
a. Dominance 3. Alternative versus alternative: comparison of attributes
a. Lexicography b. Elimination by aspects
C. Mathematical programming methods 1. Global. objective function
a. Linear programming 2. Goals in constraints
a. Goal programming 3. 1,ocal objectives: interactive
a. Interactive, multicriterion prograrnming
D. Spatial proximity methods 1. lsopreference graphs
a. Indifference map 2. Ideal points
a. Multidimensional, nonmetric scaling 3. Graphic preferences
a. Graphic overlays
the s tep method (Section 2.3.2); decision analysis (Section 2.3.3); the reference point approach (Section 2.3.4)
We shall consider briefly the strengths and weaknesses of four oi the classes listed above in order to define options for our case study. We are convinced tha t not just any model will solve all the problems. For this reason we shall t ry t o implement two or three of t h e m and compare the results obtained (Section 4).
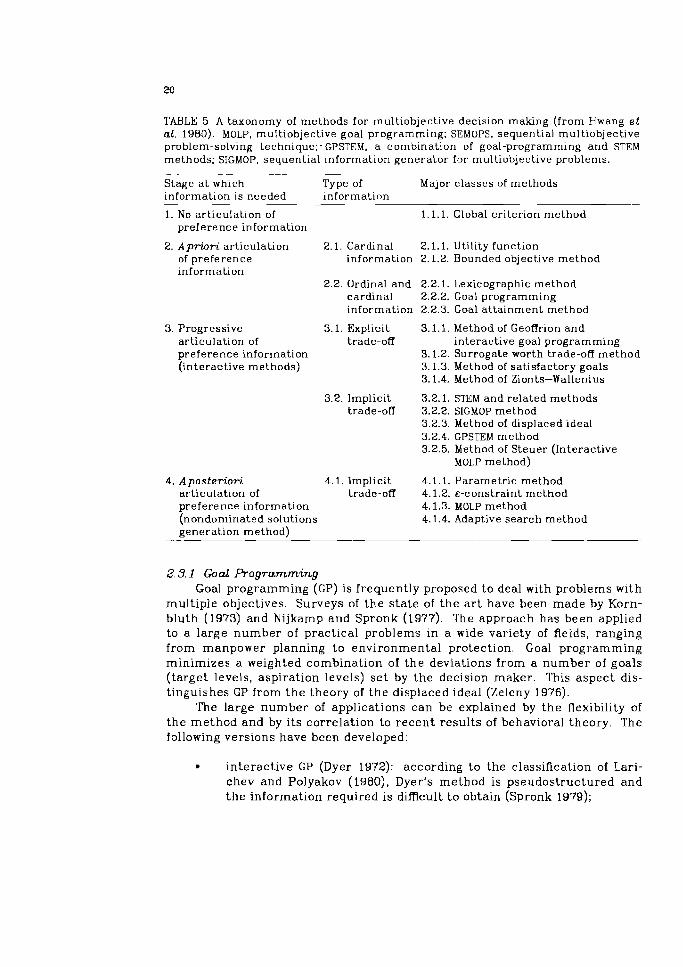
TABLE 5 A taxonomy of methods for rnultiobjective decision making (from Hwang e t al. 1980). MOLP, multiobjective goal programming; SEMOPS, sequential multiobjective problem-solving technique;.GPSTEM, a combination of goal-programming and STEM methods; SIGMOP, sequential information generator for multiobjective problems.
Stage a t which Type of Major classes of methods information is needed information
1. No articulation of preference information
Apriori articulation 2.1. Cardinal of preference information information
2.2. Ordinal and cardinal information
3. Progressive 3.1. Explicit articulation of trade-off preference information (interactive methods)
3.2. Implicit trade-off
4. Aposteriori 4.1. Implicit articulation of trade-off preference information (nondoniirlated solutions generation method)
1.1.1. Global criterion method
2.1.1. Utility function 2.1.2. Bounded objective method
2.2.1. Lexicographic method 2.2.2. Goal programming 2.2.3. Goal a t ta inment method
3.1.1. Method of Geoffrion and interactive goal programming
3.1.2. Surrogate worth trade-off method 3.1.3. Method of satisfactory goals 3.1.4. Method of Zionts-Wallenius
3.2.1. STEM and related methods 3.2.2. SIGMOP method 3.2.3. Method of displaced ideal 3.2.4. GPSTEM method 3.2.5. Method of Steuer (Interactive
MOLP method)
4.1.1. Parametr ic method 4.1.2. &-constraint method 4.1.3. MOLP method 4.1.4. Adaptive search method
2.3.1 Goal Programming Goal programming (GP) is frequently proposed to deal with problems with
multiple objectives. Surveys of the s ta te of the a r t have been made by Korn- bluth (1973) and Nijkamp and Spronk (1977). The approach has been applied to a large number of practical problems in a wide variety of fields, ranging from manpower planning to environmental protection. Goal programming minimizes a weighted combination of the deviations from a number of goals (target levels, aspiration levels) se t by the decision maker. This aspect dis- tinguishes GP from the theory of t h e displaced ideal (Zeleny 1976).
The large number of applications can be explained by the flexibility of the method and by its correlation to recent results of behavioral theory. The following versions have been developed:
interactive GP (Dyer 1972): according to the classification of Lari- chev and Polyakov (1980), Dyer's method is pseudostructured and the information required is difficult t o obtain (Spronk 1979);
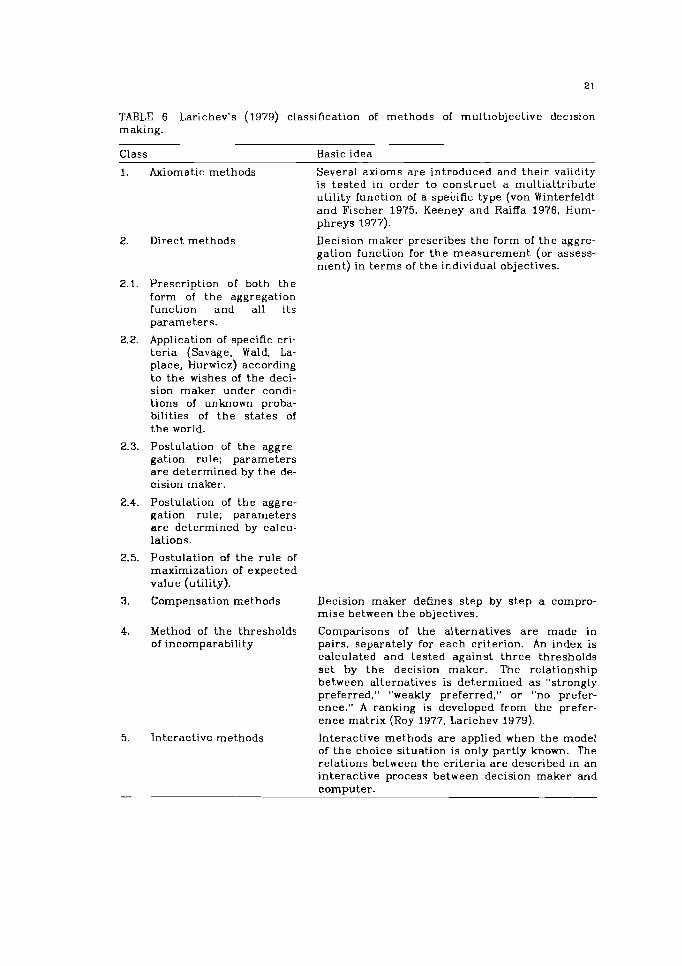
TABLE 6 Larichev's (1979) classification of methods of multiobjective decision making.
Class Basic idea
1. Axiomatic methods Several axioms a r e introduced and their validity is tes ted in order t o construct a mult ia t t r ibute utility function of a specific type (von Winterfeldt a n d Fischer 1975, Keeney and Raiffa 1976, Hum- p h r e y ~ 1977).
Direct methods
Prescription of both t h e form of t h e aggregation function and all i ts parameters .
Application of specific cri- t e r ia (Savage. Wald. La- place. Hurwicz) according t o t h e wishes of the deci- sion maker under condi- tions of unknown proba- bilities of t h e s ta tes of t h e world.
Postulation of t h e aggre- gation rule; parameters a r e determined by t h e de- cision maker .
Postulation of t h e aggre- gation rule; parameters a r e determined by calcu- lations.
Postulation of t h e rule of maximization of expected value (utility).
Compensation methods
Method of t h e thresholds of incomparability
5. Interactive methods
Decision maker prescribes t h e form of t h e aggre- gation function for t h e measurement (or assess- m e n t ) in t e r m s of t h e individual objectives.
Decision maker defines s tep by s t e p a compro- mise between t h e objectives.
Comparisons of t h e alternatives a r e made in pairs, separately for each criterion. An index is calculated and tested against t h r e e thresholds s e t by t h e decision maker . The relationship between alternatives is determined a s "strongly preferred," "weakly preferred," or "no prefer- ence ." A ranking is developed from t h e prefer- e n c e matr ix (Roy 1977, Larichev 1979).
Interactive methods a r e applied when t h e model of t h e choice situation is only part ly known. The relations between t h e cr i ter ia a r e described in a n interact ive process between decision maker and computer .
- --
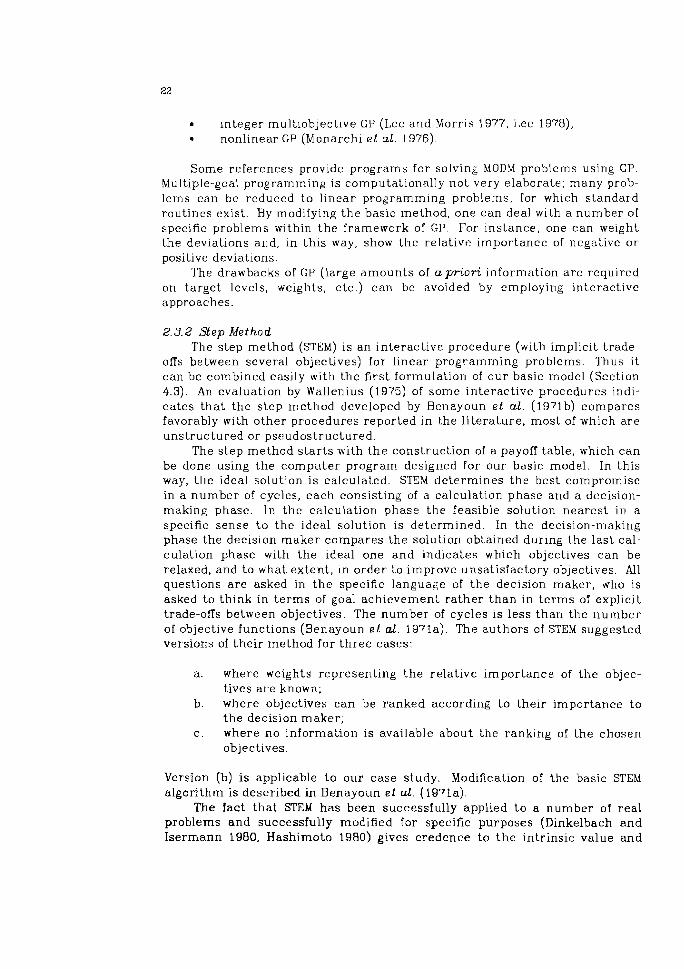
integer multiobjective CP (Lee and Morris 1977, Lee 1978); nonlinear CP (Monarchi et aL 1976).
Some references provide programs for solving MODM problems using GP. Multiple-goal programming is computat ion~~lly not very elaborate; many prob- lems can be reduced to l inear programming problems, for which standard routines exist. By modifying the basic method, one can deal with a number of specific problems within the framework of GP. For instance, one can weight the deviations a i ~ d , in this way, show the relative importance of negative or positive deviations.
The drawbacks of GP (large amounts of apr ior i information a re required on target levels, weights, e tc . ) can be avoided by employing interactive approaches.
2.3.2 Step Method The step method (STEM) is an interactive procedure (with implicit trade-
offs between several objectives) for linear programrning problems. Thus i t can be combined easily with the first formulation of our basic model (Section 4.3). An evaluation by Wallenius (1975) of some interactive procedures indi- cates tha t the step method developed by Benayoun et aL. (1971b) compares favorably with other procedures reported in the l i terature , most of which are unstructured or psc:udostructured.
The step method s ta r t s with the construction of a payoff table, which can be done using the computer program designed for our basic model. In this way, tlie ideal solution is calculated. STEM determines the best compromise in a number of cycles, each consisting of a calculation phase and a decision- making phase. In the calculation phase the feasible solution nearest in a specific sense to the ideal solution is determined. In the decision-making phase the decision maker compares the solutiori obtained during the las t cal- culation phase with the ideal one and indicates which objectives can be relaxed, and to what extent, in order to improve unsatisfactory objectives. All questions a re asked in t h e specific language of the decision maker, who is asked to think in terms of goal achievement rather than in terms of explicit trade-offs between objectives. The number of cycles is less than the number of objective functions (Benayoun et al. 1971a). The authors of STEM suggested versions of t.heir method for three cases:
a. where weights representing the relative importance of the objec- tives a re known;
b. where objectives can be ranked according t o their importance to the decision maker;
c. where no information is available about the ranking of the chosen objectives.
Version (b) is applicable to our case study. Modification of the basic STEM algorithm is described in Benayoun e t al. (1971a).
The fact tha t STEM has been successfully applied t o a number of real problems and successfully modified for specific purposes (Dinkelbach and Isermann 1980, Hashimoto 1980) gives credence to t he intrinsic value and
flexibility of the method. In addition, STEM should be attractive to decision makers because the procedure does not rely on trade-off functions and only involves weighting factors when their assignment is not difficult.
2.3.3 D e c i s i o n A n a l y s i s The decision analysis group a t the Stanford Research Institute in Califor-
nia (Howard and Matheson 1976) characterizes decision analysis as a norma- tive discipline concerned with the practice of rational decision making. What is the basis for the seemingly pretentious assertion by decision analysts that "decision analysis is the most powerful tool yet discovered for ensuring the quality of the decision making process" (Matheson and Howard 1968, Howard and Matheson 1976)?
Decision analysis (DA) was developed especially for complex, uncertain, dynamic situations where decisions have long-term effects. It relies upon Bayesian statistics, subjective assessments of expected utility, multiattribute utility theory, and several methods developed in operations research. The new theory has been applied successfully to a number of practical problems (case studies are described by Howard and Matheson 1976). Advantages of DA include the involvement of the decisiori maker in the problem-solving process and t he consideration of the subjective knowledge, time preference, and atti- tude to risk of the decision maker.
The early optimism of decision analysts t ha t almost all decision-making problems could be handled by decision analysis has been replaced by more realistic appraisals (e.g. Howard 1980). We see DA as being most useful in economics and less easily applicable to problems with strong social com- ponents. Decision analysts admit tha t some theoretical questions have not yet been solved. Howard arid Matheson (1976) have pointed to gaps in the theory, but these "white spots" do not necessarily narrow the range of practi- cal applicability of this new theory.
First tutorials in DA describe i t as a normative rather than a descriptive theory. Extensive application work in the last few years has shown tha t a nor- mative theory must be based on a satisfactory description of the real decision-making process.
Criticism of decision analysis centers on its roots: the assignment of probabilities, the concept of expected utility, and the concept of multiattri- bute utility.
2.3.3.1 A s s i g n m e n t of R o b a b i l i t i e s The assignment of probabilities to the outcomes of the chance nodes is a
part of the concept of expected utility (Section 2.3.3.2). Many theoretical investigations of decision analysis assume tha t these probabilities are known or are easy to obtain. However, applications of the theory to real decision situations have indicated that this is not t rue In the early 1970s psycholo- gists investigated the ability of decision makers to process probabilistic infor- mation (Tversky and Kahneman 1975, Kaplan and Schwartz 1975, Slovic e t al. 1977a, b). The results were disenchanting. Tversky and Kahneman (1975) found tha t people tend to reduce a complex assessment task to a se t of sim- ple tasks using heuristic principles. Under specific circumstances this may lead to questionable decisions resulting from systematic errors in
assessment, which in turn are largely the result of certain biases, including the following three types:
a. Bas due t o representation. Summarizing other studies, Slovic et al. (1977a, b) concluded tha t scientists
had unreasonably high expectations about the replicability of results from a single sample; had undue confidence in early results from a few subjects; gambled with research hypotheses based on small samples without realizing the extremely high odds against detecting the effects being studied; rarely attributed unexpected results to sampling variability because they found a causal explanation for every observed effect; and seemed to rely almost exclusively on specific information and neglected prior probabilities.
b. Bas due to availability. There is a tendency for people to assess the frequency of a class or the probability of an event. by the ease with which instances can be brought to mind (Tversky and Kahne- man 1975).
c. Bas due to anchoring. In many situations people begin to estimate the probability of an event using a natural starting point (anchor), which is then adjusted. These adjustments are often insufficient.
The question then arises whether these results cast doubt on decision analysis. Although the behavior of people involved in assessment tasks under uncertain conditions was observed to be valid for special laboratory-prepared tests, Slovic et al. (1977a, b) argue tha t "much evidence suggests that the laboratory results generalize. Cognitive limitations appear to pervade a wide variety of tasks in which intelligent individuals serve as decision makers." Psychologists do not pretend to cover all decision situations and all decision makers. No doubt these psychological investigations are important for the understanding of people's cognitive processes, but we believe tha t i t is too early to condemn decision analysis. Other considerations support this belief.
The use of probability estimates that are biased to a certain degree will not have catastrophic effects on the results obtained from using the approach proposed in this report. A sensitivity analysis will reveal t he importance of a particular estimate for the solution. Several procedures can be applied to calibrate probability assessments (e.g. Spetzler and Stael von Holstein 1972, Lichtenstein e t al. 1977, Pfohl 1977).
We have to look a t the problem of assigning probability to future events in the more general framework of the evaluation process as a whole, includ- ing the assignmerit of values or utilities to certain consequences of our activities. The utility aspect is of the same importance for societal decision making as the probability aspect (Jungermann 1977).
Finally, in tackling problems of high complexity both analyst and deci- sion maker must have the courage to simplify. We cannot renounce probabil- ities simply because of difficulties in making estimates.
2.3.3.2 Ezpected Utility Theory In applying the concept of expected utility, one assumes tha t decisions
are chosen because of their prospects for utility and the probability of the occurrence of certain options. Some decision makers and decision scientists argue, however, tha t risky decisions are not determined by maximization of expected utility. An alternative theory was suggested by Coombs (1975), but i t has not been implemented.
One cannot say definitely whether expected utility is a good or bad basis for making decisions under circumstances of uncertainty. According to Larichev's classification of methods for multiattribute decision making (Table 6), models using expected utility as a criterion belong to the class of direct methods. Defining or postulating the form of the criterion (expected utility), the decision analyst eliminates all problems, but the question is whether or not this postulate is justified.
Kahneman and Tversky reported on an unambiguous violation of the sub- jectively expected utility theory (Bell et al. 1977). They observed t ha t people tend t o value consequences t ha t are known with certainty more highly than uncertain consequences. Kahneman and Tversky called this violation the certainty effect.
Another violation of the theory is the reference effect: people seem to evaluate alternatives with reference to a point determined either by expecta- tions about future development or by the s tatus quo. The reference effect is one of the main arguments of the proponents of the reference point approach (Section 2.3.4). The certainty and reference effects mus t be regarded as seri- ous problems for the normative theory and its application (Slovic et al. 1977a. b). Proponents of expected utility could argue tha t one could elicit the "uncertainty preference" (e.g. risk or t ime preference) from the decision maker and formally include it in the analysis.
2.3.3.3 Multiattribute Utility lheory Methods based on multiattribute utility theory (MAUT) are discussed
intensively in the scientific l i terature. Their applicability t o real problems has been critically reviewed by Fischer (1972), von Winterfeldt and Fischer (1975), Humphreys (1977), Larichev (1979), and Humphreys and Wisudha (1980). MAUT is a strong and sophisticated mathematical theory (Fishburn 1970) whose main concern is the decomposition of multiattribute utility func- tions into a se t of simple single-attribute utility functions t ha t can actually be assessed. For this purpose a set of axioms has been described (Fishburn and Keeney 1974). However, psychologists have shown tha t the axioms can- not pretend to be of general applicability (Nlais 1953, Slovic and Tversky 1974, von Winterfeldt and Fischer 1975). Disaggregation of t he general utility function is often performed regardless of violations of the axioms. Simple additive models are most popular. Several investigations indicate tha t minor violatioils had little effect on the quality of the solutions to the problems because of the robustness of the simple additive model (Fischer 1972).
Sometimes the question arises whether i t is sensible to spend the con- siderable effort needed t o tes t the axioms; it seems reasonable to postulate an additive or multiplicative form or the overall utility function. "Conse- quently, except in very simple laboratory experiments, validation of MAUT
makes no sense at. all" (Bauer and Wegener 1977). Recent applications of MAUT placed emphasis not on formal axiomatic considerations but on the specific task environment lacing the decision maker. This makes MAUT more attractive for real applications.
Let us summarize the most important drawbacks:
MAUT assumes tha t complete and definite information about the preference of the decision maker is available a t the beginning of t he decision-making process. The opposite seems to be t rue in most practical situations (Dinkelbach and Isermann 1980, Hwang e t al. 1980). MAUT is based on rather strong assumptions about t h e rational behavior of economists (Keen and Morton 1978). Investigations by March and Simon (1978) and Wierzbicki (1980) support the hypothesis tha t everyday decisions are not made by maximizing utility functions but ra ther by establishing certain reference levels. The most important concerns of MAUT are not real decision-making problems but considerations of the form of the disaggregation rule for the overall utility function. MAUT is best suited for repetitive choice situations (Wierzbicki 1979a, b, Larichev 1979). (Our problem in the lighting industry is somewhere between the repetitive arid unique choice situations.) I t is extremely difficult to t e s t the axioms. MAUT has rarely been applied to risky multiattribute decision mak- ing; von Winterfeldt and Fischer (1.975) reported only two cases. In most cases additive, riskless, time-invariant models a re applied. Hession (1977) discusses risky MAUT procedures, and a case study has been reported by Keefer (1978). The procedures for assessing utilities a re clurnsy, complicated, difficult to understand, and time-consuming; they do no t allow for mistakes and they sometimes require answers to somewhat nebu- lous hypothetical questions (von Winterfeldt 1975).
Bauer and Wegener (1977) ascribe the discrepancy between the sophistication and high development of MAUT and the small number of applications to "limi- tations concerning t he overall complexity tha t can be processed by it." They s ta te multiattributivity, uncertainty, and time variability to be t he main fac- tors determining the complexity of a decision situation and argue t ha t "further decomposition of one of the three dimensions ... has to be paid for with higher aggregation in the other two dimensions, unless progress is made simultaneously on the instrumental side of the modeling techniques, e.g. by introducing choice heuristics or int.eractive computing assistance."
The weaknesses of MAUT make i t difficult to justify i ts application t o our case study. Peschel (1980) points out tha t despite the great popularity of MAUT in t he western scientific l i terature, the existence of a decision maker 's global utility function is sometimes denied. Peschel's reservations a re shared by many scientists, especially in countries with planned economies (Golubkov 1977, Belyaev 1977, Danilov-Danilyan 1980).
2.3.4 Reference Point Approach The following discussion is based on the work of Wierzbicki (1979a, b,
1980), Kallio et al. (1980), and Hashimoto (1980). The relatively new reference point approach (RPA) avoids many of the drawbacks of more traditional approaches to MODM. Wierzbicki (1979b) advocates the hypothesis tha t every- day decisions are not made by maximizing utility functions but ra ther by establishing certain reference levels for objectives and trying to satisfy them. This hypothesis seems to be valid for the problem formulated in Section 4, where decisions to be made display features of both repetitive and unique decision situations and where the preferences a re variable. The problems of an appropriate representation of uncertainty have still to be investigated. Successful implementation of RPA was reported by Hashimoto (1980) and by Kindler et al. (1980). A package of programs has been designed for automat- ing RPA, but i t is not in general use.
The main advantage of RPA over traditional MODM methods is tha t the decision maker can specify target levels tha t are used to define a Pareto optimal solution. This is as close as possible in a specific sense to the refer- ence point. The decision maker can think in te rms of goals instead of utili- ties and preferences, which are quite unnatural in practical decision making (Zeleny 1980). The reference point approach improves a crucial aspect of interactive MODM methods because additional i.nformation from the decision maker is provided (Larichev and Polyakov 1980).
A feature of Wierzbicki's approach is tha t any reference point, attainable or not, can be used. Thus RPA is more general than most of the previous approaches, which used only certain kinds of reference point. Kallio et al. (1980) discussed forms of the penalty scalarizing function resulting in linear programming problems. The reference point approach can be combined with our approach as developed in Section 4.
2.4 Risk Evaluation of Portfolios of Innovation Projects
The acceleration of scientific and technological progress amplifies several sources of uncertainty. This greatly complicates decision making on innovation projects and project portfolios. In practice, to ignore risk means to deny the nature of t he matter . For this reason, problems of uncertainty and risk a re taken up in most publications on decision making. No general recommendations can yet be given on how best to include the prospect of risk in decision making on innovation projects, although there is a need for such a methodology. In this study we can consider only certain theoretical aspects of the problem and possible approaches within the framework of our decision support system for the lighting industry of [.he German Democratic Republic.
Taking into consideration all complicating aspects (risk, multiple objec- tives, t ime variability of the preferences, etc.) independently or sequentially leads t o unsatisfactory or, a t least, theoretically insufficient results. Models tha t allow one to handle all these important aspects simultaneously are lack- ing. New approaches have been developed recently to expand decision mak- ing involving multiple objectives to a multicriterion concept of risk (Colson and Zeleny 1980).
Although there are differences between risk and uncertainty, these te rms are often seen as identical (Salazar and Sen 1968). In our view, uncer- tainty denotes ambiguity. We distinguish between uncertainty t ha t can be grasped by probability theory and uncertainty for which probability theory cannot be applied (Fedorenko 1975, p. 376). Furthermore, there is uncertainty resulting from the nature of a process (situation) and uncertainty due t o incomplete and /or inaccurate information. In practice these differences become blurred: all types of uncertainty complicate decision making in a like manner .
We have to find the type of uncertainty tha t best characterizes our prob- lem in order to progress in our investigations. Generally speaking, there a re unique choice situations and repetitive choice situations. The decision t o adopt or reject an innovation project is either unique or repetitive, depending on the class of innovations prevailing. For example, decisions concerning marginal improvement innovations have many repetitive features, whereas basic innovations a re always uniq-ue, as are decisions to adopt or reject proj- ects of this type. In our study we deal mainly with average and important improvement innovations (a precise definition of these terms is given by Hau- stein and Maier 1980). Therelore, an approximate probabilistic t rea tment of uncertainty seems possible.
The interpretation of uncertainty and risk depends also upon the level of the management hierarchy under consideration. On the level of society as a whole, risk is often associated with uncertain and undesirable consequences of the application of modern technologies (Slovic e t al. 1977a. b, Pat6 1979). Investigations concentrate on psychological questions of perception and societal acceptance of undesirable side effects. While we do not deny t he importance of these questions, we stress the influence of uncertain expecta- tions and possible future events on decisions tha t mus t be made today con- cerning innovation projects.
In every business situation, a qualitative risk analysis is absolutely necessary. Quantitative risk analyses are valid only for specific conditions and under certain assumptions and cannot be generalized in most cases. Undoubtedly this fact greatly complicates the integration of risk in the decision-making process within the planned economy. It has not yet been determined whether decision situations can be classified with regard to risk, so tha t general approaches can be recommended for certain classes.
Let us summarize the most important issues (BBcskai e t al. 1976, Zell- mer 1980). Risk is the possibility tha t a decision will lead t o consequences tha t differ too rnuch from those expected or planned. This definition relates risk to objectives derived from societal needs. Risk implies interdependence between:
the objectives of economic development; the anticipated objectives and the actual results t ha t can be accepted by society; the expected positive consequences;
the expected negative consequences, should actual results differ too much from those anticipated.
By quantifying these factors in an appropriate manner, we obtain the so- called risk coefficient, as i t was introduced by Bacskai e t al. (1976) and developed further by Zellmer (1980).
A variety of risk factors can lead to a discrepancy between actual and anticipated results. Most of the classifications of these factors reflect pecu- liarities of a certain field of investigation. For decisions on innovation proj- ects, we see the following factors as most important:
I . The potential areas of application of a particular innovation are only roughly predictable (but accuracy increases with time). This is even more true of the market share of an innovation in a specific application. Difficulties in forecasting the market share are caused, above all, by competing innovations. The market share of a particu- lar innovation is determined by the development of prices (espe- cially the price of energy: Doblin 1982), by existing capacities, by the present economic mechanism and its main directions of development, by the present s tate of the economy, etc . That is why it is sometimes difficult for innovations to realize the high expecta- tions of top management.
2. To realize its scientific, technological, arld economic potential, the innovation process presumes the availability of certain resources, machines, and equipment.
3. Governmental economic measures have a major impact on innova- tions, especially in countries with centrally planned economies.
4. International development of prices and costs has caused a deeply felt shift in the orientation of the economy as a whole, with pro- found consequences for all innovation projects under consideration.
All of the factors listed above act together. It is only partly possible to separate them analytically in each application. Other important factors influencing risk are described by Martino (1972), Bacskai e t al. (1976), and others, who express alternative views on these problems.
Our practical experience with managers and theoretical investigations (B~cskai e t d. 1976) confirm the view that i t 1s the economic mechanism tha t has the greatest impact on the formation of risk. The behavior of managers is determined to a high degree by sanctions when risky decisions fail and by financial and other rewards when they succeed. Stimulation has been predominantly negative in nature. This has led most decision makers to shy away from dynamic development with high potential gains for their enter- prise and for society as a whole in favor of contemplative, riskless behavior characterized by leisure, stability, and the absence of conflicts. This behavior is also fostered by the fact that risk-prone decision makers lack juridical pro- tection and have insufficient reserve funds. In addition, economic conditions during the 1970s and early 1980s (scarcity of raw materials and energy sup- plies) have increased restrictions on decision makers' latitude. Governmen- tal agencies are being forced to allocate certain kinds of resources centrally.
Much has been done both in theoretical work and in practice to create an economic mechanism for stimulating decision makers to make decisions involving an admissible degree of risk. We consider risk to be socially admis- sible if i t does not entail possible consequences tha t could not be accepted by society even when the most important influencing factors are unfavorable. Many of the aids to decision making developed by modern decision theory to quantify risk have been applied successfully to various problems in different branches of industry (e.g. Tsuji 1980 and references cited therein).
We want to warn against uncritical applications of these methods. First of all, the assumptions upon which the methods are based must be examined. All of the methods imply a certain manner or style of viewing a decision prob- lem or place certain aspects of the problem into the center of the analysis (Salazar and Sen 1968, BAcskai e t d. 1976, Pate 1979, Chapman 1979, Tsuji 1980). In applying methods based on decision theory it is of critical impor- tance to identify all events relevant to a risky decision situation and to deter- mine their interdependence. In order to determine a t least the most impor- tant of these, the judgment of experts is needed. The quality of the whole analysis depends upon the competence of these experts (Pate 1979).
There are only a few methods tha t do not employ event probability esti- mates (behavioral factors producing biases in probability estimates were summarized in Section 2.3.3). Estimates of the probabilities of events pro- vide information that, as yet cannot be obtained in other ways.
The application of decision t rees is one of the methods suggested by pro- ponents of decision theory for supporting risky decisions. (For details of this and alternative approaches and combinations of methods we refer to the literature, e.g. Belyaev (1977), Keefer (1978), Pat6 (1979), Chapman (1979), and Tsuji (1980).) A critical assessment of decision trees was made by Lari- chev (1979). Decision trees are an important element in Cazalet's (1981) integrated system of models. We shall discuss quantitative risk assessment based on decision trees and its integration into our approach after we have introduced the general outline of the decision support system for which we are aiming (Section 4.4).
Having reviewed existing models and concepts for decision support and their relevance to innovation management, we shall now use them for developing a decision support system for the lighting industry. For this pur- pose we need a clear understanding of the industry and its requirements for development.
3 THE LIGHTING INDUSTRY: A CLASSIC EXAMPIX OF INNOVATION
Energy production and consumption are a major global prol)lem, and society is becoming increasingly aware tliat economic growth cannot be ensured by the continued ability of energy production to remain ahead of overall production growth. In view of this, many scientific iristitutions have been making more detailed investigations of a wide spectrum of possible energy-saving measures. Eighty years ago, lighting technology was the big- gest consumer of electricity in countries with electric energy systems. The demand for electric lighting and the complex innovation process triggered off
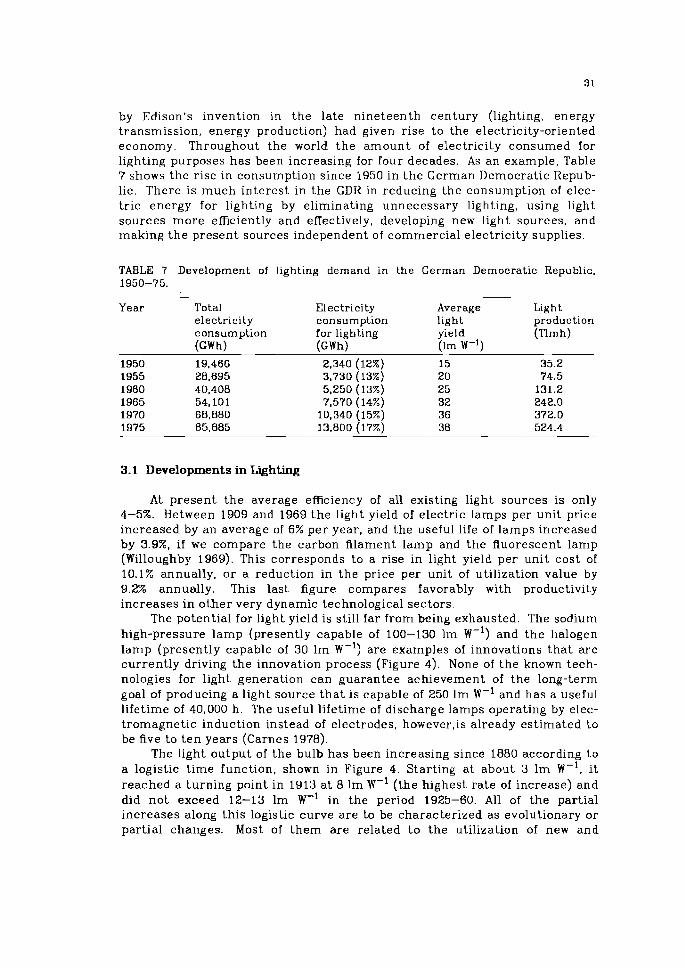
by Edison's invention in the late nineteenth century (lighting, energy transmission, energy production) had given rise to the electricity-oriented economy. Throughout the world the amount of electricity consumed for lighting purposes has been increasing for four decades. As an example, Table 7 shows the rise in consumption since 1950 in the German Democratic Repub- lic. There is much interest in the GDR in reducing the consumption of elec- tric energy for lighting by eliminating unnecessary lighting, using light sources more efficiently and effectively, developing new light sources, and making the present sources independent of commercial electricity supplies.
TABLE 7 Development of lighting demand in the German Democratic Republic, 1950-75.
Year Total electricity consumption (GWh) 19,466 28,695 40,408 54,101 68.880 85.885
Electricity consumption for lighting ( G W h l
Average light yield (lm W-') -
15 20 25 32 36 38
Light production (Tlmh)
3.1 Developments in Lighting
At present the average efficiency of all existing light sources is only 4-5%. Between 1909 and 1969 the light yield of electric lamps per unit price increased by an average of 6% per year, and the useful life of lamps increased by 3.9%, if we compare the carbon filament lamp and the fluorescent lamp (Willoughby 1969). This corresponds to a rise in light yield per unit cost of 10.1% annually, or a reduction in the price per unit of utilization value by 9.2% annually. This last figure compares favorably with productivity increases in other very dynamic technological sectors.
The potential for light yield is still far from being exhausted. The sodium high-pressure lamp (presently capable of 100-130 lm W-l) and the halogen lamp (presently capable of 30 lm W-l) are examples of innovations tha t are currently driving the innovation process (Figure 4). None of the known tech- nologies for light generation can guarantee achievement of the long-term goal of producing a light source tha t is capable of 250 lm W-l and has a useful lifetime of 40,000 h. The useful lifetime of discharge lamps operating by elec- tromagnetic induction instead of electrodes, however,is already estimated to be five to ten years (Carnes 1978).
The light output of the bulb has been increasing since 1880 according to a logistic time function, shown in Figure 4. Starting a t about 3 lm W-l, i t reached a turning point in 1913 a t 8 lm W-l (the highest rate of increase) and did not exceed 12-13 lm W-l in the period 1925-60. All of the partial increases along this logistic curve are to be characterized as evolutionary or partial changes. Most of them are related t o the utilization of new and
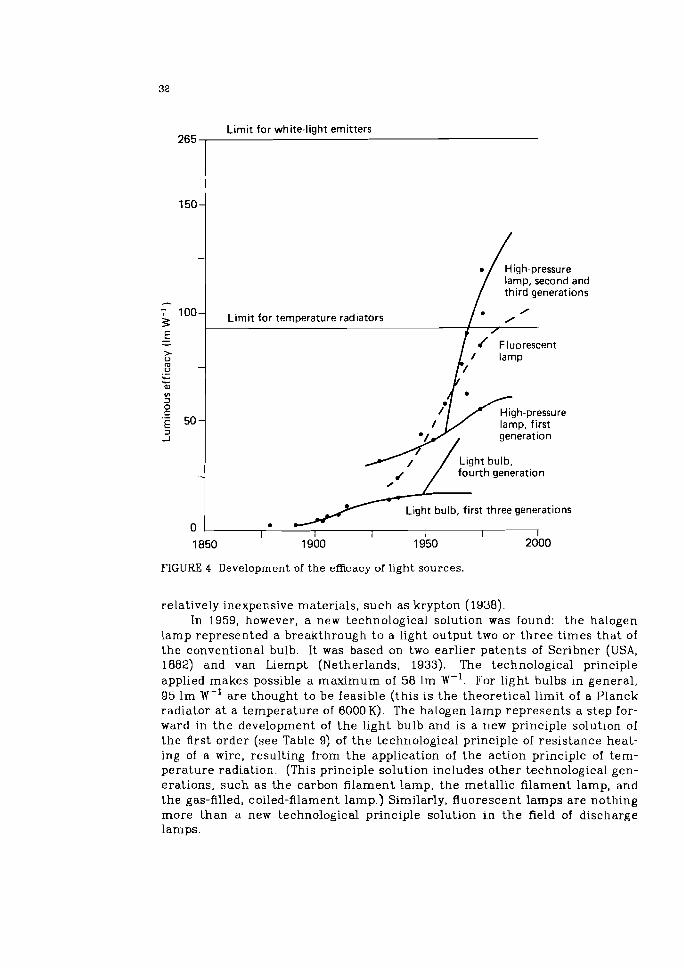
Limit for white-light emitters 265 ,
i High-pressure lamp, second and third generations
. ~
& loo] Limit for temperature radiators i(i ,;;iscent E - - >- 0 10 0 .- *- *- bl
FIGURE 4 Development of the efficacy of light sources.
V)
3 0
'- 50- S J
-
0
relatively inexpensive materials, such as krypton (1938). In 1959, however, a new technological solution was found: the halogen
lamp represented a breakthrough to a light output two or three times tha t of the conventional bulb. It was based on two earlier patents of Scribner (USA, 1882) and van Liempt (Netherlands, 1933). The technological principle applied makes possible a maximum of 58 Im W-l. For light bulbs in general, 95 l m W-I are thought to be feasible (this is the theoretical limit of a Planck radiator a t a temperature of 6000K). The halogen lamp represents a step for- ward in the development of the light bulb and is a new principle solution of the first order (see Table 9) of the technological principle of resistance heat- ing of a wire, resulting from the application of the action principle of tem- perature radiation. (This principle solution includes other technological gen- erations, such as the carbon filament lamp, the metallic filament lamp, and the gas-filled, coiled-filament lamp.) Similarly, fluorescent lamps are nothing more than a new technological principle solution i n the field of discharge lamps.
High-pressure lamp, first generation
Light bulb, fourth generation
Light bulb, first three generations a
I I I I I I 1850 1900 1950 2000
Of course, i t is possible that new technological principles will be discovered in the field of gas discharge systems. An innovation resulting from such a discovery would have to be classified as a principle solution of the second order. Moreover, only some of the presently known energy transforma- tion processes have been used as commercial light sources. Only three fun- damental principles of action have been exploited so far. Plasma physics and the phenorl~ena of tribo-, chemi-, and bioluminescence may find wider appli- cation in the future.
3.2 Product and Process Innovations
3.2.1 R e I n c a n d e s c e n t Lamp Using the example of the incandescent lamp, we can study the sequence
of product innovation and process innovation in the lighting industry (Figure 5). Product innovation began in 1881; until 1891 the technical level of the product, measured in lumen-hours, showed an annual increase. Between 1890 and 1900, during which time gas lighting began to compete with electric lighting, progress was less significant. However, between 1890 and 1915 a series of major improvements (especially ductile tungsten) ensured the suc- cess of the new technological principles. At the same time indicators of pro- cess innovation behaved differently. Productivity gain was very high when mass production was begun (1882-86); however, i t was rather low during the subsequent fifteen years because production was mainly a manual process. Mechanization brought about a greater increase in productivity in the years from 1900 to 1915. As a result of automation the main process innovation came before the Second World War. Product innovation in incandescent lamps declined after 1910-15, but showed a small upswing before the Second World War.
The first halogen lamp was produced in 1960, but i t is still not used as a general-purpose lamp. Thus we find tha t the basic innovation, "incandescent lamp," was realized through three major improvement-related innovations and many minor innovations. The length of the product improvement cycle was about 25-30 years. The increase in technical level of the product reached an absolute maximum in 1910-15, after which there was a decline. Process innovations also went through improvement cycles and became accelerated after the peak in product innovation. After more than forty years of relatively slow product development the bulb production process was revo- lutionized: only 83 lamps were produced per man-hour in 1939, whereas the corresponding figure for 1969 was 750 (Carnes 1978).
3 . 2 . 2 R e &charge Lamp Tlie innovation process of the discharge lamp began in 1830. The light
output was lower than that of the incandescent lamp; however, this should be seen against the higher technological level and greater useful lifetime of the discharge lamp. The production rate increased from 1,000 units per hour in 1954 to more than 3,000 units per hour in 1977. As no new technological prin- ciple for light generation has been discovered, i t is very difficult today to assess what the time or extent of maximum production of discharge lamps will be.
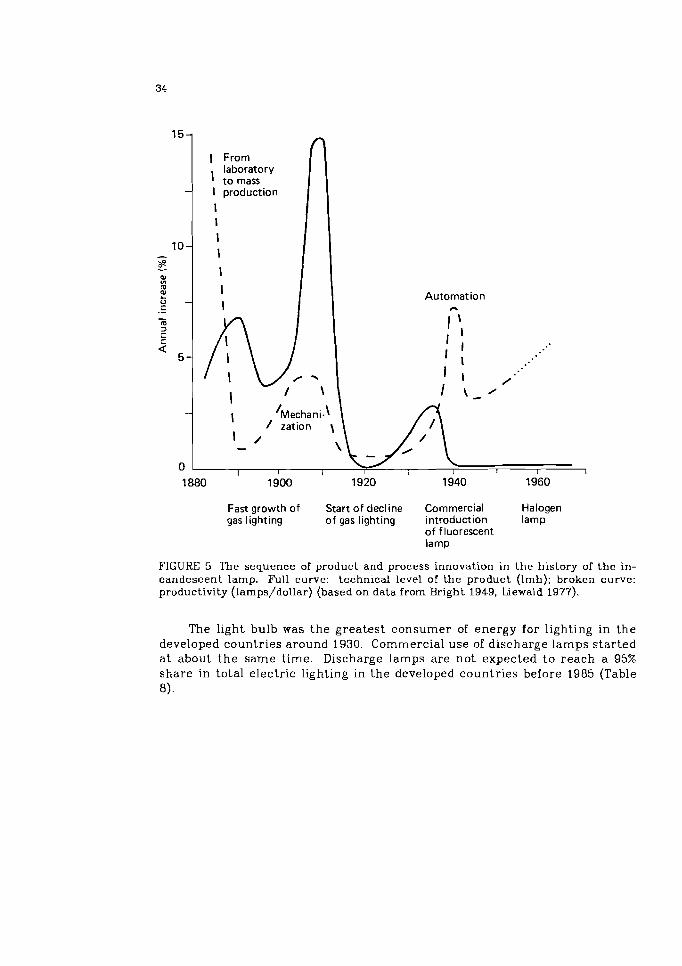
. - I From
laboratory I to mass I production
I
I I I
Automation
Fast growth of Start of decline Commercial Halogen gas lighting of gas lighting introduction lamp
of fluorescent lamp
FIGURE 5 The sequence of product and process innovation in t h e history of t h e in- candescent lamp. Full curve: technical level of the product (lmh); broken curve: productivity (larnps/dollar) (based on data from Bright 1949. Liewald 1977).
The light bulb was the greatest consumer of energy for lighting in the developed countries around 1930. Commercial use of discharge lamps started a t about the same time. Discharge lamps are not expected to reach a 95% share in total electric lighting in the developed countries before 1985 (Table 8).
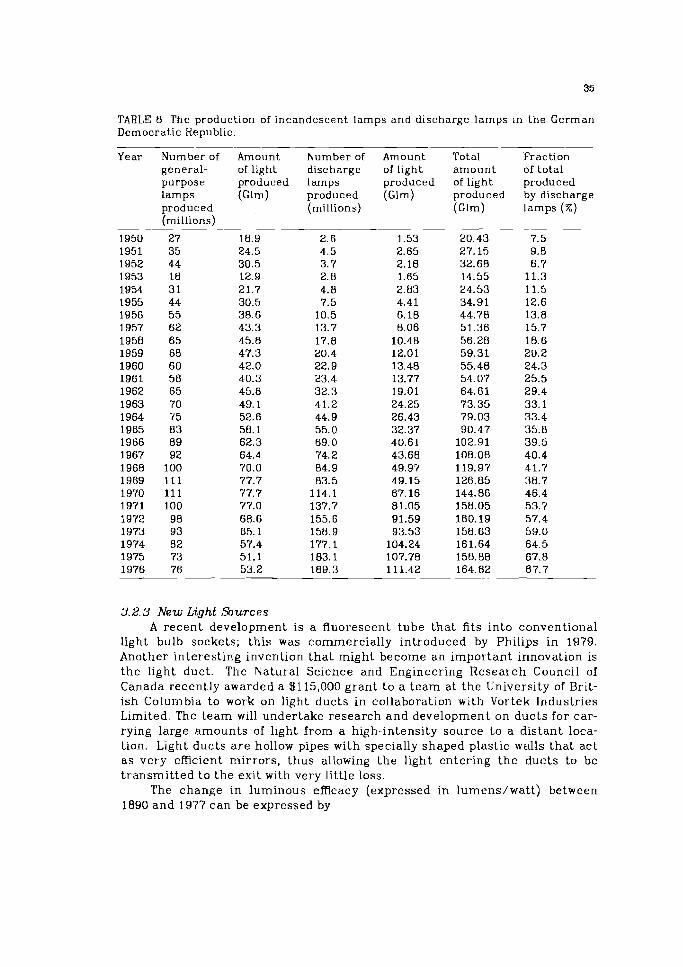
TABLE 8 The production of incandescent lamps and discharge lamps in the German Democratic Republic.
-- Year Number of Amount Number of Amount Total Fraction
general- oflight discharge oflight amount of to ta l purpose produced lamps produced of light produced lamps (Glm) produced (Glm) produced by discharge produced (millions) (Glm) lamps (%) (millions)
3.2.3 New Light S u r c e s A recent development is a fluorescent tube that fits into conventional
light bulb sockets; this was commercially introduced by Philips in 1979. Another interesting invention tha t might become an important innovation is the light duct. The Natural Science and Engineering Research Council of Canada recently awarded a $1 15,000 grant to a team a t the University of Brit- ish Columbia to work on light ducts in collaboration with Vortek lndustries Limited. The team will undertake research and development on ducts for car- rying large amounts of light from a high-intensity source to a distant loca- tion. Light ducts are hollow pipes with specially shaped plastic walls that act as very efficient mirrors, thus allowing the light entering the ducts to be transmitted to the exit with very little loss.
The change in luminous efficacy (expressed in lumens/watt) between 1890 and 1977 can be expressed by
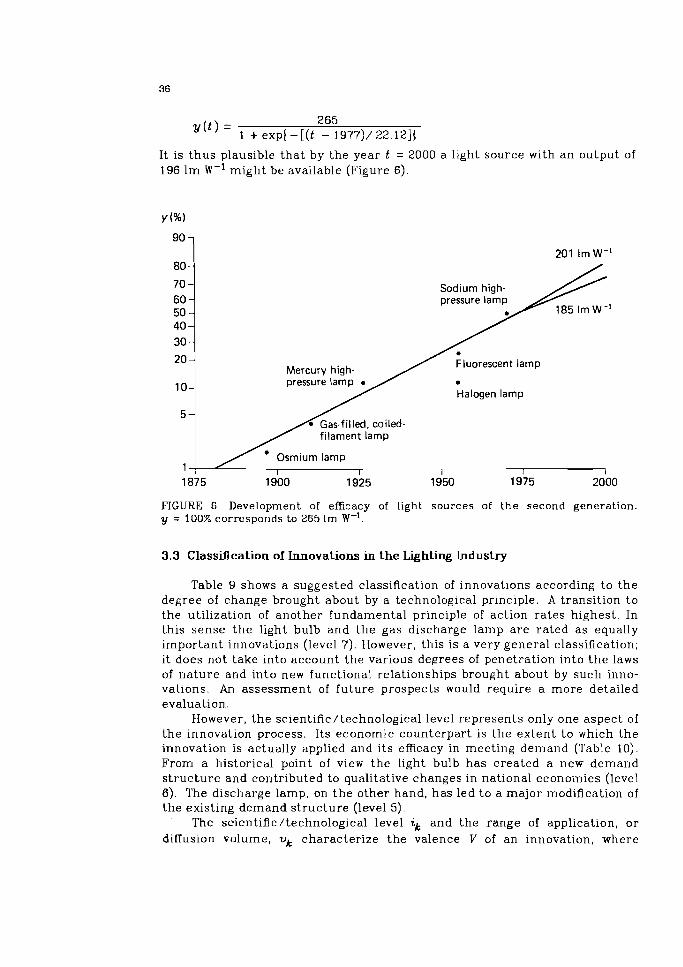
~ ( t ) = 265
1 + expl - [(t - 1977)/ 22.121j
It is thus plausible that by the year t = 2000 a light source with an output of 196 lm W-' might be available (Figure 6).
Sodium high- pressure lamp //
185 Im W- '
/ Mercury high- pressure lamp
Halogen lamp
filament lamp
FIGURE 6 Development of efficacy of light sources of t h e second generat ion. y = 100% corresponds to 265 lrn W - I .
3.3 Classification of Innovations in the Lighting Industry
Table 9 shows a suggested classification of innovations according to the degree of change brought about by a technological principle. A transition to the utilization of another fundamental principle of action rates highest. In this sense the light bulb and the gas discharge lamp are rated as equally important innovations (level 7). However. this is a very general classification; it does not take into account the various degrees of penetration into the laws of nature and into new functional relationships brought about by such inno- vations. An assessment of future prospects would require a more detailed evaluation.
However, the scientific/technological level represents only one aspect of the innovation process. Its economic counterpart is the extent to which the innovation is actually applied and its efficacy in meeting demand (Table 10). From a historical point of view the light bulb has created a new demand structure and contributed to qualitative changes in national economies (level 6). The discharge lamp, on the other hand, has led to a major modification of the existing demand structure (level 5).
The scientific/technological level ik and the range of application, or diffusion volume, vk characterize the valence V of an innovation, where
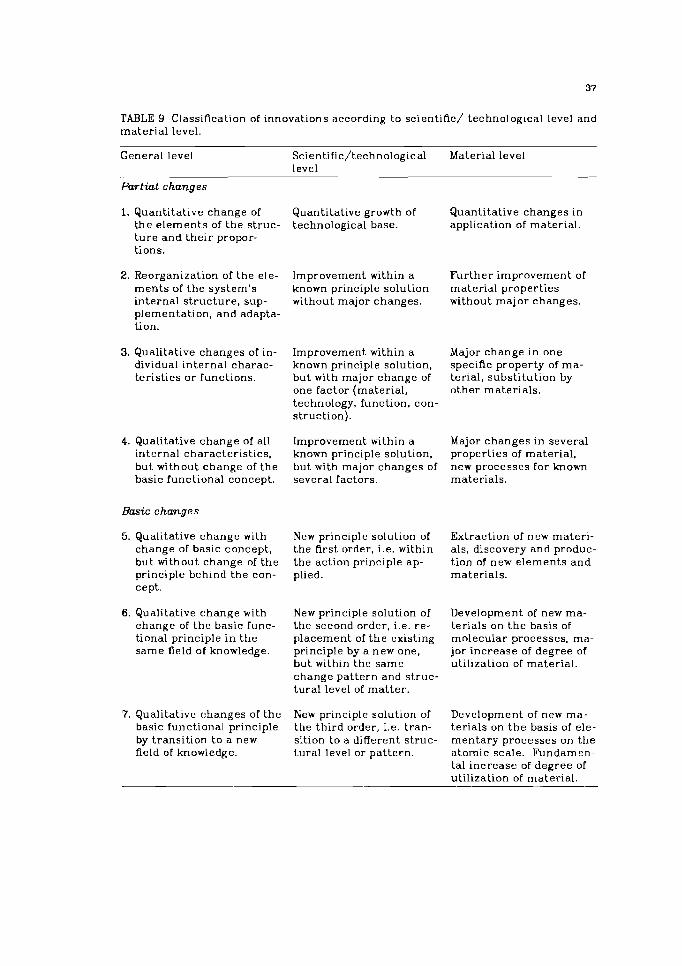
TABLE 9 Classification of innovations according to scientific/ technological level and mater ial level.
General level Scientific/technological Material level level
Partial changes
1. Quantitative change of Quantitative growth of Quantitative changes in t h e e lements of t h e s t ruc- technological base. application of material. t u r e and the i r propor- tions.
2. Reorganization of the ele- Improvement within a Fur ther improvement of m e n t s of the system's known principle solution mater ial propert ies internal s t ruc ture , sup- without major changes. without major changes. plementation, and adapta- tion.
3. Qualitative changes of in- Improvement within a Major change in one dividual internal charac- known principle solution, specific property of ma- teristics o r functions. bu t with major change of terial, subst i tut ion by
one factor (material, o ther mater ials . technology, function, con- s t ruct ion) .
4. Qualitative change of all Improvement within a Major changes in several internal character is t ics , known principle solution, properties of material. but without change of t h e but with major changes of new processes for b o w n basic functional concept. several factors. materials.
Basic changes
5. Qualitative change with New principle solution of Extraction of new mater i- change of basic concept, t.he first order, i.e. within als, discovery and produc- but without change of t h e the action principle ap- tion of new elements and principle behind t h e con- plied. mater ials . cept.
6. Qualitative change with New principle solution of Development of new ma- change of t h e basic func- the second order, i.e. re- terials on t h e basis of tional principle i n t h e placement of t h e existing molecular processes, ma- same field of knowledge. principle by a new one, jor increase of degree of
but within the same u t i l~za t ion ol material. change pat tern and s t ruc- tu ra l level of mat te r .
7. Qualitative changes of t h e New principle solution of Development of new ma- basic functional principle the third order, i.e. t ran- ter ials on t h e basis of ele- by t ransi t ion to a new sition to a different s t ruc- menta ry processes on t h e field of knowledge. t.ural level or pat tern. a tomic scale. Fundamen-
tal inc rease of degree of utilization of mater ial .
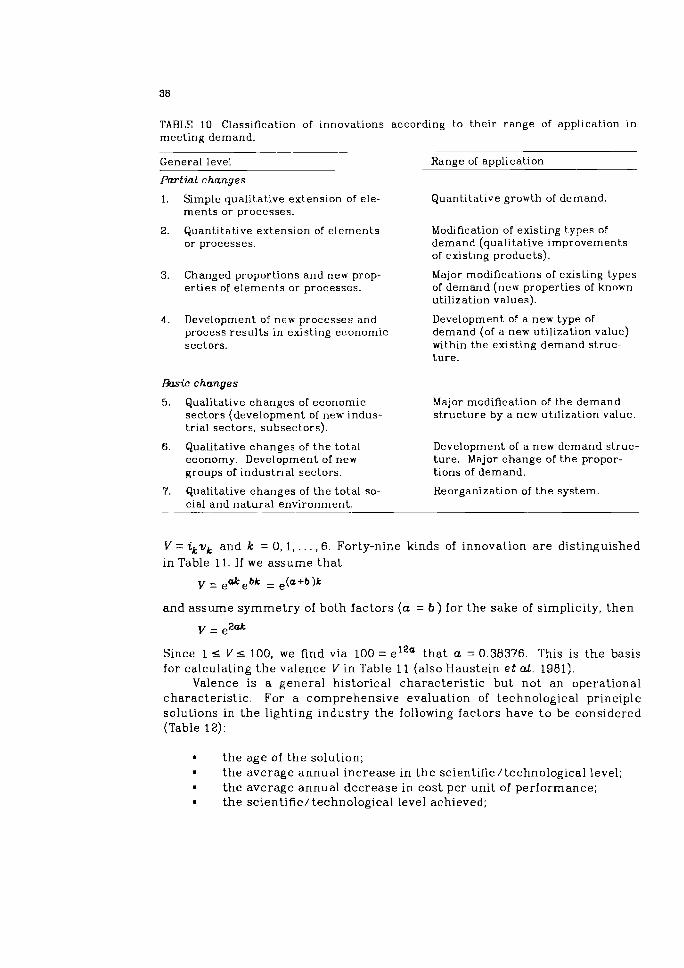
TABLE 10 Classification of innovations according to their range of application in meeting demand.
General level Range of application
Partial changes
1. Simple qualitative extension of ele- ments or processes.
2. Quantitative extension of e lements or processes.
3. Changed proportions a n d new prop- er t ies of e lements or processes.
4. Development of new processes and process resu l t s in existing economic sectors.
Basic changes
5. Qualitative changes of economic sectors (development of new indus- trial sectors, subsectors).
6. Qualitative changes of t h e total economy. Developn~ent of new groups of industrial sectors.
7. Qualitative changes of t h e total so- cial and na tura l environment.
Quantitative growth of demand.
Modification of existing types of demand (qualitative improvements of existing products).
Major modifications of existing types of demand (new properties of known utilization values).
Development of a new type of demand (of a new utilization value) within the existing demand struc- tu re .
Major mcdification of the demand s t ruc ture by a new utilization value.
Development of a new demand struc- tu re . Major change of t h e propor- tions of demand.
Reorganization of t h e system.
V = ikvk and k = 0, 1 , . . . , 6 . Forty-nine kinds of innovation a re distinguished in Table 11. If we assume tha t
y = e d e b k = e(a+b)k
and assume symmetry of both factors ( a = b ) for the sake of simplicity, then
V = e2ak
Since 1 s V s 100, we find via 100 = tha t a = 0.38376. This is the basis for calculating t he valence V in Table 11 (also Haustein e t al. 1981).
Valence is a general historical characteristic but not an operational characteristic. For a comprehensive evaluation of technological principle solutions in t he lighting industry the following factors have t o be considered (Table 12):
the age of the solution; the average annual increase in the scientific/technological level; the average annual decrease in cost per unit of performance; the scientific/technological level achieved;
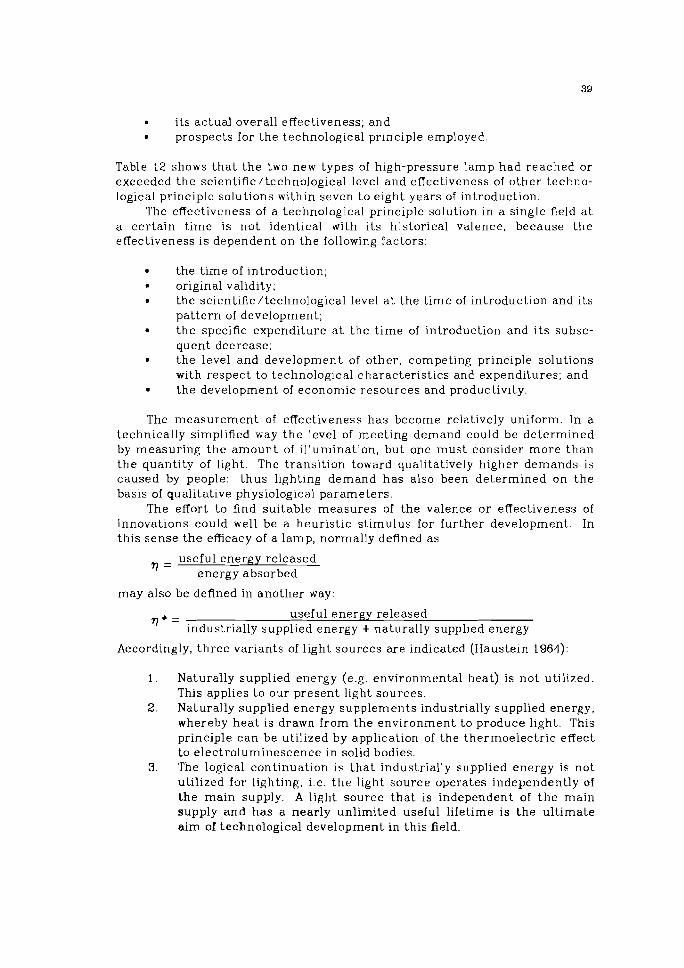
its actual overall effectiveness; and prospects for the technological principle employed.
Table 12 shows tha t the two new types of high-pressure lamp had reached or exceeded the scientific/technological level and effectiveness of other techno- logical principle solutions within seven to eight years of introduction.
The effectiveness of a technological principle solution in a single field a t a cer ta in t ime is not identical with i ts historical valence, because the effectiveness is dependent on the following factors:
the t ime of introduction; original validity; the scientific/technological level a t the t ime of introduction and its pat tern of development; the specific expenditure a t the t ime of introduction and i t s subse- quent decrease; the level and development of other, competing principle solutions with respect to technological characteristics and expenditures; and the development of economic resources and productivity.
The measurement of effectiveness has become relatively uniform. In a technically simplified way the level of meeting demand could be determined by measuring t h e amount of ~ l lumina t ion , but one mus t consider more than t h e quantity of light. The transit ion toward qualitatively higher demands is caused by people: thus lighting demand has also been determined on the basis of qualitative physiological parameters.
The effort to find suitable measures of the valence o r effectiveness of innovations could well be a heuristic stimulus for further development. In this sense the efficacy of a lamp, normally defined as
useful energy released ' = energy absorbed
may also be defined in another way:
v e x useful energy released industrially supplied energy + naturally supplied energy
Accordingly, th ree variants of light sources are indicated (Haustein 1964):
1. Naturally supplied energy (e.g. environmental heat) is not utilized. This applies to our present light sources.
2. Naturally supplied energy supplements industrially supplied energy, whereby heat is drawn from t h e environment to produce light. This principle can be utilized by application of the thermoelectric effect to electroluminescence in solid bodies.
3. The logical continuation is t h a t industrially supplied energy is not utilized for lighting, i.e. the light source operates independently of the main supply. A light source t h a t is independent of t h e main supply and has a nearly unlimited useful lifetime is the ultimate aim of technological development in this field.
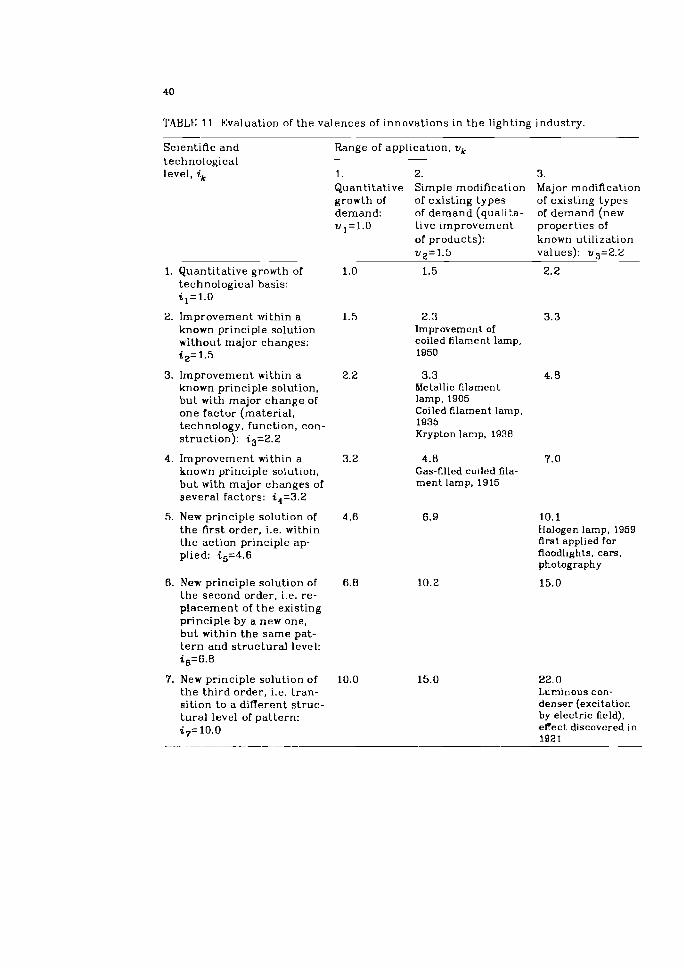
TABLE 11 Evaluation of the valences of innovations in t h e lighting industry.
Scientific and Range of application, uk technological level, ik 1. 2. 3.
Quantitative Simple modification Major modification growth of of existing types of existing types demand: of demand (qualita- of demand (new v l= l .O tive improvement properties of
of products): known utilization u2=1.5 values): v3=2 .2
-- --
1. Quantitative growth of 1.0 1.5 2 .2 technological basis: i , = l . O
2. Improvement within a 1.5 known principle solution without major changes: i 2=1 .5
3 . Improvement within a 2.2 known principle solution. bu t with major change of one factor (material, technology, function, con- struction): i3=Z.Z
4 . Improvement within a 3.2 known principle solution, but with major changes of several factors: i 4 = 3 . 2
5. New principle solution of 4.6 t h e first order, i.e. within t h e action principle ap- plied: i5=4.6
6. New principle solution of 6.8 t h e second order, i.e. re- placement of t h e existing principle by a new one. but within the same pat- t e r n and s t ruc tura l level: i,=B.8
7 . New principle solution of 10.0 t h e th i rd order, i.e. t ran- sition to a different s t ruc- tu ra l level of pat tern: i7= 10.0
2.3 3.3 Improvement of coiled filament lamp, 1950
3.3 4 .8 Metallic filament lamp. 1905 Coiled filament lamp, 1935 Krypton lamp. 1938
4.8 7 .0 Gas-filled coiled fila- ment lamp. 1915
10.1 Halogen lamp. 1959 first applied for floodlights, cars, photography
22.0 Luminous con- denser (excitation by electric field), effect discovered in 1921
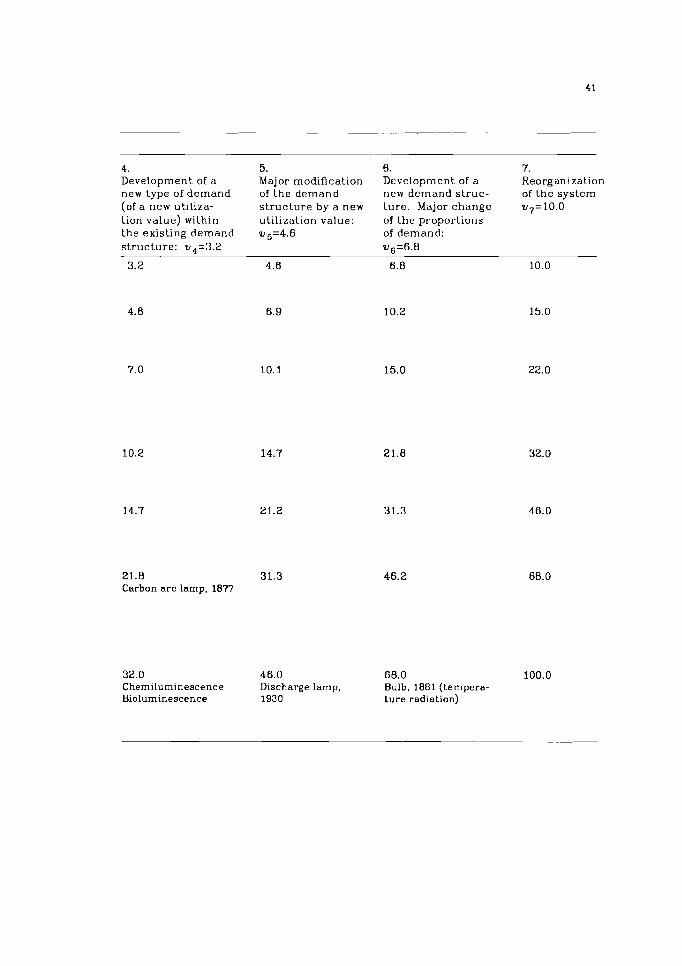
4. Development of a new type of demand (of a new utiliza- tion value) within the existing demand s t ruc ture : v 4 = 3 . 2
3.2
21.8 Carbon arc lamp, 1877
5. Major modification of the demand s t ruc ture by a new utilization value: v5=4 .6
6 . 7 . Development of a Reorganization new demand s t ruc- of the system ture. Major change v7=10.0 of the proportions of demand: v6=6.8
6.8 10.0
32.0 46.0 68.0 Chemilurninescence Discharge lamp, Bulb, 1881 (ternpera- Bioluminescence 1930 ture radiation)
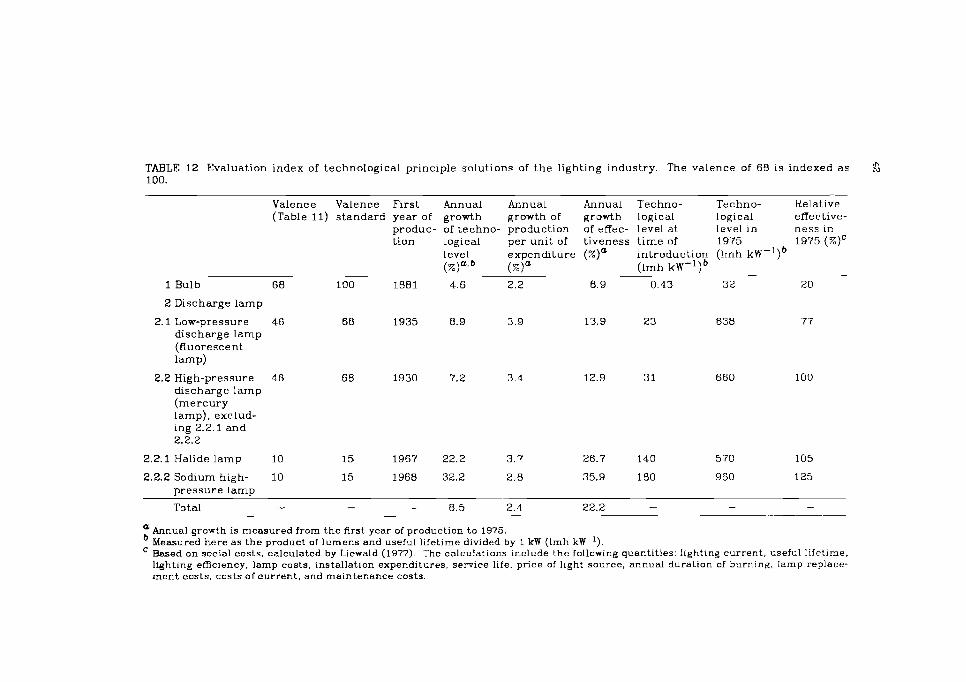
TABLE 12 Evaluation index of technological principle solutions of t h e lighting industry. The valence of 68 is indexed a s & 100.
Valence Valence First Annual Annual Annual Techno- Techno- Relative (Table 11) s tandard year of growth growth of growth logical logical effective-
produc- of techno- production of effec- level a t level in ness in tion logical per uni t of t iveness t i m e of 1975 1975 (%)'
level expenditure (%)a introduct ion (lrnh k ~ - ' ) ~ (@a.b (w)" (lrnh k ~ - ' ) ~
1 Bulb 6 8 100 1881 4.6 2.2 6.9 0.43 3 2 20
2 Discharge lamp
2.1 Low-pressure 46 68 1935 8.9 3.9 13.9 23 638 77 discharge l a m p (fluorescent
lamp)
2.2 High-pressure 46 discharge l a m p ( m e r c u r y lamp). exclud- ing 2.2.1 a n d 2.2.2
2.2.1 Halide lamp 10 15 1967 22.2 3.7 26.7 140 570 105
2.2.2 Sodium high- 10 15 1968 32.2 2.8 35.9 180 960 125 pressure l amp
Total - - - 8.5 2.4 22.2 - - -
a Annual growth is measured from the first year of production to 1975. Measured here as the product of lumens and useful lifetime divided by 1 kW (Imh kw-I). Based on social costs, calculated by Liewald (1977). The calculations include the following quantities: lighting current, useful lifetime. lighting efficiency, lamp costs, installation expenditures, service life, price of light source, annual duration of burning, lamp replace- ment costs, costs of current, and maintenance costs.
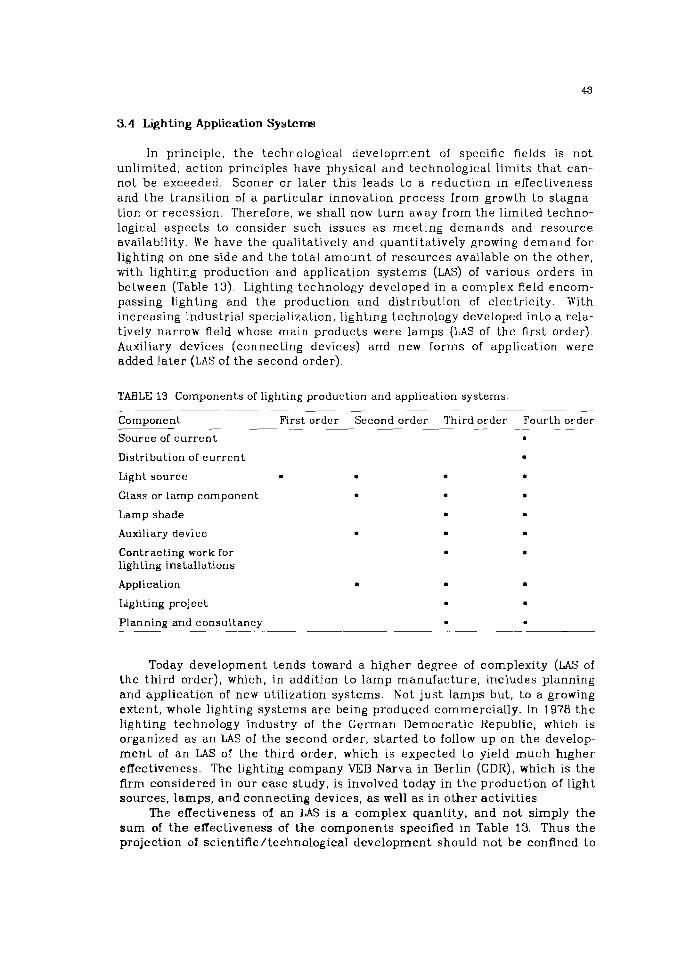
3.4 Lighting Application Systems
In principle, the technological developnlent of specific fields is not unlimited; action principles have physical and technological limits that can- not be exceeded. Sooner or later this leads to a reduction in effectiveness and t h e transition of a particular innovation process from growth to stagna- tion or recession. Therefore, we shall now t u r n away from the limited techno- logical aspects to consider such issues as meeting demands and resource availability. We have the qualitatively and quantitatively growing demand for lighting on one side and the total amount of resources available on the other , with lighting production and application systems (LAS) of various orders in between (Table 13). Lighting technology developed in a complex field encom- passing lighting and the production and distribution of electricity. With increasing industrial specialization, lighting technology developed into a rela- tively narrow field whose main products were lamps (LAS of the first order). Auxiliary devices (connecting devices) and new forms of application were added la te r (LAS of the second order).
TABLE 13 Components of lighting production a n d application systems.
Component First order Second order Third order Fourth order
Source of c u r r e n t . Distribution of c u r r e n t . Light source . . . . Glass or l amp component . . Lamp shade . Auxiliary device . . Contracting work for lighting installations
Application . . . Lighting project . . Planning and consultancv • .
Today development tends toward a higher degree of complexity (LAS of the third order), which, in addition t o lamp manufacture , includes planning and application of new utilization systems. Not just lamps but , to a growing extent, whole lighting systerns are being produced commercially. In 1978 t h e lighting technology industry of the German Democratic Republic, which is organized as an LAS of the second order, s t a r ted t o follow up on the develop- m e n t of an LAS of the third order, which is expected to yield much higher effectiveness. The lighting company VEB Narva in Berlin (GDR), which is the firm considered in our case study, is involved today in the production of light sources, lamps, and connecting devices, a s well a s in other activities.
The effectiveness of an LAS is a complex quantity, and not simply t h e sum of t h e effectiveness of the components specified in Table 13. Thus t h e projection of scientific/technological development should not be confined to
individual components; i t has to reveal the strategic deficiencies tha t limit the growth of effectiveness within the overall production and application sys- tem. An LAS of the fourth order might be produced in the future, which would return the lighting industry to its starting point, but a t a higher scientific/technological level; for example, a lighting system tha t is indepen- dent of the main electricity supply.
A vertical and horizcllltal combination of production in the production and application systems is the best means of stimulating the dynamic pro- gress of industrial sectors in the interest of the national economy. In this sense the concept of the complex innovation process is clearly defined: it is an innovation process tha t is no t confined to individual components of the production and application process, but tha t comprises several or all these components.
4 A DECISION SUPPORT SYSTEM FOR THE LIGHTING INDUSTRY
We shall now discuss a decision support system tha t will help manage- ment decide which innovation projects should be adopted and how much t o spend on them. The lighting company VEB Narva, which employs 15,000 peo- ple, has three objectives for tec:hnological progress:
1. Maximization of ne t production 2. Maximization of exports 3. Maximization of lighting output per unit of energy input
Clearly, these objectives may conflict with one another to some degree, depending on the level of attainment. This complicates the problem consider- ably. In designing a decision support system we see no sense in including objectives tha t are of little importance, because people tend to select alterna- tives t h a t excel in the more important features (Slovic e t al. 1977a, b) and because formal complication of the analysis often impairs the decision maker 's understanding of the decision situation.
The technological field represented by the lighting company is relatively small and easy to survey. It encompasses about ten basic products stemming from relatively old technological changes. Most of i ts R&D projects are on improvement-related innovations. The percentage of basic research projects is small enough to be considered negligible. Many of the R&D projects are characterized by relatively well defined technical and commercial parame- ters.
The decision problem under consideration can be formulated in the fol- lowing way.
a. Of the set of proposed projects, which should be chosen in order t o mee t best the goals of the firm and of society as a whole?
b. How many resources should be allocated to which projects? Options include rejection, postponement, termination, or acceleration of ongoing or new projects.
A decision is subject t o several constraints. First, the company cannot exceed the amount of resources (including manpower) tha t i t has available or expects to have available. Second, some projects are mandatory and mus t be adopted although they are not expected to be of economic benefit; for exam- ple, they may be necessary for maintaining a market position or for overcom- ing bottlenecks in the production process. Third, ongoing projects should be coordinated according to the stages of the innovation process so a s to avoid excessive demand for certain types of resources a t any one time and to main- tain continuity in the firm. Fourth, one has to adopt a portfolio of projects tha t combines innovations tha t have long-term effects with those t ha t have short-term effects.
In the firm under consideration, corporate strategy is greatly influenced by decisions a t the level of the Council of Ministers of the GDR, who deter- mine goals in energy saving. The s t ructure of the decision-making process for innovations is s e t by law in the GDR. This law defines t h e main decision points, the documents and expertise required, and the members of the com- mit tee of experts who a re to make the decision.
4.1 The Basic Approach
It is still too early to speculate about the final form of the decision sup- port system (DSS): this is a long-term goal. In expanding the basic approach, we will rely upon the findings of psychologists, management scientists, and specialists in DSS, and upon experience gained from the implementation of models of R&D project selection. We expect the development of our system t o take a few years. Working closely with the decision makers of the firm (who should welcome efforts to make decision making more objective), we will have to decide at each stage whether i t is worth while to continue t he basic approach. Caution in development is recommended because few successful applications of models of R&D project selection are known, and no t many of the recently suggested approaches have been tested in a wide range of practi- cal situations (multiobjective decision making under uncertainty, fuzzy analysis, etc.) .
Our procedure was selected because of i ts flexibility and because of the grea t number of successful applications to real problems, including t he management of R&D, tha t have been reported. However, fur ther progress in our research will very much depend on the success of our efforts t o stimulate support from decision makers and from specialists in a number of disciplines, such as multiobjective decision making, decision analysis, and computer techniques.
A basic principle in the development of a 1)SS is the modular principle: all of the techniques applied have to be compatible so t ha t the analyst (or decision maker) can combine them a t will. This principle guarantees tha t the model can be adapted to new requirements or to new findings in the rapidly changing fleld of DSS. We are still searching for the best approach to our problem and this is why we are testing a number of approaches (Section 2.3). In practical applications, hybrid models have often proved successful (Hogarth 1974, Bunn 1978, Chapman 1979).
With our present under-standing of the decision situation we think t h a t modules with the following functions a re necessary lor the decision support system:
to process data on innovations t h a t have already been phased out o r tha t have reached an advanced stage; to represent how the manager envisions the development of cer ta in ongoing or new innovations; to forecast important quantities needed for planning innovations (technological and scientific t rends, supplies of major resources, development of t h e firm's capabilities, e tc . ) ; to create scenarios; to t es t long-term effects of strategic decisions on R&D programs (e.g. risk); to process the judgments of experts; to represent the management view of the long-term objectives of the firm; and to secure an efficient man-machine dialogue.
While all of the modules are closely interrelated, they m u s t operate indepen- dently so t h a t changes in the organization of the Arm will no t have cata- strophic consequences for the system as a whole.
Our present research is focused mainly on module 2, around which the other modules will be developed s tep by s tep. Experience suggests t h a t t h e process of developing a DSS mus t be iterative, adaptive, and flexible (Keen 1980). In presenting our first ideas about the DSS, we stimulate the decision maker to specify more precisely his expectations of the support he is to be given .
4 - 2 Interactive Mode of Operation
Before we discuss the basic model and several versions of i t , we m u s t say why an interactive mode of operation is necessary for our case study. When faced with t h e evaluation and selection of innovation projects under t h e cir- cumstances of multiple objectives, uncertainty, and the prospect of long- lasting effects on the company as a whole, the decision maker is often unable to articulate his preferences well enough for u s to construct a utility func- tion. In most cases, t h e first presentation of the problem will be very vague and will have to be corrected via feedback loops. This is the main reason for involving the decision maker in the problem formulation and solution and in t h e evaluation of t h e results. The decision maker may wish t o change some of the data on which the decision t ree is based, such as the resource require- ments for a certain project path in a particular period, t h e expected benefits of realizing a particular project, or t h e probability of certain chance nodes. This might require a reassessment of t h e impact of t h e changes on t h e final outcome. He may even wish t o change whole branches of t h e decision t ree .
The generation of a feasible se t of alternatives is in some cases more important than the solution itself because it predetermines t h e final choice.
Our approach is intended to be process-oriented and should allow for any changes the decision maker wishes to undertake. Many models for project selection have been rejected because the decision maker felt that his prefer- ences were reflected inadequately. An interactive procedure greatly increases the decision maker's confidence in the method. Zeleny (1980) stated that the "human decision-making paradigm must be amplified rather than ignored, respected rather than degraded." Interactive decision making is the best way to meet this demand.
The main idea behind interactive decision making is jointly to solicit the decision maker's preferences and investigate the feasible alternatives for the eventual determination of an optimal solution. The most important facet of an interactive procedure is the ability of the decision maker to answer the questions asked by the algorithm. One cannot expect him to answer ques- tions that are difficult even with a computer.
Larichev and Polyakov's (1980) classification of interactive procedures is based on the distribution of the work between the decision maker and the machine. They distinguish between unstructured, pseudostructured, and structured procedures, which differ in the degree of involvement of the deci- sion maker in finding a solution. In this report we consider only structured procedures because of their relative simplicity. Structured procedures reflect the results of psychological investigations, that human capabilities for com- paring multiattributed alternatives are very limited. Hence interactive pro- cedures should ask simple questions.
4.3 The Basic Model and Difierent Versions
The basic model can be formulated in several ways, depending on the size of the problem. This is determined by:
the number of projects under consideration; the complexity of the decision trees (numbers of decision and chance nodes and corresponding branches); the number of periods; the number of types of resources formally included.
If the problem is not too large, the evaluation and selection problem takes the form of a stochastic linear programming problem in which uncertainties about the future are incorporated into the objective function.
The decision variable is zij, j t , which is the j t h path of a project i in period t , and i t is assumed that the future state, j, of the world occurs, which is determined by the outcomes of chance nodes up to period t (further details are given by Gear and Lockett 1873). The constraints of this model version ensure tha t not more than one project path will be selected for each project, tha t resource availabilities are not exceeded in any of the periods, and that whole paths are either adopted or rejected. Since the values of the end points can be expressed in monetary terms, the objective can be formu- lated as t he maximization of t he overall expected sum of the final values of the projects. Similar expressions can be found for the other two objectives
mentioned at the beginning of Section 4. Other constraints arising from pecu- liarities of the firm can be included easily.
The first version of our model takes into account the order in which deci- sions are due and uncertainties arising in each project over time. Projec- tions of all possible future states of the world are obtained with one computer run. By defining the nodes of the decision tree in an appropriate manner, one can take into account uncertainties about resource requirements, project durations, and project outcomes. The results of the calculations indicate how to allocate the available resources to certain selected projects in period 1 in order to be on the optimum path. If the number of decision variables is large, difficulties may arise in the analysis of the solutions.
From our viewpoint, this first formulation of the problem is well suited for interactive multiobjective decision making and can be combined easily with the step method or the reference point approach (Wierzbicki 1979a, b, 1980, Kallio e t al. 1980), because all uncertainties involved in the decision trees are represented in the objective function. In solving the problem interactively, the decision maker can manipulate factors only in the objective space.
We hope tha t because of the relatively small number of projects in our case study we need not exceed the limits of solution with the existing stan- dard packages. Moreover, i t is possible to reduce the size of a problem tha t has become too large by reducing the number of chance nodes in the decision trees. The necessary theory for the single-objective case is provided by Lock- et t e t d. (1980). Finally, one should be satisfied with a good feasible solution having upper and lower bounds on the expected value of the optimal solution instead of strong optimization, which has no real sense (Lockett e t al. 1980).
As the size of the linear programming problem increases with the size of the decision tree, i t becomes more and more difficult to solve the problem with existing standard solution packages, even when a branch-and-bound method is applied. For this reason, an alternative approach has been developed. It combines linear programming, simulation, and heuristic interpretation of the results. Each path of a given innovation project is represented by one decision variable. The constraints of the model ensure tha t resource availabi1itj.e~ are not exceeded for any period or for any resource.
In the second problem formulation the chance nodes of t he decision trees are sampled repeatedly. In this way the problem is reduced to one of deterministic linear programming. This simulation results in some addi- tional constraints, their number corresponding to the number of project paths in which chance nodes are incorporated. The constraints differ only in the right-hand sides of the linear inequalities. This approach was first reported by Lockett and Freeman (1970). The application of Monte Carlo tech- niques has also been proposed by Allen and Johnson (1971). We developed a computer program tha t generates the corresponding linear programming problem with a fixed matrix of coefficients and a number of right-hand sides for a se t of given decision trees. The solutions can be analyzed using statisti- cal means and variances (details are given by, e.g., Lockett and Gear 1973).
This type of presentation of ttie results of the model runs is very con- venient for the decision maker. The proposed method can handle a large
number of innovation projects with complicated s t ructures and highly disag- gregated resources and periods. A weakness of the method is the problem of final choice. Also, i t is not suited for an interactive mode of operation. Nevertheless, i t can be used as a convenient starting point for an analysis using the approach discussed above combined with man-machine dialogue. We think tha t a combination of both approaches is the best way to arrive a t the most realistic picture of the whole decision process in innovation proj- ects.
The basic model discussed here is l inear. Many detailed studies have indicated tha t linear models provide good simulations of real R&D situations (Bell and Read 1970, Allen and Johnson 1971), are easy to handle, and are easy for decision makers to understand. They can be easily expanded for multiob- jective decision-making problems. (The theory and a number of computer programs for multiobjective linear problems are widely discussed in the li terature, e.g. by Evans and Steuer (1973) and Zeleny (1974).) In contrast, nonlinear problem formulations do not add to our understanding of reality and often cannot be solved by standard computerized solution techniques.
4.4 Quantifying Risk and Multiple Objectives
In our approach we use the following notation for quantifying risk:
X is t he se t of alternative projects, xq is the portfolio of projects, where q = 1 , 2 , 3 , . . . , Q , f k is the objective function, defined on X, where k = 1, 2 , 3 , . . . , K,
f k ( x q ) is the benefit with regard to k t ha t is achieved when zq is realized,
f is the aspiration level with regard t o the objective function,
rq is the risk coefficient when portfolio xq is realized,
rqk is the risk coefficient with regard to the objective function when portfolio z q is realized,
s is the future s ta te of t he world, where s = 1 ,2 ,3 , . . . , S,
ps is the probability of the future s ta te s ,
f i ( x q ) is the benefit with regard to k t ha t is achieved when portfolio xq is realized, given t h a t s ta te s has occurred.
The risk coefficient rqk is then defined by the following equation (Bacskai e t al. 1976, Zellmer 1980):
In comparing the two versions of the model proposed in Section 4.3, we said t ha t the stochastic programming formulation of the first version is bet ter suited for multiobjective decision making than t he combination of linear programming and simulation. This is also t rue for the quantification of risk using the equation suggested above. Before describing how the first
version of the model can be used for evaluating risk in a project portfolio, we shall try to show that in the form introduced the risk coefficient can be used only apos te r ior i , i.e. after we have calculated the optimal solution or several solutions tha t are considered good enough.
Risk evaluation using decision trees was also suggested by Klausmann (1976). Mader (1976), and Bacskai e t al. (1976), but they considered only sin- gle projects. By this method risk coefficients can be calculated for all decision alternatives and can be used for decision making (including MODM). However, this approach cannot be applied to our case, where a decision alternative is not identical to a project.
Before calculating risk coefficients we have to determine alternative project portfolios by running the model. In order to use risk coefficients as one of the objectives we would have to follow another approach:
1. Check the admissibility of all possible portfolios. 2. Calculate the risk coefficient for each admissible portfolio.* 3. Select the best portfolio by applying an appropriate decision rule
based on the risk coefficients.
Obviously one would have to use an unreasonable amount of computer time for this approach, even if the number of possible portfolios were not very high. The only solution is to calculate the risk coefficients after alterna- tive portfolios have been found. The risk coefficient relates the expected "nonachievement" to the aspiration level and the expected "overachieve- ment." Generally, the lower this coefficient the better the alternative.
Having calculated risk coefficients with regard to K different functions, we have to aggregate them. Zellmer (1980, p. 101) proposed a weighted sum of coefficients for this purpose, using weighting factors that reflect the relative importance of each objective to the decision maker. We hesitate t o transfer the aggregation of multiple objectives to the risk coefficients, because the equalization of weighting factors for both the objectives and the risk coefficients has not yet been proven.
An adequate scale is still lacking for the risk coefficients. This problem was recognized by Bacskai e t al. (1976), who proposed the construction of a risk scale based on an analysis of past experience. Given a risk scale one could define aspiration levels. Other proposals to express risk coefficients in the units of the objectives replace one problem with another (Bacskai e t al. 1976. pp.72. 80). For want of anything better. we try to give additional sup- port to the decision maker by calculating the risk coefficients using the equa- tion for the optimal portfolio.
Temporary renunciation of aggregation of the risk coefficients does not rule out future exploitation of the suggestions cited. Obviously risk coefficients cannot be used if the enumeration of all future states of the world is practically impossible. In this case we have to adopt the more traditional approaches for quantifying risk (e.g. Salazar and Sen 1968).
*To obtain the risk coetRcients for nonoptimal admissible portfolios one has to find optimal fu- ture decision variables by running the first model version with mandatory projects.
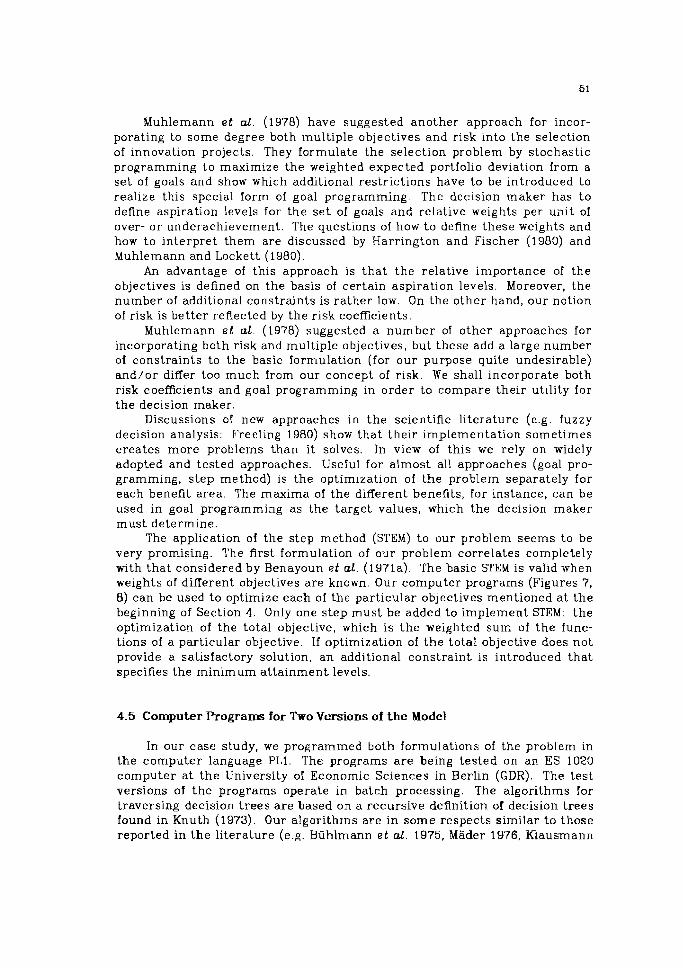
Muhlemann e t d . (1978) have suggested another approach for incor- porating to some degree both multiple objectives and risk into the selection of innovation projects. They formulate the selection problem by stochastic programming to maximize the weighted expected portfolio deviation from a se t of goals and show which additional restrictions have to be introduced to realize this special form of goal programming. The decision maker has to define aspiration levels for the s e t of goals and relative weights per uilit of over- or underachievement. The questions of how to define these weights and how to interpret them are discussed by Harrington and Fischer (1980) and Muhlemann and Lockett (1980).
An advantage of this approach is t ha t the relative importance of the objectives is defined on the basis of certain aspiration levels. Moreover, the number of additional constraints is ra ther low. On the other hand, our notion of risk is better reflected by the risk coefficients.
Muhlemann e t al. (1978) suggested a number of other approaches for incorporating both risk and multiple objectives, but these add a large number of constraints to the basic formulation (for our purpose quite undesirable) and /or differ too much from our concept of risk. We shall incorporate both risk coefficients and goal programming in order to compare their utility for the decision maker.
Discussions of new approaches in t he scientific l i terature (e.g. fuzzy decision analysis: Freeling 1980) show tha t their implementation sometimes creates more problems than it solves. In view of this we rely on widely adopted and tested approaches. Useful for almost all approaches (goal pro- gramming, s tep method) is the optimization of t he problem separately for each benefit area. The maxima of the different benefits, for instance, can be used in goal programming as the target values, which the decision maker mus t determine.
The application of the step method (STEM) to our problem seems to be very promising. The first formulation of our problem correlates completely with t ha t considered by Benayoun e t al. (1971a). 'The basic STEM is valid when weights of different objectives are known. Our computer programs (Figures 7, 8) can be used to optimize each of the particular objectives mentioned a t t he beginning of Section 4. Only one s tep must be added to implement STEM: t he optimization of the total objective, which is t he weighted sum of t he func- tions of a particular objective. If optimization of t he total objective does not provide a satisfactory solution, an additional constraint is introduced tha t specifies the minimum at ta inment levels.
4.5 Computer Programs for Two Versions of the Model
In our case study, we programmed both formulations of the problem in the computer language PL1. The programs a re being tested on an ES 1020 computer a t t he University of Economic Sciences in Berlin (GDR). The tes t versions of t he programs operate in batch processing. The algorithms for traversing decision t rees a r e based on a recursive definition of decision trees found in Knuth (1973). Our algorithrns are in some respects similar to those reported in t h e li terature (e.g. Biihlmann e t d . 1975, Mader 1976, Klausmann
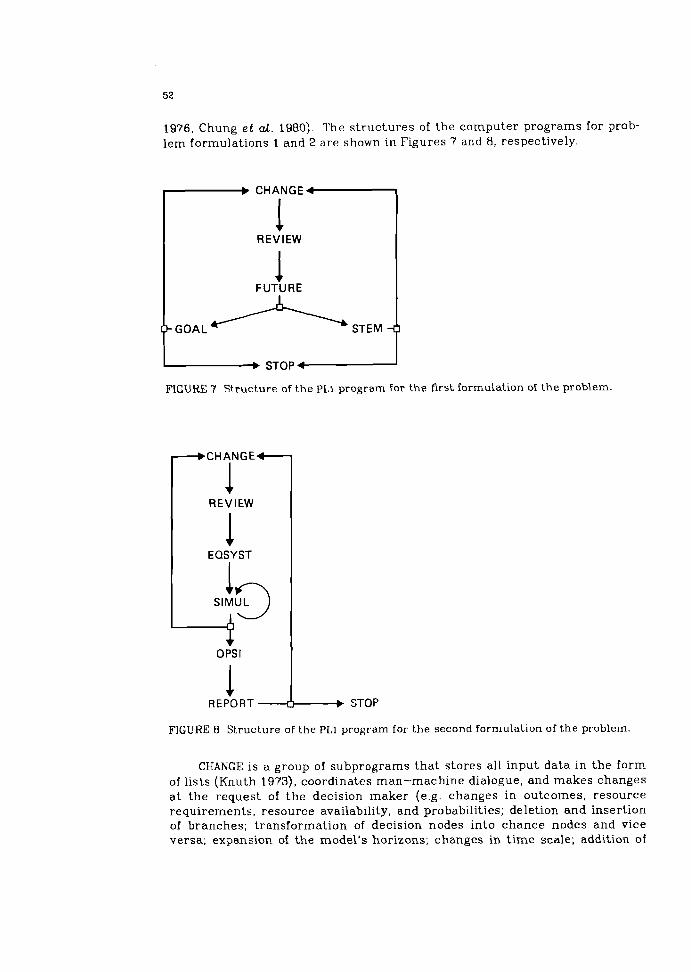
1976, Chung e t d. 1980). The structures of the computer programs for prob- lem formulations 1 and 2 are shown in Figures 7 and 8, respectively.
b C H A N G E 4
I REVIEW
1 FUTURE
GOAL A STEM
STOP 4
FIGURE 7 Structure of the PLI program for the first formulation of the problem.
FIGURE 8 Structure of the PLI program for the second formulation of the problem.
CHANGE is a group of subprograms that stores all input data in the form of lists (Knuth 1973), coordinates man-machine dialogue, and makes changes a t the request of the decision maker (e.g. changes in outcomes, resource requirements, resource availability, and probabilities; deletion and insertion of branches; transformation of decision nodes into chance nodes and vice versa; expansion of the model's horizons; changes in t ime scale; addition of
new projects; changes in kinds of resources or benefits). These functions allow high flexibility in the decision trees during implementation of the decision.
CHANGE is applied to both problem formulations, a s is the subprogram REVIEW, which allows the decision maker to check the input data and survey the whole portfolio of projects.
FUTURE is a group of subprograms t ha t generates a l l res t r ic t ions for for- mulation 1. These subprograms are much more complicated than the corresponding subprograms of formulation 2 because we have to generate the restrictions for all possible future s ta tes of the world in formulation 1, whereas in formulation 2 this is necessary for only one of them.
EQSYST is a subprogram tha t generates the matrix of coefficients for the linear programming problem corresponding to the elicited decision tree. For each matrix of coefficients, SIMUL generates a se t of right-hand sides of the linear programming problem, which is solved with the standard routine OPSI. What follows is a statistical analysis of the simulation runs using REPORT. Having analyzed the solutions, the decision maker can r e tu rn to CHANGE and adjust the input data.
In the present program package the decision maker can choose between two methods of MODM: subprogram GOAL adds the necessary constraints for goal programming and the group of subprograms STEM was developed for the s tep method.
4.6 Results
We shall now demonstrate the operation of the computer programs with a small example of seven project proposals, using five periods, three kinds of resource, and th ree kinds of benefit (Figure 9 and Table 14). The results of model version 2 show tha t the following project versions can be excluded from fur ther analysis: P2V1, P3V1, P4V2, P5V1, P7V1-P7V4, P7V8, P7V10, and
P7Vll. Project 3 was restructured (aggregation of versions 1 and 2). This simplification reduces the number of possible future s ta tes of the world con- siderably. Model 1 was applied to the simplified portfolio of innovation proj- ects. Results for the three objective functions and their interpretation are given in Tables 15-17.
For objective function 1, there is a high degree of correlation between t he results of the two models. Only the fourth project shows differing results. Both models produce the same evaluations of projects 2, 4, 5, and 7 (7: re- s t ructure or reject) using objective function 2, but differ for project 3. The results for projects 1 and 6 are complementary. With objective function 3, the models gave the same results for projects 3, 5, and 6, but for the other proj- ects the results mus t be compared to gain a deeper insight into the choice situation.
From the results in Tables 15-17 we can conclude that :
1. Projects 1 and 2 have been partially selected and should be restruc- tured before a final decision is made on their adoption or rejection.
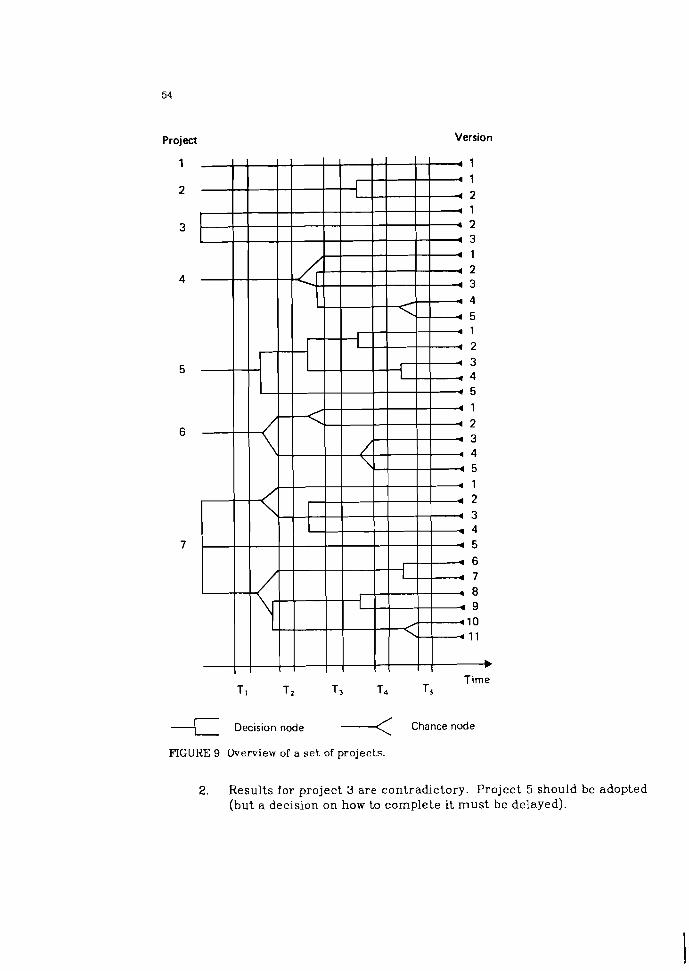
Project Version
1
2
3
4
5
6
7
I I I 1 I I Time
TI T2 T3 T4 T5
< Decision node -< Chance node
FIGURE 9 Overview of a s e t of projects.
2. Results for project 3 are contradictory. Project 5 should be adopted (but a decision on how to complete i t mus t be delayed).
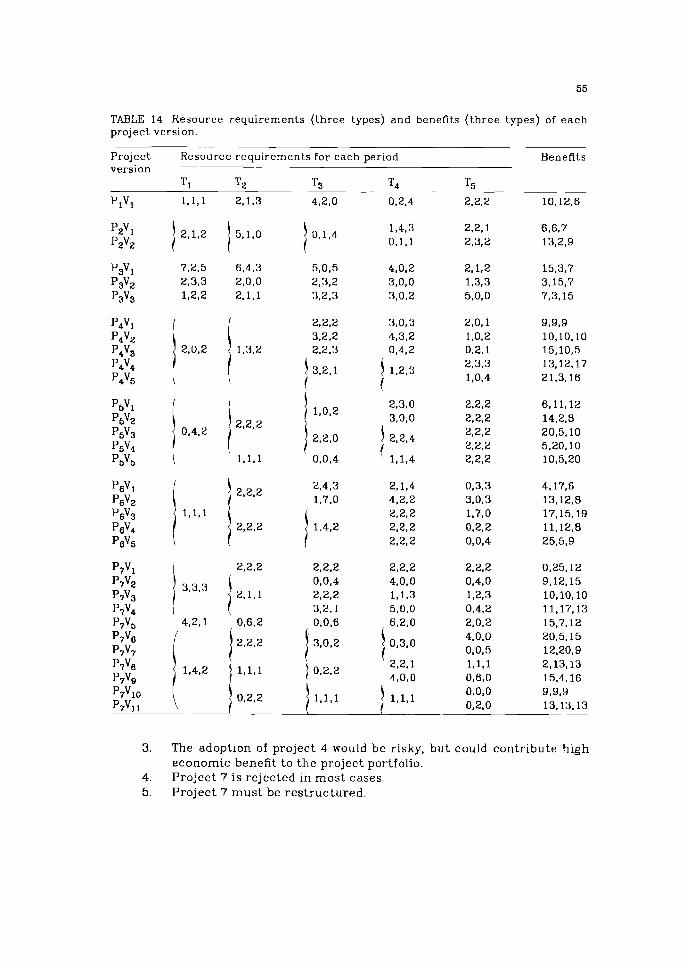
TABLE 14 Resource requirements ( th ree types) and benefits ( t h r e e types) of e a c h project version.
Project Resource requirements lor each period Benefits version -
T 1 T2 T3 T4 T5
P ~ v ~ 1,1,1 2,1.3 4,2,0 0,2,4 2,2,2 10.12,6
3. The adoption of project 4 would be risky. but could contribute high economic benefit to the project portfolio.
4. Project 7 is rejected in most cases. 5. Project 7 mus t be restructured.
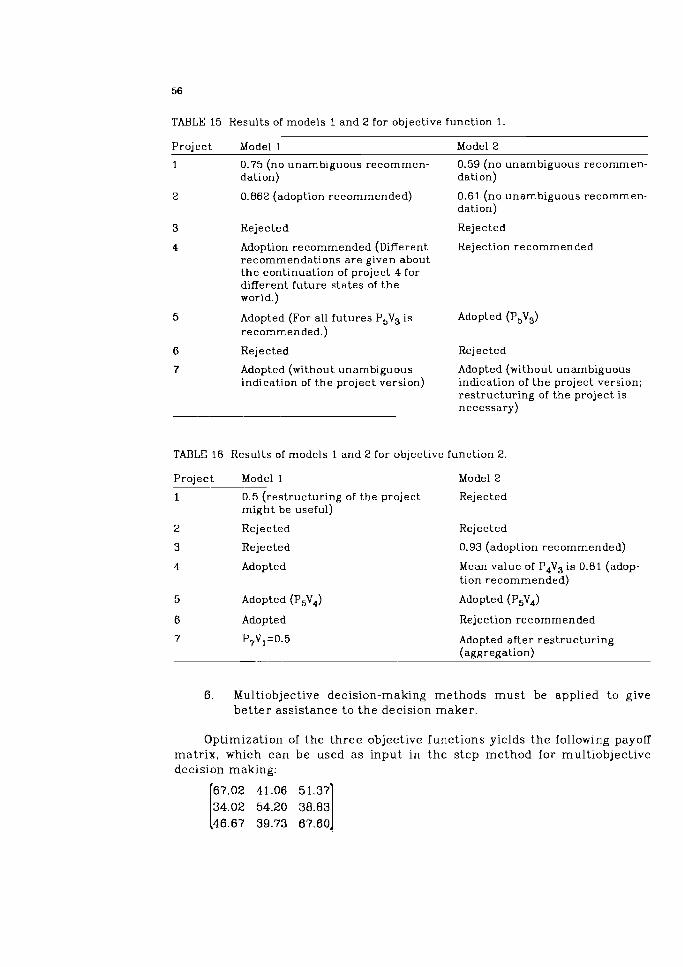
TABLE 15 Results of models 1 and 2 for objective function 1.
Project Model 1 Model 2
0.75 (no unambiguous recommen- dation)
0.862 (adoption recommended)
Rejected
Adoption recommended (Different recommendations are given about the continuation of project 4 for different future states of the world.)
Adopted (For all futures P5V3 is recommended.)
Rejected
Adopted (without unambiguous indication of the project version)
0.59 (no unambiguous recommen- dation)
0.61 (no unambiguous recornmen- dation)
Rejected
Rejection recommended
Adopted (P5V3)
Rejected
Adopted (without unambiguous indication of the project version; restructuring of the project is necessary)
TABLE 16 Results of models 1 and 2 for objective function 2.
Project Model 1 Model 2
1 0.5 (restructuring of the project might be useful)
2 Rejected
3 Rejected
4 Adopted
5 Adopted (P5V4)
6 Adopted
7 P,V,=0.5
Rejected
Rejected
0.93 (adoption recommended)
Mean value of P4V3 is 0.81 (adop- tion recommended)
Adopted (P5V4)
Rejection recommended
Adopted after restructuring (aggregation)
6. Multiobjective decision-making methods must be applied to give better assistance to the decision maker.
Optimization of the three objective functions yields the following payoff matrix, which can be used as input in the step method for multiobjective decision making:
I 67.02 41..06 51.37 34.02 54.20 38.83 46.67 39.73 67.60 1
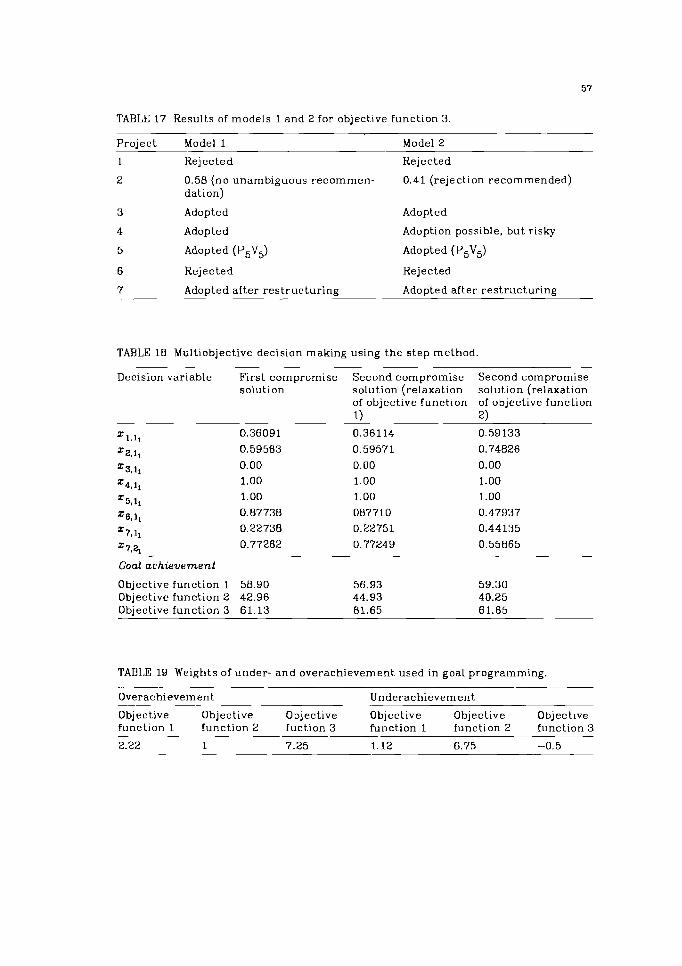
TABLE 17 Results of models 1 and 2 for objective function 3.
Project --
1
Model 1 Model 2
Rejected Rejected
0.58 (no unambiguous recommen- 0.41 (rejection recommended) dation)
Adopted Adopted
Adopted
Adopted (P5V5)
Rejected
Adoption possible, but risky
Adopted (P5V5)
Rejected
Adopted after restructuring Adopted after restructuring
TABLE 10 Multiobjective decision making using t h e s tep method.
Decision variable First compromise solution
Second compromise solution (relaxation of objective function 1)
Second compromise solution (relaxation of objective function 2)
0.59133
0.74826
0.00
1.00
1.00
0.47937
0.44135
0.55865
Goal a c h i e v e m e n t
Objective function 1 58.90 Objective function 2 42.96 Objective function 3 61.13
TABLE 19 Weights of under- a n d overachievement used in goal programming. --
Overachievement --
Underachievement --
Objective Objective Objective Objective Objective Objective function 1 function 2 fuction 3 function 1 function 2 function 3
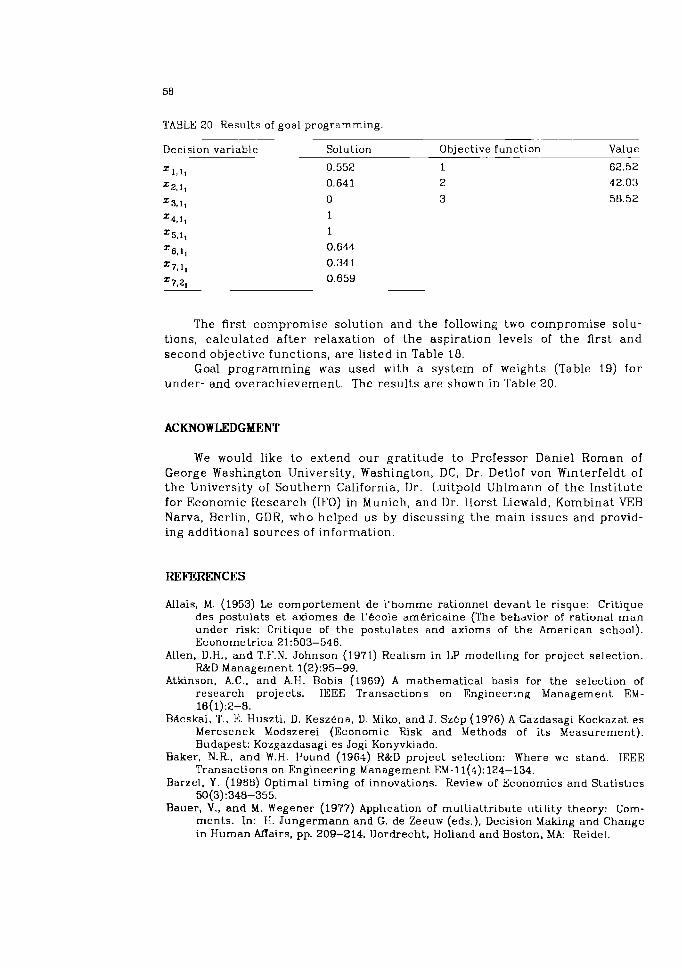
TABLE 20 Results of goal programming --
Decision variable Solution Objective function --
Value
= 1 , 1 1 0.552 1 62.52
Z2,11 0.641 2 42.03
=3,11 0 3 58.52
z4,11 1
25,11 1
=6.11 0.644
z7,1, 0.341
z7.2. 0.659
The first compromise solution and the following two compromise solu- tions, calculated af ter relaxation of the aspiration levels of the first and second objective functions, are listed in Table 18.
Goal programming was used with a system of weights (Table 19) for under- and overachievement. The results are shown in Table 20.
ACKNOWLEDGMENT
We would like to extend our gratitude to Professor Daniel Roman of George Washington University, Washington, D C , Dr. Detlof von Winterfeldt of the University of Southern California, Dr. Luitpold Uhlmann of the Institute for Economic Research (IFO) in Munich, and Dr. Horst Liewald, Kombinat VEB Narva. Berlin, GDR, who helped us by discussing the main issues and provid- ing additional sources of information.
REFERENCES
Allais, M. (1953) Le comportement de i 'homme rationnel devant l e risque: Critique des postulats e t axiomes de L'Bcole amkricaine (The behavior of rat ional m a n under risk: Critique of t h e postulates and axioms of t h e American school). Econome trica 21:503-546.
Allen. D.H., a n d T.F.N. Johnson (1971) Realism in LP modelling for project selection. R&D Management 1(2):95-99.
Atkinson. kc . , a n d A.H. Bobis (1969) A mathematical basis for t h e selection of research projects. JEEE Transactions on Engineering Management EM- 16(1):2-8.
Bacskai. T., E. Huszti, D. Keszkna, D. Miko, and J. Szkp (1976) A Gazdasagi Kockazat e s Meresenek Modszerei (Economic Risk and Methods of it.s Measurement). Budapest: Kozgazdasagi es Jogi Konyvkiado.
Baker, N.R., a n d W.H. Pound (1964) R&D project selection: Where we s tand. IREE Transactions on Engineering Management EM-11(4):124-134.
Barzel, Y. (1968) Optimal timing of innovations. Review of Economics a n d Stat is t ics 50(3):348-355.
Bauer. V., a n d M. Wegener (1977) Application of mult ia t t r ibute utility theory: Com- ments . In: H. Jungermann a n d G. de Zeeuw (eds.), Decision Making and Change i n Human M a i r s , pp. 209-214. Dordrecht, Holland a n d Boston, MA: Reidel.
Bell. D.C., and A.W. Read (1970) The application of a research project selection method. R&D Management 1(1):35.
Bell, D.E., R.L. Keeney, and H. Raiffa (eds.) (1977) Conflicting Objectives in Decisions. International Series on Applied Systems Analysis vol. 1. Chichester, UK: Wiley.
Belyaev, L.S. (1977) A practical approach to choosing a l te rna te solutions t o complex optimization problems under uncertainty. Research Memorandum RM-77-7. Laxenburg, Austria: International Inst i tute for Applied Systerns Analysis.
Benayoun, 3.. 0.1. Larichev, J. de Montgolfier, and J . Tergny (1971a) Linear program- ming with multiple objective functions: The method of constraints. Autoniation and Remote Control, USSR 32(8): 1257-1264.
Benayoun, R., J. de Montgolfier, J. Tergny, and 0. Larichev (1971b) Linear program- ming with multiple objective functions: Step method (STEM). Mathematical Programming 1(3):366-375.
Bright, k J . (1949) The Electric Lamp Industry: Technological Change a n d Economic Development from 1800 to 1947. New York, NY: Macmillan.
Biihlmann. H., H. Loeffel. and E. Nievergelt (1975) Entscheidungs- und Spieltheorie (Decision and Game Theory). Berlin (West): Springer.
Bunn, D.W. (1978) The Synthesis of Forecasting Models in Decision Analysis. Basle and Stut tgart : Birkhauser.
Carnes, R.B. (1978) Productivity a n d technology in the electric lamp industry. Monthly Labor Review 101(8):15.
Cazalet, E.G. (1981) Integrated modeling for analysis of energy policy decisions. Modeling of Large-Scale Energy Systems. IIASA Proceedings Series vol. 12, pp. 109-123. Oxford: Pergamon.
Chang. R.L.P., a n d T. Pavlidis (1977) Fuzzy decision t r e e algorithms. lEEE Transac- tions on Systems Management and Cybernetics SMC-7(1):28-35.
Chapman, C.B. (1979) Large engineering project risk analysis. IEEE Transactions on Engineering Management EM-26(3):78-86.
Chiu, L., and T.E. Gear (1979) An application and case history of a dynamic R&D port.- folio selection model. lEEE Transactions on Engineering Management EM- 26(1):2-7.
Chung, K.M.. F. Luccio, and C.K. Wong (1980) A t r e e storage scheme for magnet ic bub- ble memories. IEEE Transactions on Computers C-29(10):864-874.
Clarke, T.E. (1974) Decision making i n technologically based organizations: A Litera- t u r e survey of present practice. IEEE Transactions on Engineering Management EM-21(2):9-23.
Cochran, M.A., E.H. Pyle 111, L.D. Greene, H.A. Clymer, a n d AD. Bender (1971) Invest- m e n t model for R&D project evaluation a n d selection. IEEE Transactions on Engineering Management EM-18(3):89-100.
Colson. G., and M. Zeleny (1980) A mult icr i ter ion concept of risk under incomplete information. Computers and Operations Research 7: 125-143.
Coombs, C.H. (1975) Portfolio theory and the measurement of risk. In: M.F. Kaplan and S. Schwartz (eds.), Human Judgment and Decision, pp. 63-85. New York, NY: Academic Press.
Danilov-Danilyan, V.I. (1980) Metodologicheskie aspekty i teoriya sotsialno- ekonomicheskogo optimuma (Methodological aspects and theory of s o c i o e c ~ n o m i c optima). Ekonomika i Maternaticheskie Metody 16(1): 146-164.
Davies, S. (1979) The Diffusion of Process Inriovations. Cambridge: Cambridge Univer- sity Press.
Dinkelbach. W.. and H. Isermann (1930) Resource allocation of a n academic depart- m e n t in t h e presence of multiple cr i ter ia - Some experirnents with a modified STEM network. Computers and Operations Research 7(1):99-106.
Doblin. C.P. (1982) The growth of energy consumption and prices in t h e USA, FRG, France, and the UK, 1950-1980. Research Report RR-82-18. Laxenburg, Austria: International Institute for Applied Systems Analysis.
Dyer. J.S. (1972) Interactive goal programming. Management Science 19(1):62-70.
Evans. J.P.. and R.E. Steuer (1973) A revised simplex method for linear multiple objective programs. Mathematical Programming 5:54-72.
Fedorenko, N.P. (ed.) (1975) Matematika i Kibernetika v Ekonomike (Mathematics and Cybernetics in Economics). Moscow: Ekonomika.
Filippovskii, E.E. (1978) Obnovlenie Prornyshlennoi Produktsii v Kapitalisticheskich Stranakh (Innovation in Capitalist Countries). Moscow: Nauka.
Fischer, G.W. (1972) Four methods for assessing multiattribute utilities: An experi- mental validation. Technical Report 037230-6-T. Ann Arbor. MI: Engineering Psychology Laboratory, University of Michigan.
Fishburn, P.C. (1970) Utility Theory for Decision Making. New York, NY: Wiley. Fishburn, P.C., and R.L. Keeney (1974) Seven independence concepts and continuous
multiattribute utility functions. Journal of Mathematical Psychology 1: 294-327.
Freeling, A.N.S. (1980) Fuzzy sets and decision analysis. IEEE Transactions on Sys- tems. Man, and Cybernetics SMC-10(7):341-354.
Gear, A.E. (1974) A review of some recent developments in portfolio modeling in applied R&D. IEEE Transactions on Engineering Management EM-21(4): 119-125.
Gear, A.E.. J.S. Gillespie, and J.M. Allen (1972) Applications of decision trees to the evaluation of applied research projects. Journal of Management Studies, May. pp. 172-181.
Gear, A.E., J.S. Gillespie, kG. Lockett, and kW. Pearson (1970) Manpower modeling: A study in research and development. Paper presented a t Conference of Institute of Management Science, London, July.
Gear, kE. , and A.G. Lockett (1973) A dynamic model of some multistage aspects of research and development portfolios. lEEE Transactions on Engineering Management EM-20(1):22-29.
Gear, kE . , kG. Lockett, and kW. Pearson (1971) Analysis of some portfolio selection models for R&D. IEEE Transactions on Engineering Management EM- ie(z):66-76.
Gillespie, J.S., and A. E. Gear (1972) Decision network in applied research and development. Proceedings of INTERNET Conference, Stockholm, May, pp. 128-147.
Golubkov, E.P. (1977) Sistemrlyi Analiz v Otraslevom Planirovanii (Systems Analysis in the Planning of Industrial Branches). Moscow: Ekonomika.
Grossman, D.. and S.N. Gupta (1974) Dynamic time-staged model for R&D portfolio planning: A real world case. IEEE Transactions on Engineering Management EM-24(4): 141-147.
Harrington, T.C., and W.k Fischer (1980) Portfolio modeling in multiple-criteria situations under uncertainty: Comment. Decision Sciences 11(1):171-177.
Hashimoto, 7'. (1980) A rnultiobjective approach to allocating water resources for municipal, agricultural, and recreational uses. Working Paper WP-80-107. Lax- enburg. Austria: International Institute for Applied Systems Analysis.
Haustein, H.-D. (1974) Die Proportionalitat der Technischen Basis im Sozialisrnus. Berlin (GDR): Akademie-Verlag.
Haustein, H.-D. (1964) Die Messung und okonomische Analyse des technischen Niveaus unter besonderer Berucksichtigung der Anforderungen der Perspek- tivplanung (Measurement and economic analysis of technical levels with partic- ular consideration for future planning requirements). Habilitation Thesis, University of Ec:onomics, Berlin (GDR).
Haustein, I-1.-D., and H. Maier (1980) Basic, improvement, and pseudo-innovations and their impact on efficiency. Technological Forecasting and Social Change 16:243-265.
Haustein. I-1.-D.. H. Maier, and L. Uhlmann (1981) Innovation and efficiericy. Research Report RR-81-7. Laxenburg, Austria: International Institute for Applied Systems Analysis.
Hennecke. H.-U. (1975) Verfahren zur Bewertung von Vorschlagen fiir industrielle Forschungs- und Entwicklungsprojekte (Method for assessing proposals for
industrial research and development projects). Dissertation, University of Saarland, FRG.
Hespos, R.F., and P . k Strassman (1965) Stochastic decision t rees for the analysis of investment decisions. Management Science 11(10):244-259.
Hession, E. (1977) The application of multiattribute utility models to some uncertain decision situations in areas of business and public policy. In: H. Jungermann and G. de Zeeuw (eds.), Decision Making and Change in Human Affairs, pp. 67-80. Dordrecht, Holland and Boston. MA: Reidel.
Hogarth. R.M. (1974) Process tracing in clinical judgment. Behavioral Science 19:298-313.
Howard. R.A. (1980) An assessment of decision analysis. Operations Research ze(i):4-27.
Howard. R.A., and J.E. Matheson (eds.) (1976) Readings in Decision Analysis. Menlo Park. CA: Stanford Research Institute.
Hurnphreys, P. (1977) Application of multiattribute utility theory. In: H. Junger- mann and G. de Zeeuw (eds.), Decision Making and Change in Human Mairs , pp. 165-208. Dordrecht, Holland and Boston, MA: Reidel.
Humphreys, P., and A. Wisudha (1980) MAUT - An interactive computer program for the structuring, decomposition, and recomposition of preferences between mul- tiattributed alternatives. Technical Report 79-2/2. Uxbridge, UK: Brunel Insti- tu te of Organization and Social Studies. Decision Analysis Unit.
Hwang, C.L., S.R. Paidy, K.Yoon, and A.S.M. Masud (1980) Mathematical programming with multiple objectives: A tutorial. Computer and Operations Research 7(1-2): 5-3 1.
Jungermann. H. (1977) Cognitive processes and societal risk taking: Comments. In: H. Jungermann and G. de Zeeuw (eds.), Decision Making and Change in Human Mai r s , pp. 37-44. Dordrecht, Holland and Boston, MA: Reidel.
Kallio. M., k Lewandowski, and W. Orchard-Hays (1980) An implementation of the reference point approach for multiobjective optimization. Working Paper WP- 80-35. Laxenburg. Austria: International Institute for Applied Systems Analysis.
Kamien. M.I.. and N.L. Schwartz (1974) Patent life and rivalry. American Economic Review 64(1): 183-187.
Kaplan. M.F., and S. Schwartz (eds.) (1975) Human Judgment and Decision Processes. New York, NY: Academic Press.
Keefer, D.L. (1978) Allocation planning for R&D with uncertainty and multiple objec- tives. IEEE Transactions on Engineering Management EM-25(1):8-14.
Keen, P.G.W. (1980) Decision support systems: A research perspective. Sloan Work- ing Paper 1117-80. Cambridge. MA: Center for Information Systems, MIT.
Keen, P.G.W., and M.S.S. Morton (1978) Decision Support Systems: An Organizational Perspective. Reading. MA: Addison-Wesley.
Keeney, R.L.. and H. Raiffa (1976) Decisions with Multiple Objectives. New York. NY: Wiley.
Kindler, J., P. Zielinski, and L. de Mare (1980) An interactive procedure for multiob- jective analysis of water resources allocation. Working Paper WP-80-85. Laxen- burg. Austria: lnterr~ational Institute for Applied Systems Analysis.
Klausmann, H.-S. (1976) Stochastische Entscheidungsbaume: Ein Beitrag zur Losung von sequentiellen Entscheidungsproblemen bei Risiko (Stochastic Decision Trees: A Contribution to Solution of Decision Problems wi.th Risk). Meisenheim a m Glan, FRG: Verlag Glan.
Knuth. D.E. (1973) The Art of Computer Programming vol. 1.. New York. NY: Addison-Wesley.
Kornbluth. J. (1973) A survey of goal programming. OMEGA 1:193-205. Larichev, 0.1. (1979) Nauka i Iskusstvo: Prirlyatiya i Reshenii (Science and Art of
Decision Making). Moscow: Nauka. Larichev. O.I., and 0 . k Polyakov (1980) Cheloveko-mashinnye protsedury resheniya
rnnogokriterialnykh zadach matematicheskogo programmirovaniya (Man-machine procedures for solving mathematical programming problems
with multiple objectives). Ekonomika i matematicheskie metody 16(1):129-145. Leal, A,, and J. Pearl (1977) An interactive program for conversational elicitation of
decision s tructures . IEEE Transactions on Systems. Man, a n d Cybernetics SMC- 7(5):368-376.
Lee, S.M. (1978) Interactive integer goal programming: Methods and applications. In: S. Zionts (ed.), Multiple Criteria Problem Solving, pp. 362-383. Berlin (West): Springer.
Lee, 8 M., and R.L. Morris (1977) Integer goal programming methods. TIMS Studies in t h e Management Sciences 6:273-289.
Levin, S.. S. Johnston, A. Leal, and G. Weltman (1978) Computer-based group decision aiding. Proceedings of t h e IEEE International Conference on Cybernetics and Society. 3-8 November. Tokyo-Kyoto. P a r t I1:707, pp. 1396-1401.
Lewis, J.W. (1975) Tree: An interact ive sys tem for editing t r e e s t ruc tures . Comput- ing a n d Graphics 1(1):65-68.
Lichtenstein, S., B. Fischhoff, and L.D. Phillips (1977) Calibration of probabilities: The s ta te of the ar t . In: H. Jungermann and G. de Zeeuw (eds.), Decision Making and Change in Human AfTairs, pp. 275-324. Dordrecht. Holland and Boston. MA: Reidel.
Liewald, H. (1977) Die analytisch-prognostische und langfristig-konzeptionelle Arbeit fu r Forschung u n d Entwicklung als Bedingung fur die planmassige Erhohung des wissenschaftlich-technischen Niveaus der Produktion - Dar- gestellt a m Beispiel der Lichtquellen-Industrie d e r DDR (Analytic-predictive and long-term planning of research and development work as a condition for t h e systematic increase of the scientific-technical level of production - The example of the lighting industry of t h e GDR). Dissertation, Humboldt Univer- sity, Berlin (GDR).
Linstone, H.A., and D. Sahal (eds.) (1976) Technological Substitution, Forecasting. Technique, and Applications. Portland, OR: Port land State University.
Lockett, kG. , and P. Freeman (1970) Probabilistic networks and R&D portfolio selec- tion. Operational Research Quarterly 21(3):353-359.
Lockett, kG. , and A.E. Gear (1972) Program selection i n research and development. Management Science 18(10):575-590.
Lockett, AG.. and k E . Gear (1973) Representation and analysis of mult is tage prob- lems in R&D. Management Science 19(8):947-960.
Lockett, A.G.. A.P. Muhlemann, a n d L.k Wolsey (1980) A s tochast ic programming model for project selection. In: M.A.H. Dempster (ed.), Stochastic Program- ming, pp. 427-448. New York. NY: Academic Press.
MacCrimmon, K.R. (1973) An overview of multiple objective decision making. In: J. Cochrane and M. Zeleny (eds.), Multiple Criteria Decision Making, pp. 18-44. Columbia. SC: University of South Carolina Press.
Mader. M. (1976) Aufbau u n d Analyse von Entscheidunpsbaumen: Grundlage fur die Entwicklung eines computergestutzten Analyseverfahrens fiir Risi- koentscheidungsprobleme (Construction a n d analysis of decision t rees: Basis for t h e development of a computer-assis ted analytical technique for r isk deci- sion problems). Dissertation, University of St. Gallen, Switzerland.
Mansfield. E., J. Rapoport, J. Schnee, S. Wagner, a n d M. Hamburger (1971) Research and Innovation in t h e Modern Corporation. New York, NY: Macmillan.
March. J.G.. a n d H.A. Sirnori (1978) Organizations. New York. NY: Wiley. Marien, E... a n d L.C. Jagetia (1972) A solution approach to t h e calculation of
expected, discounted decision values for new-product sequential-decision processes. Bulletin of t h e Inst i tute of Management Science, March, p. 121.
Martino, J.P. (1972) Techriological Forecasting for Decisionmaking. New York, NY: American Elsevier.
Matheson, J.E., and R . k Howard (1968) An Introduction t o Decision Analysis. Palo Alto. CA: Stanford Research Institute.
Monarchi, E.D.. J.E. Weber, a n d L. Duckstein (1976) An interact ive multiple objective decision making aid using nonlinear goal programming. In: M. Zeleny (ed.).
Multiple Criteria Decision Making. pp. 235-253. Berlin (West): Springer. Moore, J.R., Jr., and N.R. Baker (1969) Computational analysis of scoring models for R
and D project selection. Management Science 16(4):B212-232. Moskowitz, H. (1971) Dynamic programming and branch and bound approaches for
analyzing decision trees in normal rorm. Paper presented a t 39th National Meeting of Operations Research Society of America, Dallas, TX. 5-7 May.
Muhlemann, k P . , and kG. Lockett (1980) Portfolio modeling in multiple-criteria situations under uncertainty: Rejoinder. Decision Sciences 11(1):178-180.
Muhlemann A.P., A.G. Lockett, and A.E. Gear (1978) Portfolio modeling in multiple- criteria situations under uncertainty. Decision Sciences 9(4):612-626.
Nijkamp, P., and J. Spronk (1977) Goal programming for decision making. Report 7709/A. Rotterdam: Erasrnus University. Centre for Research in Business Economics.
Pate. M.-E. (1979) Values and risks - A research proposal for lIASk Working Paper WP-79-94. Laxenburg, Austria: International Institute for Applied Systems Analysis.
Peschel, M. (1980) Ingenieurtechnische Entscheidungen: Modellbildung und Steuerung mit Hilfe der Polyoptimierung (~echn ica l Engineering Decisions: Model Construction and Control with the Aid of Multicriteria Optimization). Berlin (GDR): Verlag Technik
Pfohl, H.-C. (1977) Messung subjektiver Wahrscheinlichkeiten (Measurement of sub- jective probabilities). In: H.-C. Pfohl and B. Ruerup (eds.), Wirtschaftliche Messprobleme (Economic Measurement Problems), pp. 23-36. Cologne: Han- stein Verlag.
Rapoport, k (1975) Research paradigms for studying dynamic decision behavior. In: D. Wendt and C. Vlek (eds.), Utility, Probability, and Human Decision Making, pp. 349-369. Dordrecht, Holland and Boston, MA: Reidel.
Ritchie. E. (1970) Research on research: Where do we stand? R&D Management 1(1):3-9.
Roman. D. (1980) Science, Technology, and Innovation: A Systems Approach. Columbus. OH: Grid.
Roy, B. (1977) ELECTRE 111. Sema, Research Report 81. Roy. B., and P. Bertier (1971) La Methode ELECTRE 11. Sema. Note de Travail 124. Rubenstein, AH. (1966) A real firm study of information requirements for project
selection in research and development. Paper presented a t International Federation of Operations Research Societies, Boston, MA, August.
Salazar, R.C.. and S.K. Sen (1968) A simulation model of capital budgeting under uncertainty. Management Science 15(4): 16 1-179.
Schwartz, S.L (1976) R&D project evaluation: From firm behavior to normative models to implementations. Report IV/76-2. International Institute of Manage- ment. Berlin (GDR).
Schwartz. S.L.. and I. Vertinsky (1980) Information preferences and attention pat- terns of R&D investment decision. In: D. Sahal (ed.). Research. Development. and Technological Innovation. Lexington, MA: Heath.
Slovic, P., B. Fischhoff, and S. Lichtenstein (1977a) Behavioral Decision Theory. Annual Review of Psychology 28: 1-39.
Slovic. P.. B. Rschhoff, and S. Lichtenstein (1977h) Cognitive processes and societal risk taking. In: H. Jungerrnann and G. de Zeeuw (eds.), Decision Making and Change in Hurnan Mairs , pp. 7-36. Dordrecht, Holland and Boston, MA: Reidel.
Slovic, P., and A. 'I'versky (1974) Who accepts Savage's Axiom? Behavioral Science 19:368-373.
Smallwood, R.D., and P . k Morris (1980) A task force decision analysis. Operations Research 28(1):60-80.
Souder. W.E. (1968) Experiences with an R&D project control model. IEEE Transac- tions on Engineering Management EM-15(1):39-49.
Souder. W.E. (1972) Comparative analysis of R&D investment models. AlIE Transac- tions 4(1):57-64.
Souder. W.E. (1973a) Analytical effectiveness of mathematical networks for R&D proj- e c t selection. Management Science 19(8):907-923.
Souder, W.E. (1973b) Utility and perceived acceptability of R&D project selection models. Management Science 19(12):1384-1394.
Souder, W.E. (1978) A System for using R&D project evaluation methods. Research Management 21(5):29-37.
Spetzler, C.S., and C.AS. Stael von Holstein (1972) Probability encoding in decision analysis. In: R.A Howard and J.E. Matheson (eds.). Readings in Decision Analysis. pp. 405-427. Menlo Park, CA: Stanford Research Institute.
Spronk. J. (1979) Interactive multiple-goal programming a s a n aid for capital budget- ing a n d financial planning with multiple goals. Report 7914/F. Rotterdam: Erasmus University, Centre for Research in Business Economics.
Thompson, D.A., a n d P. Kirschner (1978) Decision t r e e s display parameters for interactive graphics computers. Proceedings of International Conference on Interactive Techniques in Computer-Aided Design, pp.363-366. New York: IEEE.
Tsuji. K (1980) The effects of uncertainty in generation expansion planning: A review of methods and experiences. Working Paper WP-80-116. Laxenburg, Austria: International Inst i tute for Applied Systems Analysis.
Tversky, A,, a n d D. Kahneman (1975) Judgment under uncertainty: Heuristics and biases. In: D. Wendt and C. Vlek (eds.), Utility, Probability and Human Decision Making, pp. 141-163. Dordrecht, Holland and Boston, MA: Reidel.
Twiss. D.C. (1974) Managing Technological Innovation. London: Longman. Wallenius. J. (1975) Comparative evaluation of some interact ive appoaches to mul-
ticriterion optimization. Management Sciences 21(12):1387-1396. Watson, S.R., J.J. Weiss, and M.L. Donne11 (1979) Fuzzy decision analysis. IEEE Trans-
act ions on Systems, Man. and Cybernetics SMC-9(1): 1-9. Wierzbicki, A.P. (1979a) The use of reference objectives in multiobjective optimiza-
tion - Theoretical implications and practical experience. Working Paper WP- 79-66. Laxenburg, Austria: International Institute for Applied Systems Analysis.
Wierzbicki, AP. (1979b) A methodological guide t o multiobjective optimization. Working Paper WP-79-122. Laxenburg, Austria: International Inst i tute for Applied Systems Analysis.
Wierzbicki. A.P. (1980) A mathematical basis for satisfying decision making. Working Paper WP-80-90. Laxenburg, Austria: International Inst i tute for Applied Sys- t e m s Analysis.
Willoughby, AH. (1969) The evolution of electric lamps. Lighting Research and Tech- nology 1(2):77.
von Winterfeldt. D. (1975) An overview, integration, and evaluation of utility theory for decision analysis. Social Science Research Institute Research Report 75-9. Los Angeles, CA: University of Southern California.
von Winterfeldt, D.. and G.W. Fischer (1975) Multiattribute utility theory: Models and assessment procedures. In: D. Wendt a n d C. Vlek (eds.), Probability a n d Human Decision Making, pp. 47-87. Dordrecht. Holland a n d Boston, MA: Reidel.
Yager, R.R. (1977) Subjective decision making. Proceedings of Internat ional Confer- ence o n Cybernetics a n d Society, Washington, DC, September. pp. 243-244. New York, NY: IEEE.
Zeleny. M. (1974) Linear Multiobjective Programming. New York. NY: Springer. Zeleny, M. (1976) The theory of displaced ideal. Proceedings of Conference on
Multiple-Criteria Decision Making. Kyoto, 1975, pp. 153-206. New York. NY: Springer.
Zeleny, M. (1980) Multiple objectives i n mathematical progamming: Letting t h e m a n in. Computers and Operations Research 7: 1-4.
Zellmer, G. (1980) Entscheidungstheoretische Aussagen z u m Risiko und M6glichkeiten seiner Beriicksichtigung bei d e r Vorbereitung volkswirtschaft- l icher Bilanzentscheidungen (Statements from decision theory o n r isk and pos- sibilities of i t s consideration in t h e preparation of economic budgeting deci- sions). Habilitation Thesis. University of Economics. Berlin (GDR).
THE AUTHORS
H e i n z - D i e t e r H a u s t e i n received his diploma in industrial economics in 1955 from the Leningrad Institute of Finance and Economics, and his Ph.D. in 1960 and his Habilitation in 1964 from the University of Economics, Berlin (GDR). Deputy Director of the Institute for Management and Head of the Department for Planning and Fore- casting of Science and Technology at the Bruno Leuschner University of Economics in Berlin (GDR), Professor Haustein worked in the Innovation Management Task of the Management and Technology Area a t IIASA from 1979 to 1982. His research interests include the economic analysis of technology and innovation.
Mathias Weber received his diploma in economic cybernetics in 1978 from the Moscow State University, and his Ph.D. in 1982 from the University of Economics, Berlin (GDR). He worked a t the Department for Planning and Forecasting of Science and Technology a t the Bruno Leuschner University of Economics in Berlin (GDR) from 1978 to 1982. Since 1982 he has been a research economist in Kombinat VEB Narva, Berlin. His scientific interests include management of technological innova- tions and computer-aided management systems.
RELATED IIASA PUBLICATIONS
Research Reports
Haustein. H.-D. (1982) Human resources, creativity, and innovation: The conflict between Homo faber and Homo ludens . RR-82-46 (available for a handling charge of $1.00). Reprinted from Behavioral Science vol. 26 (1981).
Haustein, H.-D., H. Maier, and L. Uhlrnann (1981) Innovation and efficiency. RR-81-7 ($8.50).
Haustein, H.-D.. H. Maier, and E. Ulrich (1983) Innovation and requirements for human resources. RR-83-24 ($6.00).
Maier. H., and H.-D. Haustein (1982) Innovation, efficiency cycle, and strategy impli- cations. RR-82-22 (available for a handling charge of $1.00). Reprinted from Technological f i r ecas t ing and Social Change vol. 17 (1980).
Marchetti, C. (1981) Society as a learning system: Discovery, invention, and innova- tion cycles revisited. RR-81-29 (available for a handling charge of $1.00). Reprinted from Technological f i r ecas t ing and Social Change vol. 18 (1980).
Robinson, J.M. (1982) Technological learning, technological substitution, and techno- logical change. RR-82-31 (available for a handling charge of $1.00). Reprinted from Technological f i r ecas t ing and Social Change vol. 18 (1980).
Collaborative Proceedings
Maier. H., and J.M. Robinson (eds.) (1982) Innovation Policy and Company Strategy. CP-82-S9 ($18.50).
Recommended