EARTHQUAKE HAZARD MAPS OF THE VISTA AND STEAMBOAT 7%-MINUTE QUADRANGLES, NEVADA
D. T. Trexler and M. R. Nichol
Nevada Bureau of Mines and GeologyUniversity of Nevada, Reno
Reno, NV 89557
USGS CONTRACT NO. 14-08-0001-19116 Supported by the EARTHQUAKE HAZARDS REDUCTION PROGRAM
OPEN-FILE NO. 81-945
U.S. Geological Survey OPEN FILE REPORT
This report was prepared under contract to the U.S. Geological Survey and has not been reviewed for conformity with USGS editorial standards and stratigraphic nomenclature. Opinions and conclusions expressed herein do not necessarily represent those of the USGS. Any use of trade names is for descriptive purposes only and does not imply endorsement by the USGS.

-1-
TABLE OF CONTENTS
Page
INTRODUCTION ............................ 1
SEISMIC VELOCITY MEASUREMENTS. ................... 3
RIGIDITY PRODUCT .......................... 10
EARTHQUAKE HAZARDS MAPS. ...................... 14
POTENTIAL FOR FAULT SURFACE RUPTURE. ................ 17
Delineation of faults in the Steamboat Quadrangle ........ 21Delineation of faults in the Vista Quadrangle .......... 24
REFERENCES ............................. 26
Appendix............. 27

-11-
LIST OF FIGURES
Page
Figure 1. SH-wave source orientations and first arrivals ....... 4
Figure 2. Travel-time plot of SH-wave first arrivals forsite V-18, alluvial fan material .............. 5
Figure 3. Seismic velocity locations Steamboat quadrangle. ...... 6
Figure 4. Seismic velocity locations Vista quadrangle. ........ 7
LIST OF TABLES
Page
Table 1. Rigidity product calculations for the Steamboat7 1/2-minute quadrangle. .................. 11
Table 2. Rigidity product calculations for the Vista7 1/2-minute quadrangle. .................. 12
Table 3. Shaking categories for the Steamboat quadrangleearthquake hazard map. ................... 15
Table 4. Shaking categories for the Vista quadrangleearthquake hazard map. ................... 19
INTRODUCTION
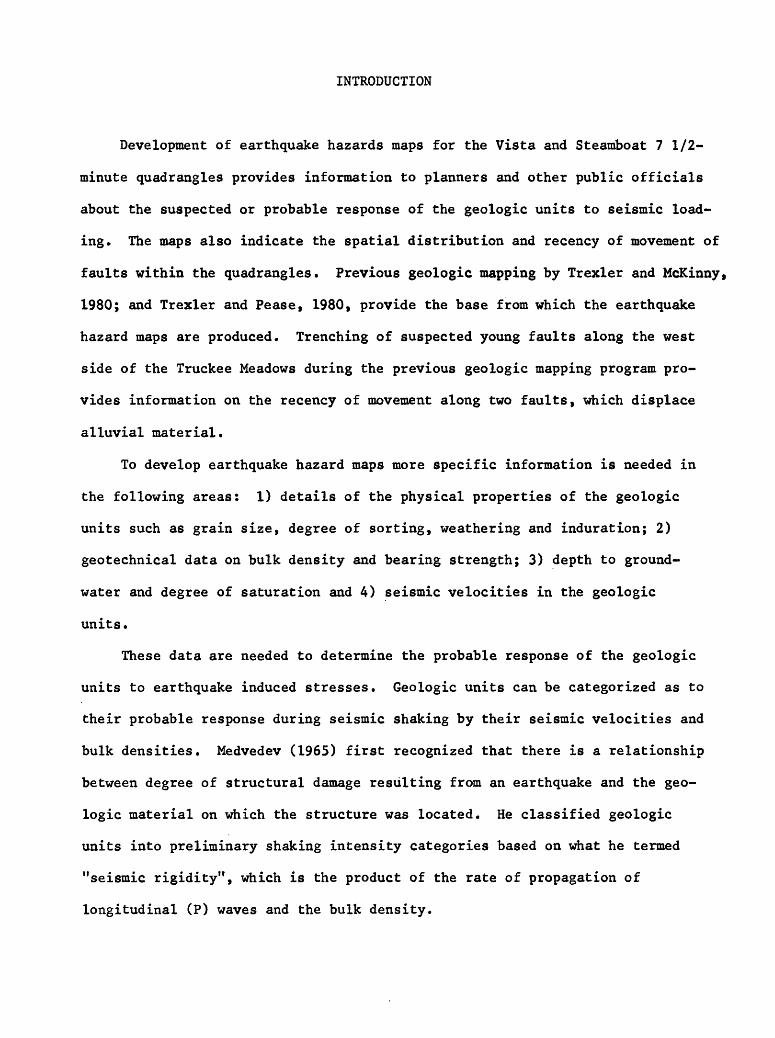
Development of earthquake hazards maps for the Vista and Steamboat 7 1/2-
minute quadrangles provides information to planners and other public officials
about the suspected or probable response of the geologic units to seismic load
ing. The maps also indicate the spatial distribution and recency of movement of
faults within the quadrangles. Previous geologic mapping by Trexler and McKinny,
1980; and Trexler and Pease, 1980, provide the base from which the earthquake
hazard maps are produced. Trenching of suspected young faults along the west
side of the Truckee Meadows during the previous geologic mapping program pro
vides information on the recency of movement along two faults, which displace
alluvial material.
To develop earthquake hazard maps more specific information is needed in
the following areas: 1) details of the physical properties of the geologic
units such as grain size, degree of sorting, weathering and induration; 2)
geotechnical data on bulk density and bearing strength; 3) depth to ground-
water and degree of saturation and 4) seismic velocities in the geologic
units.
These data are needed to determine the probable response of the geologic
units to earthquake induced stresses. Geologic units can be categorized as to
their probable response during seismic shaking by their seismic velocities and
bulk densities. Medvedev (1965) first recognized that there is a relationship
between degree of structural damage resulting from an earthquake and the geo
logic material on which the structure was located. He classified geologic
units into preliminary shaking intensity categories based on what he termed
"seismic rigidity", which is the product of the rate of propagation of
longitudinal (P) waves and the bulk density.

-2-
In this study we will follow the procedures initiated by Bingler, 1974
and modified by Trexler and Bell, 1980. These include the determination of
the suspected response of the geologic units based upon the product of the
shear-wave (SH) velocity and the bulk density (p). The product of the values
has been termed the "rigidity product". The classification derived from this
technique are modified by the presence of groundwaterj saturated unconsolidated
sediments are placed in the next higher classification if they are within 10 m
(30 ft) of the surface. For a detailed discussion of the methodology involved,
the previous report on earthquake hazard maps of Carson City, New Empire, and
South Lake Tahoe quadrangles (Trexler and Bell, 1979) should be consulted.
The recency of faulting is an important aspect in the preparation of the
earthquake hazard maps. By using USDA Soil Conservation Service soil maps and
applying the technique developed by Trexler and Bell, 1979 and Bell and Pease,
1979, faults that are Pleistocene or younger are divided into age groups based
on soil development. Faults of Holocene age (<12,000 years B.P.) displace enti-
sol soils which are characterized by an AC profile. Late Pleistocene faults
(approximately 12,000 - 35,000 B.P.) displace soils identified as Haplargids
and Argixerolls. These soil types are equivalent to the Churchill soil of
the western Great Basin. Faults of Early to mid-Pleistocene age (approxi
mately 100,000 - 1.8 m.y. B.P.) displace Durargid, Paleargid and Durargixeroll
soils or equivalents and correspond to development similar to the Cocoon
soil.
-3-
SEISMIC VELOCITY MEASUREMENTS
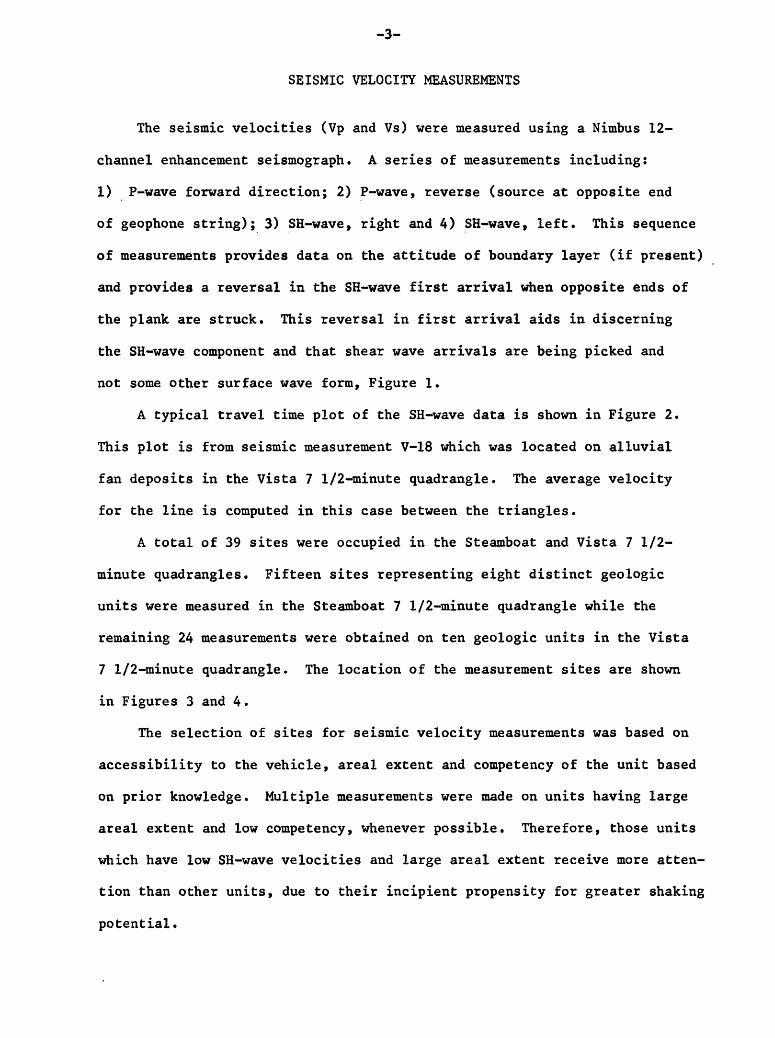
The seismic velocities (Vp and Vs) were measured using a Nimbus 12-
channel enhancement seismograph. A series of measurements including:
1) P-wave forward direction; 2) P-wave, reverse (source at opposite end
of geophone string); 3) SH-wave, right and 4) SH-wave, left. This sequence
of measurements provides data on the attitude of boundary layer (if present)
and provides a reversal in the SH-wave first arrival when opposite ends of
the plank are struck. This reversal in first arrival aids in discerning
the SH-wave component and that shear wave arrivals are being picked and
not some other surface wave form, Figure 1.
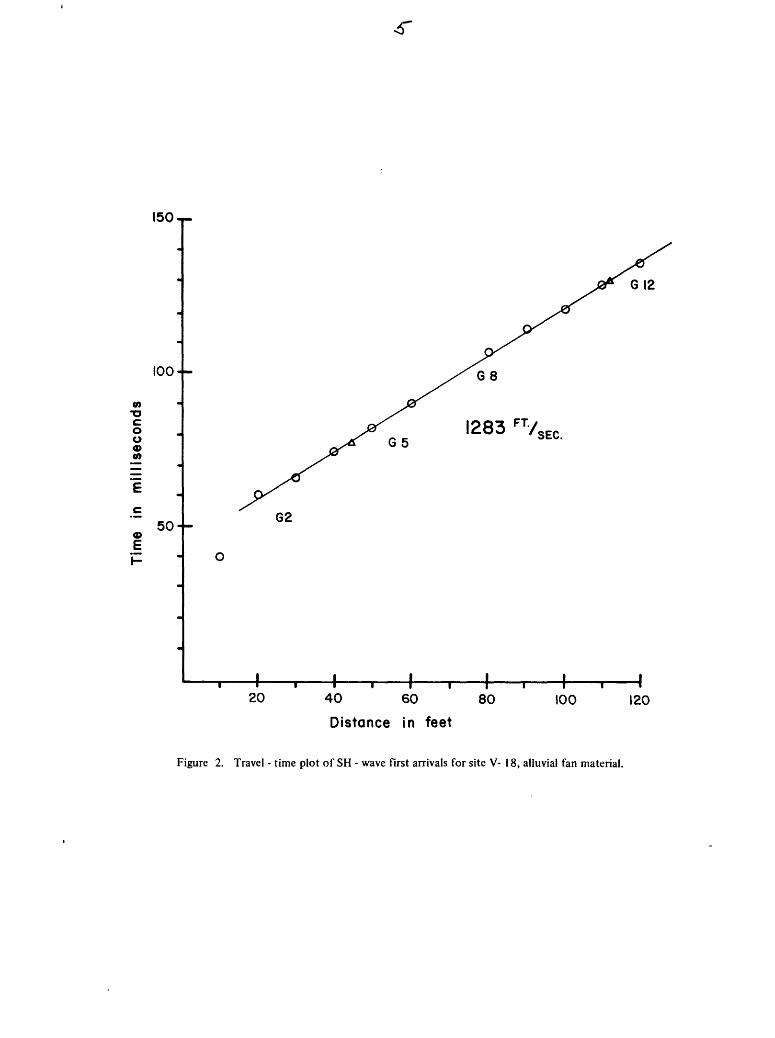
A typical travel time plot of the SH-wave data is shown in Figure 2.
This plot is from seismic measurement V-18 which was located on alluvial
fan deposits in the Vista 7 1/2-minute quadrangle. The average velocity
for the line is computed in this case between the triangles.
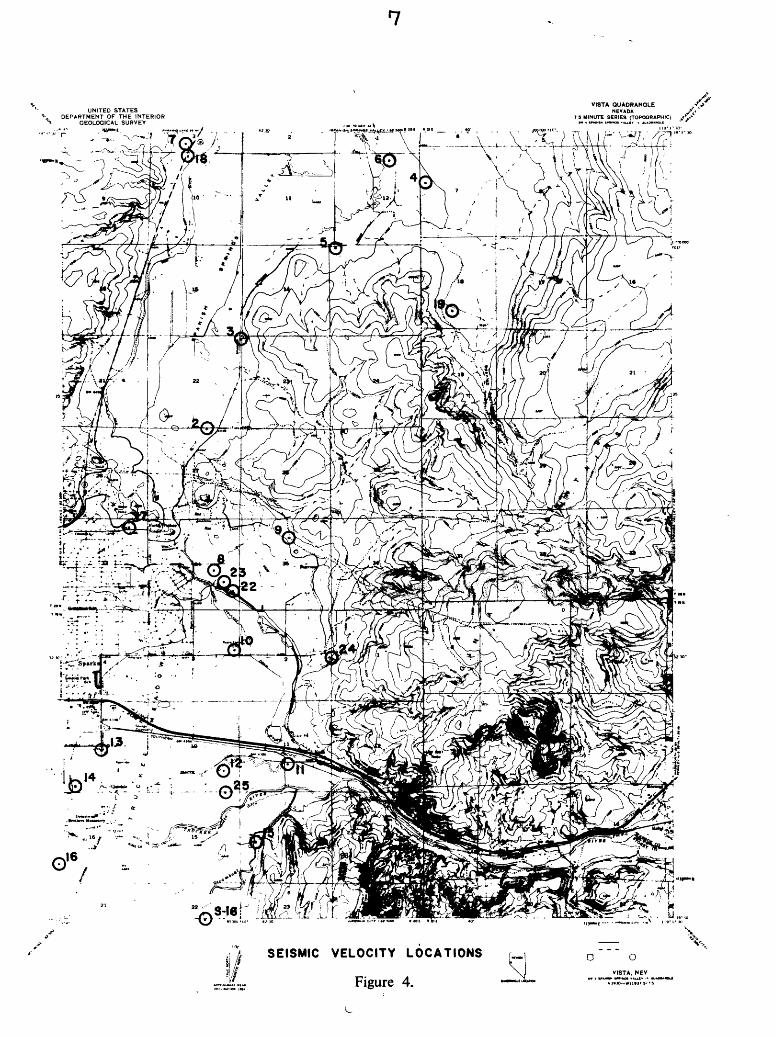
A total of 39 sites were occupied in the Steamboat and Vista 7 1/2-
minute quadrangles. Fifteen sites representing eight distinct geologic
units were measured in the Steamboat 7 1/2-minute quadrangle while the
remaining 24 measurements were obtained on ten geologic units in the Vista
7 1/2-minute quadrangle. The location of the measurement sites are shown
in Figures 3 and 4.
The selection of sites for seismic velocity measurements was based on
accessibility to the vehicle, areal extent and competency of the unit based
on prior knowledge. Multiple measurements were made on units having large
areal extent and low competency, whenever possible. Therefore, those units
which have low SH-wave velocities and large areal extent receive more atten
tion than other units, due to their incipient propensity for greater shaking
potential.

w
Point 0
SHOWN BY OASHEO LINE IN FIGURE
G1 G2 G3
\J
w
^ ^x*
G3 SHOWN BY SOLID LINE IN
, NUMBER 2 x'~Y
' 60 msec "^"""-A
lOtot-^,
G2 FIGURE
w
S^ LXiGl^fr-
l̂W- Weight of true Impluse provided G1, G2, G3, etc.
spaced every 10 feet out to G12 et 120' from plank
NUMBER 5
82 msec
NUMBER 8
107msec
NUMBER 12
135msec
Figure 1. SH - wave source orientations and first arrivals.
150 T-
100 -
CO oc o o<D CO
<P50--
20I
G5
I
1283 FT/SEC.
40 60
Distance in feet
80 100
G 12
120
Figure 2. Travel - time plot of SH - wave first arrivals for site V- 18, alluvial fan material.

cUNITED STATES
DEPARTMENT OF THE INTERIOR OEOLOCICAL SURVEY
' r2_J6
STEAMBOAT OUADRANOLENEVADA
5 MINUTE SERIES (TOPOGRAPHIC) ,f'
SEISMIC VELOCITY LOCATIONS *AiC » U 1 GCCHOGMUU. luHVCV DCMVIM COlOVAOOHUn OH WAtHfMCTON O C 3XU43
Figure 3.
UNITED STATESDEPARTMENT OF THE INTERIOR
GEOLOGICAL SURVEY
VISTA QUADRANGLENEVADA
7 3 MINUTE SERIES (TOPOGRAPHIC)
\SEISMIC VELOCITY LOCATIONS
Figure 4.
o oVISTA, NEV

-8-
Seismic velocity measurements in the Vista 7 1/2-minute quadrangle
(Appendix I) have SH-wave velocity values ranging from 594 to 867 ft/sec
for the fluvial-lacustrine deposits (Qfl) to a maximum of 4,320 ft/sec for
competent unaltered Kate Peak andesite (Tk). The low mean SH-wave values
of 714 ft/sec for Qfl deposits are not unusual for this deposit and re
flect the unconsolidated nature of the unit.
Intermediate SH-wave velocities ranging between 912 and 1411 ft/sec
were measured in alluvium, Tahoe outwash and older alluvium. Mean P-wave
velocities for the same units range from 1506 to 3125 ft/sec.
Seismic velocities for the bedrock units were taken from measurements
in the Steamboat quadrangle. However, the Washington Hill rhyolite was
measured in sec. 8, T19N, R21E; velocities for the P-wave were 2012 ft/sec
and the SH-wave was 1741 ft/sec. The highly fractured nature of the out
crop may cause the low P-wave velocity for this extrusive dome.
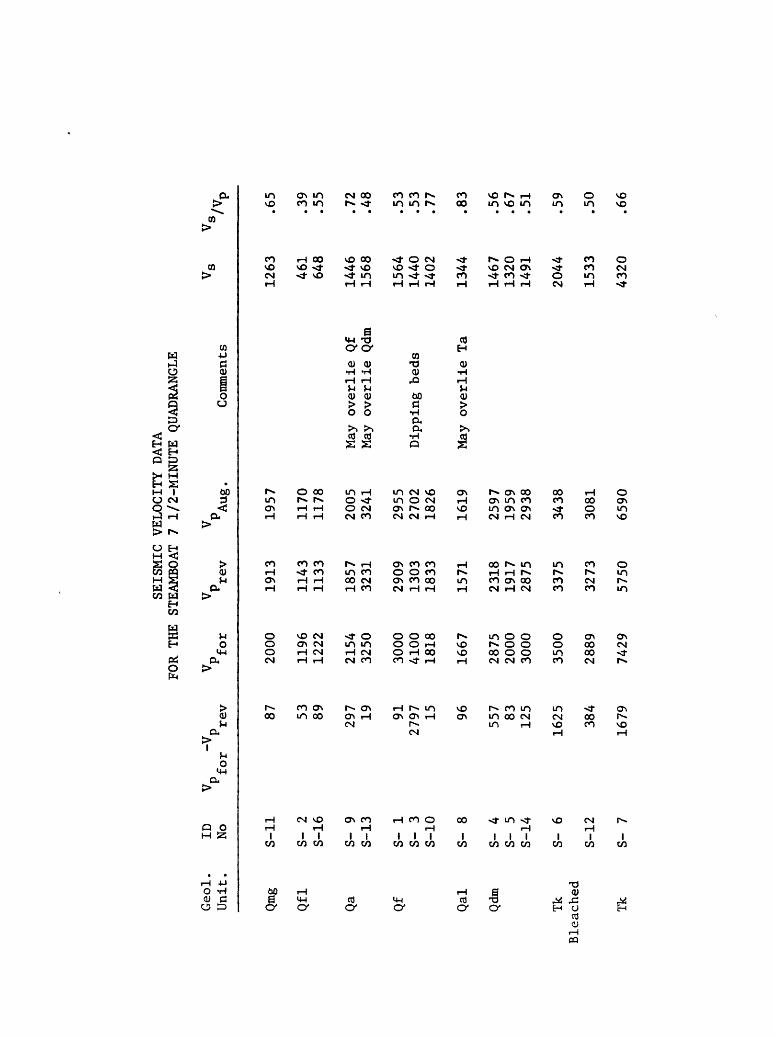
In the Steamboat 7 1/2-minute quadrangle the geologic unit with the
lowest SH-wave velocity is the fluvial-lacustrine deposit which has a
slightly lower mean velocity (555 ft/sec) than the same unit in the Vista
quadrangle (Appendix I). The variation in velocity from a range of 461-
648 ft/sec in the Steamboat 7 1/2-minute quadrangle to 594-867 ft/sec in
the Vista 7 1/2-minute quadrangle is undoubtedly due to the increased
presence of peat and intercalated organic material in the southern part
of the unit. Apparently the lowest portion of the Truckee Meadows during
the time of deposition of the fluvial-lacustrine deposits was in the
northern portion of the Steamboat 7 1/2-minute quadrangle.
Intermediate SH-wave velocities in the Steamboat 7 1/2-minute quad
rangle range from 1263 to 1507 ft/sec. Units represented by this range
in velocities are main stream gravels (Qmg), alluvium in closed basins
-9-
in the Virginia Range (Qal), Donner Lake outwash (Qdm), alluvial fan
deposits (Qf) and alluvial deposits (Qa). The P-wave velocities also
exhibit a close grouping ranging from 1957 to 2742 ft/sec.
Three seismic velocity measurements were made on Kate Peak andesite,
one measurement was made on unaltered andesite and two were made on bleached
and altered andesite. SH-wave velocities for the bleached andesite ranged
from 1533-2044 ft/sec and averaged 1789 ft/sec. The mean SH-wave velocity
for unaltered andesite was 4320 ft/sec or 2.5 times greater than the bleached
and altered andesite. The P-wave velocities have similar large variations
between altered and unaltered andesite, 3260 and 6590 ft/sec, respectively.
-10-
RIGIDITY PRODUCT
To categorize geologic units into probable (suspected) response groups
the rigidity product is computed. The rigidity product is the product of
the near-surface shear-wave (SH) velocity and the bulk density of the unit.
The values used in calculation of the rigidity products for the Steamboat
and Vista 7 1/2-minute quadrangles are presented in Tables 1 and 2*
The geologic unit having the lowest rigidity product values in both
quadrangles is the fluvial-lacustrine deposits (Qf1). The values ranged
from 599 to 1,214 using the range of SH-wave velocities and the mean density,
Values determined using the mean velocity and mean density were 722 for the
Steamboat quadrangle and 1,000 for the Vista quadrangle.
The next lowest calculated value for the rigidity product was for a
unit common to both quadrangles, the mainstream gravels (Qmg). Only one
seismic velocity measurement site was occupied in the Steamboat quadrangle
due to accessibility problems. The mean rigidity product for this unit is
1768. This value is comparable to mean values for young alluvium and allu
vial fan deposits in the Vista quadrangle, but due to the degree of satura
tion of these deposits, they are considered to be less stable than the
alluvial deposits.
Mean rigidity product values for young alluvium (Qa) range from 1,459
to 2,562. This large range in mean values for similar deposits in the two
quadrangles result from the combined effect of higher mean velocities and
densities in the Steamboat quadrangle. This disparity in rigidity products
for similar geologic materials is not surprising over such a wide area.
The number of determinations used in calculating the respective values
of velocity and density effect the calculated rigidity products. It is
readily apparent the mean of 101 density measurements is a more realistic

TABLE
1.
Rigi
dity
product
calc
ulat
ions
fo
r th
e Steamboat
7 1/
2-mi
nute
qu
adra
ngle
.
Geol.
Seismic
velocities ft/sec
Dens
ity
g/cc
Unit
No.
of
Vp
Vp
Vs
Vs
No.
of
p p
Mean Vs
x
Measurements
Rang
e Mean
Range
Mean
Measurements
Range
Mean
Range
p
gmg
gfl
ga Qf gal
Qdm
Tk bleacned
Tk
1 2 2 3 1 J 2 1
1957
1170
-117
8 11
74
2154
-323
1 26
93
1826-2955
2742
1619
1959-2938
2498
3081
-343
8 3260
6590
1263
**
461-
648
555
25
1446-1563
1507
3
1402
-156
4 1463
23
1344
2
1320
-149
1 1426
32
1533
-204
4 1789
*
4320
*
1.3-1.5
1
0.8-1.5
1
1.5-
2.0
1
1.3-1.8
1
1.5-1.7
1
1.5-
2.0
1 2
2.7-
3.0
2
.4
1642
-189
5
.3
444-
833
.7
2261-3014
.6
1902-2633
.6
2016-2285
.8
2139-2852
.0 .8
11,664-12,960
Rigi
dity
Pr
oduc
t Mean Vs x
Range
Vs x
Mean p
Mean
p
1768 722
2562
2341
2150
2567
3578
12,0
96
599-842
2458-2666
2243
-250
2
2376-2684
3066-4088
*Clark,
S. P.,
1966,
in "Handbook
of Ph
yaic
al Constants",
rev.
ed
., Geol.
Soc.
Am
. Me
m. 97
.
**Data fr
om Vista 7
1/2-minute qu
adra
ngle
.
TABL
E 2.
Rigidity pr
oduc
t calculations for
the
Vist
a 7
1/2-mlnute qu
adra
ngle
.
Geol.
Unit
gmg
Qfl
ga Qf Qto
Qdo
gfo
Qao
Tk Tw
Seis
mic
veolclties ft/sec
Density
g/cc
No.
of
Vp
Vp
Vs
Vs
No.
of
p p
Mean V
s x
Measurements
Rang
e Mean
Rang
e Mean
Meas
urem
ents
Range
Mean
Range
p
2
5 11
41-1
355
1203
59
A-86
7 71
A 11
1
5 1086-2250
1506
667-
1020
912
101
3 2154-2414
2301
12
80-1
508
1357
*
3 1144-1824
1371
736-1267
955
68
0 1
5 1662-2274
1993
1108-1548
1411
8
2 2211-4039
3125
1247-1333
1290
2
0 **
1 20
12
1741
***
1.3-1.5
1
0.9-
2.1
1
1.2-2.0
1
1.3-
1.8
1
1.2-
2.3
1 1
1.3-1.8
1
1.8
1
2.7-3.0
2
2.0-
2.3
2
.4 .4
642-
1499
.6
1094
-182
4
.6
1764
-244
2
.7
1146
-219
7
.7 .6
1834
-254
0
.8
2322
.8 .2
3482
-400
4
Rigidity Product
Mean V
s x
Range
Vs x
Mean
p Mean p
1000
832-
1214
1459
10
67-1
632
2171
2048-2413
1624
1251-2154
2258
1773-2477
2322
22
45-2
399
3830
*Data
from St
eamb
oat
quad.
**Clark, S. P.,
1966,
In "H
andb
ook
of Ph
ysic
al Co
nsta
nts,
" rev. ed
., Geol.
Soc. Am.
Mem.
97.
***0
ral
comm., Dennis Br
yan,
Me
tehe
m Engineering, Re
no.
-13-
value than the average of 3 density determinations. Similarly the mean of
5 seismic velocity measurements from one quadrangle is a more realistic
value than the average of 2 measurements in the other.
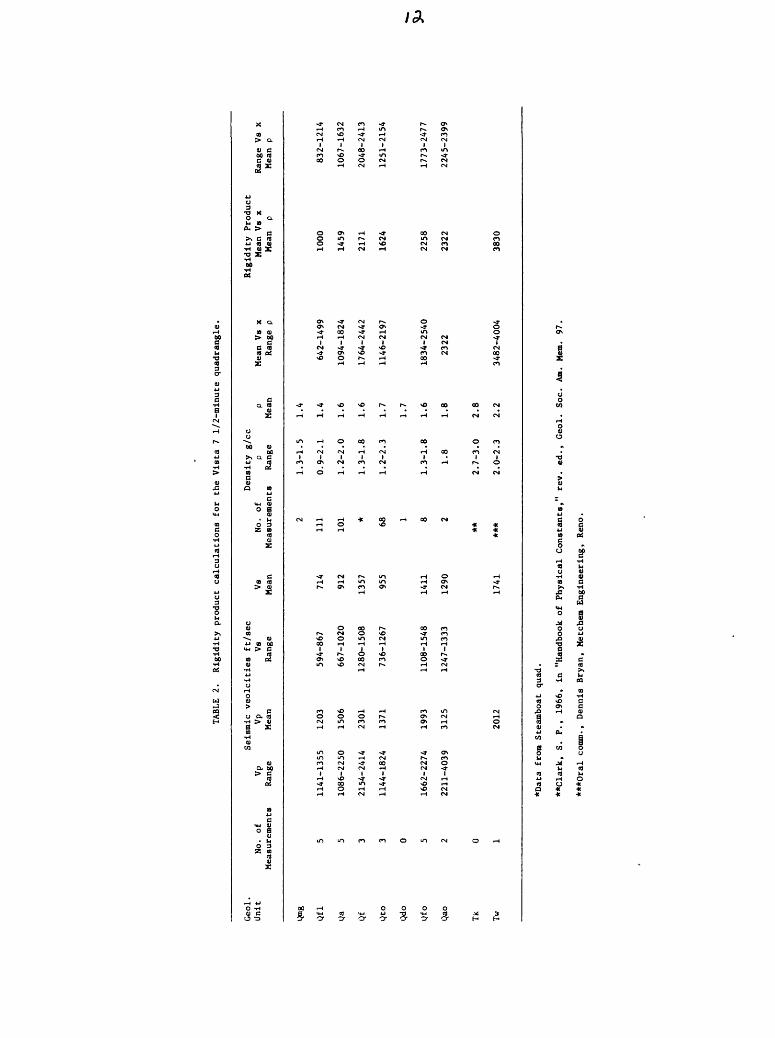
The rigidity product values for young alluvial fan deposits in both
quadrangles are similar with the mean values being 2,171 and 2,341. Other
intermediate rigidity product values include those for basin fill alluvium
(Qal) and Donner Lake age alluvium (Qdm) in the Steamboat quadrangle and
Tahoe outwash material and older alluvium and fan deposits.
The major bedrock units exhibited a wide range in rigidity product
values. The Washington Hill rhyolite (Tw) had low rigidity product values
due to slow SH-wave velocities which are probably the result of the highly
fractured nature of the rock in the near surface and the low density because
of its pumaceous texture. Altered Kate Peak andesite (Tk bleached) has a
lower rigidity product value than the Washington Hill rhyolite. The bleached
and hydrothermally brecciated andesite has many more characteristics of in
stability that are characterized by a range of rigidity product values from
intermediate rigidity to the lower part of the most stable bedrock units.
The unaltered andesites (Tk) have mean rigidity products in excess of
12,000. This value is greater than 3 times the nearest value for other
measured bedrock units. This value compares favorably with the rigidity
product values derived from Quaternary basalts in the New Empire quadrangle
which had a value of 12,480 (Trexler and Bell, 1979).

-14-
EARTHQUAKE HAZARDS MAPS
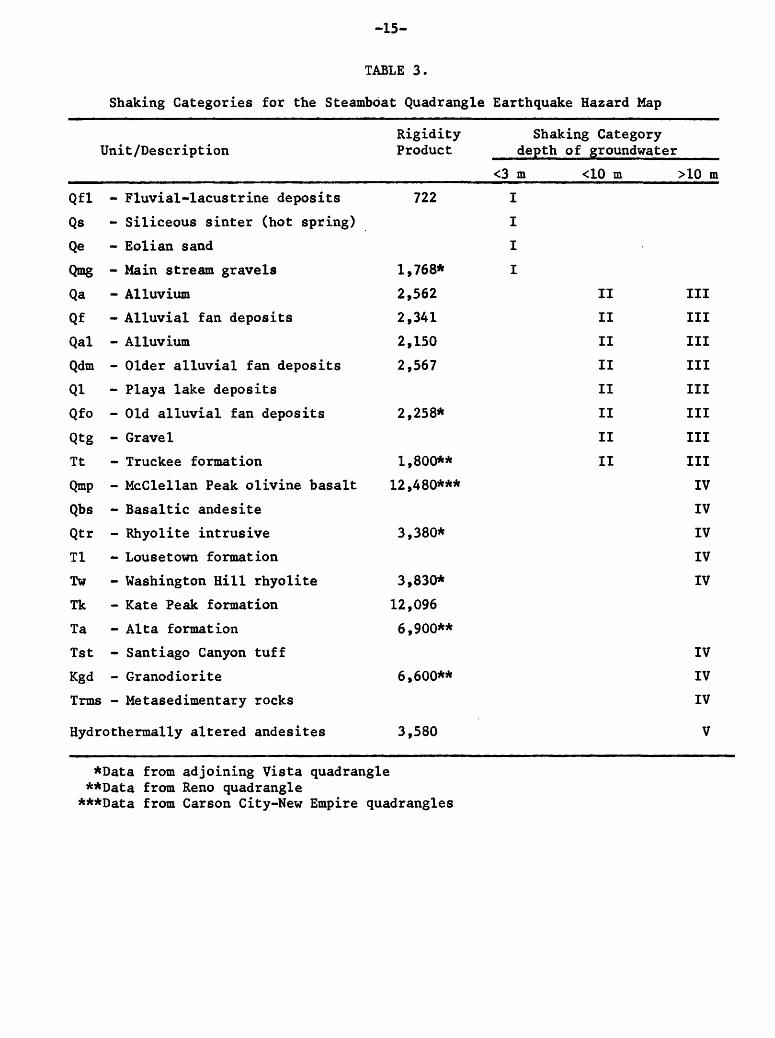
The shaking characteristics for the individual geologic units are computed
from the SH-wave velocity and the bulk density. This value has been termed the
"rigidity product" by Trexler and Bell (1979). The geologic units within the
Steamboat 7 1/2-minute quadrangle are grouped into five categories based on
suspected seismic response. The rigidity product values and shaking categories
for geologic units in the Steamboat quadrangle are presented in Table 3. The
map is Plate I in the pocket.
Geologic units with low rigidity products and saturated within 10 m (30 ft)
of the surface have the lowest ranking shaking category (low ranking =» most
severe shaking). These units include: fluvial-lacustrine deposits, mainstream
gravels, eolian sand and siliceous sinter deposited by hot springs in the Steam
boat Springs area. The rigidity product for the flucial-lacustrine deposits
(Qfl), based on two seismic velocity measurements and 25 density determination,
is 722. This is computed from SH-wave velocity of 555 ft/sec coupled with a
mean density of 1.3 g/cc. Mainstream gravel deposits which are by their nature
saturated in the near surface have higher rigidity product values based on
measurements obtained in the Vista quadrangle. These deposits are generally
thin and restricted to the present day drainage channels of the major streams.
It is doubtful that development would occur in the floodplains due to potential
flooding, they are however, included with those deposits being the most suscep
tible for seismic shaking.
The eolian sand unit (Qe) is a thin, areally restricted deposit for which
seismic velocity values are unavailable. The unconsolidated nature of these
deposits would require that they be excavated before construction. They have
been included here as having a high potential for seismic shaking so that these
-15-
TABLE 3.
Shaking Categories for the Steamboat Quadrangle Earthquake Hazard Hap
Unit /Description
Qfl - Fluvial -lacustrine deposits
Qs - Siliceous sinter (hot spring)
Qe - Eolian sand
Qmg - Main stream gravels
Qa - Alluvium
Qf - Alluvial fan deposits
Qal - Alluvium
Qdm - Older alluvial fan deposits
Ql - Playa lake deposits
Qfo - Old alluvial fan deposits
Qtg - Gravel
Tt - Truckee formation
Qmp - McClellan Peak olivine basalt
Qbs - Basaltic andesite
Qtr - Rhyolite intrusive
Tl - Louse town formation
Tw - Washington Hill rhyolite
Tk - Kate Peak formation
Ta - Alta formation
1st - Santiago Canyon tuff
Kgd - Granodiorite
Trms - Metasedimentary rocks
Hydro thermally altered andesites
Rigidity Shaking Category Product depth of groundwater
<3 m
722 I
I
I
1,768* I
2,562
2,341
2,150
2,567
2,258*
1,800**
12,480***
3,380*
3,830*
12,0966,900**
6,600**
3,580
<10 m >10 m
II III
II III
II III
II III
II III
II III
II III
II III
IV
IV
IV
IV
IV
IV
IV
IV
V
*Data from adjoining Vista quadrangle **Data from Reno quadrangle ***Data from Carson City-New Empire quadrangles
-16-
potential problems can be mitigated. The siliceous sinter deposits (Qs) are
depicted on the earthquake hazards map as having a high potential for shaking
during an earthquake. These deposits are restricted to past and present hot
spring activity in the Steamboat Springs area located in the southwest part
of the quadrangle. Construction at this site may be restricted to geothermal
generating facilities and are therefore included in the category of highest
shaking potential.
The next shaking category includes units which have rigidity products
ranging from 1800 to 2567. The values calculated for the deposits in the
Steamboat quadrangle ranged from 2150 for alluvial deposits (Qal) which
occupy closed basins in the Virginia Range to 1800 for the Truckee formation
(Tt) based on measurements from the Reno quadrangle. The seismic velocity
measurements of SH-wave velocities in the Reno quadrangle were not performed
in the same manner as the present measurements and provide uniformally low
SH-wave velocities in unconsolidated deposits.
Alluvial fan deposits had the next highest rigidity product (2341) of
the deposits comprising categories II and III. Calculated values for alluvium
of the Truckee Meadows (Qa) and older alluvial fan deposits (Qdm) have almost
identical rigidity product values of 2562 and 2567 repectively. Rigidity
product values for units in the Steamboat quadrangle were derived from
measurments of the same deposits in the Vista quadrangle for old alluvial
fan deposits. This value of 2258 is intermediate in the range of values
for this category.
The shaking category ranking of II and III are assigned to the units
described above based upon the depth to groundwater. If saturation of the
deposits occurs within 10 m (30 ft) of the surface, the lower (more severe)
shaking category is used. A category III value is assigned to the units
-17-
when the depth to groundwater exceeds 10 m (30 ft). The depth to saturated
conditions is considered important in determining the potential for differ
ential settlement in the unconsolidated deposits.
The remaining geologic units which comprise shaking categories IV and
V are bedrock units consisting of intrusive and extrusive igneous rocks and
metamorphosed sediments. Rigidity product values range from a low of 3830
for rhyolitic intrusive bodies to a value in excess of 12,000 for the Kate
Peak formation and the McClellan Peak olivine basalts. Category V is made
up of the Kate Peak formation and Alta formation, which have been hydrother-
mally altered. Rigidity product values calculated from SH-^wave velocity
measurements and bulk densities indicate that a value of approximately 3600
represents a lower value for the altered equivalents of these units. Multiple
episodes of hydrothermal brecciation have left these rocks in a highly sheared,
silicifiedcondition that resembles broken glass. Several degrees of alteration
in the andesitic rocks are apparent ranging from degradation of the feldspars
to silicification. Due to the range of physical characteristics of these
bleached and altered deposits they are assigned to shaking category V, which
has a range of potential shaking characteristics which cannot be definitely
defined. This range of potential shaking characteristics ranges from res
ponses suspected for indurated alluvium to the mid-range of unaltered
extrusive volcanic rocks.
Unaltered Kate Peak formation had the highest calculated rigidity product
within the quadrangle based on in situ SH-wave velocities and estimated bulk
density values. Other volcanic rocks such as the McClellan Peak olivine
basalt have had similar rigidity product values (12,480) determined from
measurements by Trexler and Bell (1979) in the New Empire quadrangle.
Intermediate rigidity product values for bedrock units in the quadrangle
were extrapolated from similar units in adjoining or nearby quadrangles. The
-18-
rigidity product values for the rhyolite intrusive and Washington Hill rhyo-
lite were based on measurements made in the adjoining quadrangle. Values of
6,600 and 6,900 are used for granodiorite and Alta formation based on seismic
velocity measurements made in the Reno quadrangle. As mentioned previously,
values derived by earlier investigators are consistantly lower than rigidity
product values determined during studies in the Carson City - New Empire
quadrangles and the present studies.
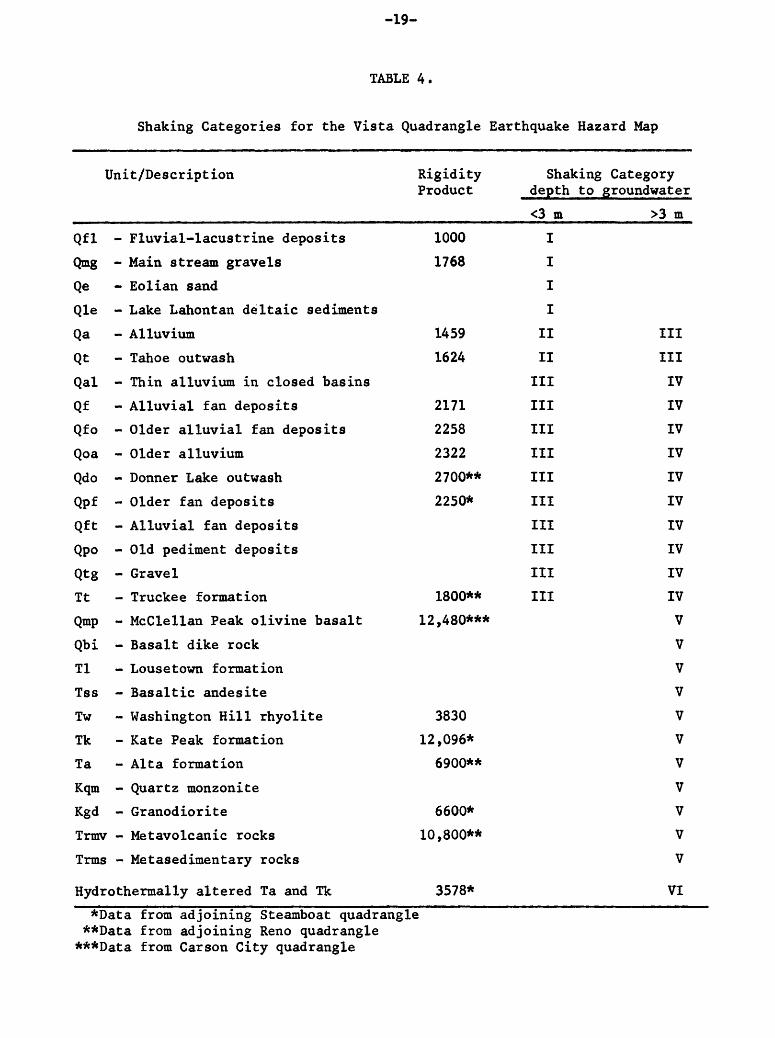
The shaking categories for geologic units in the Vista quadrangle are
similar to those of the Steamboat quadrangle, except that an additional cate
gory has been added to reflect the lower values of rigidity product calculated
for the alluvium and Tahoe outwash (table 4). The map is present as Plate II
(in pocket). Seismic velocity measurements for these geologic units were
medial between the fluvial-lacustrine deposits, excluding mainstream gravels
which present a special case due to the degree of saturation, and the other
alluvial, pediment and late Tertiary sedimentary deposits. The later units
have rigidity products ranging from 2171 to 2700. This does not include the
1800 rigidity product value calculated for the Truckee formation in the Reno
quadrangle based on seismic velocity measurements that were made with differ
ent instrumentation and techniques than those presented in this report and
following procedures developed in the Carson City, New Empire and South Lake
Tahoe quadrangles (Trexler and Bell, 1979).
Again the mainstream gravels (Qmg) are included in the most severe
shaking category (I) because of the saturated conditions which are charac
teristic of their recency and environment of deposition. These deposits
are confined to the active channel of the Truckee River, which traverses
the quadrangle near the southern boundary and in Long Valley Creek at its
confluence with the Truckee River near the southeastern corner of the
quadrangle.
-19-
TABLE 4.
Shaking Categories for the Vista Quadrangle Earthquake Hazard Map
Unit/Description Rigidity Product
Qfl - Fluvial-lacustrine deposits
Qmg - Main stream gravels
Qe - Eolian sand
Qle - Lake Lahontan deltaic sediments
Qa - Alluvium
Qt - Tahoe outwash
Qal - Thin alluvium in closed basins
Qf - Alluvial fan deposits
Qfo - Older alluvial fan deposits
Qoa - Older alluvium
Qdo - Donner Lake outwash
Qpf - Older fan deposits
Qft - Alluvial fan deposits
Qpo - Old pediment deposits
Qtg - Gravel
Tt - Truckee formation
Qmp - McClellan Peak olivine basalt
Qbi - Basalt dike rock
Tl - Lousetown formation
Tss - Basaltic andesite
Tw - Washington Hill rhyolite
Tk - Kate Peak formation
Ta - Alt a formation
Kqm - Quartz monzonite
Kgd - Granodiorite
Trmv - Metavolcanic rocks
Trms - Hetasedimentary rocks
Hydrothermally altered Ta and Tk
1000
1768
1459
1624
2171
2258
2322
2700**
2250*
1800**
12,480***
3830
12,096*
6900**
6600*
10,800**
3578*
Shaking Category depth to groundwater
<3 m
I
I
I
I
II
II
III
III
III
III
III
III
III
III
III
III
>3 m
III
III
IV
IV
IV
IV
IV
IV
IV
IV
IV
IV
V
V
V
V
V
V
V
V
V
V
V
VI
*Data from adjoining Steamboat quadrangle **Data from adjoining Reno quadrangle ***Data from Carson City quadrangle
-20-
As mentioned above, the young alluvial deposits and Tahoe outwash
deposits exhibit rigidity products intermediate with the lowest values and
other alluvial deposits. These lower values necessitated an additional
shaking category. Based upon the physical properties of these units it is
not anticipated that they would react as violently to seismic loading as the
finer grained fluvial-lacustrine deposits or the unconsolidated and saturated
mainstream gravels. The alluvium and outwash units are identified as shaking
category II when saturation due to groundwater is within 3m (10 ft) of sur
face and are identified as category III when the depth to groundwater is
greater than 3 m (10 ft).
Unconsolidated deposits and sediments of the Truckee formation with
rigidity products in the range of 1800-2700 are included in shaking category
III when the depth to groundwater is less than 3 m (10 ft). When conditions
of saturation occur at depths greater than 3 m (10 ft) the units included in
shaking category III are elevated to shaking category IV. It is anticipated
that the response of the units to seismic loading in a dewatered condition
in the near surface will be less severe than when conditions of saturation
exist.
The bedrock units which are not altered comprise shaking category V.
This category will have the least severity of shaking induced by an earth
quake. The rigidity products range from 3,830 for the Washington Hill
rhyolite to 12,480 for olivine basalt.
The hydrothermally altered andesites are not as extensive in the Vista
quadrangle. The altered rocks are included in shaking category VI. Their
response to earthquake stresses will vary over a wide range because their
physical properties vary greatly. Silicification is locally common causing
resistant ridges and knobs, whereas other altered rocks are loose and friable
and will have more severe shaking characteristics than the silicified rock.
-21-
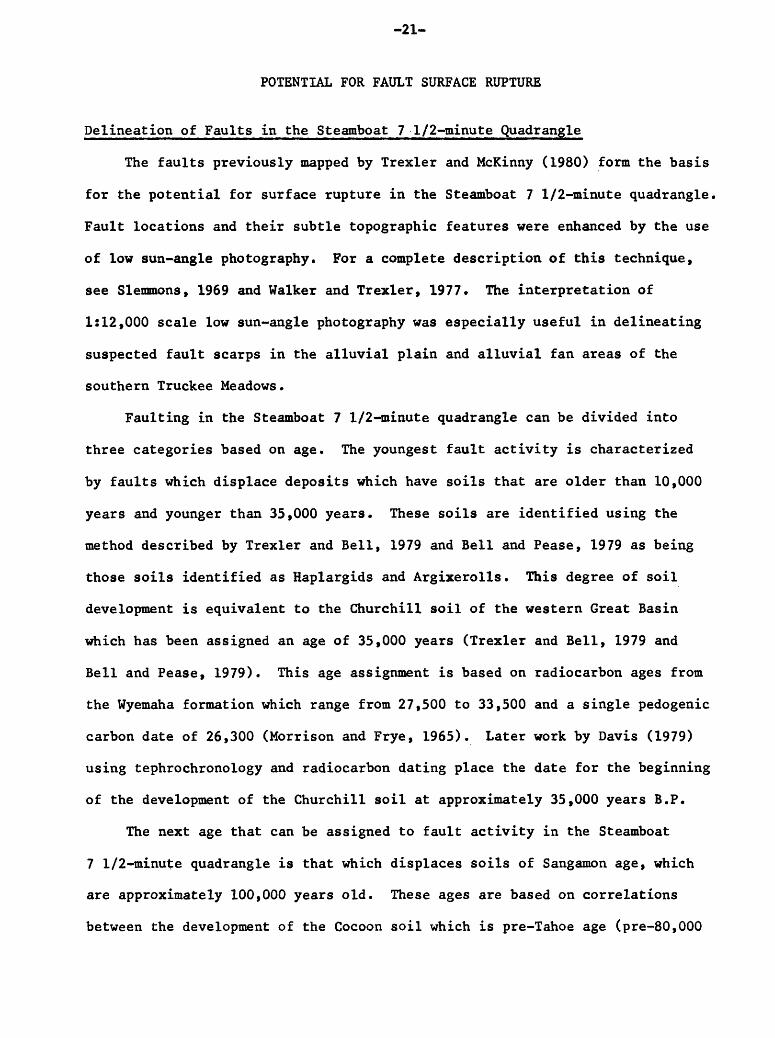
POTENTIAL FOR FAULT SURFACE RUPTURE
Delineation of Faults in the Steamboat 7 1/2-minute Quadrangle
The faults previously mapped by Trexler and McKinny (1980) form the basis
for the potential for surface rupture in the Steamboat 7 1/2-minute quadrangle,
Fault locations and their subtle topographic features were enhanced by the use
of low sun-angle photography. For a complete description of this technique,
see Slemmons, 1969 and Walker and Trexler, 1977* The interpretation of
1:12,000 scale low sun-angle photography was especially useful in delineating
suspected fault scarps in the alluvial plain and alluvial fan areas of the
southern Truckee Meadows.
Faulting in the Steamboat 7 1/2-minute quadrangle can be divided into
three categories based on age. The youngest fault activity is characterized
by faults which displace deposits which have soils that are older than 10,000
years and younger than 35,000 years. These soils are identified using the
method described by Trexler and Bell, 1979 and Bell and Pease, 1979 as being
those soils identified as Haplargids and Argixerolls. This degree of soil
development is equivalent to the Churchill soil of the western Great Basin
which has been assigned an age of 35,000 years (Trexler and Bell, 1979 and
Bell and Pease, 1979). This age assignment is based on radiocarbon ages from
the Wyemaha formation which range from 27,500 to 33,500 and a single pedogenic
carbon date of 26,300 (Morrison and Frye, 1965). Later work by Davis (1979)
using tephrochronology and radiocarbon dating place the date for the beginning
of the development of the Churchill soil at approximately 35,000 years B.P.
The next age that can be assigned to fault activity in the Steamboat
7 1/2-minute quadrangle is that which displaces soils of Sangamon age, which
are approximately 100,000 years old. These ages are based on correlations
between the development of the Cocoon soil which is pre-Tahoe age (pre-80,000
-22-
years). Based on continental correlations a 100,000 year date for a major
interpluvial is apparent, which would equate with development of a mature
soil such as the Cocoon. Correlations between the Carson Sink and the
Truckee Meadows is based on the work of Birkeland, 1968 and Hock, 1972 who
describe the relationship between glacial outwash terraces and alluvial sur
faces with similar units and surfaces in the Lahontan sequence.
Other faults in the Steamboat quadrangle are post-Tertiary in age.
Based on slope morphology, none of the faults appear to be Pleistocene age
or younger. Trenching of the most youthful appearing scarps in the Steam
boat 7 1/2-minute quadrangle based on morphology, indicated that the last
movement along these faults occurred during mid-Pleistocene time (Trexler
and Pease, 1980). Specific areas of fault activity are discussed below
and are indicated on the accompanying maps.
Area 1: Steamboat Springs
Faults in this area displace Haplargid and Argixeroll soils. These
soil types are equivalent to the Churchill soil in the western Great Basin.
This indicates that the surface is not more than 35,000 years old. The
faults are all in bedrock and the most westerly of the faults has relative
displacement with the westside down.
Area 2: Brown-Washoe School
Three faults in the immediate area either displace or bound Donner Lake
age alluvium. A similar relationship occurs along the fault located approxi
mately 1 mile south-southeast of Brown-Washoe School. Soils developed on the
alluvium are Durargids. This type of soil development indicates the surface
is older than 35,000 years and is probably equivalent to the Cocoon soil
which is approximately 100,000 years old. Therefore, these faults are
early to mid-Pleistocene in age.

-23-
Area 3:
The two faults in this area bound Dormer Lake age alluvium and have a
similar relationship as the faulting in Area 2. In each case the older
alluvial material is up on the southeast side relative to the northwest.
Soils developed on the surfaces are Durargids indicating an age of mid-
Pleistocene for faulting.
Area 4: Virginia Foothills
The westernmost fault in this area juxtaposes alluvium and bedrock;
the other faults displace Alta andesite and granodiorite. Soils developed
on the basement rocks are Halargids, indicating that the surface on which
they are developed is not older than 35,000 years. The alluvial-bedrock
fault is also covered with Haplargid soils indicating a late Pleistocene
age.
Area 5:
Faults in this area displace alluvial fan deposits that have Haplargid
soils. Scarp morphology of the faults is similar to those faults which were
trenched three miles to the north. Based on soil development and scarp mor
phology, the faults are late Pleistocene in age.
Area 6:
The fault along Miraloma Road was trenched during the previous contract
period. The fault is pre-soil and since the soil is a Durargid the fault is
early to mid-Pleistocene in age. The range bounding faults in this area
have Haplargid soil over the scarps indicating a late Pleistocene age for
faulting. The bedrock alluvium faults in this area and to the south are
apparently late Pleistocene in age, while faults further to the north have
Durargid soils covering the scarps. This would indicate that the faults to
-24-
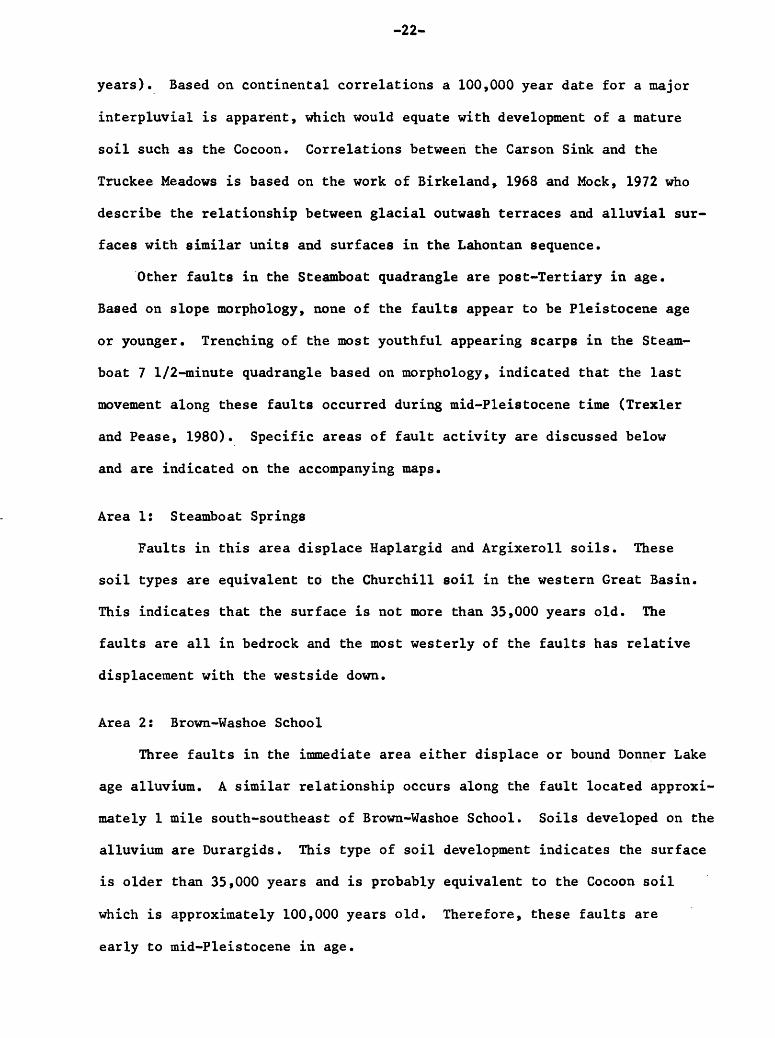
the north are older. Trenching at two locations along a fault segment that
cuts alluvial fan deposits in the SW^ of section 23, T19N, R20E shows that
the fault is pre-soil and that the soil being a Durargid indicates that
faulting is early to mid-Pleistocene in age.
Delineation of Faults in the Vista 7 1/2-minute Quadrangle
The faults previously mapped by Trexler and Pease (1980) form the basis
for the potential for surface rupture in the Vista 7 1/2-minute quadrangle.
Low sun-angle photography was flown over the northern portion of the quad
rangle at a scale of 1:12,000. Based on scarp morphology, the faults in
the major bedrock units appear to be older than 12,000 years.
The northeast trending faults in the east-central portion of the quad
rangle are subparallel to the Olinghouse fault located 16 miles to the
northeast. Scarp morphology indicates movement along this segment of the
fault occurred in 1869 (Sanders and Slemmons, 1979). They indicate that
maximum fault length and maximum fault displacement to earthquake magnitude
relations correspond to an earthquake of about magnitude 7. Based on inter
pretation of low sun-angle photography and field mapping, evidence of recent
movement along any of the northeast trending faults in the Vista quadrangle
was not found.
Area 1:
The fault which bounds the bedrock of the Virginia Range in the southern
portion of the quadrangle displaces older alluvial fan material in section 14
which has a Durargid soil developed on the surface. This relationship indi
cates that the age of last movement is probably mid-Pleistocene.

-25-
Area 2:
The northwest trending fault at this location bounds deposits of Donner
Lake outwash. The soils developed on these surfaces are a Durargid and a
Haplargid. As indicated previously, the age of the surfaces are approxi
mately 100,000 and 35,000 years old, respectively.
Area 3:
The alluvial fans along the west side of Spanish Spring Valley are
younger than the fans on the east side of the valley. The difference in
age is the result of faulting along the west side. Faulting and uplift of
the range provide renewed deposition and fan development. The age of the
fan surfaces based on soil development range from Holocene to Sangamonian
(12,000 to 35,000 years B.P.), since the oldest soils developed on the fan
surfaces are Haplargid and Argixeroll types.
Area 4:
Air photo interpretation indicated that the fault trending north-
northwest-south-southeast in Spanish Springs Canyon displaces older fan
deposits in sec. 19, T20N, R21E. These deposits have a Durargid soil
developed on the surface, which indicates the surface is early to mid-
Pleistocene in age. The scarp morphology tends to confirm this age of
last movement.

REFERENCES
Bell, J.W. and Pease, R.C. (1979)Soil stratigraphy as a technique for faultActivity Assessment in the Carson City area, Nevada: U.S. Geol. Survey open-file rpt. 80-801.
Birkeland, P..W. (1968) Correlation of Quaternary stratigraphy of the SierraNevada with that of Lake Lahontan area, in Morrison, R.B. and Wright, H.E., eds. Means of correlation of Quaternary successions: Proc., VII Congress, Internat. Assoc. for Quat. Res., v. 8, p. 469-500.
Davis, J.O. (1978) Quaternary tephrachronology of the Lake Lahontan area, Nevada and California: Nev. Arch. Survey Res. Paper No. 7, 137 p.
Medvedev, S.V. (1965) Engineering seismology: U.S. Department of Commerce, Nat. Tech. Info. Serivce, Rept. TT65-50011, 260 p.
Mock, R.G. (1972) Correlation of land surfaces in the Truckee River Valley between Reno and Verdi, Nevada: Univ. of Nevada, Reno, unpub. M.S. thesis.
Morrison, R.B. and Frye, J.C. (1965) Correlation of the middle and lateQuaternary successions of the Lake Lahontan, Lake Bonneville, Rocky Mountain (Wasatch Range), southern Great Plains, and eastern Midwest areas: Nev. Bur. Mines and Geol. Rept. 9, 45 p.
Sanders, C. D. and Slemmons, D.B. (1979) Recent crustal movements in the central Sierra Nevada - Walker Lake region of California - Nevada: Part III, the Olinghouse fault zone. Tectonphysics, 52: 585-597.
Trexler, D.T. and Bell, J.W. (1979) Earthquake Hazard maps of Carson City, New Empire and South Lake Tahoe quadrangles. Final Report U.S. Geol. Survey grant no. 14-08-0001-G-494.
Trexler, D.T. and McKinny, R.F. (1980) Geologic map Steamboat quadrangle, Nevada: U.S. Geol. Survey open-file rpt.
Trexler, D.T. and Pease, R.C. (1980) Geologic map Vista quadrangle, Nevada: U.S. Geol. Survey open-file rpt.

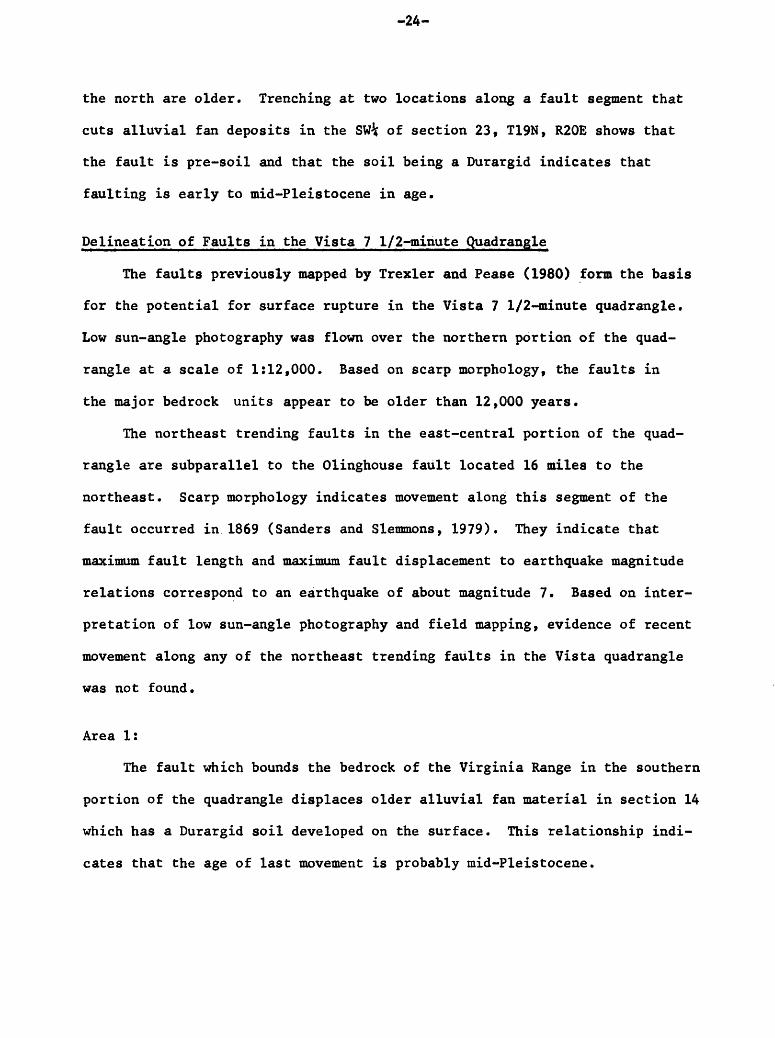
APPENDIX
SEISMIC VE
LOCI
TY DA
TA
FOR
THE VISTA 7
1/2-
MINU
TE QU
ADRA
NGLE
Geol
. Un
it
Qfl
Qa Qf Qto
Qfo
Qao
ID
No
V-ll
V-12
V-15
V-25
S-16
V- 2
V- 8
V-10
V-22
V-23
V- 7
V-17
V-18
V-13
V-14
V-16
V- 3
V- 5
V- 9
V-19
V-24
V- 4
V- 6
VP
~Vp
for
rev 20 143 33
238 89 36
113 15
146
388 28
581 99 11 25 47 454
702
158
500
526 22
650
Vpfor
1176
1083
1158
1233
1222
1100
1030
1122
2035
2444
2428
2444
2286
1150
1133
1167
1435
2625
2158
2000
1964
2222
4364
VP re
v
1196
1226
1125
1471
1133
1136
1143
1106
1889
2056
2400
1863
2385
1139
1158
1120
1889
1923
2000
2500
1438
2200
3714
VpAug.
1186
1155
1141
1355
1178
1118
1086
1114
1962
2250
2414
2154
2335
1824
1146
1144
1662
2274
2079
2250
1701
2211
4039
vs
Comm
ents
867
594
Surface mu
dcra
cked
745
648
May overlie
Qfo
667
1020 838
May overlie
Qdo
978
1058
1508
May
overlie
Ta
1280
Underlying Qa
1283
1267 863
736
Overlying
Ta
1108
1548
Overlying
Ta1433
1520
1333
Clos
e to Qa
1247
V*/Vp .73
.52
.55
.55
.60
.94
.75
.50
.47
.62
.59
.55
.69
.75
.64
.67
.68
.64
.87
.60
.31
TwV-20
198
1913
2111
2012
1741
85
SEISMIC
VELOCITY DA
TA
FOR T
HE STEAMBOAT
7 1/
2-MI
NUTE
QUADRANGLE
Geol
. Un
it.
Qmg
Qfl
Qa Qf Qal
Qdm
Tk
Blea
ched
Tk
ID No S-ll
S- 2
S-16
S- 9
S-13
S- 1
S- 3
S-10
S- 8
S- 4
S- 5
S-14
S- 6
S-12
S- 7
V -V
p p
for
rev 87 53
89 297 19 91
2797
15 96 557 83
125
1625
384
1679
for
2000
1196
12
22
2154
3250
3000
4100
1818
1667
2875
2000
3000
3500
2889
7429
V re
v
1913
1143
11
33
1857
32
31
2909
13
03
1833
1571
2318
19
17
2875
3375
3273
5750
vpAug.
Comm
ents
1957
1170
1178
2005
May
overlie
Qf
3241
May
overlie
Qdm
2955
2702
Dipp
ing
beds
1826
1619
Ma
y overlie
Ta
2597
1959
2938
3438
3081
6590
vs 1263 461
648
1446
1568
1564
1440
14
02
1344
1467
1320
1491
2044
1533
4320
Vs/v
p
.65
.39
.55
.72
.48
.53
.53
.77
.83
.56
.67
.51
.59
.50
.66
Recommended