Embed Size (px)
Citation preview
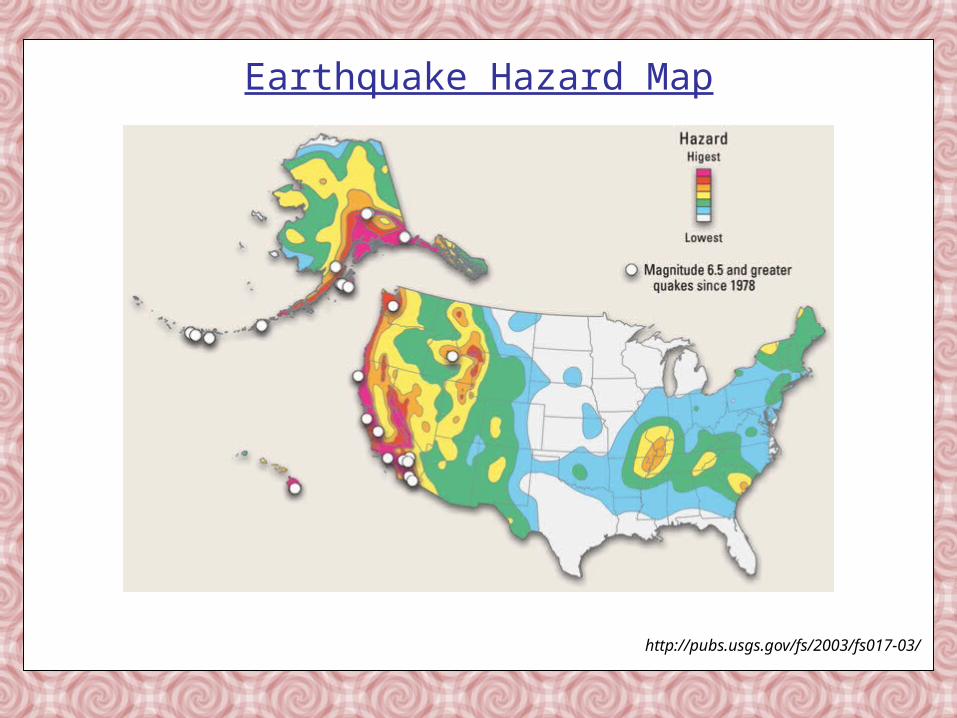
Earthquake Hazard Map
http://pubs.usgs.gov/fs/2003/fs017-03/
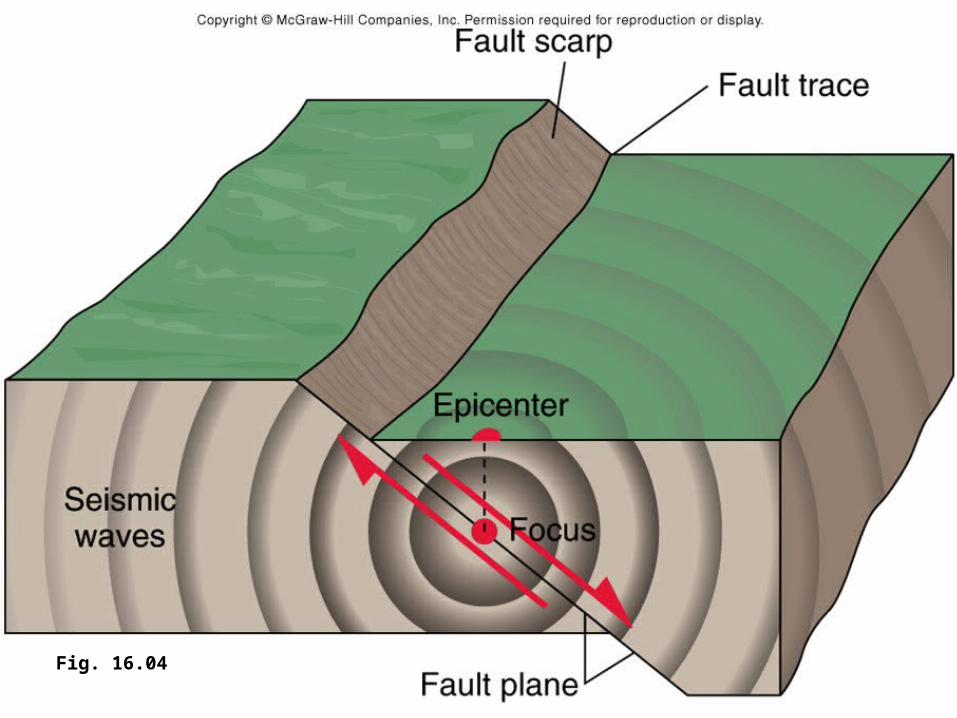
Fig. 16.04
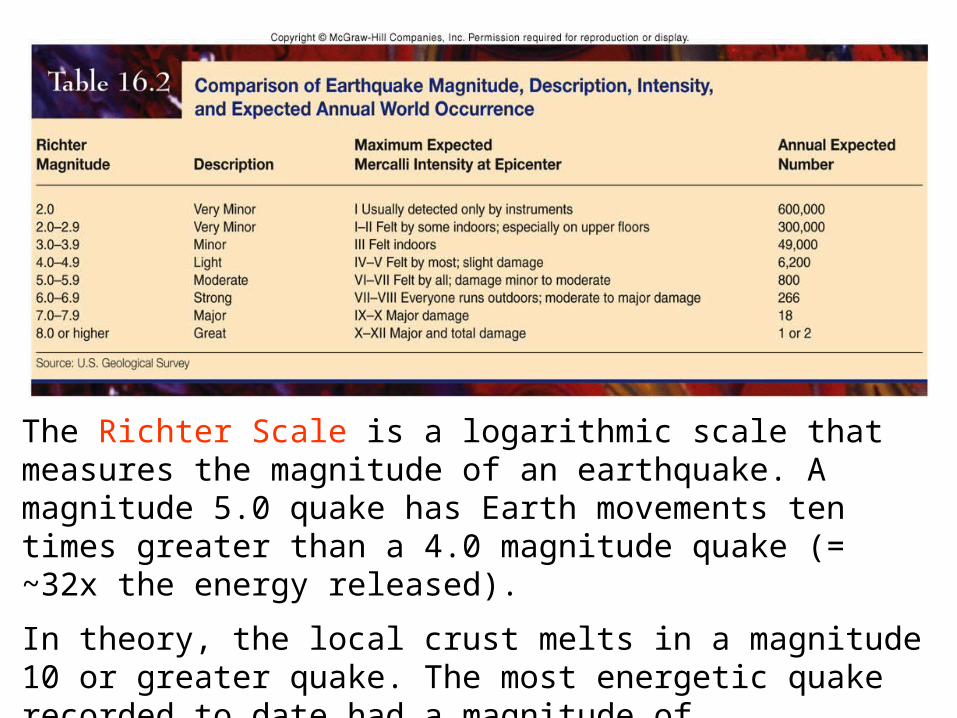
The Richter Scale is a logarithmic scale that measures the magnitude of an earthquake. A magnitude 5.0 quake has Earth movements ten times greater than a 4.0 magnitude quake (= ~32x the energy released).
In theory, the local crust melts in a magnitude 10 or greater quake. The most energetic quake recorded to date had a magnitude of approximately 9.0.
http://earthquake.usgs.gov/regional/world/most_destructive.php
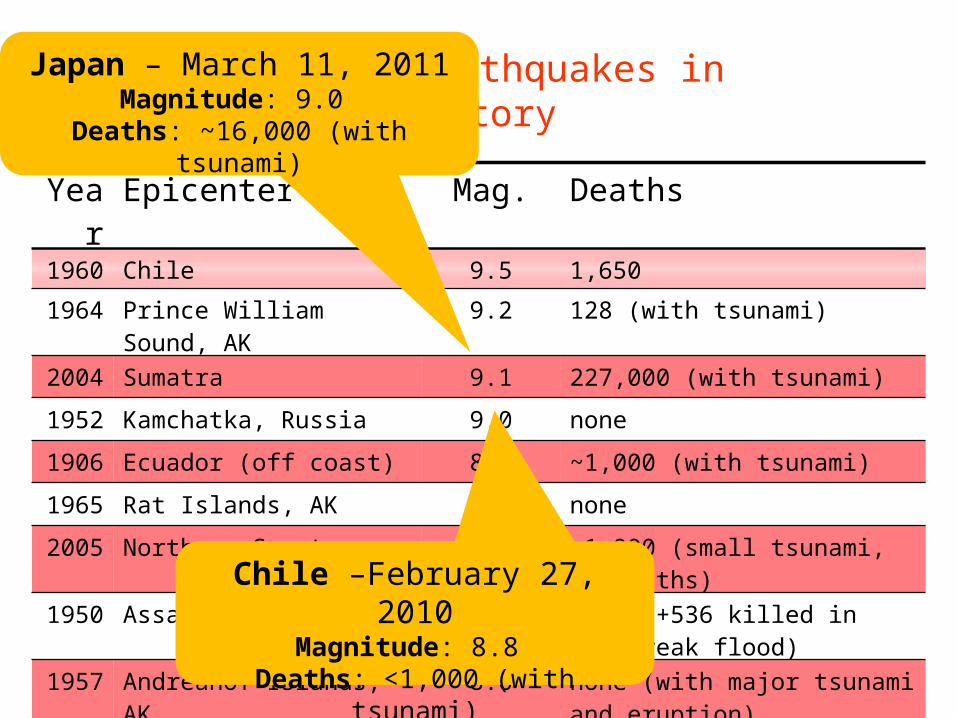
Largest Earthquakes in History
Year Epicenter Mag. Deaths1960 Chile 9.5 1,650
1964 Prince William Sound, AK 9.2 128 (with tsunami)
2004 Sumatra 9.1 227,000 (with tsunami)
1952 Kamchatka, Russia 9.0 none
1906 Ecuador (off coast) 8.8 ~1,000 (with tsunami)
1965 Rat Islands, AK 8.7 none
2005 Northern Sumatra 8.6 ~1,000 (small tsunami, no deaths)
1950 Assam, Tibet 8.6 ~780 (+536 killed in dam-break flood)
1957 Andreanof Islands, AK 8.6 none (with major tsunami and eruption)Chile –February 27, 2010Magnitude: 8.8
Deaths: <1,000 (with tsunami)
Japan – March 11, 2011Magnitude: 9.0
Deaths: ~16,000 (with tsunami)
http://earthquake.usgs.gov/regional/world/most_destructive.php
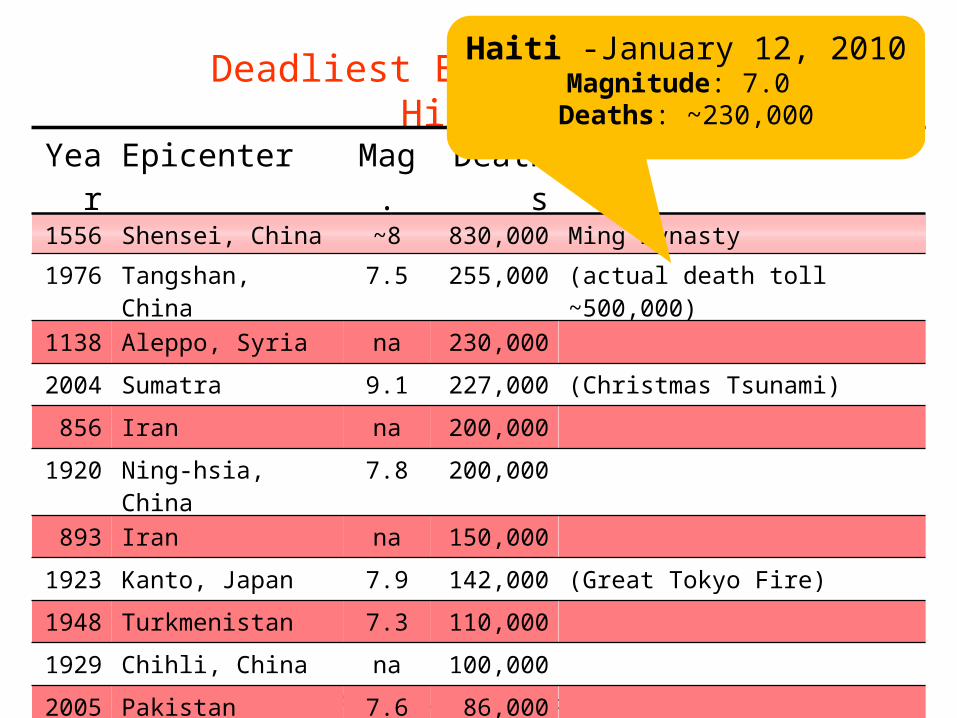
Deadliest Earthquakes in History
Year Epicenter Mag. Deaths1556 Shensei, China ~8 830,000 Ming Dynasty
1976 Tangshan, China 7.5 255,000 (actual death toll ~500,000)
1138 Aleppo, Syria na 230,000
2004 Sumatra 9.1 227,000 (Christmas Tsunami)
856 Iran na 200,000
1920 Ning-hsia, China 7.8 200,000
893 Iran na 150,000
1923 Kanto, Japan 7.9 142,000 (Great Tokyo Fire)
1948 Turkmenistan 7.3 110,000
1929 Chihli, China na 100,000
2005 Pakistan 7.6 86,000
Haiti -January 12, 2010Magnitude: 7.0
Deaths: ~230,000
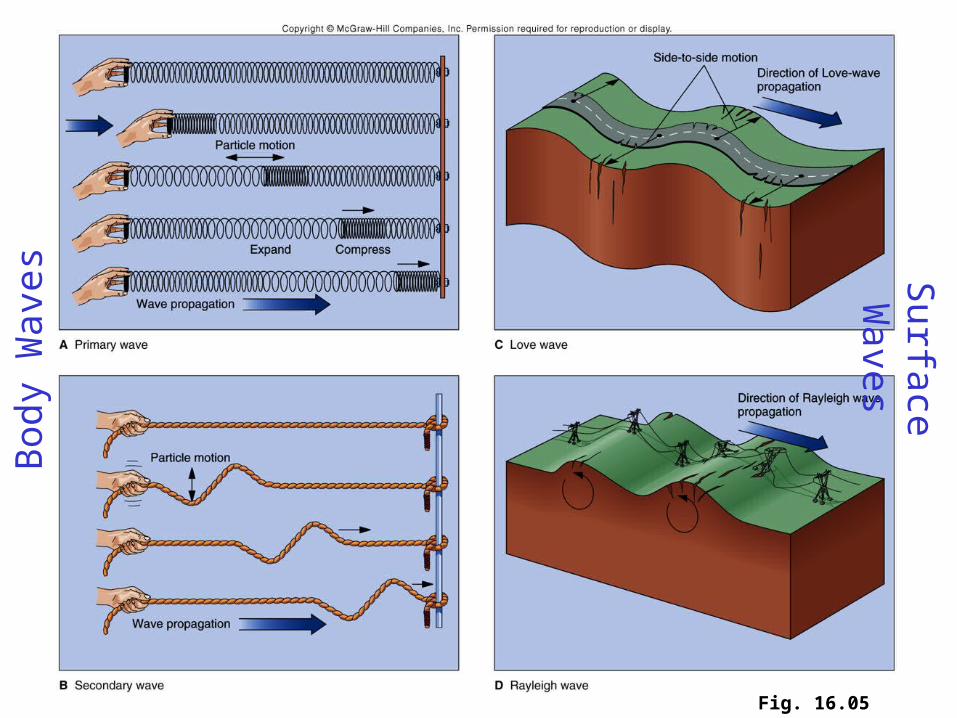
Fig. 16.05
Bod
y W
aves
Surface W
aves
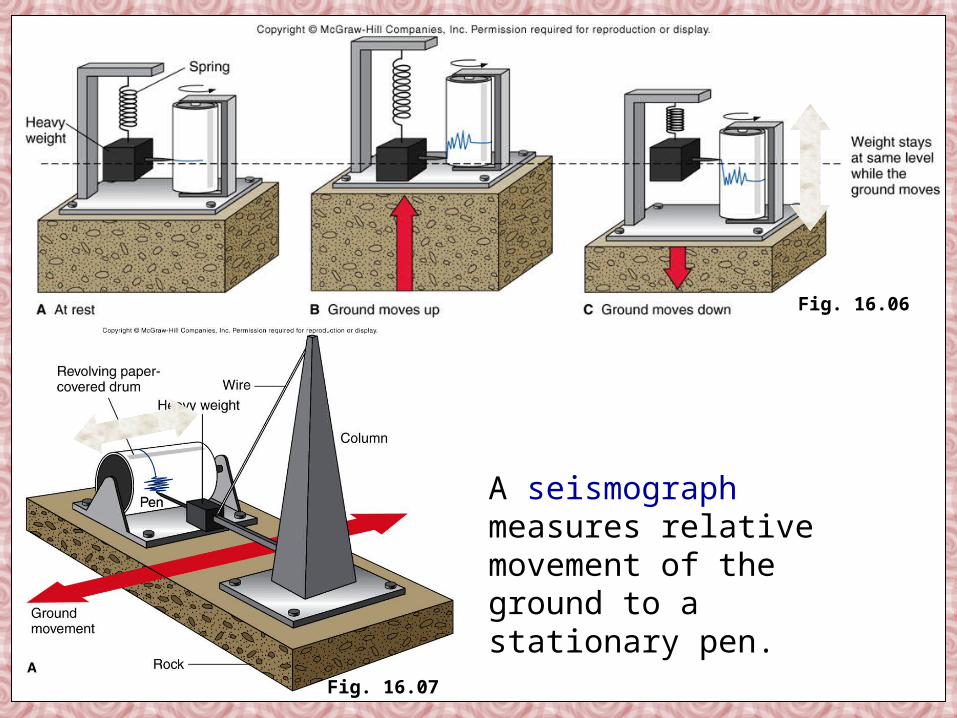
Fig. 16.06
Fig. 16.07
A seismograph measures relative movement of the ground to a stationary pen.
http://www.gly.uga.edu/railsback/GeologicalDiagrams1.html
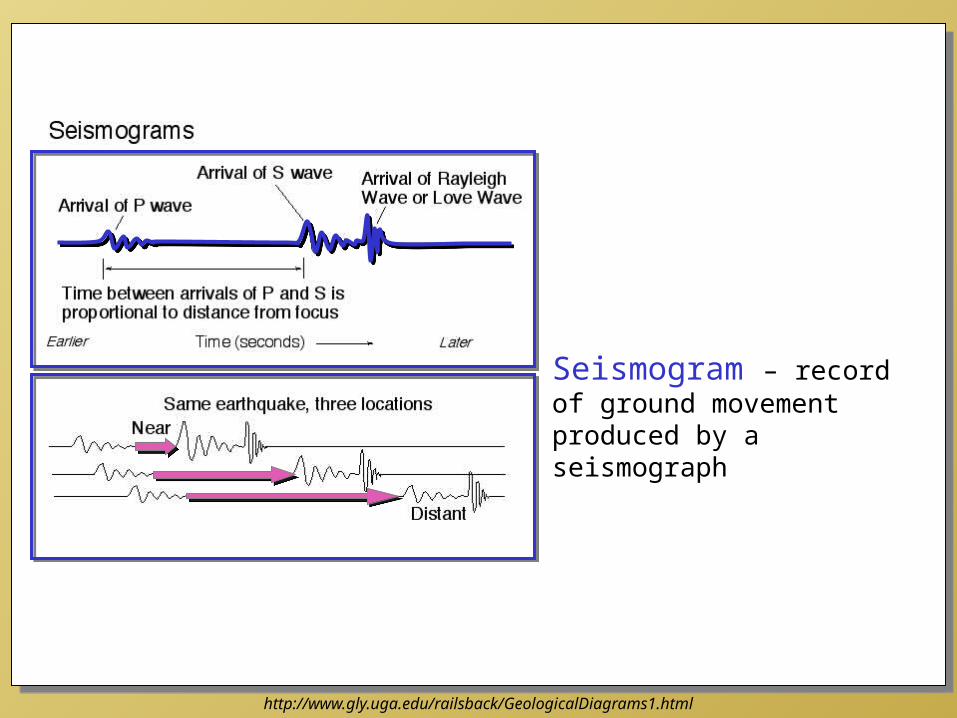
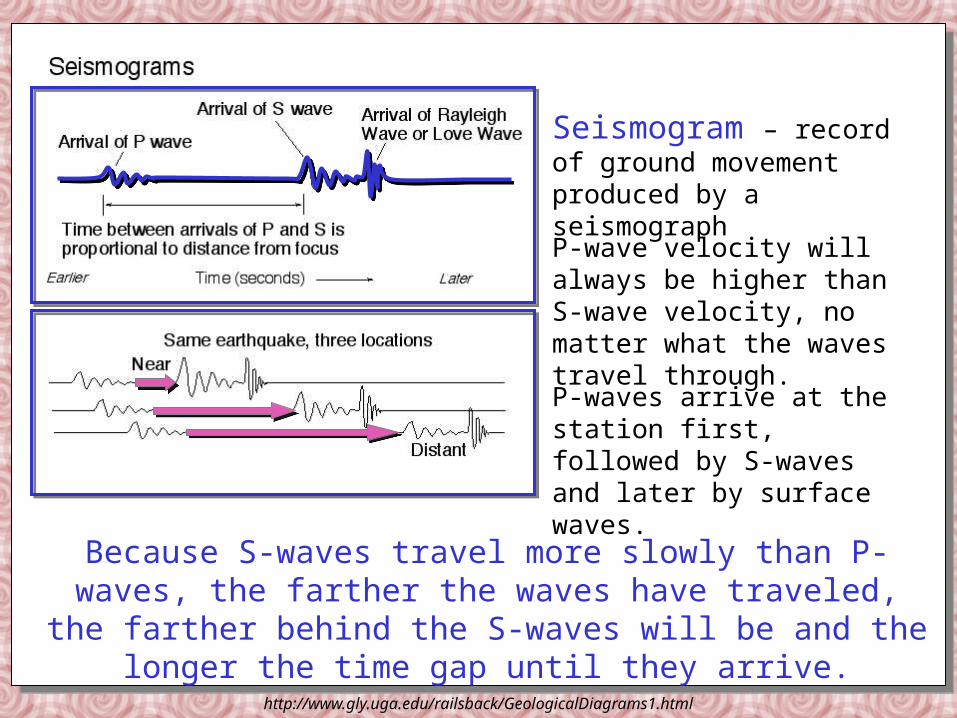
Seismogram – record of ground movement produced by a seismograph
http://www.gly.uga.edu/railsback/GeologicalDiagrams1.html
Seismogram – record of ground movement produced by a seismograph
P-waves arrive at the station first, followed by S-waves and later by surface waves.
Because S-waves travel more slowly than P-waves, the farther the waves have traveled, the farther behind the S-waves will
be and the longer the time gap until they arrive.
P-wave velocity will always be higher than S-wave velocity, no matter what the waves travel through.
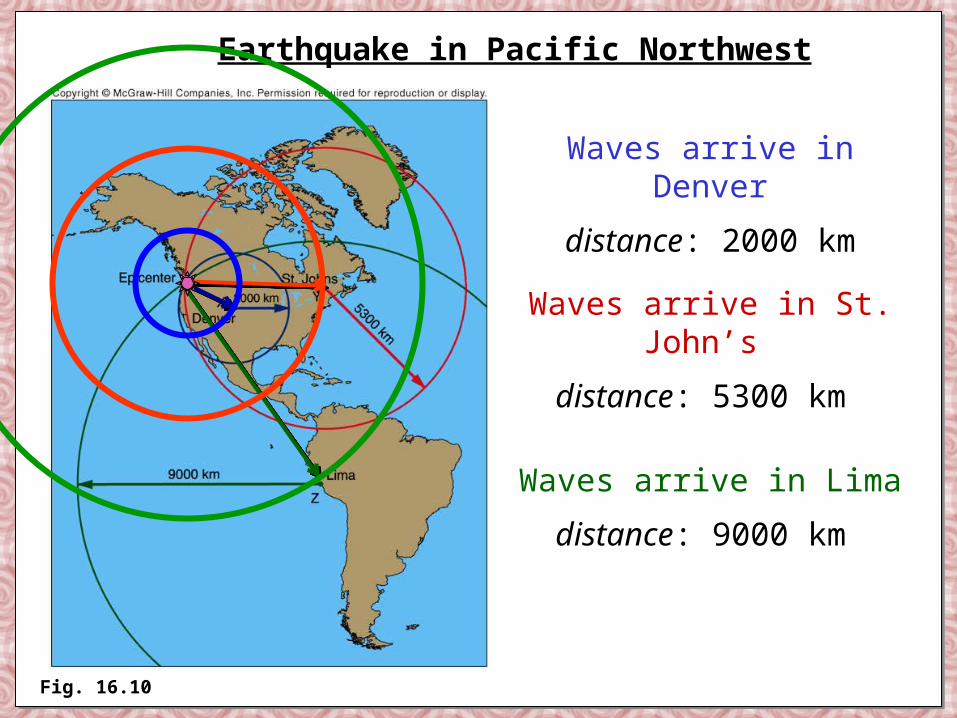
Fig. 16.10
Earthquake in Pacific Northwest
Waves arrive in Denver
distance: 2000 km
Waves arrive in St. John’s
distance: 5300 km
Waves arrive in Lima
distance: 9000 km
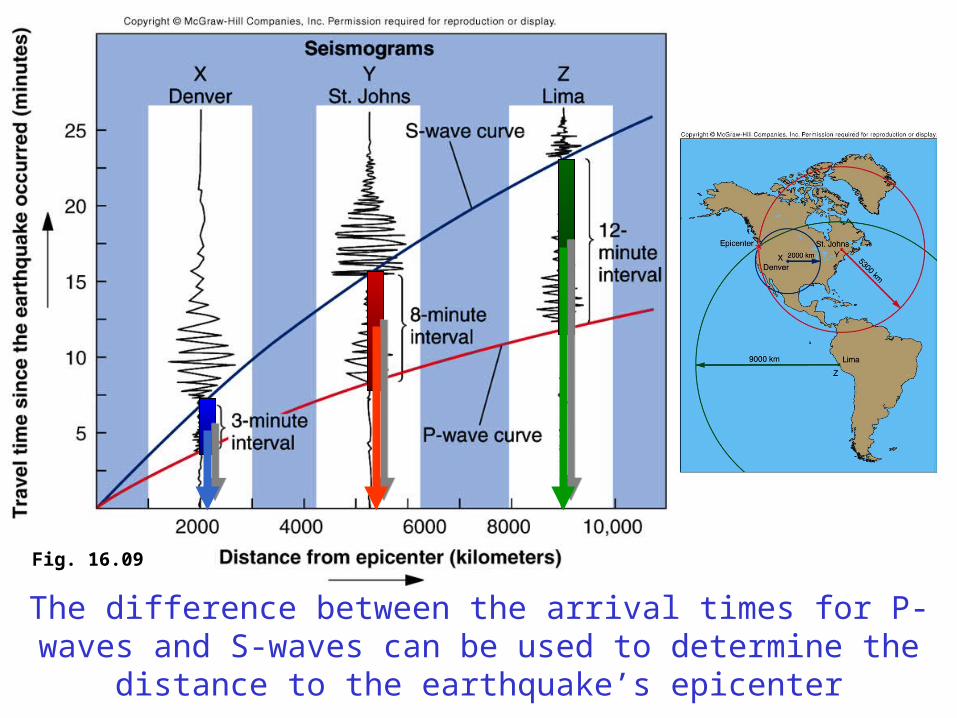
Fig. 16.09
The difference between the arrival times for P-waves and S-waves can be used to determine the distance to the
earthquake’s epicenter