EAE/ASE RECOMMENDATIONS
Echocardiographic assessment of valve stenosis: EAE/ASErecommendations for clinical practice
Helmut Baumgartner1†, Judy Hung2‡, Javier Bermejo3†, John B. Chambers4†, Arturo Evangelista5†,Brian P. Griffin6‡, Bernard Iung7†, Catherine M. Otto8‡, Patricia A. Pellikka9‡, and Miguel Quinones10‡
1University of Muenster, Muenster, Germany; 2Massachusetts General Hospital, Boston, MA, USA; 3Hospital General UniversitarioGregorio Maranon, Barcelona, Spain; 4Huy’s and St. Thomas’ Hospital, London, United Kingdom; 5Hospital Vall D’Hebron,Barcelona, Spain; 6Cleveland Clinic, Cleveland, OH, USA; 7Paris VII Denis Diderot University, Paris, France; 8University ofWashington, Seattle, WA, USA; 9Mayo Clinic, Rochester, MN, USA; and 10The Methodist Hospital, Houston, TX, USA
Abbreviations
AR ¼ aortic regurgitationAS ¼ aortic stenosisAVA ¼ aortic valve areaCSA ¼ cross sectional areaCWD ¼ continuous wave DopplerD ¼ diameterHOCM ¼ hypertrophic obstructive cardiomyopathyLV ¼ left ventricleLVOT ¼ left ventricular outflow tractMR ¼ mitral regurgitationMS ¼ mitral stenosisMVA ¼ mitral valve areaDP ¼ pressure gradientRV ¼ right ventricleRVOT ¼ right ventricular outflow tractSV ¼ stroke volumeTEE ¼ transesophageal echocardiographyT 1/2 ¼ pressure half-timeTR ¼ tricuspid regurgitationTS ¼ tricuspid stenosisV ¼ velocityVSD ¼ ventricular septal defectVTI =velocity time integral
I. Introduction
Valve stenosis is a common heart disorder and an importantcause of cardiovascular morbidity and mortality. Echocardio-graphy has become the key tool for the diagnosis and evalu-ation of valve disease, and is the primary non-invasiveimaging method for valve stenosis assessment. Clinicaldecision-making is based on echocardiographic assessmentof the severity of valve stenosis, so it is essential that
standards be adopted to maintain accuracy and consistencyacross echocardiographic laboratories when assessing andreporting valve stenosis. The aim of this paper was todetail the recommended approach to the echocardiographicevaluation of valve stenosis, including recommendationsfor specific measures of stenosis severity, details of dataacquisition and measurement, and grading of severity.These recommendations are based on the scientific litera-ture and on the consensus of a panel of experts.
This document discusses a number of proposed methodsfor evaluation of stenosis severity. On the basis of a compre-hensive literature review and expert consensus, thesemethods were categorized for clinical practice as:
† Level 1 Recommendation:anappropriateand recommendedmethod for all patients with stenosis of that valve.
† Level 2 Recommendation: a reasonable method for clini-cal use when additional information is needed in selectedpatients.
† Level 3 Recommendation: a method not recommended forroutine clinical practice although it may be appropriatefor research applications and in rare clinical cases.
It is essential in clinical practice to use an integrativeapproach when grading the severity of stenosis, combiningall Doppler and 2D data, and not relying on one specificmeasurement. Loading conditions influence velocity andpressure gradients; therefore, these parameters varydepending on intercurrent illness of patients with low vs.high cardiac output. In addition, irregular rhythms or tachy-cardia can make assessment of stenosis severity proble-matic. Finally, echocardiographic measurements of valvestenosis must be interpreted in the clinical context of theindividual patient. The same Doppler echocardiographicmeasures of stenosis severity may be clinically importantfor one patient but less significant for another.
† Writing Committee of the European Association of Echocardiography (EAE).‡ American Society of Echocardiography (ASE).
Published on behalf of the European Society of Cardiology. All rights reserved. & The Author 2008.For permissions please email: [email protected].
European Journal of Echocardiography (2009) 10, 1–25doi:10.1093/ejechocard/jen303
by guest on May 6, 2016
Dow
nloaded from
II. Aortic stenosis
Echocardiography has become the standard means forevaluation of aortic stenosis (AS) severity. Cardiaccatheterization is no longer recommended1–3 except inrare cases when echocardiography is non-diagnostic ordiscrepant with clinical data.
This guideline details recommendations for recordingand measurement of AS severity using echocardiography.However, although accurate quantitation of disease severityis an essential step in patient management, clinical decision-making depends on several other factors, most importantlysymptom status. This echocardiographic standards documentdoes not make recommendations for clinical management:these are detailed in the current guidelines for managementof adults with valvular heart disease.
A. Causes and anatomic presentation
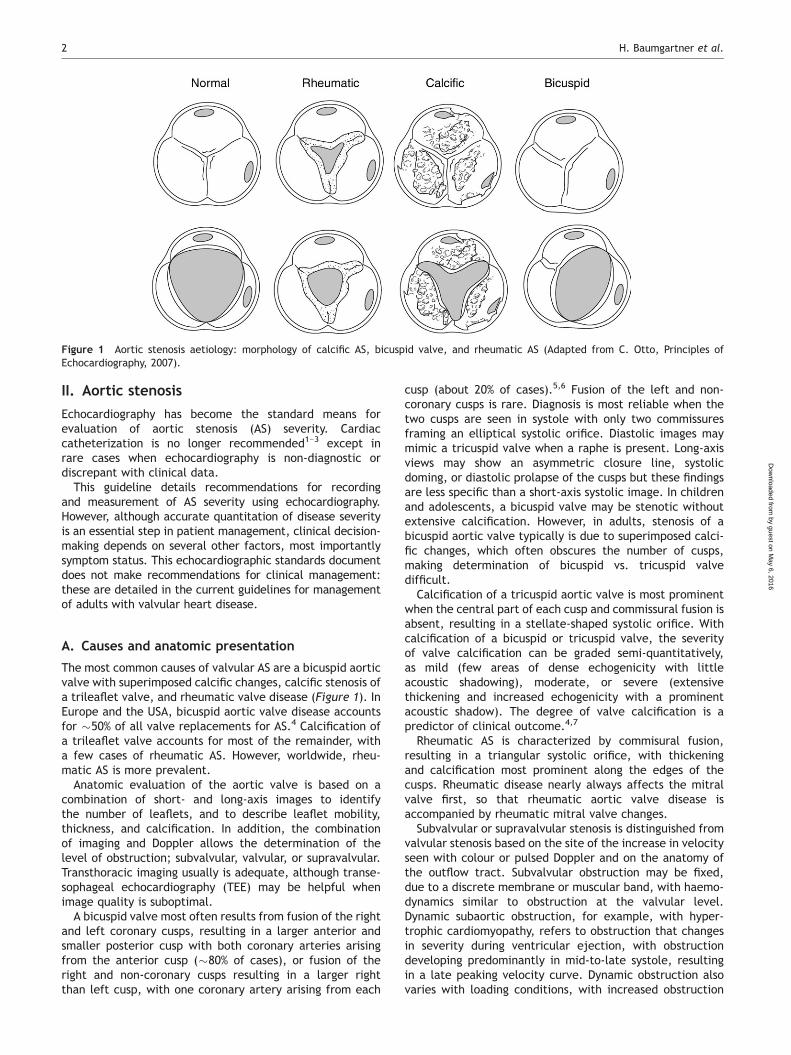
The most common causes of valvular AS are a bicuspid aorticvalve with superimposed calcific changes, calcific stenosis ofa trileaflet valve, and rheumatic valve disease (Figure 1). InEurope and the USA, bicuspid aortic valve disease accountsfor �50% of all valve replacements for AS.4 Calcification ofa trileaflet valve accounts for most of the remainder, witha few cases of rheumatic AS. However, worldwide, rheu-matic AS is more prevalent.
Anatomic evaluation of the aortic valve is based on acombination of short- and long-axis images to identifythe number of leaflets, and to describe leaflet mobility,thickness, and calcification. In addition, the combinationof imaging and Doppler allows the determination of thelevel of obstruction; subvalvular, valvular, or supravalvular.Transthoracic imaging usually is adequate, although transe-sophageal echocardiography (TEE) may be helpful whenimage quality is suboptimal.
A bicuspid valve most often results from fusion of the rightand left coronary cusps, resulting in a larger anterior andsmaller posterior cusp with both coronary arteries arisingfrom the anterior cusp (�80% of cases), or fusion of theright and non-coronary cusps resulting in a larger rightthan left cusp, with one coronary artery arising from each
cusp (about 20% of cases).5,6 Fusion of the left and non-coronary cusps is rare. Diagnosis is most reliable when thetwo cusps are seen in systole with only two commissuresframing an elliptical systolic orifice. Diastolic images maymimic a tricuspid valve when a raphe is present. Long-axisviews may show an asymmetric closure line, systolicdoming, or diastolic prolapse of the cusps but these findingsare less specific than a short-axis systolic image. In childrenand adolescents, a bicuspid valve may be stenotic withoutextensive calcification. However, in adults, stenosis of abicuspid aortic valve typically is due to superimposed calci-fic changes, which often obscures the number of cusps,making determination of bicuspid vs. tricuspid valvedifficult.
Calcification of a tricuspid aortic valve is most prominentwhen the central part of each cusp and commissural fusion isabsent, resulting in a stellate-shaped systolic orifice. Withcalcification of a bicuspid or tricuspid valve, the severityof valve calcification can be graded semi-quantitatively,as mild (few areas of dense echogenicity with littleacoustic shadowing), moderate, or severe (extensivethickening and increased echogenicity with a prominentacoustic shadow). The degree of valve calcification is apredictor of clinical outcome.4,7
Rheumatic AS is characterized by commisural fusion,resulting in a triangular systolic orifice, with thickeningand calcification most prominent along the edges of thecusps. Rheumatic disease nearly always affects the mitralvalve first, so that rheumatic aortic valve disease isaccompanied by rheumatic mitral valve changes.
Subvalvular or supravalvular stenosis is distinguished fromvalvular stenosis based on the site of the increase in velocityseen with colour or pulsed Doppler and on the anatomy ofthe outflow tract. Subvalvular obstruction may be fixed,due to a discrete membrane or muscular band, with haemo-dynamics similar to obstruction at the valvular level.Dynamic subaortic obstruction, for example, with hyper-trophic cardiomyopathy, refers to obstruction that changesin severity during ventricular ejection, with obstructiondeveloping predominantly in mid-to-late systole, resultingin a late peaking velocity curve. Dynamic obstruction alsovaries with loading conditions, with increased obstruction
Figure 1 Aortic stenosis aetiology: morphology of calcific AS, bicuspid valve, and rheumatic AS (Adapted from C. Otto, Principles ofEchocardiography, 2007).
H. Baumgartner et al.2
by guest on May 6, 2016
Dow
nloaded from
when ventricular volumes are smaller and when ventricularcontractility is increased.
Supravalvular stenosis is uncommon and typically is due toa congenital condition, such as Williams syndrome with per-sistent or recurrent obstruction in adulthood.
With the advent of percutaneous aortic valve implan-tation, anatomic assessment appears to become increasinglyimportant for patient selection and planning of the interven-tion. Besides underlying morphology (bicuspid vs. tricuspid)as well as extent and distribution of calcification, the assess-ment of annulus dimension is critical for the choice ofprosthesis size. For the latter, TEE may be superior to trans-thoracic echocardiography (TTE). However, standards stillhave to be defined.
B. How to assess aortic stenosis (Tables 1 and 2)
B.1. Recommendations for Standard Clinical Practice(Level 1 Recommendation 5 appropriate in all patientswith AS)
The primary haemodynamic parameters recommended forclinical evaluation of AS severity are:
† AS jet velocity† Mean transaortic gradient† Valve area by continuity equation.
B.1.1. Jet velocity. The antegrade systolic velocity acrossthe narrowed aortic valve, or aortic jet velocity, is measuredusing continuous-wave (CW) Doppler (CWD) ultrasound.8–10
Accurate data recording mandates multiple acousticwindows in order to determine the highest velocity (apicaland suprasternal or right parasternal most frequently yieldthe highest velocity; rarely subcostal or supraclavicularwindows may be required). Careful patient positioning andadjustment of transducer position and angle are crucial asvelocity measurement assumes a parallel intercept anglebetween the ultrasound beam and direction of blood flow,whereas the 3D direction of the aortic jet is unpredictableand usually cannot be visualized. AS jet velocity is defined asthe highest velocity signal obtained from any window after acareful examination; lower values from other views are notreported. The acoustic window that provides the highestaortic jet velocity is noted in the report and usually remainsconstant on sequential studies in an individual patient.Occasionally, colour Doppler is helpful to avoid recordingthe CWD signal of an eccentric mitral regurgitation (MR)jet, but is usually not helpful for AS jet direction. Any devi-ation from a parallel intercept angle results in velocityunderestimation; however, the degree of underestimation is5% or less if the intercept angle is within 158 of parallel.‘Angle correction’ should not be used because it is likely tointroduce more error given the unpredictable jet direction.
A dedicated small dual-crystal CW transducer is rec-ommended both due to a higher signal-to-noise ratio and
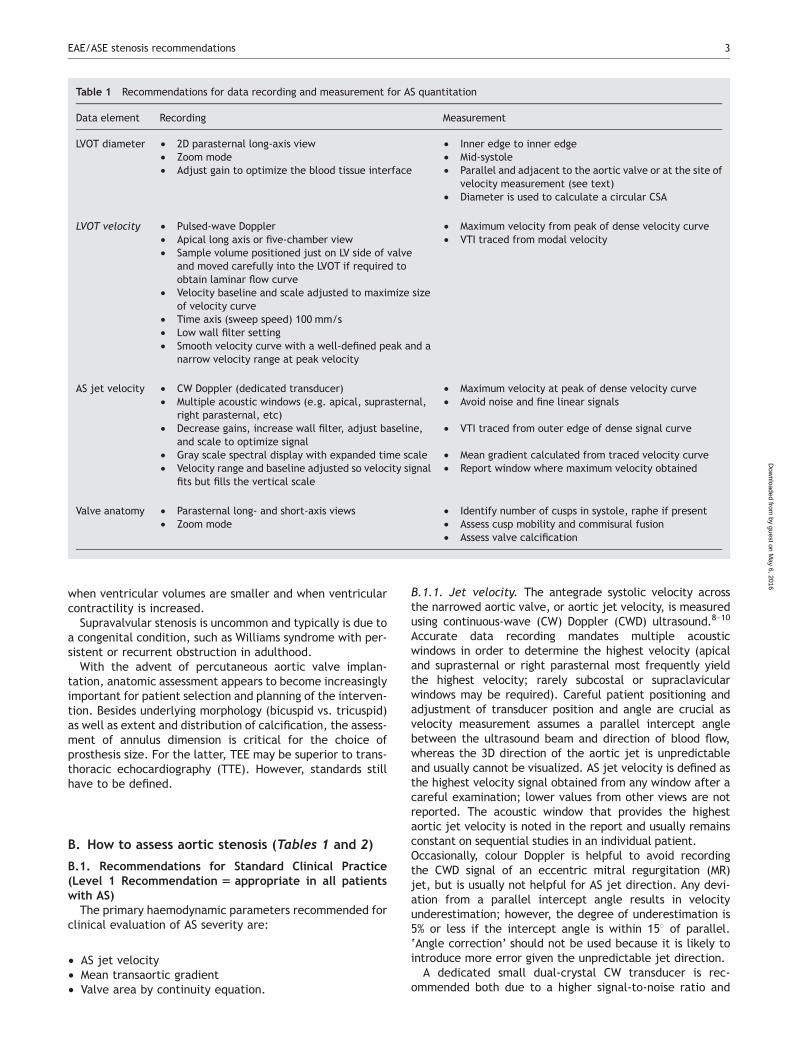
Table 1 Recommendations for data recording and measurement for AS quantitation
Data element Recording Measurement
LVOT diameter † 2D parasternal long-axis view † Inner edge to inner edge† Zoom mode † Mid-systole† Adjust gain to optimize the blood tissue interface † Parallel and adjacent to the aortic valve or at the site of
velocity measurement (see text)† Diameter is used to calculate a circular CSA
LVOT velocity † Pulsed-wave Doppler † Maximum velocity from peak of dense velocity curve† Apical long axis or five-chamber view † VTI traced from modal velocity† Sample volume positioned just on LV side of valve
and moved carefully into the LVOT if required toobtain laminar flow curve
† Velocity baseline and scale adjusted to maximize sizeof velocity curve
† Time axis (sweep speed) 100 mm/s† Low wall filter setting† Smooth velocity curve with a well-defined peak and a
narrow velocity range at peak velocity
AS jet velocity † CW Doppler (dedicated transducer) † Maximum velocity at peak of dense velocity curve† Multiple acoustic windows (e.g. apical, suprasternal,
right parasternal, etc)† Avoid noise and fine linear signals
† Decrease gains, increase wall filter, adjust baseline,and scale to optimize signal
† VTI traced from outer edge of dense signal curve
† Gray scale spectral display with expanded time scale † Mean gradient calculated from traced velocity curve† Velocity range and baseline adjusted so velocity signal
fits but fills the vertical scale† Report window where maximum velocity obtained
Valve anatomy † Parasternal long- and short-axis views † Identify number of cusps in systole, raphe if present† Zoom mode † Assess cusp mobility and commisural fusion
† Assess valve calcification
EAE/ASE stenosis recommendations 3
by guest on May 6, 2016
Dow
nloaded from
to allow optimal transducer positioning and angulation, par-ticularly when suprasternal and right parasternal windowsare used. However, when stenosis is only mild (velocity,3 m/s) and leaflet opening is well seen, a combinedimaging-Doppler transducer may be adequate.
The spectral Doppler signal is recorded with the velocityscale adjusted so the signal fills, but fits, on the verticalaxis, and with a time scale on the x-axis of 100 mm/s.Wall (or high pass) filters are set at a high level and gain isdecreased to optimize identification of the velocity curve.Grey scale is used because this scale maps signal strengthusing a decibel scale that allows visual separation of noiseand transit time effect from the velocity signal. In addition,all the validation and interobserver variability studies
were done using this mode. Colour scales have variableapproaches to matching signal strength to colour hue orintensity and are not recommended unless a decibel scalecan be verified.
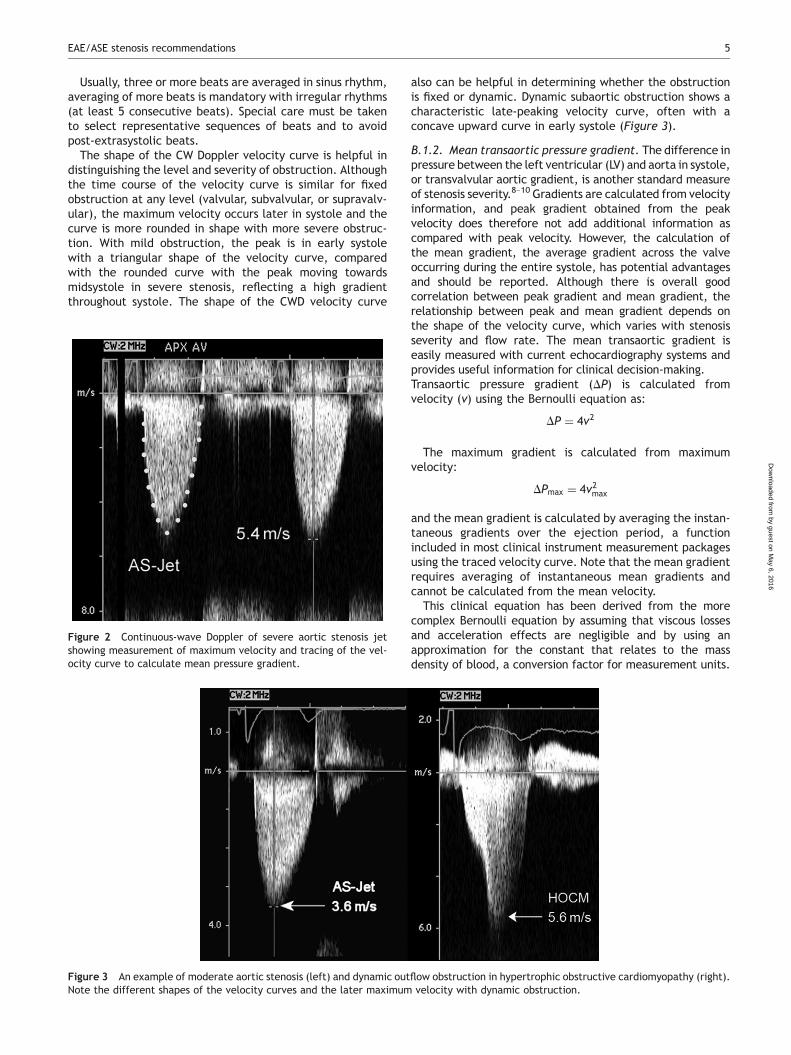
A smooth velocity curve with a dense outer edge and clearmaximum velocity should be recorded. The maximum velocityis measured at the outer edge of the dark signal; fine linearsignals at the peak of the curve are due to the transit timeeffect and should not be included in measurements. Somecolour scales ‘blur’ the peak velocities, sometimes resultingin overestimation of stenosis severity. The outer edge of thedark ‘envelope’ of the velocity curve (Figure 2) is traced toprovide both the velocity–time integral (VTI) for the continu-ity equation and the mean gradient (see below).
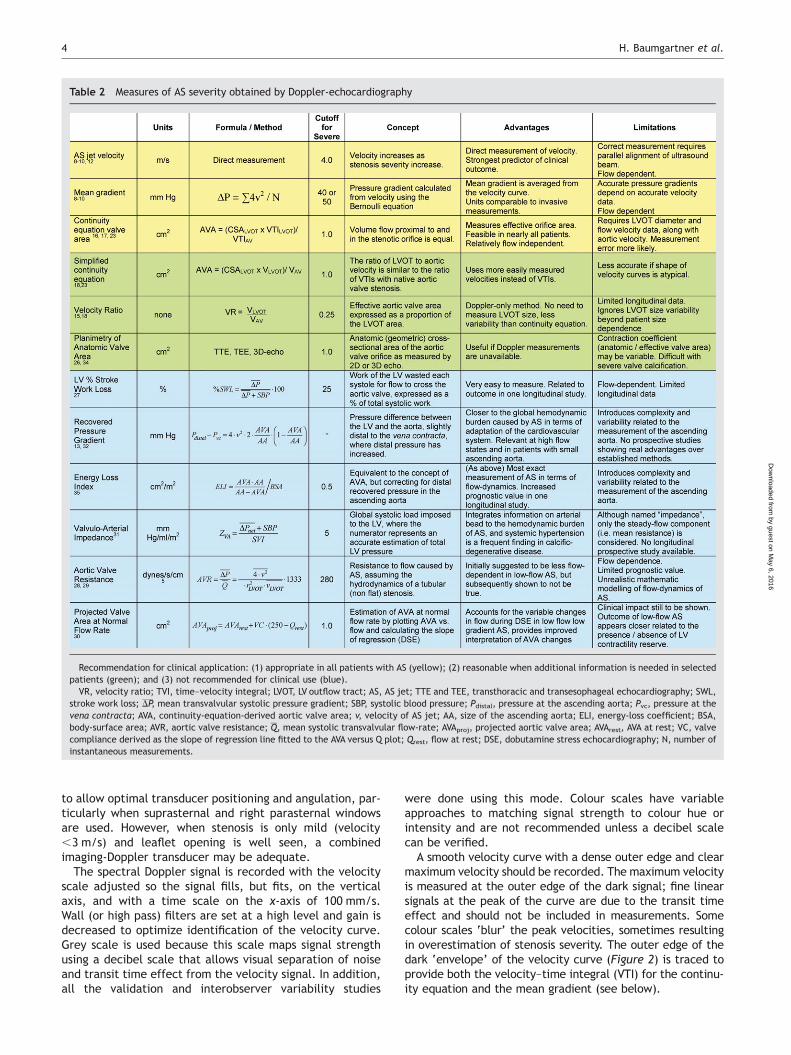
Table 2 Measures of AS severity obtained by Doppler-echocardiography
Recommendation for clinical application: (1) appropriate in all patients with AS (yellow); (2) reasonable when additional information is needed in selectedpatients (green); and (3) not recommended for clinical use (blue).
VR, velocity ratio; TVI, time–velocity integral; LVOT, LV outflow tract; AS, AS jet; TTE and TEE, transthoracic and transesophageal echocardiography; SWL,stroke work loss; DP, mean transvalvular systolic pressure gradient; SBP, systolic blood pressure; Pdistal, pressure at the ascending aorta; Pvc, pressure at thevena contracta; AVA, continuity-equation-derived aortic valve area; v, velocity of AS jet; AA, size of the ascending aorta; ELI, energy-loss coefficient; BSA,body-surface area; AVR, aortic valve resistance; Q, mean systolic transvalvular flow-rate; AVAproj, projected aortic valve area; AVArest, AVA at rest; VC, valvecompliance derived as the slope of regression line fitted to the AVA versus Q plot; Qrest, flow at rest; DSE, dobutamine stress echocardiography; N, number ofinstantaneous measurements.
H. Baumgartner et al.4
by guest on May 6, 2016
Dow
nloaded from
Usually, three or more beats are averaged in sinus rhythm,averaging of more beats is mandatory with irregular rhythms(at least 5 consecutive beats). Special care must be takento select representative sequences of beats and to avoidpost-extrasystolic beats.
The shape of the CW Doppler velocity curve is helpful indistinguishing the level and severity of obstruction. Althoughthe time course of the velocity curve is similar for fixedobstruction at any level (valvular, subvalvular, or supravalv-ular), the maximum velocity occurs later in systole and thecurve is more rounded in shape with more severe obstruc-tion. With mild obstruction, the peak is in early systolewith a triangular shape of the velocity curve, comparedwith the rounded curve with the peak moving towardsmidsystole in severe stenosis, reflecting a high gradientthroughout systole. The shape of the CWD velocity curve
also can be helpful in determining whether the obstructionis fixed or dynamic. Dynamic subaortic obstruction shows acharacteristic late-peaking velocity curve, often with aconcave upward curve in early systole (Figure 3).
B.1.2. Mean transaortic pressure gradient. The difference inpressure between the left ventricular (LV) and aorta in systole,or transvalvular aortic gradient, is another standard measureof stenosis severity.8–10 Gradients are calculated from velocityinformation, and peak gradient obtained from the peakvelocity does therefore not add additional information ascompared with peak velocity. However, the calculation ofthe mean gradient, the average gradient across the valveoccurring during the entire systole, has potential advantagesand should be reported. Although there is overall goodcorrelation between peak gradient and mean gradient, therelationship between peak and mean gradient depends onthe shape of the velocity curve, which varies with stenosisseverity and flow rate. The mean transaortic gradient iseasily measured with current echocardiography systems andprovides useful information for clinical decision-making.Transaortic pressure gradient (DP) is calculated fromvelocity (v) using the Bernoulli equation as:
DP ¼ 4v2
The maximum gradient is calculated from maximumvelocity:
DPmax ¼ 4v2max
and the mean gradient is calculated by averaging the instan-taneous gradients over the ejection period, a functionincluded in most clinical instrument measurement packagesusing the traced velocity curve. Note that the mean gradientrequires averaging of instantaneous mean gradients andcannot be calculated from the mean velocity.
This clinical equation has been derived from the morecomplex Bernoulli equation by assuming that viscous lossesand acceleration effects are negligible and by using anapproximation for the constant that relates to the massdensity of blood, a conversion factor for measurement units.
Figure 3 An example of moderate aortic stenosis (left) and dynamic outflow obstruction in hypertrophic obstructive cardiomyopathy (right).Note the different shapes of the velocity curves and the later maximum velocity with dynamic obstruction.
Figure 2 Continuous-wave Doppler of severe aortic stenosis jetshowing measurement of maximum velocity and tracing of the vel-ocity curve to calculate mean pressure gradient.
EAE/ASE stenosis recommendations 5
by guest on May 6, 2016
Dow
nloaded from
In addition, the simplified Bernoulli equation assumes that theproximal velocity can be ignored, a reasonable assumptionwhen velocity is ,1 m/s because squaring a number ,1makes it even smaller. When the proximal velocity is over1.5 m/s or the aortic velocity is ,3.0 m/s, the proximal vel-ocity should be included in the Bernoulli equation so that
DP ¼ 4 v2max � v2
proximal
� �
when calculating maximum gradients. It is more problematicto include proximal velocity in mean gradient calculations aseach point on the ejection curve for the proximal and jet vel-ocities would need to be matched and this approach is notused clinically. In this situation, maximum velocity and gradi-ent should be used to grade stenosis severity.
Sources of error for pressure gradient calculationsIn addition to the above-mentioned sources of error
(malalignment of jet and ultrasound beam, recording ofMR jet, neglect of an elevated proximal velocity), thereare several other limitations of transaortic pressure gradientcalculations. Most importantly, any underestimation ofaortic velocity results in an even greater underestimationin gradients, due to the squared relationship between vel-ocity and pressure difference. There are two additional con-cerns when comparing pressure gradients calculated fromDoppler velocities to pressures measured at cardiac cathe-terization. First, the peak gradient calculated from themaximum Doppler velocity represents the maximum instan-taneous pressure difference across the valve, not the differ-ence between the peak LV and peak aortic pressuremeasured from the pressure tracings. Note that peak LVand peak aortic pressure do not occur at the same point intime; so, this difference does not represent a physiologicalmeasurement and this peak-to-peak difference is less thanthe maximum instantaneous pressure difference. Thesecond concern is the phenomenon of pressure recovery(PR). The conversion of potential energy to kinetic energyacross a narrowed valve results in a high velocity and adrop in pressure. However, distal to the orifice, flow decele-rates again. Although some of the kinetic energy dissipatesinto heat due to turbulences and viscous losses, some ofthe kinetic energy will be reconverted into potentialenergy with a corresponding increase in pressure, theso-called PR. Pressure recovery is greatest in stenoses withgradual distal widening since occurrence of turbulences isthen reduced. Aortic stenosis with its abrupt wideningfrom the small orifice to the larger aorta has an unfavour-able geometry for pressure recovery. In AS, PR (in mmHg)can indeed be calculated from the Doppler gradient thatcorresponds to the initial pressure drop across the valve(i.e. 4v2), the effective orifice area as given by the continu-ity equation (EOA) and the cross-sectional area (CSA) of theascending aorta (AoA) by the following equation: PR ¼ 4v2
�
2EOA/AoA � (12EOA/AoA).11 Thus, PR is basically relatedto the ratio of EOA/AoA. As a relatively small EOA is requiredto create a relevant gradient, AoA must also be relativelysmall to end up with a ratio favouring PR. For clinical pur-poses, aortic sizes, therefore, appear to be the key playerand PR must be taken into account primarily in patientswith a diameter of the ascending aorta ,30 mm.11 It maybe clinically relevant particularly in congenital AS.However, in most adults with native AS, the magnitude ofPR is small and can be ignored as long as the diameter of
the aorta is .30 mm. When the aorta is ,30 mm,however, one should be aware that the initial pressuredrop from LV to the vena contracta as reflected by Dopplermeasurement may be significantly higher than the actualnet pressure drop across the stenosis, which representsthe pathophysiologically relevant measurement.11
Current guidelines for decision-making in patients withvalvular heart disease recommend non-invasive evaluationwith Doppler echocardiography.1,2,12,13 Cardiac catheteriza-tion is not recommended except in cases where echocardio-graphy is non-diagnostic or is discrepant with clinical data.The prediction of clinical outcomes has been primarilystudied using Doppler velocity data.
B.1.3. Valve area. Doppler velocity and pressure gradientsare flow dependent; for a given orifice area, velocity andgradient increase with an increase in transaortic flow rate,and decrease with a decrease in flow rate. Calculation ofthe stenotic orifice area or aortic valve area (AVA) ishelpful when flow rates are very low or very high,although even the degree of valve opening varies to somedegree with flow rate (see below).
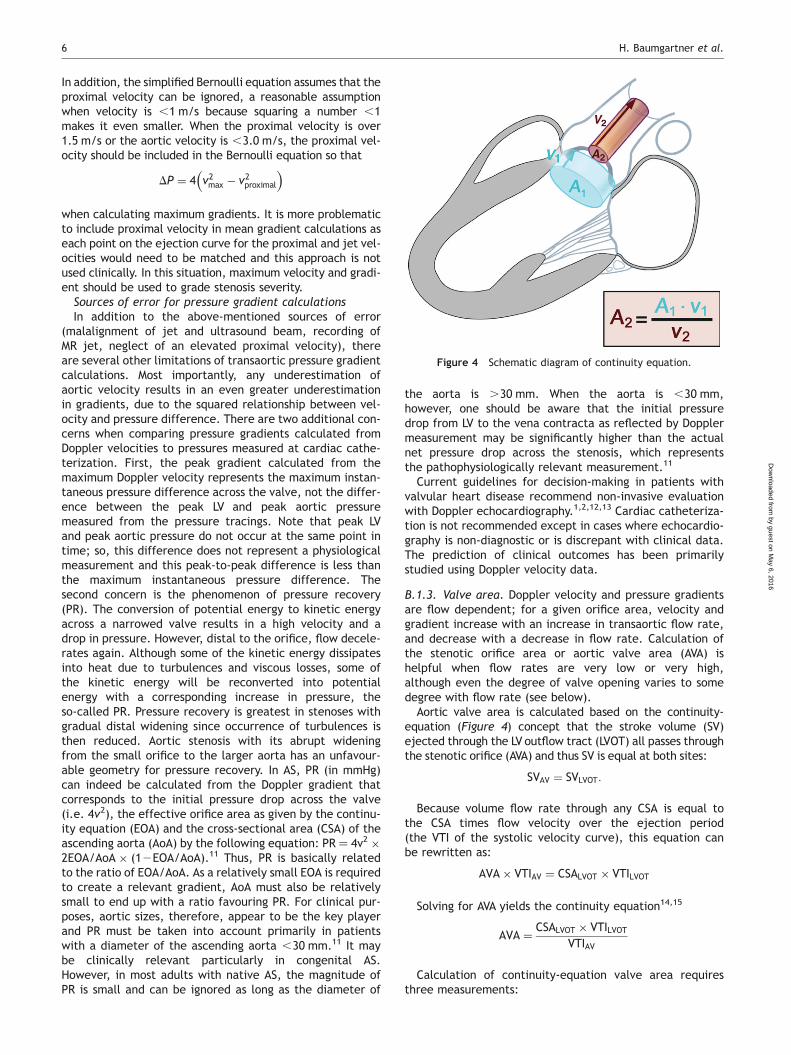
Aortic valve area is calculated based on the continuity-equation (Figure 4) concept that the stroke volume (SV)ejected through the LV outflow tract (LVOT) all passes throughthe stenotic orifice (AVA) and thus SV is equal at both sites:
SVAV ¼ SVLVOT:
Because volume flow rate through any CSA is equal tothe CSA times flow velocity over the ejection period(the VTI of the systolic velocity curve), this equation canbe rewritten as:
AVA� VTIAV ¼ CSALVOT � VTILVOT
Solving for AVA yields the continuity equation14,15
AVA ¼CSALVOT � VTILVOT
VTIAV
Calculation of continuity-equation valve area requiresthree measurements:
Figure 4 Schematic diagram of continuity equation.
H. Baumgartner et al.6
by guest on May 6, 2016
Dow
nloaded from
† AS jet velocity by CWD† LVOT diameter for calculation of a circular CSA† LVOT velocity recorded with pulsed Doppler.
AS jet velocity is recorded with CWD and the VTI is measuredas described above.
Left ventricular outflow tract stroke volumeAccurate SV calculations depend on precisely recording
the LVOT diameter and velocity. It is essential that bothmeasurements are made at the same distance from theaortic valve. When a smooth velocity curve can be obtainedat the annulus, this site is preferred (i.e. particularly in con-genital AS with doming valve). However, flow acceleration atthe annulus level and even more proximally occurs in manypatients, particularly those with calcific AS, so that thesample volume needs to be moved apically from 0.5 to1.0 cm to obtain a laminar flow curve without spectral dis-persion. In this case, the diameter measurement should bemade at this distance from the valve (Figure 5). However,it should be remembered that LVOT becomes progressivelymore elliptical (rather than circular) in many patients,which may result in underestimation of LVOT CSA and inconsequence underestimation of SV and eventually AVA.16
Diameter is measured from the inner edge to inner edge ofthe septal endocardium, and the anterior mitral leaflet inmid-systole. Diameter measurements are most accurateusing the zoom mode with careful angulation of the transdu-cer and with gain and processing adjusted to optimize theimages. Usually three or more beats are averaged in sinusrhythm, averaging of more beats is appropriate with irregu-lar rhythms (at least 5 consecutive beats). With carefulattention to the technical details, diameter can bemeasured in nearly all patients. Then, the CSA of the LVOTis calculated as the area of a circle with the limitationsmentioned above:
CSALVOT ¼ pD2
� �2
where D is diameter. LVOT velocity is recorded with pulsedDoppler from an apical approach, in either the anteriorlyangulated four-chamber view (or ‘five-chamber view’) orin the apical long-axis view. The pulsed-Doppler samplevolume is positioned just proximal to the aortic valve sothat the location of the velocity recording matches theLVOT diameter measurement. When the sample volume isoptimally positioned, the recording (Figure 6) shows asmooth velocity curve with a well-defined peak, narrowband of velocities throughout systole. As mentioned above,this may not be the case in many patients at the annulusdue to flow convergence resulting in spectral dispersion. Inthis case, the sample volume is then slowly moved towardsthe apex until a smooth velocity curve is obtained. TheVTI is measured by tracing the dense modal velocitythroughout systole.17
Limitations of continuity-equation valve areaThe clinical measurement variability for continuity-
equation valve area depends on the variability in each ofthe three measurements, including both the variability inacquiring the data and variability in measuring the recordeddata. AS jet and LVOT velocity measurements have a verylow intra- and interobserver variability (�3–4%) both fordata recording and measurement in an experienced labora-tory. However, the measurement variability for LVOT diam-eter ranges from 5% to 8%. When LVOT diameter is squaredfor calculation of CSA, it becomes the greatest potentialsource of error in the continuity equation. When transthor-acic images are not adequate for the measurement ofLVOT diameter, TEE measurement is recommended if thisinformation is needed for clinical decision-making.
Accuracy of SV measurements in the outflow tract alsoassumes laminar flow with a spatially flat profile of flow(e.g. velocity is the same in the centre and at the edge ofthe flow stream). When subaortic flow velocities are abnor-mal, for example, with dynamic subaortic obstruction or asubaortic membrane, SV calculations at this site are notaccurate. With combined stenosis and regurgitation, high
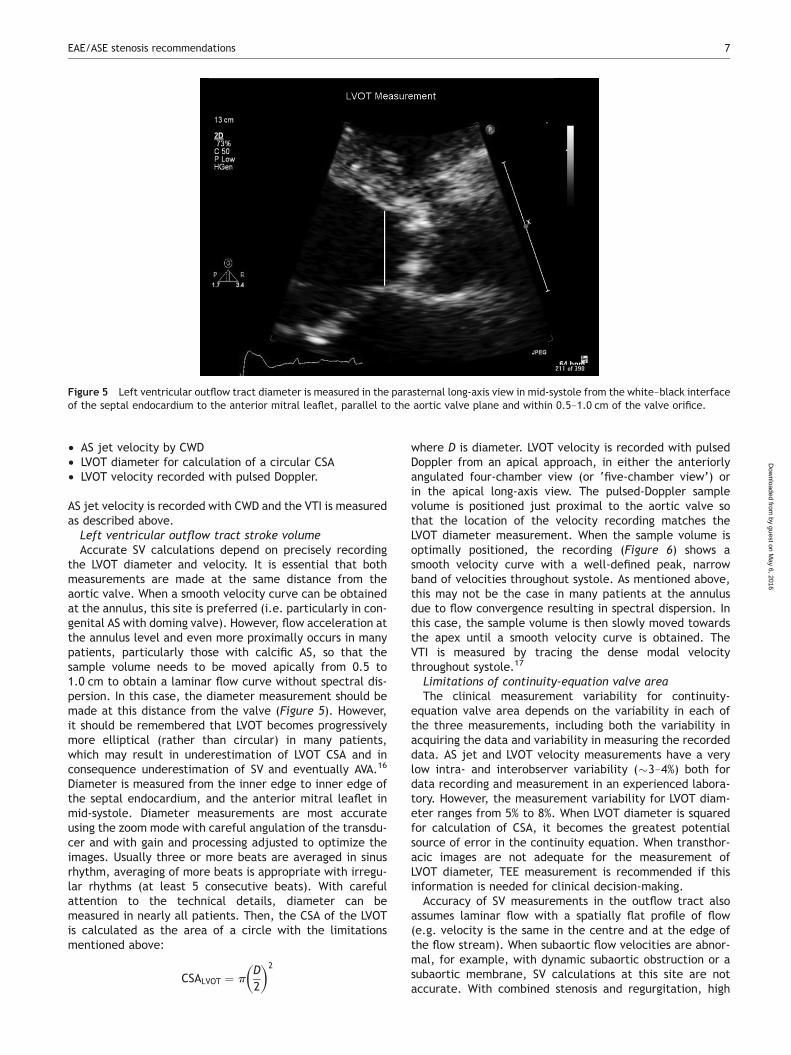
Figure 5 Left ventricular outflow tract diameter is measured in the parasternal long-axis view in mid-systole from the white–black interfaceof the septal endocardium to the anterior mitral leaflet, parallel to the aortic valve plane and within 0.5–1.0 cm of the valve orifice.
EAE/ASE stenosis recommendations 7
by guest on May 6, 2016
Dow
nloaded from
subaortic flow rates may result in a skewed flow profileacross the outflow tract that may limit the accuracy. WhenLVOT velocity must be measured with some distance toannulus due to flow convergence, the velocity profile mayno longer be flat but rather skewed with highest velocitiespresent at the septum. Placement of the sample volume inthe middle of the LVOT cross-section may neverthelessgive a measurement reasonably close to the average.Placement closer to the septum or the mitral anteriorleaflet may, however, yield higher or lower measurements,respectively.
Continuity-equation valve area calculations have been wellvalidated in both clinical and experimental studies.14,15,18 Inaddition, continuity-equation valve areas are a reliable par-ameter for prediction of clinical outcome and for clinicaldecision-making.12,19 Of course, valve area calculationsare dependable only when there is careful attention to tech-nical aspects of data acquisition and measurement asdetailed above. In addition, there are some theoretical con-cerns about continuity-equation valve areas.
First, the continuity-equation measures the effective valvearea—the area of the flow stream as it passes through thevalve—not the anatomic valve area. The effective valvearea is smaller than the anatomic valve area due to contrac-tion of the flow stream in the orifice, as determined by thecontraction and discharge coefficients for a given orifice geo-metry.20 Although, the difference between effective and ana-tomic valve area may account for some of the discrepanciesbetween Doppler continuity equation and catheterizationGorlin equation valve areas, there now are ampleclinical-outcome data validating the use of the continuityequation. The weight of the evidence now supports theconcept that effective, not anatomic, orifice area is theprimary predictor of clinical outcome.
The second potential limitation of valve area as a measureof stenosis severity is the observed changes in valve areawith changes in flow rate.21,22 In adults with AS andnormal LV function, the effects of flow rate are minimaland resting effective valve area calculations are accurate.However, this effect may be significant when concurrent LVdysfunction results in decreased cusp opening and a smalleffective orifice area even though severe stenosis is notpresent. The most extreme example of this phenomenon isthe lack of aortic valve opening when a ventricular assistdevice is present. Another example is the decreasedopening of normal cusps seen frequently with severe LV sys-tolic dysfunction. However, the effect of flow rate on valvearea can be used to diagnostic advantage in AS with LV dys-function to identify those with severe AS, as discussedbelow.
Serial measurementsWhen serial measurements are performed during follow-
up, any significant changes in results should be checked indetail:
† make sure that aortic jet velocity is recorded from thesame window with the same quality (always report thewindow where highest velocities can be recorded).
† when AVA changes, look for changes in the different com-ponents incorporated in the equation. LVOT size rarelychanges over time in adults.
B.2. Alternate measures of stenosis severity (Level 2Recommendation 5 reasonable when additionalinformation is needed in selected patients)B.2.1. Simplified continuity equation. The simplifiedcontinuity equation is based on the concept that in native
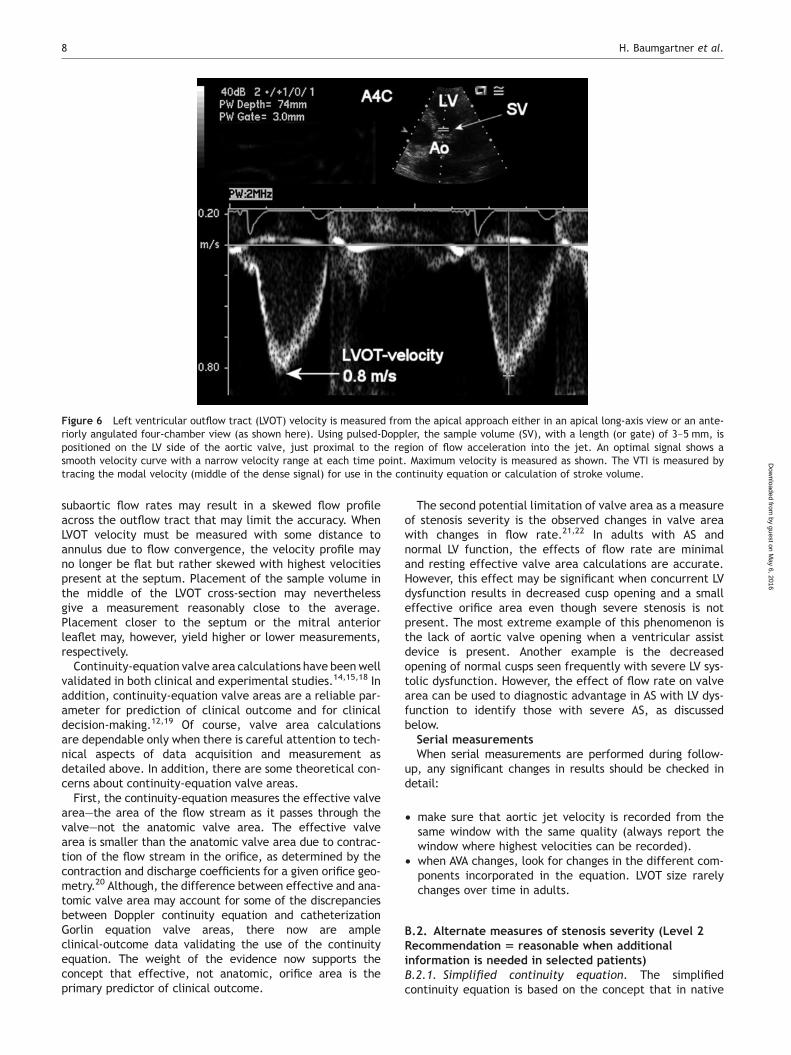
Figure 6 Left ventricular outflow tract (LVOT) velocity is measured from the apical approach either in an apical long-axis view or an ante-riorly angulated four-chamber view (as shown here). Using pulsed-Doppler, the sample volume (SV), with a length (or gate) of 3–5 mm, ispositioned on the LV side of the aortic valve, just proximal to the region of flow acceleration into the jet. An optimal signal shows asmooth velocity curve with a narrow velocity range at each time point. Maximum velocity is measured as shown. The VTI is measured bytracing the modal velocity (middle of the dense signal) for use in the continuity equation or calculation of stroke volume.
H. Baumgartner et al.8
by guest on May 6, 2016
Dow
nloaded from
aortic valve stenosis the shape of the velocity curve in theoutflow tract and aorta is similar so that the ratio of LVOTto aortic jet VTI is nearly identical to the ratio of theLVOT to aortic jet maximum velocity (V ).18,23 Thus, thecontinuity equation can be simplified to:
AVA ¼CSALVOT � VLVOT
VAV
This method is less well accepted because some experts areconcerned that results are more variable than using VTIs inthe equation.
B.2.2. Velocity ratio. Another approach to reducing errorrelated to LVOT diameter measurements is removing CSAfrom the simplified continuity equation. This dimensionlessvelocity ratio expresses the size of the valvular effectivearea as a proportion of the CSA of the LVOT.
Velocity ratio ¼VLVOT
VAV
Substitution of the time–velocity integral can also be usedas there was a high correlation between the ratio usingtime–velocity integral and the ratio using peak velocities.In the absence of valve stenosis, the velocity ratioapproaches 1, with smaller numbers indicating moresevere stenosis. Severe stenosis is present when thevelocity ratio is 0.25 or less, corresponding to a valve area25% of normal.18 To some extent, the velocity ratio isnormalized for body size because it reflects the ratio ofthe actual valve area to the expected valve area in eachpatient, regardless of body size. However, thismeasurement ignores the variability in LVOT size beyondvariation in body size.
B.2.3. Aortic valve area planimetry. Multiple studies haveevaluated the method of measuring anatomic (geometric)AVA by direct visualization of the valvular orifice, eitherby 2D or 3D TTE or TEE.24–26 Planimetry may be anacceptable alternative when Doppler estimation of flowvelocities is unreliable. However, planimetry may beinaccurate when valve calcification causes shadows orreverberations limiting identification of the orifice.Caution is also needed to ensure that the minimal orificearea is identified rather than a larger apparent areaproximal to the cusp tips, particularly in congenital ASwith a doming valve. In addition, as stated previously,effective, rather than anatomic, orifice area is the primarypredictor of outcome.
B.3. Experimental descriptors of stenosis severity(Level 3 recommendation 5 not recommended forroutine clinical use)Other haemodynamic measurements of severity such asvalve resistance, LV percentage stroke-work loss, and theenergy-loss coefficient are based on different mathematicalderivations of the relationship between flow and the trans-valvular pressure drop.27–31 Accounting for PR in the ascend-ing aorta has demonstrated to improve the agreementbetween invasively and non-invasively derived measure-ments of the transvalvular pressure gradient, and is particu-larly useful in the presence of a high output state, amoderately narrowed valve orifice and, most importantly,a non-dilated ascending aorta.11,32
A common limitation of most these new indices is that long-term longitudinal data from prospective studies are lacking.Consequently, a robust validation of clinical-outcome efficacyof all these indices is pending, and they are seldom used forclinical decision-making.27
B.4. Effects of concurrent conditions on assessmentof severityB.4.1. Concurrent left ventricular systolic dysfunction.When LV systolic dysfunction co-exists with severe AS, theAS velocity and gradient may be low, despite a small valvearea; a condition termed ‘low-flow low-gradient AS’. Awidely used definition of low-flow low-gradient AS includesthe following conditions:
† Effective orifice area ,1.0 cm2;1,33,34
† LV ejection fraction ,40%; and† Mean pressure gradient ,30–40 mmHg
Dobutamine stress provides information on the changes inaortic velocity, mean gradient, and valve area as flow rateincreases, and also provides a measure of the contractileresponse to dobutamine, measured by the change in SV orejection fraction. These data may be helpful to differen-tiate two clinical situations:
† Severe AS causing LV systolic dysfunction. The transaorticvelocity is flow dependent; so, LV failure can lead to apatient with severe AS having an apparently moderatetransaortic peak velocity and mean pressure gradientassociated with a small effective orifice area. In this situ-ation, aortic valve replacement will relieve afterload andmay allow the LV ejection fraction to increase towardsnormal.
† Moderate AS with another cause of LV dysfunction (e.g.myocardial infarct or a primary cardiomyopathy). Theeffective orifice area is then low because the LV doesnot generate sufficient energy to overcome the inertiarequired to open the aortic valve to its maximum possibleextent. In this situation, aortic valve replacement maynot lead to a significant improvement in LV systolicfunction.
A patient with a low ejection fraction but a resting AS vel-ocity .4.0 m/s or mean gradient .40 mmHg does nothave a poor left ventricle (LV). The ventricle is demonstrat-ing a normal response to high afterload (severe AS), and ven-tricular function will improve after relief of stenosis. Thispatient does not need a stress echocardiogram.
The protocol for dobutamine stress echocardiography forevaluation of AS severity in setting of LV dysfunction usesa low dose starting at 2.5 or 5 mg/kg/min with an incremen-tal increase in the infusion every 3–5 min to a maximumdose of 10–20 mg/kg/min. There is a risk of arrhythmia sothere must be medical supervision and high doses of dobuta-mine should be avoided. The infusion should be stopped assoon as a positive result is obtained or when the heartrate begins to rise more than 10–20 bpm over baseline orexceeds 100 bpm, on the assumption that the maximuminotropic effect has been reached. In addition, dobutamineadministration should also be terminated when symptoms,blood pressure fall, or significant arrhythmias occur.
EAE/ASE stenosis recommendations 9
by guest on May 6, 2016
Dow
nloaded from
Doppler data are recorded at each stage including LVOTvelocity recorded from the apical approach. AS jet velocityoptimally is recorded from the window that yields thehighest velocity signal but some laboratories prefer to usecomparative changes from an apical window to facilitaterapid data acquisition. The LVOT diameter is measured atbaseline and the same diameter is used to calculate thecontinuity-equation valve area at each stage. Measurementof biplane ejection fraction at each stage is helpful to assessthe improvement in LV contractile function.
The report of the dobutamine stress echocardiographicstudy should include AS velocity, mean gradient, valvearea, and ejection fraction preferably at each stage (tojudge reliability of measurements) but at least at baselineand peak dose. The role of dobutamine stress echocardio-graphy in decision-making in adults with AS is controversialand beyond the scope of this document. The findings we rec-ommend as reliable are:
† An increase in valve area to a final valve area .1.0 cm2
suggests that stenosis is not severe.35
† Severe stenosis is suggested by an AS jet .4.0 or a meangradient .40 mmHg provided that valve area does notexceed 1.0 cm2 at any flow rate.34
† Absence of contractile reserve (failure to increase SV orejection fraction by .20%) is a predictor of a high surgicalmortality and poor long-term outcome although valvereplacement may improve LV function and outcomeeven in this subgroup.36
For all other findings, more scientific data are requiredbefore they can be included in recommendations for clinicaldecision-making.
B.4.2. Exercise stress echocardiography. As described in theprevious section, dobutamine stress echocardiography isapplied to assess contractile reserve and AS severity in thesetting of LV dysfunction. In addition, exercise stressechocardiography has been used to assess functional statusand AS severity. Several investigators have suggested thatthe changes in haemodynamics during exercise study mightprovide a better index of stenosis severity than a singleresting value. Specifically, impending symptom onset canbe identified by a fixed valve area that fails to increasewith an increase in transaortic volume flow rate. Whileclinical studies comparing groups of patients support thishypothesis and provide insight into the pathophysiology ofthe disease process, exercise stress testing to evaluatechanges in valve area is not helpful in clinical decision-making in individual patients and therefore is currently notrecommended for assessment of AS severity in clinicalpractice. While exercise testing has become accepted forrisk stratification and assessment of functional class inasymptomatic severe AS,1,2 it remains uncertain whetherthe addition of echocardiographic data is of incrementalvalue in this setting. Although the increase in meanpressure gradient with exercise has been reported topredict outcome and provide information beyond a regularexercise test,22 more data are required to validate thisfinding and recommend its use in clinical practice.
B.4.3. Left ventricular hypertrophy. Left ventricularhypertrophy commonly accompanies AS either as aconsequence of valve obstruction or due to chronic
hypertension. Ventricular hypertrophy typically results in asmall ventricular cavity with thick walls and diastolicdysfunction, particularly in elderly women with AS. Thesmall LV ejects a small SV so that, even when severe stenosisis present, the AS velocity and mean gradient may be lowerthan expected for a given valve area. Continuity-equationvalve area is accurate in this situation. Many women withsmall LV size also have a small body size (and LVOTdiameter), so indexing valve area to body size may be helpful.
B.4.4. Hypertension. Hypertension accompanies AS in 35–45%of patients. Although a recent in vitro study has demonstratedthat systemic pressure may not directly affect gradientand valve area measurements,37 increasing LV pressure loadmay cause changes in ejection fraction and flow. Thepresence of hypertension may therefore primarily affect flowand gradients but less AVA measurements. Nevertheless,evaluation of AS severity38–40 with uncontrolled hypertensionmay not accurately reflect disease severity. Thus, control ofblood pressure is recommended before echocardiographicevaluation, whenever possible. The echocardiographic reportshould always include a blood pressure measurementrecorded at the time of the examination to allow comparisonbetween serial echocardiographic studies and with otherclinical data.
B.4.5. Aortic regurgitation. About 80% of adults with AS alsohave aortic regurgitation (AR) but regurgitation is usuallyonly mild or moderate in severity and measures of ASseverity are not significantly affected. When severe ARaccompanies AS, measures of AS severity remain accurateincluding maximum velocity, mean gradient, and valvearea. However, because of the high transaortic volumeflow rate, maximum velocity, and mean gradient will behigher than expected for a given valve area. In thissituation, reporting accurate quantitative data for theseverity of both stenosis and regurgitation41 is helpful forclinical decision-making. The combination of moderate ASand moderate AR is consistent with severe combined valvedisease.
B.4.6. Mitral valve disease. Mitral regurgitation is common inelderly adults with AS either as a consequence of LV pressureoverload or due to concurrent mitral valve disease. With MR,it is important to distinguish regurgitation due to a primaryabnormality of the mitral valve from secondary regurgitationrelated to AS. Left ventricular size, hypertrophy, and systolicand diastolic functions should be evaluated using standardapproaches, and pulmonary systolic pressure should beestimated from the tricuspid regurgitant jet velocity andestimated right atrial pressure. Mitral regurgitation severitydoes not affect evaluation of AS severity except for twopossible confounders. First, with severe MR, transaortic flowrate may be low resulting in a low gradient even whensevere AS is present; valve area calculations remainaccurate in this setting. Second, a high-velocity MR jet maybe mistaken for the AS jet as both are systolic signalsdirected away from the apex. Timing of the signal is themost reliable way to distinguish the CWD velocity curve ofMR from AS; MR is longer in duration, starting with mitralvalve closure and continuing until mitral valve opening. Theshape of the MR velocity curve also may be helpful withchronic regurgitation but can appear similar to AS withacute severe MR. High driving pressure (high LV pressure due
H. Baumgartner et al.10
by guest on May 6, 2016
Dow
nloaded from
to AS) may cause MR severity overestimation if jet size isprimarily used to evaluate MR. Careful evaluation of MRmechanism is crucial for the decision whether to alsooperate on the mitral valve.
Mitral stenosis (MS) may result in low cardiac output and,therefore, low-flow low-gradient AS.
B.4.7. High cardiac output. High cardiac output in patientson haemodialysis, with anaemia, AV fistula, or other highflow conditions may cause relatively high gradients inthe presence of mild or moderate AS. This may lead tomisdiagnosis of severe disease particularly when it isdifficult to calculate AVA in the presence of dynamic LVOTobstruction. In this situation, the shape of the CWDspectrum with a very early peak may help to quantify theseverity correctly.
B.4.8. Ascending aorta. In addition to evaluation of ASaetiology and haemodynamic severity, the echocardiographicevaluation of adults with aortic valve disease should includeevaluation of the aorta with measurement of diameters atthe sinuses of Valsalva and ascending aorta. Aortic rootdilation is associated with bicuspid aortic valve disease, thecause of AS in 50% of adults and aortic size may impact thetiming and type of intervention. In some cases, additionalimaging with CTor CMR may beneeded to fully assess the aorta.
C. How to grade aortic stenosisAortic stenosis severity is best described by the specificnumerical measures of maximum velocity, mean gradient,and valve area. However, general guidelines have been setforth by the ACC/AHA and ESC for categorizing AS severityas mild, moderate, or severe to provide guidance for clinicaldecision-making. In most patients, these three Level I rec-ommended parameters, in conjunction with clinical data,evaluation of AR and LV functions, are adequate for clinicaldecision-making. However, in selected patients, such asthose with severe LV dysfunction, additional measurementsmay be helpful. Comparable values for indexed valvearea and the dimensionless velocity ratio have been indi-cated in Table 3, and the category of aortic sclerosis, as dis-tinct from mild stenosis, has been added. When aorticsclerosis is present, further quantitation is not needed. Inevaluation of a patient with valvular heart disease, thesecut-off values should be viewed with caution; no single cal-culated number should be relied on for final judgement.Instead, an integrated approach considering AVA, velocity/gradient together with LVF, flow status, and clinicalpresentation is strongly recommended. The ACC/AHA andESC Guidelines for management of valvular heart disease
provide recommendations for classification of severity(Table 3).1,2
A normal AVA in adults is �3.0–4.0 cm2. Severe stenosis ispresent when valve area is reduced to �25% of the normalsize so that a value of 1.0 cm2 is one reasonable definitionof severe AS in adults. The role of indexing for body size iscontroversial, primarily because the current algorithms fordefining body size [such as body-surface area (BSA)] do notnecessarily reflect the normal AVA in obese patients,because valve area does not increase with excess bodyweight. However, indexing valve area for BSA is importantin children, adolescents, and small adults as valve areamay seem severely narrowed when only moderate stenosisis present. Another approach to indexing for body size isto consider the LVOT to AS velocity ratio, in addition tovalve area, in clinical decision-making.
We recommend reporting of both AS maximum velocityand mean gradient. In observational clinical studies, amaximum jet velocity of 4 m/s corresponds to a mean gradi-ent of �40 mmHg and a maximum velocity of 3 m/s corre-sponds to a mean gradient of �20 mmHg. Although thereis overall correlation between peak gradient and mean gra-dient, the relationship between peak and mean gradientsdepends on the shape of the velocity curve, which varieswith stenosis severity and flow rate.
In clinical practice, many patients have an apparent dis-crepancy in stenosis severity as defined by maximum vel-ocity (and mean gradient) compared with the calculatedvalve area.
The first step in patients with either a valve area larger orsmaller than expected for a given AS maximum velocity (ormean gradient) is to verify the accuracy of the echocardio-graphic data (see above for sources of error).
The next step in evaluation of an apparent discrepancy inmeasure of AS severity is to evaluate LV ejection fractionand the severity of co-existing AR. If cardiac output is lowdue to small ventricular chamber or a low ejection fraction,a low AS velocity may be seen with a small valve area. If trans-aortic flow rate is high due to co-existing AR, valve area maybe �1.0 cm2 even though AS velocity and mean gradient arehigh. It may be useful to compare the SV calculated fromthe LVOT diameter and velocity with the SV measured on 2Dechocardiography by the biplane apical method, to confirma low or high transaortic volume flow rate.
When review of primary data confirms accuracy ofmeasurements and there is no clinical evidence for a revers-ible high output state (e.g. sepsis, hyperthyroidism), thepatient with an AS velocity of .4 m/s and a valve area of�1.0 cm2 most likely has combined moderate AS/AR or alarge body size. The AS velocity is a better predictor of
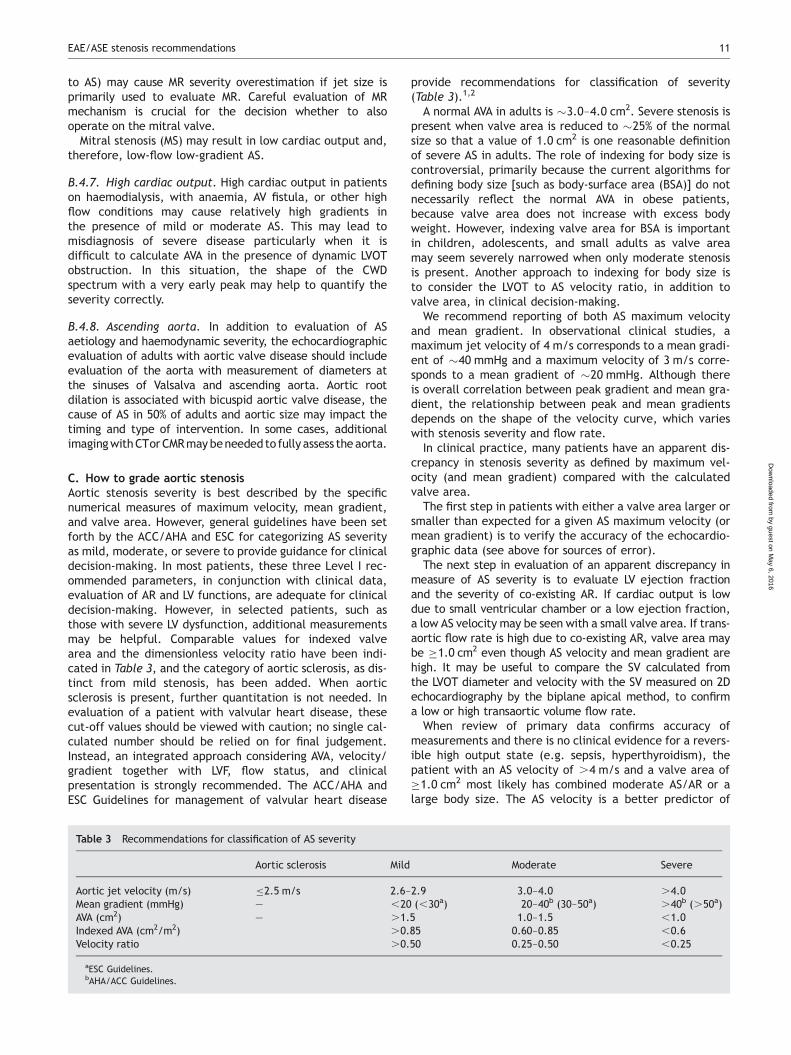
Table 3 Recommendations for classification of AS severity
Aortic sclerosis Mild Moderate Severe
Aortic jet velocity (m/s) �2.5 m/s 2.6–2.9 3.0–4.0 .4.0Mean gradient (mmHg) — ,20 (,30a) 20–40b (30–50a) .40b (.50a)AVA (cm2) — .1.5 1.0–1.5 ,1.0Indexed AVA (cm2/m2) .0.85 0.60–0.85 ,0.6Velocity ratio .0.50 0.25–0.50 ,0.25
aESC Guidelines.bAHA/ACC Guidelines.
EAE/ASE stenosis recommendations 11
by guest on May 6, 2016
Dow
nloaded from
clinical outcome than valve area in this situation and shouldbe used to define valve disease as ‘severe’.
When review of primary data confirms accuracy ofmeasurements and there is no clinical evidence for a lowcardiac output state, the patient with an aortic velocity of,4.0 m/s and a valve area of ,1.0 cm2 most likely hasonly moderate AS with a small body size. The velocity ofAS is a better measure of stenosis severity when body sizeis small and transvalvular flow rate is normal (Table 4).
III. Mitral stenosis
Echocardiography plays a major role in decision-making forMS, allowing for confirmation of diagnosis, quantitationof stenosis severity and its consequences, and analysis ofvalve anatomy.
A. Causes and anatomic presentation
Mitral stenosis is the most frequent valvular complication ofrheumatic fever. Even in industrialized countries, most casesremain of rheumatic origin as other causes are rare. Giventhe decrease in the prevalence of rheumatic heart diseases,MS has become the least frequent single left-sided valvedisease. However, it still accounts for �10% of left-sidedvalve diseases in Europe and it remains frequent in develop-ing countries.42,43
The main mechanism of rheumatic MS is commissuralfusion. Other anatomic lesions are chordal shortening and
fusion, and leaflet thickening, and later in the diseasecourse, superimposed calcification, which may contributeto the restriction of leaflet motion.
This differs markedly from degenerative MS, in which themain lesion is annular calcification. It is frequently observedin the elderly and associated with hypertension, athero-sclerotic disease, and sometimes AS. However, calcificationof the mitral annulus has few or no haemodynamicconsequences when isolated and causes more often MR thanMS. In rare cases, degenerative MS has haemodynamic conse-quences when leaflet thickening and/or calcification areassociated. This is required to cause restriction of leafletmotion since there is no commissural fusion. Valve thickeningor calcification predominates at the base of the leafletswhereas it affects predominantly the tips in rheumatic MS.
Congenital MS is mainly the consequence of abnormalitiesof the subvalvular apparatus. Other causes are rarelyencountered: inflammatory diseases (e.g. systemic lupus),infiltrative diseases, carcinoid heart disease, anddrug-induced valve diseases. Leaflet thickening and restric-tion are common here, while commissures are rarely fused.
B. How to assess mitral stenosis
B.1. Indices of Stenosis SeverityB.1.1. Pressure gradient (Level 1 Recommendation). Theestimation of the diastolic pressure gradient is derivedfrom the transmitral velocity flow curve using thesimplified Bernoulli equation DP ¼ 4v2.This estimation is reliable, as shown by the good corre-lation with invasive measurement using transseptalcatheterization.44
The use of CWD is preferred to ensure maximal velocitiesare recorded. When pulsed-wave Doppler is used, thesample volume should be placed at the level or just afterleaflet tips.
Doppler gradient is assessed using the apical window inmost cases as it allows for parallel alignment of the ultra-sound beam and mitral inflow. The ultrasound Dopplerbeam should be oriented to minimize the intercept anglewith mitral flow to avoid underestimation of velocities.Colour Doppler in apical view is useful to identify eccentricdiastolic mitral jets that may be encountered in cases ofsevere deformity of valvular and subvalvular apparatus. Inthese cases, the Doppler beam is guided by the highestflow velocity zone identified by colour Doppler.
Optimization of gain settings, beam orientation, and agood acoustic window are needed to obtain well-definedcontours of the Doppler flow. Maximal and mean mitralgradients are calculated by integrated software using thetrace of the Doppler diastolic mitral flow waveformson the display screen. Mean gradient is the relevanthaemodynamic finding (Figure 7). Maximal gradient is oflittle interest as it derives from peak mitral velocity,which is influenced by left atrial compliance and LV diastolicfunction.45
Heart rate at which gradients are measured should alwaysbe reported. In patients with atrial fibrillation, mean gradi-ent should be calculated as the average of five cycles withthe least variation of R–R intervals and as close as possibleto normal heart rate.
Mitral gradient, although reliably assessed by Doppler, isnot the best marker of the severity of MS since it is
Table 4 Resolution of apparent discrepancies in measures of ASseverity
AS velocity .4 m/s and AVA .1.0 cm2
1. Check LVOT diameter measurement and compare withprevious studiesa
2. Check LVOT velocity signal for flow acceleration3. Calculate indexed AVA when
a. Height is ,135 cm (50500)b. BSA ,1.5 m2
c. BMI ,22 (equivalent to 55 kg or 120 lb at this height).4. Evaluate AR severity5. Evaluate for high cardiac output
a. LVOT stroke volumeb. 2D LV EF and stroke volume
Likely causes: high output state, moderate–severe AR, largebody size
AS velocity �4 m/s and AVA �1.0 cm2
1. Check LVOT diameter measurement and compare withprevious studiesa
2. Check LVOT velocity signal for distance from valve3. Calculate indexed AVA when
a. Height is ,135 cm (50500)b. BSA ,1.5 m2
c. BMI ,22 (equivalent to 55 kg or 120 lb at this height).4. Evaluate for low transaortic flow volume
a. LVOT stroke volumeb. 2D LV EF and stroke volumec. MR severityd. Mitral stenosis
5. When EF ,55%a. Assess degree of valve calcificationb. Consider dobutamine stress echocardiography
Likely causes: low cardiac output, small body size, severe MR
H. Baumgartner et al.12
by guest on May 6, 2016
Dow
nloaded from
dependent on the mitral valve area (MVA) as well as anumber of other factors that influence transmitral flowrate, the most important being heart rate, cardiac output,and associated MR.46 However, the consistency betweenmean gradient and other echocardiographic findings shouldbe checked, in particular in patients with poor quality ofother variables (especially planimetry of valve area) orwhen such variables may be affected by additional con-ditions [i.e. pressure half-time (T1/2) in the presence of LVdiastolic dysfunction; see below]. In addition, mean mitralgradient has its own prognostic value, in particular followingballoon mitral commissurotomy.
B.1.2. MVA Planimetry (Level 1 Recommendation).Theoretically, planimetry using 2D echocardiography of themitral orifice has the advantage of being a directmeasurement of MVA and, unlike other methods, does notinvolve any hypothesis regarding flow conditions, cardiacchamber compliance, or associated valvular lesions. Inpractice, planimetry has been shown to have the bestcorrelation with anatomical valve area as assessed onexplanted valves.47 For these reasons, planimetry isconsidered as the reference measurement of MVA.1,2
Planimetry measurement is obtained by direct tracing ofthe mitral orifice, including opened commissures, if appli-cable, on a parasternal short-axis view. Careful scanningfrom the apex to the base of the LV is required to ensure
that the CSA is measured at the leaflet tips. The measure-ment plane should be perpendicular to the mitral orifice,which has an elliptical shape (Figure 8).
Gain setting should be just sufficient to visualize thewhole contour of the mitral orifice. Excessive gain settingmay cause underestimation of valve area, in particularwhen leaflet tips are dense or calcified. Image magnifi-cation, using the zoom mode, is useful to better delineatethe contour of the mitral orifice. The correlation data onplanimetry was performed with fundamental imaging andit is unclear whether the use of harmonic imaging improvesplanimetry measurement.
The optimal timing of the cardiac cycle to measure plani-metry is mid-diastole. This is best performed using the cine-loop mode on a frozen image.
It is recommended to perform several different measure-ments, in particular in patients with atrial fibrillation and inthose who have incomplete commissural fusion (moderateMS or after commissurotomy), in whom anatomical valvearea may be subject to slight changes according to flowconditions.
Although its accuracy justifies systematic attempts toperform planimetry of MS, it may not be feasible even byexperienced echocardiographers when there is a poor acous-tic window or severe distortion of valve anatomy, in particu-lar with severe valve calcifications of the leaflet tips.Although the percentage of patients in whom planimetry is
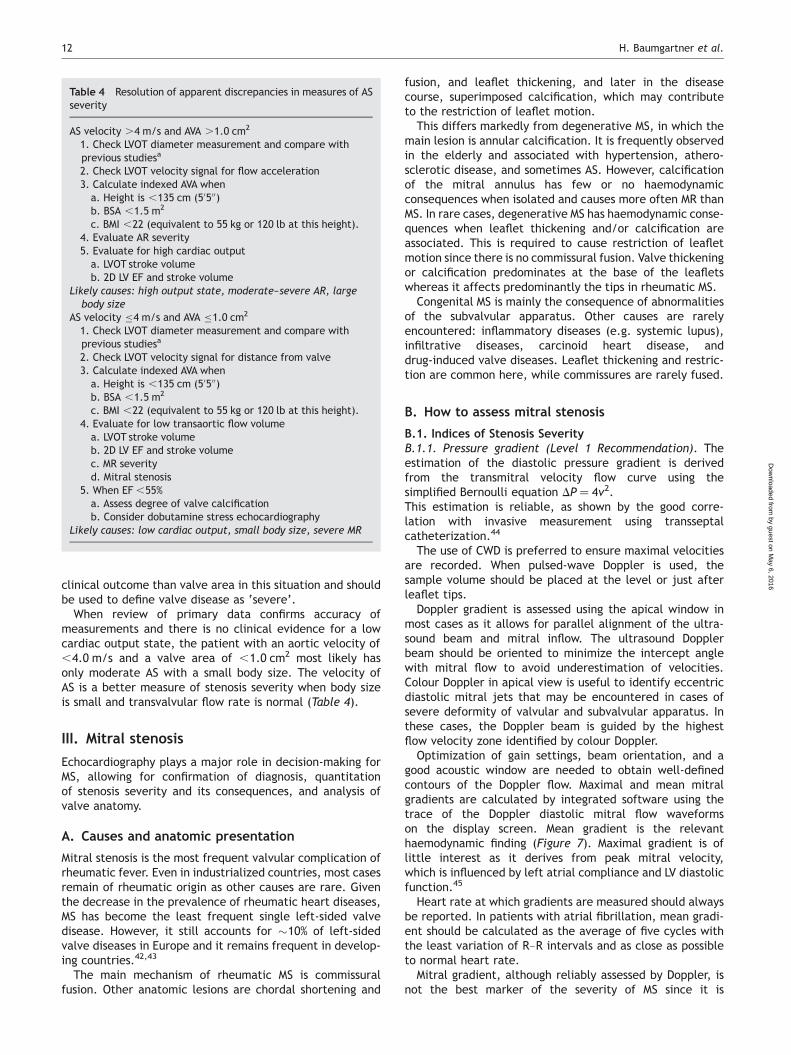
Figure 7 Determination of mean mitral gradient from Doppler diastolic mitral flow in a patient with severe mitral stenosis in atrial fibrillation.Mean gradient varies according to the length of diastole: it is 8 mmHg during a short diastole (A) and 6 mmHg during a longer diastole (B).
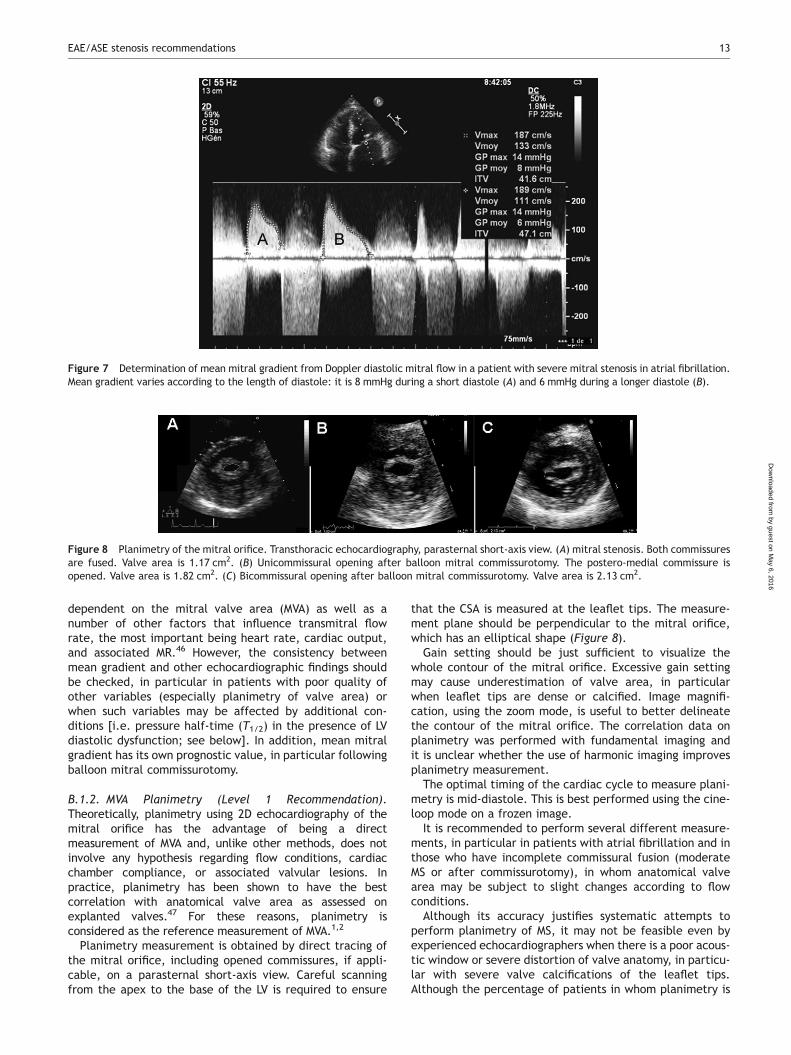
Figure 8 Planimetry of the mitral orifice. Transthoracic echocardiography, parasternal short-axis view. (A) mitral stenosis. Both commissuresare fused. Valve area is 1.17 cm2. (B) Unicommissural opening after balloon mitral commissurotomy. The postero-medial commissure isopened. Valve area is 1.82 cm2. (C) Bicommissural opening after balloon mitral commissurotomy. Valve area is 2.13 cm2.
EAE/ASE stenosis recommendations 13
by guest on May 6, 2016
Dow
nloaded from
not feasible has been reported as low as 5%, this numberhighly depends on the patient population.48 The above-mentioned problems are more frequent in the elderly whorepresent a significant proportion of patients with MS nowin industrialized countries.49
Another potential limitation is that the performance ofplanimetry requires technical expertise. Not all echocardio-graphers have the opportunity to gain the appropriateexperience because of the low prevalence of MS in industri-alized countries. The measurement plane must be optimallypositioned on the mitral orifice. Recent reports suggestedthat real-time 3D echo and 3D-guided biplane imaging isuseful in optimizing the positioning of the measurementplane and, therefore, improving reproducibility.50,51 It alsoimproves the accuracy of planimetry measurement whenperformed by less experienced echocardiographers.52
In the particular case of degenerative MS, planimetry isdifficult and mostly not reliable because of the orifice geo-metry and calcification present.
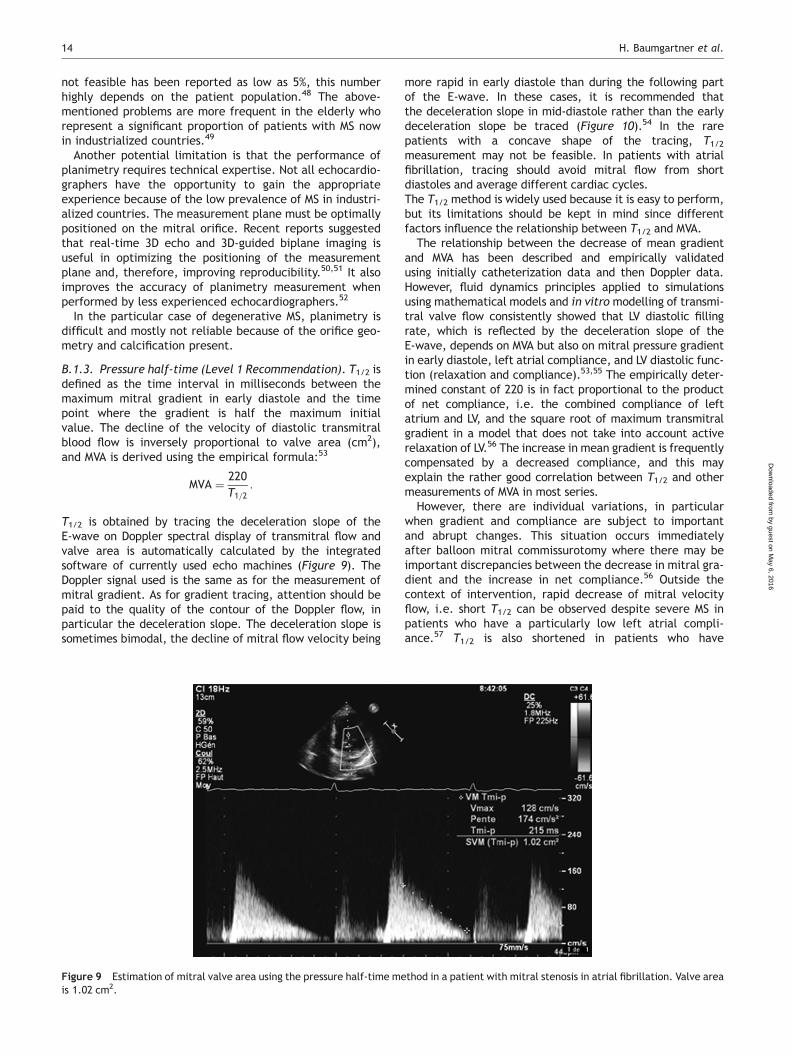
B.1.3. Pressure half-time (Level 1 Recommendation). T1/2 isdefined as the time interval in milliseconds between themaximum mitral gradient in early diastole and the timepoint where the gradient is half the maximum initialvalue. The decline of the velocity of diastolic transmitralblood flow is inversely proportional to valve area (cm2),and MVA is derived using the empirical formula:53
MVA ¼220T1=2
:
T1/2 is obtained by tracing the deceleration slope of theE-wave on Doppler spectral display of transmitral flow andvalve area is automatically calculated by the integratedsoftware of currently used echo machines (Figure 9). TheDoppler signal used is the same as for the measurement ofmitral gradient. As for gradient tracing, attention should bepaid to the quality of the contour of the Doppler flow, inparticular the deceleration slope. The deceleration slope issometimes bimodal, the decline of mitral flow velocity being
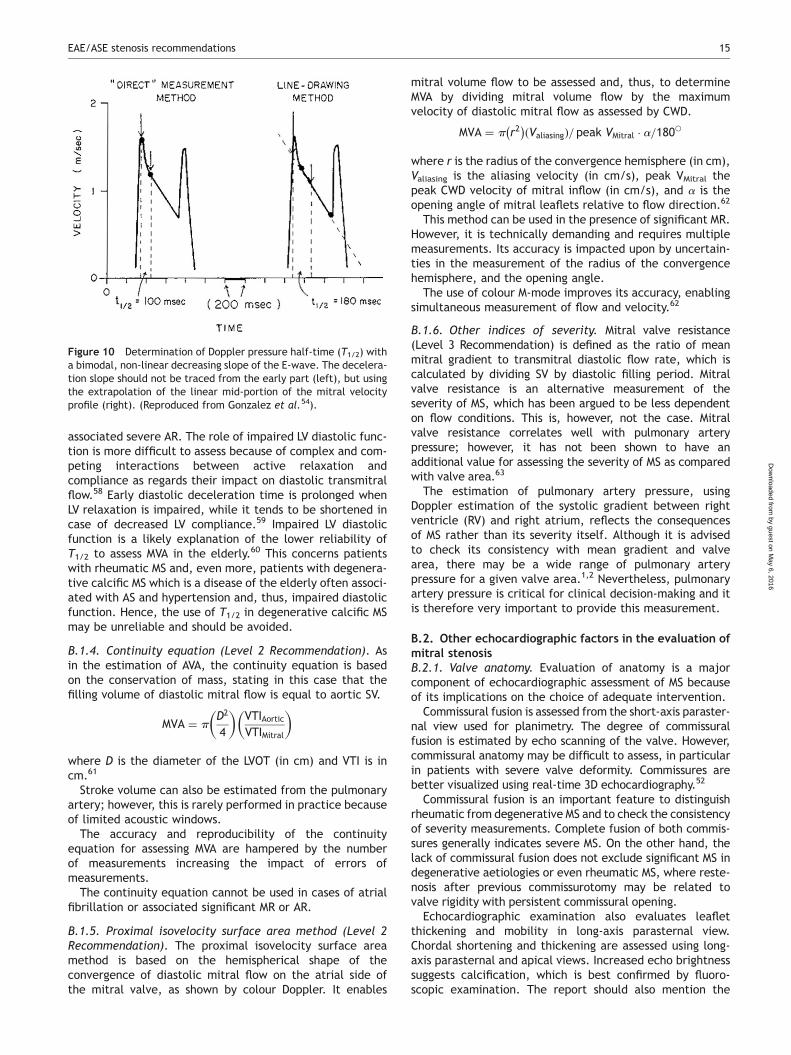
more rapid in early diastole than during the following partof the E-wave. In these cases, it is recommended thatthe deceleration slope in mid-diastole rather than the earlydeceleration slope be traced (Figure 10).54 In the rarepatients with a concave shape of the tracing, T1/2
measurement may not be feasible. In patients with atrialfibrillation, tracing should avoid mitral flow from shortdiastoles and average different cardiac cycles.The T1/2 method is widely used because it is easy to perform,but its limitations should be kept in mind since differentfactors influence the relationship between T1/2 and MVA.
The relationship between the decrease of mean gradientand MVA has been described and empirically validatedusing initially catheterization data and then Doppler data.However, fluid dynamics principles applied to simulationsusing mathematical models and in vitro modelling of transmi-tral valve flow consistently showed that LV diastolic fillingrate, which is reflected by the deceleration slope of theE-wave, depends on MVA but also on mitral pressure gradientin early diastole, left atrial compliance, and LV diastolic func-tion (relaxation and compliance).53,55 The empirically deter-mined constant of 220 is in fact proportional to the productof net compliance, i.e. the combined compliance of leftatrium and LV, and the square root of maximum transmitralgradient in a model that does not take into account activerelaxation of LV.56 The increase in mean gradient is frequentlycompensated by a decreased compliance, and this mayexplain the rather good correlation between T1/2 and othermeasurements of MVA in most series.
However, there are individual variations, in particularwhen gradient and compliance are subject to importantand abrupt changes. This situation occurs immediatelyafter balloon mitral commissurotomy where there may beimportant discrepancies between the decrease in mitral gra-dient and the increase in net compliance.56 Outside thecontext of intervention, rapid decrease of mitral velocityflow, i.e. short T1/2 can be observed despite severe MS inpatients who have a particularly low left atrial compli-ance.57 T1/2 is also shortened in patients who have
Figure 9 Estimation of mitral valve area using the pressure half-time method in a patient with mitral stenosis in atrial fibrillation. Valve areais 1.02 cm2.
H. Baumgartner et al.14
by guest on May 6, 2016
Dow
nloaded from
associated severe AR. The role of impaired LV diastolic func-tion is more difficult to assess because of complex and com-peting interactions between active relaxation andcompliance as regards their impact on diastolic transmitralflow.58 Early diastolic deceleration time is prolonged whenLV relaxation is impaired, while it tends to be shortened incase of decreased LV compliance.59 Impaired LV diastolicfunction is a likely explanation of the lower reliability ofT1/2 to assess MVA in the elderly.60 This concerns patientswith rheumatic MS and, even more, patients with degenera-tive calcific MS which is a disease of the elderly often associ-ated with AS and hypertension and, thus, impaired diastolicfunction. Hence, the use of T1/2 in degenerative calcific MSmay be unreliable and should be avoided.
B.1.4. Continuity equation (Level 2 Recommendation). Asin the estimation of AVA, the continuity equation is basedon the conservation of mass, stating in this case that thefilling volume of diastolic mitral flow is equal to aortic SV.
MVA ¼ pD2
4
� �VTIAortic
VTIMitral
� �
where D is the diameter of the LVOT (in cm) and VTI is incm.61
Stroke volume can also be estimated from the pulmonaryartery; however, this is rarely performed in practice becauseof limited acoustic windows.
The accuracy and reproducibility of the continuityequation for assessing MVA are hampered by the numberof measurements increasing the impact of errors ofmeasurements.
The continuity equation cannot be used in cases of atrialfibrillation or associated significant MR or AR.
B.1.5. Proximal isovelocity surface area method (Level 2Recommendation). The proximal isovelocity surface areamethod is based on the hemispherical shape of theconvergence of diastolic mitral flow on the atrial side ofthe mitral valve, as shown by colour Doppler. It enables
mitral volume flow to be assessed and, thus, to determineMVA by dividing mitral volume flow by the maximumvelocity of diastolic mitral flow as assessed by CWD.
MVA ¼ p r2� �ðValiasingÞ= peak VMitral � a=180W
where r is the radius of the convergence hemisphere (in cm),Valiasing is the aliasing velocity (in cm/s), peak VMitral thepeak CWD velocity of mitral inflow (in cm/s), and a is theopening angle of mitral leaflets relative to flow direction.62
This method can be used in the presence of significant MR.However, it is technically demanding and requires multiplemeasurements. Its accuracy is impacted upon by uncertain-ties in the measurement of the radius of the convergencehemisphere, and the opening angle.
The use of colour M-mode improves its accuracy, enablingsimultaneous measurement of flow and velocity.62
B.1.6. Other indices of severity. Mitral valve resistance(Level 3 Recommendation) is defined as the ratio of meanmitral gradient to transmitral diastolic flow rate, which iscalculated by dividing SV by diastolic filling period. Mitralvalve resistance is an alternative measurement of theseverity of MS, which has been argued to be less dependenton flow conditions. This is, however, not the case. Mitralvalve resistance correlates well with pulmonary arterypressure; however, it has not been shown to have anadditional value for assessing the severity of MS as comparedwith valve area.63
The estimation of pulmonary artery pressure, usingDoppler estimation of the systolic gradient between rightventricle (RV) and right atrium, reflects the consequencesof MS rather than its severity itself. Although it is advisedto check its consistency with mean gradient and valvearea, there may be a wide range of pulmonary arterypressure for a given valve area.1,2 Nevertheless, pulmonaryartery pressure is critical for clinical decision-making and itis therefore very important to provide this measurement.
B.2. Other echocardiographic factors in the evaluation ofmitral stenosisB.2.1. Valve anatomy. Evaluation of anatomy is a majorcomponent of echocardiographic assessment of MS becauseof its implications on the choice of adequate intervention.
Commissural fusion is assessed from the short-axis paraster-nal view used for planimetry. The degree of commissuralfusion is estimated by echo scanning of the valve. However,commissural anatomy may be difficult to assess, in particularin patients with severe valve deformity. Commissures arebetter visualized using real-time 3D echocardiography.52
Commissural fusion is an important feature to distinguishrheumatic from degenerative MS and to check the consistencyof severity measurements. Complete fusion of both commis-sures generally indicates severe MS. On the other hand, thelack of commissural fusion does not exclude significant MS indegenerative aetiologies or even rheumatic MS, where reste-nosis after previous commissurotomy may be related tovalve rigidity with persistent commissural opening.
Echocardiographic examination also evaluates leafletthickening and mobility in long-axis parasternal view.Chordal shortening and thickening are assessed using long-axis parasternal and apical views. Increased echo brightnesssuggests calcification, which is best confirmed by fluoro-scopic examination. The report should also mention the
Figure 10 Determination of Doppler pressure half-time (T1/2) witha bimodal, non-linear decreasing slope of the E-wave. The decelera-tion slope should not be traced from the early part (left), but usingthe extrapolation of the linear mid-portion of the mitral velocityprofile (right). (Reproduced from Gonzalez et al.54).
EAE/ASE stenosis recommendations 15
by guest on May 6, 2016
Dow
nloaded from
homogeneity of impairment of valve anatomy, in particularwith regards to commissural areas in parasternal short-axisview.
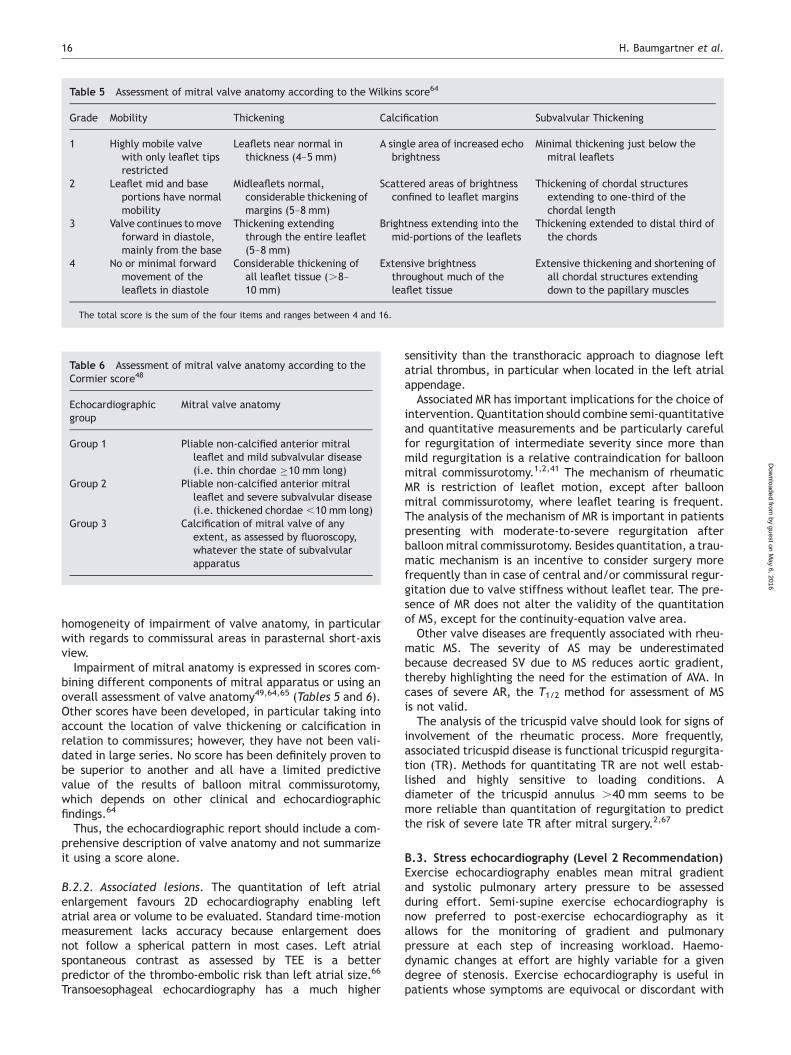
Impairment of mitral anatomy is expressed in scores com-bining different components of mitral apparatus or using anoverall assessment of valve anatomy49,64,65 (Tables 5 and 6).Other scores have been developed, in particular taking intoaccount the location of valve thickening or calcification inrelation to commissures; however, they have not been vali-dated in large series. No score has been definitely proven tobe superior to another and all have a limited predictivevalue of the results of balloon mitral commissurotomy,which depends on other clinical and echocardiographicfindings.64
Thus, the echocardiographic report should include a com-prehensive description of valve anatomy and not summarizeit using a score alone.
B.2.2. Associated lesions. The quantitation of left atrialenlargement favours 2D echocardiography enabling leftatrial area or volume to be evaluated. Standard time-motionmeasurement lacks accuracy because enlargement doesnot follow a spherical pattern in most cases. Left atrialspontaneous contrast as assessed by TEE is a betterpredictor of the thrombo-embolic risk than left atrial size.66
Transoesophageal echocardiography has a much higher
sensitivity than the transthoracic approach to diagnose leftatrial thrombus, in particular when located in the left atrialappendage.
Associated MR has important implications for the choice ofintervention. Quantitation should combine semi-quantitativeand quantitative measurements and be particularly carefulfor regurgitation of intermediate severity since more thanmild regurgitation is a relative contraindication for balloonmitral commissurotomy.1,2,41 The mechanism of rheumaticMR is restriction of leaflet motion, except after balloonmitral commissurotomy, where leaflet tearing is frequent.The analysis of the mechanism of MR is important in patientspresenting with moderate-to-severe regurgitation afterballoon mitral commissurotomy. Besides quantitation, a trau-matic mechanism is an incentive to consider surgery morefrequently than in case of central and/or commissural regur-gitation due to valve stiffness without leaflet tear. The pre-sence of MR does not alter the validity of the quantitationof MS, except for the continuity-equation valve area.
Other valve diseases are frequently associated with rheu-matic MS. The severity of AS may be underestimatedbecause decreased SV due to MS reduces aortic gradient,thereby highlighting the need for the estimation of AVA. Incases of severe AR, the T1/2 method for assessment of MSis not valid.
The analysis of the tricuspid valve should look for signs ofinvolvement of the rheumatic process. More frequently,associated tricuspid disease is functional tricuspid regurgita-tion (TR). Methods for quantitating TR are not well estab-lished and highly sensitive to loading conditions. Adiameter of the tricuspid annulus .40 mm seems to bemore reliable than quantitation of regurgitation to predictthe risk of severe late TR after mitral surgery.2,67
B.3. Stress echocardiography (Level 2 Recommendation)Exercise echocardiography enables mean mitral gradientand systolic pulmonary artery pressure to be assessedduring effort. Semi-supine exercise echocardiography isnow preferred to post-exercise echocardiography as itallows for the monitoring of gradient and pulmonarypressure at each step of increasing workload. Haemo-dynamic changes at effort are highly variable for a givendegree of stenosis. Exercise echocardiography is useful inpatients whose symptoms are equivocal or discordant with
Table 5 Assessment of mitral valve anatomy according to the Wilkins score64
Grade Mobility Thickening Calcification Subvalvular Thickening
1 Highly mobile valvewith only leaflet tipsrestricted
Leaflets near normal inthickness (4–5 mm)
A single area of increased echobrightness
Minimal thickening just below themitral leaflets
2 Leaflet mid and baseportions have normalmobility
Midleaflets normal,considerable thickening ofmargins (5–8 mm)
Scattered areas of brightnessconfined to leaflet margins
Thickening of chordal structuresextending to one-third of thechordal length
3 Valve continues to moveforward in diastole,mainly from the base
Thickening extendingthrough the entire leaflet(5–8 mm)
Brightness extending into themid-portions of the leaflets
Thickening extended to distal third ofthe chords
4 No or minimal forwardmovement of theleaflets in diastole
Considerable thickening ofall leaflet tissue (.8–10 mm)
Extensive brightnessthroughout much of theleaflet tissue
Extensive thickening and shortening ofall chordal structures extendingdown to the papillary muscles
The total score is the sum of the four items and ranges between 4 and 16.
Table 6 Assessment of mitral valve anatomy according to theCormier score48
Echocardiographicgroup
Mitral valve anatomy
Group 1 Pliable non-calcified anterior mitralleaflet and mild subvalvular disease(i.e. thin chordae �10 mm long)
Group 2 Pliable non-calcified anterior mitralleaflet and severe subvalvular disease(i.e. thickened chordae ,10 mm long)
Group 3 Calcification of mitral valve of anyextent, as assessed by fluoroscopy,whatever the state of subvalvularapparatus
H. Baumgartner et al.16
by guest on May 6, 2016
Dow
nloaded from
the severity of MS.1,2 However, thresholds of mitral gradientand pulmonary artery pressure, as stated in guidelines toconsider intervention in asymptomatic patients, rely onlow levels of evidence.1 Estimations of SV and atrioventricu-lar compliance are used for research purposes but have nocurrent clinical application.
Dobutamine stress echocardiography has been shown tohave prognostic value but is a less physiological approachthan exercise echocardiography.68,69
C. How to grade mitral stenosis
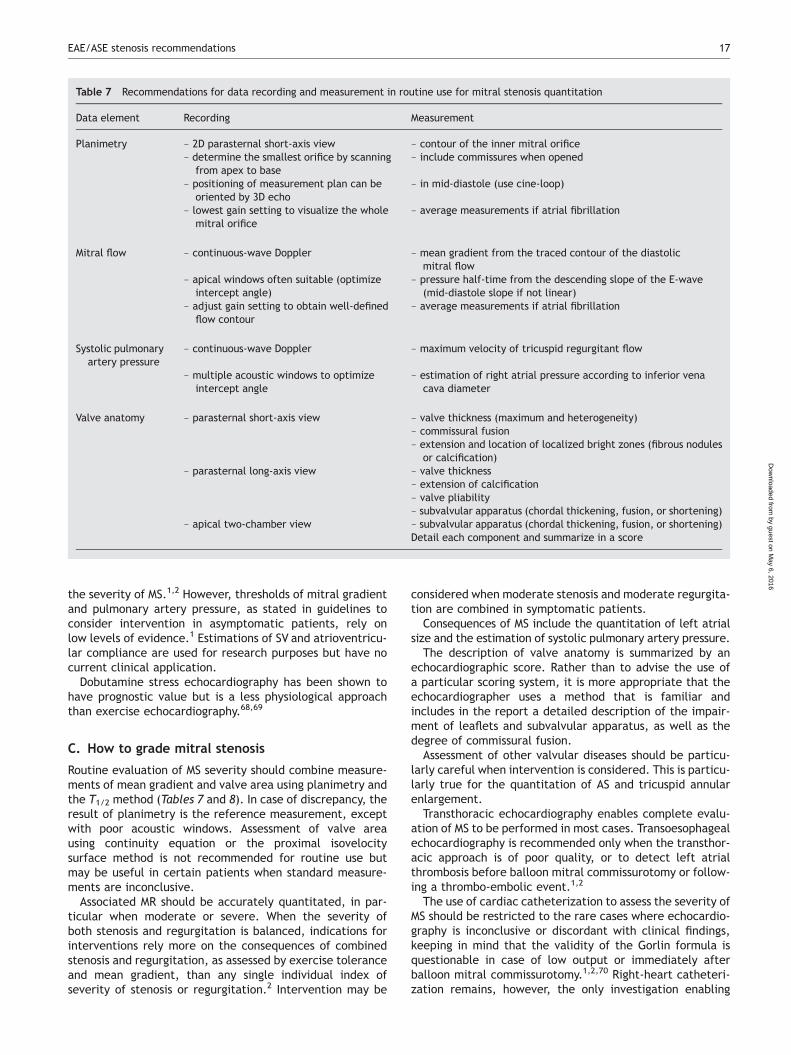
Routine evaluation of MS severity should combine measure-ments of mean gradient and valve area using planimetry andthe T1/2 method (Tables 7 and 8). In case of discrepancy, theresult of planimetry is the reference measurement, exceptwith poor acoustic windows. Assessment of valve areausing continuity equation or the proximal isovelocitysurface method is not recommended for routine use butmay be useful in certain patients when standard measure-ments are inconclusive.
Associated MR should be accurately quantitated, in par-ticular when moderate or severe. When the severity ofboth stenosis and regurgitation is balanced, indications forinterventions rely more on the consequences of combinedstenosis and regurgitation, as assessed by exercise toleranceand mean gradient, than any single individual index ofseverity of stenosis or regurgitation.2 Intervention may be
considered when moderate stenosis and moderate regurgita-tion are combined in symptomatic patients.
Consequences of MS include the quantitation of left atrialsize and the estimation of systolic pulmonary artery pressure.
The description of valve anatomy is summarized by anechocardiographic score. Rather than to advise the use ofa particular scoring system, it is more appropriate that theechocardiographer uses a method that is familiar andincludes in the report a detailed description of the impair-ment of leaflets and subvalvular apparatus, as well as thedegree of commissural fusion.
Assessment of other valvular diseases should be particu-larly careful when intervention is considered. This is particu-larly true for the quantitation of AS and tricuspid annularenlargement.
Transthoracic echocardiography enables complete evalu-ation of MS to be performed in most cases. Transoesophagealechocardiography is recommended only when the transthor-acic approach is of poor quality, or to detect left atrialthrombosis before balloon mitral commissurotomy or follow-ing a thrombo-embolic event.1,2
The use of cardiac catheterization to assess the severity ofMS should be restricted to the rare cases where echocardio-graphy is inconclusive or discordant with clinical findings,keeping in mind that the validity of the Gorlin formula isquestionable in case of low output or immediately afterballoon mitral commissurotomy.1,2,70 Right-heart catheteri-zation remains, however, the only investigation enabling
Table 7 Recommendations for data recording and measurement in routine use for mitral stenosis quantitation
Data element Recording Measurement
Planimetry – 2D parasternal short-axis view – contour of the inner mitral orifice– determine the smallest orifice by scanning
from apex to base– include commissures when opened
– positioning of measurement plan can beoriented by 3D echo
– in mid-diastole (use cine-loop)
– lowest gain setting to visualize the wholemitral orifice
– average measurements if atrial fibrillation
Mitral flow – continuous-wave Doppler – mean gradient from the traced contour of the diastolicmitral flow
– apical windows often suitable (optimizeintercept angle)
– pressure half-time from the descending slope of the E-wave(mid-diastole slope if not linear)
– adjust gain setting to obtain well-definedflow contour
– average measurements if atrial fibrillation
Systolic pulmonaryartery pressure
– continuous-wave Doppler – maximum velocity of tricuspid regurgitant flow
– multiple acoustic windows to optimizeintercept angle
– estimation of right atrial pressure according to inferior venacava diameter
Valve anatomy – parasternal short-axis view – valve thickness (maximum and heterogeneity)– commissural fusion– extension and location of localized bright zones (fibrous nodules
or calcification)– parasternal long-axis view – valve thickness
– extension of calcification– valve pliability– subvalvular apparatus (chordal thickening, fusion, or shortening)
– apical two-chamber view – subvalvular apparatus (chordal thickening, fusion, or shortening)Detail each component and summarize in a score
EAE/ASE stenosis recommendations 17
by guest on May 6, 2016
Dow
nloaded from
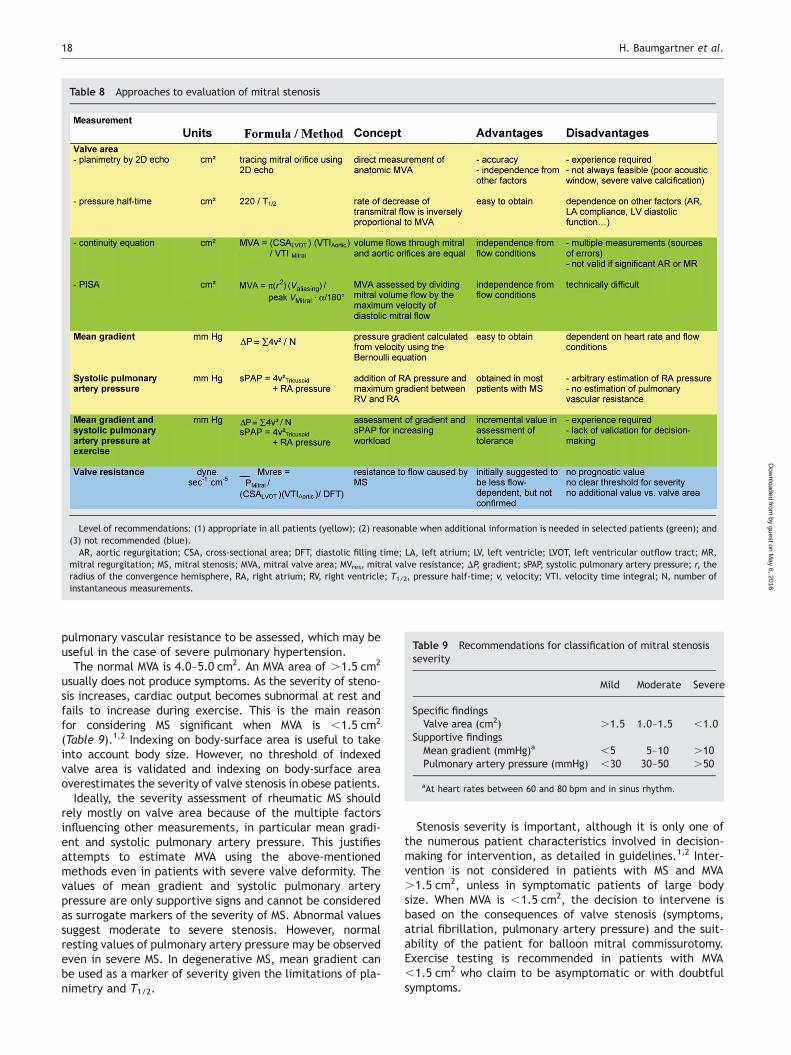
pulmonary vascular resistance to be assessed, which may beuseful in the case of severe pulmonary hypertension.
The normal MVA is 4.0–5.0 cm2. An MVA area of .1.5 cm2
usually does not produce symptoms. As the severity of steno-sis increases, cardiac output becomes subnormal at rest andfails to increase during exercise. This is the main reasonfor considering MS significant when MVA is ,1.5 cm2
(Table 9).1,2 Indexing on body-surface area is useful to takeinto account body size. However, no threshold of indexedvalve area is validated and indexing on body-surface areaoverestimates the severity of valve stenosis in obese patients.
Ideally, the severity assessment of rheumatic MS shouldrely mostly on valve area because of the multiple factorsinfluencing other measurements, in particular mean gradi-ent and systolic pulmonary artery pressure. This justifiesattempts to estimate MVA using the above-mentionedmethods even in patients with severe valve deformity. Thevalues of mean gradient and systolic pulmonary arterypressure are only supportive signs and cannot be consideredas surrogate markers of the severity of MS. Abnormal valuessuggest moderate to severe stenosis. However, normalresting values of pulmonary artery pressure may be observedeven in severe MS. In degenerative MS, mean gradient canbe used as a marker of severity given the limitations of pla-nimetry and T1/2.
Stenosis severity is important, although it is only one ofthe numerous patient characteristics involved in decision-making for intervention, as detailed in guidelines.1,2 Inter-vention is not considered in patients with MS and MVA.1.5 cm2, unless in symptomatic patients of large bodysize. When MVA is ,1.5 cm2, the decision to intervene isbased on the consequences of valve stenosis (symptoms,atrial fibrillation, pulmonary artery pressure) and the suit-ability of the patient for balloon mitral commissurotomy.Exercise testing is recommended in patients with MVA,1.5 cm2 who claim to be asymptomatic or with doubtfulsymptoms.
Table 8 Approaches to evaluation of mitral stenosis
Level of recommendations: (1) appropriate in all patients (yellow); (2) reasonable when additional information is needed in selected patients (green); and(3) not recommended (blue).
AR, aortic regurgitation; CSA, cross-sectional area; DFT, diastolic filling time; LA, left atrium; LV, left ventricle; LVOT, left ventricular outflow tract; MR,mitral regurgitation; MS, mitral stenosis; MVA, mitral valve area; MVres, mitral valve resistance; DP, gradient; sPAP, systolic pulmonary artery pressure; r, theradius of the convergence hemisphere, RA, right atrium; RV, right ventricle; T1/2, pressure half-time; v, velocity; VTI. velocity time integral; N, number ofinstantaneous measurements.
Table 9 Recommendations for classification of mitral stenosisseverity
Mild Moderate Severe
Specific findingsValve area (cm2) .1.5 1.0–1.5 ,1.0
Supportive findingsMean gradient (mmHg)a ,5 5–10 .10Pulmonary artery pressure (mmHg) ,30 30–50 .50
aAt heart rates between 60 and 80 bpm and in sinus rhythm.
H. Baumgartner et al.18
by guest on May 6, 2016
Dow
nloaded from
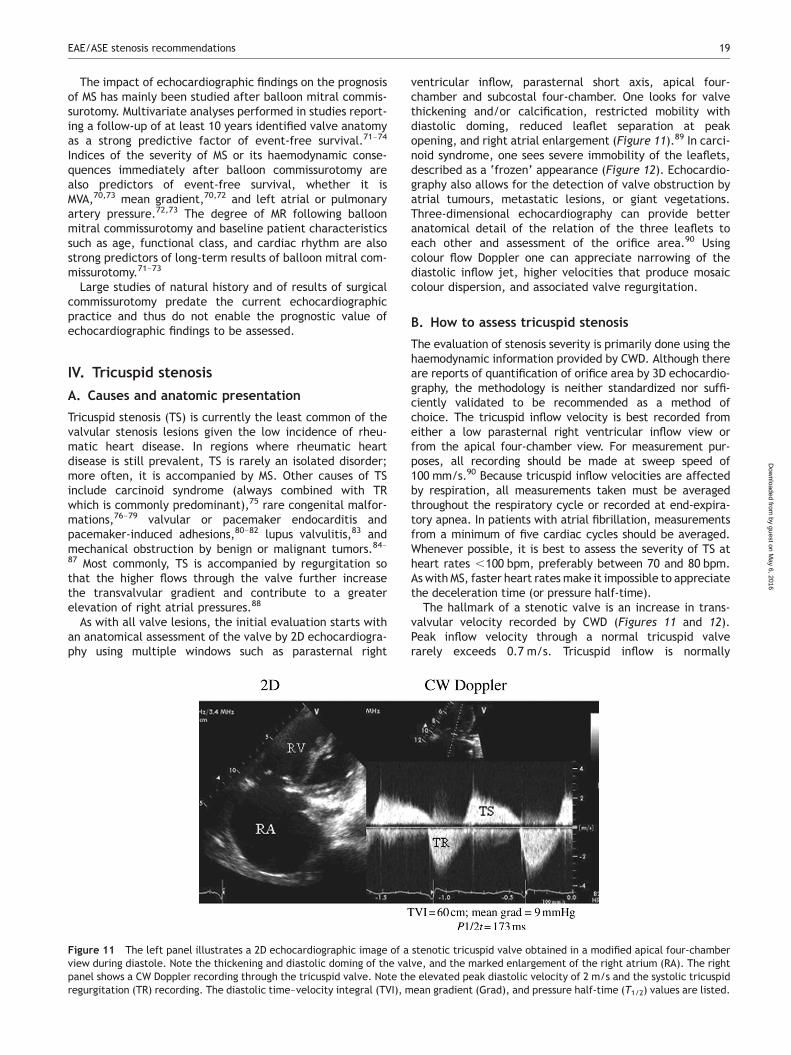
The impact of echocardiographic findings on the prognosisof MS has mainly been studied after balloon mitral commis-surotomy. Multivariate analyses performed in studies report-ing a follow-up of at least 10 years identified valve anatomyas a strong predictive factor of event-free survival.71–74
Indices of the severity of MS or its haemodynamic conse-quences immediately after balloon commissurotomy arealso predictors of event-free survival, whether it isMVA,70,73 mean gradient,70,72 and left atrial or pulmonaryartery pressure.72,73 The degree of MR following balloonmitral commissurotomy and baseline patient characteristicssuch as age, functional class, and cardiac rhythm are alsostrong predictors of long-term results of balloon mitral com-missurotomy.71–73
Large studies of natural history and of results of surgicalcommissurotomy predate the current echocardiographicpractice and thus do not enable the prognostic value ofechocardiographic findings to be assessed.
IV. Tricuspid stenosis
A. Causes and anatomic presentation
Tricuspid stenosis (TS) is currently the least common of thevalvular stenosis lesions given the low incidence of rheu-matic heart disease. In regions where rheumatic heartdisease is still prevalent, TS is rarely an isolated disorder;more often, it is accompanied by MS. Other causes of TSinclude carcinoid syndrome (always combined with TRwhich is commonly predominant),75 rare congenital malfor-mations,76–79 valvular or pacemaker endocarditis andpacemaker-induced adhesions,80–82 lupus valvulitis,83 andmechanical obstruction by benign or malignant tumors.84–
87 Most commonly, TS is accompanied by regurgitation sothat the higher flows through the valve further increasethe transvalvular gradient and contribute to a greaterelevation of right atrial pressures.88
As with all valve lesions, the initial evaluation starts withan anatomical assessment of the valve by 2D echocardiogra-phy using multiple windows such as parasternal right
ventricular inflow, parasternal short axis, apical four-chamber and subcostal four-chamber. One looks for valvethickening and/or calcification, restricted mobility withdiastolic doming, reduced leaflet separation at peakopening, and right atrial enlargement (Figure 11).89 In carci-noid syndrome, one sees severe immobility of the leaflets,described as a ‘frozen’ appearance (Figure 12). Echocardio-graphy also allows for the detection of valve obstruction byatrial tumours, metastatic lesions, or giant vegetations.Three-dimensional echocardiography can provide betteranatomical detail of the relation of the three leaflets toeach other and assessment of the orifice area.90 Usingcolour flow Doppler one can appreciate narrowing of thediastolic inflow jet, higher velocities that produce mosaiccolour dispersion, and associated valve regurgitation.
B. How to assess tricuspid stenosis
The evaluation of stenosis severity is primarily done using thehaemodynamic information provided by CWD. Although thereare reports of quantification of orifice area by 3D echocardio-graphy, the methodology is neither standardized nor suffi-ciently validated to be recommended as a method ofchoice. The tricuspid inflow velocity is best recorded fromeither a low parasternal right ventricular inflow view orfrom the apical four-chamber view. For measurement pur-poses, all recording should be made at sweep speed of100 mm/s.90 Because tricuspid inflow velocities are affectedby respiration, all measurements taken must be averagedthroughout the respiratory cycle or recorded at end-expira-tory apnea. In patients with atrial fibrillation, measurementsfrom a minimum of five cardiac cycles should be averaged.Whenever possible, it is best to assess the severity of TS atheart rates ,100 bpm, preferably between 70 and 80 bpm.As with MS, faster heart rates make it impossible to appreciatethe deceleration time (or pressure half-time).
The hallmark of a stenotic valve is an increase in trans-valvular velocity recorded by CWD (Figures 11 and 12).Peak inflow velocity through a normal tricuspid valverarely exceeds 0.7 m/s. Tricuspid inflow is normally
Figure 11 The left panel illustrates a 2D echocardiographic image of a stenotic tricuspid valve obtained in a modified apical four-chamberview during diastole. Note the thickening and diastolic doming of the valve, and the marked enlargement of the right atrium (RA). The rightpanel shows a CW Doppler recording through the tricuspid valve. Note the elevated peak diastolic velocity of 2 m/s and the systolic tricuspidregurgitation (TR) recording. The diastolic time–velocity integral (TVI), mean gradient (Grad), and pressure half-time (T1/2) values are listed.
EAE/ASE stenosis recommendations 19
by guest on May 6, 2016
Dow
nloaded from
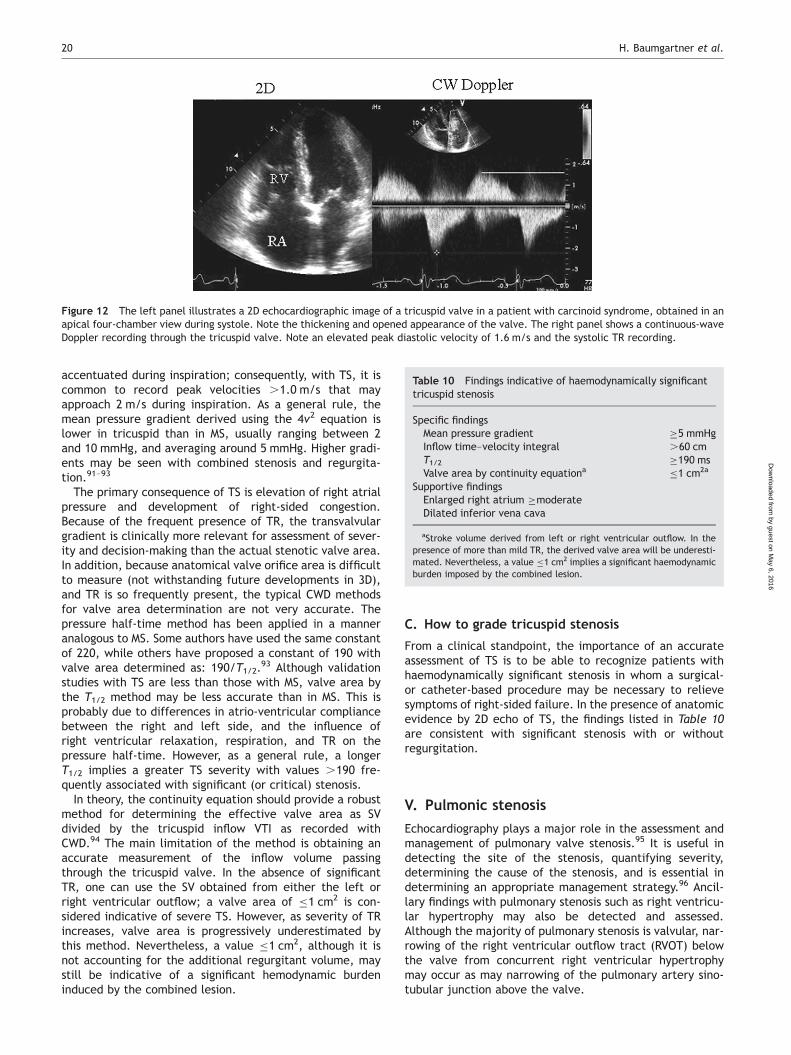
accentuated during inspiration; consequently, with TS, it iscommon to record peak velocities .1.0 m/s that mayapproach 2 m/s during inspiration. As a general rule, themean pressure gradient derived using the 4v2 equation islower in tricuspid than in MS, usually ranging between 2and 10 mmHg, and averaging around 5 mmHg. Higher gradi-ents may be seen with combined stenosis and regurgita-tion.91–93
The primary consequence of TS is elevation of right atrialpressure and development of right-sided congestion.Because of the frequent presence of TR, the transvalvulargradient is clinically more relevant for assessment of sever-ity and decision-making than the actual stenotic valve area.In addition, because anatomical valve orifice area is difficultto measure (not withstanding future developments in 3D),and TR is so frequently present, the typical CWD methodsfor valve area determination are not very accurate. Thepressure half-time method has been applied in a manneranalogous to MS. Some authors have used the same constantof 220, while others have proposed a constant of 190 withvalve area determined as: 190/T1/2.
93 Although validationstudies with TS are less than those with MS, valve area bythe T1/2 method may be less accurate than in MS. This isprobably due to differences in atrio-ventricular compliancebetween the right and left side, and the influence ofright ventricular relaxation, respiration, and TR on thepressure half-time. However, as a general rule, a longerT1/2 implies a greater TS severity with values .190 fre-quently associated with significant (or critical) stenosis.
In theory, the continuity equation should provide a robustmethod for determining the effective valve area as SVdivided by the tricuspid inflow VTI as recorded withCWD.94 The main limitation of the method is obtaining anaccurate measurement of the inflow volume passingthrough the tricuspid valve. In the absence of significantTR, one can use the SV obtained from either the left orright ventricular outflow; a valve area of �1 cm2 is con-sidered indicative of severe TS. However, as severity of TRincreases, valve area is progressively underestimated bythis method. Nevertheless, a value �1 cm2, although it isnot accounting for the additional regurgitant volume, maystill be indicative of a significant hemodynamic burdeninduced by the combined lesion.
C. How to grade tricuspid stenosis
From a clinical standpoint, the importance of an accurateassessment of TS is to be able to recognize patients withhaemodynamically significant stenosis in whom a surgical-or catheter-based procedure may be necessary to relievesymptoms of right-sided failure. In the presence of anatomicevidence by 2D echo of TS, the findings listed in Table 10are consistent with significant stenosis with or withoutregurgitation.
V. Pulmonic stenosis
Echocardiography plays a major role in the assessment andmanagement of pulmonary valve stenosis.95 It is useful indetecting the site of the stenosis, quantifying severity,determining the cause of the stenosis, and is essential indetermining an appropriate management strategy.96 Ancil-lary findings with pulmonary stenosis such as right ventricu-lar hypertrophy may also be detected and assessed.Although the majority of pulmonary stenosis is valvular, nar-rowing of the right ventricular outflow tract (RVOT) belowthe valve from concurrent right ventricular hypertrophymay occur as may narrowing of the pulmonary artery sino-tubular junction above the valve.
Figure 12 The left panel illustrates a 2D echocardiographic image of a tricuspid valve in a patient with carcinoid syndrome, obtained in anapical four-chamber view during systole. Note the thickening and opened appearance of the valve. The right panel shows a continuous-waveDoppler recording through the tricuspid valve. Note an elevated peak diastolic velocity of 1.6 m/s and the systolic TR recording.
Table 10 Findings indicative of haemodynamically significanttricuspid stenosis
Specific findingsMean pressure gradient �5 mmHgInflow time–velocity integral .60 cmT1/2 �190 msValve area by continuity equationa
�1 cm2a
Supportive findingsEnlarged right atrium �moderateDilated inferior vena cava
aStroke volume derived from left or right ventricular outflow. In thepresence of more than mild TR, the derived valve area will be underesti-mated. Nevertheless, a value �1 cm2 implies a significant haemodynamicburden imposed by the combined lesion.
H. Baumgartner et al.20
by guest on May 6, 2016
Dow
nloaded from
A. Causes and anatomic presentation
Pulmonary stenosis is almost always congenital in origin. Thenormal pulmonary valve is trileaflet. The congenitallystenotic valve may be trileaflet, bicuspid, unicuspid, ordysplastic.97
Acquired stenosis of the pulmonary valve is very uncom-mon. Rheumatic pulmonary stenosis is rare even when thevalve is affected by the rheumatic process.98 Carcinoiddisease is the commonest cause of acquired pulmonaryvalve disease (combined stenosis and regurgitation withusually predominant regurgitation) and this may be suffi-ciently severe to require prosthetic replacement. Varioustumors may compress the RV outflow tract leading to func-tional pulmonary stenosis. These tumors may arise fromwithin the heart or associated vasculature or be externalto the heart and compress from without.99,100 Pulmonaryvalve stenosis may also occur as part of more complex con-genital lesions such as tetralogy of Fallot, complete atrio-ventricular canal, double outlet RV, and univentricularheart. Peripheral pulmonary artery stenosis may co-existwith valvular pulmonary stenosis such as in Noonan’s syn-drome and Williams syndrome.
Stenosis below (proximal to) the pulmonary valve mayresult from a number of causes, both congenital andacquired. Congenital ventricular septal defect (VSD) mayalso be associated with RV outflow tract obstruction second-ary to development of obstructive midcavitary or infundibu-lar muscle bundles (double chamber RV) or in rare cases as aresult of the jet lesion produced by the VSD in this area.Severe right ventricular hypertrophy of any cause but insome cases caused by valvular pulmonary stenosis itselfmay be responsible for narrowing of the infundibular areabelow the pulmonary valve. Iatrogenic causes include priorsurgery or intervention on this area. Other causes includehypertrophic or infiltrative processes such as hypertrophicobstructive cardiomyopathy or glycogen storage disordersand compression from a tumour or vascular structure.
Stenosis of the pulmonary artery above the valve (distal tothe valve) may occur in the main pulmonary trunk at thebifurcation, or more distally in the branch vessels. In rareinstances, a membrane just above the valve may cause ste-nosis. Pulmonary artery stenosis may occur as an isolatedfinding without other malformations.
B. How to grade pulmonary stenosis
Pulmonic stenosis severityQuantitative assessment of pulmonary stenosis severity is
based mainly on the transpulmonary pressure gradient. Cal-culation of pulmonic valve area by planimetry is not possiblesince the required image plane is in general not available.Continuity equation or proximal isovelocity surface areamethod, although feasible in principle, has not been vali-dated in pulmonary stenosis and is rarely performed.
B.1.1. Pressure gradient. The estimation of the systolicpressure gradient is derived from the transpulmonaryvelocity flow curve using the simplified Bernoulli equationDP ¼ 4v2.
This estimation is reliable, as shown by the good corre-lation with invasive measurement using cardiac catheteriza-tion.101 Continuous-wave Doppler is used to assess theseverity when even mild stenosis is present. It is important
to line up the Doppler sample volume parallel to the flowwith the aid of colour flow mapping where appropriate. Inadults, this is usually most readily performed from a para-sternal short-axis view but in children and in some adultsthe highest gradients may be found from the subcostalwindow. A modified apical five-chamber view may also beused where the transducer is angled clockwise to bring inthe RV outflow tract. Ideally, the highest velocity in multipleviews should be used for the determination.102,103
In most instances of valvular pulmonary stenosis, themodified Bernoulli equation works well and there is noneed to account for the proximal velocity as this is usually,1 m/s. There are exceptions to this, however. In thesetting of subvalvular or infundibular stenosis and pulmonarystenosis as part of a congenital syndrome or as a result of RVhypertrophy, the presence of two stenoses in series maymake it impossible to ascertain precisely the individual con-tribution of each. In addition, such stenoses in series maycause significant PR resulting in a higher Doppler gradientcompared with the net pressure drop across both ste-noses.104 Pulsed-wave Doppler may be useful to detect thesites of varying levels of obstruction in the outflow tractand in lesser degrees of obstruction may allow a full evalu-ation of it. Muscular infundibular obstruction is frequentlycharacterized by a late peaking systolic jet that appears‘dagger shaped’, reflecting the dynamic nature of theobstruction; this pattern can be useful is separatingdynamic muscular obstruction from fixed valvular obstruc-tion, where the peak velocity is generated early in systole.
In certain situations, TEE may allow a more accurateassessment of the pulmonary valve and RVOT. The pulmon-ary valve may be identified from a mid-oesophagealwindow at varying transducer positions from 50 to 908,anterior to the aortic valve. The RVOT is often well seenin this view. It is in general impossible to line up CW to accu-rately ascertain maximal flow velocity. Other windows inwhich the pulmonary outflow tract may be interrogatedinclude the deep transgastric view in which by appropriatetorquing of the transducer, the RV inflow and outflow maybe appreciated in a single image. This view can allow accu-rate alignment of the Doppler beam with the area of subval-var/valvular stenosis through the RV outflow tract.
In pulmonary valve stenosis, the pressure gradient acrossthe valve is used to ascertain severity of the lesion moreso than in left-sided valve conditions due in part to the dif-ficulty in obtaining an accurate assessment of pulmonaryvalve area. The following definitions of severity have beendefined in the 2006 American College of Cardiology/American Heart Association (ACC/AHA) guidelines on themanagement of valvular heart disease:1
Severe stenosis (Table 11): a peak jet velocity .4 m/s (peakgradient .64 mmHg) Moderate stenosis: peak jet velocityof 3–4 m/s (peak gradient 36–64 mmHg)
Table 11 Grading of pulmonary stenosis
Mild Moderate Severe
Peak velocity (m/s) ,3 3–4 .4Peak gradient (mmHg) ,36 36–64 .64
EAE/ASE stenosis recommendations 21
by guest on May 6, 2016
Dow
nloaded from
Mild stenosis: peak jet velocity is ,3 m/s (peak gradient lessthan 36 mmHg).
In determining the need for intervention, no specificDoppler gradients have been agreed on.
Severity of pulmonary stenosis using Doppler gradientshas been based on catheterization data with demonstrationof reasonable correlation between instantaneous peakDoppler gradients and peak-to-peak gradients obtained bycatheterization. Typically though, Doppler peak gradientstend to be higher than peak-to-peak catheterization gradi-ents.102 Doppler mean gradient has been shown in onestudy to correlate better with peak-to-peak catheterizationgradient but is not commonly used.105
B.1.2. Other indices of severity. A useful index of severity isto determine the RV systolic pressure in patients withpulmonary stenosis from the tricuspid regurgitant velocityand the addition of an estimate of right atrial pressure.The pulmonary artery systolic pressure should be RVsystolic pressure 2 pulmonary valve pressure gradient. Insettings where there are multiple stenoses in the RVoutflow tract or in the more peripheral pulmonary tree(sometimes associated with valvular pulmonary stenosis),the failure of the measured pulmonary valve gradient toaccount for much of the RV systolic pressure may be a cluefor the presence of alternative stenoses.
B.1.3. Valve anatomy. Evaluation of anatomy is important indefining where the stenosis is maximal, as discussed above.Valve morphology is often evident especially the thin mobileleaflets seen with the dome-shaped valve. Dysplastic leafletsmove little and are rarely associated with the post-stenoticdilatation common in dome-shaped leaflets. Calcification ofthe valve is relatively rare so the valve appearance does notplay a huge role in decisions for balloon valvuloplasty.However, the size of the pulmonary annulus should bemeasured in order to define the optimal balloon size forsuccessful dilatation of the valve.106
B.1.4. Associated lesions. Pulmonic stenosis especiallywhen severe may be associated with right ventricularhypertrophy, eventually right ventricular enlargement, andright atrial enlargement. Given the unusual shape of theRV and its proximity to the chest wall, accurate estimationof RV hypertrophy and enlargement may be difficult. Theparasternal long-axis and subcostal long-axis views areoften best in assessing RV hypertrophy. The normalthickness of the RV is �2–3 mm but given the difficultiesin estimating thickness, a thickness of .5 mm is usuallyconsidered abnormal. RV enlargement is typically assessedin the apical or subcostal four-chamber view.107–109
As described above, pulmonary stenosis may form part ofother syndromes or may be associated with other congenitallesions. Dilatation of the pulmonary artery beyond the valveis common and is due to weakness in the arterial wall in amanner analogous to bicuspid aortic valve and is not necess-arily commensurate with the degree of obstruction. Detec-tion of other lesions such as infundibular stenosis, VSD, ortetralogy of Fallot is all important in the assessment ofthese patients.
Acknowledgements
We would like to thank Peter Frommelt MD, for his review of the pul-monary stenosis section and Gloria Healy for her technical assist-ance. Conflict of interest: B.I. received Speaker’s Fee fromEdwards Lifesciences, Sanofi-Aventis. The following stated no con-flict of interest to disclose: H.B., J.H., J.B., J.B.C., A.E., B.P.G.,C.M.O., P.A.P., and M.Q.
References1. Bonow RO, Carabello BA, Chatterjee K, de Leon CC Jr, Faxon DP,
Freed MD et al. ACC/AHA 2006 guidelines for the management ofpatients with valvular heart disease: a report of the American Collegeof Cardiology/American Heart Association Task Force on Practice Guide-lines (writing Committee to Revise the 1998 guidelines for the manage-ment of patients with valvular heart disease) developed in collaborationwith the Society of Cardiovascular Anesthesiologists endorsed by theSociety for Cardiovascular Angiography and Interventions and theSociety of Thoracic Surgeons. J Am Coll Cardiol 2006;48:e1–148.
2. Vahanian A, Baumgartner H, Bax J, Butchart E, Dion R, Filippatos Get al. Guidelines on the management of valvular heart disease: TheTask Force on the Management of Valvular Heart Disease of the EuropeanSociety of Cardiology. Eur Heart J 2007;28:230–68.
3. Chambers J, Bach D, Dumesnil J, Otto C, Shah P, Thomas J. Crossing theaortic valve in severe aortic stenosis: no longer acceptable? J HeartValve Dis 2004;13:344–6.
4. Roberts WC, Ko JM. Frequency by decades of unicuspid, bicuspid, andtricuspid aortic valves in adults having isolated aortic valve replacementfor aortic stenosis, with or without associated aortic regurgitation.Circulation 2005;111:920–5.
5. Nistri S, Sorbo MD, Marin M, Palisi M, Scognamiglio R, Thiene G. Aorticroot dilatation in young men with normally functioning bicuspid aorticvalves. Heart 1999;82:19–22.
6. Schaefer BM, Lewin MB, Stout KK, Byers PH, Otto CM. Usefulness ofbicuspid aortic valve phenotype to predict elastic properties of theascending aorta. Am J Cardiol 2007;99:686–90.
7. Rosenhek R, Binder T, Porenta G, Lang I, Christ G, Schemper M et al. Pre-dictors of outcome in severe, asymptomatic aortic stenosis. N Engl JMed 2000;343:611–7.
8. Currie PJ, Seward JB, Reeder GS, Vlietstra RE, Bresnahan DR,Bresnahan JF et al. Continuous-wave Doppler echocardiographic assess-ment of severity of calcific aortic stenosis: a simultaneous Doppler-catheter correlative study in 100 adult patients. Circulation 1985;71:1162–9.
9. Smith MD, Kwan OL, DeMaria AN. Value and limitations of continuous-wave Doppler echocardiography in estimating severity of valvular steno-sis. J Am Med Assoc 1986;255:3145–51.
10. Burwash IG, Forbes AD, Sadahiro M, Verrier ED, Pearlman AS, Thomas Ret al. Echocardiographic volume flow and stenosis severity measureswith changing flow rate in aortic stenosis. Am J Physiol 1993;265(5 Pt2):H1734–43.
11. Baumgartner H, Stefenelli T, Niederberger J, Schima H, Maurer G.‘Overestimation’ of catheter gradients by Doppler ultrasound inpatients with aortic stenosis: a predictable manifestation of pressurerecovery. J Am Coll Cardiol 1999;33:1655–61.
12. Otto CM, Burwash IG, Legget ME, Munt BI, Fujioka M, Healy NL et al. Pro-spective study of asymptomatic valvular aortic stenosis. Clinical, echo-cardiographic, and exercise predictors of outcome. Circulation 1997;95:2262–70.
13. Pellikka PA, Sarano ME, Nishimura RA, Malouf JF, Bailey KR, Scott CGet al. Outcome of 622 adults with asymptomatic, hemodynamicallysignificant aortic stenosis during prolonged follow-up. Circulation2005;111:3290–5.
14. Zoghbi WA, Farmer KL, Soto JG, Nelson JG, Quinones MA. Accurate non-invasive quantification of stenotic aortic valve area by Doppler echocar-diography. Circulation 1986;73:452–9.
15. Otto CM, Pearlman AS, Comess KA, Reamer RP, Janko CL, Huntsman LLet al. Determination of the stenotic aortic valve area in adults usingDoppler echocardiography. J Am Coll Cardiol 1986;7:509–17.
16. Baumgartner H, Kratzer H, Helmreich G, Kuehn P. Determination ofaortic valve area by Doppler echocardiography using the continuityequation: a critical evaluation. Cardiology 1990;77:101–11.
17. Evangelista A, Garcia-Dorado D, Garcia del Castillo H, Gonzalez-Alujas T,Soler-Soler J. Cardiac index quantification by Doppler ultrasound in
H. Baumgartner et al.22
by guest on May 6, 2016
Dow
nloaded from
patients without left ventricular outflow tract abnormalities. J Am CollCardiol 1995;25:710–6.
18. Oh JK, Taliercio CP, Holmes DR Jr, Reeder GS, Bailey KR, Seward JB et al.Prediction of the severity of aortic stenosis by Doppler aortic valve areadetermination: prospective Doppler-catheterization correlation in 100patients. J Am Coll Cardiol 1988;11:1227–34.
19. Rosenhek R, Klaar U, Schemper M, Scholten C, Heger M, Gabriel H et al.Mild and moderate aortic stenosis. Natural history and risk stratificationby echocardiography. Eur Heart J 2004;25:199–205.
20. Gilon D, Cape EG, Handschumacher MD, Song JK, Solheim J, VanAuker Met al. Effect of three-dimensional valve shape on the hemodynamics ofaortic stenosis: three-dimensional echocardiographic stereolithographyand patient studies. J Am Coll Cardiol 2002;40:1479–86.
21. Otto CM, Pearlman AS, Kraft CD, Miyake-Hull CY, Burwash IG,Gardner CJ, Physiologic changes with maximal exercise in asymptomaticvalvular aortic stenosis assessed by Doppler echocardiography. J Am CollCardiol 1992;20:1160–7.
22. Lancellotti P, Lebois F, Simon M, Tombeux C, Chauvel C, Pierard LA.Prognostic importance of quantitative exercise Doppler echocardiogra-phy in asymptomatic valvular aortic stenosis. Circulation 2005;112(9Suppl):I377–82.
23. Otto CM, Pearlman AS. Doppler echocardiography in adults with sympto-matic aortic stenosis. Diagnostic utility and cost-effectiveness. ArchIntern Med 1988;148:2553–60.
24. Okura H, Yoshida K, Hozumi T, Akasaka T, Yoshikawa J. Planimetry andtransthoracic two-dimensional echocardiography in noninvasive assess-ment of aortic valve area in patients with valvular aortic stenosis.J Am Coll Cardiol 1997;30:753–9.
25. Cormier B, Iung B, Porte JM, Barbant S, Vahanian A. Value of multiplanetransesophageal echocardiography in determining aortic valve area inaortic stenosis. Am J Cardiol 1996;77:882–5.
26. Goland S, Trento A, Iida K, Czer LS, De Robertis M, Naqvi TZ et al. Assess-ment of aortic stenosis by three-dimensional echocardiography: anaccurate and novel approach. Heart 2007;93:801–7.
27. Bermejo J, Odreman R, Feijoo J, Moreno MM, Gomez-Moreno P,Garcia-Fernandez MA. Clinical efficacy of Doppler-echocardiographicindices of aortic valve stenosis: a comparative test-based analysis ofoutcome. J Am Coll Cardiol 2003;41:142–51.
28. Bermejo J, Garcia-Fernandez MA, Torrecilla EG, Bueno H, Moreno MM,San Roman D et al. Effects of dobutamine on Doppler echocardiographicindexes of aortic stenosis. J Am Coll Cardiol 1996;28: 1206–13.
29. Burwash IG, Thomas DD, Sadahiro M, Pearlman AS, Verrier ED, Thomas Ret al. Dependence of Gorlin formula and continuity equation valve areason transvalvular volume flow rate in valvular aortic stenosis. Circulation1994;89:827–35.
30. Blais C, Burwash IG, Mundigler G, Dumesnil JG, Loho N, Rader F et al.Projected valve area at normal flow rate improves the assessment ofstenosis severity in patients with low-flow, low-gradient aortic stenosis:the multicenter TOPAS (Truly or Pseudo-Severe Aortic Stenosis) study.Circulation 2006;113:711–21.
31. Briand M, Dumesnil JG, Kadem L, Tongue AG, Rieu R, Garcia D et al.Reduced systemic arterial compliance impacts significantly on left ven-tricular afterload and function in aortic stenosis: implications for diag-nosis and treatment. J Am Coll Cardiol 2005;46:291–8.
32. Niederberger J, Schima H, Maurer G, Baumgartner H. Importance ofpressure recovery for the assessment of aortic stenosis by Doppler ultra-sound. Role of aortic size, aortic valve area, and direction of the steno-tic jet in vitro. Circulation 1996;94:1934–40.
33. Monin JL, Monchi M, Gest V, Duval-Moulin AM, Dubois-Rande JL,Gueret P. Aortic stenosis with severe left ventricular dysfunction andlow transvalvular pressure gradients: risk stratification by low-dosedobutamine echocardiography. J Am Coll Cardiol 2001;37:2101–7.
34. Nishimura RA, Grantham JA, Connolly HM, Schaff HV, Higano ST,Holmes DR Jr. Low-output, low-gradient aortic stenosis in patientswith depressed left ventricular systolic function: the clinical utility ofthe dobutamine challenge in the catheterization laboratory. Circulation2002;106:809–13.
35. Takeda S, Rimington H, Chambers J. The relation between transaorticpressure difference and flow during dobutamine stress echocardiogra-phy in patients with aortic stenosis. Heart 1999;82:11–4.
36. Monin JL, Quere JP, Monchi M, Petit H, Baleynaud S, Chauvel C et al.Low-gradient aortic stenosis: operative risk stratification and predictorsfor long-term outcome: a multicenter study using dobutamine stresshemodynamics. Circulation 2003;108:319–24.
37. Mascherbauer J, Fuchs C, Stoiber M, Schima H, Pernicka E, Maurer G etal. Systemic pressure does not directly affect pressure gradient and
valve area estimates in aortic stenosis in vitro. Eur Heart J 2008;29:2049–57.
38. Kadem L, Dumesnil JG, Rieu R, Durand LG, Garcia D, Pibarot P. Impact ofsystemic hypertension on the assessment of aortic stenosis. Heart 2005;91:354–61.
39. Little SH, Chan KL, Burwash IG, Impact of blood pressure on the Dopplerechocardiographic assessment of severity of aortic stenosis. Heart 2007;93:848–55.
40. Otto CM, Valvular aortic stenosis: disease severity and timing of inter-vention. J Am Coll Cardiol 2006;47:2141–51.
41. Zoghbi WA, Enriquez-Sarano M, Foster E, Grayburn PA, Kraft CD,Levine RA et al. Recommendations for evaluation of the severity ofnative valvular regurgitation with two-dimensional and Doppler echo-cardiography. J Am Soc Echocardiogr 2003;16:777–802.
42. Iung B, Baron G, Butchart EG, Delahaye F, Gohlke-Barwolf C, Levang OWet al. A prospective survey of patients with valvular heart disease inEurope: The Euro Heart Survey on Valvular Heart Disease. Eur Heart J2003;24:1231–43.
43. Marijon E, Ou P, Celermajer DS, Ferreira B, Mocumbi AO, Jani D et al.Prevalence of rheumatic heart disease detected by echocardiographicscreening. N Engl J Med 2007;357:470–6.
44. Nishimura RA, Rihal CS, Tajik AJ, Holmes DR Jr. Accurate measurementof the transmitral gradient in patients with mitral stenosis: a simul-taneous catheterization and Doppler echocardiographic study. J AmColl Cardiol 1994;24:152–8.
45. Thomas JD, Newell JB, Choong CY, Weyman AE. Physical and physiologi-cal determinants of transmitral velocity: numerical analysis. Am JPhysiol 1991;260(5 Pt 2):H1718–31.
46. Rahimtoola SH, Durairaj A, Mehra A, Nuno I. Current evaluation andmanagement of patients with mitral stenosis. Circulation 2002;106:1183–8.
47. Faletra F, Pezzano A Jr, Fusco R, Mantero A, Corno R, Crivellaro W et al.Measurement of mitral valve area in mitral stenosis: four echocardio-graphic methods compared with direct measurement of anatomic ori-fices. J Am Coll Cardiol 1996;28:1190–7.
48. Iung B, Cormier B, Ducimetiere P, Porte JM, Nallet O, Michel PL et al.Immediate results of percutaneous mitral commissurotomy. A predictivemodel on a series of 1514 patients. Circulation 1996;94:2124–30.
49. Shaw TR, Sutaria N, Prendergast B. Clinical and haemodynamic profilesof young, middle aged, and elderly patients with mitral stenosis under-going mitral balloon valvotomy. Heart 2003;89:1430–6.
50. Zamorano J, Cordeiro P, Sugeng L, Perez de Isla L, Weinert L, Macaya Cet al. Real-time three-dimensional echocardiography for rheumaticmitral valve stenosis evaluation: an accurate and novel approach.J Am Coll Cardiol 2004;43:2091–6.
51. Sebag IA, Morgan JG, Handschumacher MD, Marshall JE, Nesta F, Hung Jet al. Usefulness of three-dimensionally guided assessment of mitralstenosis using matrix-array ultrasound. Am J Cardiol 2005;96:1151–6.
52. Messika-Zeitoun D, Brochet E, Holmin C, Rosenbaum D, Cormier B,Serfaty JM et al. Three-dimensional evaluation of the mitral valvearea and commissural opening before and after percutaneous mitralcommissurotomy in patients with mitral stenosis. Eur Heart J 2007;28:72–9.
53. Thomas JD, Weyman AE. Doppler mitral pressure half-time: a clinicaltool in search of theoretical justification. J Am Coll Cardiol 1987;10:923–9.
54. Gonzalez MA, Child JS, Krivokapich J. Comparison of two-dimensionaland Doppler echocardiography and intracardiac hemodynamics forquantification of mitral stenosis. Am J Cardiol 1987;60:327–32.
55. Thomas JD, Weyman AE. Fluid dynamics model of mitral valve flow:description with in vitro validation. J Am Coll Cardiol 1989;13:221–33.
56. Thomas JD, Wilkins GT, Choong CY, Abascal VM, Palacios IF, Block PCet al. Inaccuracy of mitral pressure half-time immediately after percu-taneous mitral valvotomy. Dependence on transmitral gradient and leftatrial and ventricular compliance. Circulation 1988;78:980–93.
57. Schwammenthal E, Vered Z, Agranat O, Kaplinsky E, Rabinowitz B,Feinberg MS. Impact of atrioventricular compliance on pulmonaryartery pressure in mitral stenosis: an exercise echocardiographicstudy. Circulation 2000;102:2378–84.
58. Flachskampf FA, Weyman AE, Guerrero JL, Thomas JD. Calculation ofatrioventricular compliance from the mitral flow profile: analytic andin vitro study. J Am Coll Cardiol 1992;19:998–1004.
59. Karp K, Teien D, Bjerle P, Eriksson P. Reassessment of valve area deter-minations in mitral stenosis by the pressure half-time method: impact ofleft ventricular stiffness and peak diastolic pressure difference. J AmColl Cardiol 1989;13:594–9.
EAE/ASE stenosis recommendations 23
by guest on May 6, 2016
Dow
nloaded from
60. Messika-Zeitoun D, Meizels A, Cachier A, Scheuble A, Fondard O,Brochet E et al. Echocardiographic evaluation of the mitral valve areabefore and after percutaneous mitral commissurotomy: the pressurehalf-time method revisited. J Am Soc Echocardiogr 2005;18:1409–14.
61. Nakatani S, Masuyama T, Kodama K, Kitabatake A, Fujii K, Kamada T.Value and limitations of Doppler echocardiography in the quantificationof stenotic mitral valve area: comparison of the pressure half-time andthe continuity equation methods. Circulation 1988;77:78–85.
62. Messika-Zeitoun D, Fung Yiu S, Cormier B, Iung B, Scott lC, Vahanian Aet al. Sequential assessment of mitral valve area during diastole usingcolour M-mode flow convergence analysis: new insights into mitralstenosis physiology. Eur Heart J 2003;24:1244–53.
63. Izgi C, Ozdemir N, Cevik C, Ozveren O, Bakal RB, Kaymaz C et al. Mitralvalve resistance as a determinant of resting and stress pulmonary arterypressure in patients with mitral stenosis: a dobutamine stress study.J Am Soc Echocardiogr 2007;20:1160–6.
64. Wilkins GT, Weyman AE, Abascal VM, Block PC, Palacios IF. Percutaneousballoon dilatation of the mitral valve: an analysis of echocardiographicvariables related to outcome and the mechanism of dilatation. Br HeartJ 1988;60:299–308.
65. Vahanian A, Palacios. IF. Percutaneous approaches to valvular disease.Circulation 2004;109:1572–9.
66. Black IW, Hopkins AP, Lee LC, Walsh WF. Left atrial spontaneous echocontrast: a clinical and echocardiographic analysis. J Am Coll Cardiol1991;18:398–404.
67. Dreyfus GD, Corbi PJ, Chan KM, Bahrami T. Secondary tricuspid regurgi-tation or dilatation: which should be the criteria for surgical repair? AnnThorac Surg 2005;79:127–32.
68. Hecker SL, Zabalgoitia M, Ashline P, Oneschuk L, O’Rourke RA,Herrera CJ. Comparison of exercise and dobutamine stress echocardio-graphy in assessing mitral stenosis. Am J Cardiol 1997;80: 1374–7.
69. Reis G, Motta MS, Barbosa MM, Esteves WA, Souza SF, Bocchi EA. Dobu-tamine stress echocardiography for noninvasive assessment and riskstratification of patients with rheumatic mitral stenosis. J Am CollCardiol 2004;43:393–401.
70. Segal J, Lerner DJ, Miller DC, Mitchell RS, Alderman EA, Popp RL. Whenshould Doppler-determined valve area be better than the Gorlinformula?: variation in hydraulic constants in low flow states. J AmColl Cardiol 1987;9:1294–305.
71. Iung B, Garbarz E, Michaud P, Helou S, Farah B, Berdah P et al. Lateresults of percutaneous mitral commissurotomy in a series of 1024patients. Analysis of late clinical deterioration: frequency, anatomicfindings, and predictive factors. Circulation 1999;99:3272–8.
72. Palacios IF, Sanchez PL, Harrell LC, Weyman AE, Block PC. Whichpatients benefit from percutaneous mitral balloon valvuloplasty? Preval-vuloplasty and postvalvuloplasty variables that predict long-termoutcome. Circulation 2002;105:1465–71.
73. Ben-Farhat M, Betbout F, Gamra H, Maatouk F, Ben-Hamda K,Abdellaoui M et al. Predictors of long-term event-free survival and offreedom from restenosis after percutaneous balloon mitral commissur-otomy. Am Heart J 2001;142:1072–9.
74. Fawzy ME, Shoukri M, Al Buraiki J, Hassan W, El Widaal H, Kharabsheh Set al. Seventeen years’ clinical and echocardiographic follow up ofmitral balloon valvuloplasty in 520 patients, and predictors of long-termoutcome. J Heart Valve Dis 2007;16:454–60.
75. Thatipelli MR, Uber PA, Mehra MR. Isolated tricuspid stenosis and heartfailure: a focus on carcinoid heart disease. Congest Heart Fail 2003;9:294–6.
76. Ootaki Y, Yamaguchi M, Yoshimura N, Tsukuda K. Congenital heartdisease with hypereosinophilic syndrome. Pediatr Cardiol 2003;24:608–10.
77. Cohen ML, Spray T, Gutierrez F, Barzilai B, Bauwens D. Congenital tricus-pid valve stenosis with atrial septal defect and left anterior fascicularblock. Clin Cardiol 1990;13:497–9.
78. Mehta V, Sengupta PP, Banerjee A, Arora R, Datt V. Congenital tricuspidstenosis and membranous right ventricular outflow tract obstruction inan adult. Ann Card Anaesth 2003;6:152–5.
79. Dervanian P, Mace L, Bucari S, Folliguet TA, Grinda JM, Neveux JY.Valved conduit bypass for extensively calcified tricuspid valve stenosis.Ann Thorac Surg 1995;60:450–2.
80. Saito T, Horimi H, Hasegawa T, Kamoshida T. Isolated tricuspid valve ste-nosis caused by infective endocarditis in an adult: report of a case. SurgToday 1993;23:1081–4.
81. Old WD, Paulsen W, Lewis SA, Nixon JV. Pacemaker lead-induced tricus-pid stenosis: diagnosis by Doppler echocardiography. Am Heart J 1989;117:1165–7.
82. Taira K, Suzuki A, Fujino A, Watanabe T, Ogyu A, Ashikawa K. Tricuspidvalve stenosis related to subvalvular adhesion of pacemaker lead: a casereport. J Cardiol 2006;47:301–6.
83. Ames DE, Asherson RA, Coltart JD, Vassilikos V, Jones JK, Hughes GR.Systemic lupus erythematosus complicated by tricuspid stenosis andregurgitation: successful treatment by valve transplantation. AnnRheum Dis 1992;51:120–2.
84. Kuralay E, Cingoz F, Gunay C, Demirkilic U, Tatar H. Huge right atrialmyxoma causing fixed tricuspid stenosis with constitutional symptoms.J Card Surg 2003;18:550–3.
85. Uribe-Etxebarria N, Voces R, Rodriguez MA, Llorente A, Perez P,Aramendi JI. Reversible tricuspid valve stenosis due to a metastaticdissemination of a noncardiac sarcoma. Ann Thorac Surg 2005;80:e1–2.
86. Chrissos DN, Stougiannos PN, Mytas DZ, Katsaros AA, Andrikopoulos GK,Kallikazaros IE. Multiple cardiac metastases from a malignant mela-noma. Eur J Echocardiogr 2008;9:391–2.
87. Nishida H, Grooters RK, Coster D, Soltanzadeh H, Thieman KC. Meta-static right atrial tumor in colon cancer with superior vena cava syn-drome and tricuspid obstruction. Heart Vessels 1991;6:125–7.
88. Yousof AM, Shafei MZ, Endrys G, Khan N, Simo M, Cherian G. Tricuspidstenosis and regurgitation in rheumatic heart disease: a prospectivecardiac catheterization study in 525 patients. Am Heart J 1985;110(1Pt 1):60–4.
89. Pearlman AS, Role of echocardiography in the diagnosis and evaluationof severity of mitral and tricuspid stenosis. Circulation 1991;84(3Suppl): I193–7.
90. Pothineni KR, Duncan K, Yelamanchili P, Nanda NC, Patel V, Fan P et al.Live/real time three-dimensional transthoracic echocardiographicassessment of tricuspid valve pathology: incremental value over thetwo-dimensional technique. Echocardiography 2007;24:541–52.
91. Quinones MA, Otto CM, Stoddard M, Waggoner A, Zoghbi WA. DopplerQuantification Task Force of the Nomenclature and Standards Commit-tee of the American Society of Echocardiography. Recommendationsfor quantification of Doppler echocardiography: a report from theDoppler Quantification Task Force of the Nomenclature and StandardsCommittee of the American Society of Echocardiography. J Am Soc Echo-cardiogr 2002;15:167–84.
92. Hatle L. Noninvasive assessment of valve lesions with Doppler ultra-sound. Herz 1984;9:213–21.
93. Fawzy ME, Mercer EN, Dunn B, al-Amri M, Andaya W. Doppler echocar-diography in the evaluation of tricuspid stenosis. Eur Heart J 1989;10:985–90.
94. Karp K, Teien D, Eriksson P. Doppler echocardiographic assessmentof the valve area in patients with atrioventricular valve stenosisby application of the continuity equation. J Intern Med 1989;225:261–6.
95. Weyman AE, Hurwitz RA, Girod DA, Dillon JC, Feigenbaum H, Green D.Cross-sectional echocardiographic visualization of the stenotic pulmon-ary valve. Circulation 1977;56:769–74.
96. Weyman AE, Dillon JC, Feigenbaum H, Chang S. Echocardiographicdifferentiation of infundibular from valvular pulmonary stenosis. Am JCardiol 1975;36:21–6.
97. Waller BF, Howard J, Fess S. Pathology of pulmonic valve stenosis andpure regurgitation. Clin Cardiol 1995;18:45–50.
98. Bandin MA, Vargas-Barron J, Keirns C, Romero-Cardenas A, Villegas M,Buendia A. Echocardiographic diagnosis of rheumatic cardiopathyaffecting all four cardiac valves. Am Heart J 1990;120:1004–7.
99. Fox R, Panidis IP, Kotler MN, Mintz GS, Ross J. Detection by Dopplerechocardiography of acquired pulmonic stenosis due to extrinsictumor compression. Am J Cardiol 1984;53:1475–6.
100. Van Camp G, De Mey J, Daenen W, Budts W, Schoors D. Pulmonarystenosis caused by extrinsic compression of an aortic pseudoaneurysmof a composite aortic graft. J Am Soc Echocardiogr 1999;12:997–1000.
101. Lima CO, Sahn DJ, Valdes-Cruz LM, Goldberg SJ, Barron JV, Allen HDet al. Noninvasive prediction of transvalvular pressure gradient inpatients with pulmonary stenosis by quantitative two-dimensionalechocardiographic Doppler studies. Circulation 1983;67:866–71.
102. Aldousany AW, DiSessa TG, Dubois R, Alpert BS, Willey ES, Birnbaum SE.Doppler estimation of pressure gradient in pulmonary stenosis: maximalinstantaneous vs peak-to-peak, vs mean catheter gradient. PediatrCardiol 1989;10:145–9.
103. Frantz EG, Silverman NH. Doppler ultrasound evaluation of valvar pul-monary stenosis from multiple transducer positions in children requiringpulmonary valvuloplasty. Am J Cardiol 1988;61:844–9.
H. Baumgartner et al.24
by guest on May 6, 2016
Dow
nloaded from

104. Johnson GL, Kwan OL, Handshoe S, Noonan JA, DeMaria AN. Accuracy ofcombined two-dimensional echocardiography and continuous waveDoppler recordings in the estimation of pressure gradient in right ventri-cular outlet obstruction. J Am Coll Cardiol 1984;3:1013–8.
105. Silvilairat S, Cabalka AK, Cetta F, Hagler DJ, O’Leary PW. Echocardio-graphic assessment of isolated pulmonary valve stenosis: which outpati-ent Doppler gradient has the most clinical validity? J Am SocEchocardiogr 2005;18:1137–42.
106. Chen CR, Cheng TO, Huang T, Zhou YL, Chen JY, Huang YG et al. Percu-taneous balloon valvuloplasty for pulmonic stenosis in adolescents andadults. N Engl J Med 1996;335:21–5.
107. Foale R, Nihoyannopoulos P, McKenna W, Kleinebenne A, Nadazdin A,Rowland E et al. Echocardiographic measurement of the normal adultright ventricle. Br Heart J 1986;56:33–44.
108. Matsukubo H, Matsuura T, Endo N, Asayama J, Watanabe T. Echocar-diographic measurement of right ventricular wall thickness. A newapplication of subxiphoid echocardiography. Circulation 1977;56:278–84.
109. Lang RM, Bierig M, Devereux RB, Flachskampf FA, Foster E, Pellikka PAet al. Recommendations for chamber quantification. Eur J Echocardiogr2006;7:79–108.
EAE/ASE stenosis recommendations 25
by guest on May 6, 2016
Dow
nloaded from
Recommended