2 + 2 = ?
Two Plus Two Might Not Always Equal Four
Enhanced Strategic Planning
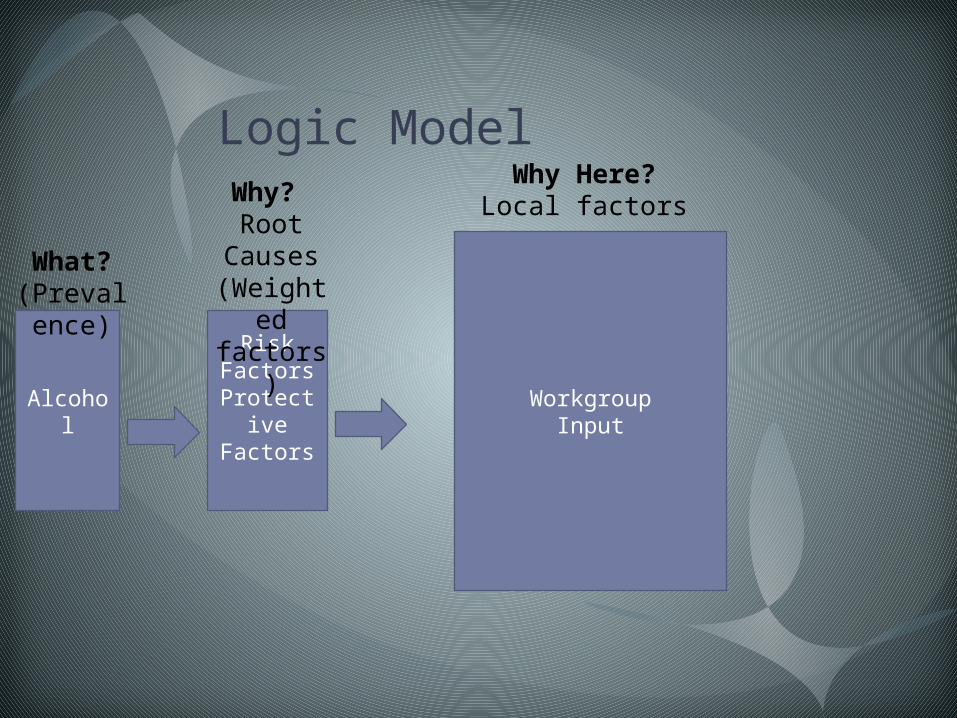
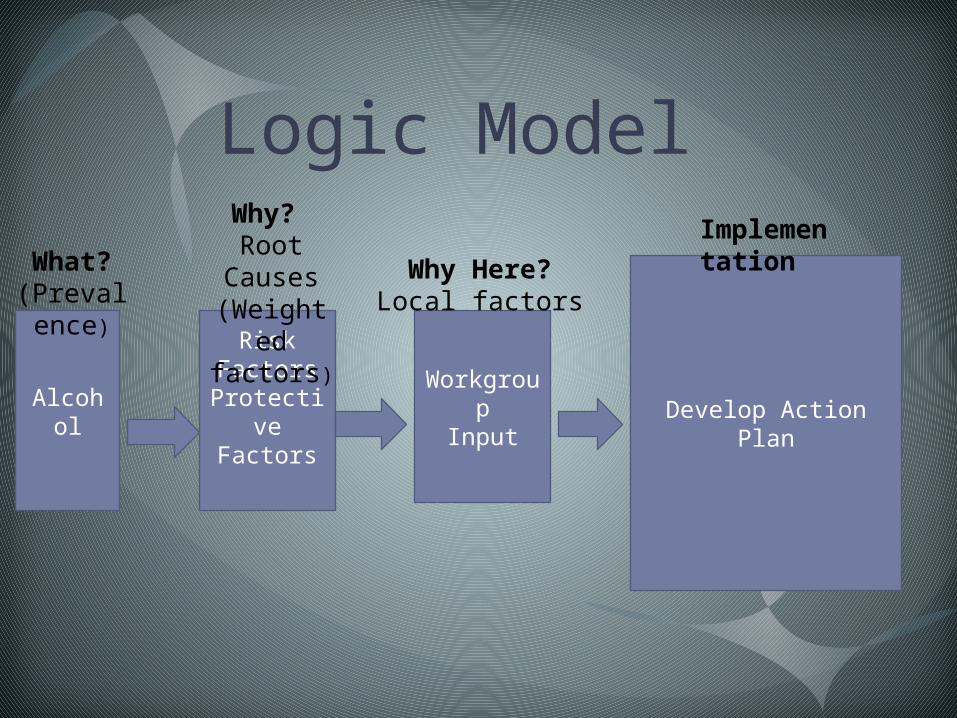
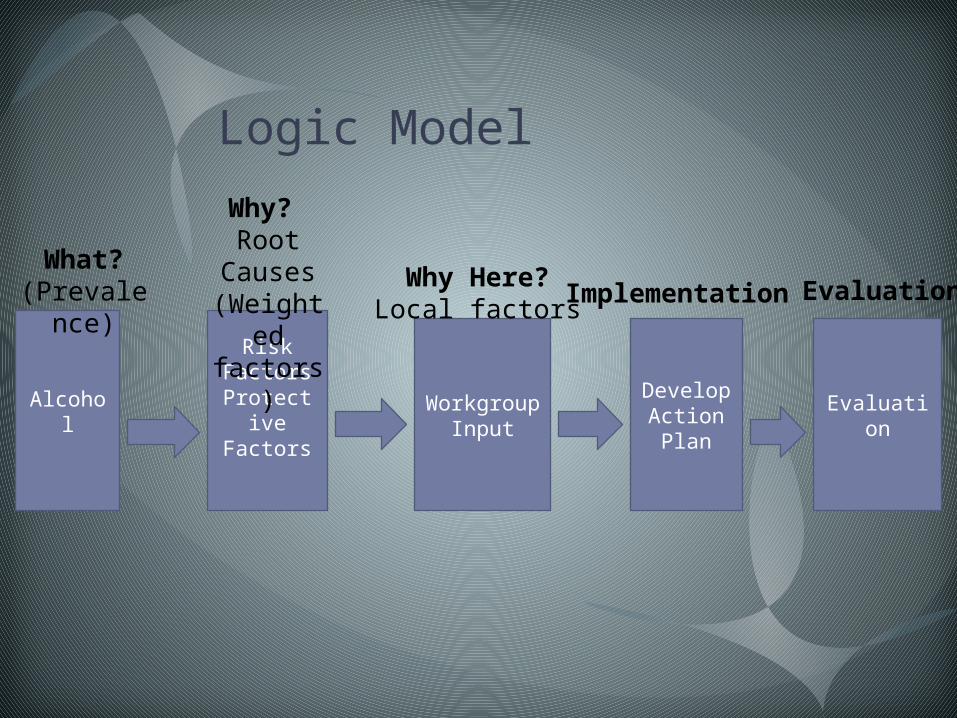
Logic Model
Alcohol
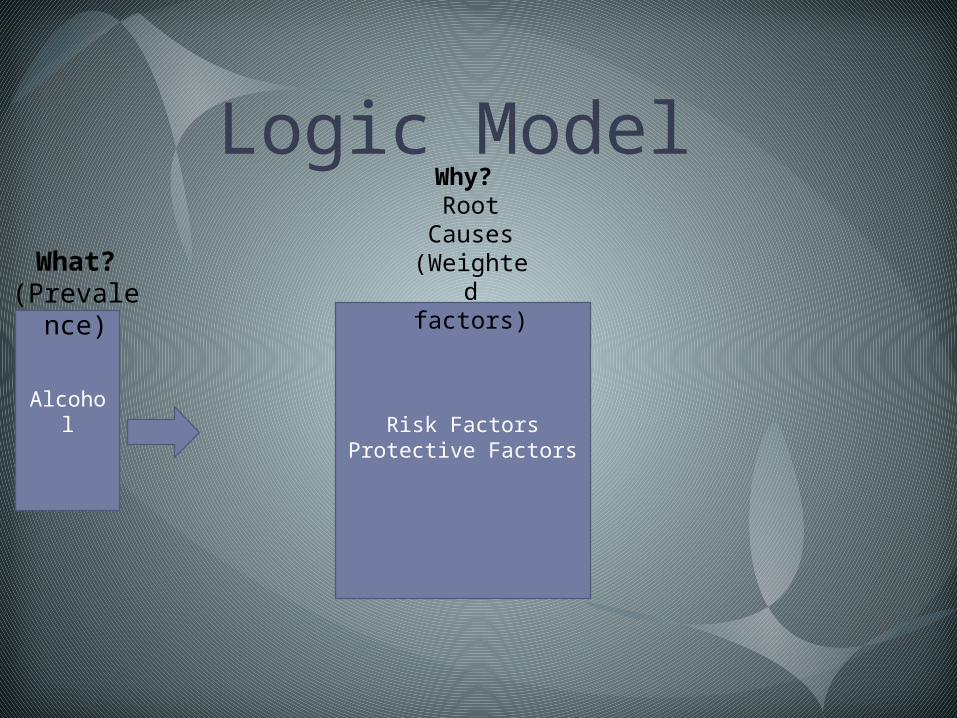
Risk Factors
Protective Factors
WorkgroupInput
Develop
Action Plan
What? (Prevale
nce)
Why? Root
Causes(Weighted factors)
Why Here?Local factors
Implementation
Evaluation
Evaluation
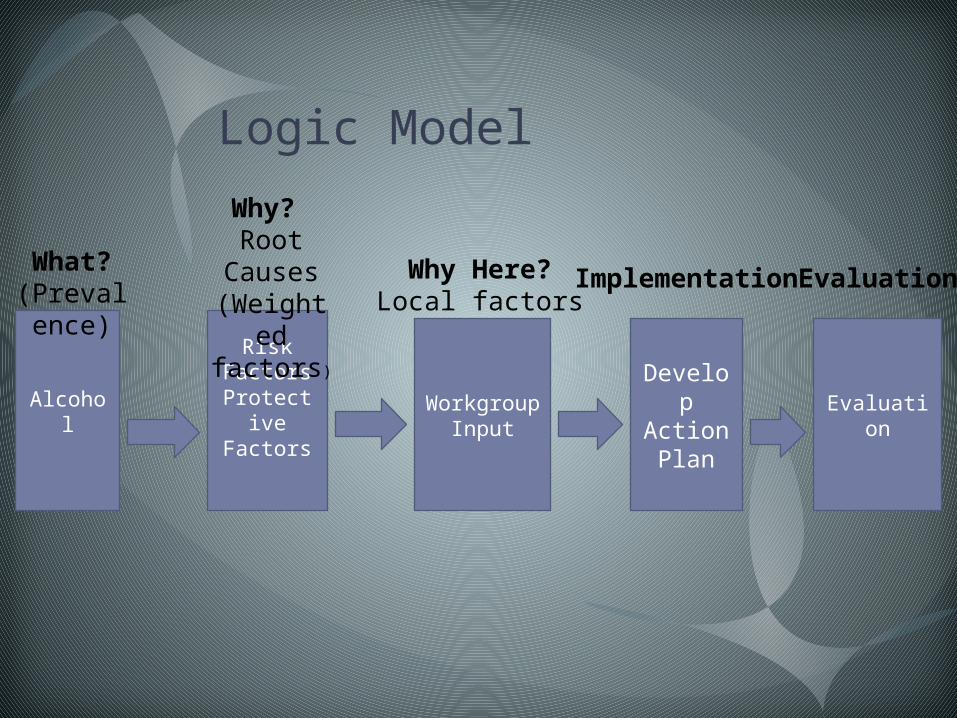
Logic Model
Alcohol
What? (Prevalence
)
“What?” The problem
Just like Chicken Little -
Problems often seem to fall from the sky.
or
in the case of
prevention planning..
from the survey.
“What?” The ProblemWhat we measure is
often determined by what we
are concerned
about
or (in some cases),
someone else’s
pre-determined concerns or priorities.
Groups are then formed because of
that issue/proble
m.
Logic Model
AlcoholRisk Factors
Protective Factors
What? (Prevalen
ce)
Why? Root
Causes(Weighted
factors)
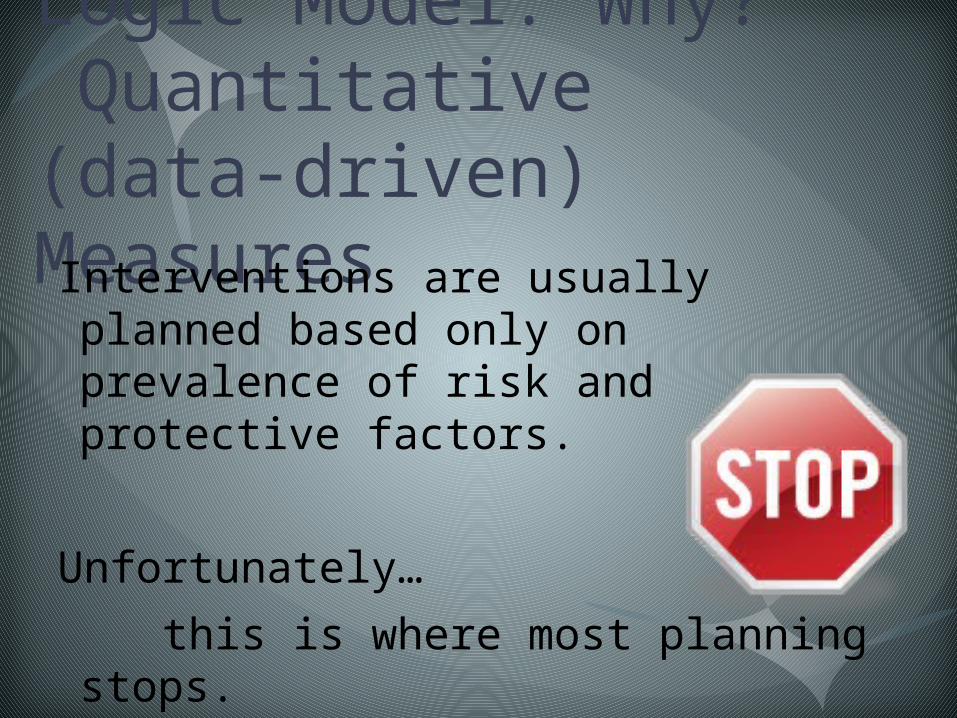
Logic Model: Why? Quantitative (data-driven) MeasuresInterventions are usually planned based only on prevalence of risk and protective factors.
Unfortunately…
this is where most planning stops.
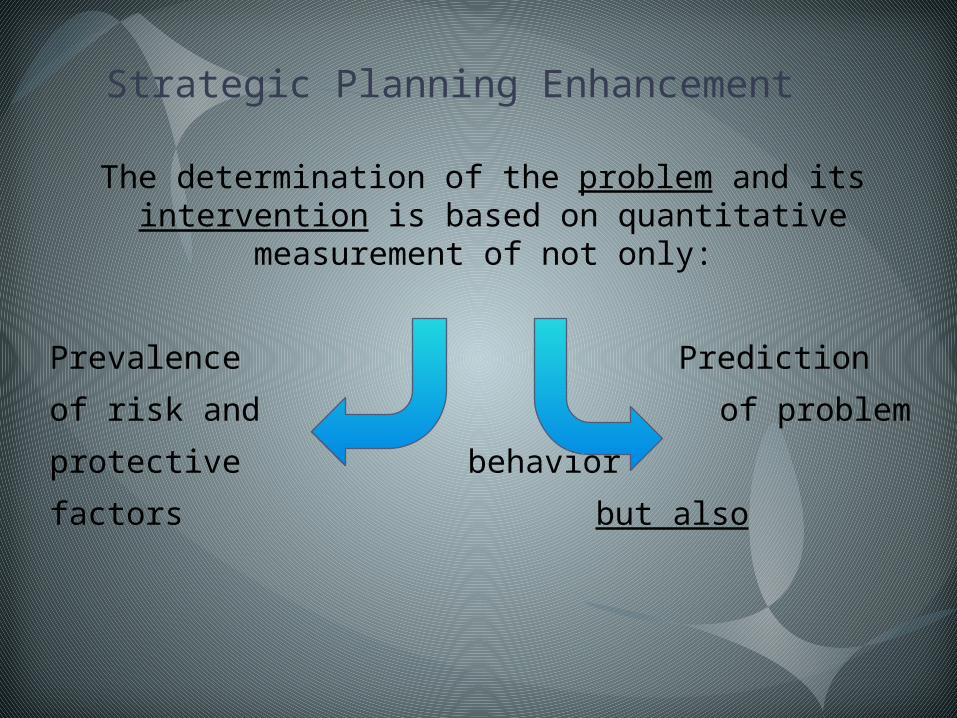
Strategic Planning Enhancement
The determination of the problem and its intervention is based on quantitative measurement of not only:
Prevalence Prediction
of risk and of problem
protective behavior
factors but also

For Example……
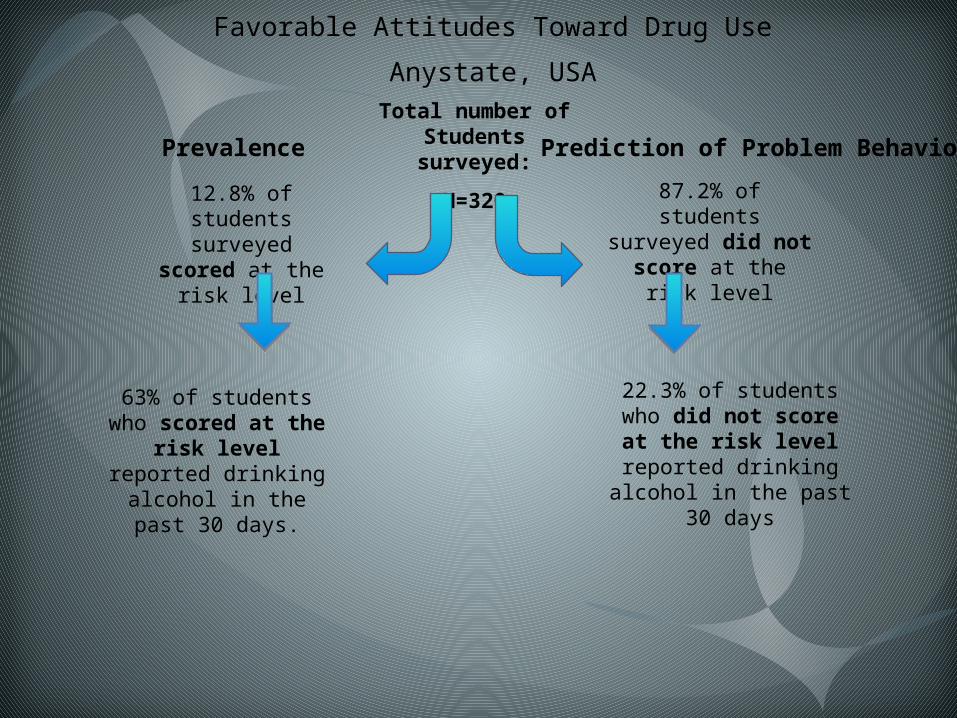
Favorable Attitudes Toward Drug Use
Anystate, USA
Total number of Students surveyed:
N=320
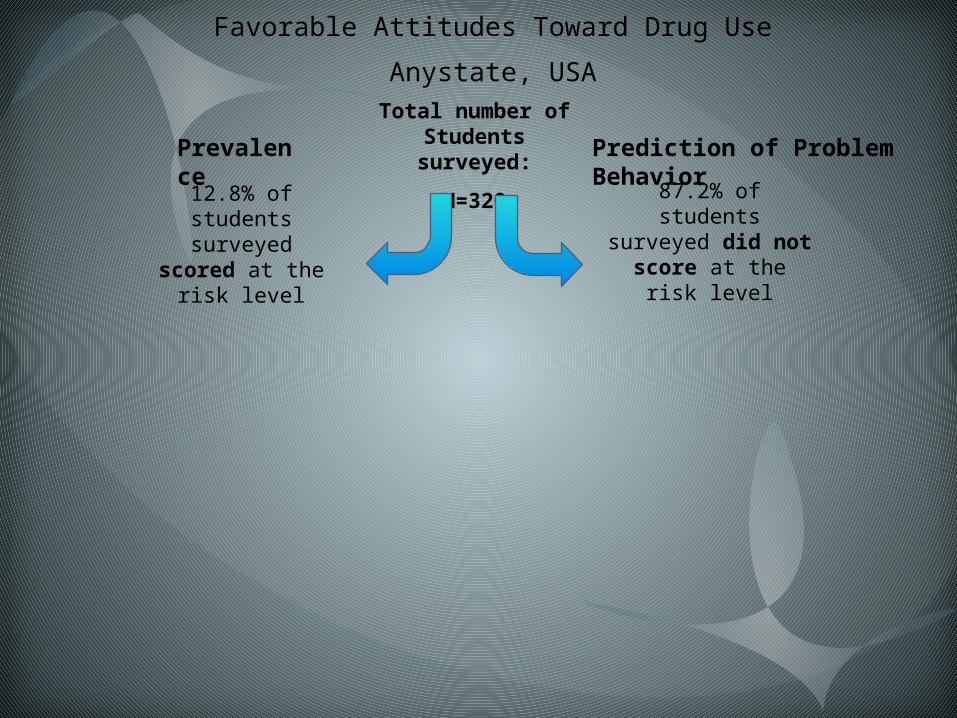
Favorable Attitudes Toward Drug Use
Anystate, USA
Total number of Students surveyed:
N=32012.8% of students surveyed scored at
the risk level
87.2% of students surveyed did not score
at the risk level
Prevalence Prediction of Problem Behavior
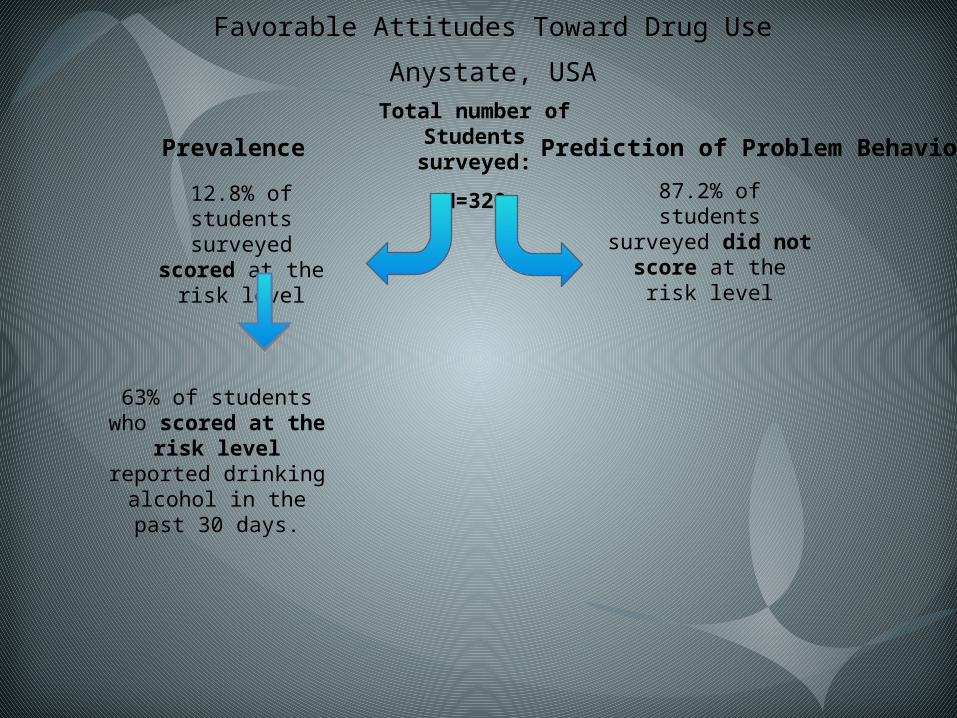
Favorable Attitudes Toward Drug Use
Anystate, USA
Total number of Students surveyed:
N=32012.8% of students surveyed scored at
the risk level
87.2% of students surveyed did not score
at the risk level
63% of students who scored at the risk level
reported drinking alcohol in the past 30 days.
Prevalence Prediction of Problem Behavior
Favorable Attitudes Toward Drug Use
Anystate, USA
Total number of Students surveyed:
N=32012.8% of students surveyed scored at
the risk level
87.2% of students surveyed did not score
at the risk level
63% of students who scored at the risk level
reported drinking alcohol in the past 30 days.
22.3% of students who did not score at the risk level
reported drinking alcohol in the past 30 days
Prevalence Prediction of Problem Behavior
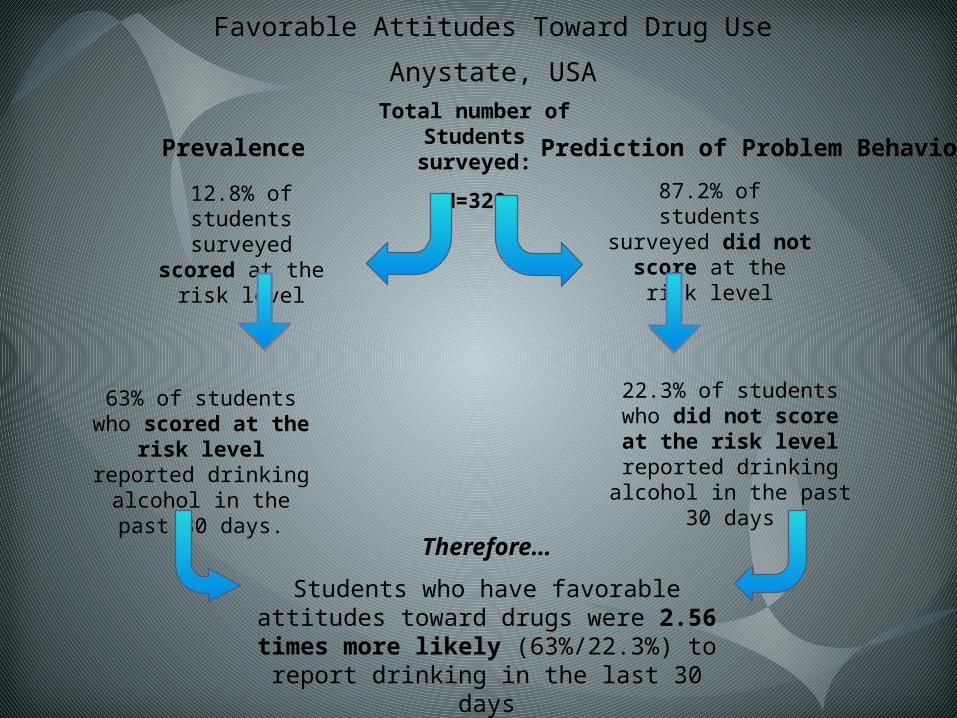
Favorable Attitudes Toward Drug Use
Anystate, USA
Total number of Students surveyed:
N=32012.8% of students surveyed scored at
the risk level
87.2% of students surveyed did not score
at the risk level
63% of students who scored at the risk level
reported drinking alcohol in the past 30 days.
22.3% of students who did not score at the risk level
reported drinking alcohol in the past 30 days
Therefore…
Students who have favorable attitudes toward drugs were 2.56 times more likely
(63%/22.3%) to report drinking in the last 30 days
Prevalence Prediction of Problem Behavior
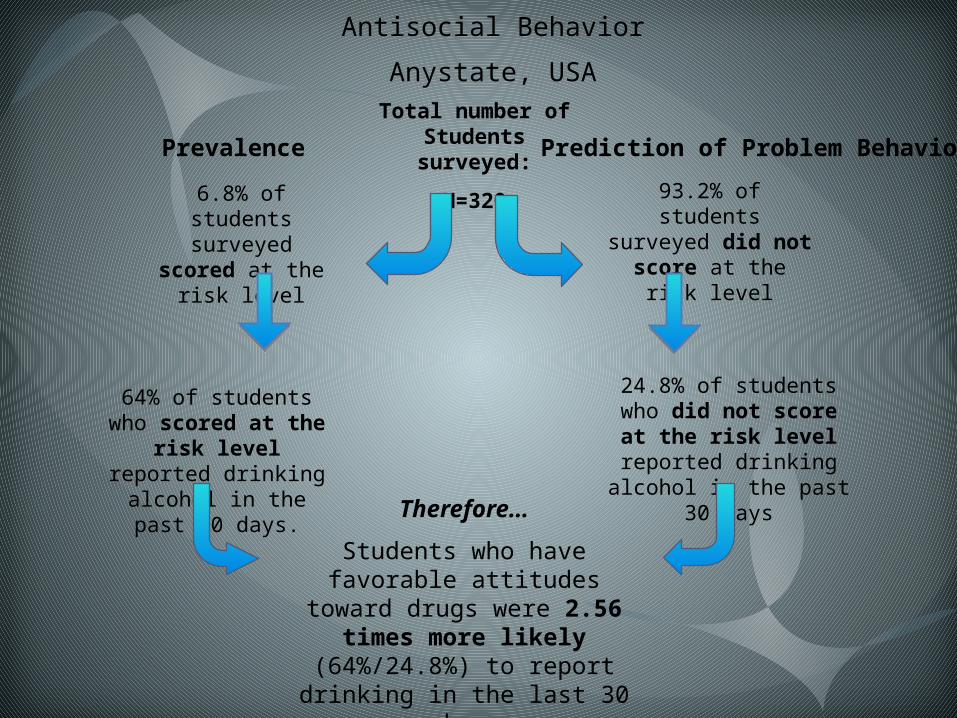
Antisocial Behavior
Anystate, USA
Total number of Students surveyed:
N=3206.8% of students
surveyed scored at the risk level
93.2% of students surveyed did not score
at the risk level
64% of students who scored at the risk level
reported drinking alcohol in the past 30 days.
24.8% of students who did not score at the risk level
reported drinking alcohol in the past 30 days
Therefore…
Students who have favorable attitudes toward drugs were 2.56
times more likely (64%/24.8%) to report drinking in the last 30 days
Prevalence Prediction of Problem Behavior
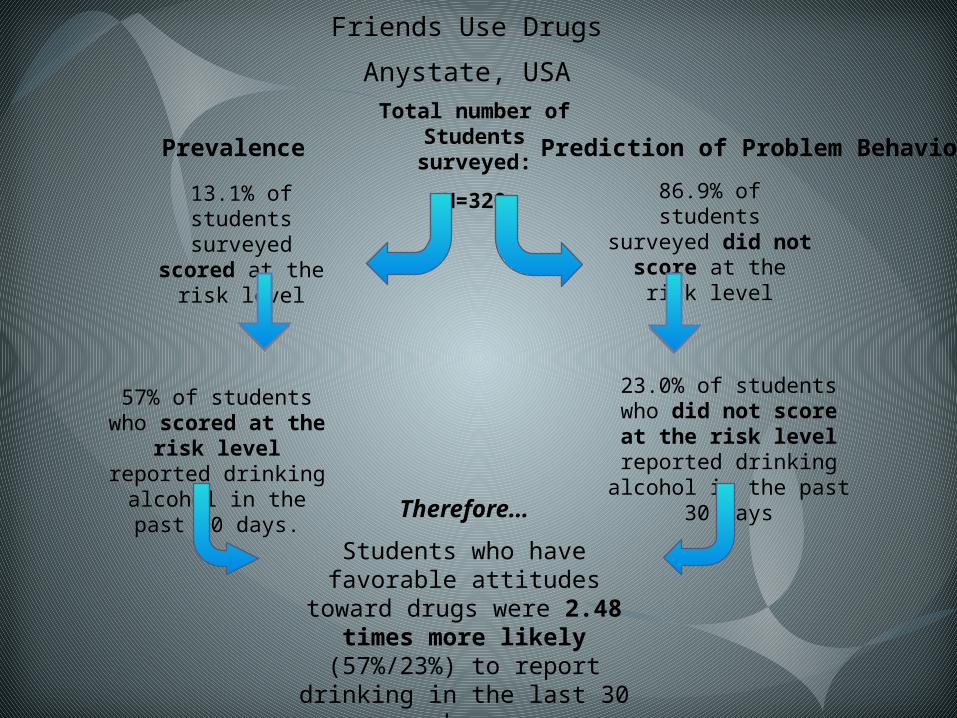
Friends Use Drugs
Anystate, USA
Total number of Students surveyed:
N=32013.1% of students surveyed scored at
the risk level
86.9% of students surveyed did not score
at the risk level
57% of students who scored at the risk level
reported drinking alcohol in the past 30 days.
23.0% of students who did not score at the risk level
reported drinking alcohol in the past 30 days
Therefore…
Students who have favorable attitudes toward drugs were 2.48 times more likely (57%/23%) to report drinking in the last 30 days
Prevalence Prediction of Problem Behavior
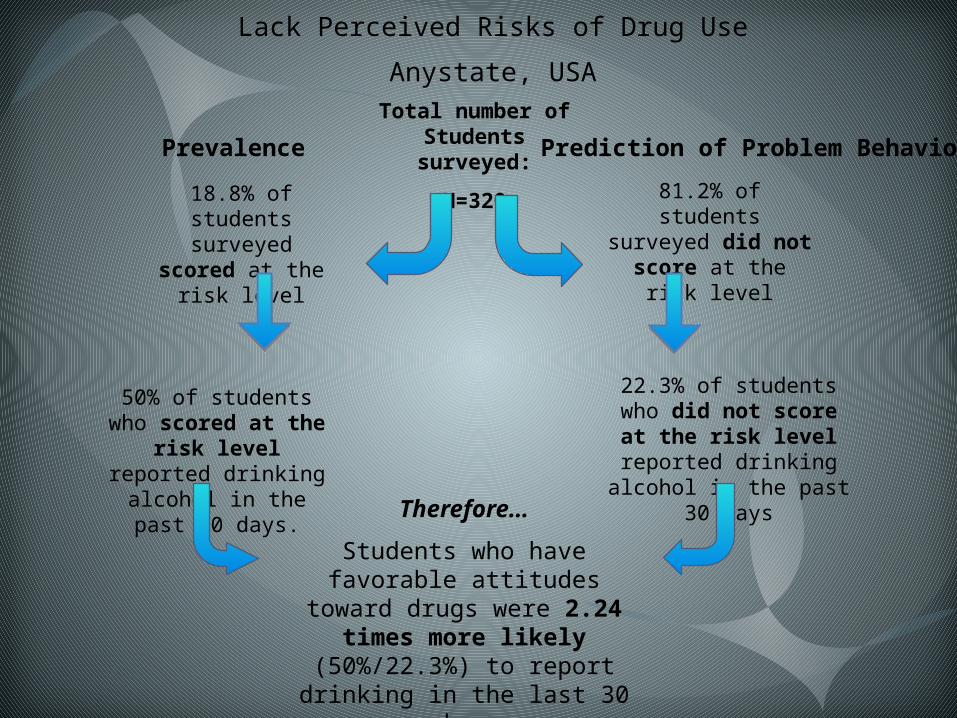
Lack Perceived Risks of Drug Use
Anystate, USA
Total number of Students surveyed:
N=32018.8% of students surveyed scored at
the risk level
81.2% of students surveyed did not score
at the risk level
50% of students who scored at the risk level
reported drinking alcohol in the past 30 days.
22.3% of students who did not score at the risk level
reported drinking alcohol in the past 30 days
Therefore…
Students who have favorable attitudes toward drugs were 2.24
times more likely (50%/22.3%) to report drinking in the last 30 days
Prevalence Prediction of Problem Behavior
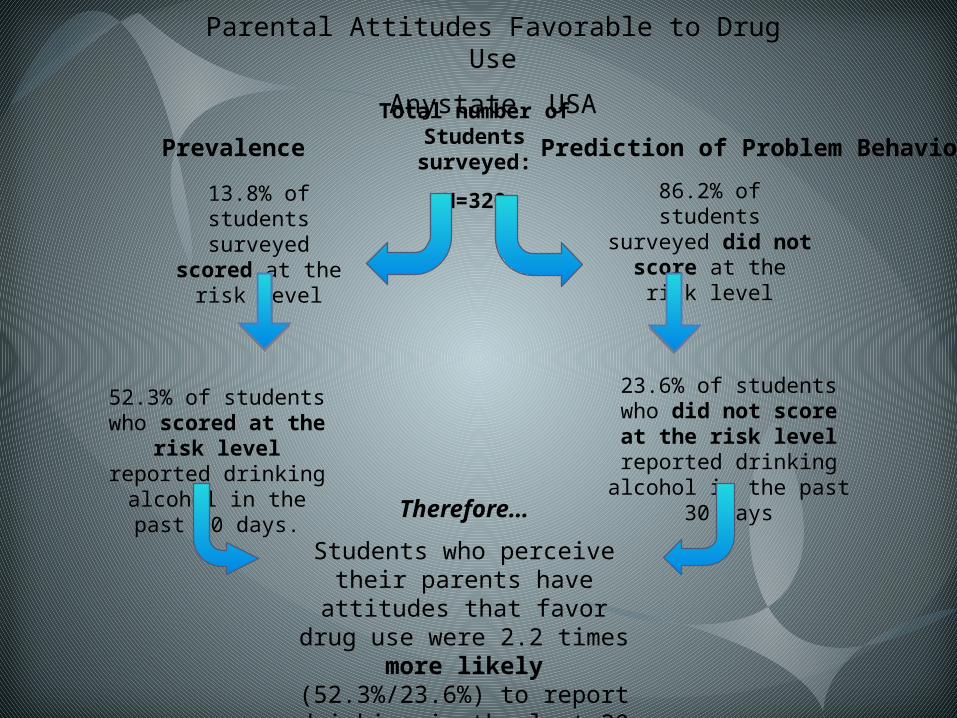
Parental Attitudes Favorable to Drug Use
Anystate, USA
Total number of Students surveyed:
N=32013.8% of students surveyed scored at
the risk level
86.2% of students surveyed did not score
at the risk level
52.3% of students who scored at the risk level
reported drinking alcohol in the past 30 days.
23.6% of students who did not score at the risk level
reported drinking alcohol in the past 30 days
Therefore…
Students who perceive their parents have attitudes that favor drug use
were 2.2 times more likely (52.3%/23.6%) to report drinking in
the last 30 days
Prevalence Prediction of Problem Behavior
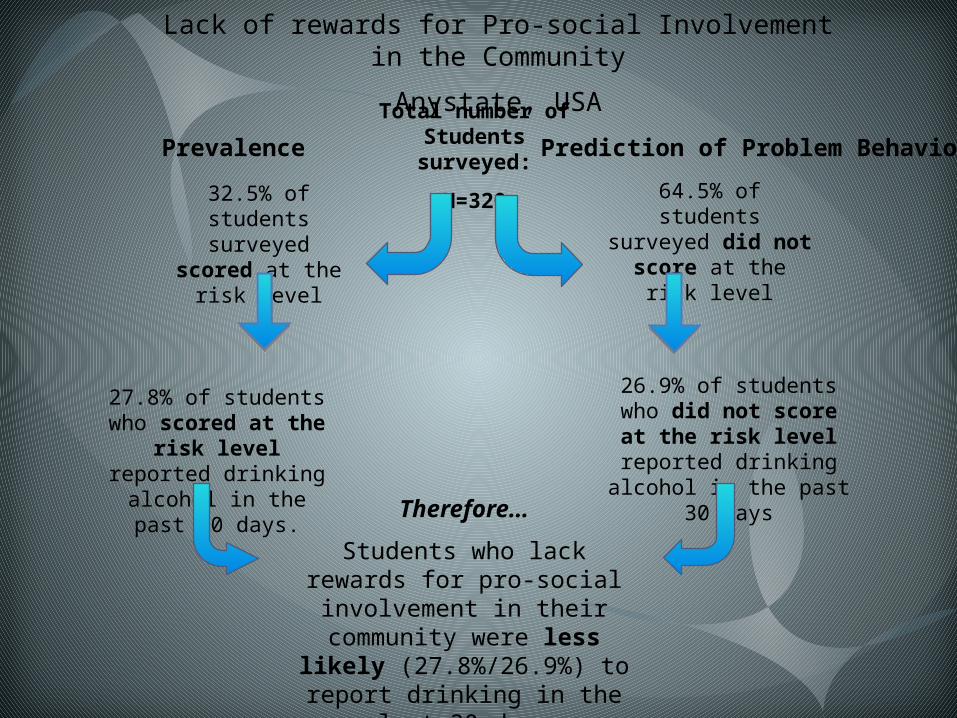
Lack of rewards for Pro-social Involvement in the Community
Anystate, USA
Total number of Students surveyed:
N=32032.5% of students surveyed scored at
the risk level
64.5% of students surveyed did not score
at the risk level
27.8% of students who scored at the risk level
reported drinking alcohol in the past 30 days.
26.9% of students who did not score at the risk level
reported drinking alcohol in the past 30 days
Therefore…
Students who lack rewards for pro-social involvement in their community were less likely
(27.8%/26.9%) to report drinking in the last 30 days
Prevalence Prediction of Problem Behavior
Logic Model
Alcohol
Risk Factors
Protective
Factors
WorkgroupInput
What? (Prevale
nce)
Why? Root
Causes(Weighte
d factors)
Why Here?Local factors
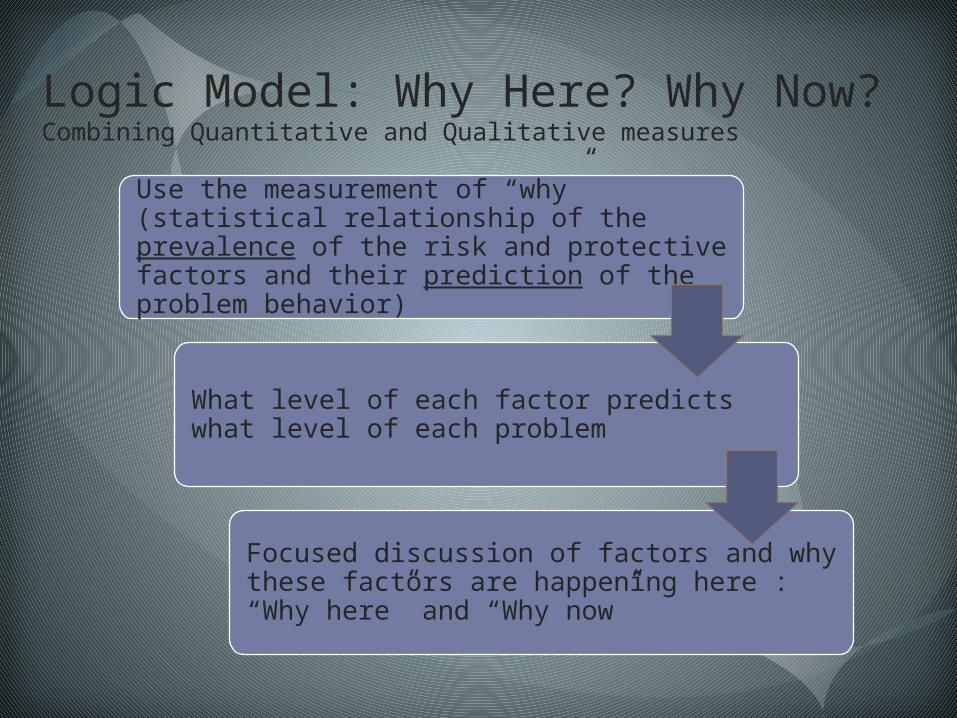
Logic Model: Why Here? Why Now?Combining Quantitative and Qualitative measures
Use the measurement of “why” (statistical relationship of the prevalence of the risk and protective factors and their prediction of the problem behavior)
What level of each factor predicts what level of each problem
Focused discussion of factors and why these factors are happening here : “Why here” and “Why now”
Anytown USA
Rating
High School Students - 2011 N=320
(1-10)
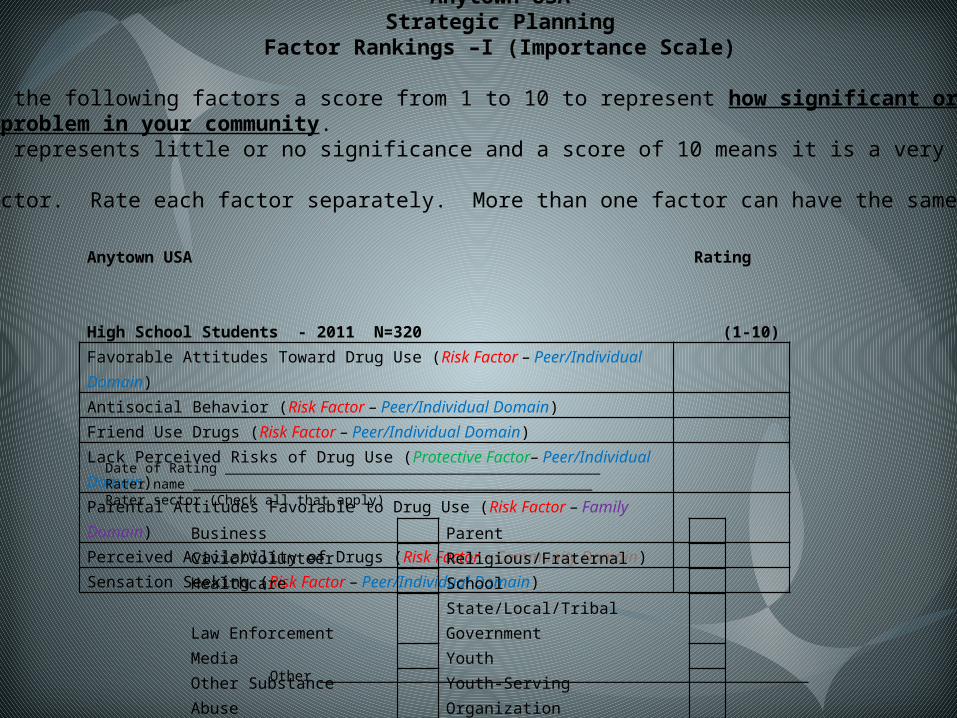
Favorable Attitudes Toward Drug Use (Risk Factor – Peer/Individual Domain) Antisocial Behavior (Risk Factor – Peer/Individual Domain) Friend Use Drugs (Risk Factor – Peer/Individual Domain)
Lack Perceived Risks of Drug Use (Protective Factor– Peer/Individual Domain) Parental Attitudes Favorable to Drug Use (Risk Factor – Family Domain) Perceived Availability of Drugs (Risk Factor – Community Domain) Sensation Seeking (Risk Factor – Peer/Individual Domain)
Business Parent Civic/Volunteer Religious/Fraternal Healthcare School Law Enforcement State/Local/Tribal Government Media Youth Other Substance Abuse Youth-Serving Organization
Anytown USAStrategic Planning
Factor Rankings –I (Importance Scale)
Give each of the following factors a score from 1 to 10 to represent how significant or important
it is as a problem in your community. A score of 1 represents little or no significance and a score of 10 means it is a very significant
problem for your sector. Rate each factor separately. More than one factor can have the same rating or
score.
Date of Rating _______________________________________________Rater name __________________________________________________Rater sector (Check all that apply)
Other ___________________________________________________________

Activity: “What We Need” or “What We Should Do?”
1. Break up into groups based on your “sector”.
2. In your group answer the following question:
“How does this factor manifest itself in your work and how important is it to
you as you do your job?”
3. Fill out the Factor Rating 1 form
Do’s: You can speculate as to why young people have this factor.
Don’ts: You cannot discuss how to address the factor…yet.
(no solutions)
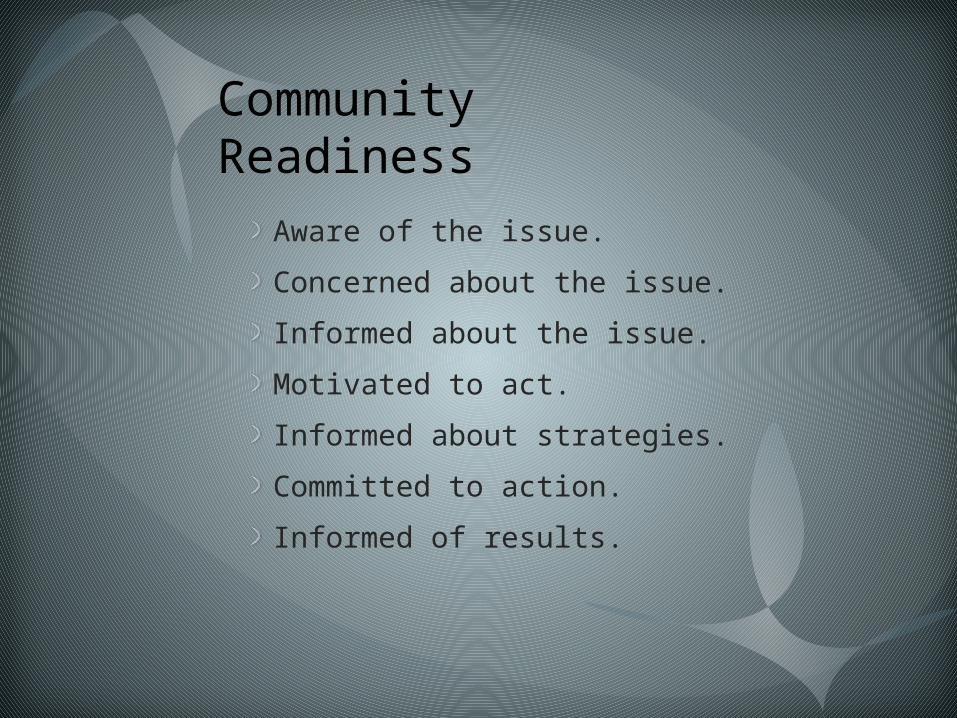
Community Readiness
Aware of the issue.
Concerned about the issue.
Informed about the issue.
Motivated to act.
Informed about strategies.
Committed to action.
Informed of results.
Anytown USA
Rating
High School Students - 2011 N=320
(1-10)
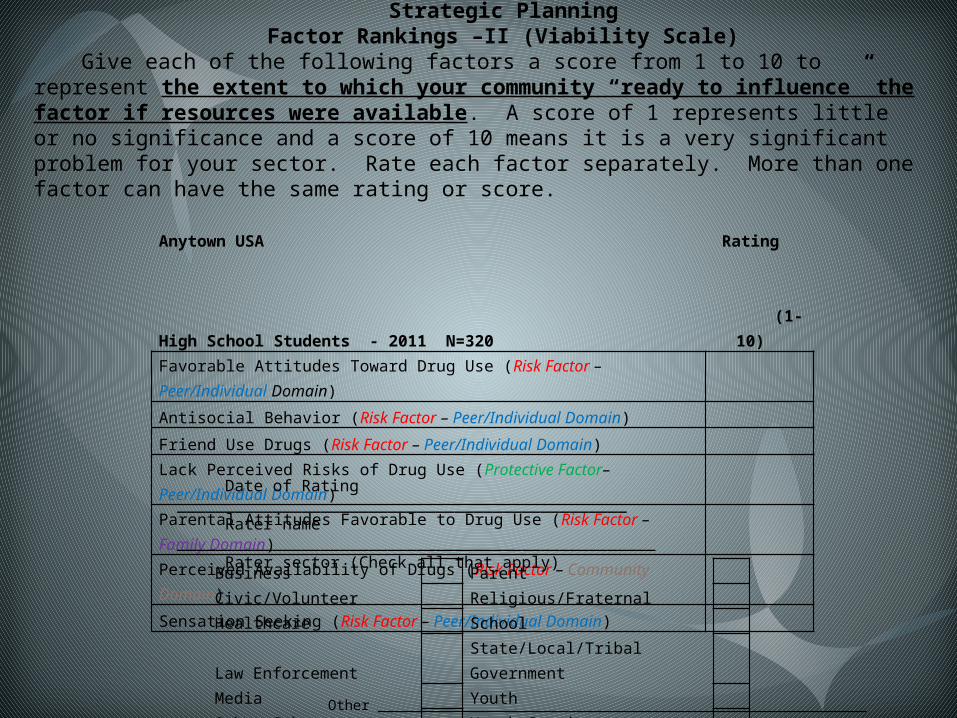
Favorable Attitudes Toward Drug Use (Risk Factor – Peer/Individual Domain)
Antisocial Behavior (Risk Factor – Peer/Individual Domain)
Friend Use Drugs (Risk Factor – Peer/Individual Domain)
Lack Perceived Risks of Drug Use (Protective Factor– Peer/Individual Domain)
Parental Attitudes Favorable to Drug Use (Risk Factor – Family Domain)
Perceived Availability of Drugs (Risk Factor – Community Domain)
Sensation Seeking (Risk Factor – Peer/Individual Domain)
Business Parent Civic/Volunteer Religious/Fraternal Healthcare School Law Enforcement State/Local/Tribal Government Media Youth Other Substance Abuse Youth-Serving Organization
Anytown USAStrategic Planning
Factor Rankings –II (Viability Scale)Give each of the following factors a score from 1 to 10 to represent the extent to which your
community “ready to influence” the factor if resources were available. A score of 1 represents little or no significance and a score of 10 means it is a very significant problem for your sector. Rate each factor separately. More than one factor can have the same rating or score.
Other ___________________________________________________________
Date of Rating _______________________________________________Rater name __________________________________________________Rater sector (Check all that apply)
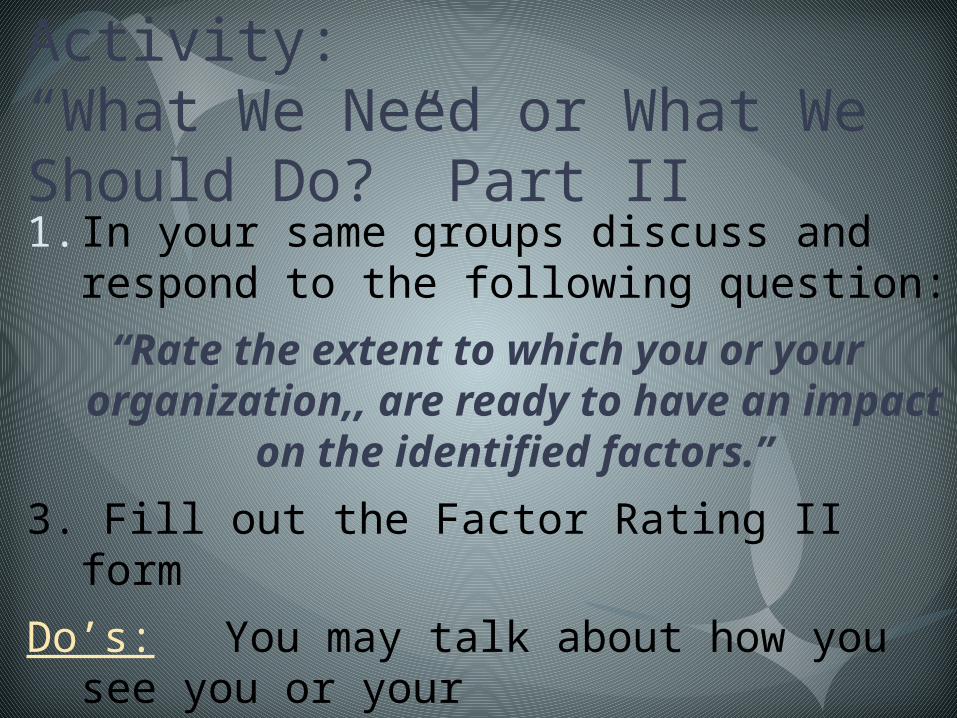
Activity: “What We Need or What We Should Do?” Part II1. In your same groups discuss and
respond to the following question:
“Rate the extent to which you or your organization,, are ready to have an impact on the identified factors.”
3. Fill out the Factor Rating II form
Do’s: You may talk about how you see you or your organization’s readiness to address this factor
Don’ts: You may not discuss the limitations (lack of resources) you or your organization may have to address that factor.
Logic Model
Alcohol
Risk Factors
Protective Factors
Workgroup
Input Develop Action Plan
What? (Prevale
nce)
Why? Root
Causes(Weighte
d factors)
Why Here?Local factors
Implementation
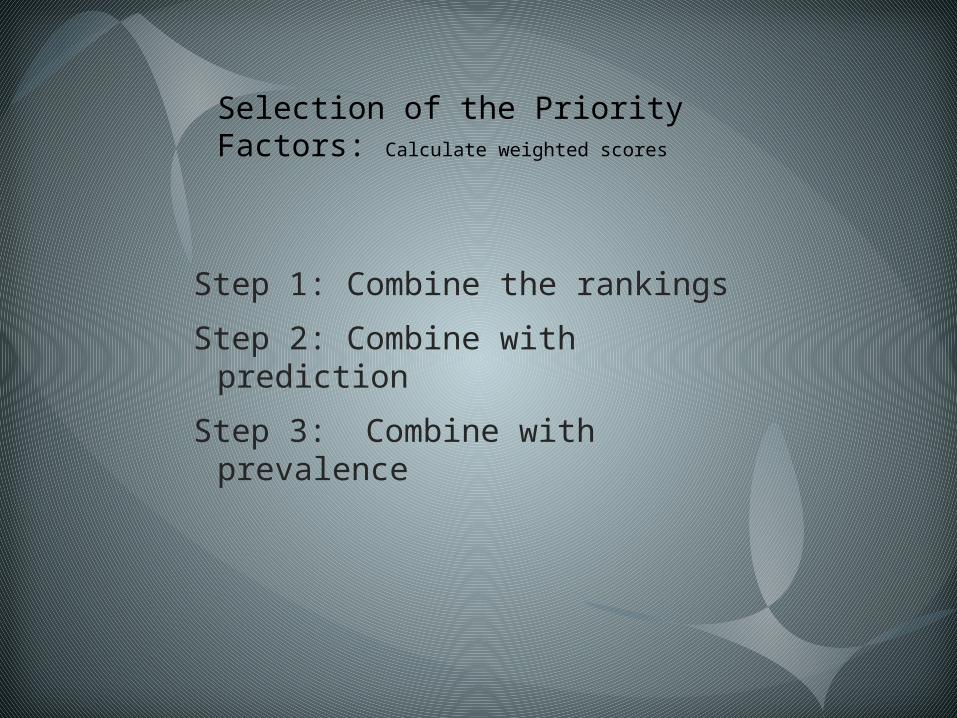
Selection of the Priority Factors: Calculate weighted scores
Step 1: Combine the rankings
Step 2: Combine with prediction
Step 3: Combine with prevalence
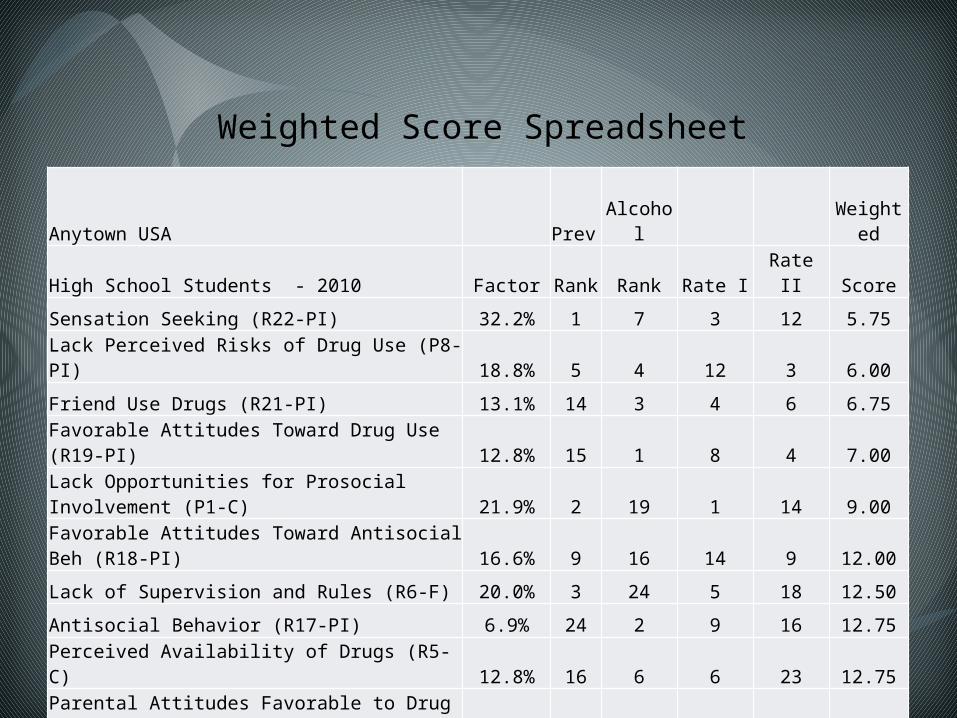
Weighted Score Spreadsheet
Anytown USA Prev Alcohol Weighted
High School Students - 2010 Factor Rank Rank Rate I Rate II Score
Sensation Seeking (R22-PI) 32.2% 1 7 3 12 5.75
Lack Perceived Risks of Drug Use (P8-PI) 18.8% 5 4 12 3 6.00
Friend Use Drugs (R21-PI) 13.1% 14 3 4 6 6.75
Favorable Attitudes Toward Drug Use (R19-PI) 12.8% 15 1 8 4 7.00
Lack Opportunities for Prosocial Involvement (P1-C) 21.9% 2 19 1 14 9.00
Favorable Attitudes Toward Antisocial Beh (R18-PI) 16.6% 9 16 14 9 12.00
Lack of Supervision and Rules (R6-F) 20.0% 3 24 5 18 12.50
Antisocial Behavior (R17-PI) 6.9% 24 2 9 16 12.75
Perceived Availability of Drugs (R5-C) 12.8% 16 6 6 23 12.75
Parental Attitudes Favorable to Drug Use (R10-F) 13.8% 12 5 13 21 12.75
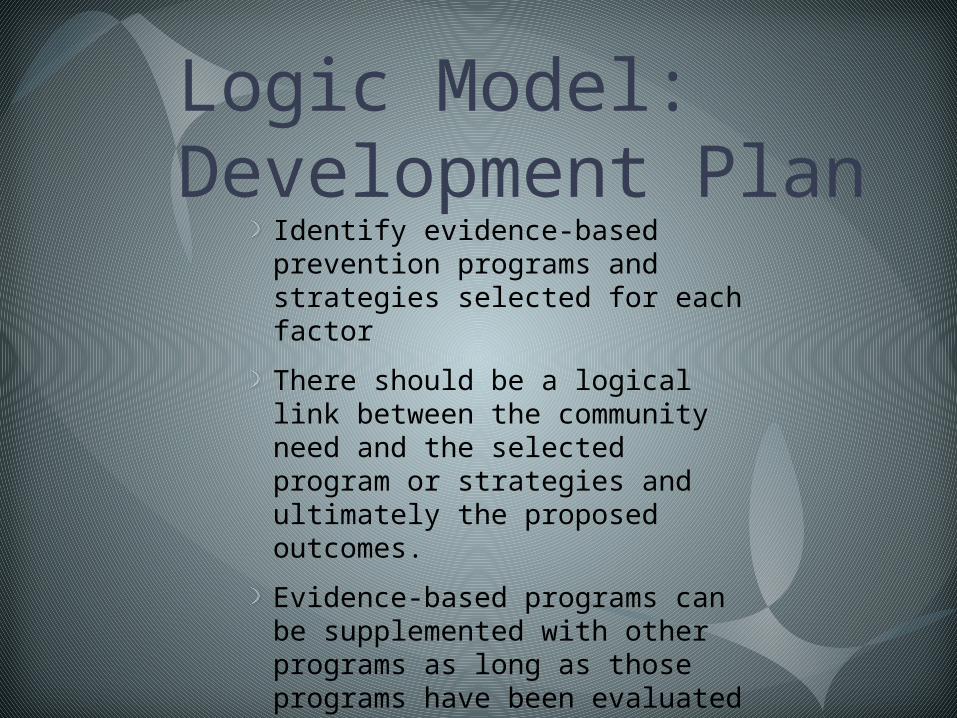
Logic Model: Development Plan
Identify evidence-based prevention programs and strategies selected for each factor
There should be a logical link between the community need and the selected program or strategies and ultimately the proposed outcomes.
Evidence-based programs can be supplemented with other programs as long as those programs have been evaluated and are based on evidence-based approaches.
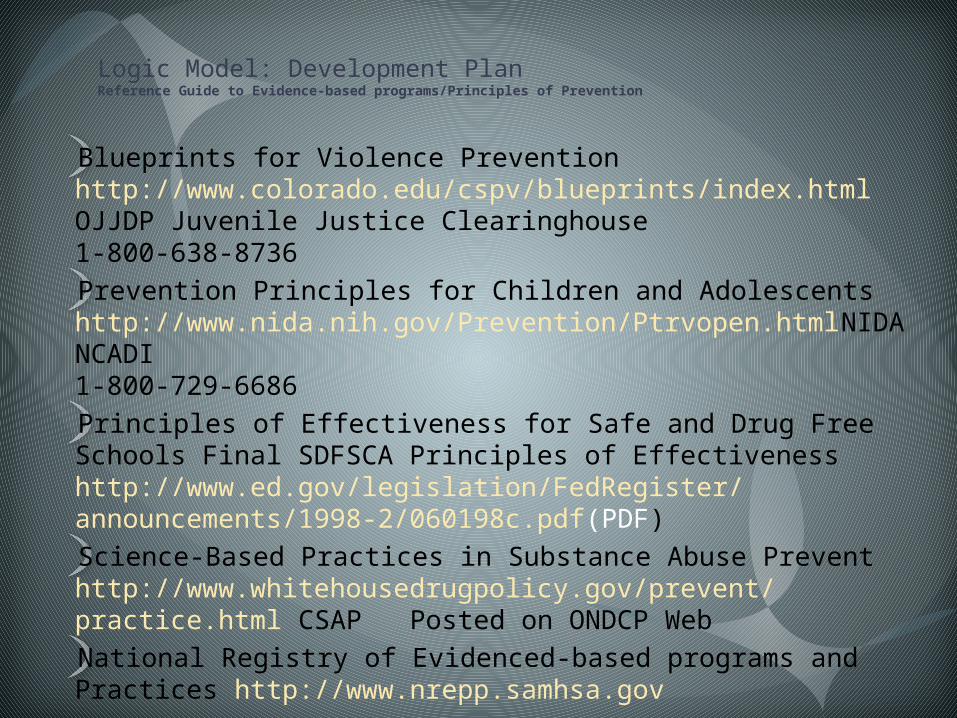
Logic Model: Development PlanReference Guide to Evidence-based programs/Principles of Prevention
Blueprints for Violence Prevention http://www.colorado.edu/cspv/blueprints/index.html OJJDP Juvenile Justice Clearinghouse1-800-638-8736 Prevention Principles for Children and Adolescents http://www.nida.nih.gov/Prevention/Ptrvopen.htmlNIDA NCADI1-800-729-6686 Principles of Effectiveness for Safe and Drug Free Schools Final SDFSCA Principles of Effectivenesshttp://www.ed.gov/legislation/FedRegister/ announcements/1998-2/060198c.pdf(PDF) Science-Based Practices in Substance Abuse Prevent http://www.whitehousedrugpolicy.gov/prevent/ practice.html CSAP Posted on ONDCP Web National Registry of Evidenced-based programs and Practices http://www.nrepp.samhsa.gov
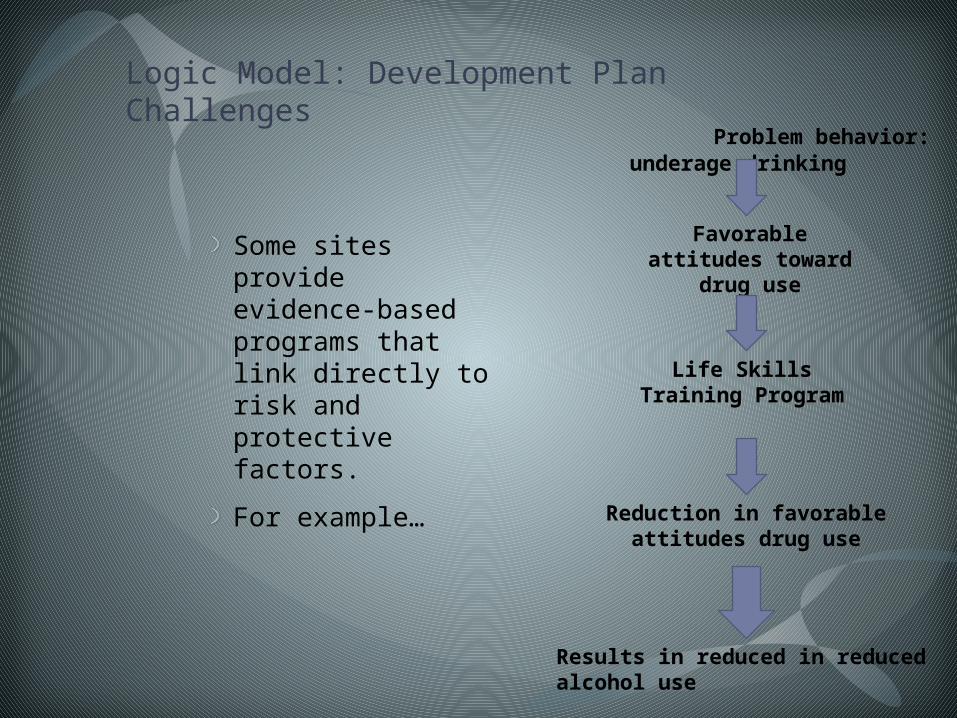
Logic Model: Development Plan Challenges
Some sites provide evidence-based programs that link directly to risk and protective factors.
For example…
Problem behavior: underage drinking
Favorable attitudes toward drug use
Life Skills Training Program
Reduction in favorable attitudes drug use
Results in reduced in reduced alcohol use
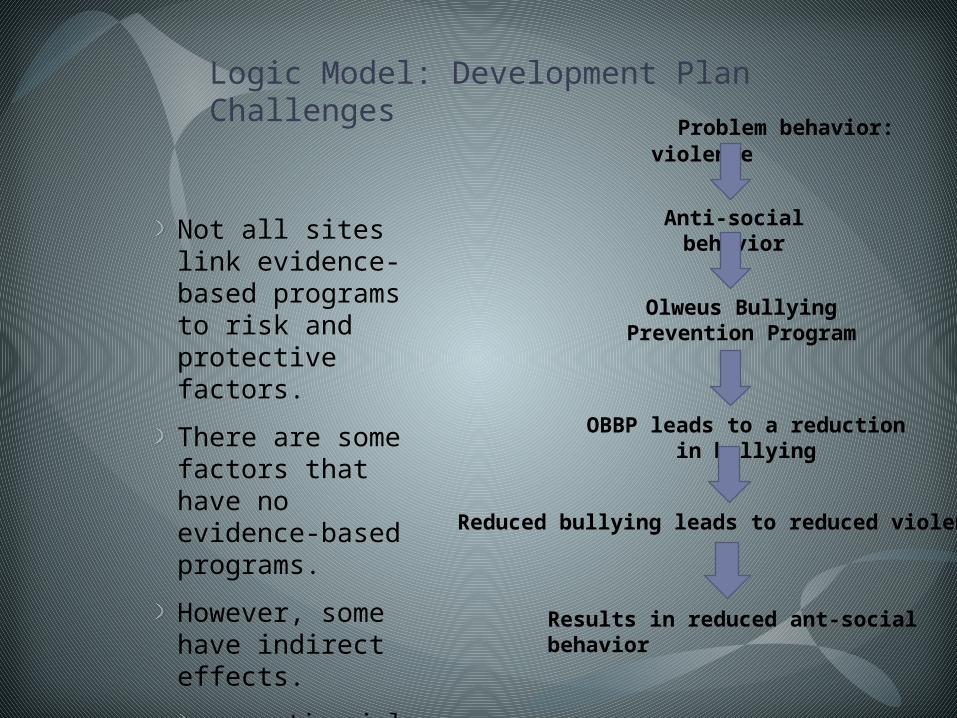
Logic Model: Development Plan Challenges
Not all sites link evidence-based programs to risk and protective factors.
There are some factors that have no evidence-based programs.
However, some have indirect effects.
eg: antisocial behavior
Problem behavior: violence
Anti-social behavior
Olweus Bullying Prevention Program
OBBP leads to a reduction in bullying
Results in reduced ant-social behavior
Reduced bullying leads to reduced violence
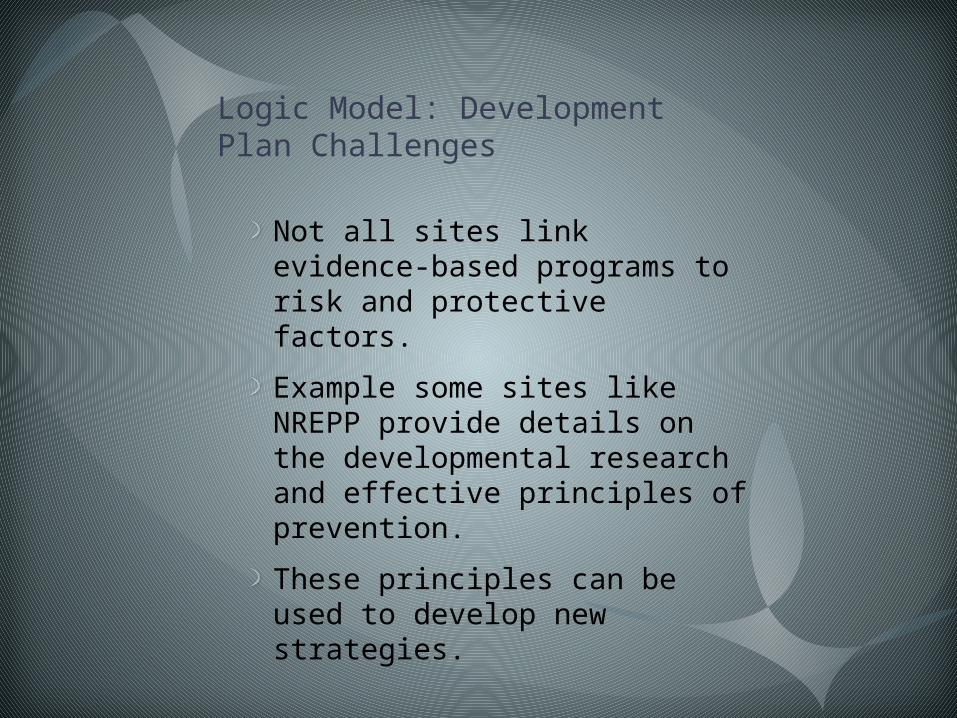
Logic Model: Development Plan Challenges
Not all sites link evidence-based programs to risk and protective factors.
Example some sites like NREPP provide details on the developmental research and effective principles of prevention.
These principles can be used to develop new strategies.
Logic Model
Alcohol
Risk Factors
Protective Factors
WorkgroupInput
Develop Action Plan
What? (Prevalenc
e)
Why? Root
Causes(Weighte
d factors)
Why Here?Local factors
Implementation
Evaluation
Evaluation
Evaluation
Answers the question – “What happened…
…compared to what would have happened?”
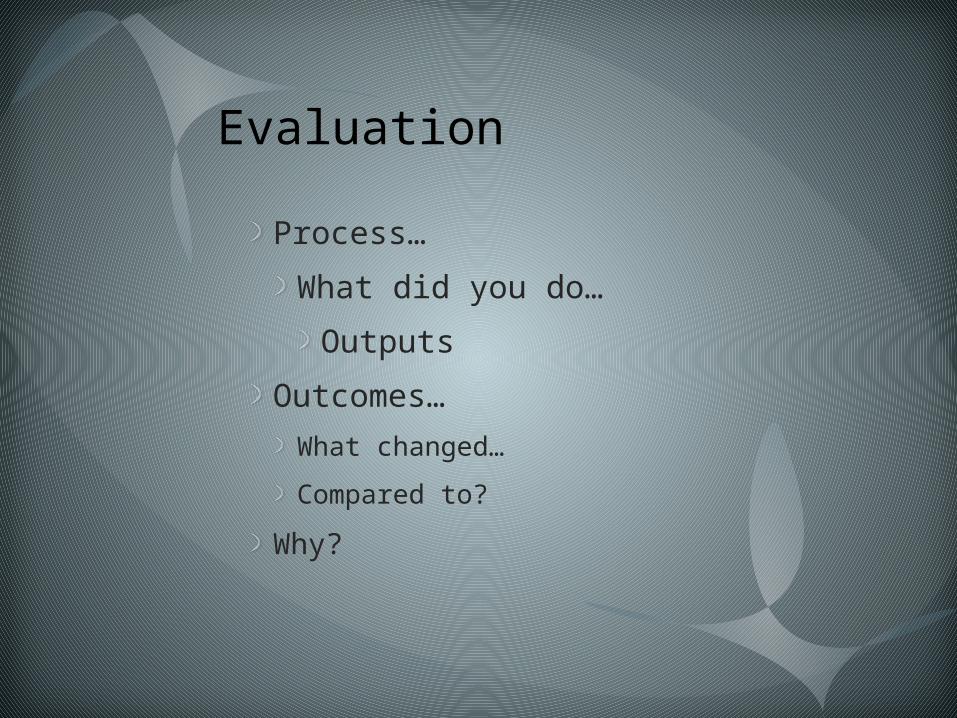
Evaluation
Process…
What did you do…
Outputs
Outcomes…
What changed…
Compared to?
Why?
Evaluation
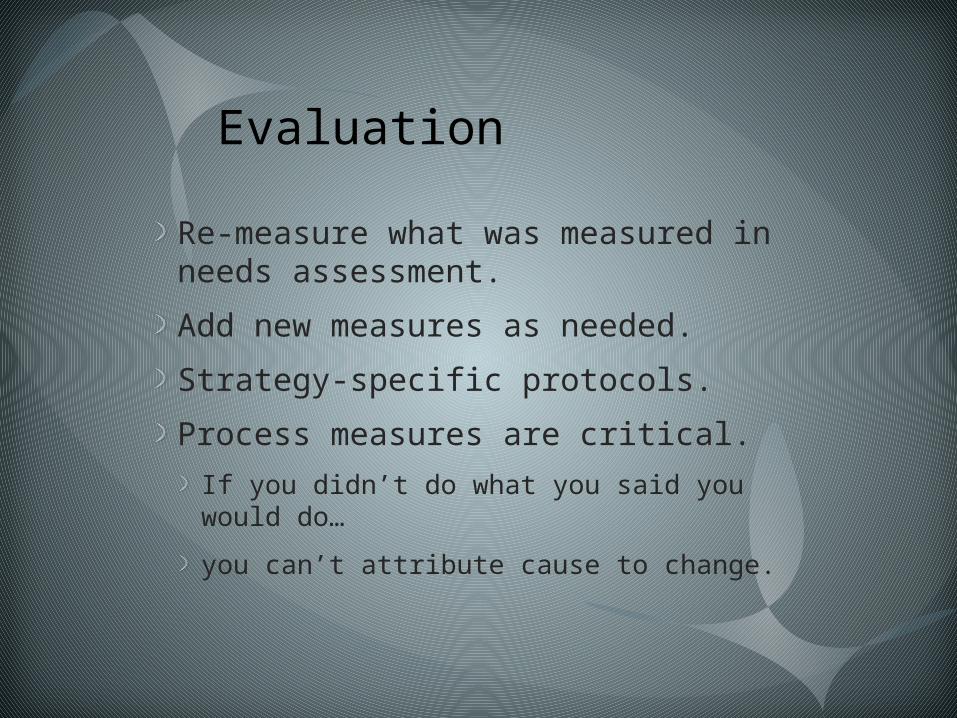
Re-measure what was measured in needs assessment.
Add new measures as needed.
Strategy-specific protocols.
Process measures are critical.
If you didn’t do what you said you would do…
you can’t attribute cause to change.
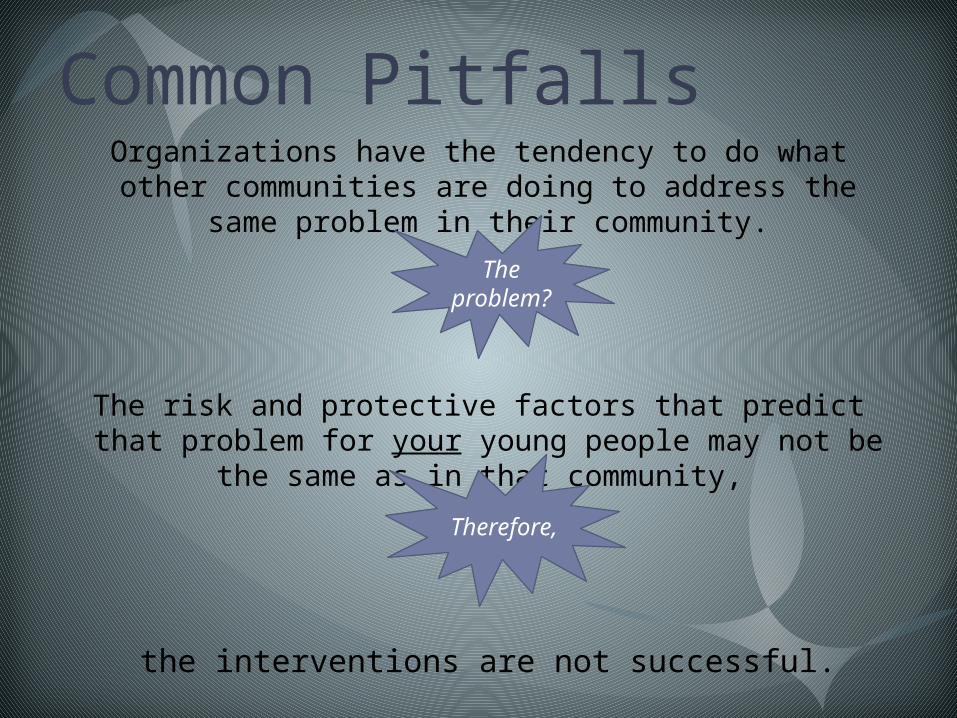
Common PitfallsOrganizations have the tendency to do what other communities are doing to address the same problem
in their community.
The risk and protective factors that predict that problem for your young people may not be the same
as in that community,
the interventions are not successful.
The problem
?
Therefore,
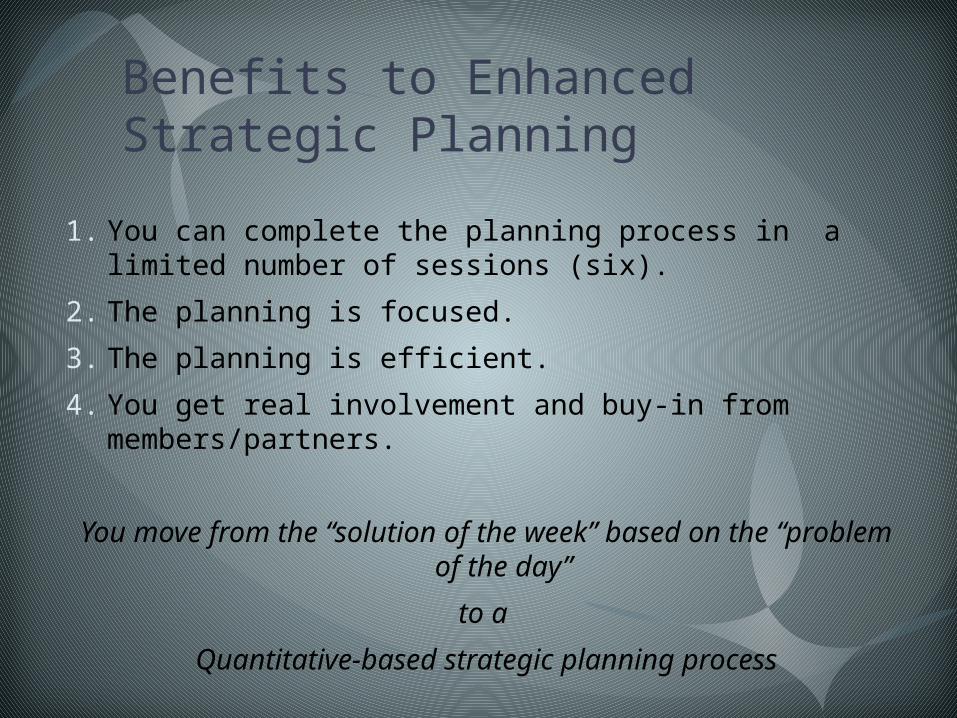
Benefits to Enhanced Strategic Planning
1. You can complete the planning process in a limited number of sessions (six).
2. The planning is focused.
3. The planning is efficient.
4. You get real involvement and buy-in from members/partners.
You move from the “solution of the week” based on the “problem of the day”
to a
Quantitative-based strategic planning process

For Questions
Rob Lillis
Evalumetrics Research
Lynne Gochenaur
Marcus Whitman School District
Recommended