AN INDUSTRY ANALYSIS
OF THE REAL ESTATE
SECTORBy:
Arunav Nayak (11DM059)
Sanjeev Kumar (11DM017)
Sudeshna Sahu (11DM039)
Sulekha Routray (11DM104)
APPROACH
Analysis of the Real Estate Cycle and the
parameters affecting it
Current Scenario of Real Estate in India
Analysis of the segments of the Real Estate
Industry (i.e Residential, Commercial, Retail and
Hospitality)
Key Players in the Indian Real Estate
Sector Market Performance in NSE
Global Trends
Application of Porter’s 5 Forces Model
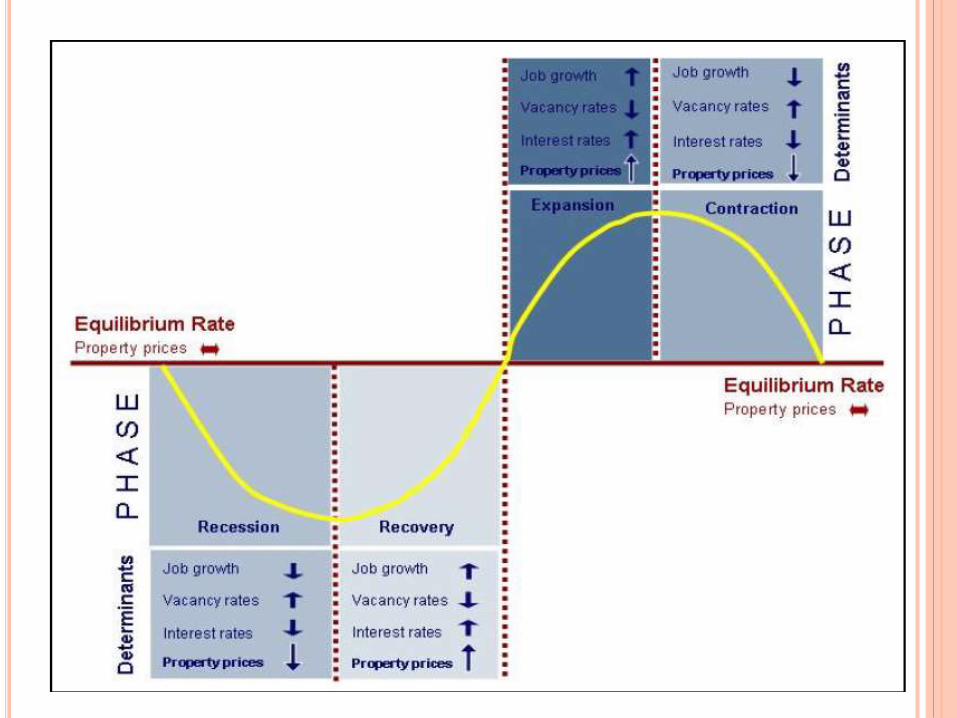
REAL ESTATE CYCLE
Real estate cycles are described as cyclic
movements of price in the real estate market which,
over a period of time, causes fluctuations in the
residential and commercial property market.
The real estate cycles involves periodic shifts of
rapid growth of output (recovery and
prosperity),alternating with relative stagnation or
decline (contraction or recession) over time.
PHASES OF REAL ESTATE CYCLE
Recession
Recovery
Expansion
Contraction
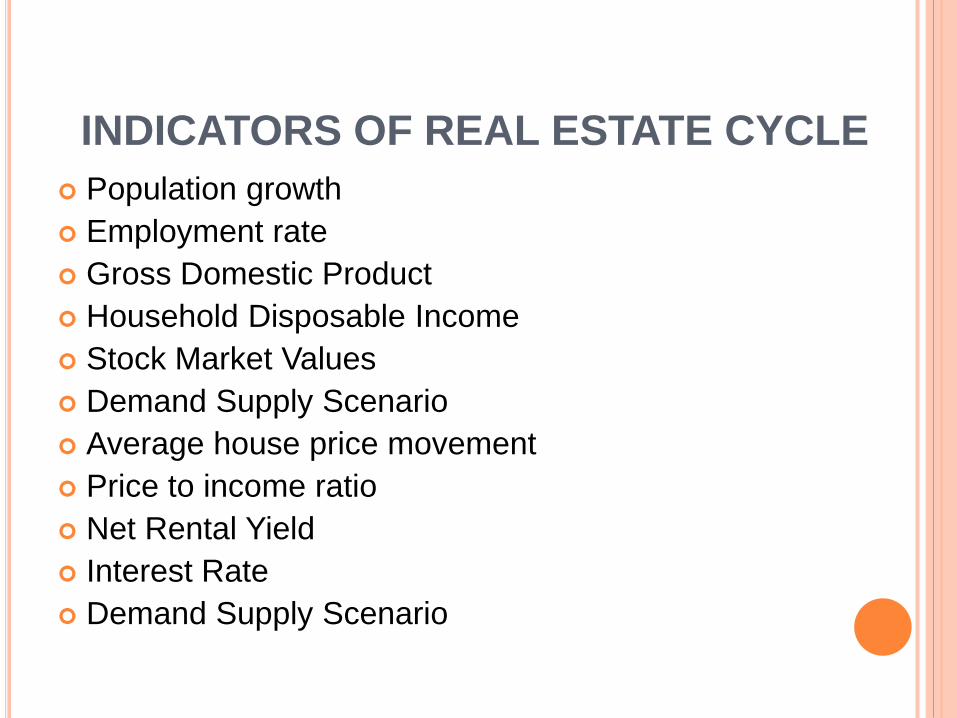
INDICATORS OF REAL ESTATE CYCLE
Population growth
Employment rate
Gross Domestic Product
Household Disposable Income
Stock Market Values
Demand Supply Scenario
Average house price movement
Price to income ratio
Net Rental Yield
Interest Rate
Demand Supply Scenario
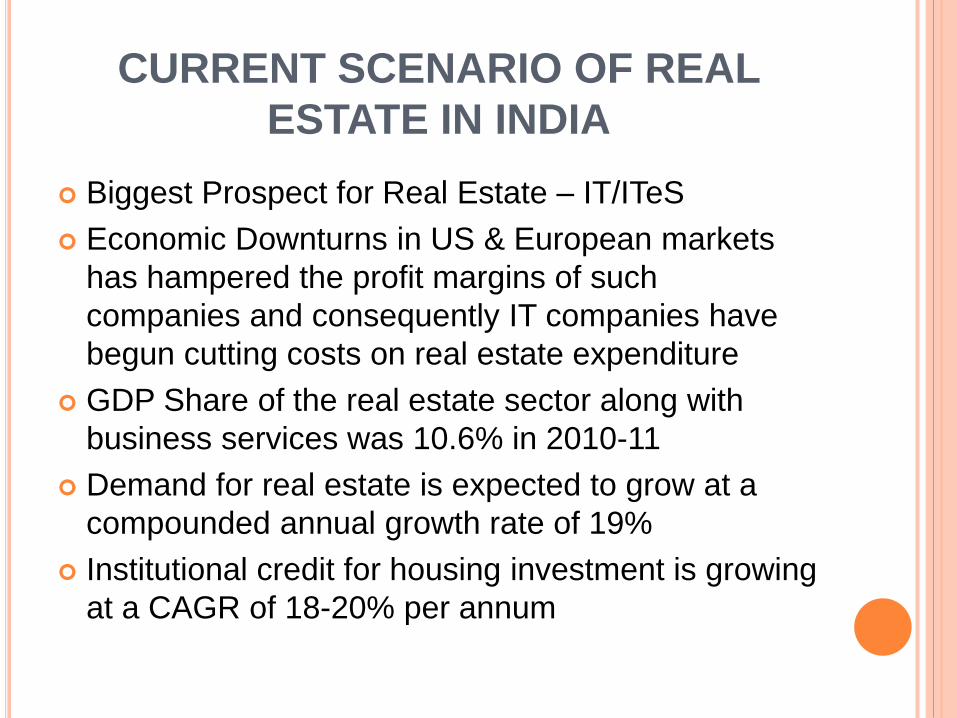
CURRENT SCENARIO OF REAL
ESTATE IN INDIA
Biggest Prospect for Real Estate – IT/ITeS
Economic Downturns in US & European markets
has hampered the profit margins of such
companies and consequently IT companies have
begun cutting costs on real estate expenditure
GDP Share of the real estate sector along with
business services was 10.6% in 2010-11
Demand for real estate is expected to grow at a
compounded annual growth rate of 19%
Institutional credit for housing investment is growing
at a CAGR of 18-20% per annum
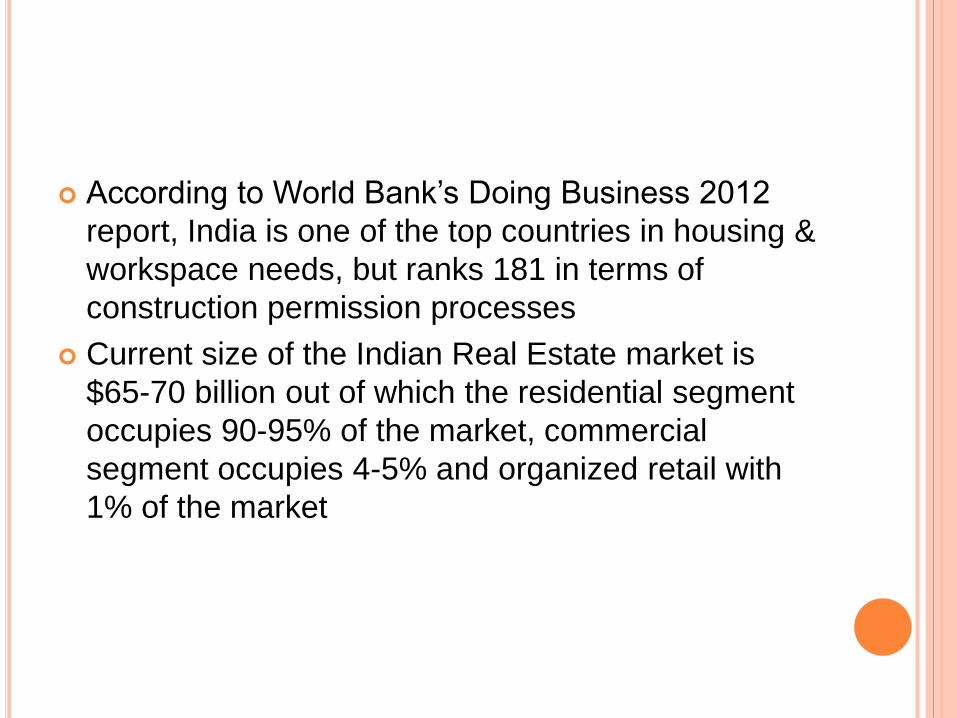
According to World Bank’s Doing Business 2012
report, India is one of the top countries in housing &
workspace needs, but ranks 181 in terms of
construction permission processes
Current size of the Indian Real Estate market is
$65-70 billion out of which the residential segment
occupies 90-95% of the market, commercial
segment occupies 4-5% and organized retail with
1% of the market
GROWTH DRIVERS OF INDIAN REAL
ESTATE
Rapid urbanization
Significant rise in consumerism
Policy and Regulatory reforms (100% FDI
relaxation)
Surge in Industrial and Business Activities
Increasing demand for newer avenues for
entertainment, leisure and shopping
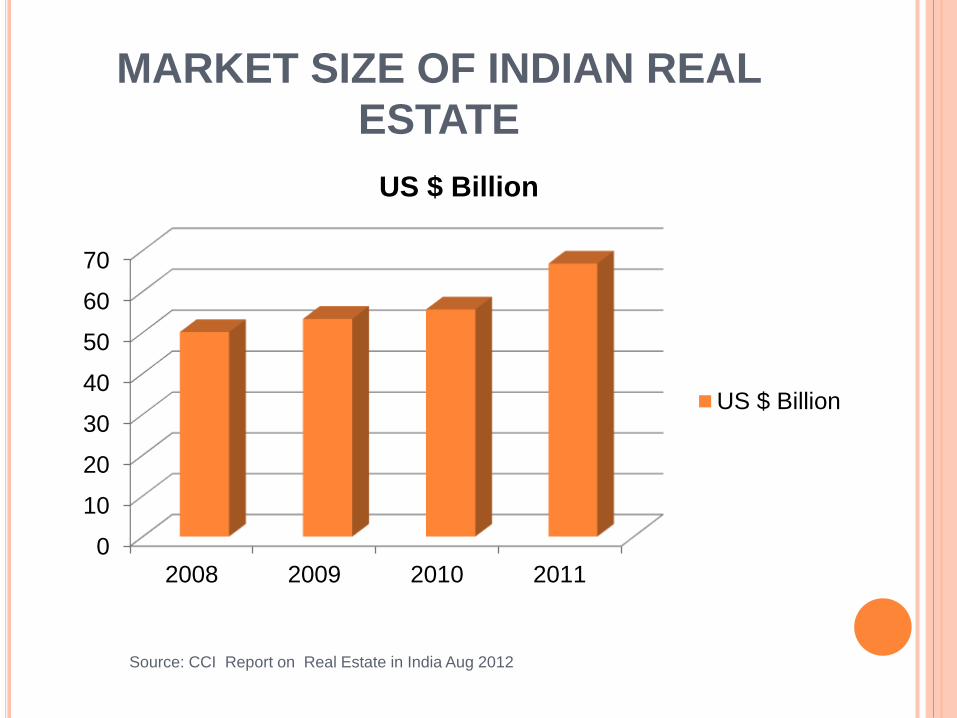
MARKET SIZE OF INDIAN REAL
ESTATE
0
10
20
30
40
50
60
70
2008 2009 2010 2011
US $ Billion
US $ Billion
Source: CCI Report on Real Estate in India Aug 2012
SEGMENTS OF REAL ESTATE
SECTOR IN INDIA
Residential
Commercial
Retail
Hospitality
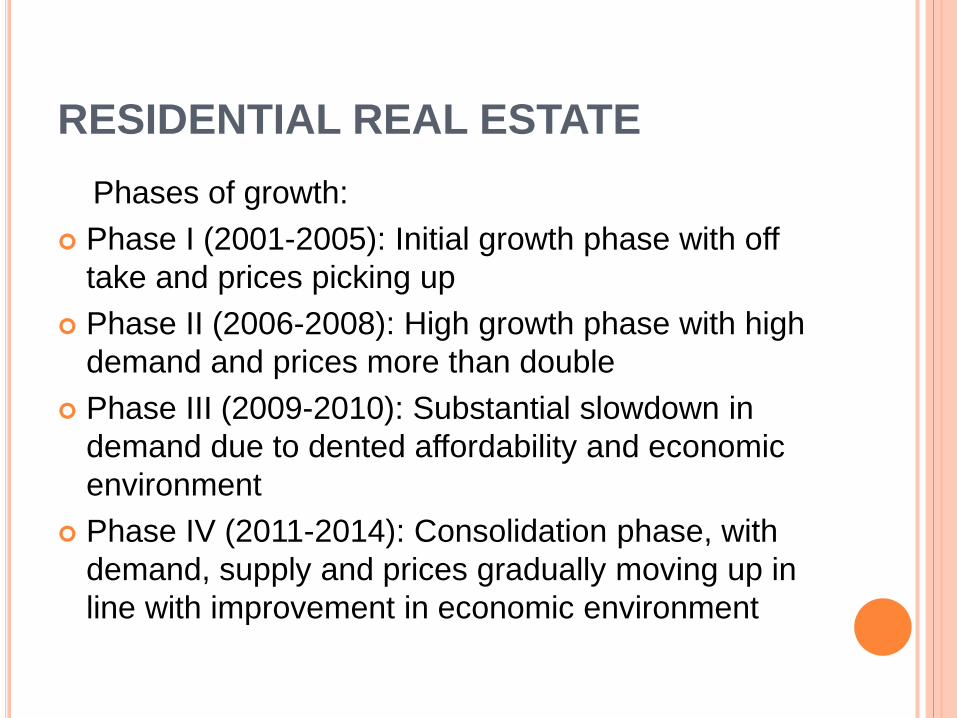
RESIDENTIAL REAL ESTATE
Phases of growth:
Phase I (2001-2005): Initial growth phase with off
take and prices picking up
Phase II (2006-2008): High growth phase with high
demand and prices more than double
Phase III (2009-2010): Substantial slowdown in
demand due to dented affordability and economic
environment
Phase IV (2011-2014): Consolidation phase, with
demand, supply and prices gradually moving up in
line with improvement in economic environment
This segment is highly influenced by economic
cycles. Owing to global meltdown, the residential
real estate market in India too witnessed an
astounding fall in demand and capital values,
between first half of 2008 and first half of 2009.
Average residential capital values declined by 18-
20 per cent in March 2009 from the peaks
witnessed during the first half of 2008.
Recently there has been a pickup in demand due
improvements in economy

COMMERCIAL REAL ESTATE
The commercial real estate has been driven largely by the growth in service sectors, especially IT/ITeSand with this began movement from CBD’s (Central Business Districts) towards city suburbs.
Tax sops on the profits of IT-ITeS companies also led to massive development of IT Parks and SEZs (Special Economic Zones)
Demand for office space is directly linked to addition in number of employees, which in turn is dependent on economic growth. When economy slows down, companies hold their expansion plans leading to lower demand for office space.
Due to the Subprime crisis and the ongoing
Eurozone crisis, the demand for commercial space
has come down drastically. Subdued demand and
rentals has impacted the execution adversely in
addition to cancellation of many projects.
Sustained decline in this segment past 2008 has
been the result of postponement of expansion plans
by corporate.

ORGANIZED RETAIL REAL ESTATE
The retail industry in India is in slowdown despite
attaining peaks of CAGR at 28% in the 2005-08
period. The industry is expected to increase at a
CAGR of 14% in the short term and 19% over the
next 5 years.
Organised retail penetration has grown to about
5.6% in 2009-10, which is further expected to
increase to about 7.3% by 2012-13.
Key driving factors for growth of this sector includes
lavish lifestyles, high disposable incomes and a
propensity to spend.
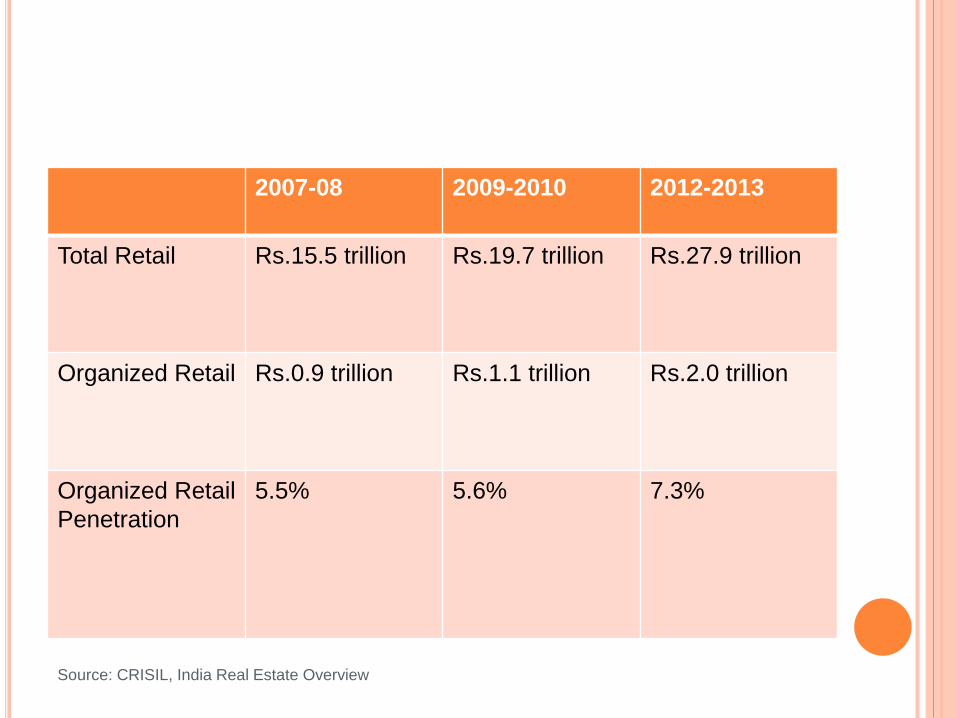
2007-08 2009-2010 2012-2013
Total Retail Rs.15.5 trillion Rs.19.7 trillion Rs.27.9 trillion
Organized Retail Rs.0.9 trillion Rs.1.1 trillion Rs.2.0 trillion
Organized Retail
Penetration
5.5% 5.6% 7.3%
Source: CRISIL, India Real Estate Overview
HOSPITALITY SECTOR REAL
ESTATE
Rising incomes, higher weekend trips and increased access to travel-related information over the Internet have propelled growth in hospitality.
From 2003-04 to 2010-11,the market size of the hotel sector has more than doubled from Rs 77.13 billion in 2003-04 to more than Rs 200 billion in 2008-09, registering an impressive CAGR of more than 15%
In 2008-09, the market size decreased by around 4 per cent due to decline in revenues. The hotel industry faced a fall in room demand due to the global financial crisis and the 26/11 terror attacks in Mumbai.

Demand is expected to increase at a CAGR of 15
per cent while room availability is expected to
record a CAGR of 9 per cent across premium
segments. Business destinations are poised to see
higher growth in room inventory compared to
leisure destinations.
KEY PLAYERS IN THE INDIAN REAL
ESTATE
DLF Ltd
1. Presence across 30 cities in India
2. Residential, townships, commercial complexes, IT
parks, hotels etc pan its project coverage
3. It is the only real estate company to be listed in
BSE Sensex, NSE Nifty, MSCI India Index and
MSCI Emerging Markets Asia Index
UNITECH
1. First developer to be certified ISO 9001
2. Offers diversified projects across residential,
commercial and IT parks, retail, hotels etc.
3. First real estate company to be listed in NSE Nifty
4. Has ventured into infrastructure business as
UNITECH Infra
Ansal API
1. Market leader in the NCR region
2. Project spectrum includes integrated townships,
group housing, shopping complexes and malls,
hotels, IT parks and SEZ segments, and
Infrastructure and Utility services
3. Land reserves of about 9335 acres
SECTOR MARKET PERFORMANCE
(NSE)
The market trend in NSE for last 7, 15, 30 and 90
days can be obtained
In this presentation, there will be focus on top
gainers and losers over a period from 14th
September 2012 to 28th September 2012
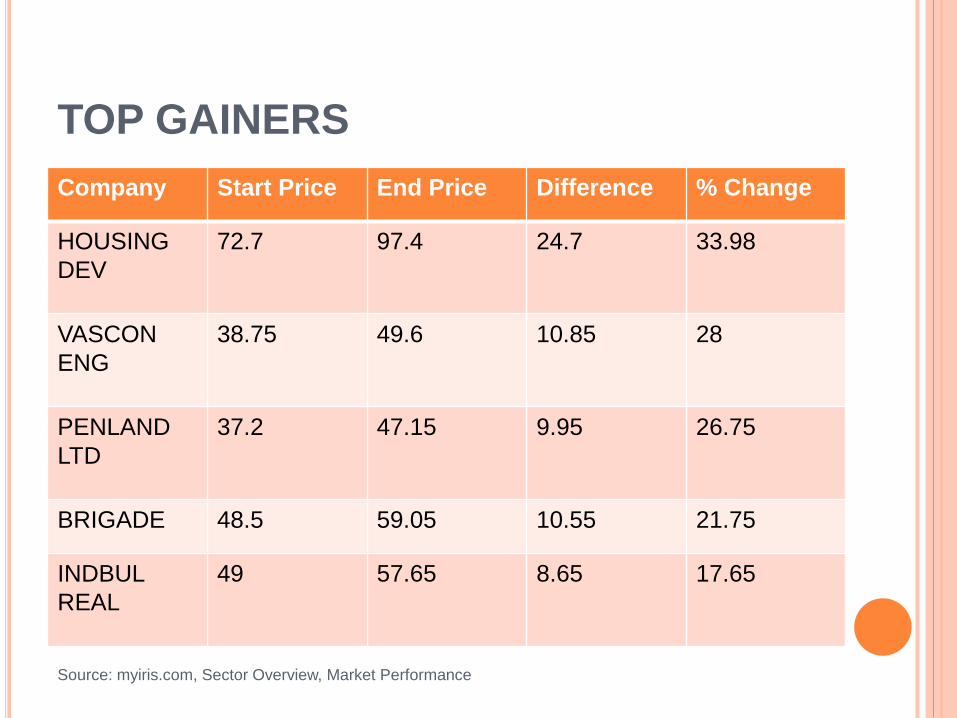
TOP GAINERS
Company Start Price End Price Difference % Change
HOUSING
DEV
72.7 97.4 24.7 33.98
VASCON
ENG
38.75 49.6 10.85 28
PENLAND
LTD
37.2 47.15 9.95 26.75
BRIGADE 48.5 59.05 10.55 21.75
INDBUL
REAL
49 57.65 8.65 17.65
Source: myiris.com, Sector Overview, Market Performance
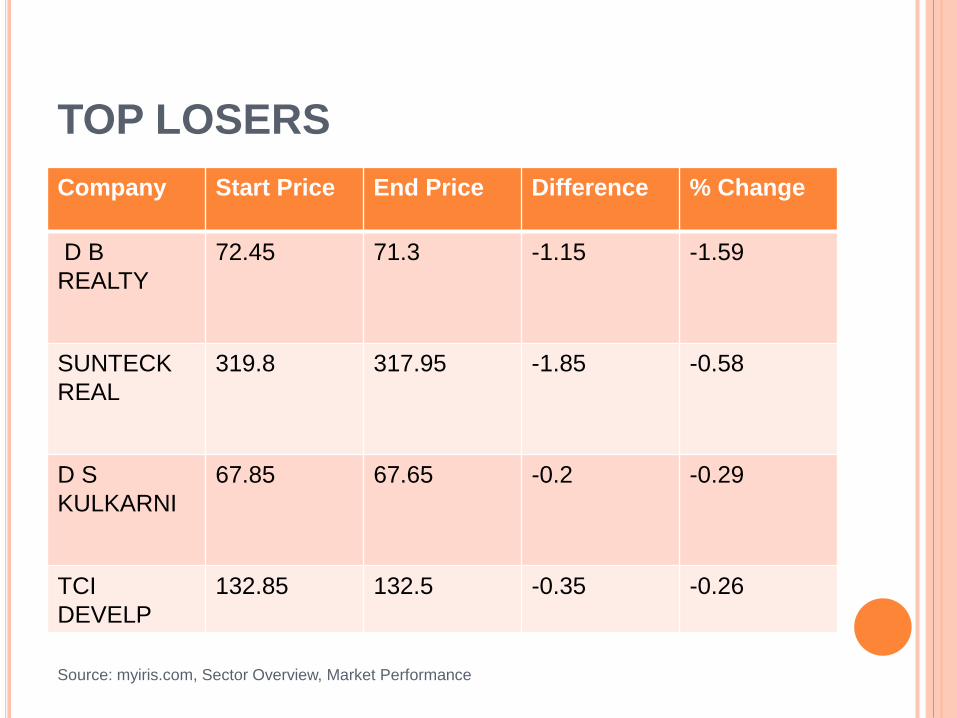
TOP LOSERS
Company Start Price End Price Difference % Change
D B
REALTY
72.45 71.3 -1.15 -1.59
SUNTECK
REAL
319.8 317.95 -1.85 -0.58
D S
KULKARNI
67.85 67.65 -0.2 -0.29
TCI
DEVELP
132.85 132.5 -0.35 -0.26
Source: myiris.com, Sector Overview, Market Performance
GLOBAL TRENDS
As per a report published by Scotiabank dated
September 14, 2012:
Among the international property markets tracked,
the number of countries reporting declining average
real prices on a year-over-year basis outnumbered
those reporting price increases by more than two to
one.
Weak consumer confidence, high unemployment
and tight credit conditions continue to weigh heavily
on housing demand and pricing.
Housing markets remain weakest in Europe, where
sharp fiscal austerity, rising unemployment and
financial sector strains are deepening recessionary
conditions.
In European countries that are financially sound,
there were some tentative signs of improvement.
The U.S. housing market is showing increasing
signs of recovery.
U.S. homeowner affordability, rising rental costs
and strengthening household formation are
contributing to the pickup in sales. Lower inventory
levels and a falling share of distressed property
sales also have contributed to the stabilization in
prices, though significant differences in local market
conditions persist.
An increasing number of cities in China are seeing
renewed home price appreciation. This is being
supported by an easing in monetary conditions .
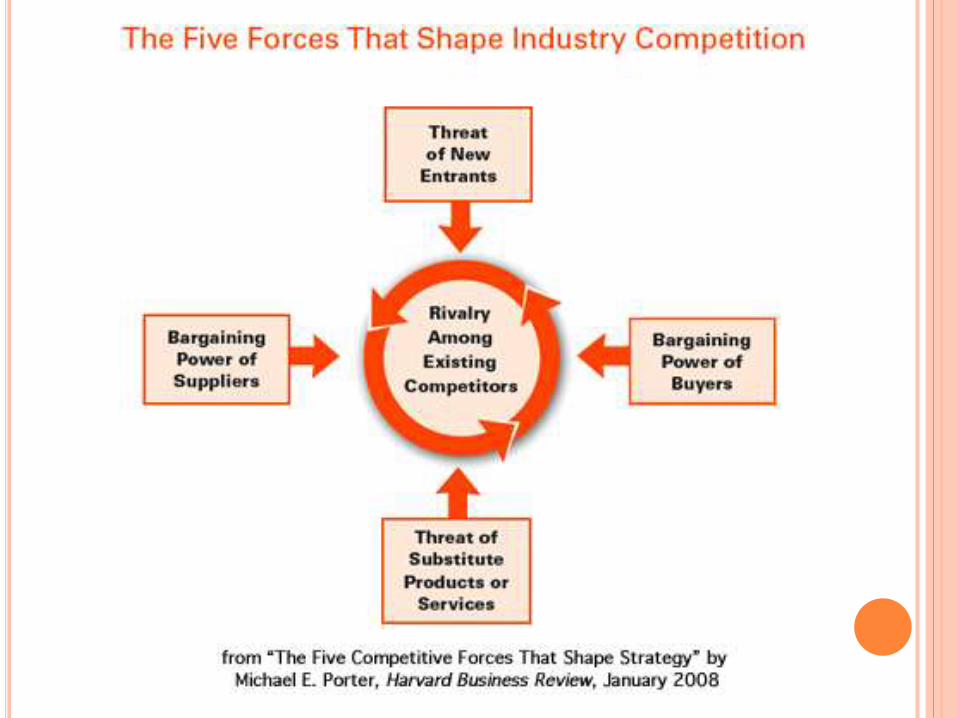
APPLICATION OF PORTER’S 5
FORCES MODEL TO INDIAN REAL
ESTATE
The analysis of 5 Forces model has been done to
determine whether the Indian Real Estate sector will
remain profitable in the years to come
It is important to consider the impact of the
Eurozone Crisis as well as the Subprime Crisis
THREAT OF NEW ENTRANTS
There will be decrease in profitability due to
increase in the number of entrants.
As a result of the economic downturn around the
globe, it has been difficult for the new entrants to
get a hold because of cost reduction in expansion
plans by corporates in real estate, little scope in
commercial construction, and strong rivalry
between existing firms.
Result: Relatively weak threat of new entrants

BARGAINING POWER OF BUYERS
Powerful customers are able to exert pressure to
drive down prices, or increase the required quality
for the same price, and therefore reduce profits in
an industry.
Customers significantly influence the business
operations in real estate.
Customers do possess a threat of integrating
backwards.
Consequently, the bargaining power of the buyers
is strong.
BARGAINING POWER OF SUPPLIERS
An important category of suppliers is the bank.
They have the power to decide whether to fund a
venture or not and at what rate.
Banks have now become highly conservative
especially after the economic downturn.
Are significantly affected by the monetary
regulations like the Repo rate & CRR formulated by
the Central Bank of the country. This is in turn
affects the real estate sector.
Consequently the bargaining power of suppliers is
very strong
THREAT OF SUBSTITUTE
PRODUCTS AND SERVICES
In real estate business, substitute might be some
type of totally new retail space, some new location
for office space or rehabilitation instead of new
construction.
The threat of substitute in real estate business and
its impact on profitability of the industry is quite
ambiguous and difficult to establish given the
economic downturns and the recovery mode of the
real estate business cycle.
RIVALRY AMONG EXISTING
COMPETITORS
Rivalry is strong due to the large no. of real estate
firms operating in India (65 in total) and the difficulty
to differentiate
The services offered by real estate companies
cannot be differentiated because these firms don’t
offer a product, other than the facilities they lease
and this itself is very difficult to quantify.
In the current economic crisis, there is minimal
profitability and only companies with large cash
reserves are likely to survive.
ANALYSIS
Considering all the 5 forces, it can be said that the
real estate industry is not very profitable at this
stage as it was before the subprime crisis of US in
2008
But considering the fact that the real estate cycle is
in the recovery stage right now and given that the
demand for real estate is growing at a CAGR of
19%, it can be said that there are still bright
prospects ahead in a country like India.
REFERENCES
(August 2012). Real Estate Sector in India. New Delhi: Competition Corporation of India (CCI)http://www.cci.in/pdf/surveys_reports/real-estate-sector-india.pdf
Warren, A. (September 14,2012). Global Real Estate Trends. Toronto: Scotia Bank http://www.gbm.scotiabank.com/English/bns_econ/retrends.pdf
Porter, M. E. (June 2002). Competitive Strategy and Real Estate Development. Harvard Business School , 9. http://www.isc.hbs.edu/Porter_Strategy_Real_Estate1.pdf
Dr.V.Chandrasekhar, G. S. (2011). Indicators of
Real Estate Cycle - Implication for India. ICREI, ISB
, 20.

THANK YOU
Recommended