ipd.com 1 ©2013 Investment Property Databank Ltd. All rights reserved.
IPD BeNeLux composite market indicator 2012
PropertyEU
Benelux Investment Briefing
Brussels, 24 M ay 2013
Arnoud L.M. Vlak
managing director IPD BeNeLux

©2013 Investment Property Databank Ltd. All rights reserved. ipd.com 2
Belgium databank 2012
Index data started 2004
IPD Databank capital value (million €)
8,157
Number of properties 373
Number of funds 32
Market coverage
(est. € 42 billion) 19%
IPD BeNeLux composite market indicator core data
Netherlands databank 2012
Index data started 1995
IPD Databank capital value (million €)
37,267
Number of properties 4.521
Number of funds 58
Market coverage
(est. € 112 billion) 33%
©2013 Investment Property Databank Ltd. All rights reserved. ipd.com 3
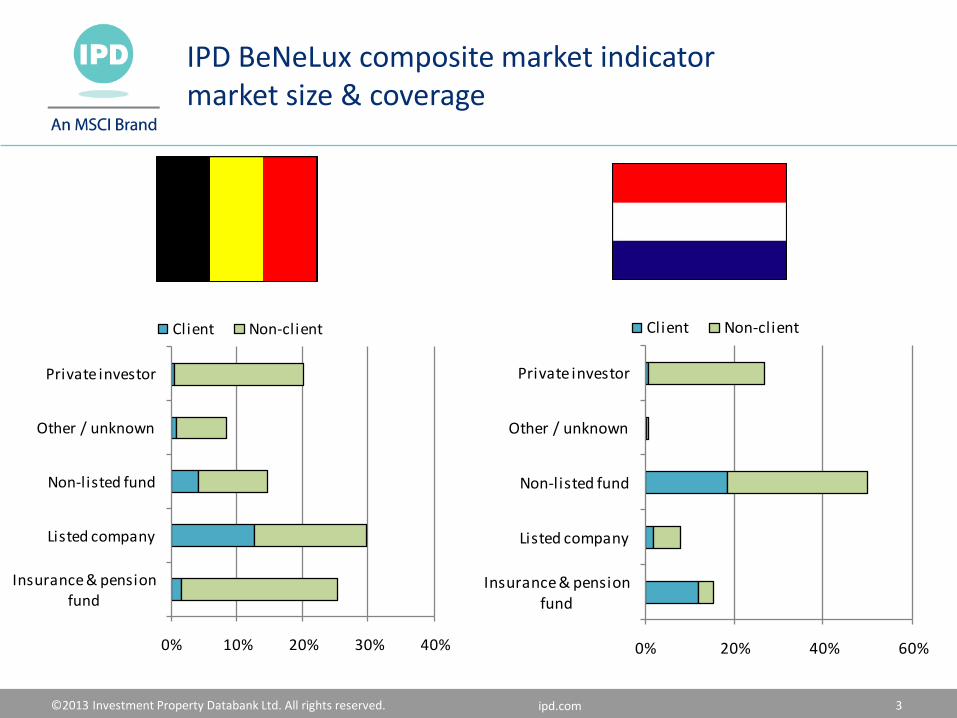
IPD BeNeLux composite market indicator market size & coverage
0% 20% 40% 60%
Insurance & pension fund
Listed company
Non-listed fund
Other / unknown
Private investor
Client Non-client
0% 10% 20% 30% 40%
Insurance & pension fund
Listed company
Non-listed fund
Other / unknown
Private investor
Client Non-client

©2013 Investment Property Databank Ltd. All rights reserved. ipd.com 4
IPD BeNeLux market indicator 2012 – composition
0% 20% 40% 60% 80%
Retail
Office
Industrial
Residential
Other
Belgium
Netherlands

©2013 Investment Property Databank Ltd. All rights reserved. ipd.com 5
BeNeLux 2012 total return composite & differentiated
Standing Investments Total Return differentiated per country:
1,9
IPD BeNeLux- Standing Investments composite Total Return
IPD Belgium index 3,6 IPD Netherlands Annual index 1,2

©2013 Investment Property Databank Ltd. All rights reserved. ipd.com 6
BeNeLux composite total return 2012, per sector
Retail, offices, industrial and other (SI)
-1.4
-5.3 -4.8
-3.2-1.7 -3.5
6.0 6.1 6.84.5
6.2
5.54.4
0.5
1.7
1.1
4.4
1.9
-6
-4
-2
0
2
4
6
8
Retail Offices Industrial Residential Other All sectors
Pe
rce
nta
ge %
Income return Capital growth Total return

©2013 Investment Property Databank Ltd. All rights reserved. ipd.com 7
BeNeLux differentiated total return 2012, per sector
Retail, offices, industrial and other per region (SI)
-4
-3
-2
-1
0
1
2
3
4
5
6
7
Retail Office Industrial Residential Other All Property
Pe
rce
nta
ge (%
) Belgium
Netherlands
BeNeLux
Eurozone

©2013 Investment Property Databank Ltd. All rights reserved. ipd.com 8
BeNeLux composite return p/a 2005 - 2012
Total return index results all sectors (SI)
-6
-3
0
3
6
9
12
15
18
2005 2006 2007 2008 2009 2010 2011 2012
Capital growth Income return Total return
Tota
l Ret
urn
%
3-years: 3.5 8-years: 5.8
Annualised BeNeLux total returns:

©2013 Investment Property Databank Ltd. All rights reserved. ipd.com 9
BeNeLux differentiated return p/a 2005 – 2012
All property (SI) – Total return
-2
0
2
4
6
8
10
12
14
16
181
99
8
19
99
20
00
20
01
20
02
20
03
20
04
20
05
20
06
20
07
20
08
20
09
20
10
20
11
20
12
Belgium Netherlands BeNeLux Eurozone
To
tal R
etu
rn %

©2013 Investment Property Databank Ltd. All rights reserved. ipd.com 10
BeNeLux returns 2005 – 2012 in global perspective
All property (SI) – Total return annualised average return (currency effect)
-5
0
5
10
15
20
Au
stra
lia
Au
stri
a
Ca
na
da
Cze
ch R
epu
bli
c
Den
ma
rk
Euro
zon
e
Fin
lan
d
Fra
nce
Ger
ma
ny
Hu
nga
ry
Ita
ly
Jap
an
New
Zea
lan
d
No
rwa
y
Po
lan
d
Po
rtu
gal
Irel
an
d
Sou
th A
fric
a
Sou
th K
ore
a
Spa
in
Swed
en
Swit
zerl
an
d
UK
USA
Bel
giu
m
Net
her
lan
ds
BeN
eLu
x
Euro
zon
e
Tota
l re
turn
(%)
Avg. 2005-2012 return local currency Avg. 2005-2012 return €

©2013 Investment Property Databank Ltd. All rights reserved. ipd.com 11
BeNeLux risk & return 2005 – 2012 in global perspective
All property (SI) – Total return annualised average return
-5
0
5
10
15
20
0 5 10 15 20 25
An
nu
alis
ed
to
tal r
etu
rn (%
)
Risk (Stdev)
Other countries
Belgium
Netherlands
BeNeLux
Eurozone

©2013 Investment Property Databank Ltd. All rights reserved. ipd.com 12
BeNeLux return 2005 – 2012 in perspective of GDP growth
All property (SI) – Total return annualised average return
-5
0
5
10
15
20
-1 0 1 2 3 4 5
An
nu
alis
ed
to
tal r
etu
rn (%
)
Annualised Real GDP growth (%)
Other countries
Belgium
Netherlands
BeNeLux
Eurozone

©2013 Investment Property Databank Ltd. All rights reserved. ipd.com 13
Capital value growth analysis: retail - Belgium
Underlying parameters (SI)
90
100
110
120
130
140
150
2004 2005 2006 2007 2008 2009 2010 2011 2012
Decem
ber
20
04
= 1
00
Gross income
Market rent
Capital value
Inflation
Income growth potential as % of rent passing
-4.0 -2.0 0.0 2.0 4.0 6.0 8.0 10.0
2012
2011
2010
Overrented Rent review potential Vacancy

©2013 Investment Property Databank Ltd. All rights reserved. ipd.com 14
Capital value growth analysis: offices - Belgium
70
80
90
100
110
120
130
2004 2005 2006 2007 2008 2009 2010 2011 2012
Decem
ber
20
04
= 1
00
Gross income
Market rent
Capital value
Inflation
Income growth potential as % of rent passing
Underlying parameters (SI)
-10.0 -5.0 0.0 5.0 10.0 15.0 20.0 25.0
2012
2011
2010
Overrented Rent review potential Vacancy

©2013 Investment Property Databank Ltd. All rights reserved. ipd.com 15
Capital value growth analysis: residential - NL
Underlying parameters (SI)
80
85
90
95
100
105
110
115
Dece
mb
er
200
7 =
100
Gross income
Market rent
Capital value
Inflation
Vacant value
Quarterly index (94% of annual index)
Source: Vacant value: CBS bestaande koopwoningen
Adjustment transfer tax
-4 -2 0 2 4 6 8 10 12
2012
2011
2010
Overrented Rent review potential Vacancy
Income growth potential as % of rent passing

©2013 Investment Property Databank Ltd. All rights reserved. ipd.com 16
Capital value growth analysis: retail - NL
Underlying parameters (SI)
90
95
100
105
110
115
de
c-0
7
mrt
-08
jun
-08
se
p-0
8
de
c-0
8
mrt
-09
jun
-09
se
p-0
9
de
c-0
9
mrt
-10
jun
-10
sep-1
0
de
c-1
0
mrt
-11
jun
-11
se
p-1
1
de
c-1
1
mrt
-12
jun
-12
se
p-1
2
de
c-1
2
Decem
ber
2007 =
100
Gross income
Market rent
Capital value
Inflation
Quarterly index (81% of annual index)
Income growth potential as % of rent passing
-10 -5 0 5 10 15
2012
2011
2010
Overrented Rent review potential Vacancy
Average remaining lease duration
61 months
55 months
52 months

©2013 Investment Property Databank Ltd. All rights reserved. ipd.com 17
Capital value growth analysis: offices - NL
70
75
80
85
90
95
100
105
110
115
dec-0
7
mrt
-08
jun
-08
se
p-0
8
de
c-0
8
mrt
-09
jun
-09
se
p-0
9
de
c-0
9
mrt
-10
jun-1
0
se
p-1
0
de
c-1
0
mrt
-11
jun
-11
se
p-1
1
de
c-1
1
mrt
-12
jun
-12
se
p-1
2
de
c-1
2
Decem
ber
2007 =
100
Gross income
Market rent
Capital value
Inflation
Income growth potential as % of rent passing
Quarterly index (84% of annual index)
-20 -10 0 10 20 30
2012
2011
2010
Overrented Rent review potential Vacancy
Average remaining lease duration
52 months
46 months
46 months
Underlying parameters (SI)
©2013 Investment Property Databank Ltd. All rights reserved. ipd.com 18
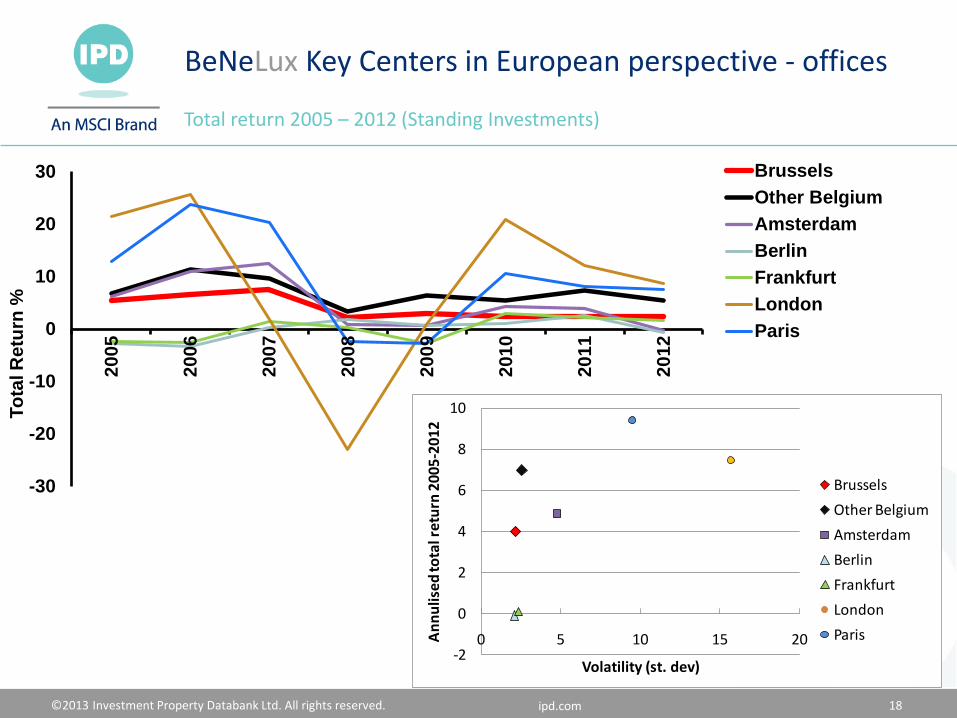
BeNeLux Key Centers in European perspective - offices
Total return 2005 – 2012 (Standing Investments)
-30
-20
-10
0
10
20
30
20
05
20
06
20
07
20
08
20
09
20
10
20
11
20
12
Brussels
Other Belgium
Amsterdam
Berlin
Frankfurt
London
Paris
To
tal R
etu
rn %
-2
0
2
4
6
8
10
0 5 10 15 20An
nu
lise
d to
tal r
etu
rn 2
00
5-2
01
2
Volatility (st. dev)
Brussels
Other Belgium
Amsterdam
Berlin
Frankfurt
London
Paris

©2013 Investment Property Databank Ltd. All rights reserved. ipd.com 19
W: www.ipd.com
T: +31 (0)88 328 2200
Recommended