1
IT GOVERNANCE MATURITY ATINDONESIAN STATE OWNEDENTERPRISES: CONTINGENT
FACTORS & IMPACTS
Proposed byArrianto Mukti Wibowo
A doctoral dissertation submitted in partial fulfillment of the requirements fordoctoral degree
Faculty of Computer Science, University of Indonesia
June, 2011
1
IT GOVERNANCE MATURITY ATINDONESIAN STATE OWNEDENTERPRISES: CONTINGENT
FACTORS & IMPACTS
Proposed byArrianto Mukti Wibowo
A doctoral dissertation submitted in partial fulfillment of the requirements fordoctoral degree
Faculty of Computer Science, University of Indonesia
June, 2011
1
IT GOVERNANCE MATURITY ATINDONESIAN STATE OWNEDENTERPRISES: CONTINGENT
FACTORS & IMPACTS
Proposed byArrianto Mukti Wibowo
A doctoral dissertation submitted in partial fulfillment of the requirements fordoctoral degree
Faculty of Computer Science, University of Indonesia
June, 2011
ii
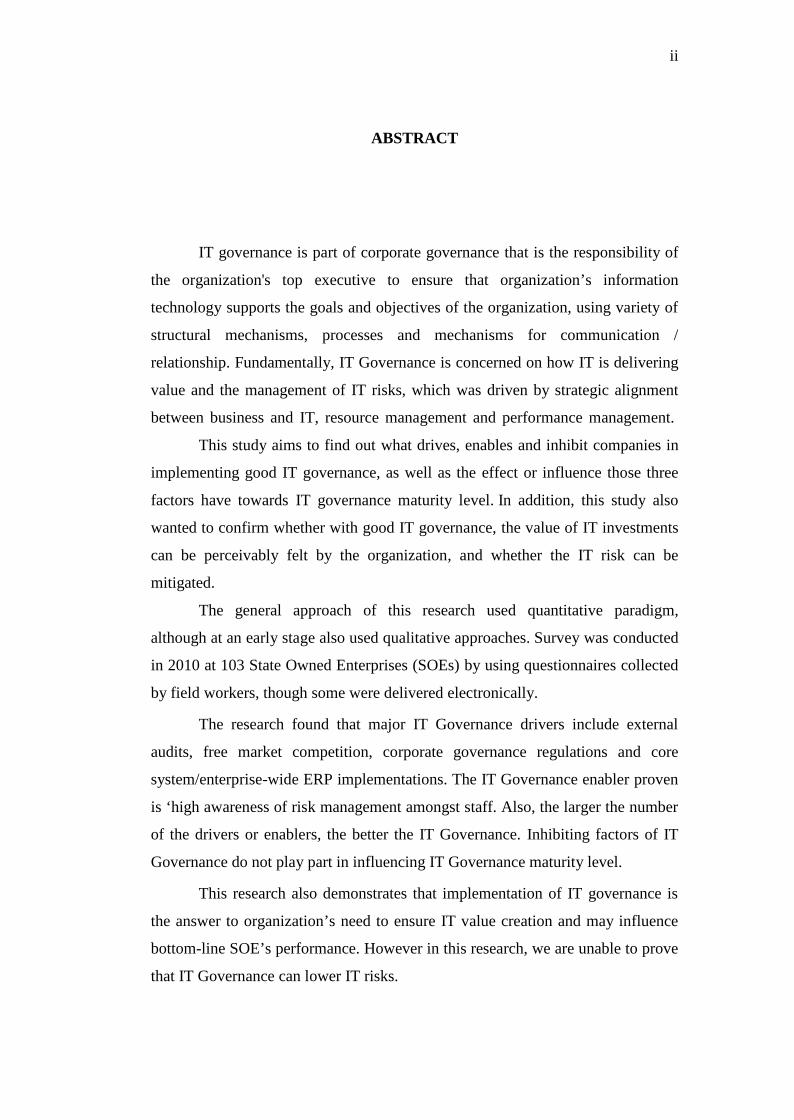
ABSTRACT
IT governance is part of corporate governance that is the responsibility of
the organization's top executive to ensure that organization’s information
technology supports the goals and objectives of the organization, using variety of
structural mechanisms, processes and mechanisms for communication /
relationship. Fundamentally, IT Governance is concerned on how IT is delivering
value and the management of IT risks, which was driven by strategic alignment
between business and IT, resource management and performance management.
This study aims to find out what drives, enables and inhibit companies in
implementing good IT governance, as well as the effect or influence those three
factors have towards IT governance maturity level. In addition, this study also
wanted to confirm whether with good IT governance, the value of IT investments
can be perceivably felt by the organization, and whether the IT risk can be
mitigated.
The general approach of this research used quantitative paradigm,
although at an early stage also used qualitative approaches. Survey was conducted
in 2010 at 103 State Owned Enterprises (SOEs) by using questionnaires collected
by field workers, though some were delivered electronically.
The research found that major IT Governance drivers include external
audits, free market competition, corporate governance regulations and core
system/enterprise-wide ERP implementations. The IT Governance enabler proven
is ‘high awareness of risk management amongst staff. Also, the larger the number
of the drivers or enablers, the better the IT Governance. Inhibiting factors of IT
Governance do not play part in influencing IT Governance maturity level.
This research also demonstrates that implementation of IT governance is
the answer to organization’s need to ensure IT value creation and may influence
bottom-line SOE’s performance. However in this research, we are unable to prove
that IT Governance can lower IT risks.

iii
TABLE OF CONTENTS
ABSTRACT............................................................................................................ ii
TABLE OF CONTENTS....................................................................................... iii
LIST OF FIGURES ............................................................................................... vi
LIST OF TABLES ................................................................................................ vii
CHAPTER 1 INTRODUCTION......................................................................... 1
1.1 Background .............................................................................................. 1
1.2 IT Governance Philosophy Used.............................................................. 3
1.3 Research Question .................................................................................... 3
1.4 Research Significance .............................................................................. 4
1.5 Scope of Study.......................................................................................... 5
1.6 Writing Structure ...................................................................................... 5
CHAPTER 2 Literature Review .......................................................................... 7
2.1 Attempting to Define “IT Governance” ................................................... 7
2.2 Dimensions of IT Governance................................................................ 10
2.3 Previous Studies ..................................................................................... 11
CHAPTER 3 THEORETHICAL FRAMEWORK............................................ 20
3.1 Framework Employed ............................................................................ 20
3.1.1 Framework for IT Governance Maturity Level .............................. 20
3.1.2 Framework for Drivers.................................................................... 23
3.1.3 Framework for Enabler & Inhibitors .............................................. 23
3.1.4 Framework for IT Value & IT Risk ................................................ 23
3.1.5 Association between IT Governance and Bottom-line Financial
Performance .................................................................................................. 24
iv
3.2 Conceptual Model Hypothesis ............................................................... 24
3.3 Some Hypothesis Testing Related to the Conceptual Model ................. 25
CHAPTER 4 RESEARCH METHODOLOGY ................................................ 28
4.1 General Approach................................................................................... 28
4.1.1 Two stage multi paradigm design ................................................... 28
4.1.2 Time Horizon .................................................................................. 29
4.1.3 Unit of Analysis .............................................................................. 29
4.1.4 Reasons for approaches/methods used in this research................... 29
4.2 Qualitative Stage Method....................................................................... 31
4.3 Quantitative Stage Method..................................................................... 33
CHAPTER 5 DATA ANALYSIS ..................................................................... 36
5.1 Qualitative Data Elicitation .................................................................... 36
5.2 Quantitative Data Analysis..................................................................... 39
5.2.1 Demographics ................................................................................. 39
5.2.2 Basic Descriptive Analysis ............................................................. 41
5.2.3 Association Among Variables Based on Conceptual Model .......... 47
5.2.4 Major Factors Using Multiple Regression ...................................... 62
5.2.5 Supplementary Data Analysis ......................................................... 64
CHAPTER 6 ANALYSIS OF RESEARCH RESULTS................................... 66
6.1 Summary of Quantitative Data Analysis ................................................ 66
6.2 Summary of our conceptual model......................................................... 67
6.3 Interpreting research results ................................................................... 68
6.4 Implications for SOEs in Indonesia........................................................ 68
6.5 Agreement with Other Studies ............................................................... 69
CHAPTER 7 CONCLUSION ........................................................................... 72
REFERENCE........................................................................................................ 74

v
APPENDIX A SURVEY QUESTIONNAIRE 2010............................................ 81
APPENDIX B SURVEY QUESTIONNAIRE 2011 ............................................ 82

vi
LIST OF FIGURES
Figure 1. IT Governance Focus Area (ITGI, 2003) ................................................ 8
Figure 2. Jeffery & Leliveld’s (2004) framework to prioritize IT investments .... 14
Figure 3. DeHaes & Van Grembergen’s (2006) elements of IT governance
framework .......................................................................................... 18
Figure 4. Conceptual model hypothesis of our research questions along with
relevant theories ................................................................................. 25
Figure 5. Data were analyzed using SPSS. SOEs name are obscured to hide
company names. ................................................................................. 34
Figure 6. Composition of cases based on privatization status .............................. 40
Figure 7. Composition of cases based on their market environment .................... 41
Figure 8. Perception scales on whether IT investment has brought value to the
organization........................................................................................ 42
Figure 9. Perception of value from IT investment (in rephrased 2011 survey) .... 42
Figure 10. Problems/risks claimed experienced by respondents .......................... 43
Figure 11. Drivers of IT Governance at SOEs...................................................... 44
Figure 12. Enablers of IT Governance.................................................................. 44
Figure 13. Inhibitors of IT Governance ................................................................ 45
Figure 14. Overall case count of Control Objective Maturity Level .................... 46
Figure 15. Case count of Control Objective Maturity Level by focus area .......... 46
Figure 16. Final conceptual model........................................................................ 67

vii
LIST OF TABLES
Table 1. Dimensions of IT Governance ................................................................ 11
Table 2. Enablers & inhibitors of business-IT alignment (Luftman, et.al., 1999) 12
Table 3. Governance Arrangement Matrix (Weill & Ross, 2004). ....................... 16
Table 4. Reasons for a particular approach and/or method being used ................ 30
Table 5. Elicited Drivers of IT Governance.......................................................... 37
Table 6. Elicited Enablers of Good IT Governance.............................................. 38
Table 7. Elicited Inhibitors of Good IT Governance ............................................ 39
Table 8. Industry sector composition of the respondents...................................... 40
Table 9. Summary of association between IT Governance maturity level and IT
risks .................................................................................................... 62
Table 10. Multiple Regression Analysis of Driving Factors................................. 63
Table 11. Crosstab between privatization status vs. IT Governance documentation
status, along with its corresponding χ2 test......................................... 65
Table 12. Summary of associative test data analysis ............................................ 67

1
CHAPTER 1
INTRODUCTION
1.1 Background
State owned enterprises (SOE) – or Badan Hukum Milik Negara (BUMN) –
are very important to the government. Some serve as a vehicle for the government
to execute their strategy, and some provide good dividend to the government. Due
to its importance, Good Corporate Governance (GCG) is important issue at SOEs.
It provides transparency and clear decision making, authority and responsibility
structure at SOEs. GCG also includes good governance on information
technology, as clearly described in ITGI (2003).
As van Grembergen (2004) of University Antwerpen School of
Management defines, IT Governance is the organizational capacity exercised by
the board, executive management and IT management to control the formulation
and implementation of IT strategy and in this way ensure fusion of business with
IT. It consists of leadership, organizational structures, and processes that ensure
that the organization’s IT sustains and extends the organizational strategy and
objective. This definition still rhymes with ITGI’s (2003) definition – loosely – is
a part of enterprise governance that consist of leadership, organizational
structures, communication mechanisms and processes that ensure that the
organization’s IT sustain and extends the organization’s strategy and objectives,
as a responsibility of the board of Directors and executive management. In the
light of this definition, and the regulatory requirement for SOEs for good
corporate governance (SOE Minister Decree no.117 of 2002 and also Act no.19 of
2003 on the State Owned Enterprises), it seems that IT Governance is imperative
for SOEs.
2
According to ITGI (2003), focus areas of IT Governance are concerned on
how IT is delivering value and the management of IT risks, which was driven by
strategic alignment between business and IT, resource management and
performance management. Organizations that wishes to provide IT Governance
may opt to implement those five focus area of IT Governance by following the
control objectives of COBIT 4.1 (ITGI, 2007) especially domain Monitor &
Evaluate 4 (ME4). COBIT can also be used for organizations to measure up how
good are their IT Governance.
In this sector, the implementation of good IT governance might be the
answer to organization need to ensure IT value creation and also return on IT
investments. Without good IT Governance, there might be risk of inappropriate IT
investment, failure of services to public / customer and even non-compliance to
regulations. In Van Grembergen, De Haes & Guldentops (2004) terminology,
proper IT Governance is needed to ensure that the investments in IT will generate
the required business value and that risks associated with IT are mitigated.
According to (Weill & Ross, 2005), IT Governance performance correlate
with desired corporate performance measure. For example, companies that have
better IT governance may profit 20% higher than those of other companies
pursuing similar strategies and also achieve higher returns on equity. They argue
that IT Governance and bottom-line performance measures correlate quite well.
Good Corporate Governance may not be the only reason organization
initiates IT Governance. More practical manner sometimes drives the need for IT
Governance, for example at author’s client, a SOE bank, underlined that board of
directors demand accountability for return from huge IT investment. From the
terminology of ITGI (2003), we identify the ‘stakeholder value drivers’ which
was the reason an organization embarked on IT Governance. We can also see that
in AS-8015:2005 Corporate Governance of Information & Communications
Technology we have the same driver concept, which are business pressures and
business needs of IT Governance (Standards Australia, 2005). It is interesting to
understand how pressures from stakeholders drives the need of IT Goverrrnance
at SOEs. Maybe, some SOEs do not have good IT Governance because they do
not have the need for it.

3
On the other hand, if in the when cases IT Governance is clearly needed,
there are some SOEs who had easier time implementing IT Governance. I might
suppose that must be some external factors that smoothens the IT Governance
implementation. At the other end, some other SOEs had difficult times
implementing IT Governance, which I assume that some external forces also takes
place which hinders good IT Governance. We name this external supporting as
enablers of IT Governance and we name the opposing as inhibiting factors. These
terms are inspired by Luftman, Brier & Pap (1999) study of enablers & inhibitors
of business-IT alignment.
1.2 IT Governance Philosophy Used
For the purpose of this research, to large extent we are using IT
Governance Institute family of frameworks as our main reference, which includes
ITGI (2003), ITGI (2007) and ITGI (2008). This school of thought also extends to
IT Governance definition of van Grembergen (2004) and also related work such
as Van Grembergen, De Haes & Guldentops (2004).
Other works are also referenced, but they are supplemental in nature.
1.3 Research Question
Let us now define our problem in term of research question below:
No. Research question Relevant theory
1. How well do the SOEs in Indonesia govern
their IT? How sophisticated is their IT
Governance processes? (i.e. what is their IT
Governance control objective maturity level1?)
Domain ME4 ‘Provide IT
Governance’ of COBIT
4.1 (ITGI, 2007)
1 We shall later may simply use the term ‘IT Governance level’ to refer to IT Governance control objective maturity levelas defined in COBIT 4.1 (ITGI, 2007).
4
2. Also, do higher IT Governance level leads to
higher return value from IT investment and
also lower number of risk?
ITGI (2003) and Van
Grembergen, De Haes &
Guldentops (2004)
3. Does IT Governance maturity level have an
impact on bottom-line company performance?
(Weill & Ross, 2005)
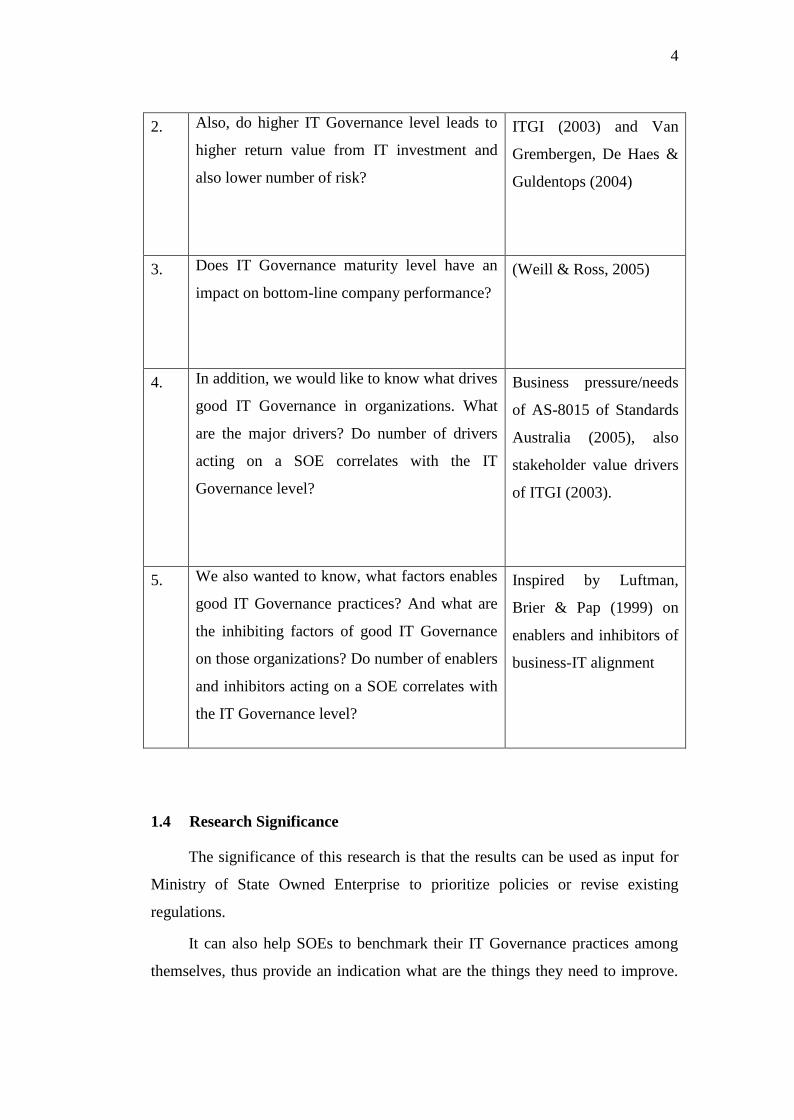
4. In addition, we would like to know what drives
good IT Governance in organizations. What
are the major drivers? Do number of drivers
acting on a SOE correlates with the IT
Governance level?
Business pressure/needs
of AS-8015 of Standards
Australia (2005), also
stakeholder value drivers
of ITGI (2003).
5. We also wanted to know, what factors enables
good IT Governance practices? And what are
the inhibiting factors of good IT Governance
on those organizations? Do number of enablers
and inhibitors acting on a SOE correlates with
the IT Governance level?
Inspired by Luftman,
Brier & Pap (1999) on
enablers and inhibitors of
business-IT alignment
1.4 Research Significance
The significance of this research is that the results can be used as input for
Ministry of State Owned Enterprise to prioritize policies or revise existing
regulations.
It can also help SOEs to benchmark their IT Governance practices among
themselves, thus provide an indication what are the things they need to improve.
5
Thus, agreeing to Becker, Saul, Bryman & Sempik (2006). (2006), eventually the
results of this study can develop the capacity of policy maker and service users (in
this case SOEs) to make informed decision and take appropriate actions.
1.5 Scope of Study
The scopes of this study are as follows:
1. The primary qualitative data source is a collection of theses along with
their interview transcripts and observation notes which used the same IT
Governance framework that shall be explained later in this document.
These theses are the works of students at the Graduate Program in
Information Technology, University of Indonesia, during January to
December 2007 periods. It must be noted that the author came up first with
the research design before the students joined the research. The author in
many cases also went to the field with the students.
2. The data extraction is only focused on elicitation of the original data
source without changing the substance.
3. The mode of quantitative analysis shall use parametric test whenever
possible.
4. Reliability test of quantitative dataset shall be done by the means of
correlating variables with the same topic.
1.6 Writing Structure
This dissertation is written with the following structure:
1. Chapter 1 explains the subject matter of this research, research problem
and question, significance of the research, and scope of this study.
2. Chapter 2 elaborates some definitions of IT Governance and also previous
studies on IT Governance.
3. Chapter 3 describes the theoretical foundation which this research relies
on.
4. Chapter 4 explains the research methodology, including both the
qualitative and quantitative research design.
6
5. Chapter 5 explains how the data are analyzed, including the discussion of
both the qualitative data extraction process and the quantitative statistical
test processing.
6. Chapter 6 explains the analysis of research result including the
triangulation of the research result with the previous studies (including
foreign studies) and the implications of the research result.
7. Chapter 7 describes the conclusions and further works based on the result
of this research.
8. At the end we present the reference list and also the questionnaire used for
the survey.
7
CHAPTER 2 Literature Review
2.1 Attempting to Define “IT Governance”
As there has been some misunderstanding and different perceptions of IT
Governance, we shall attempt to first define it. The first mention of IT
Governance was actually coined by renowned information systems researchers,
Henderson & Venkatraman (1993), in their seminal paper in IBM Systems
Journal, nearly two decades ago. They define what was called ‘I/T Governance’ as
selection and use of mechanisms to obtain and deploy competencies.
Still in the same journal, Jerry Luftman (1993), a former IBM Consultant,
former CIO and now a Professor at Stevens Institute of Technology, defines ‘I/T
Governance’ as the extent of ownership of organization’s technology (e.g. end
user executive, steering committee) or the possibility of technology alliances (e.g.
partnership, outsourcing) or both. However, later on Luftman redefined his
definition of IT Governance to ‘the degree to which the authority for making IT
decisions is defined and shared among management, and the processes managers
in both IT and business organizations apply in setting IT priorities and the
allocation of IT resources’ (Luftman, 1996).
Brown & Magill (1994) defines IT Governance as a concept that describes
the locus of responsibility for IT functions. Robert W. Zmud and V.
Sambamurthy in their 1999 research on multiple contingencies that influence IT
decision making, refers IT Governance to the patterns of authority for key IT
activities (Sambamurthy & Zmud, 1999). Shortly afterwards, they propose
another perspective similar to Brown & Magill (1994). They defined IT
Governance as the locus of enterprise decision-making authority for core IT
activities (Sambamurthy & Zmud, 2000).
According to IT Governance Institute Board Briefing on IT Governance,
2nd ed, the organization that published the COBIT standard, IT Governance is the
responsibility of the board of Directors and executive management. IT
Governance is an integral part of enterprise governance and consists of the
leadership and organizational structures and processes that ensure that the
8
organization’s IT sustains and extends the organization’s strategy and objectives.
Critical to the success of these structures and processes are effective
communication among all parties based on constructive relationships, a common
language and a shared commitment to addressing the issues (ITGI, 2003).
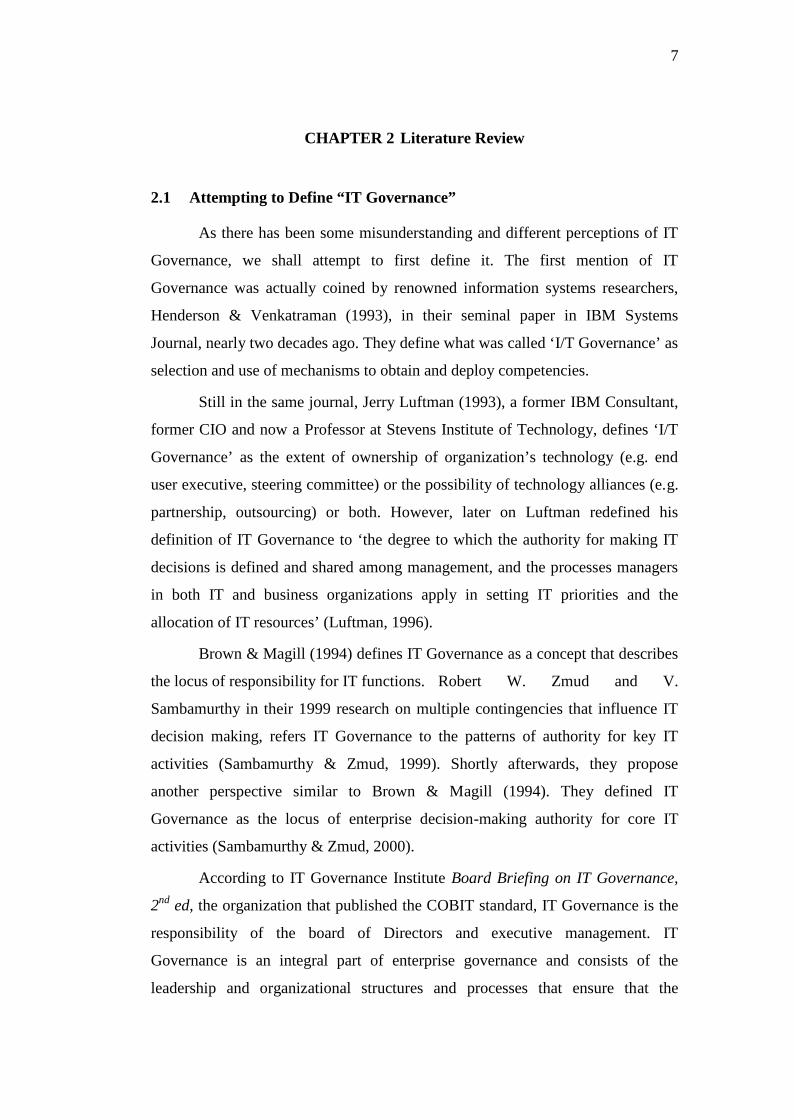
Included in the same document is the IT Governance focus areas, which
consist of: stakeholder value drivers; strategic alignment; value delivery, resource
management; risk management and last but not least, performance management.
Figure 1. IT Governance Focus Area (ITGI, 2003)
Schwarz & Hirschheim (2003) defined IT governance as the IT related
structures or architectures (and associated authority pattern) implemented to
successfully accomplish (IT imperative) activities in response to an enterprise’s
environmental and strategic imperatives. In defining governance this way, they
included three essential elements to governance:
1. Strategic and environmental imperatives that define a necessary response
from IT.
2. Structures designed to support the response.
3. An imperative for IT to be successful in this design.
Prominent IS researchers, Peter Weill & Jeanne Ross of Centre of
Information Systems Research (CISR), Sloan School of Management, MIT,
defined IT Governance as specifying the decision right and accountability

9
framework to encourage desirable behaviour in the use of IT (Weill & Ross, 2004,
2005). It seems that their definition is somehow similar to the definitions of
Sambamurthy & Zmud (1999, 2000). Weil & Ross’s (2004, 2005) definitions
seems also be embraced by Saha (2005).
Peterson (2001) also has somewhat similar definition as above. He defined
IT Governance as the formal allocation of IT decision-making authority. However
in 2004, Peterson reformulated and enhanced his definition. He defined IT
Governance as the system by which an organization’s IT portfolio is directed and
controlled. It also describes the distribution of IT decision making rights and
responsibilities among different stakeholders in the organization, and the rules and
procedures for making and monitoring decisions on strategic IT resources
(Peterson, 2004b).
During an interview in Information Management, Prof Van Grembergen, a
recognized IT Governance researcher from University of Antwerpen Management
School (UAMS) and also a committee member at IT Governance Institute, stated
that IT Governance is the organizational capacity exercised by the Board,
Executive management and IT management to control the formulation and
implementation of IT strategy and in this way ensure the fusion of business and IT
(Van Grembergen, 2004).
Rau (2004) while agreed with ITGI’s definition, also explained that IT
Governance is about the way senior managers interact and communicate with IT
leaders to ensure that technology investments enable the achievement of business
strategy in an effective and efficient manner.
Standards Australia (2005) has devised their own standard for ‘Corporate
Governance of Information & Communication Technology’, known as AS 8015 -
2005. It defines Corporate Governance of ICT as ‘the system by which the current
and future use of ICT is directed and controlled. It involves evaluating and
directing the plans for the use of ICT to support the organisation and monitoring
this use to achieve plans. It includes the strategy and policies for using ICT within
an organisation’.
10
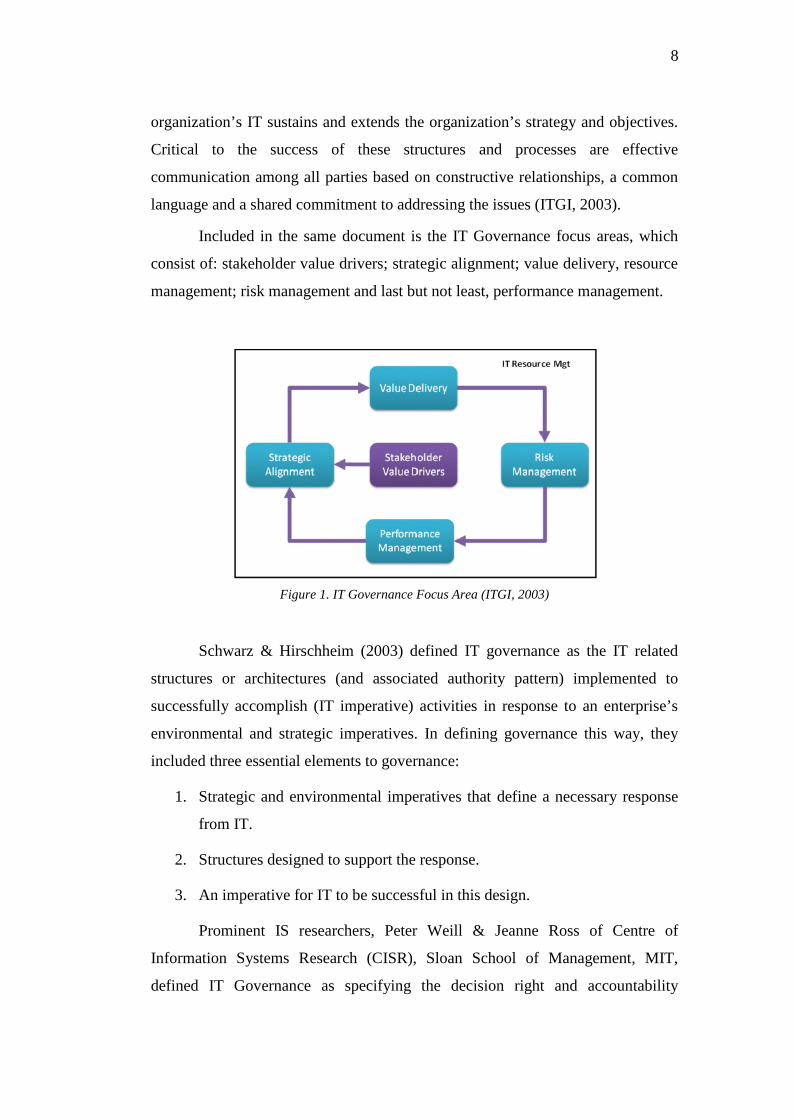
2.2 Dimensions of IT Governance
Based on our review on existing IT Governance definitions, we try to
interpret and extract important dimensions of from each one of them.
Definition
DimensionsDecisionmaking,authority,responsibilitywithin anorganizationstructure
Leadership Process, asamanagementcycle (fromplanning tomonitoring)
ResourceManagement
IT used to accomplishorganization’sstrategy or objective,or IT to respondbusiness pressure
Henderson &Venkatraman(1993)
Luftman (1993)
Luftman (1996)
Brown & Magill(1994)
Sambamurthy& Zmud (1999)
Sambamurthy& Zmud (2000)
Peterson(2001)
ITGI (2003)
ITGI (2003) ITGovernanceFocus Area(model)
Schwarz &Hirschheim(2003)
Weill & Ross(2004)
Van Gremberen(2004)
Rau (2004)
Peterson(2004)
StandardsAustralia (2005)
StandardsAustralia(2005), AS-8015 (model)

11
Table 1. Dimensions of IT Governance
2.3 Previous Studies
Luftman, Brier & Pap (1999) studied enablers & inhibitors of business-IT
alignment. This research is quite of our interest for two reasons. First, alignment is
one of the IT Governance focus area (ITGI, 2003). Second, it maps well with our
research agenda to find inhibitors and enablers of IT Governance. The survey data
on which their findings rest on were obtained from executives from over 500
firms representing 15 industries attending classes at IBM’s Advanced Business
Institute. Analysis of the survey data shows that the enablers and inhibitors are:
Enablers Inhibitors
Senior executive support IT/non-IT lack close relationship
IT involved in strategy development IT does not prioritize well
IT understands business IT fails to meet its commitments
IT, non-IT have close relationship IT does not understand business
IT shows strong leadership Senior executives do not support IT
IT efforts are well prioritized IT management lacks leadership
IT meets commitments IT fails to meet strategic goals
IT plans linked to business plans Budget and staffing problems
IT achieves its strategic goals Antiquated IT infrastructure
IT resources shared Goals/vision are vague
Goals/vision are defined IT does not communicate well
IT applied for competitive advantage Resistance from senior executives
Good IT/business communication IT, non-It plans are not linked
Partnerships/alliances
12
Table 2. Enablers & inhibitors of business-IT alignment (Luftman, et.al., 1999)
Zmud & Sambamurthy (1999) conducted case study research at 8
organizations about their arrangements of IT Governance. They studied multiple
contingencies (pulls & pressures) from different factors influencing the IT
Governance mode of the organizations. Those contingent forces includes different
corporate governance mode, geographic dispersion, line IT knowledge (absorptive
capacity of IT), and economies of scope (corporate & business strategy). The
research suggests that reinforcing contingencies will induce either a centralized or
decentralized mode of IT governance. Conflicting contingencies will induce a
federal mode of IT governance. Lastly, the findings showed that dominating
contingencies will induce centralized or decentralized mode of IT governance.
Peterson (2001) conducted an exploratory case study at three European
financial service companies. The findings indicate that financial institutions adopt
distinct hybrid configurations and coordination mechanisms contingent on their
strategic context. The results suggest that whatever formal configuration is chosen
for IT governance, mechanisms for lateral coordination (relational mechanisms)
need to be addressed. Effective mechanisms for lateral coordination move beyond
the level of structure, and focus on the different stakeholders involved in the IT
governance process.
Later on, Peterson (2004) conducted a literary study from several
published research papers to see how various determinants such as organization
size, business strategy and governance business structure influence IT decision
making rights. From the research he concluded that centralized IT decision
making seems to be associated with organizations which are small, have a cost-
focus business strategy, exist in a stable environment, centralized governance
structure and low experience/competence in managing IT. On the other hand,
decentralized IT decision making seems to be associated with large, complex
organization following an innovation strategy in a volatile environment,
characterized by decentralized business governance structure and high
competence in managing IT.
Peterson admitted though, that the findings are not prescriptive. A
combined approach of centralization & decentralization can be used. Like
13
previous researchers such as Zmud & Sambamurthy (1999), Hodgkinson (1996),
Rockart et.al. (1996), Peterson also argued that federated IT decision making
model is one model that organizations adopt to answer those various determinants.
However Peterson – again – argued that by using a federated model, where
some decisions are made centrally, is essentially still a vertical division of labour.
To achieve the intended organization objective, an organization needs an
integration mechanism to coordinate IT activities distributed across organization.
That is the point where relational integration process and structures (both are
called relational mechanisms) takes place (Peterson 2004).
Ribbers, Patel and Parker (2002) studied the significance of IT
Governance process and structures at nine organizations. They showed that the
use of management tools and frameworks (such as balanced scorecard,
information economics, etc.) are insufficient to govern IT effectively. These tools
should be embedded within the organizational context of stakeholders’
experiences, judgments and understanding. On the other hand, attention for
stakeholders’ experiences and judgments, without some analysis of costs, benefits
and risks, is unlikely to lead to a satisfactory result. Hence organizations need to
infuse the use of IT Governance tools into organization context.
In his case study at ING, a global financial service company, Kan (2004)
showed how ING manages different portfolios of IT investment to achieve
different organization objective. Kan showed that shareholder return is at least
partly related to IT intensity, i.e., how much and how money is spent on IT. There
is some evidence for potentially good returns on IT new development activity. In
the short term, best shareholder return is generated by transactional (cost saving)
projects because they emphasize standardization and efficiency, which result in
lower cost per transaction. However, strategic IT investments must also be
pursued to create future revenue growth and to further improve sustainable
financial performance for all stakeholders. ING, are not risk-averse, but they
strongly prefer to take a calculated risk to allow strategic initiatives to sustain
competitive advantage.
A quite similar study was also done by Jeffery & Leliveld (2004).
Basically they categorized IT portfolio into a 2 x 2 matrix formed by value from
14
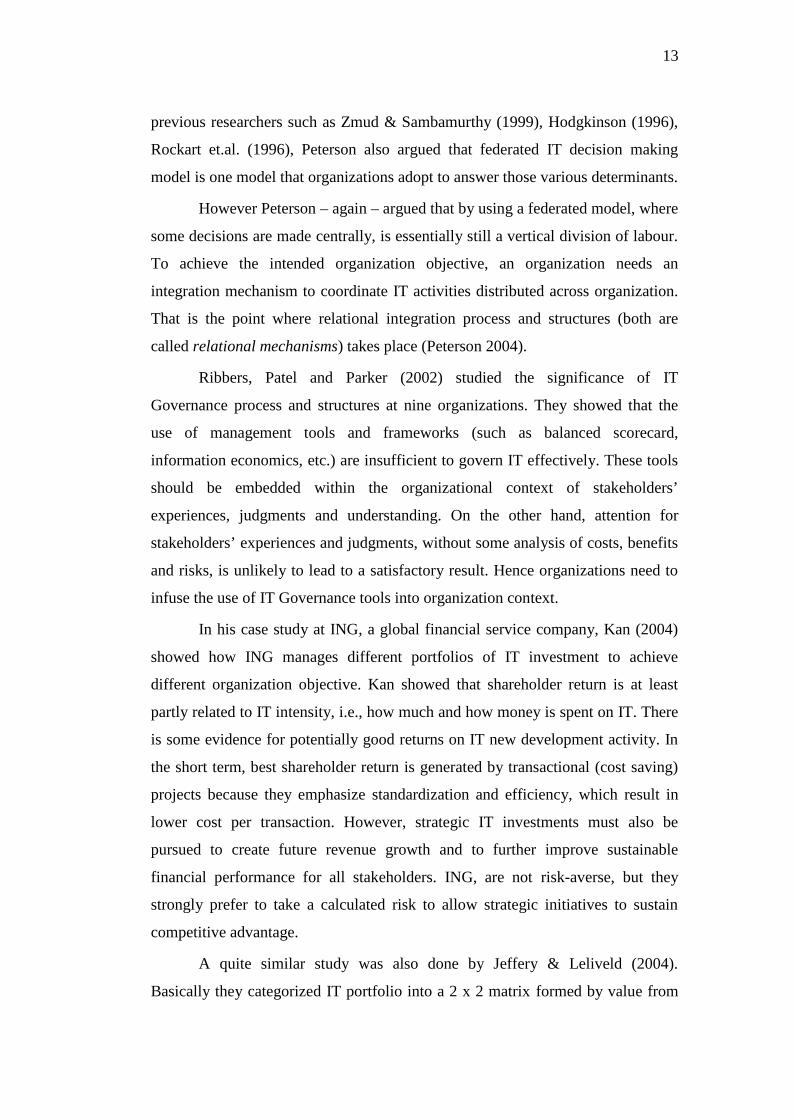
IT investment versus risk of those investment. They suggest that a project within
the low risk and high value quadrant should be pursued.
Figure 2. Jeffery & Leliveld’s (2004) framework to prioritize IT investments
They also clustered the maturity on how the organization manages their IT
portfolio, from defined stage, managed stage and then to synchronize staged,
being synchronized as the most sophisticated. The synchronized stage is
characterized by continuous monitoring of IT portfolio, and in this stage weeding
out a bad IT investment even after it was executed is not a an ‘embarrassment’.
They conducted survey with 130 respondents, mostly CIO. Although only
17% of the organizations polled are at the synchronized stage, Jeffery &
Leliveld’s findings suggest that becoming synchronized is the right move for
others. They experienced cost savings of up to 40% of budgets before having a
synchronized IT portfolio management, better alignment between IT spending and
business objectives, and greater central coordination of IT investments across the
organization.
Subsequently, IT Governance Institute (ITGI, 2006) produced a guideline
called Val IT, which suggest best practice IT Value Delivery parallel to Jeffery &
Leliveld’s (2004) maturity model on how organizations manages their portfolio of
IT investment to bring maximum value while reducing risk to the organization.
Kan’s (2004) work provides a strong foundation in this ITGI publication. Val IT
differs from COBIT (ITGI, 2007). While the primary focus of COBIT domains is

15
on delivering the technology capability that enterprise need, the primary focus of
Val IT is on delivering business value.
Val IT recommends three major processes to obtain maximum return from
IT investments. First, the Value Governance process, by establishing governance
framework & control, and also strategic direction for investments. Second,
Portfolio Management process, by managing investment profiles, evaluating,
prioritizing, deferring and rejecting investments. Third, Investment Management
process, by developing business cases, manage the execution of IT
programmes/projects, and actively manage the realization of benefits.
Weill & Ross (2004, 2005) developed a simple matrixed IT Governance
framework that can help companies allocate IT decision rights and
accountabilities so that each IT decisions align with strategic objectives. The
matrix comprises what kind of decision must be made versus who should make
the decision. Those major decisions includes IT principles, IT architecture, IT
infrastructure, business application needs, and IT investments. They also propose
six archetypal patterns of on who makes the decision ranging from the centralized
business monarchy archetype, to feudal (decentralized business unit dominated IT
decisions) archetype.
Their research suggests that there is no single best model for IT
Governance. Given different strategies and organizational forms, different
enterprises will attempt to encourage different IT governance pattern. They also
showed that top performing organizations govern significantly different from
other companies. The seven characteristics of top governance performers are
(Weill & Ross, 2004):
1. More managers in leadership positions could describe IT governance
2. They can describe IT Governance, simply because they engage more
often and more effectively.
3. More direct involvement of senior leaders in IT governance
4. Clearer business objectives for IT investments
5. More differentiated business strategies

16
6. Fewer renegade and more formally approved exceptions
7. Fewer changes in governance from year to year
DecisionArche-type IT Principles IT Architecture
ITInfrastructure
Strategies
BusinessApplication
Needs IT Investment
BusinessMonarchy
IT Monarchy
Feudal
Federal
Duopoly
Anarchy
Don’t know
Table 3. Governance Arrangement Matrix (Weill & Ross, 2004).
In addition, those top performing organizations can be categorized further:
• Most profitable companies tend to centralize their IT decision making,
characterized centralized committees for enterprise wide decision making
process, architecture compliance, and formal post implementation review
of IT projects.
• Fast revenue growing companies, focusing on innovation and time to
market, tend to insist on local (decentralized) accountability. They try to
maximize customer responsiveness by limiting number of governance
constraints and use only a few technology standards.
• Companies seeking optimal asset utilization, attempt to balance the
contrast between governance for profitability and governance for revenue
growth and innovation. They emphasize on shared service of process,
technology and data to achieve responsiveness and/or economies of scale.
Asset utilization demands a hybrid approach of IT Governance, mixing
elements of centralization & decentralization.
Csaszar & Clemons (2006) study about governance of IT function,
revealed several major points. They suggest that under most conditions the
governance of the IT functional area does affect the performance of the firm; and
the CIO’s business savvy and ability to communicate with the rest of the senior
17
management team will affect performance, by determining the quality of
consensus decisions reached and the speed with which consensus is achieved.
In 2005, Saha (2005) conducted an IT Governance research in cooperation
with MIS Asia. The research showed that while respondents demonstrated a
strong awareness of IT Governance and how important it is to overall business
performance, a large majority felt they did not adequate internal support for IT
Governance. Few were taking advantage of IT Governance in enhancing business
value. While discussion on IT decisions take place at the highest levels it seems to
focus on IT investments. Most organizations feel that IT is important but not
strategic, and still use cost as an important criterion for measuring IT success.
In addition, Saha also list IT governance related problems in this research,
amongst them are:
• slow mechanisms to make IT decisions
• IT resources are frittered away in fire-fighting
• senior management senses low value from IT investment
Bi-annually, since 2004, PriceWaterhouseCoopers International Survey
Unit in collaboration with IT Governance Institute publish IT Governance Global
Status Report (ITGI, 2006b, 2008). It is a global survey with 749 respondents
around the world, conducted using telephone or mail. Some of the latest research
key findings include:
1. Although C-level executive champions IT Governance, in daily practice IT
Governance is still a CIO/IT director issue.
2. Self-assessment regarding IT Governance is increasing
3. Communication between IT and user is improving slowly
4. Compared to the 2006 report, in 2008 they observer that there is a large
increase of action being taken or plans are underway to implement IT
Governance
5. More than half respondents apply or plan to apply Val IT principles of
good governance of IT investments, but not familiar with the ‘Val IT’
brand. A major obstacle to adoption of good governance of IT investment
is the lack of knowledge/expertise.

18
De Haes & Van Grembergen (2006) conducted several case studies on
best practice IT Governance at six (6) Belgian organizations. It also includes their
previous major in depth case study at KBC, one of the large banks in Belgium (De
Haes & Van Grembergen, 2005). They started their case study with several
propositions. First, organizations are using a mix of structures, processes and
relational mechanisms to build up an IT governance framework. Second, the
chosen mix of structures, processes and relational mechanisms is dependent upon
multiple contingencies. Lastly, a well balanced mix of structures, processes and
relational mechanisms will enable better IT governance outcomes. Findings of
from these six case studies indicated that those propositions are supported.
Figure 3. DeHaes & Van Grembergen’s (2006) elements of IT governance framework
There are some other interesting results from De Haes & Van
Grembergen’s (2006) research. IT steering committees are common practice and
are used in many different names. IT strategy committees at the other hand are not
common in Belgium. Most companies operate either in centralized or federated IT
governance mode. In the federal model, operations are centralized to achieve
economies of scale, but developments are decentralized to stay closer to business
need. Regarding IT governance processes, De Haes & Van Grembergen found
that the BSC and COBIT are not (or merely) used and that processes found in
ITIL such as SLA are more popular. Many prioritization methods and processes

19
were identified, based on IE or other frameworks accompanied with ROI type of
measures. Finally, many relational mechanisms were used in the domains of
shared understanding of business/IT objectives, active conflict resolution, cross-
functional business/IT training and business/IT job rotation. In many cases, these
mechanisms were rather informally organized.
By examining previous studies, we conclude that we have not yet found
any IT Governance survey research at Indonesian State Owned Enterprises.
Moreover, we have not discovered any research concerning what are the drivers,
enablers and inhibitors of good IT governance. Luftman, Brier & Pap’s (1999)
work on enablers & inhibitors of business-IT alignment actually inspires our
research.
20
CHAPTER 3
THEORETHICAL FRAMEWORK
3.1 Framework Employed
The following sections explained what framework this research used to
answer the research problem described in section 1.2.
3.1.1 Framework for IT Governance Maturity Level
We derive some questions from best practice framework – in this case
section ME4 ‘Provide IT Governance’ of COBIT (ITGI, 2007). It answers the
question of, “How well are they governing their IT, irrespective of their
organization context?” We hope by referring to a professional standard like
COBIT, the research result will be acknowledged by professional community, not
just by academics. Note instead of using process maturity level, we developed
control objective maturity question from the defined control objectives.
The reason for this approach is because in our opinion, the process
maturity level definition in COBIT ME4 is too vague and ambiguous to be asked
to the respondents. However, by using control objective maturity, readers ought to
be aware that lower control objective maturity level does not imply that the
organization’s IT Governance is worse than organization with higher control
objective maturity level. Probably it only needs less sophisticated form of IT
Governance due to less organizational complexity it has.
Recall at the first paragraph of this sub section, we implied that COBIT
was used because it is a widely accepted professional standard. This does not
imply that COBIT can not be used in scientific work like ours. Tuttle and
Vandervelde (2007) proved that matching COBIT’s conceptual model onto audit
relevant assessments confirms the internal consistency between the underlying

21
constructs of CobiT. The assessments were made by a panel of highly experienced
IT auditors. In our opinion, this research showed the validity of COBIT, hence it
is viable to use COBIT in scientific research.
Another issue that needs explanation is of why did we not use the whole
COBIT. i.e. all of the four domains (PO, AI, DS and ME). First, the large nunber
of questions that must be derived from them – and then asked to the respondents -
will make data collection impractical as it may become uncessarily too long to
take. Second, as De Haes & Van Grembergen (2008) propose an IT Governance
baselining, they also discard IT Governance practices at operational level.
Therefore, we opt to pick ME4 ‘Provide IT Governance’ as the best subdomain of
COBIT to be used in our research, as we want to keep the research at the strategic
level.
The IT Governance maturity model used in this study itself is originally
modelled after Software Engineering Institute Capability Maturity Model (SEI-
CMM). Below we present the IT Governance Maturity Levels that will be used
(ITGI, 2003):
0 Nonexistent – Management processes are not applied at all
1 Initial – (IT Governance) processes are ad-hoc and disorganized
2 Repeatable – (IT Governance) processes follow a regular pattern
3 Defined – (IT Governance) processes are documented and
communicated
4 Managed – (IT Governance) processes are monitored and measured
5 Optimised – (IT Governance) best practices are followed and
automated
We developed our own questions best to operationalize each IT
Governance focus area. Those IT Governance focus areas are as follows:

22
1. Strategic alignment focuses on ensuring the linkage of business and IT
plans; on defining, maintaining and validating the IT value proposition;
and on aligning IT operations with enterprise operations.
2. Value delivery is about executing the value proposition throughout the
delivery cycle, ensuring that IT delivers the promised benefits against the
strategy, concentrating on optimising costs and proving the intrinsic value
of IT.
3. Resource management is about the optimal investment in, and the proper
management of, critical IT resources: applications, information,
infrastructure and people. Key issues relate to the optimization of
knowledge and infrastructure.
4. Risk management requires risk awareness by senior corporate officers, a
clear understanding of the enterprise’s appetite for risk, understanding of
compliance requirements, transparency about the significant risks to the
enterprise, and embedding of risk management responsibilities into the
organization.
5. Performance measurement tracks and monitors strategy implementation,
project completion, resource usage, process performance and service
delivery, using, for example, balanced scorecards that translate strategy
into action to achieve goals measurable beyond conventional accounting.
A glance at 33 baseline IT Governance pratices of De Haes & Van
Grembergen (2008) revealed plenty of similarities with our IT Govermamce
control objective maturity questionaire based on ME4 ‘Provide IT Governance’ as
shown in appendix A.
We did not use model-based IT Governance assessment developed by
Simonson et.al (2007). They claimed that their proposed method is easier use for
collection of data, requiring less professional judgment of the data collector. It is
also COBIT based. We agree on their point that it is easy to use, but we argue that
their proposed IT Government assessment method is best suited for case studies or
real-world audit. Still, the number of questions to be filled is still way too much to
be a practical approach in a large scale survey like our research.

23
3.1.2 Framework for Drivers
We recategorize – albeit loosely - the ‘stakeholder value drivers’ from the
ITGI (2003) IT Governance focus area with AS-8015’s business pressures and
business needs (Standards Australia, 2005), into a new dimension we call ‘Drivers
for IT Governance’. We did not discriminate between external business pressure
and internally oriented business need, since it may make the interview process a
bit more complicated.
‘Drivers for IT Governance’ variable demonstrates what are the things that
drive the organization to implement good IT governance. We were unable to find
any scientific research paper that gathered empirical evidence of what the drivers
are. Moreover, Schwarz & Hirschheim (2003) also emphasized that one element
of IT governance is the IT response to strategic and environmental imperatives.
3.1.3 Framework for Enabler & Inhibitors
During the qualitative phase of the research as we shall explain in section
4.1.4 and section 5.1, we also noticed that some organization, knowingly that they
had to carry out certain best practice process, cannot perform that process,
because of certain things that we call inhibitors. In other cases, we found the
opposite. We found several factors that actually help or enable the organization to
implement good IT Governance.
We coined the term enablers and inhibitors of IT Governance, inspired by
a study by Luftman, Brier & Pap (1999) on enablers and inhibitors of business-IT
alignment.
3.1.4 Framework for IT Value & IT Risk
In addition, the questions relating to IT value and IT risk were taken from
previous survey (ITGI, 2008) because we would like to have a degree of
comparability between them. We know also that ITGI (2003) and Van
Grembergen, De Haes & Guldentops (2004) also suggest that good IT
Governance is important to create IT value and mitigating IT risks. Note that we
supplement the ITGI (2008) survey question about IT value with our own
rephrased question to eliminate bias inherent in the question.
24
3.1.5 Association between IT Governance and Bottom-line Financial
Performance
According to (Weill & Ross, 2005), IT Governance performance correlate
with desired corporate performance measure. For example, companies that have
better IT governance may profit 20% higher than those of other companies
pursuing similar strategies. They also achieve higher ROE (returns on equity).
Although Weill & Ross cannot conclude whether superior governance
performance causes superior financial performance, they argue that both measures
correlate quite well and it is plausible that the two are linked.
In our case here in Indonesian SOEs, the bottom line corporate
performance measurement has been laid down in Ministry of SOE Decree
no.Kep-100/MBU/2002 on Evaluation of Health Level of SOEs. It described three
categories of SOE health level: healthy (sehat), rather healthy (kurang sehat), and
not healthy (tidak sehat), each category with three addition subcategories. The
health level can be calculated by considering financial, operational and
administrative aspects. The financial aspect can be derived from fincancial
statements that had been audited by a public accountant or the National Audit
Agency (Badan Pemeriksa Keuangan). The other two aspects parameters are
established during stakeholders’ general meeting (rapat umum pemegang
saham/RUPS) and evaluated by the board of commissioners (dewan komisaris).
3.2 Conceptual Model Hypothesis
To make a clearer picture, we sketched a correlational hypothesis from all
of the contributing factors (drivers, enablers, inhibitors) down to the outcomes of
IT Governance. This is modelled after stakeholder value drivers of IT Governance
focus area (ITGI, 2003) and partly inspired by Luftman et.al (1999). It also
sketches the IT Governance level of the SOEs taken from COBIT ME4 (ITGI,
2007). It also models the impact on value delivered from IT investment and its
imposing risks, similar as described by Van Grembergen, De Haes & Guldentops
(2004). Finally, the model also shows the plausible link / association between IT
Governance level and SOE’s health level.

25
Figure 4. Conceptual model hypothesis of our research questions along with relevant theories
Special note on IT risks, we may break it down to more operational
concept. Since for practical and future comparability reason we use ITGI (2008)
survey as our basis, then the operational concept of IT risks has to be selected
from what is available from ITGI (2008). If we assume that IT risk can be defined
as security for information systems, then we may base it on the concept of CIA
(confidentiality, integrity and availability) as defined by (Harris, 2003). Thus in
our research here, the IT risk operational concepts are:
a. IT service delivery problems
b. Problems with business continuity and/or disaster recovery plan
c. Serious IT operational incidents
d. Privacy related incidents
3.3 Some Hypothesis Testing Related to the Conceptual Model
Although the statistical testing of the conceptual model hypothesis will be
elaborated in section 5.2.3 about ‘Association Among Variables Based on
Conceptual Model’, in this section we declare some of the related hypothesis.

26
1. Null hypothesis H0: there is no associaton between number of IT
Governance drivers and IT Governance maturity level
Alternate hypothesis HA: there is an associaton between number of IT
Governance drivers and IT Governance maturity level
2. Null hypothesis H0: there is no associaton between number of IT
Governance enablers and IT Governance maturity level
Alternate hypothesis HA: there is an associaton between number of IT
Governance enablers and IT Governance maturity level
3. Null hypothesis H0: there is no associaton between number of IT
Governance inhibitors and IT Governance maturity level
Alternate hypothesis HA: there is an associaton between number of IT
Governance inhibitors and IT Governance maturity level
4. Null hypothesis H0: there is no associaton between IT Governance
maturity level and how much value of IT investment being felt
(experienced)
Alternate hypothesis HA: there is an associaton between IT Governance
maturity level and how much value of IT investment being felt
(experienced)
5. Null hypothesis H0: there is no associaton between IT Governance
maturity level and SOE’s health status
Alternate hypothesis HA: there is an associaton between IT Governance
maturity level and SOE’s health status
6. Null hypothesis H0: there is no associaton between IT Governance
maturity level and IT risks experienced
Alternate hypothesis HA: there is an associaton between IT Governance
maturity level and IT risks experienced
IT risks are caluclated several times, as IT risk variable are decomposed /
operationalized into other more ‘practical’ variable, which are:
- IT Service Delivery Problems
- Inadequate Business Continuity Plan / Disaster Recovery Plan
27
- Serious IT Operational Incidents
- Privacy/Security Incidents
All of those operatinal variables were taken from ITGI (2008), and the
data were of course also taken during data collection.
28
CHAPTER 4
RESEARCH METHODOLOGY
4.1 General Approach
4.1.1 Two stage multi paradigm design
This research has a multi-paradigm approach, i.e. combined qualitative
paradigm and quantitative paradigm (Creswell, 1994). The research started with
multiple qualitative interpretive case studies (Yin, 1994). The objective of this
qualitative phase is to capture the depth, or the rich story (the why and how) of IT
Governance practices and problems in Indonesian state owned enterprises
(Creswell, 1994).
This study also uses a two stage design as explained by Cooper &
Schindler (2006). Early on, much of the problems were not known, but should be
known before the costly survey is conducted. The first half exploratory study
should find the major dimensions of the research, development of hypothesis, and
eliciting factors to be asked. Besides the exploratory case studies mentioned,
supplementary literary review is also important. For the other half of this research,
we used a positivist paradigm research approach to enhance our findings, that is, a
descriptive quantitative survey (Sekaran, 1992).
Apparently this multi-paradigm approach is also similar to the approach of
Centre for Information Systems Research (CISR) Sloan School of Management,
Massachusetts Institute of Technology when they did their IT Governance
research during 1995-2004 (Weill & Ross, 2004).
This research is also a social policy research (Becker et.al, 2006), which
one of the important issue of policy research is the development of capacity of
policy maker (Ministry of State Owned Enterprise) and/or service user (the State
Owned Enterprises) to make informed decision and then take appropriate actions.

29
4.1.2 Time Horizon
The descriptive study in this research provides a ‘snapshot’ or description
of elements at a given point in time, thus called cross-sectional study (Hair et.al,
2007). The exploratory case studies conducted earlier are also not meant to elicit
factors and their changes in long period in time, generally the case studies also
took ‘snapshots’.
4.1.3 Unit of Analysis
According to Babbie (1998), formal social organizations are eligible for the
unit of analysis in social scientific research. State owned enterprises are such
example of formal social organizations, therefore eligible as the unit of analysis of
this study. Since however we cannot ‘ask an organization’, the respondents are the
IT head, IT manager or the IT staff responsible (or at least knowledgeable) for IT
Governance.
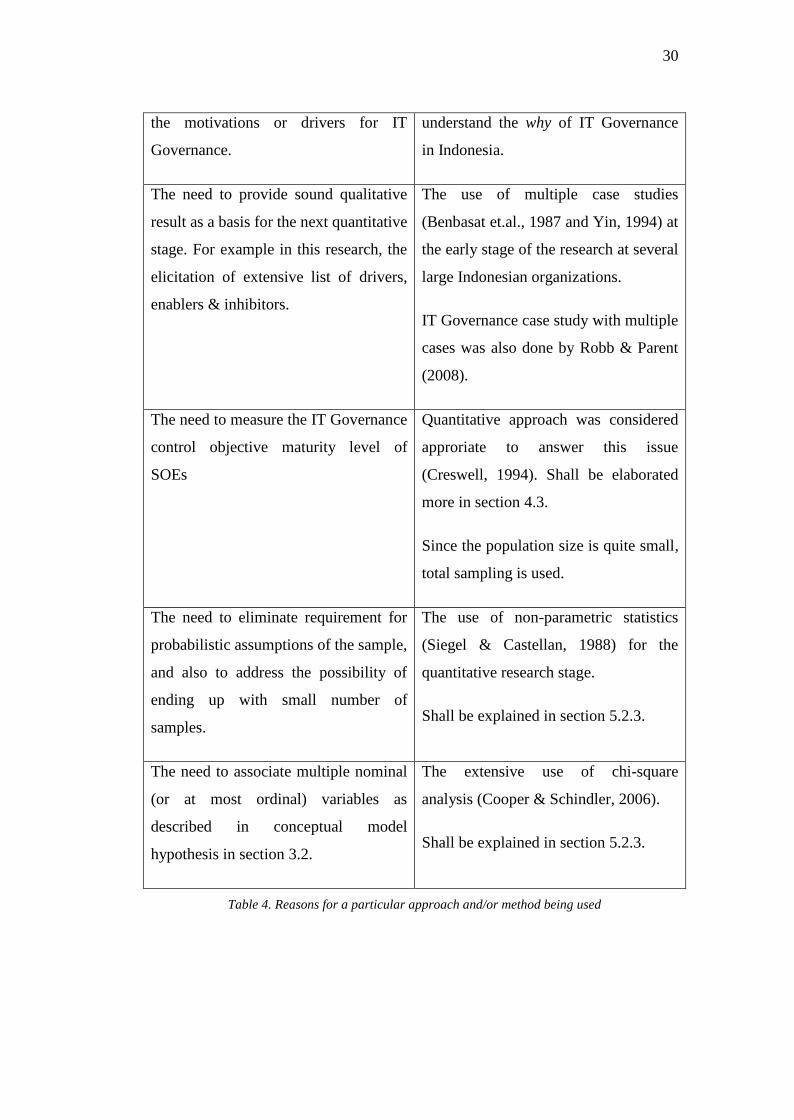
4.1.4 Reasons for approaches/methods used in this research
To clarify the reasons behind a particular approach or method being used
in this research, we shall show it in a more readable table format below:
Research issues to deal with Approach or method used
There are unexplored research area
(especially enabler & inhibitors of IT
Governance), but at the same time we
also wanted to have a reliable and
statistically sound research results.
Multi-paradigm approach, i.e.
qualitative approach followed-up with
quantitative approach (Creswell, 1994).
Two stage design (Cooper & Schindler,
2006).
The need for in depth investigation of
IT Governance issues in Indonesia that
might contextual differences.
The use of case studies (Yin, 1994)
with no rigid samples yet. See also
section 4.2.
Some issues during case study stage
need deep understanding of the
situation, for example in understanding
Besides common descriptive case study
approach, explanatory case study (Yin,
1994) approach was also employed to
30
the motivations or drivers for IT
Governance.
understand the why of IT Governance
in Indonesia.
The need to provide sound qualitative
result as a basis for the next quantitative
stage. For example in this research, the
elicitation of extensive list of drivers,
enablers & inhibitors.
The use of multiple case studies
(Benbasat et.al., 1987 and Yin, 1994) at
the early stage of the research at several
large Indonesian organizations.
IT Governance case study with multiple
cases was also done by Robb & Parent
(2008).
The need to measure the IT Governance
control objective maturity level of
SOEs
Quantitative approach was considered
approriate to answer this issue
(Creswell, 1994). Shall be elaborated
more in section 4.3.
Since the population size is quite small,
total sampling is used.
The need to eliminate requirement for
probabilistic assumptions of the sample,
and also to address the possibility of
ending up with small number of
samples.
The use of non-parametric statistics
(Siegel & Castellan, 1988) for the
quantitative research stage.
Shall be explained in section 5.2.3.
The need to associate multiple nominal
(or at most ordinal) variables as
described in conceptual model
hypothesis in section 3.2.
The extensive use of chi-square
analysis (Cooper & Schindler, 2006).
Shall be explained in section 5.2.3.
Table 4. Reasons for a particular approach and/or method being used
31
4.2 Qualitative Stage Method
The main purpose of this qualitative stage is to generate ideas, conjectures
and hypothesis as a foundation for the next stage (Neuman, 2003).
The qualitative study in this dissertation is based on the eighteen of cases at
several large Indonesian organizations, led by the authors under IT Governance
Lab, Faculty of Computer Science, University of Indonesia. It was an explorative
and qualitative research, because we want to find new ideas in the IT Governance
family of theories. Those grounded research were mainly conducted during
January to December 2007.
In addition, we would also like to include our observation as strategic IT
consultant at large organizations using the framework of ethnographic research,
since we immersed ourselves in the daily operation of the organizations we
studied, and sought to place the phenomena studied in their social and cultural
context (Lewis, 1985). Observations are eligible for complementary data source
(Cooper & Schindler, 2006).
The samples were drawn from a carefully constructed sampling frame.
The sampling frame includes organizations which are:
1. State Owned Enterprises (SOEs), because they have the obligation to
comply with Good Corporate Governance mandated by the Ministry of
SOE. Secondly, SOEs are interesting because they are experiencing
liberalization & privatization with government slowly relinquishing part of
its shares to public or foreign investors. This in turn will require more
rigor governance for transparency of majority shareholder and the
executives to protect the interest of minority shareholder and the public.
2. Banks, because they have the obligation to obey strict and detailed central
bank rules and regulations, and they have relied completely on IT for their
daily operations.
3. Some of the government agencies which we believe should have a high
intensity of IT use. Usually its business had something to do with large
number of transactional data.
32
4. Publicly owned companies, because they have to obey strict information
disclosure regulations from Securities Exchange Authority (Bapepam-
LK).
5. Highly regulated industries, such as airlines companies.
6. Large scale privately ownedd companies in a competitive market.
Apparently, the chosen sampling frame above implicitly also relate to
judgmental or purposive sampling of the study, which samples were selected on
the basis of researcher’s own knowledge of the population (Babbie, 1998).
Following the sampling frame, we use convenient sampling (Hair et.al, 2007) to
reach to our respondents. Convenient sampling allows us to use our existing
contacts, relations, connections or ties with the organizations. Some of our
samples are actually also our consulting clients. It allows better in-depth
discussion.
Note that six out of eighteen of the case study samples are state owned
enterprises. At the early stage of this study, we have not known where to focus
our attention, and that is the reason why the sampling frame was quite broad. As
we shall see later, this research later focused on IT Governance at state owned
enterprises.
The case studies research design was carefully designed by the researcher
(me). The researcher also provided the original interview guide (list of questions).
Later, case study research observation guide and the interview guide along with
the codes were finalized together by the assistants (i.e. the students doing their
master’s theses) guided carefully be the researcher in a workshop. Those guides
and codes were based on the aforementioned research framework. The guides
were written in local language to allow easier interview by the assistants.
The research assistants then collected data, although in many cases the
researcher accompanied them in the field data collection. A common short
presentation about IT Governance developed earlier by the researcher was
distributed to the assistants. It can be presented to respondent to gain common
understanding of the subject matter. The assistants were allowed to add the
interview guide during the interview to suit the situation.
33
The respondents in those case studies are mainly the IT managers, and in
some cases we had access to the other functional managers or business unit
managers. The interviews were recorded and transcripted. The transcripts are then
analyzed with a qualitative data analysis software, using axial coding (Neuman,
2003) prepared by both the author and the research assistants. The author then
reviewed and qualitatively analyzed the data with the research assistants.
4.3 Quantitative Stage Method
One of the purposes of the qualitative stage is to confirm the findings from
the previous qualitative stages (including literary study). We believe that the focus
of this research is to find the magnitude of the issues found at the qualitative
stage, to see the magnitude of a problem when it exists. We also wanted to know
the strength of the relationships among variables, as modelled in the conceptual
model hypothesis in figure 4. We developed the questionnaire based on theoretical
framework as described in chapter 3 and also naturally from results taken from
qualitative stage.
To ensure validity of our survey questionnaire design, we pre-tested the
questionnaires to several respondents (Neuman, 2003). It gave us some idea what
might be the barriers during the data collection phase. The questionnaires were
also face validated (Sekaran, 1992) by several of colleagues who had academic
and practical IT management experience. The finalized questionnaire is presented
in the appendix.
List or sampling frame (Babbie, 1998) of SOEs were taken from Ministry
of State Owned Enterprises website (Kementerian BUMN, 2010), all of them
totalled 147 SOEs. Therefore since we took all the available samples in the
population, this research is actually a census (Neuman, 2003).
Before the data collection phase begins, the data collectors was trained
how to properly administer questionnaires. The data collectors were explicitly told
that the respondents must be the person responsible for the IT for the organization
(e.g. IT Division Head), or person responsible for IT Governance for the
organization. Upon the return of the questionnaires, we found that majority of the

34
respondents were the head of the IT unit or an IT manager of the SOE. Few were
the staffs, which according the data collectors were delegated with the job filling
the questionnaires. Even fewer were from IT unit such as human resources unit.
This is due to the non-existence of IT unit at the particular SOE and/or other unit
are assigned responsibility to IT related issues. Despite minor variability of the
respondents, we still believe that the validity of the research is still high.
The finalized questionnaires were then sent by email, fax or brought by the
data collectors to the respondents. From 147 listed respondents, 103
questionnaires (70%) were returned via the data collector directly, fax, or email
during end of April 2010 to early June 2010. Unreturned questionnaires are due to
company liquidation, rejection, uncooperative behaviour, or considered too long
to respond. In our experience, the use of data collectors responsible for delivering
and returning filled questionnaires significantly increase the return rate of
completed questionnaires. Our previous attempt via e-mail only achieve 21%
return rate.
The returned questionnaires were then entered into and analyzed with
SPSS 13, a statistical software package. Some of the data, especially regarding the
health status of each SOE, were taken from Ministry of SOE, and were inputed
into the corresponding row/record based on company name. We were only able to
get the 2009 SOE health status as our most recent reference.
Figure 5. Data were analyzed using SPSS. SOEs name are obscured to hide company names.

35
Note that this is not an experimental causal study, but an ex post facto
study, meaning the fact was happening or had already happened (Cooper &
Schindler, 2006).. Therefore the research is not looking at suggesting ‘variable A
causes variable B’, but more on the association (Sekaran, 1992) or prediction of
one variable based on other variable (Cooper & Schindler, 2006). Therefore when
we said that a causes B, actually it really means:
• A is associated with B or
• value of A can predict value of B.
During data processing, apparently it was found that the question ‘Has IT
brought value to the organization’ seems biased due to leading question design as
the question was taken from ITGI (2008). Therefore, the question was rephrased
so it should not lead the respondents to a particular answer. Along with a reduced
set version of the original 2010 questionnaire, we recollect the new data during IT
Governance 2011 Seminar at Hotel Bidakara in March 2011. We were able to
collect data from 38 SOEs.

36
CHAPTER 5
DATA ANALYSIS
5.1 Qualitative Data Elicitation
Following the methodology mentioned earlier in section 4.1.4 we coded
the results from each case study. Drivers were easily recognized explicitly from
the ITGI (2007) IT Governance Focus Area and business pressure/needs from AS-
8015 (Standards Australia, 2005). The researcher than categorized the results. The
process of data analysis in this phase is largely a search for patterns of similarities
and differences, followed by interpretation of those patterns (Babbie, 1998).
Despite sampling frame had included non SOEs, through careful analysis,
however, all of the drivers resulted were considered relevant for SOEs, thus
incorporated in the final questionnaires in survey phase later on.
To complement those findings, using ethnographic approach (Lewis,
1985) as described previously in section 4.1.4, some personal experience as IT
management consultant enriched list of drivers. As explained by (Harvey &
Myers, 1995), ethnography offers an approach to the analysis of institutional
context of information systems (and information technology) practices, with the
notion of context being one of the social construction of meaning frameworks. It
deals with actual practices of real world situation, thus allowing for relevant
issues to be explored and frameworks to be developed. One example of driving
factors added by the researcher is ‘accountability for huge IT investment’, as it
was mentioned by the IT strategy & policy head of a SOE bank during
researcher’s involvement in a COBIT-based audit in 2007.
Below we list those IT Governance driving factors:

37
Accountability & transparency regulations from stock market regulator
Accountability of huge IT investments
Business partner pressure
Community pressure regarding bureaucracy reform
Core system or enterprise-wide ERP implementation
Corporate governance regulations
Data accuracy/reliability/timeliness requirement from directors or users
External audit
Free market competition
Industry sector regulations
Merger & acquisition
Previous Y2K problem
SOE specific regulations
Transparency requirement of Public Information Access Act
Table 5. Elicited Drivers of IT Governance
The enablers and inhibitors must be extracted from the case studies. As
Luftman (1999) did not supply the definition of enablers nor inhibitors, we must
define them. Enablers were defined by the researcher as “things that makes it
easier in governing and managing IT”. In the opposite, inhibitors were defined as
“things that can hinder or impede the process of governing or managing IT the
way it should be done”.
Through the process of interpretation and classifying (Neuman, 2003), the
inhibitors and enablers were extracted. Quite specifically, this part used
hermeneutics (Boland, 1991), as text from the case studies were being understood
to include their social context, including the data collector and/or writer (i.e. the
assistants). In Babbie (1998) terms, the meaning of the text is sought after. Also,
as Neuman (2003) explained, aaccess to reality only through social constructions,
such as language, consciousness and shared meanings. Therefore researcher’s
judgment, past experience and social understanding of the situation plays
important role.
The in the case of inhibiting factors, apparently the sampling frame
differences between the qualitative phase and the later quantitative survey phase

38
must be accounted on. For example, President Decree no.80 of 2003 on Goods &
Service Procurement was considered irrelevant to be accounted for state owned
enterprises, as they have their own set of rules as a limited liability company
(perseroan terbatas).
As with driving factors, researcher’s personal experience also complement
the enabler and inhibitor list taken from case studies. Some of them include
“allowing changes of KPI…” from a SOE and “selfishness for not exchanging
data…” from a financial government agency. Taken together, the list of enablers
and inhibitors are shown below:
Awareness of IT benefits from top executives
High level of awareness of risk management amongst staff
The use of objective & performance based management system
Company's commitment to knowledge management
Continuous optimization of organization design for better governance
Existence of audit committee on Board of Commissioners
Multiple level of authorization of budget use
Existence of PMO to monitor project cycles
Customary practice to reach consensus formally
Customary practice to reach consensus informally
Contingency budget for unexpected expenditures
Investment committee on Board of Commissioners
Regulation/procedure allowing changes to budget in half year time
Allowing changes of KPI during execution
Table 6. Elicited Enablers of Good IT Governance
Many employees have low IT awareness
IT investment only uses financial calculation
Sorts of communication problems
Some other units are slow to respond to IT needs or bureaucracyproblems
Lack of commitment of top executives
Unclear IT career path
No formal procedures for prioritization of IT investments
Relatively low salary for IT staff
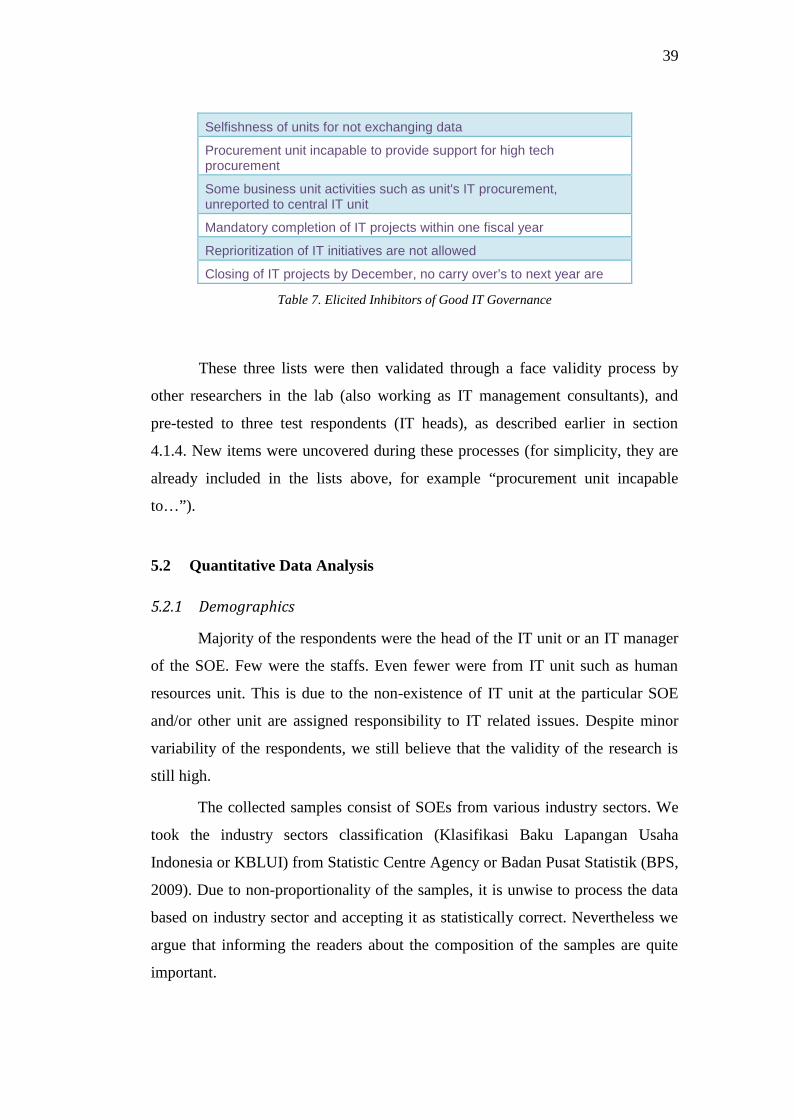
39
Selfishness of units for not exchanging data
Procurement unit incapable to provide support for high techprocurement
Some business unit activities such as unit's IT procurement,unreported to central IT unit
Mandatory completion of IT projects within one fiscal year
Reprioritization of IT initiatives are not allowed
Closing of IT projects by December, no carry over’s to next year are
Table 7. Elicited Inhibitors of Good IT Governance
These three lists were then validated through a face validity process by
other researchers in the lab (also working as IT management consultants), and
pre-tested to three test respondents (IT heads), as described earlier in section
4.1.4. New items were uncovered during these processes (for simplicity, they are
already included in the lists above, for example “procurement unit incapable
to…”).
5.2 Quantitative Data Analysis
5.2.1 Demographics
Majority of the respondents were the head of the IT unit or an IT manager
of the SOE. Few were the staffs. Even fewer were from IT unit such as human
resources unit. This is due to the non-existence of IT unit at the particular SOE
and/or other unit are assigned responsibility to IT related issues. Despite minor
variability of the respondents, we still believe that the validity of the research is
still high.
The collected samples consist of SOEs from various industry sectors. We
took the industry sectors classification (Klasifikasi Baku Lapangan Usaha
Indonesia or KBLUI) from Statistic Centre Agency or Badan Pusat Statistik (BPS,
2009). Due to non-proportionality of the samples, it is unwise to process the data
based on industry sector and accepting it as statistically correct. Nevertheless we
argue that informing the readers about the composition of the samples are quite
important.
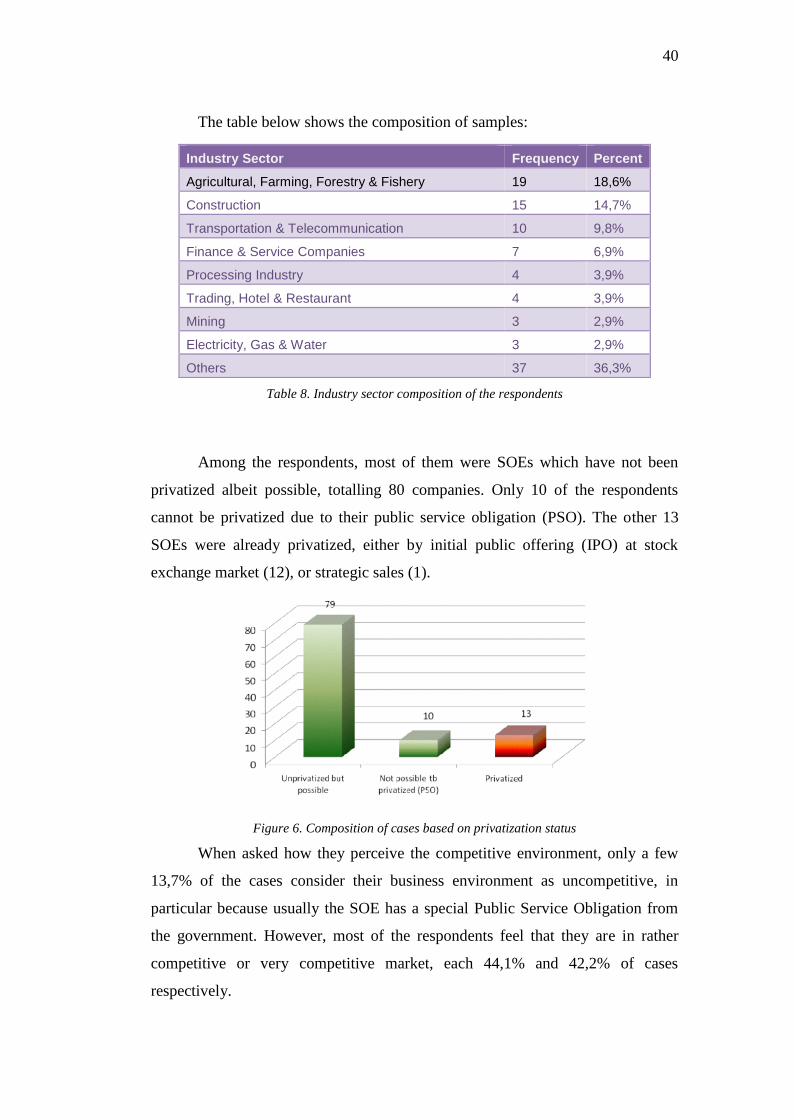
40
The table below shows the composition of samples:
Industry Sector Frequency Percent
Agricultural, Farming, Forestry & Fishery 19 18,6%
Construction 15 14,7%
Transportation & Telecommunication 10 9,8%
Finance & Service Companies 7 6,9%
Processing Industry 4 3,9%
Trading, Hotel & Restaurant 4 3,9%
Mining 3 2,9%
Electricity, Gas & Water 3 2,9%
Others 37 36,3%
Table 8. Industry sector composition of the respondents
Among the respondents, most of them were SOEs which have not been
privatized albeit possible, totalling 80 companies. Only 10 of the respondents
cannot be privatized due to their public service obligation (PSO). The other 13
SOEs were already privatized, either by initial public offering (IPO) at stock
exchange market (12), or strategic sales (1).
Figure 6. Composition of cases based on privatization status
When asked how they perceive the competitive environment, only a few
13,7% of the cases consider their business environment as uncompetitive, in
particular because usually the SOE has a special Public Service Obligation from
the government. However, most of the respondents feel that they are in rather
competitive or very competitive market, each 44,1% and 42,2% of cases
respectively.

41
Figure 7. Composition of cases based on their market environment
5.2.2 Basic Descriptive Analysis
This section discusses the descriptive analysis of each variable in the
conceptual model hypothesis previously described.
Majority of the respondents we surveyed (93 cases) pointed out that they
agreed or strongly agree that IT investment has created value. Only six cases we
found that it somehow create value and even fewer four cases where it didn’t
create value. Due to the uneven distribution of the result as shown in Figure 8, we
suspect that the answer was biased caused by leading question design. As
previously explained, we recollect new data a year later using a different question
but pointed out to the same concept (‘has IT brought value’). The new result is
shown in Figure 9, which seems that the result is more evenly distributed as
expected. Around 41,6% of the respondents said that value they felt from IT
investment is more than expected or seems just comparable with the IT
investment spent. On the other hand, 47,2% of the respondent said that value they
felt from IT investment is a little bit less than expected or even not comparable
with the IT investment spent. Only a handful 11,1% of the respondents choose
don’t know to the question.
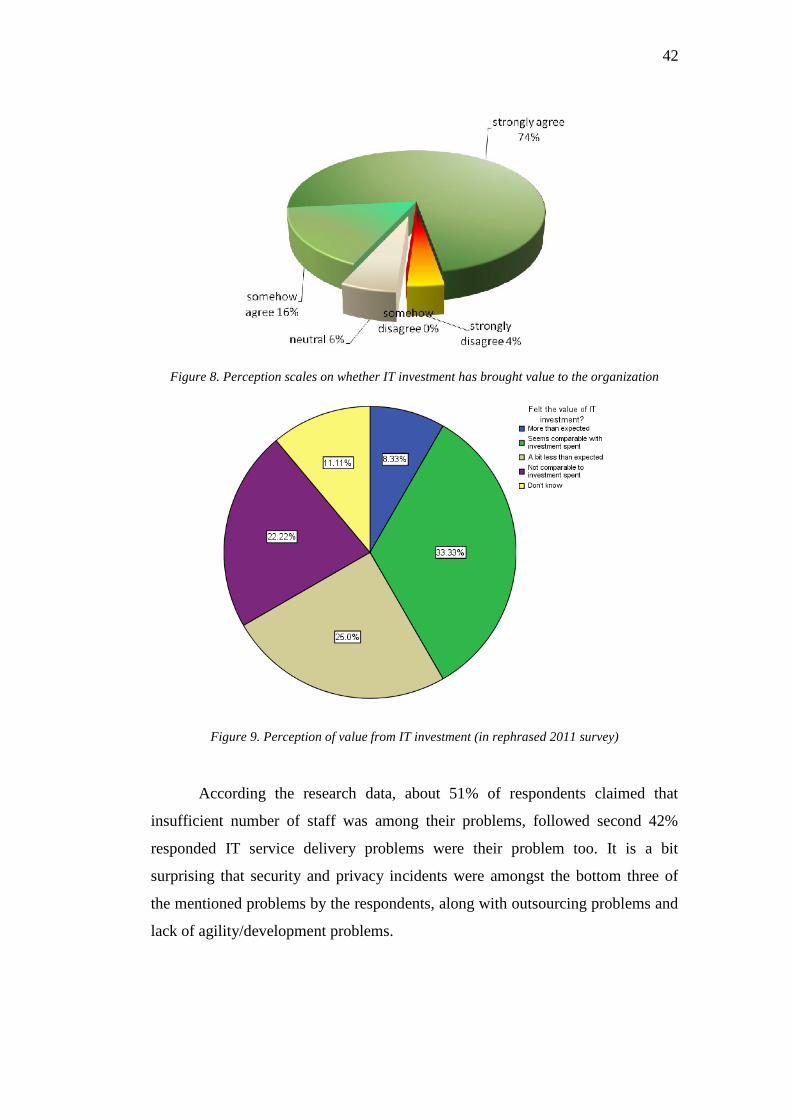
42
Figure 8. Perception scales on whether IT investment has brought value to the organization
Figure 9. Perception of value from IT investment (in rephrased 2011 survey)
According the research data, about 51% of respondents claimed that
insufficient number of staff was among their problems, followed second 42%
responded IT service delivery problems were their problem too. It is a bit
surprising that security and privacy incidents were amongst the bottom three of
the mentioned problems by the respondents, along with outsourcing problems and
lack of agility/development problems.
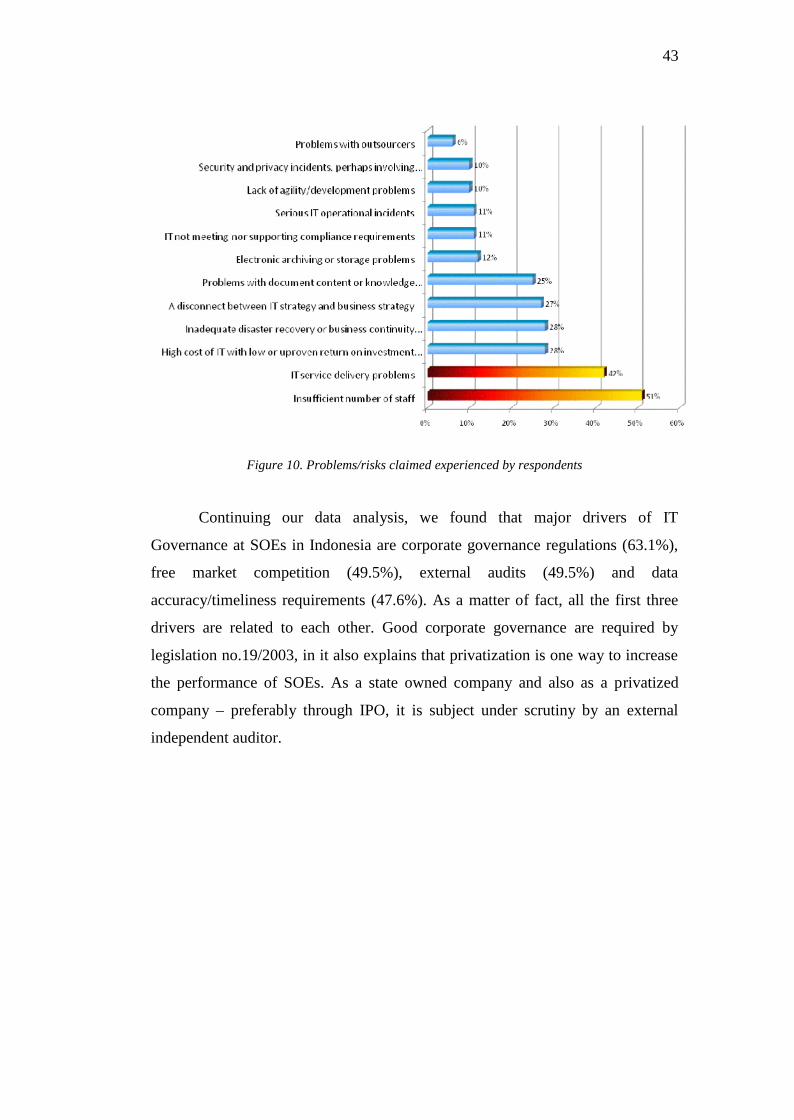
43
Figure 10. Problems/risks claimed experienced by respondents
Continuing our data analysis, we found that major drivers of IT
Governance at SOEs in Indonesia are corporate governance regulations (63.1%),
free market competition (49.5%), external audits (49.5%) and data
accuracy/timeliness requirements (47.6%). As a matter of fact, all the first three
drivers are related to each other. Good corporate governance are required by
legislation no.19/2003, in it also explains that privatization is one way to increase
the performance of SOEs. As a state owned company and also as a privatized
company – preferably through IPO, it is subject under scrutiny by an external
independent auditor.
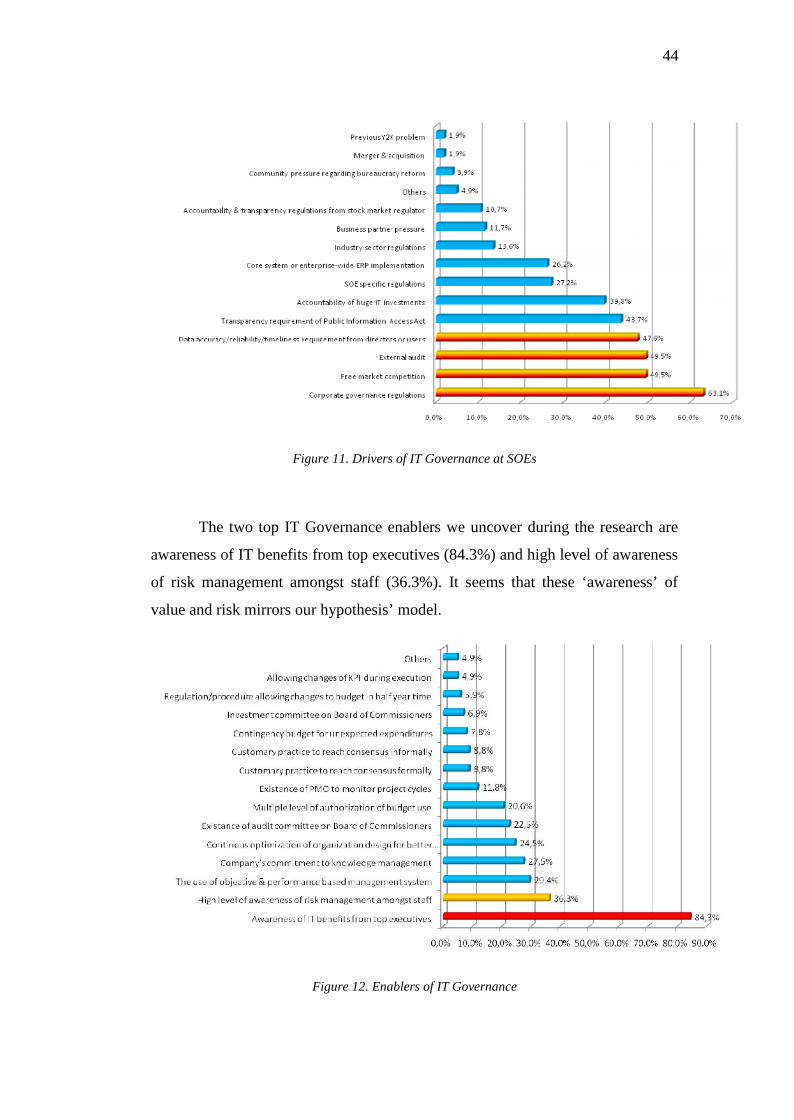
44
Figure 11. Drivers of IT Governance at SOEs
The two top IT Governance enablers we uncover during the research are
awareness of IT benefits from top executives (84.3%) and high level of awareness
of risk management amongst staff (36.3%). It seems that these ‘awareness’ of
value and risk mirrors our hypothesis’ model.
Figure 12. Enablers of IT Governance
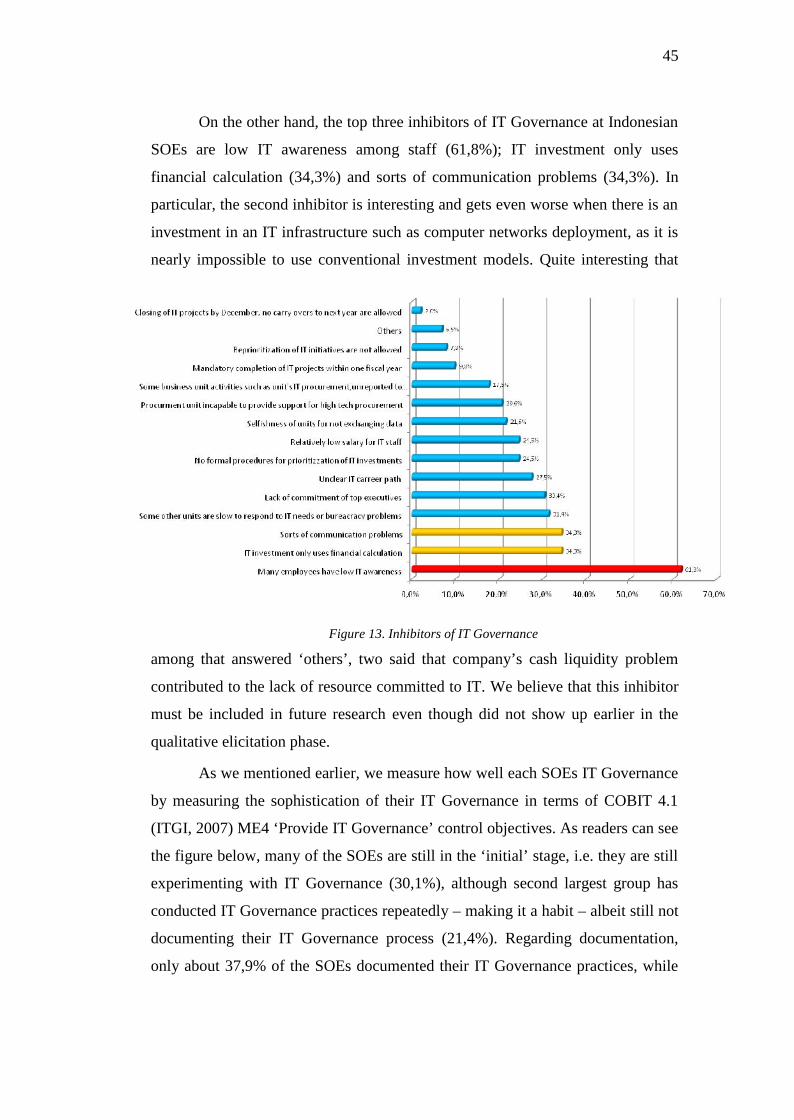
45
On the other hand, the top three inhibitors of IT Governance at Indonesian
SOEs are low IT awareness among staff (61,8%); IT investment only uses
financial calculation (34,3%) and sorts of communication problems (34,3%). In
particular, the second inhibitor is interesting and gets even worse when there is an
investment in an IT infrastructure such as computer networks deployment, as it is
nearly impossible to use conventional investment models. Quite interesting that
among that answered ‘others’, two said that company’s cash liquidity problem
contributed to the lack of resource committed to IT. We believe that this inhibitor
must be included in future research even though did not show up earlier in the
qualitative elicitation phase.
As we mentioned earlier, we measure how well each SOEs IT Governance
by measuring the sophistication of their IT Governance in terms of COBIT 4.1
(ITGI, 2007) ME4 ‘Provide IT Governance’ control objectives. As readers can see
the figure below, many of the SOEs are still in the ‘initial’ stage, i.e. they are still
experimenting with IT Governance (30,1%), although second largest group has
conducted IT Governance practices repeatedly – making it a habit – albeit still not
documenting their IT Governance process (21,4%). Regarding documentation,
only about 37,9% of the SOEs documented their IT Governance practices, while
Figure 13. Inhibitors of IT Governance

46
the rest of the majority of the respondents is still not documenting their IT
Governance practices.
Figure 14. Overall case count of Control Objective Maturity Level
On the figure that follows, we also have a more detailed breakdown of the
IT Governance level based on 5 focus areas. From those figures, it seems that
SOEs are doing better in managing resource and managing performance, however
this claim has to be statistically tested later.
Figure 15. Case count of Control Objective Maturity Level by focus area
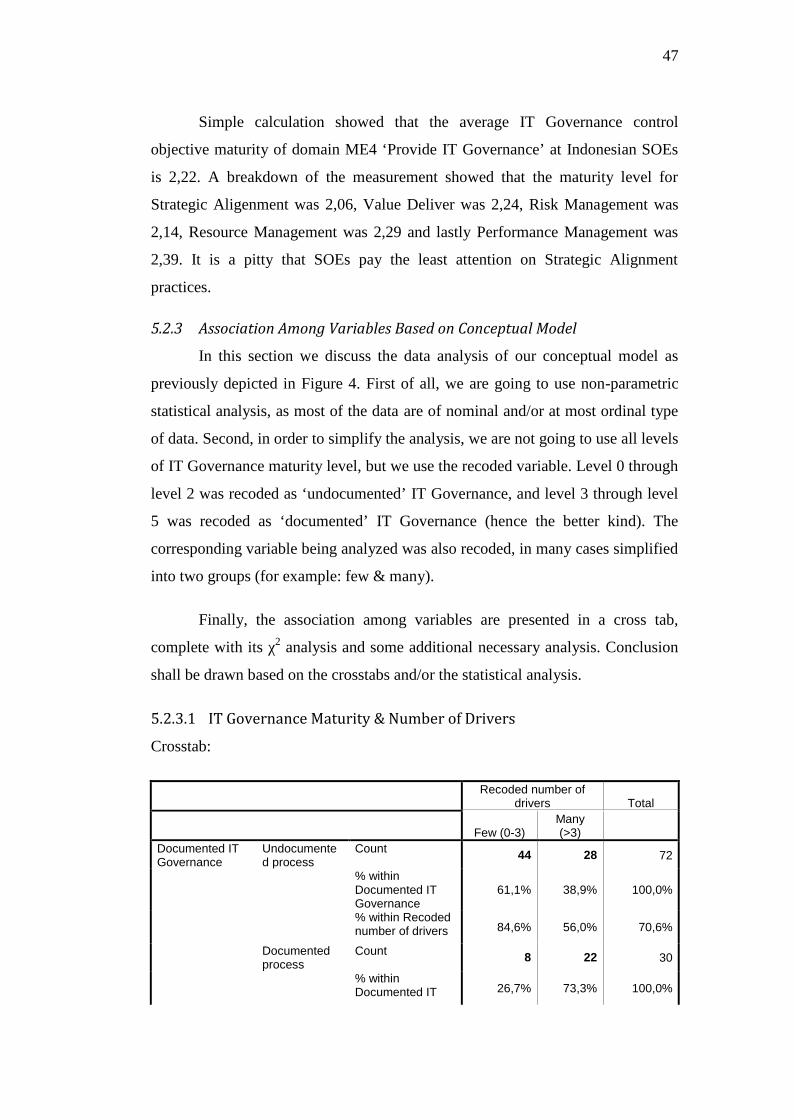
47
Simple calculation showed that the average IT Governance control
objective maturity of domain ME4 ‘Provide IT Governance’ at Indonesian SOEs
is 2,22. A breakdown of the measurement showed that the maturity level for
Strategic Aligenment was 2,06, Value Deliver was 2,24, Risk Management was
2,14, Resource Management was 2,29 and lastly Performance Management was
2,39. It is a pitty that SOEs pay the least attention on Strategic Alignment
practices.
5.2.3 Association Among Variables Based on Conceptual Model
In this section we discuss the data analysis of our conceptual model as
previously depicted in Figure 4. First of all, we are going to use non-parametric
statistical analysis, as most of the data are of nominal and/or at most ordinal type
of data. Second, in order to simplify the analysis, we are not going to use all levels
of IT Governance maturity level, but we use the recoded variable. Level 0 through
level 2 was recoded as ‘undocumented’ IT Governance, and level 3 through level
5 was recoded as ‘documented’ IT Governance (hence the better kind). The
corresponding variable being analyzed was also recoded, in many cases simplified
into two groups (for example: few & many).
Finally, the association among variables are presented in a cross tab,
complete with its χ2 analysis and some additional necessary analysis. Conclusion
shall be drawn based on the crosstabs and/or the statistical analysis.5.2.3.1 IT Governance Maturity & Number of DriversCrosstab:
Recoded number ofdrivers Total
Few (0-3)Many(>3)
Documented ITGovernance
Undocumented process
Count 44 28 72
% withinDocumented ITGovernance
61,1% 38,9% 100,0%
% within Recodednumber of drivers 84,6% 56,0% 70,6%
Documentedprocess
Count 8 22 30
% withinDocumented IT 26,7% 73,3% 100,0%
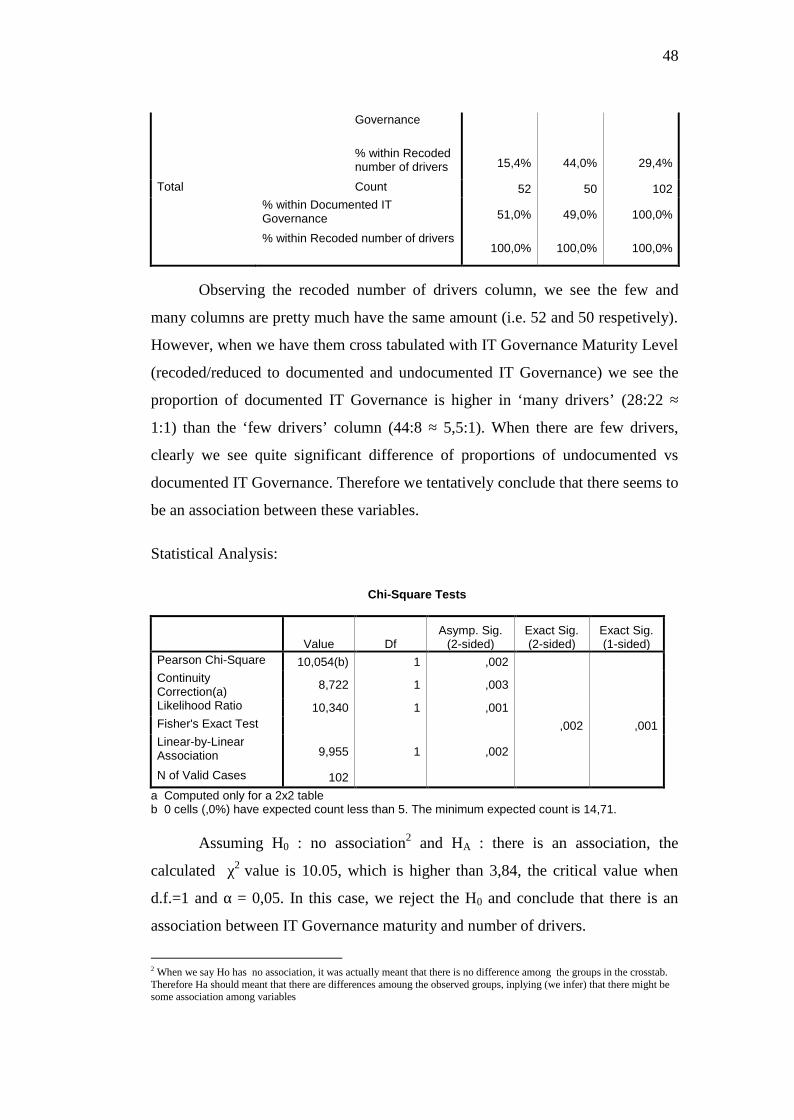
48
Governance
% within Recodednumber of drivers 15,4% 44,0% 29,4%
Total Count 52 50 102% within Documented ITGovernance 51,0% 49,0% 100,0%
% within Recoded number of drivers100,0% 100,0% 100,0%
Observing the recoded number of drivers column, we see the few and
many columns are pretty much have the same amount (i.e. 52 and 50 respetively).
However, when we have them cross tabulated with IT Governance Maturity Level
(recoded/reduced to documented and undocumented IT Governance) we see the
proportion of documented IT Governance is higher in ‘many drivers’ (28:22 ≈
1:1) than the ‘few drivers’ column (44:8 ≈ 5,5:1). When there are few drivers,
clearly we see quite significant difference of proportions of undocumented vs
documented IT Governance. Therefore we tentatively conclude that there seems to
be an association between these variables.
Statistical Analysis:
Chi-Square Tests
Value DfAsymp. Sig.
(2-sided)Exact Sig.(2-sided)
Exact Sig.(1-sided)
Pearson Chi-Square 10,054(b) 1 ,002ContinuityCorrection(a) 8,722 1 ,003
Likelihood Ratio 10,340 1 ,001Fisher's Exact Test ,002 ,001Linear-by-LinearAssociation 9,955 1 ,002
N of Valid Cases 102a Computed only for a 2x2 tableb 0 cells (,0%) have expected count less than 5. The minimum expected count is 14,71.
Assuming H0 : no association2 and HA : there is an association, the
calculated χ2 value is 10.05, which is higher than 3,84, the critical value when
d.f.=1 and α = 0,05. In this case, we reject the H0 and conclude that there is an
association between IT Governance maturity and number of drivers.
2 When we say Ho has no association, it was actually meant that there is no difference among the groups in the crosstab.Therefore Ha should meant that there are differences amoung the observed groups, inplying (we infer) that there might besome association among variables
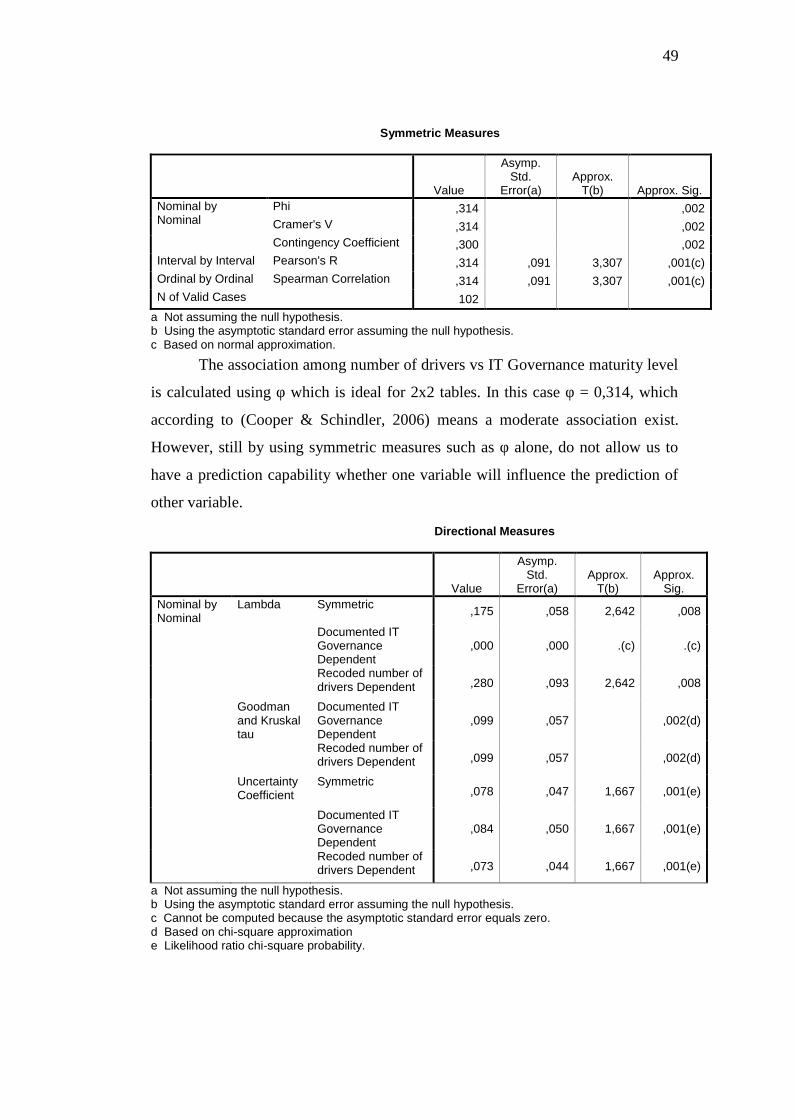
49
Symmetric Measures
Value
Asymp.Std.
Error(a)Approx.
T(b) Approx. Sig.Nominal byNominal
Phi ,314 ,002Cramer's V ,314 ,002Contingency Coefficient ,300 ,002
Interval by Interval Pearson's R ,314 ,091 3,307 ,001(c)Ordinal by Ordinal Spearman Correlation ,314 ,091 3,307 ,001(c)N of Valid Cases 102
a Not assuming the null hypothesis.b Using the asymptotic standard error assuming the null hypothesis.c Based on normal approximation.
The association among number of drivers vs IT Governance maturity level
is calculated using φ which is ideal for 2x2 tables. In this case φ = 0,314, which
according to (Cooper & Schindler, 2006) means a moderate association exist.
However, still by using symmetric measures such as φ alone, do not allow us to
have a prediction capability whether one variable will influence the prediction of
other variable.
Directional Measures
Value
Asymp.Std.
Error(a)Approx.
T(b)Approx.
Sig.Nominal byNominal
Lambda Symmetric ,175 ,058 2,642 ,008
Documented ITGovernanceDependent
,000 ,000 .(c) .(c)
Recoded number ofdrivers Dependent ,280 ,093 2,642 ,008
Goodmanand Kruskaltau
Documented ITGovernanceDependent
,099 ,057 ,002(d)
Recoded number ofdrivers Dependent ,099 ,057 ,002(d)
UncertaintyCoefficient
Symmetric,078 ,047 1,667 ,001(e)
Documented ITGovernanceDependent
,084 ,050 1,667 ,001(e)
Recoded number ofdrivers Dependent ,073 ,044 1,667 ,001(e)
a Not assuming the null hypothesis.b Using the asymptotic standard error assuming the null hypothesis.c Cannot be computed because the asymptotic standard error equals zero.d Based on chi-square approximatione Likelihood ratio chi-square probability.
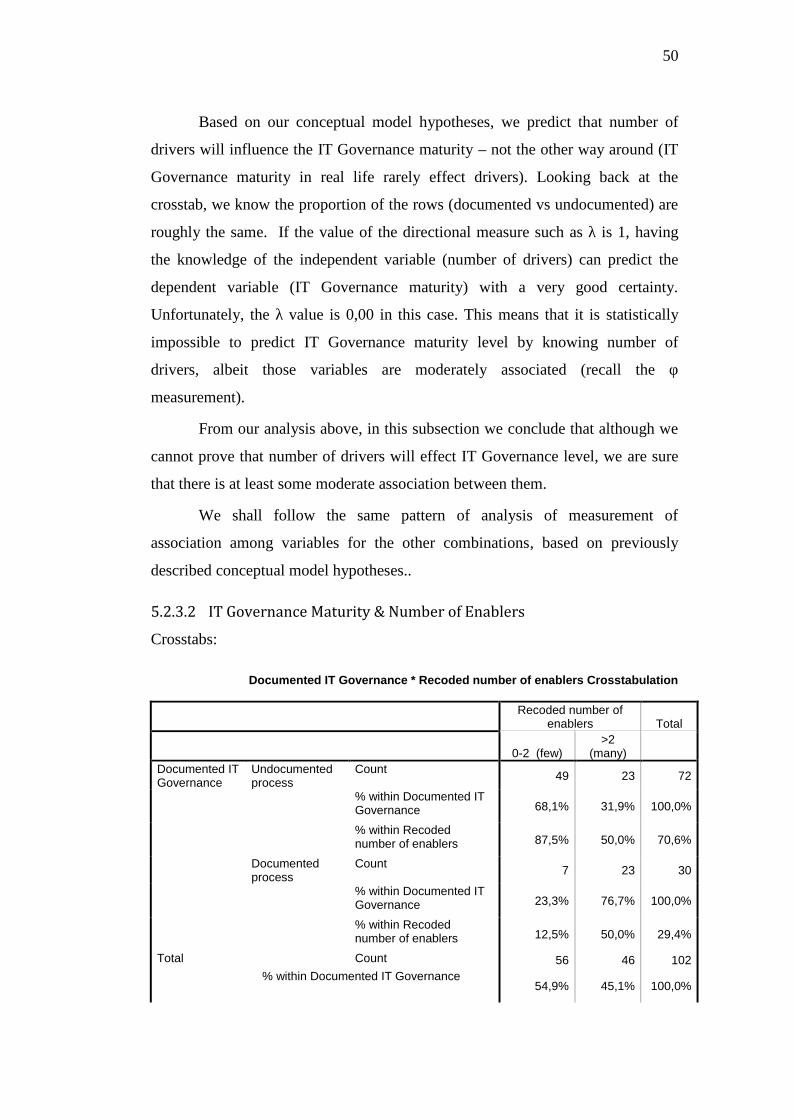
50
Based on our conceptual model hypotheses, we predict that number of
drivers will influence the IT Governance maturity – not the other way around (IT
Governance maturity in real life rarely effect drivers). Looking back at the
crosstab, we know the proportion of the rows (documented vs undocumented) are
roughly the same. If the value of the directional measure such as λ is 1, having
the knowledge of the independent variable (number of drivers) can predict the
dependent variable (IT Governance maturity) with a very good certainty.
Unfortunately, the λ value is 0,00 in this case. This means that it is statistically
impossible to predict IT Governance maturity level by knowing number of
drivers, albeit those variables are moderately associated (recall the φ
measurement).
From our analysis above, in this subsection we conclude that although we
cannot prove that number of drivers will effect IT Governance level, we are sure
that there is at least some moderate association between them.
We shall follow the same pattern of analysis of measurement of
association among variables for the other combinations, based on previously
described conceptual model hypotheses..5.2.3.2 IT Governance Maturity & Number of EnablersCrosstabs:
Documented IT Governance * Recoded number of enablers Crosstabulation
Recoded number ofenablers Total
0-2 (few)>2
(many)Documented ITGovernance
Undocumentedprocess
Count 49 23 72
% within Documented ITGovernance 68,1% 31,9% 100,0%
% within Recodednumber of enablers 87,5% 50,0% 70,6%
Documentedprocess
Count 7 23 30
% within Documented ITGovernance 23,3% 76,7% 100,0%
% within Recodednumber of enablers 12,5% 50,0% 29,4%
Total Count 56 46 102% within Documented IT Governance
54,9% 45,1% 100,0%

51
% within Recoded number of enablers100,0% 100,0% 100,0%
A quick look at the table indicates that IT Governance maturity clearly can
be associated with number of enablers. The proportion of documented IT
Governance is higher when the many drivers are working on the SOE (49:7 =
7:1), and the opposite thing happened when only a few enablers exist (23:23 =
1:1). In other words, there are differences among groups.
Statistical analysis:
Chi-Square Tests
Value dfAsymp. Sig.
(2-sided)Exact Sig.(2-sided)
Exact Sig.(1-sided)
Pearson Chi-Square 17,106(b) 1 ,000ContinuityCorrection(a) 15,348 1 ,000
Likelihood Ratio 17,615 1 ,000Fisher's Exact Test ,000 ,000Linear-by-LinearAssociation 16,939 1 ,000
N of Valid Cases 102a Computed only for a 2x2 tableb 0 cells (,0%) have expected count less than 5. The minimum expected count is 13,53.
Assuming H0 : no association and HA : there is an association, the
calculated χ2 value is 17,1, which is much higher than 3,84, the critical value
when d.f.=1 and α = 0,05. In this case, we reject the H0 and conclude that there is
an association between IT Governance maturity and number of enablers.
Symmetric Measures
Value
Asymp.Std.
Error(a)Approx.
T(b) Approx. Sig.Nominal byNominal
Phi ,410 ,000Cramer's V ,410 ,000Contingency Coefficient ,379 ,000
Interval by Interval Pearson's R ,410 ,089 4,489 ,000(c)Ordinal by Ordinal Spearman Correlation ,410 ,089 4,489 ,000(c)N of Valid Cases 102
a Not assuming the null hypothesis.b Using the asymptotic standard error assuming the null hypothesis.c Based on normal approximation.

52
The association among number of enablers vs IT Governance maturity
level is calculated using φ. In this case φ = 0,41, which indicates more than
moderate association exist (φ ranges from 0 to 1, which φ = 1 indicates certain
association and φ = 0 indicates no association at all).
Directional Measures
ValueAsymp. Std.
Error(a)Approx.
T(b)Approx.
Sig.Nominal byNominal
Lambda Symmetric ,211 ,057 3,052 ,002
Documented ITGovernanceDependent
,000 ,000 .(c) .(c)
Recoded numberof enablersDependent
,348 ,096 3,052 ,002
Goodmanand Kruskaltau
Documented ITGovernanceDependent
,168 ,073 ,000(d)
Recoded numberof enablersDependent
,168 ,071 ,000(d)
UncertaintyCoefficient
Symmetric,133 ,060 2,213 ,000(e)
Documented ITGovernanceDependent
,143 ,063 2,213 ,000(e)
Recoded numberof enablersDependent
,125 ,057 2,213 ,000(e)
a Not assuming the null hypothesis.b Using the asymptotic standard error assuming the null hypothesis.c Cannot be computed because the asymptotic standard error equals zero.d Based on chi-square approximatione Likelihood ratio chi-square probability.
Based on our conceptual model hypotheses, we predict that number of
enablers will influence the IT Governance maturity. In this case, we must have IT
Governance maturity (recoded into documented & documented IT Governance).
Again we unfortunately found the λ value to be 0,00 in this case. This means that
it is statistically impossible to predict IT Governance maturity level by knowing
number of enablers, albeit those variables are moderately associated (recall the φ
measurement).
From our analysis above, in this subsection we conclude that although we
cannot prove that number of enablers will effect IT Governance level, we are sure
that there is a moderate association between them.

53
5.2.3.3 IT Governance Maturity & Number of InhibitorsCrosstabs:
Documented IT Governance * Recoded number of inhibitors Crosstabulation
Recoded number ofinhibitors Total
0-3 (few) >3 (many)Documented ITGovernance
Undocumentedprocess
Count 44 28 72
% within DocumentedIT Governance 61,1% 38,9% 100,0%
% within Recodednumber of inhibitors 71,0% 70,0% 70,6%
Documentedprocess
Count 18 12 30
% within DocumentedIT Governance 60,0% 40,0% 100,0%
% within Recodednumber of inhibitors 29,0% 30,0% 29,4%
Total Count 62 40 102% within Documented IT Governance
60,8% 39,2% 100,0%
% within Recoded number of inhibitors100,0% 100,0% 100,0%
Observing the proportions of documented vs undocumented IT
Governance on each column, we see that the proportion in the few inhibitors
column (44:18 ≈ 2,4:1) is quite the same as in the many inhibitors column (28:12
≈ 2,3:1). It seems that there is no apparent relationship between number of
inhibitors with IT Governance maturity. To ensure our analysis, we must resort to
statistical analysis.
Statistical analysis:
Chi-Square Tests
Value dfAsymp. Sig.
(2-sided)Exact Sig.(2-sided)
Exact Sig.(1-sided)
Pearson Chi-Square ,011(b) 1 ,917ContinuityCorrection(a) ,000 1 1,000
Likelihood Ratio ,011 1 ,917Fisher's Exact Test 1,000 ,544Linear-by-LinearAssociation ,011 1 ,917
N of Valid Cases 102a Computed only for a 2x2 table
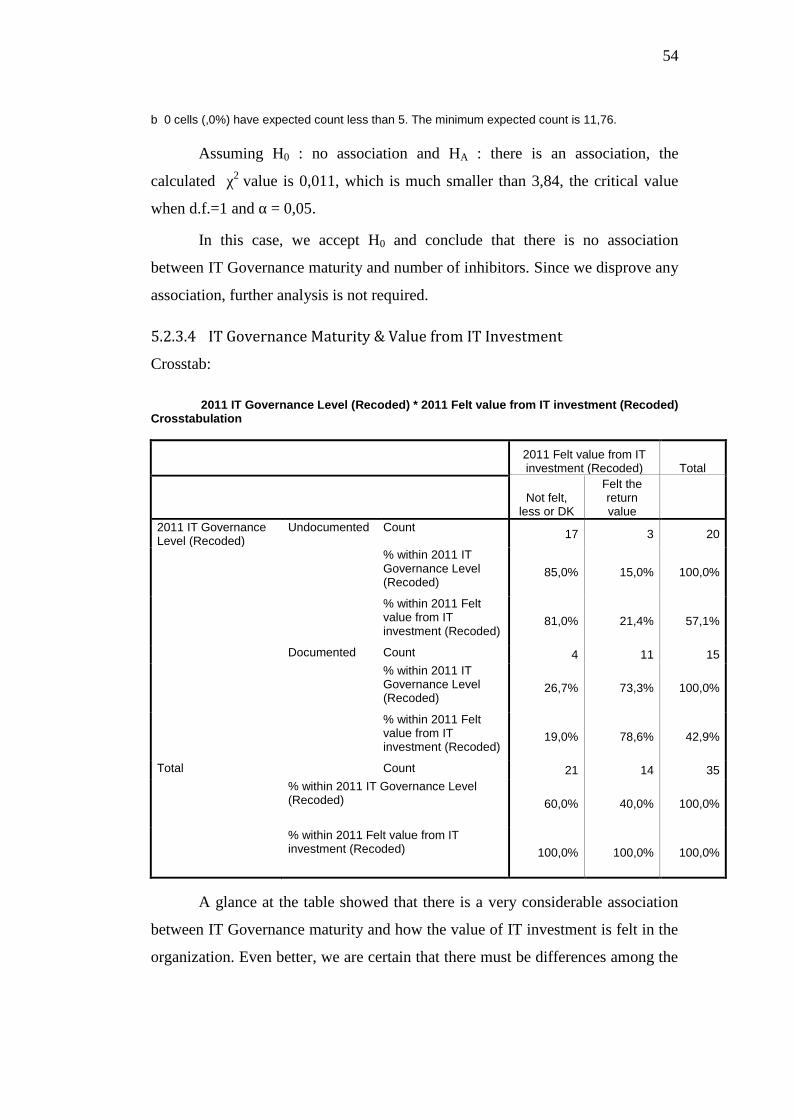
54
b 0 cells (,0%) have expected count less than 5. The minimum expected count is 11,76.
Assuming H0 : no association and HA : there is an association, the
calculated χ2 value is 0,011, which is much smaller than 3,84, the critical value
when d.f.=1 and α = 0,05.
In this case, we accept H0 and conclude that there is no association
between IT Governance maturity and number of inhibitors. Since we disprove any
association, further analysis is not required.5.2.3.4 IT Governance Maturity & Value from IT InvestmentCrosstab:
2011 IT Governance Level (Recoded) * 2011 Felt value from IT investment (Recoded)Crosstabulation
2011 Felt value from ITinvestment (Recoded) Total
Not felt,less or DK
Felt thereturnvalue
2011 IT GovernanceLevel (Recoded)
Undocumented Count 17 3 20
% within 2011 ITGovernance Level(Recoded)
85,0% 15,0% 100,0%
% within 2011 Feltvalue from ITinvestment (Recoded)
81,0% 21,4% 57,1%
Documented Count 4 11 15% within 2011 ITGovernance Level(Recoded)
26,7% 73,3% 100,0%
% within 2011 Feltvalue from ITinvestment (Recoded)
19,0% 78,6% 42,9%
Total Count 21 14 35% within 2011 IT Governance Level(Recoded) 60,0% 40,0% 100,0%
% within 2011 Felt value from ITinvestment (Recoded) 100,0% 100,0% 100,0%
A glance at the table showed that there is a very considerable association
between IT Governance maturity and how the value of IT investment is felt in the
organization. Even better, we are certain that there must be differences among the

55
groups, since the proportions are somehow inverted between those two rows
(high:low (17:3) vs low:high (4:11)).
Statistical Analysis:
Chi-Square Tests
Value dfAsymp. Sig.
(2-sided)Exact Sig.(2-sided)
Exact Sig.(1-sided)
Pearson Chi-Square 12,153(b) 1 ,000ContinuityCorrection(a) 9,844 1 ,002
Likelihood Ratio 12,805 1 ,000Fisher's Exact Test ,001 ,001Linear-by-LinearAssociation 11,806 1 ,001
N of Valid Cases 35a Computed only for a 2x2 tableb 0 cells (,0%) have expected count less than 5. The minimum expected count is 6,00.
Assuming H0 : no association and HA : there is an association, the
calculated χ2 value is 12,15, which is much higher than 3,84, the critical value
when d.f.=1 and α = 0,05. In this case, we reject the H0 and conclude that there is
an association between IT Governance maturity and how value from IT
investment is felt.
Symmetric Measures
Value
Asymp.Std.
Error(a)Approx.
T(b) Approx. Sig.Nominal byNominal
Phi ,589 ,000Cramer's V ,589 ,000Contingency Coefficient ,508 ,000
Interval by Interval Pearson's R ,589 ,138 4,190 ,000(c)Ordinal by Ordinal Spearman Correlation ,589 ,138 4,190 ,000(c)N of Valid Cases 35
a Not assuming the null hypothesis.b Using the asymptotic standard error assuming the null hypothesis.c Based on normal approximation.
Having φ = 0,589 indicates a rather strong (obviously more than moderate)
association between IT Governance maturity level and the value being felt from
IT investment.
Directional Measures
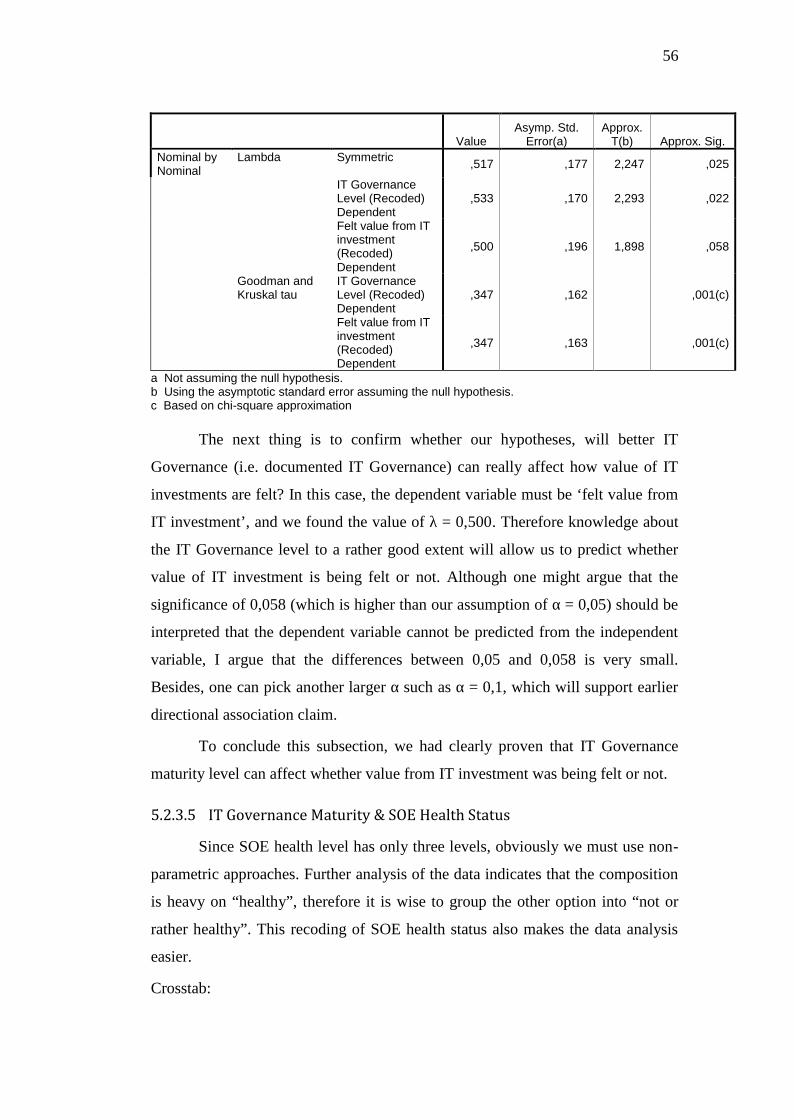
56
ValueAsymp. Std.
Error(a)Approx.
T(b) Approx. Sig.Nominal byNominal
Lambda Symmetric ,517 ,177 2,247 ,025
IT GovernanceLevel (Recoded)Dependent
,533 ,170 2,293 ,022
Felt value from ITinvestment(Recoded)Dependent
,500 ,196 1,898 ,058
Goodman andKruskal tau
IT GovernanceLevel (Recoded)Dependent
,347 ,162 ,001(c)
Felt value from ITinvestment(Recoded)Dependent
,347 ,163 ,001(c)
a Not assuming the null hypothesis.b Using the asymptotic standard error assuming the null hypothesis.c Based on chi-square approximation
The next thing is to confirm whether our hypotheses, will better IT
Governance (i.e. documented IT Governance) can really affect how value of IT
investments are felt? In this case, the dependent variable must be ‘felt value from
IT investment’, and we found the value of λ = 0,500. Therefore knowledge about
the IT Governance level to a rather good extent will allow us to predict whether
value of IT investment is being felt or not. Although one might argue that the
significance of 0,058 (which is higher than our assumption of α = 0,05) should be
interpreted that the dependent variable cannot be predicted from the independent
variable, I argue that the differences between 0,05 and 0,058 is very small.
Besides, one can pick another larger α such as α = 0,1, which will support earlier
directional association claim.
To conclude this subsection, we had clearly proven that IT Governance
maturity level can affect whether value from IT investment was being felt or not.5.2.3.5 IT Governance Maturity & SOE Health StatusSince SOE health level has only three levels, obviously we must use non-
parametric approaches. Further analysis of the data indicates that the composition
is heavy on “healthy”, therefore it is wise to group the other option into “not or
rather healthy”. This recoding of SOE health status also makes the data analysis
easier.
Crosstab:
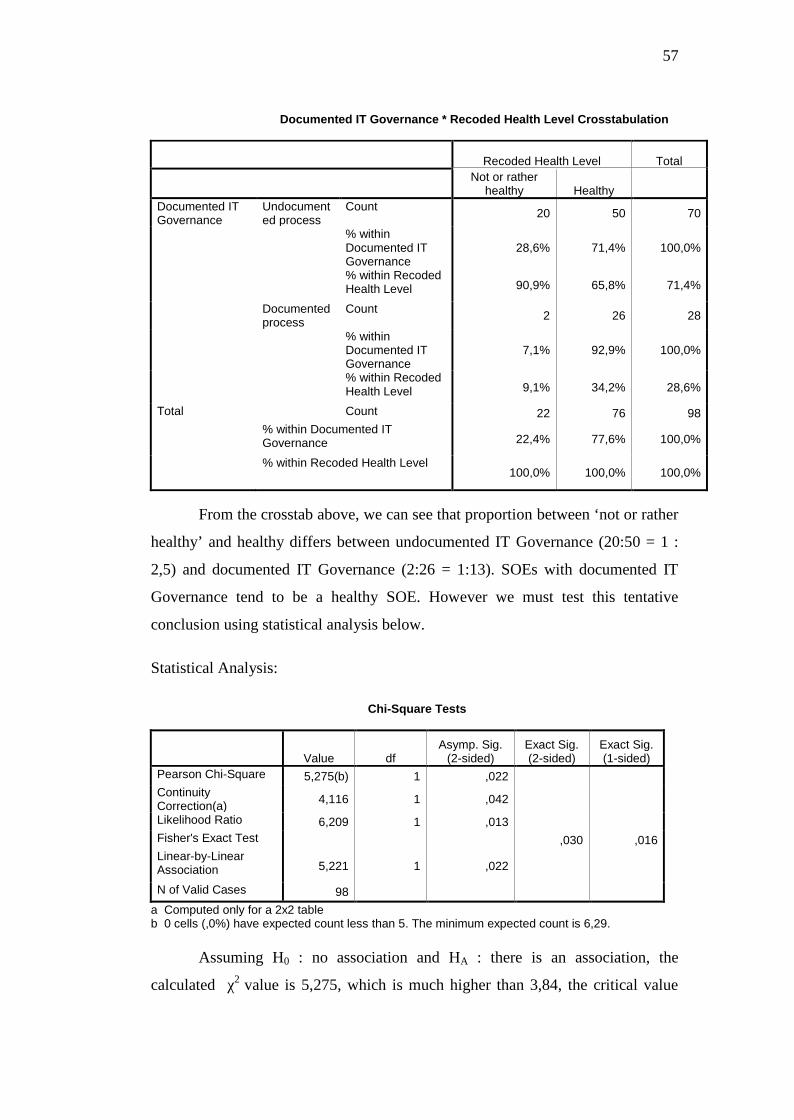
57
Documented IT Governance * Recoded Health Level Crosstabulation
Recoded Health Level TotalNot or rather
healthy HealthyDocumented ITGovernance
Undocumented process
Count 20 50 70
% withinDocumented ITGovernance
28,6% 71,4% 100,0%
% within RecodedHealth Level 90,9% 65,8% 71,4%
Documentedprocess
Count 2 26 28
% withinDocumented ITGovernance
7,1% 92,9% 100,0%
% within RecodedHealth Level 9,1% 34,2% 28,6%
Total Count 22 76 98% within Documented ITGovernance 22,4% 77,6% 100,0%
% within Recoded Health Level100,0% 100,0% 100,0%
From the crosstab above, we can see that proportion between ‘not or rather
healthy’ and healthy differs between undocumented IT Governance (20:50 = 1 :
2,5) and documented IT Governance (2:26 = 1:13). SOEs with documented IT
Governance tend to be a healthy SOE. However we must test this tentative
conclusion using statistical analysis below.
Statistical Analysis:
Chi-Square Tests
Value dfAsymp. Sig.
(2-sided)Exact Sig.(2-sided)
Exact Sig.(1-sided)
Pearson Chi-Square 5,275(b) 1 ,022ContinuityCorrection(a) 4,116 1 ,042
Likelihood Ratio 6,209 1 ,013Fisher's Exact Test ,030 ,016Linear-by-LinearAssociation 5,221 1 ,022
N of Valid Cases 98a Computed only for a 2x2 tableb 0 cells (,0%) have expected count less than 5. The minimum expected count is 6,29.
Assuming H0 : no association and HA : there is an association, the
calculated χ2 value is 5,275, which is much higher than 3,84, the critical value

58
when d.f.=1 and α = 0,05. In this case, we reject the H0 and conclude that there is
an association between IT Governance maturity and SOE’s health level.
Symmetric Measures
Value
Asymp.Std.
Error(a)Approx.
T(b) Approx. Sig.Nominal byNominal
Phi ,232 ,022Cramer's V ,232 ,022Contingency Coefficient ,226 ,022
Interval by Interval Pearson's R ,232 ,074 2,337 ,022(c)Ordinal by Ordinal Spearman Correlation ,232 ,074 2,337 ,022(c)N of Valid Cases 98
a Not assuming the null hypothesis.b Using the asymptotic standard error assuming the null hypothesis.c Based on normal approximation.
Asking ourselves how strong is the association, we found that significance
equals 0,022 (which is smaller than α = 0,05) and φ = 0,232, indicates that there
is an association albeit less then moderate.
Directional Measures
Value
Asymp.Std.
Error(a)Approx.
TApprox.
Sig.Nominal byNominal
Lambda Symmetric ,000 ,000 .(b) .(b)
Documented ITGovernanceDependent
,000 ,000 .(b) .(b)
Recoded HealthLevel Dependent ,000 ,000 .(b) .(b)
GoodmanandKruskaltau
Documented ITGovernanceDependent ,054 ,033 ,022(c)
Recoded HealthLevel Dependent ,054 ,034 ,022(c)
a Not assuming the null hypothesis.b Cannot be computed because the asymptotic standard error equals zero.c Based on chi-square approximation
In our conceptual model hypotheses we put SOE health status (or in other
words, health level) as the dependent variable from the IT Governance maturity
level as the independent variable. Unfortunately, again, we have λ = 0, which
meant that we cannot predict SOE health status based on the knowledge of SOE’s
IT Governance maturity level.

59
We may conclude this subsection, by stating that there is an association
between IT Governance and SOE health level, but we cannot prove that higher IT
Governance will drive SOE health level better,
5.2.3.6 IT Governance Maturity & IT RisksRecall 3.2, IT risks are composed of several more operational concepts.
Here we analyze them one by one, cross tabbing them with IT Governance
maturity level.5.2.3.6.1 IT Governance Maturity & IT Service Delivery ProblemsCrosstab:
CountIT service delivery
problems
TotalNo YesDocumented ITGovernance
Undocumented process 39 33 72Documented process 21 9 30
Total 60 42 102
In this case proportion of not having problem and having it, within each
row is 39:33 (for undocumented IT Governance) and 21:9 (documented).
Simplifying the proportions, we have 1,18:1 and 2,3:1, in which the later
proportion is roughly double of the first. So there is an indication that there are
differences among groups.
Statistical analysis:
Chi-Square Tests
Value dfAsymp. Sig.
(2-sided)Exact Sig.(2-sided)
Exact Sig.(1-sided)
Pearson Chi-Square 2,192(b) 1 ,139ContinuityCorrection(a) 1,587 1 ,208
Likelihood Ratio 2,244 1 ,134Fisher's Exact Test ,186 ,103Linear-by-LinearAssociation 2,170 1 ,141
N of Valid Cases 102a Computed only for a 2x2 tableb 0 cells (,0%) have expected count less than 5. The minimum expected count is 12,35.

60
Assuming H0 : no association and HA : there is an association, the
calculated χ2 value is 2,129, which is smaller than 3,84, the critical value when
d.f.=1 and α = 0,05. In this case, we accept the H0 and conclude that there no
association between IT Governance maturity and IT service delivery problems.5.2.3.6.2 IT Governance Maturity & Inadequate Business Continuity Plan /Disaster Recovery PlanCrosstab:
Count
Inadequate BCP/DRP
TotalNo YesDocumented ITGovernance
Undocumented process 55 17 72Documented process 21 9 30
Total 76 26 102
From the crosstab above, we can see that proportion between having
adequate BCP/DRP (‘no’ column) and inadequate one is 55:17 = 3,24:1 for SOE
with undocumented IT Governance, and 21:9 ≈ 2,3:1 for SOE with documented
IT Governance. The difference is small, so we predict there may be no association
between the variables.
Statistical analysis:
Chi-Square Tests
Value dfAsymp. Sig.
(2-sided)Exact Sig.(2-sided)
Exact Sig.(1-sided)
Pearson Chi-Square ,455(b) 1 ,500ContinuityCorrection(a) ,181 1 ,671
Likelihood Ratio ,446 1 ,504Fisher's Exact Test ,619 ,331Linear-by-LinearAssociation ,451 1 ,502
N of Valid Cases 102a Computed only for a 2x2 tableb 0 cells (,0%) have expected count less than 5. The minimum expected count is 7,65.
Assuming H0 : no association and HA : there is an association, the
calculated χ2 value is 0,455, which is much smaller than 3,84, the critical value
when d.f.=1 and α = 0,05. In this case, we accept the H0 and conclude that there
no association between IT Governance maturity and inadequate BCP/DRP.
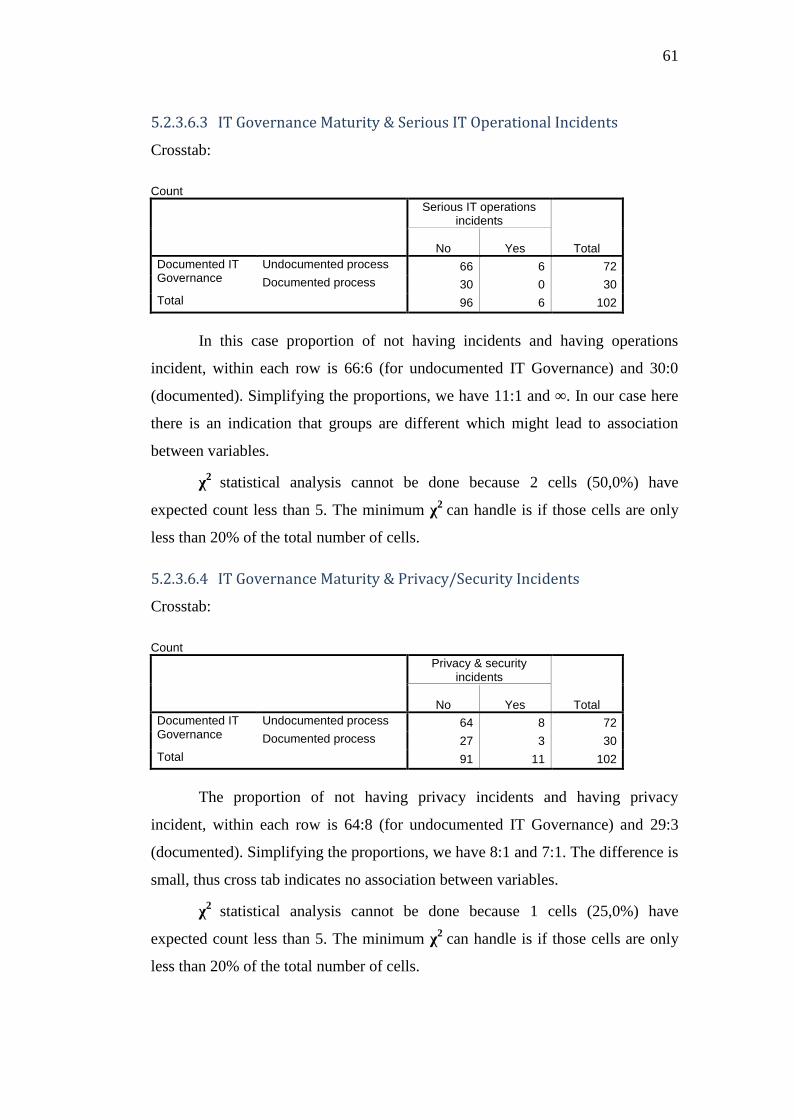
61
5.2.3.6.3 IT Governance Maturity & Serious IT Operational IncidentsCrosstab:
CountSerious IT operations
incidents
TotalNo YesDocumented ITGovernance
Undocumented process 66 6 72Documented process 30 0 30
Total 96 6 102
In this case proportion of not having incidents and having operations
incident, within each row is 66:6 (for undocumented IT Governance) and 30:0
(documented). Simplifying the proportions, we have 11:1 and ∞. In our case here
there is an indication that groups are different which might lead to association
between variables.
χ2 statistical analysis cannot be done because 2 cells (50,0%) have
expected count less than 5. The minimum χ2 can handle is if those cells are only
less than 20% of the total number of cells.5.2.3.6.4 IT Governance Maturity & Privacy/Security IncidentsCrosstab:
CountPrivacy & security
incidents
TotalNo YesDocumented ITGovernance
Undocumented process 64 8 72Documented process 27 3 30
Total 91 11 102
The proportion of not having privacy incidents and having privacy
incident, within each row is 64:8 (for undocumented IT Governance) and 29:3
(documented). Simplifying the proportions, we have 8:1 and 7:1. The difference is
small, thus cross tab indicates no association between variables.
χ2 statistical analysis cannot be done because 1 cells (25,0%) have
expected count less than 5. The minimum χ2 can handle is if those cells are only
less than 20% of the total number of cells.

62
5.2.3.6.5 Conclusion of IT Governance Maturity & IT RiskTo conclude our discussion about the association between IT Governance
maturity and IT risk, we summarize the above analysis in the table below:
Variabels being tested withIT Governance maturitylevel
Crosstab indicatesassociation?
χ2 significant?
IT Service delivery problems Yes No
Inadequate BCP/DRP No No
Serious IT operationsincidentsl
Yes Cannot be calculated
Privacy/security incidents No Cannot be calculated
Table 9. Summary of association between IT Governance maturity level and IT risks
Although there seems to be a slight indication that IT Governance maturity
and IT risk are related, clearly the association is not significant, i.e. association
cannot be proven.
5.2.4 Major Factors Using Multiple Regression
To answer the problem of finding major factors of drivers, enablers &
inhibitors, apart from visually analyzing their respective bar charts, we can also
use statistical test. In the questionnaire, each of those three variables was broken
down into list of factors, where the respondent supplied tick marks on relevant
factors in their organization.
For our purpose, we can assume dichotomous property with two kinds of
values (‘1’ and ‘0’) for each factor. Note also, that those factors contributed to the
value of IT Governance level, which have a ratio scale. Looking up at the
statistical test selection table provided by Leech et.al (2004), if we have a ratio or
interval dependent variable (IT Governance level), with all dichotomous
independent variable (the factors), we can use the multiple regression technique to
find main factors. We shall start with the analysis of IT Governance drivers,5.2.4.1 Major factors of IT Governance driversThe analysis of drivers is shown below. We use stepwise selection which is
the most popular method used. According to Cooper & Schindler (2006), it
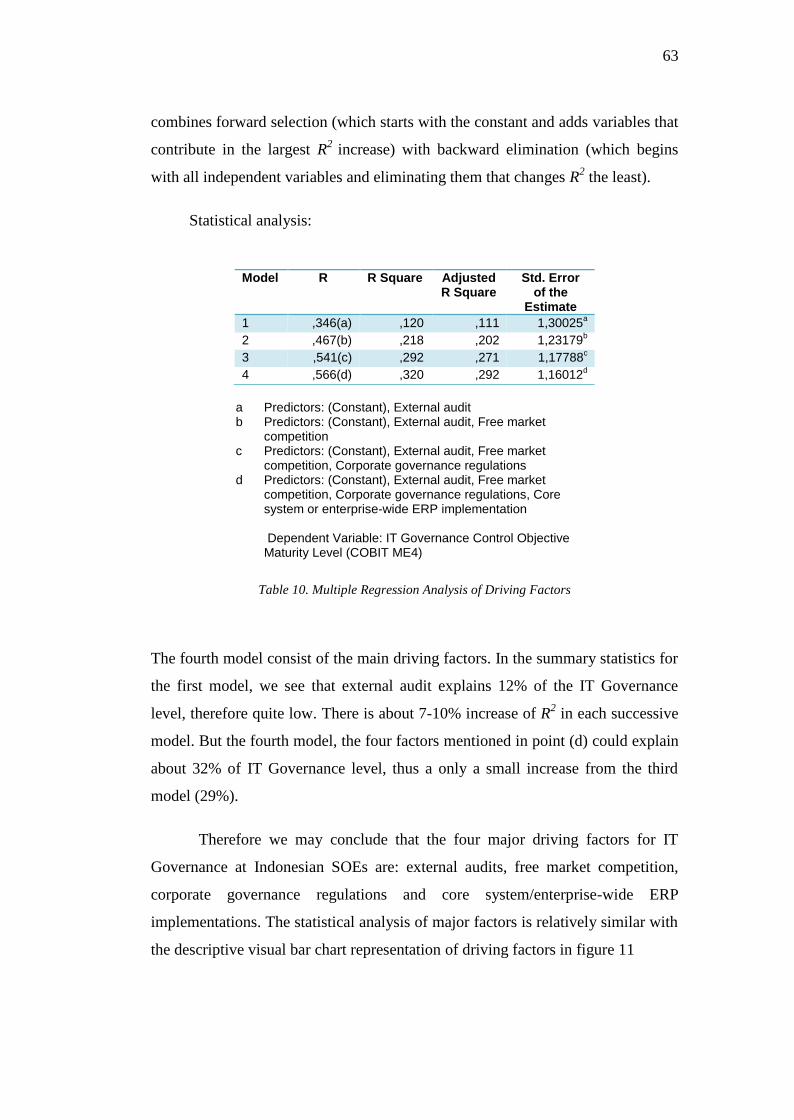
63
combines forward selection (which starts with the constant and adds variables that
contribute in the largest R2 increase) with backward elimination (which begins
with all independent variables and eliminating them that changes R2 the least).
Statistical analysis:
a Predictors: (Constant), External auditb Predictors: (Constant), External audit, Free market
competitionc Predictors: (Constant), External audit, Free market
competition, Corporate governance regulationsd Predictors: (Constant), External audit, Free market
competition, Corporate governance regulations, Coresystem or enterprise-wide ERP implementation
Dependent Variable: IT Governance Control ObjectiveMaturity Level (COBIT ME4)
Table 10. Multiple Regression Analysis of Driving Factors
The fourth model consist of the main driving factors. In the summary statistics for
the first model, we see that external audit explains 12% of the IT Governance
level, therefore quite low. There is about 7-10% increase of R2 in each successive
model. But the fourth model, the four factors mentioned in point (d) could explain
about 32% of IT Governance level, thus a only a small increase from the third
model (29%).
Therefore we may conclude that the four major driving factors for IT
Governance at Indonesian SOEs are: external audits, free market competition,
corporate governance regulations and core system/enterprise-wide ERP
implementations. The statistical analysis of major factors is relatively similar with
the descriptive visual bar chart representation of driving factors in figure 11
Model R R Square AdjustedR Square
Std. Errorof the
Estimate1 ,346(a) ,120 ,111 1,30025a
2 ,467(b) ,218 ,202 1,23179b
3 ,541(c) ,292 ,271 1,17788c
4 ,566(d) ,320 ,292 1,16012d
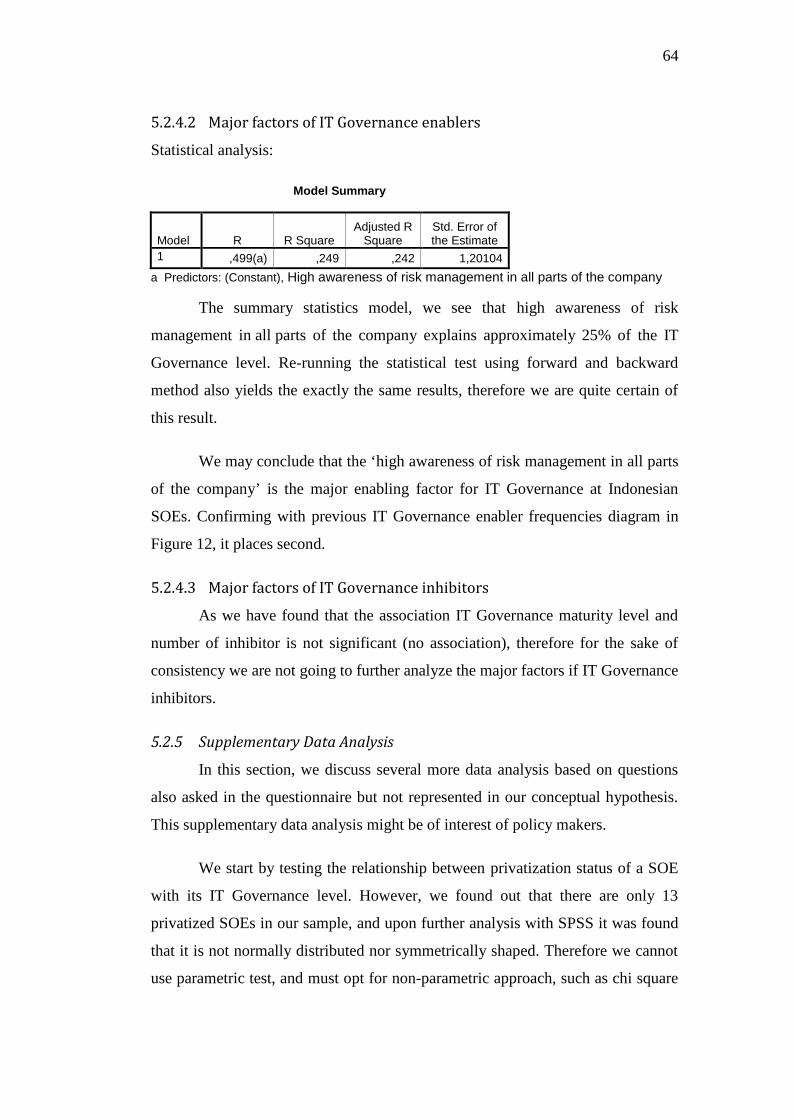
64
5.2.4.2 Major factors of IT Governance enablersStatistical analysis:
Model Summary
Model R R SquareAdjusted R
SquareStd. Error ofthe Estimate
1 ,499(a) ,249 ,242 1,20104a Predictors: (Constant), High awareness of risk management in all parts of the company
The summary statistics model, we see that high awareness of risk
management in all parts of the company explains approximately 25% of the IT
Governance level. Re-running the statistical test using forward and backward
method also yields the exactly the same results, therefore we are quite certain of
this result.
We may conclude that the ‘high awareness of risk management in all parts
of the company’ is the major enabling factor for IT Governance at Indonesian
SOEs. Confirming with previous IT Governance enabler frequencies diagram in
Figure 12, it places second.5.2.4.3 Major factors of IT Governance inhibitorsAs we have found that the association IT Governance maturity level and
number of inhibitor is not significant (no association), therefore for the sake of
consistency we are not going to further analyze the major factors if IT Governance
inhibitors.
5.2.5 Supplementary Data Analysis
In this section, we discuss several more data analysis based on questions
also asked in the questionnaire but not represented in our conceptual hypothesis.
This supplementary data analysis might be of interest of policy makers.
We start by testing the relationship between privatization status of a SOE
with its IT Governance level. However, we found out that there are only 13
privatized SOEs in our sample, and upon further analysis with SPSS it was found
that it is not normally distributed nor symmetrically shaped. Therefore we cannot
use parametric test, and must opt for non-parametric approach, such as chi square

65
(χ2). Chi square analysis can be conducted to test association between to two
nominal variables (Siegel & Castellan, 1988).
This requires recoding of IT Governance level, in this case, dividing it into
two groups: documented IT Governance process (upper half of the IT Governance
level, ≥3) and undocumented IT Governance process.(where IT Governance level
< 3). The crosstabs between privatization status and documentation status is
presented below, along with its chi square (χ2) test.
Documented IT Governance Total
Undocumentedprocess
Documentedprocess
Privatizationstatus
Unprivatized 69 20 89
Privatized 3 10 13Total 72 30 102
Value Asymp.Std.
Error(a)
Approx.T(b)
Approx.Sig.
Nominal byNominal
Phi ,399 ,000Cramer's V ,399 ,000Contingency Coefficient ,370 ,000
N of Valid Cases 102
Table 11. Crosstab between privatization status vs. IT Governance documentation status, alongwith its corresponding χ2 test.
The crosstabs somehow indicates differences between privatized and
unprivatized companies, where a larger portion of privatized SOEs have better IT
Governance, indicated by their well documented IT Governance process. The
advance statistical analysis, using contingency coefficient C, which is a measure
of association based on chi-square. The value ranges between zero and 1, with
zero indicating no association between the row and column variables and values
close to 1 indicating a high degree of association between the variables.
The contingency coefficient value is 0,370, although not so strong, it is
still significant. Although we cannot conclude that privatization causes better IT
Governance, we can suggest that privatization can be associated with the
improvement of IT Governance level.

66
CHAPTER 6
ANALYSIS OF RESEARCH RESULTS
6.1 Summary of Quantitative Data Analysis
For ease of analysis, we first construct the summary of the quantitative
data analysis in form of a table. The result is shown below:
No. Associationhypothesis
Relevanttheory
Crosstabindicates
association?
χ2
significant?Φ indicatesassociation?
Directionsignificant?
1. Number ofdrivers and ITGovernancematurity
StandardsAustralia,2005
Yes Yes moderate No
2. Number ofenabler and ITGovernancematurity
Luftman,Pap & Brier(1999)
Yes Yes More thanmoderate
No
3. Number ofinhibitors andIT Governancematurity
Luftman,Pap & Brier(1999)
No No N/A N/A
4. IT Governancematurity &value from ITinvestment
ITGI (2003)and VanGrembergen,De Haes &Guldentops(2004)
Yes Yes Rather strong Yes
5. IT Governancematurity & ITrisk
ITGI (2003)and VanGrembergen,De Haes &Guldentops(2004)
Inconclusive No or notcannot becalculated
N/A N/A
6. IT Governance& bottom-linecompany
(Weill &Ross, 2005)
Yes Yes Less thanmoderate
No

67
performance
Table 12. Summary of associative test data analysis
In addition, we also have found that the major IT Governance drivers are:
• external audits,
• free market competition,
• corporate governance regulations and
• core system/enterprise-wide ERP implementations
The only major IT Governance enabler proven is ‘high awareness of risk
management amongst staff’. However, we did not find any association between
number of IT Governance inhibitors with IT Governance maturity level, therefore
we did not conduct any statistical test to find major factors of it.
6.2 Summary of our conceptual model
To allow consistency with previous conceptual model hypothesis, we shall
now also present our final conceptual model in visual form, as depicted below:
Figure 16. Final conceptual model
68
6.3 Interpreting research results
While the number of drivers and number of enablers clearly associates
with IT Governance maturity level, we fail to prove their directional association.
As statistics are mathematical tools, I believe that it cannot be relied on alone for
judgment. I still believe, the results as shown by the crosstab analysis, can still be
interpreted as at least a sign that number of drivers and number of enabler has a
positive effect on IT Governance. On the other hand, the inhibiting factors
actually do not play role at determining IT Governance maturity, their forces are
simply insignificant.
One interesting thing is that our research definitely showed that IT
Governance has an impact on how IT investment is felt by the organization. The
better the IT Governance in the SOE, the value from IT investment is being felt
stronger by the organization. While we did not find prove that better IT
Governance leads to better SOE’s health status/level (as the bottom-line
performance indicator), our research clearly shows association between them.
6.4 Implications for SOEs in Indonesia
Following Becker, Bryman & Sempik (2006) paper, in this paper we can suggest
to the policy maker, in this case Ministry of State Owned Enterprise, that probably
it is best to focus on putting as much drivers (read: pressures) on SOEs, which for
example in practice privatization puts plenty of pressures. In turn, this will
hopefully increase the IT Governance maturity level of the organization.
However, because higher IT Governance does lead to better value attained
(or at least being felt) from IT investment, there is nothing wrong in enforcing
SOEs to have Good IT Governance in place. Though the directional association
was not proven, still there is a strong association between Good IT Governance
and bottom-line SOE’s performance (SOE health status). Chances are
implementing good IT Governance may impact SOE’s health in a positive
manner.
69
For the SOEs themselves, to increase IT Governance maturity level
indirectly, they may want to consider increasing the risk management program
throughout the whole organization, as it will become the enabling factor of good
IT Governance later. Although not proven in the statistical test, based solely on
descriptive analysis, I believe that awareness of IT benefits from top executive
also somehow play role as one of the major enabling factor of good IT
Governance.
6.5 Agreement with Other Studies
Post data processing, we took the liberty again to examine whether any
similarities exist with other studies on IT Governance drivers or motivationis.
Jafaar & Jordan (2009) also indicated in their case study at a government-linked
company in Malaysia, that IT investment issue is one of the reasons for having IT
Governance. (matched with ours: ‘accountability of huge IT investments’).
While explaining the differences between IT Governance in public and
private sector, Campbell et.al. (2009) mentioned that market influences IT
Governance in private sector. (quite similar with ours: ‘free market competition’)
Robb & Parent (2008) in their study of IT Goverance in two financial
mutuals, one in Australia and one in Canada, denoted important contextual
differences due to countrie’s regulatory environment. In other words, they imply
that regulations help shaped IT Governance. Closer look at some of the drivers
that we found, such as ‘transparency requirement of Public Information Access
Act’ and ‘industry sector regulations’ (as 7 of the respondents were banks),
definitely also shaped the IT Governance at SOEs. Nothing is more evident than
central bank’s Bank of Indonesia’s Regulation (Peraturan Bank Indonesia)
no.9/15/PBI/2007 regarding ‘Implementation of Risk Management in the Use of
Information Technology by Banks’ which explicitly mandates many IT
Governance practices to be conducted by banks (Bank Indonesia, 2007).
Although not truly the same, a survey by Ali & Green (2005) showed that
IT Governance effectiveness is positively related with the involvement of senior
70
management, ethics/culture of compliance in IT, and corporate communication
systems. The last one, also mimics the findings of Willson & Pollard (2009) IT
Governance case study on an Australian organization, where it encourages
communition and collaboration betweem business & IT. Our findings of IT
Governance enablers have some similarities, which corresponds to Ali & Green’s
(2005) findings: ‘awaremess of IT benefits from top executives’, ‘high level of
risk management amongst staff’. Note also, we found that ‘sorts of
communication problems’ was among the top three inhibitors.
Additionally, Willson & Pollard (2009) also mentioned several IT
governance contigents that are quite similar to our findings such as historical
context (‘previous Y2K problem’ in our finding is in past form). Also, they
mentioned that IT Governance is also influenced by their performance
management system implemented across variety of leves in the company. This is
similar to our finding that ‘the use of objective and performance based
management systems’ as the third ranked IT Governance enablers.
It seems that the top four IT Governance drivers we found in this research
is not similar to the latest ITGI (2011) research where ensuring IT functionality
aligned with business need ranks as the top driver, and second is the issue to
manage (IT) costs. Probably these differences occur because the sampling frame
we use are different than ITGI (2011) used.
We found the fact that association between IT Governance maturity level
and bottom-line SOE performance. This fact is somehow reflected also in the
ITGI (2011) research where 37.3 percent of respondents mentioned improved
delivery of business objectives as an outcome of IT Governance.
Lunardi et.al. (2009) studed the financial impact of IT Governance
mechanisms adoption in Brazil. They surveyed companies listed at Sào Paulo
Stock Exchange (BOVESPA). They measured each of the companies’ financial
performance such as profitability measures, i.e. ROE, ROA and PM (profit
margins). They found that companies which have adopted IT governance
practices improved their performance when compared to the control group,
71
especially regarding about profitability measures. Furthermore, they found that
effects of IT governance mechanisms adoption on financial performance are
stronger in the year following adoption than in the year which IT governance
was adopted.
Marrone et.al (2010) conducted an international survey of 113 firms using
COBIT. They examined the users satisfaction, impact on Business-IT alignment
and perception on the benefits realized. Findins indicated that companies that
have achieved higher implementation levels of IT Governance experienced high
positive impacts on their Business-IT alignment. They also proved that different
levels of maturity show that the higher the maturity levels the greater the benefits
realized.
Another striking similarity was also explained by Milne & Bowles (2009),
where they surveyed 389 organizations in the United States, United Kingdom and
Australia. Most of the respondents were IT executives. They found that IT
Governance maturity is linked to higher performance of the organization. The
higher the maturity is, the higher the performance.
Those studies, ITGI (2011), Lunardi et.al (2009), Marrone et.al. (2010)
and Milne & Bowles (2009) study, supports our finding that the better the IT
Governance maturity level, so is the bottomline corporate perforemance (SOE
health status), and the value felt from IT investment increased also.
Quite interesting that a research on Malaysian senior executives (Lin,
Arshad, Haron, Yap, Yusoff, & Mohamed, 2010) showed that business managers
appears to exhibit awareness but IT Governance is partially practiced. There was
also a positive correlation between awareness and IT Governance practice. The
keyword that I would like to underline as the similarities here is how IT awareness
(whatever angle it sees) relates with IT Governance practice.

72
CHAPTER 7
CONCLUSION
As van Grembergen (2004) of University Antwerpen School of
Management defines, IT Governance is the organizational capacity exercised by
the board, executive management and IT management to control the formulation
and implementation of IT strategy and in this way ensure fusion of business with
IT. It consists of leadership, organizational structures, and processes that ensure
that the organization’s IT sustains and extends the organizational strategy and
objective.
The objective of this research is to find what drives these organizations to
have good IT Governance, which we found to be: external audits, free market
competition, corporate governance regulations and core system/enterprise-wide
ERP implementations. The IT Governance enabler proven is ‘high awareness of
risk management amongst staff. Also, the larger the number of the enablers, the
better the IT Governance. Inhibiting factors of IT Governance do not play part in
influencing IT Governance maturity level.
Our measurement showed that the average IT Governance control
objective maturity of domain ME4 ‘Provide IT Governance’ at Indonesian SOEs
is 2,22, with Strategic Alighment as the least practiced (maturity level was 2,06)
and Performance Management practices as the most used (maturity level of 2,39).
It is a pitty that SOEs pay the least attention on Strategic Alignment practices.
While we measured IT Governance maturity through questioning of ME4
‘Provide IT Governance’ control objectives, we believe that the results cannot be
used to judge higher IT Governance level is always better. We believe that
73
companies will try to find and optimum level of IT Governance maturity.
Debreceny & Gray (2009) also held the same view as ours in this matter.
What is interesting is that in this sector, the implementation of IT
governance is the answer to organization need to ensure IT value creation and
may influence bottom-line SOE’s performance. However, IT risks are somehow
not related to IT Governance, or at least we are unable to prove it in this research.

74
REFERENCE
Ali, Syaiful & Peter Green (2005). ‘Determinants of Effective Information
Technology Governance: A Study of IT Intensity’ in Proceedings of
International IT Governance Conference 2005, Auckland, New Zealand.
Babbie, Earl (1998). The Practice of Social Research, 8th edition. Wadsworth
Publishing Company, Belmont, CA.
Badan Pusat Statistik (2009). Peraturan Kepala Badan Pusat Statistik Tentang
Klasifikasi Baku Lapangan Usaha Indonesia. Badan Pusat Statistik, Jakarta.
Bank Indonesia (2007). Peraturan Bank Indonesia no.9/15/PBI/2007 tentang
Penerapan Manajemen Resiko Dalam Penggunssn Teknologi Informasi oleh
Bank Umum. Bank Indonesia, Jakarta.
Becker, Saul, Alan Bryman & Joe Sempik (2006). Defining ‘Quality’ in Social
Policy Research: Views, perceptions and a framework for discussion, Social
Policy Association, Lavenham, Suffolk. Also available at htpp://www.social-
policy.com.
Benbasat, Izak, David K. Goldstein & Mellisa Mead (1987). ‘The Case Research
Strategy in Studies of Information Systems’ in MIS Quarterly, Vol. 11, No. 3,
September, 1987.
Boland, Richard J. Jr. (1991). ‘Information Systems Use as a Hermeneutic Process’
in H.E. Nissen, H.K. Klein & R. A. Hirschheim (eds.) Information Systems
Research: Contemporary Approaches and Emergent Traditions. International
Federation of Information Processing Working Group 8.2. North-Holland,
Amsterdam.
Brown, C. V., & Magill, S. L. (1994). ‘Alignment of the IS function with the
enterprise: Toward a model of antecedents’, in MIS Quarterly, 18(4).
Campbell, John, Craig McDonald & Tsholofelo Sethibe (2009). ‘Public and Private
75
Sector IT Governance: Identifying Contextual Differences’ in Ausralasian
Journal of Information Systems, Vol.16 no.2.
Cooper, Donald R. & Pamela S. Schindler (2006). Business Research Methods, 9th
ed. McGraw-Hill, New York.
Csaszar, Felipe, Eric Clemons (2006). Governance of the IT Function: Valuing
Agility and Quality of Training, Cooperation and Communications. In
Proceedings of the 39th Hawaii International Conference on System Sciences.
De Haes, Steven & Wim Van Grembergen (2005). ‘IT Governance Structures,
Processes and Relational Mechanisms: Achieving IT/Business Alignment in a
Major Belgian Financial Group’, in Proceedings of the 38th Hawaii
International Conference on System Sciences.
De Haes, Steven & Wim Van Grembergen (2006). ‘Information Technology
Governance Best Practices in Belgian Organisations’ in Proceedings of the 39th
Hawaii International Conference on System Sciences.
De Haes, Steven & Wim Van Grembergen (2008). ‘An Exploratory Study into the
Design of an IT Governance Minimum Baseline through Delphi Research’ in
Communications of the Association for Information Systems: Vol. 22, Article
24. Available at: http://aisel.aisnet.org/cais/vol22/iss1/24
Debreceny, Roger & Glen L. Gray (2009). ‘IT Governance and Process Maturity’
in Information Systems Audit & Control Association Journal, Vol.3, 2009.
Dahlberg, Tomi, Hannu Kivijärvi, (2006). An Integrated Framework for IT
Governance and the Development and Validation of an Assessment Instrument.
In Proceedings of the 39th Hawaii International Conference on System
Sciences.
Field, Andy (2009). Discovering Statistics Using SPSS (Introducing Statistical
Methods). Sage Publications, Los Angles.
Glaser, B. & A. Strauss. (1967). The Discovery of Grounded Theory. Aldine ,
Chicago.
Gottschalk, P. (2003). ‘Managing IT functions’. In W. Van Grembergen (Ed.),
Strategies for Information Technology Governance. Hershey, PA: Idea Group
Publishing.
76
Hair, Joseph F. Jr., Arthur H. Money, Phillip Siamouel, Mike Page (2007).
Research Methods for Business. John Wiley & Sons, Chichester, West Sussex.
Harris, Shon. (2003). All In One CISSP Certification Exam Guide. New York:
McGraw-Hill / Osborne.
Harvey, L. J., & Myers, M. D. (1995). Scholarship and research: the contribution of
ethnography to bridging the gap. In Information, Technology & People. MCB
University Press.
Henderson, J.C. and Venkatraman, N. (1993), ‘Strategic Alignment: Leveraging
Information Technology for Transforming Organization’, in IBM Systems
Journal, 32(1)
Hodgkinson, S.I. (1996). ‘The role of corporate IT function in the federal IT
organization’, in M.J. Earl, ed., Information Management: The Organizational
Dimensions, Oxford University Press, New York.
ITGI, (2003). ‘Board Briefing in IT Governance, 2nd edition’, IT Governance
Institute, available at http://www.itgi.org.
ITGI, (2006). ‘Enterprise Value: Governance of IT Investments, The Val IT
Framework’, IT Governance Institute, available at http://www.itgi.org.
ITGI, (2006b). ‘IT Governance Global Status Report – 2006’, IT Governance
Institute, available at http://www.itgi.org.
ITGI, (2007). ‘COBIT 4.1’, IT Governance Institute, available at
http://www.itgi.org.
ITGI, (2008). ‘IT Governance Global Status Report – 2008’, IT Governance
Institute, available at http://www.itgi.org.
ITGI, (2011). ‘IT Governance Global Status Report – 2011’, IT Governance
Institute, available at http://www.itgi.org.
Jafaar, Noor Ismawati & Ernest Jordan (2009). ‘Information Technology
Governance (ITG) Practices and Accountability of Informatioin Technology
Projects – A Case Study in Malaysian Government-Linked Company’ in Pacific
Asia Conference on Information Systems (PACIS) 2009 Proceeding,
Association of Information Systems, 2009. Available at
http://aisel.aisnet.org/pacis2009/31.

77
Jeffery, M. and I. Leliveld (2004). ‘Best Practices in IT Portfolio Management’, in
MIT Sloan Management Review, Vol.45 No.3, Spring 2004.
Kan, A.H.G. Rinnooy, (2004). ‘IT Governance and Corporate Governance at ING’,
in Information Systems Control Journal, Vol. 2.
Kementrian BUMN (2010). Official website http://www.bumn.go.id.
Leech, Nancy L., Karen C. Barrett, George A. Morgan (2004). SPSS for
Intermediary Statistics: Use and Interpretation. Routledge Academic.
Lewis, K. (1985) Social anthropology in perspective, Cambridge University Press,
Cambridge.
Lin, Y. M., Arshad, N. H., Haron, H., Yap, B. W., Yusoff, M., & Mohamed, A.
(2010, vol 5 no.1). IT Governance Awarness and Practices: an Insight from
Malaysian Senior Management Perspective. Journal of Business Systems,
Governance & Ethics .
Luftman, J., (2000). ‘Assessing Business-IT Alignment Maturity’, in
Communications of the Association for Information Systems. Vol. 4, Article
14, December 2000.
Luftman, J., (1996). Competing in the Information Age – Strategic Alignment in
Practice, ed. by J. Luftman, Oxford University Press, 1996.
Luftman, Jerry N., Raymond Papp and Tom Brier, (1999), ‘Enablers and Inhibitors
of Business-IT Alignment’, in Communications of the Association for
Information Systems. Vol. 1, Article 11.
Luftman, Jerry N., Paul R Lewis, Scott H Oldach, (1993). ‘Transforming the
enterprise: The alignment of business and information technology’ in IBM
Systems Journal; Vol. 32, No. 1, 1993
Lunardi, Guilherme Lerch, Joào Luiz Becker & Antonio Carlos G. Maçada (2009).
‘The Financial Impact of IT Governance Mechanism Adoption: an Empirical
Analysis with Brazilian Firms’ in Proceedings of the 42nd Hawaii International
Conference on System Sciences.
Marrone, Mauricio, Lukas Hoffman & Lutz M. Kolbe (2010) ‘IT Executives’
Perception of COBIT: Satisfaction, Business-IT Alignment and Benefits’ in

78
Proceedings of the Sixteenth Americas Conference on Information Systems,
Lima, Peru, August 12-15, 2010.
Milne, Kurt and Adrian Bowles (2009). How IT Governance Drives Improved
Performance. IT Process Institute. Available at http://www.itpi.org
Ministry of State Owned Enterprises (2002). Minister of State Owned Enterprises
Decree. No.Kep-100/MBU/2002 on Evaluation of Health Level of SOEs.
Jakarta.
Neuman, W. Lawrence, (2003). Social Research Methods: Qualitative and
Quantitative Approaches, 5th edition, Allyn and Bacon, Boston, Massachusetts.
Peterson, Ryan (2001). ‘Configurations and Coordination for Global Information
Technology Governance: Complex Designs in a Transnational European
Context’ in Proceedings of the 34th Hawaii International Conference on System
Sciences.
Peterson, Ryan (2004), ‘Integration Strategies and Tactics for Information
Technology Governance’, In W. Van Grembergen (Ed.), Strategies for
Information Technology Governance. Hershey, PA: Idea Group Publishing.
Peterson, Ryan (2004b), ‘Crafting Information Technology Governance’, In
Information Systems Management; Vol.21 no.4, Fall 2004.
Rau, Kenneth G, (2004). ‘Effective Governance of IT: Design Objectives, Roles
and Relationships’, Information Systems Management; Fall 2004.
Ribbers, Pieter M.A., Ryan R. Peterson & Marylin M. Parker, (2002). ‘Designing
Information Technology Governance Processes: Diagnosing Contemporary
Practises and Competing Theories’, in Proceedings of the 35the Hawaii
International Conference on System Sciences (HICCS), 2002.
Robb, Alistair & Michael Parent (2008) ‘Research Note: Understanding IT
Governance: A Case of Two Financial Mutuals’ in Felix B. Tan (ed.), Journal of
Global Information Technology, Volume 17, Issue 3, IGI Global, Hersey, PA.
Rockart, J. F., Earl, M., & Ross, J. W. (1996). ‘Eight imperatives for the new IT
organization’, in Sloan Management Review, 38(1).
Saha, Pallab, (2005), ‘IT Governance Survey: Knowing, But Not Doing’, in MIS
Asia, December 2005.
79
Schwarz, A. & R. Hirschheim, (2003). ‘An extended platform logic perspective of
IT governance: managing perceptions and activities of IT’ in Journal of
Strategic Information Systems, Vol.12 (2003) 129–166
Sekaran, Uma (1992), Research Methods for Business: A Skill Buuilding
Approach, 2nd ed, John Wiley & Sons, Inc., New York.
Siegel, Sidney & N. John Castellan, Jr. (1988). Nonparametric Statistics for the
Behavioral Sciencee, 2nd ed. McGraw-Hill Book Company, New York.
Simonsonn, Mårten, Pontus Johnson & Hanna Wijkstörm (2007) ‘Model-Based IT
Governance Maturity Assessments With COBIT’ in Proceeding of European
Conference on Information Systems (ECIS) 2007, Switzerland.
Standards Australia (2005). Corporate governance of information &
communications technology, AS-8015:2005, Sydney, New South Wales.
Tuttle, Brad & Scott D. Vandervelde (2007). ‘An empirical examination of CobiT
as an internal control framework for information technology’ in International
Journal of Accounting Information Systems, vol.8, Elsevier.
Van Grembergen, (2004). ‘Strategies for Information Technology Governance: An
Interview with Wim Van Grembergen’, in Information Management; 17, 1/2,
Spring 2004.
Van Grembergen, Wim, Steven De Haes & Erik Guldentops (2004), ‘Structures,
Processes and Relational Mechanisms for IT Governance’. In W. Van
Grembergen (Ed.), Strategies for Information Technology Governance.
Hershey, PA: Idea Group Publishing.
Van Grembergen, Wim & Steven De Haes (2008), Implementing Information
Technology Governance, IGI Publishing, Hersey, Pennsylvania.
Van Zanten, Wim (1994). Statistika untuk Ilmu-ilmu Sosial, edisi kedua. Gramedia
Pustaka Utama, Jakarta.
Weill, P. and J. Ross, (2005). ‘A Matrixed Approach to Designing IT Governance’,
in MIT Sloan Management Reviesw, Vol.46 No.2, Winter 2005.
Weill, P. and J. Ross, (2004). IT Governance: How Top Performers Manage IT
Decision Rights for Superior Results, Harvard Business School Press, Boston.
Willson, Phyl & Carol Pollard (2009). ‘Exploring IT Governance in Theory and

80
Practice in a Large Multi-National Organisation in Australia’ in Information
Systems Management, vol.26, Taylor & Francis Group.
Yin, R. (1994). Case study research: design and methods, 2nd edition, Sage
Publications, Thousand Oaks.

81
APPENDIX A
SURVEY QUESTIONNAIRE 2010

82
APPENDIX B
SURVEY QUESTIONNAIRE 2011
Recommended