Monthly Market Update (India) – August 2017 |iFAST Research

Monthly Market Update (India) – August 2017 |iFAST Research
2017 2017 2016 P/E P/E P/E Earnings Growth
Earnings Growth
MTD YTD Return (%) Yr 2017 Yr 2018 Yr 2019 2017 (%) 2018 (%)
Asia ex Japan (MSCI Asia ex Japan) 4.90% 27.55% 2.90% 14.1 12.7 11.5 23.50% 11.20%
Emerging Markets (MSCI EM) 5.48% 23.65% 8.60% 13.4 12.0 10.8 24.10% 12.30%
Europe (Stoxx 600) -0.40% 4.55% -1.20% 15.9 14.5 13.3 9.90% 9.40%
Japan (Nikkei 225) -0.54% 4.24% 0.40% 17.1 15.9 14.6 10.60% 7.80%
USA (S&P 500) 1.93% 10.34% 9.50% 19.0 17.1 15.5 9.70% 11.70%
Brazil (IBOV) 4.80% 9.45% 38.90% 12.5 11.0 9.0 32.40% 12.90%
China (HS Mainland 100) 6.47% 23.22% -1.30% 10.6 9.6 8.6 13.70% 11.10%
Hong Kong (HSI) 6.05% 24.20% 0.40% 12.9 11.8 10.8 14.60% 9.10%
India (SENSEX) 5.15% 22.12% 1.90% 20.1 16.2 14.2 12.20% 23.50%
Indonesia (JCI) 0.19% 10.27% 15.30% 16.7 14.6 13.4 14.90% 14.60%
Malaysia (KLCI) -0.21% 7.21% -3.00% 16.3 15.4 14.3 8.00% 5.90%
Russia (RTSI$) 0.62% -12.60% 52.20% 5.9 5.3 5.0 13.50% 11.10%
Singapore (STI) 3.19% 15.58% -0.10% 15.1 14.1 13.2 6.50% 7.30%
South Korea (KOSPI) 0.46% 18.57% 3.30% 10.3 9.6 9.0 32.60% 8.00%
Taiwan (Taiwan Weighted) 0.31% 12.69% 11.00% 14.9 13.8 12.9 13.80% 7.90%
Thailand (SET Index) 0.09% 2.15% 19.80% 15.6 14.1 12.8 5.20% 10.60%
*Returns are as at 31 July 2017. Source: Bloomberg, iFAST Compilations All returns are in respective local currency terms and MSCI Index returns are in USD
MARKETS ACROSS THE GLOBE

Monthly Market Update (India) – August 2017 |iFAST Research
Trade (June’17)
During the month of June 2017, India’s exports recorded a
growth of 4.39% year-on-year to USD 23.56 billion.
Imports grew by 19.01% and to USD 36.52 billion. Overall
trade deficit for June 2017 is estimated at USD 12.96
billion as against a deficit of USD 8.12 billion in June 2016.
Taking merchandise and services together, overall trade
deficit for April-June 2017-18 is estimated at USD 28.6
billion as compared to USD 8.0 billion during April-June
2016-17.
Industrial Production (May‘17)
India’s May 2017 IIP data came in lower at 1.7% below
estimates of 2.0% and lower than April’s data of 2.8%. The
decline in IIP is attributed to slowdown in manufacturing
activity post demonetisation and before the introduction
of GST. Mining, Manufacturing and Electricity sectors
recorded yearly growth rates of -0.9%, 1.2% and 8.7%
respectively.
As per use based classification, Basic Goods, Capital Goods
and Intermediate Goods recorded growth rates of 3.4%, -
3.9% and 0.7% respectively in May 2017. Consumer
durables and non-durables grew by -4.5% and 7.9%
respectively.
The slowdown in IIP figures is attributed to negative
growth rates recorded in manufacture of beverages,
motor vehicles and electrical equipment. Declining IIP
figures can slow down the pace of GDP growth during the
year.
Markets & Valuations
(As on July 24, 2017)
The benchmark Index (Sensex) was at 32,245.87.
Estimated PE & earnings growth for BSE Sensex.
Inflation (June’17)
Consumer price Index (CPI)
India’s Consumer Price Index (CPI) for the month of June
came in at 1.54% vis-à-vis 2.18% for the month of May.
The biggest contributor to this fall was the Food and
Beverages prices which stood at -1.17% and within this
category, vegetables and Pulses and Products declined by
-16.53% and -21.92% respectively.
This is the lowest inflation number witnessed since 2012
when the new series of CPI was released. This inflation
number is also way below the RBI target of 4%.
Wholesale price Index (WPI)
India’s Wholesale price Index (WPI) declined to 0.90%
year-on-year for the month of June 2017 as compared to
2.17% in the previous month and -0.09% during the
corresponding period month of the previous year.
A look into the numbers revealed the index for Fuel &
power group declined by 1.2% due to lower prices of LPG,
Naptha and ATF.
The index for manufactured products declined by 0.1% in
June 2017. On the other hand, the index for primary
articles rose marginally by 0.3%.
FY 2018 FY 2019 FY 2020
Price/Earnings 20.15 16.42 14.25
Earnings Growth 17.25% 22.74% 15.22%
ECONOMIC INDICATORS

Monthly Market Update (India) – August 2017 |iFAST Research
As on July 24, 2017, the benchmark Index (Sensex) stood at 32,245.87. The earnings estimates for
HDFC bank, the highest weighted stock in the index stood at 18.37% and 18.55% for FY18 and
FY19. Housing Development Finance Corp Ltd, the next stock with the highest weightage, has an
earnings estimate of 14.62% and 20.50% for FY18 and FY19 respectively. The top performers in
the index during the month were Bharti Airtel (15%), Wipro Ltd (14%) and Reliance Industries
(13%) while the top losers included ITC (-6%) HDFC (-1%) and Bajaj Auto (0.08%).
Our view
Indian markets rebounded in the month of July and the benchmark indices that is S&P BSE
Sensex and Nifty 50 registered a return of 5.15% and 5.84% respectively. The markets were
in euphoria mode with the Nifty 50 touching the psychological mark of 10,000 for the first
time. The positive sentiments were on account of the successful implementation of GST,
good monsoons, better than expected corporate earnings and the continuing upbeat
domestic inflows into the market. The market participants were also expecting a rate cut in
the Third Bi-Monthly Monetary policy review that was to be held in August and this was on
the back of inflation falling below the RBI target of 4%.
Today, with our benchmark indices touching an all-time high, the question we are asked is:
Are you still bullish on India”?
The answer is in the affirmative and it is wise to remember that it is only a handful of
stocks that are fuelling this rally. While we thought that India Inc’s earnings would
improve, demonetization, GST reform and cleaning up the mess in the banking system
has led to concerns on the recovery of earnings in the near future. However, we believe
that the long term impact of these reforms would be positive for India Inc and we will
start to see the denominator of the PE ratio finally taking off.
We maintain status quo on our Strategy Report released in March 2017 and would advise
our investors to continue taking exposure into the market via the SIP or the STP route.
We are not experts to predict the next correction but we have the confidence that the
robust DII inflows will bring stability if the market decides to go into a roller coaster ride.
Source: Bloomberg, iFAST Compilations. All returns are in respective local currency terms
4.43
5.09
5.15
5.84
0 2 4 6 8
BSE SMALL CAP
BSE MID CAP
BSE Sensex
Nifty Index
Broader Indices (Performance % in July 2017)*
-3.21 0.03
2.84 4.41 4.51
5.25 6.15
6.76 7.00
7.48 8.02
9.25
-5.00 0.00 5.00 10.00
BSE FMCG
BSE CD
BSE AUTO
BSE IT
BSE Realty
BSE Bankex
Sectoral Indices (Performance % in July 2017)*
EQUITY MARKET

Monthly Market Update (India) – August 2017 |iFAST Research
Our view
We saw the 10 year G-Sec yield moving in a southward direction from 6.56% by the
beginning of the month to 6.47% by July 31, 2017. The biggest positive for the market
was the decline in inflation (CPI) which came in lower at 1.54% and this was way below
the RBI target of 4%. This gave the market participants hope that RBI would go in for a
rate cut in the policy review meeting that was to be held in August.
In the Third Monetary Policy Statement, 2017-18, the Monetary Policy Committee
(MPC) cut the policy rate by 25 basis points in line with market expectations
continuing to maintain a neutral stance on monetary policy. The reason for the easing
in the policy rate today was on account of the fact that the upside risks to inflation had
either reduced or not materialised due to the following: (1) The baseline path of
headline inflation excluding the HRA impact has fallen below the projection made in
June to a little above 4% by Q4,(2) Inflation excluding food and fuel has fallen
significantly over the past three months and (3) The roll-out of the GST has been
smooth and the monsoon has been normal.
However, the MPC continued to be neutral as far as the policy stance is concerned
because they still believe that inflation is going to show an upward movement from
here.
We maintain status quo on our recommendations in the fixed income space. We
continue to recomemend short term funds to our Investors who have a time horizon of
1-3 years. On the other hand our moderately aggressive and aggressive investors can
still take exposure into dynamic bond funds.
6.300
6.350
6.400
6.450
6.500
6.550
6.600
30
-Ju
n-1
7
2-J
ul-
17
4-J
ul-
17
6-J
ul-
17
8-J
ul-
17
10
-Ju
l-1
7
12
-Ju
l-1
7
14
-Ju
l-1
7
16
-Ju
l-1
7
18
-Ju
l-1
7
20
-Ju
l-1
7
22
-Ju
l-1
7
24
-Ju
l-1
7
26
-Ju
l-1
7
28
-Ju
l-1
7
30
-Ju
l-1
7
10 Year G-sec Yield Curve
DEBT MARKET OUTLOOK
Monthly Market Update (India) – August 2017 |iFAST Research
*Source: Bloomberg, iFAST Compilations. All returns are in respective local currency terms
Our View
U.S June nonfarm payrolls print came in stronger than expected (at 222,000), with the
largest gains coming from the health care sector and professional and business services.
We maintain our view that the pace of job creation is expected to moderate lower as
the business cycle matures in the US. Unemployment levels rose marginally from 4.3%
in May’17 to 4.4% in June’17. Corporate earnings are projected to grow by 9.9% this
year and by 11.7% in 2018. Consequently, the expected return of the US is now the
lowest among the markets that we cover. Implementation of fiscal expansion by the
Trump administration could provide strength to domestic growth in the US. However,
concerns remain with regards to the protectionist trade policies of the Trump
administration and its relations with emerging economies. We continue to monitor the
overall valuations of the US markets at the moment and may review our rating of 2.5
Stars “Neutral” for the US market going forward.
Despite the decline in both Germany’s and France’s preliminary composite PMIs in July, they remain
firmly in expansionary territory, with momentum in both manufacturing and services robust. The
European Central Bank (ECB) left its key rates unchanged in its July meeting, and made no
amendments to its current asset purchasing programme. The move was widely expected by the
consensus, with the central bank reiterating that its current programme will continued until end-
December 2017 “or beyond if necessary” until “a sustained adjustment in the path of inflation
consistent with its inflation aim” is achieved. We maintain a 2.5 Stars “Neutral” rating for Europe, and
advocate investors to remain an underweight exposure to European equities in their portfolios.
The latest poll in July shows Prime Minister Abe’s average approval rate is in mid-30%, with Japan
Macro advisors report figures of 34.2% after grouping up poll result of 7 Medias (Including Nikkei,
whose poll came up with 39% approval rate). Considering the approval rate were at 57% in year start,
it is true to say that support for prime minister Abe has dropped a lot in recent months. That being
said, we do not see strong political risk as of yet regarding the possibility that Abe may losses his
political status and fail to push on with supportive economic policies. As at 25 July 2017, the estimated
PE ratios of Japan’s Nikkei 225 Index are at 17.1X for FY 2017 and 15.9X for FY 2018. Valuations remain
rather attractive compared with other markets. We maintain our star ratings of the Japanese
market at an “Attractive” rating of 3.5 stars.
USA
Nonfarm payrolls rose by 222,000 in Jun 17, after an upward-revised 152,000 increase in May 17.
Unemployment rate rose to 4.4% in Jun 17 from 4.3% in May 17.
EUROPE
Germany-Advance composite PMI at 55.1 in Jul 17, down from a finalised 56.4 in Jun 17.
France- Preliminary PMI composite at 55.7 in Jul 17, down from a finalised 56.6 in Jun 17.
4.39%
1.93%
0.81%
-0.21%
-0.53%
-0.54%
-1.68%
-2% 0% 2% 4% 6%
Italy (FTSE MIB)
USA (S&P 500)
UK (FTSE 100)
Canada (S&P/TSX)
France (CAC-40)
Japan (Nikkei 225)
Germany (DAX)
G7 Countries - Performance in July 2017*
GLOBAL MARKET UPDATE – GROUP 7 COUNTRIES
Monthly Market Update (India) – August 2017 |iFAST Research
*Source: Bloomberg, iFAST Compilations. All returns are in respective local currency terms
Our View
Singapore’s advance estimates of 2Q 2017 GDP numbers showed the city’s GDP to have
grown 2.5% year-on-year, falling short of economist expectations of a 2.7% growth and
coming on par with 1Q 2017’s GDP growth. The primary driver of growth continued to
be the country’s manufacturing sector, which recorded an 8.0% year-on-year growth in
output. Industrial output rose 13.1% year on year in June’17 up from 4.4% rise in
May’17. Headline inflation (gauged by the CPI) rose 0.5% year-on-year in June, down
from a prior 1.4% year-on-year increase. The manufacturing sector is expected to
support economic growth going ahead. We continue to maintain a 4.0 Stars “Very
Attractive” rating on the Singapore equity market at this juncture.
Malaysia's industrial production accelerated by 4.6% year-on-year in May, beating
consensus estimates for a 4.1% growth and previous month's 4.2% year-on-year
expansion. Malaysia’s June inflation moderated to 3.6% growth year-on-year from the
previous month’s 3.9%. We continue to have a positive view on the equity market
underpinned by ameliorating corporate earnings and improving fundamental of the
economy. With the current fair valuation, the stock market is expected to deliver a
rather reasonable return for investment horizon over the next 3 years on a relative
basis. As such, we maintained the star ratings for Malaysia at 3.0 stars “Attractive”.
Nikkei Hong Kong Manufacturing PMI increased to 51.1 in June from 50.5 in May, signalling that
manufacturing output is still in expansion mode. Furthermore, foreign exchange reserves in Hong Kong
increased to USD 408,000 million in June, reaching an all-time high since 1993. We maintain our 4.5
Stars “Very Attractive” rating for Hong Kong.
Indonesian equities, represented by JCI Index, had its current year and next year’s earnings forecasts
revised downwards by -2.0% and -3.3% respectively, bringing its earnings growth to 15.0% and 14.7%
for 2017 and 2018 respectively. Looking into sectors, analysts remain pessimistic towards Materials and
continues to slash its earnings estimate this month by -0.2%. As macroeconomic conditions and
growth story remains intact, we maintain the star rating for Indonesia at 3.0 stars (Attractive).
SINGAPORE
Singapore’s GDP grew 2.5% y-o-y (advance estimates) in 2Q 17, on par with 1Q 17’s GDP growth. Industrial production rose 13.1% y-o-y in Jun 17, up from a 4.4% y-o-y increase in May 17. CPI rose 0.5% y-o-y in Jun 17, down from a 1.4% y-o-y increase in May 17.
MALAYSIA
Industrial Production grew by 4.6% y-o-y in May. CPI moderated to 3.6% y-o-y in Jun 2017 as compared to the prior 3.9% y-o-y in May.
HONG KONG
Nikkei Hong Kong Manufacturing PMI increased to 51.1 in June from 50.5 in May. Foreign exchange reserves in Hong Kong increased to USD 408,000 million in June, reaching an all-time
high since 1993.
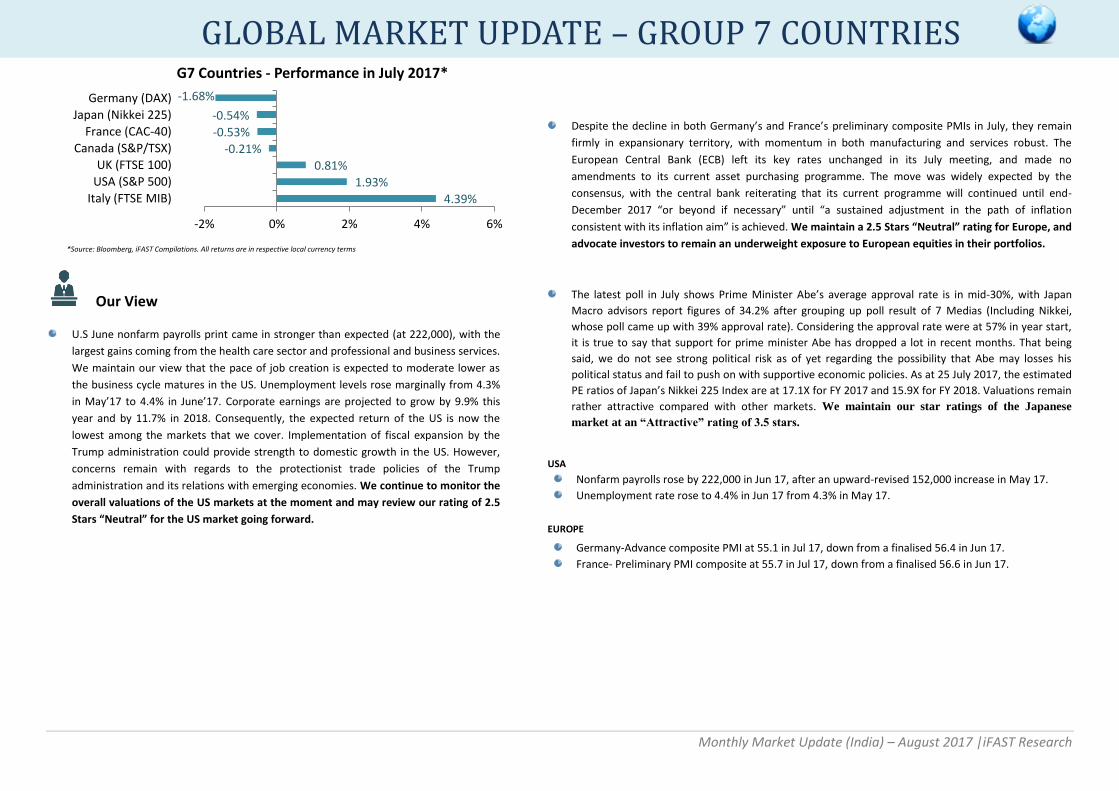
-0.21% -0.02%
0.09% 0.31% 0.46%
0.19% 3.19%
6.05%
-2% 0% 2% 4% 6% 8%
Malaysia (KLCI)
Australia (S&P/ASX 200)
Thailand (SET Index)
Taiwan (Taiwan Weighted)
South Korea (KOSPI)
Indonesia (JCI)
Singapore (STI)
Hong Kong (HSI)
Asia Pacific (Ex Japan) - Performance in July 2017*
GLOBAL MARKET UPDATE – ASIA PACIFIC (Ex-JAPAN)

Monthly Market Update (India) – August 2017 |iFAST Research
GLOBAL MARKET UPDATE – BRIC (Ex-India)
*Source: Bloomberg, iFAST Compilations. All returns are in respective local currency terms
Our View
Brazil's June Markit Manufacturing PMI came in at a 50.5 reading, down from the prior month's 52.0 reading. The figure however, has continued to come in above the 50.0 neutral reading for the third consecutive month, signalling continued manufacturing expansion and a strong quarter for the country's manufacturing sector. In June, consumer price inflation came in at 3.0% year-on-year, down from May's 3.6% and was slightly below the consensus estimate of 3.05%. While political stability in the economy has weakened, multiple economic indicators have continued to point towards a gradual turnaround and it remains likely that Brazil's economy would see positive growth for the whole of 2017. We believe that a star rating of 3.5 Stars “Attractive” continues to be warranted for Brazil’s equity market at this juncture.
Russia’s June’s industrial production rose 3.5% year-on-year, on par with market expectations and easing from prior month’s 5.6%, which was the highest year-on-year growth rate in more than 5 years. A look into other economic data released over the month revealed a slight increase in CPI to 4.40% year-on-year in June from 4.10% in May amid the increase in the prices of vegetables. While some economic indicators had dipped in June, it remains likely that the country’s economic growth would turn positive this year. We retain Russia’s star ratings at 4.0 Stars “Very Attractive”.
China reported 6.9% second-quarter GDP growth year-on-year, surpassing expectations. With GDP expansion at 6.9% for two consecutive quarters, the government will have more leeway for slower growth in the second half of year. CPI in June remained the same as that in May at 1.5% year-on-year, as a smaller drop in food prices was offset by slower growth in non-food prices. We believe that the current monetary policy will remain stable and easy fiscal policy will be maintained. We maintain our 4.5 Stars “Very Attractive” rating for the offshore Chinese equity market.
BRAZIL
Manufacturing PMI stood at 50.5 in Jun 17, down from 52.0 in May 17
IPCA inflation came in at 3.0% y-o-y in Jun 17, easing from a 3.6% y-o-y increase in May 17.
RUSSIA
Industrial production grew 3.5% y-o-y in Jun 17, down from a 5.6% gain in May 17.
CPI came in at 4.4% y-o-y in Jun 17, up from 4.1% y-o-y in May 17.
CHINA
China reports 6.9% second-quarter GDP growth y-o-y, surpassing expectations.
CPI in June remained the same as that in May at 1.5% y-o-y, as a smaller drop in food prices was offset by slower growth in non-food prices SS.
0.62%
4.80%
6.47%
0% 1% 2% 3% 4% 5% 6% 7%
Russia (RTSI$)
Brazil (IBOV)
China (HS Mainland 100)
BRIC (Ex-India) - Performance in July 2017*

Monthly Market Update (India) – August 2017 |iFAST Research
Fund Category Returns (As on July 2017)
1 Month 1 Year
Equity: Large Cap 5.43% 19.21%
Equity: Multi Cap 5.09% 20.74%
Equity: Mid Cap 3.72% 23.53%
Equity: ELSS 4.79% 21.18%
Equity: Index 5.84% 17.38%
Equity: Global 2.95% 9.43%
Hybrid: Balanced 2.81% 13.18%
Hybrid: MIP 1.49% 9.90%
Debt: Gilt Long Term 0.59% 9.86%
Debt: Gilt Short Term 0.74% 9.84%
Debt: Income 0.85% 8.73%
Debt: Short Term 0.90% 7.98%
Debt: Ultra Short Term 0.77% 7.26%
Debt: Liquid 0.59% 6.49%
Debt: Floating Rate 0.72% 7.73%
Source: NAV India, iFAST Compilations
FUND CATEGORY RETURNS

Monthly Market Update (India) – August 2017 |iFAST Research
Top and Bottom Performing Equity Funds on our Platform as on 31st July 2017
Large Cap Multi-Cap
Scheme 1 Month 1 Year Scheme 1 Month 1 Year
JM Core 11 Fund (G) 9.10% 24.15% Birla Sun Life India Reforms Fund (G) 9.40% 26.27%
Sahara Super 20 Fund (G) 7.86% 16.12% JM Basic Fund (G) 8.13% 27.51%
NSE Nifty 50 Index (Benchmark) 5.84% 16.56% NSE Nifty 500 Index (Benchmark) 5.54% 19.84%
Indiabulls Value Discovery Fund (G) 1.44% 21.78% UTI-Wealth Builder Fund (G) 1.80% 8.88%
IDBI Diversified Equity Fund (G) 1.53% 11.43% Escorts Leading Sectors Fund (G) 2.45% 17.07%
Midcap & Small Cap ELSS
Scheme 1 Month 1 Year Scheme 1 Month 1 Year
Reliance Growth Fund - (G) 6.10% 25.01% Sahara Tax Gain Fund (G) 7.60% 21.68%
Tata Mid Cap Growth Fund - (G) 5.89% 23.18% HDFC Long Term Advantage Fund (G) 7.00% 26.71%
Nifty Free Float Midcap 100 Index (Benchmark) 4.43% 25.18% NSE Nifty 500 Index (Benchmark) 5.54% 19.84%
IDBI Small Cap Fund (G) 0.20% - IDBI Equity Advantage Fund - Regular (G) 1.77% 13.99%
DSP BR Micro-Cap Fund (G) 0.60% 23.50% Peerless Long Term Advantage Fund (G) 1.89% 19.31%
Overseas
Scheme 1 Month 1 Year
DSP BR World Mining Fund (G) 11.75% 8.65%
HSBC Brazil Fund (G) 9.55% 6.50%
MSCI World Index (in INR) (Benchmark) 1.67% 9.56%
ICICI Pru US Bluechip Equity Fund (G) -0.47% 8.49%
ICICI Pru Global Stable Equity Fund - Regular (G) -0.30% - Source: NAV India, iFAST Compilations
TOP & BOTTOM EQUITY FUNDS

Monthly Market Update (India) – August 2017 |iFAST Research
Top and Bottom Performing Debt and Hybrid Funds on our Platform as on 31st July 2017 Short Term
Income
Scheme 1 Month 1 Year
Scheme 1 Month 1 Year
Taurus Short Term Income Fund (G) 4.04% -2.44%
Taurus Dynamic Income Fund (G) 4.26% -3.85%
Franklin India Short Term Income (G) 1.07% 10.62%
DHFL Pramerica IIB Fund (G) 1.09% 9.49%
Crisil Short-Term Bond Fund Index 0.81% 8.37%
Crisil Composite Bond Fund Index 0.98% 9.94%
Mahindra MF Alp Samay Bachat Yojana - Reg (G) 0.59% -
L&T Flexi Bond Fund (G) 0.37% 8.27%
Escorts Short Term Debt Fund (G) 0.61% 7.22%
Kotak Bond - Regular (G) 0.43% 7.79%
Gilt - Long Term MIP
Scheme 1 Month 1 Year Scheme 1 Month 1 Year
DHFL Pramerica Gilt Fund (G) 0.90% 8.95% Birla Sun Life MIP II - Wealth 25 (G) 2.71% 14.50%
Franklin India G-Sec Fund - Composite (G) 0.89% 8.16% DSP BR MIP Fund (G) 2.69% 10.53%
Crisil Composite Bond Fund Index 0.98% 9.94% Crisil MIP Blended Index 1.70% 11.00%
Indiabulls Gilt Fund (G) 0.25% 9.52% Principal Debt Savings Fund - Retail (G) 0.62% 8.62%
Sundaram Gilt Fund - (G) 0.26% 8.20% SBI Regular Savings Fund (G) 0.72% 12.21%
Balanced
Scheme 1 Month 1 Year
UTI-CCP Advantage Fund - (G) 6.07% 23.56%
HDFC Retirement Savings Fund-Hybrid Equity (G) 5.44% 24.03%
CRISIL Balanced Fund - Aggressive Index 4.12% 14.36%
Escorts Income Bond - (G) 0.30% 7.39%
Tata Regular Saving Equity Fund - (App) 0.52% 6.76% Source: NAV India, iFAST Compilations
TOP & BOTTOM DEBT/HYBRID FUNDS

Monthly Market Update (India) – August 2017 |iFAST Research
DISCLAIMER: THIS REPORT IS NOT TO BE CONSTRUED AS AN OFFER OR SOLICITATION FOR THE SUBSCRIPTION, PURCHASE OR SALE OF ANY MUTUAL FUND. ANY ADVICE HEREIN IS MADE
ON A GENERAL BASIS AND DOES NOT TAKE INTO ACCOUNT THE SPECIFIC INVESTMENT OBJECTIVE OF THE SPECIFIC PERSON OR GROUP OF PERSONS. PAST PERFORMANCE AND ANY
FORECAST IS NOT NECESSARILY INDICATIVE OF THE FUTURE OR LIKE PERFORMANCE OF THE MUTUAL FUND. THE VALUE OF UNITS AND THE INCOME FROM THEM MAY FALL AS WELL AS
RISE. OPINIONS EXPRESSED HEREIN ARE SUBJECT TO CHANGE WITHOUT NOTICE.
MUTUAL FUND INVESTMENTS ARE SUBJECT TO MARKET RISKS, READ ALL SCHEME RELATED DOCUMENTS CAREFULLY.
Recommended