Multi-criteria decision analysis of feed formulation for laying hens
Aung Moe*, Kerrianne Koehler-Munro, Roger Bryan, Tom Goddard, Len Kryzanowski
Alberta Agriculture and Rural Development, Edmonton, Alberta, Canada Corresponding author. E-mail: [email protected]
ABSTRACT
Increase awareness of environmentally sustainable food products and sustainability reporting in the food industry led to assessment of
environmental performance of agri-food products using life cycle assessment (LCA). Feed production is mainly responsible for the
overall environmental impact of egg and broiler production. In addition, feed cost accounts for a significant portion of the total cost of
egg production. Feed formulation is a complex process of quantifying the amount of feed ingredients to satisfy nutritional requirement of
layers. Traditional linear programming models can find least cost combination of feed ingredients that meet nutritional requirements.
However, it has limitations of rigidity that cannot solve several conflicting objectives simultaneously. Alternatively, multi-criteria
decision analysis (MCDA) can be used to find the optimal combination of feed ingredients that meet nutritional requirements at the
lowest possible cost with the minimum carbon footprint. The results suggest that the carbon footprint of feed formulation could be
reduced with a modest increase in cost.
Keywords: life cycle assessment (LCA), multi-criteria decision analysis (MCDA), carbon footprint, cost, feed formulation
1. Introduction
Consumer awareness of environmentally sustainable food products and sustainability reporting are
responsible for a growing trend in sustainability of the food supply chain. Consumers are more conscious about
how foods are produced and their consequential impacts on the environment. Many stakeholders in the food
supply chain including producers, processors and retailers are adopting sustainable practices to address
consumer demand for environmental friendly products and communicate the environmental profile of their
products. Increasingly food retailers are integrating sustainable considerations into their supply chain to reduce
cost, to enhance corporate reputation and to differentiate their products from competitors. In response to the
demand and need for sustainability reporting, a life cycle assessment has been recently completed to assess the
environmental performance of egg production in Alberta.
Key findings of LCA results identified feed production as the main contributor to greenhouse gas emissions
(carbon footprint) (70%) of egg production in Alberta. The results were consistent with other LCA studies of egg
and broiler production that identified feed production as a major contributor of greenhouse gas emissions (46-
80%) from egg and broiler chicken production (Pelletier 2008; Sonesson et al. 2009; Wiedemann and McGahan
2011; Wiedemann et al. 2012). In addition, feed cost accounts for a significant portion (46-54%) of total cost of
egg production (Martin et al. 1998). Improvement in the feed formulation can help to optimize feed efficiency.
Feed formulation is a complex process of assembling a blend of feed ingredients that meet the nutritional
requirements of layers. Inadequate nutrition may lead to a reduction in egg size and production. Energy, protein
and amino acid levels are major factors in feed formulation to achieve the best performance of egg production
(Elliot 2012). Traditional linear programming has been used to formulate the least cost combination of feed
ingredients that satisfies a specific level of nutritional requirements of layers. However, it has limitations of rigid
assumptions that cannot solve several conflicting objectives such as cost minimization and reduction of
environmental impact (Castrodeza et al. 2005; Rehman and Romero 1984). Compared to the linear
programming, multi-criteria decision analysis (MCDA) is a more flexible method to solve several conflicting
objectives simultaneously. Using MCDA, this study builds on the LCA study results to find the best compromise
solution to the optimal combination of feed ingredients that satisfies economic, nutritional and environmental
criteria.
Proceedings of the 9th International Conference on Life Cycle Assessment in the Agri-Food Sector
835
2. Methods
2.1. LCA of feed ingredients
Carbon footprints of feed ingredients were assessed using ISO standards 14040/14044 (2006). This study
included crop production on the farm, the subsequent drying, processing and the transport of feed grain to the
farm. The functional unit used was 1 kg of feed ingredient at the gate of the feed mill. Background processes
associated with input production (manufactured fertilizers, pesticides, agricultural machinery, and diesel), field
operations and the transport of feed grains to the feed mill were adapted from the ecoinvent database (Nemecek
and Kagi 2007). The electricity grid mix value was modified using Alberta data for energy sources and
electricity importation from other provinces.
Life cycle inventory data for wheat, barley, peas and canola were developed using Alberta crop production
data. Two farming systems (conventional and no tillage systems) were modeled for the four crops. Crop yield
(2009-2011) and the proportion of each tillage system were used from the Alberta Agriculture Financial Service
Corporation (AFSC – crop insurance). Corn, corn dry distiller grains (DDGS), soybean and soymeal were
adopted from ecoinvent database using U.S Midwest data. Attributional LCA modelling was applied to the study
because the main purpose of the study was to measure the total greenhouse gas emissions of feed ingredients
based on average production data and the effects of any changes in level of output were beyond the scope of the
study.
Economic allocation was used to allocate environmental impact of the by-products of feed ingredients such
as soymeal, canola meal and corn DDGS because physical relationships of feed materials differed significantly
from one feed type to another depending on nutritional contents such as energy, protein and essential amino acid
(FAO 2014). Moreover, the prices of feed ingredients reflected their nutritional value. In this case, economic
allocation was the best possible option to allocate environmental impacts of feed ingredients and their by-
products in a consistent manner and on the basis of meaningful relationship between nutritional values and
prices (FAO 2014). Limestone, dicalcium phosphate and salt were used from the ecoinvent database. Vitamin
premix was used from Nguyen et al. (2012).
Global warming potential was considered as a single environmental impact indicator to analyze in the model
because global warming potential was widely used as a standalone impact indicator using internationally
recognized greenhouse gas quantification protocols such as ISO/TS 14067 and PAS 2050 to communicate the
results to the public through carbon labelling schemes. For life cycle impact assessment method, IPCC 2007
GWP 100a was selected from SimaPro 7.3.3 to evaluate the global warming potential of feed ingredients
(Goedkoop et al. 2008; Goedkoop et al. 2010).
2.2. Multi-criteria decision analysis (MCDA) for feed formulation
Multi-criteria decision analysis can be used to find the best comprise solution among several conflicting
objectives. In order to model multiple objective programming, it needs to find target values for each of
objectives (Tozer and Stokes 2001). This study focuses on two objectives – cost minimization and reduction of
carbon footprint. Cost target (C*) and impact target (I*) are solved using traditional linear programming. C* is
determined by a LP model of cost minimization as follow:
I
i
ii XC1
min 1
Subject to:
1,...,2,1 1
JjbXa ij
I
i
iij 2
j
I
i
iij bXa 1
3
Proceedings of the 9th International Conference on Life Cycle Assessment in the Agri-Food Sector
836
The objective function specified by equation 1 describes the summation of the prices of the i feed ingredients
)( i multiplied by its amount )( iX used in the optimal feed formulation. Equation 2 and 3 are recommended
nutritional lower and upper bound constraints. The coefficients ija measure the amount of the jth nutrient in the
ith feed ingredients and jb limit the allowable minimum or maximum amount of the jth nutrient in the feed
formulation depending on the sign of inequality. Crude protein (%), metabolizable energy (kcal/kg), available
phosphorus (%), calcium (%) and essential amino acids such as methionine (%), methionine + cystine (%),
lysine (%), threonine (%), tryptophan (%) and isoleucine (%), are considered as the jth nutrient according to
diet specification from commercial poultry nutrition (Leeson et al. 2008). Wheat, barley, corn, corn DDGS,
soymeal, canola meal and peas were included as major feed grain crops. Other feed ingredients such as
limestone, canola oil, dicalcium phosphate, salt and vitamin premix were also included in the feed formulation
based on recommended diet specifications (Leeson et al. 2008).
Diet specifications for layers (60-70 weeks) were used based on guidelines for nutritional requirements of
layers from commercial poultry nutrition (Leeson et al. 2008). Nutritional values of feed ingredients were
collected from commercial poultry nutrition by Leeson et al. (2008). Price data (2013) for wheat, barley, corn,
corn DDGS, soymeal and canola meal were collected from the Alberta Pulse Growers Association. Price of
canola oil was used from the Canola Council of Canada. Prices of other minerals and feed supplements were
from Masterfeeds - retail bulk price list of July 22, 2013. Nutritional values and prices of feed ingredients are
presented in Table 1.
Table 1. Nutritional values and prices of major feed ingredients
Feed ME
(kcal)
C.P
(%)
Ca
(%)
P
(%)
Methionine
(%)
Lysine
(%)
Threonine
(%)
Methionine
+Cystine (%)
Isoleucine
(%)
Tryptop
han (%) $/tonne
Wheat 3150 13 0.05 0.2 0.2 0.49 0.42 0.41 0.3 0.21 258
Barley 2780 11.5 0.1 0.2 0.21 0.31 0.4 0.42 0.5 0.19 240
Soymeal 2550 48 0.2 0.37 0.72 3.22 1.96 1.51 2.6 0.71 569
Canola
meal 2000 37.5 0.65 0.45 0.69 2.21 1.72 1.3 1.4 0.5 338
Corn 3330 8.5 0.01 0.13 0.2 0.2 0.41 0.31 0.29 0.1 290
Corn
DDGS 2770 36.5 0.07 0.77 0.5 0.73 0.96 1.04 0.96 0.2 305
Peas 2550 23.5 0.1 0.3 0.3 1.6 0.9 0.5 1.1 0.23 287
Minimum
requirement 2800 16 4.6 0.33 0.34 0.73 0.55 0.6 0.53 0.15
Similar to the finding the minimum cost target, the impact target is solved using the following LP model:
I
i
ii XI1
min 4
Subject to:
1,...,2,1 1
JjbXa ij
I
i
iij 5
j
I
i
iij bXa 1
6
The objective function in equation 4 describes the summation of the carbon footprint of the i feed ingredients
)( i multiplied by its amount )( iX used in the optimal feed formulation. Equation 5 and 6 are specified by
similar procedures to equation 2 and 3.
Proceedings of the 9th International Conference on Life Cycle Assessment in the Agri-Food Sector
837
When the target values (C* and I*) are solved, a multiple objective programming model is solved using the
following MINIMAX formulation:
Min 7
Subject to:
1,...,2,1 1
JjbXa ij
I
i
iij 8
j
I
i
iij bXa 1
9
CXI
i
ii 1
10
IXI
i
ii 1
11
** /)( CCCwC 12
** /)( IIIwI 13
The objective function of the multiple objective model minimizes ,which is the weighted percentage deviations
from the target values for each of the two objectives. The constraints specified by equation 12 and 13 measure
percentage deviations from the target values when the weights for the goals ) and ( IC WW are equal to one.
However, the model is flexible to adjust the weights that reflect a decision maker’s priority over each objective.
3. Results
3.1. Carbon footprint of feed ingredients
Results of global warming potential (GWP 100a) ranged from 0.012 to 1.799 kg CO2e/kg of feed ingredient
(Table 2). Canola oil had the highest GWP while limestone had the lowest GWP. Among major feed crops, corn
DDGS had the highest GWP, followed by wheat and corn which had greater GWP than barley, canola meal,
peas and soymeal. For major protein feed ingredient, GWP of soymeal was higher than that of canola meal.
Fertilizer production and its emissions from field application was a major contributor to GWP of feed crops.
Transportation was mainly responsible for GWP of imported feed grains such as corn, corn DDGS and soymeal
which accounted for 41, 33 and 19 % of total impact of GWP.
3.2. Least cost feed formulation
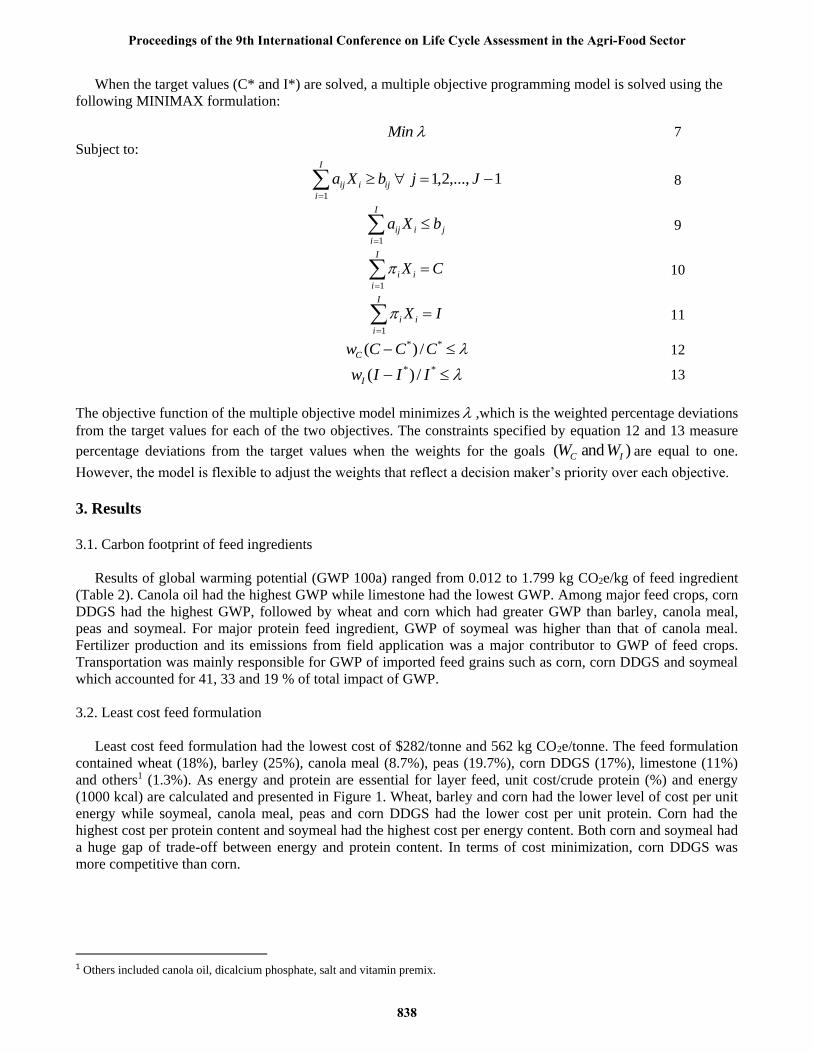
Least cost feed formulation had the lowest cost of $282/tonne and 562 kg CO2e/tonne. The feed formulation
contained wheat (18%), barley (25%), canola meal (8.7%), peas (19.7%), corn DDGS (17%), limestone (11%)
and others1 (1.3%). As energy and protein are essential for layer feed, unit cost/crude protein (%) and energy
(1000 kcal) are calculated and presented in Figure 1. Wheat, barley and corn had the lower level of cost per unit
energy while soymeal, canola meal, peas and corn DDGS had the lower cost per unit protein. Corn had the
highest cost per protein content and soymeal had the highest cost per energy content. Both corn and soymeal had
a huge gap of trade-off between energy and protein content. In terms of cost minimization, corn DDGS was
more competitive than corn.
1 Others included canola oil, dicalcium phosphate, salt and vitamin premix.
Proceedings of the 9th International Conference on Life Cycle Assessment in the Agri-Food Sector
838
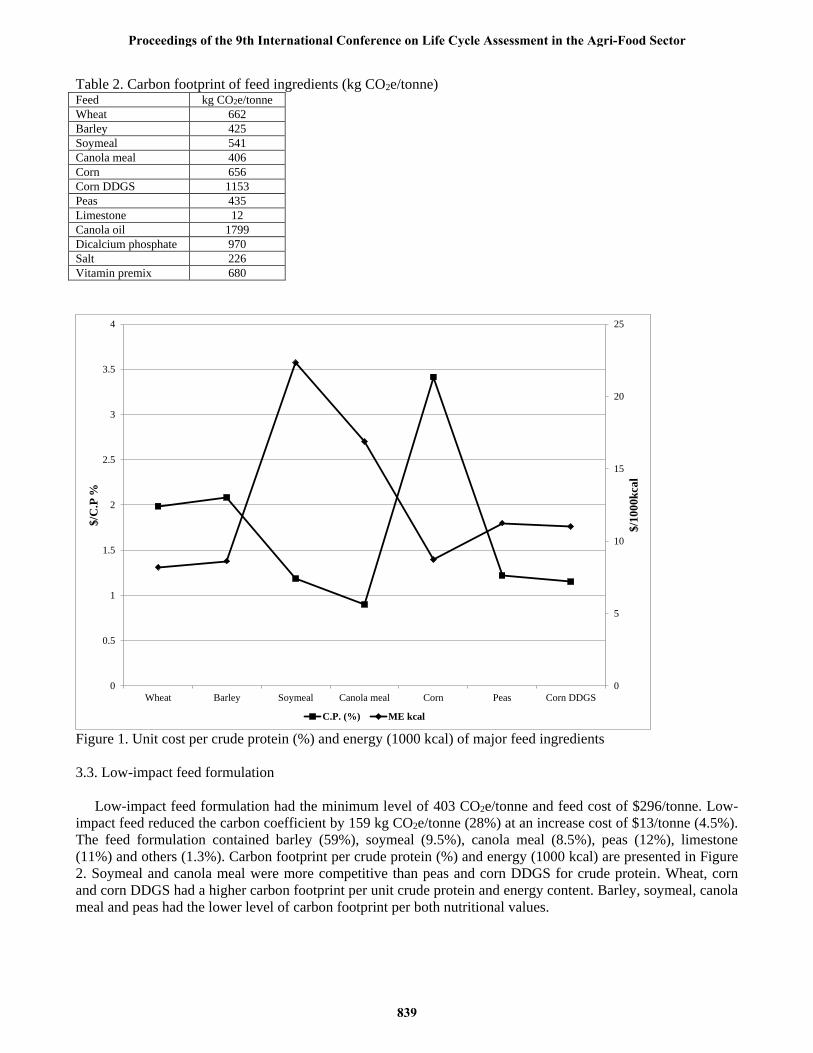
Table 2. Carbon footprint of feed ingredients (kg CO2e/tonne) Feed kg CO2e/tonne
Wheat 662
Barley 425
Soymeal 541
Canola meal 406
Corn 656
Corn DDGS 1153
Peas 435
Limestone 12
Canola oil 1799
Dicalcium phosphate 970
Salt 226
Vitamin premix 680
Figure 1. Unit cost per crude protein (%) and energy (1000 kcal) of major feed ingredients
3.3. Low-impact feed formulation
Low-impact feed formulation had the minimum level of 403 CO2e/tonne and feed cost of $296/tonne. Low-
impact feed reduced the carbon coefficient by 159 kg CO2e/tonne (28%) at an increase cost of $13/tonne (4.5%).
The feed formulation contained barley (59%), soymeal (9.5%), canola meal (8.5%), peas (12%), limestone
(11%) and others (1.3%). Carbon footprint per crude protein (%) and energy (1000 kcal) are presented in Figure
2. Soymeal and canola meal were more competitive than peas and corn DDGS for crude protein. Wheat, corn
and corn DDGS had a higher carbon footprint per unit crude protein and energy content. Barley, soymeal, canola
meal and peas had the lower level of carbon footprint per both nutritional values.
0
5
10
15
20
25
0
0.5
1
1.5
2
2.5
3
3.5
4
Wheat Barley Soymeal Canola meal Corn Peas Corn DDGS
$/1
00
0k
cal
$/C
.P %
C.P. (%) ME kcal
Proceedings of the 9th International Conference on Life Cycle Assessment in the Agri-Food Sector
839

Figure 2. Carbon footprint per unit of crude protein (%) and metabolizable energy (1000 kcal) for seven major
feed ingredients
3.4. Multiple objective solutions
The lowest cost ($282/tonne) from the least cost feed formulation and the minimum level of carbon footprint
(403 CO2e/tonne) from the low-impact feed formulation were used as the target levels of the two objectives –
least-cost and low-impact. Multiple objective programming was solved under three different weighting scenarios
for the two targets – equally weighted scenario (WLC = WLI= 1), cost heavily weighted scenario (WLC = 2, WLI=
1) and carbon footprint heavily weighted scenario (WLC = 1, WLI= 2).
The results of least cost, low-impact and three multiple objective solutions are presented in Figures 3 and 4.
For the solution of equally weighted scenario (WcWi), the cost of feed formulation was $291/tonne, an increase
over the least cost formulation of $9/tonne or 3% and, the carbon footprint was 411 kg CO2e/tonne with a
marginal decrease of 151kg CO2e/tonne or 27% compared to the least cost formulation (LC). For the solution of
the carbon footprint heavily weighted scenario (1Wc2Wi), the cost and carbon footprint of feed formulation were
$296/tonne and 403 kg CO2e/tonne that increased the cost by $14/tonne or 5% and decreased the footprint by
159 kg CO2e/tonne or 28% compared to the least cost formulation. The results were almost the same as those of
the low-impact (LI) feed formulation ($295/tonne and 403 kg CO2e/tonne). Compared to the results of the
equally weighted solution (a 3% cost increase and a 27% CO2e reduction), the low-impact and the carbon
footprint heavily weighted scenarios cost more (a 5% cost increase) but reduced relatively similar amount of the
carbon footprint (a 28% CO2e reduction). Therefore, both solutions are not optimal in terms of the marginal
changes in cost and carbon footprint.
For the solution of the cost heavily weighted scenario (2Wc1Wi), the cost of feed formulation increased by
only $1/tonne or 0.35% compared to the least cost formulation but the carbon footprint decreased by 105 kg
CO2e/tonne or 19%. The solution of the cost heavily weighted scenario was more feasible than that of the
equally weighted scenario in terms of the marginal changes in cost and carbon footprint. Compared to the least
cost formulation, a major change in these formulations was the substitution of wheat and corn DDGS by barley,
0
50
100
150
200
250
300
350
400
0
10
20
30
40
50
60
Wheat Barley Soymeal Canola meal Corn Peas Corn DDGS
CO
2e/
10
00 k
cal
CO
2e/
C.P
.%
C.P ME
Proceedings of the 9th International Conference on Life Cycle Assessment in the Agri-Food Sector
840
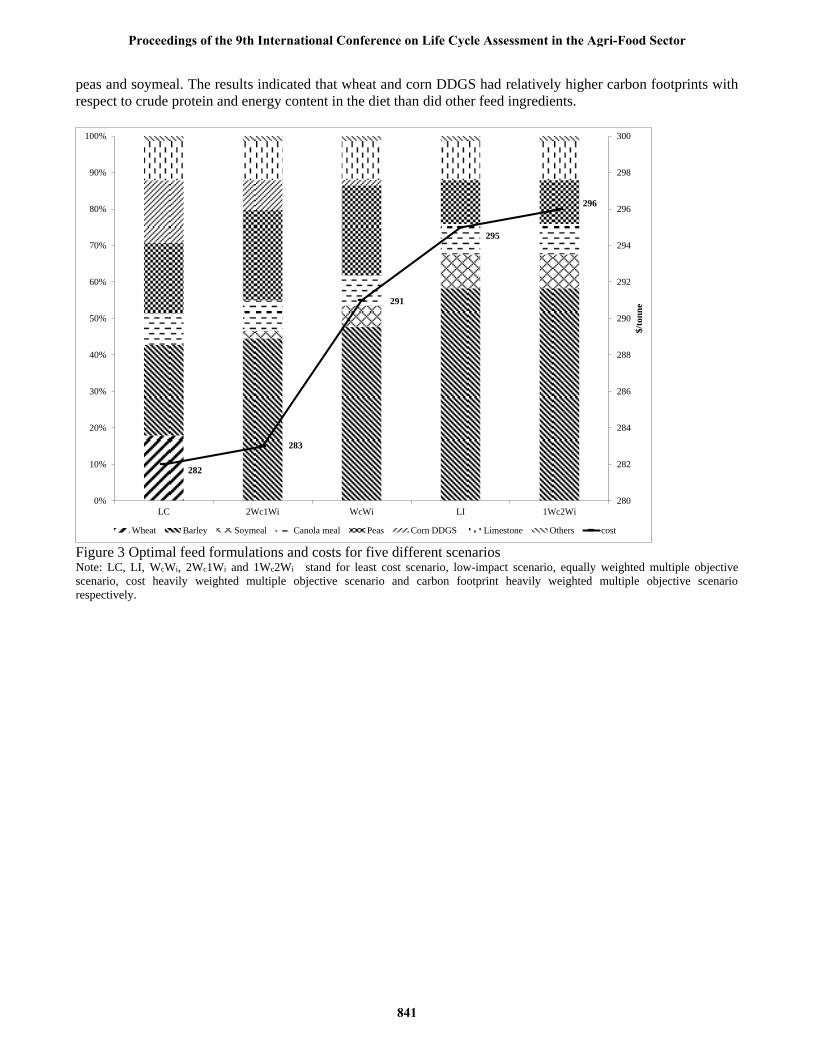
peas and soymeal. The results indicated that wheat and corn DDGS had relatively higher carbon footprints with
respect to crude protein and energy content in the diet than did other feed ingredients.
Figure 3 Optimal feed formulations and costs for five different scenarios Note: LC, LI, WcWi, 2Wc1Wi and 1Wc2Wi stand for least cost scenario, low-impact scenario, equally weighted multiple objective
scenario, cost heavily weighted multiple objective scenario and carbon footprint heavily weighted multiple objective scenario
respectively.
282
283
291
295
296
280
282
284
286
288
290
292
294
296
298
300
0%
10%
20%
30%
40%
50%
60%
70%
80%
90%
100%
LC 2Wc1Wi WcWi LI 1Wc2Wi
$/t
on
ne
Wheat Barley Soymeal Canola meal Peas Corn DDGS Limestone Others cost
Proceedings of the 9th International Conference on Life Cycle Assessment in the Agri-Food Sector
841
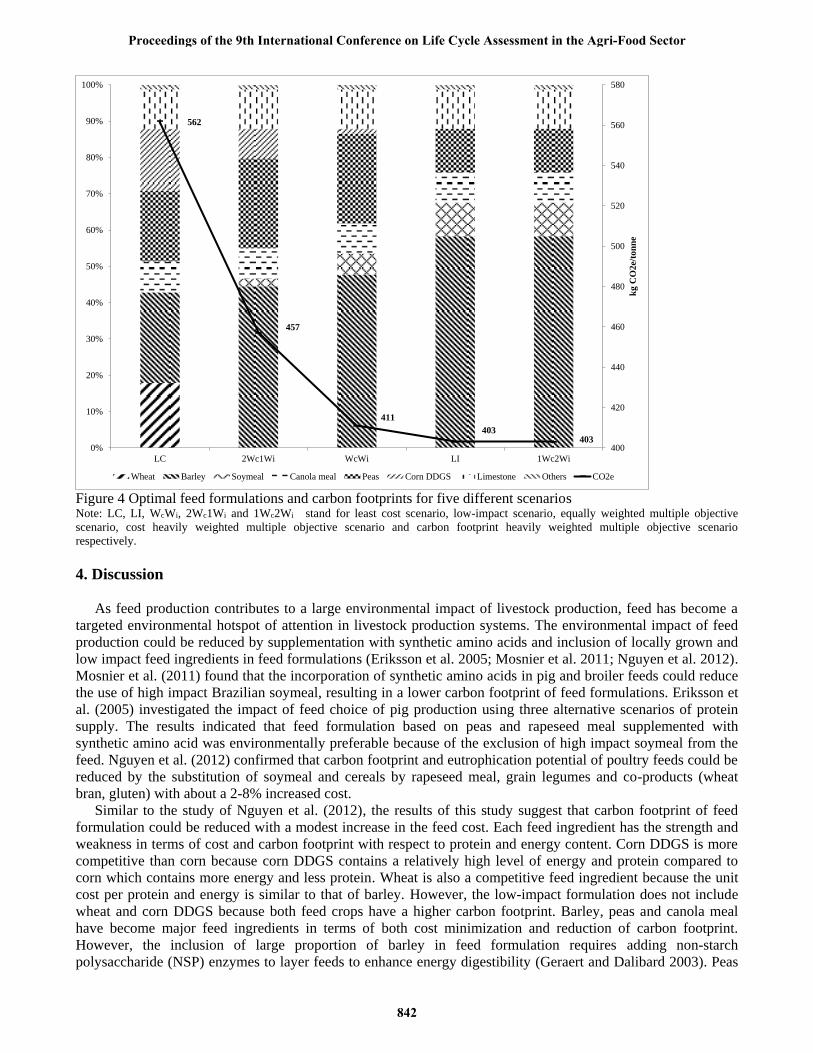
Figure 4 Optimal feed formulations and carbon footprints for five different scenarios Note: LC, LI, WcWi, 2Wc1Wi and 1Wc2Wi stand for least cost scenario, low-impact scenario, equally weighted multiple objective
scenario, cost heavily weighted multiple objective scenario and carbon footprint heavily weighted multiple objective scenario
respectively.
4. Discussion
As feed production contributes to a large environmental impact of livestock production, feed has become a
targeted environmental hotspot of attention in livestock production systems. The environmental impact of feed
production could be reduced by supplementation with synthetic amino acids and inclusion of locally grown and
low impact feed ingredients in feed formulations (Eriksson et al. 2005; Mosnier et al. 2011; Nguyen et al. 2012).
Mosnier et al. (2011) found that the incorporation of synthetic amino acids in pig and broiler feeds could reduce
the use of high impact Brazilian soymeal, resulting in a lower carbon footprint of feed formulations. Eriksson et
al. (2005) investigated the impact of feed choice of pig production using three alternative scenarios of protein
supply. The results indicated that feed formulation based on peas and rapeseed meal supplemented with
synthetic amino acid was environmentally preferable because of the exclusion of high impact soymeal from the
feed. Nguyen et al. (2012) confirmed that carbon footprint and eutrophication potential of poultry feeds could be
reduced by the substitution of soymeal and cereals by rapeseed meal, grain legumes and co-products (wheat
bran, gluten) with about a 2-8% increased cost.
Similar to the study of Nguyen et al. (2012), the results of this study suggest that carbon footprint of feed
formulation could be reduced with a modest increase in the feed cost. Each feed ingredient has the strength and
weakness in terms of cost and carbon footprint with respect to protein and energy content. Corn DDGS is more
competitive than corn because corn DDGS contains a relatively high level of energy and protein compared to
corn which contains more energy and less protein. Wheat is also a competitive feed ingredient because the unit
cost per protein and energy is similar to that of barley. However, the low-impact formulation does not include
wheat and corn DDGS because both feed crops have a higher carbon footprint. Barley, peas and canola meal
have become major feed ingredients in terms of both cost minimization and reduction of carbon footprint.
However, the inclusion of large proportion of barley in feed formulation requires adding non-starch
polysaccharide (NSP) enzymes to layer feeds to enhance energy digestibility (Geraert and Dalibard 2003). Peas
562
457
411
403403
400
420
440
460
480
500
520
540
560
580
0%
10%
20%
30%
40%
50%
60%
70%
80%
90%
100%
LC 2Wc1Wi WcWi LI 1Wc2Wi
kg
CO
2e/
ton
ne
Wheat Barley Soymeal Canola meal Peas Corn DDGS Limestone Others CO2e
Proceedings of the 9th International Conference on Life Cycle Assessment in the Agri-Food Sector
842
and canola have limitations of inclusion in formulations so that the amount of peas cannot exceed more than
30% and the amount of canola meal cannot exceed more than 10% (Hickling 2003; Newkirk 2009). Therefore, it
is important to consult with poultry nutritionists about any suggested changes in feed formulations so that
nutritional requirements and ingredient limitations are not compromised.
5. Conclusion
Carbon footprints of feed formulations could be reduced using low impact feed ingredients while satisfying
nutritional requirement of laying hens. The feed cost will be higher in order to reduce carbon footprint of feed
formulation. However, it is possible to find a lower carbon footprint of formulated feed at a reasonable cost.
Barley, peas and canola meal play a major role to reduce the carbon footprint of feed formulation. Multi-criteria
decision analysis could be used as a tool to achieve the best possible combination of feed ingredients at the
lowest possible cost using multiple objective programming. This tool will help Alberta egg producers develop
eco-efficient feed formulations that demonstrates industry’s commitment to environmental sustainability.
6. References
Castrodeza C, Lara P, Pena T, (1984) Multiple-criteria fractional model for feed formulation: economic,
nutritional and environmental criteria. Agricultural Systems 86:76-86
Elliot MA, (2012) New concepts in layer nutrition. Proceedings of the 23nd Annual Australian Poultry Science
Symposium, Sydney, New South Wales
Eriksson IS, Elmquist H, Stern S, Nybrant T, (2005) Environmental systems analysis of pig production.
International Journal of Life Cycle Assessment 10(2):143-154
Food and Agriculture Organization (FAO) (2014) Environmental performance of animal feeds supply chains:
Guidelines for quantification. Draft for public review. Available at:
http://www.fao.org/fileadmin/user_upload/benchmarking/docs/LEAP_Anima_feeds_DRAFT.pdf
Geraert PA, Dalibard P, (2003) Enzymes in layer diets: an opportunity. World Poultry 19 (4):12-13
Goedkoop M, Oele M, Schryver AD, Vieira M, (2008) SimaPro Database Manual: Method library. PRe
Consultants, Netherland
Goedkoop M, Schryver AD, Oele M, Durksz S, de Roest D, (2010) Introduction to LCA with SimaPro 7. PRe
Consultants, Netherland
Hickling D, (2003) Canadian feed peas industry guide. Pulse Canada, Winnipeg, Manitoba, Canada. Available
at: http://www.pulsecanada.com/uploads/31/1b/311beeea01659c37ca27e91d669c2a87/Feed-Peas-English.pdf
ISO 14040:2006 (2006) Environmental Management – Life Cycle Assessment – Principles and framework, the
International Organization for Standardization, Geneva
ISO 14044:2006 (2006) Environmental Management – Life Cycle Assessment – Requirements and guidelines,
the International Organization for Standardization, Geneva
ISO/TS 14047:2013 (2013) Greenhouse gases – Carbon footprint of products – Requirements and guidelines for
quantification and communication, the International Organization for Standardization, Geneva
Leeson S, Summers JD, (2008) Commercial Poultry Nutrition. Thrumpton, Nottingham: Nottingham University
Press
Martin L, Kruja Z, Alexiou J, (1998) Prospect of expanded egg production in Western Canada. George Morris
Centre, Guelph, Ontario, Canada
Mosnier E, van der Werf HMG, Boissy J, Dourmad J-Y, (2011) Evaluation of the environmental implications of
the incorporation of feed-use amino acids in the manufacturing of pig and broiler feeds using life cycle
assessment. Animal 5:1972-1983
Nemecek T, Kagi T, (2007) Life cycle inventories of Swiss and European agricultural production systems. Final
Report Ecoinvent No.15. Agroscope Reckenholz-Taenikon Research Station ART, Swiss Centre for life
cycle inventories, Zurick and Dubendorf, Switzerland
Newkirk R, (2009) Canola meal feed industry guide. Canola Council of Canada, Winnipeg, Canada. Available
at: http://www.canolacouncil.org/media/516716/canola_meal_feed_guide_english.pdf
Nguyen TTH, Bouvarel I, Ponchant P, van der Werf HMG, (2012) Using environmental constraints to formulate
low-impact poultry feeds. Journal of Cleaner Production 28:215-224
Proceedings of the 9th International Conference on Life Cycle Assessment in the Agri-Food Sector
843
PAS 2050:2008 (2008) Specification for assessment of the life cycle greenhouse gas emissions of goods and
services. British Standards, London
Pelletier N, (2008) Environmental performance in the US broiler poultry sector: Life cycle energy use and
greenhouse gas, ozone depleting, acidifying and eutrophying emissions. Agricultural Systems 98: 67-73
Rehman T, Romero C, (1984) Multiple-criteria decision-making techniques and their role in livestock ration
formulation. Agricultural Systems 15:23–49
Sonesson U, Cederberg C, Berglund M, (2009) Greenhouse gas emissions in egg production: decision support
for climate certification. Report 2009:7, KLIMATMARKNING FOR MAT. (Climate Certification for Food),
Stockholm, Sweden
Tozer PR, Stokes JR, (2001) A multi-objective programming approach to feed ratio balancing and nutrient
management. Agricultural Systems 67:201-215
Weidemann SG, McGahan EJ, (2011) Environmental assessment of an egg production supply chain using life
cycle assessment. A final report. Publication No 1FS091A, Australian Egg Corporation Limited, North
Sydney, Australia
Weidemann SG, McGahan EJ, Poad G, (2012) Using life cycle assessment to quantify the environmental impact
of chicken meat production. A final report. RIRDC Publication No 12/029, Rural Industries Research and
Development Corporation (RIRDC), Barton, Australia
Proceedings of the 9th International Conference on Life Cycle Assessment in the Agri-Food Sector
844
This paper is from:
Proceedings of the 9th International Conference on
Life Cycle Assessment in the Agri-Food Sector
8-10 October 2014 - San Francisco
Rita Schenck and Douglas Huizenga, Editors
American Center for Life Cycle Assessment
The full proceedings document can be found here:
http://lcacenter.org/lcafood2014/proceedings/LCA_Food_2014_Proceedings.pdf
It should be cited as:
Schenck, R., Huizenga, D. (Eds.), 2014. Proceedings of the 9th International Conference on Life
Cycle Assessment in the Agri-Food Sector (LCA Food 2014), 8-10 October 2014, San Francisco,
USA. ACLCA, Vashon, WA, USA.
Questions and comments can be addressed to: [email protected]
ISBN: 978-0-9882145-7-6
Recommended