Lean Six Sigma
Shewhart’sShewhart’s Control Chart PhilosophyControl Chart Philosophy
98
99
100
101
102
103
104
1 2 3 4 5 6 7 8 9 10 11 12 13 14 15 16 17 18 19 20 21 22 23 24 25 26 27 28 29 30
Normal Distribution Run Chart
UNCLASSIFIED1
96
97
98
99
100
101
102
103
104
105
1 2 3 4 5 6 7 8 9 10 11 12 13 14 15 16 17 18 19 20 21 22 23 24 25 26 27 28 29 30
X + 3s
X - 3s
Mean = X
_
_
_
Control Chart

Lean Six Sigma
Run ChartRun Chart
Shows how the process varies over time
Shifts, trends, intermittent problems and cyclic patternscan be detected
Vertical-axis is the unit of measure; horizontal-axis istime
UNCLASSIFIED
A baseline average or current average line can be usedas a point-of-reference to detect process changes
When the Run Chart p-values are greater than alpha (e.g..05), the characteristic of interest is not statisticallysignificant.
2
Lean Six Sigma
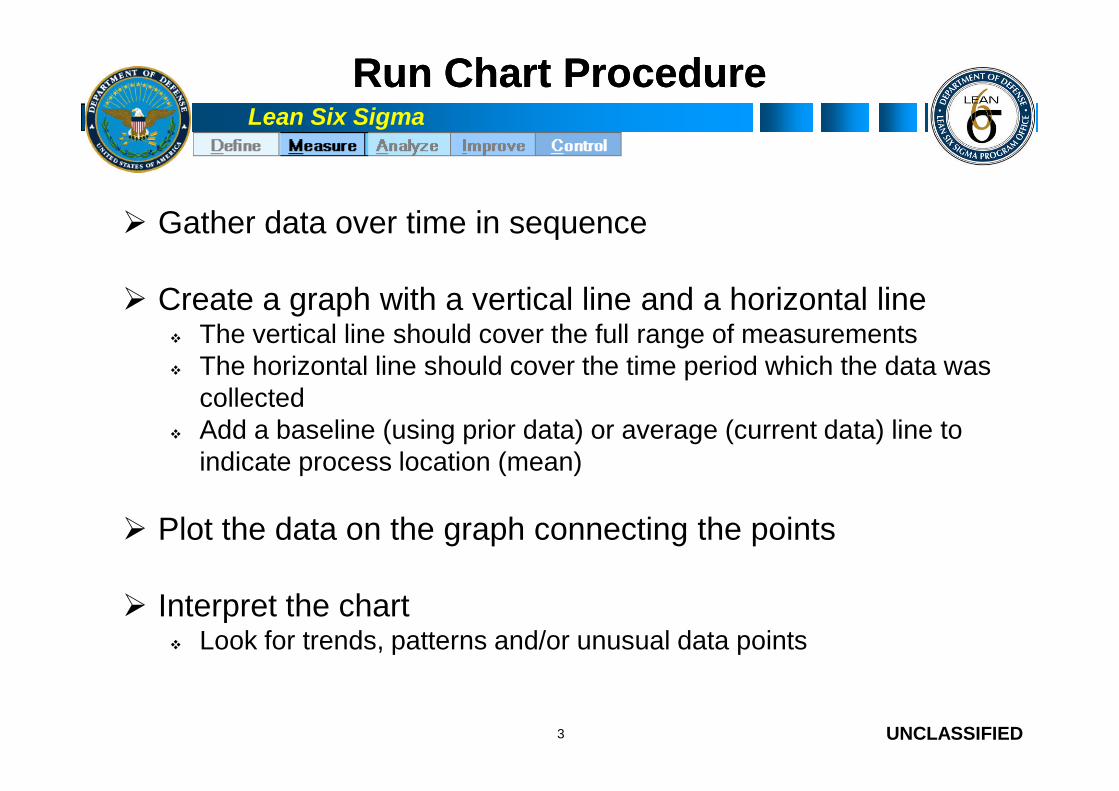
Run Chart ProcedureRun Chart Procedure
Gather data over time in sequence
Create a graph with a vertical line and a horizontal line The vertical line should cover the full range of measurements The horizontal line should cover the time period which the data was
collected
UNCLASSIFIED
collected Add a baseline (using prior data) or average (current data) line to
indicate process location (mean)
Plot the data on the graph connecting the points
Interpret the chart Look for trends, patterns and/or unusual data points
3
Lean Six Sigma
Run ChartRun Chart
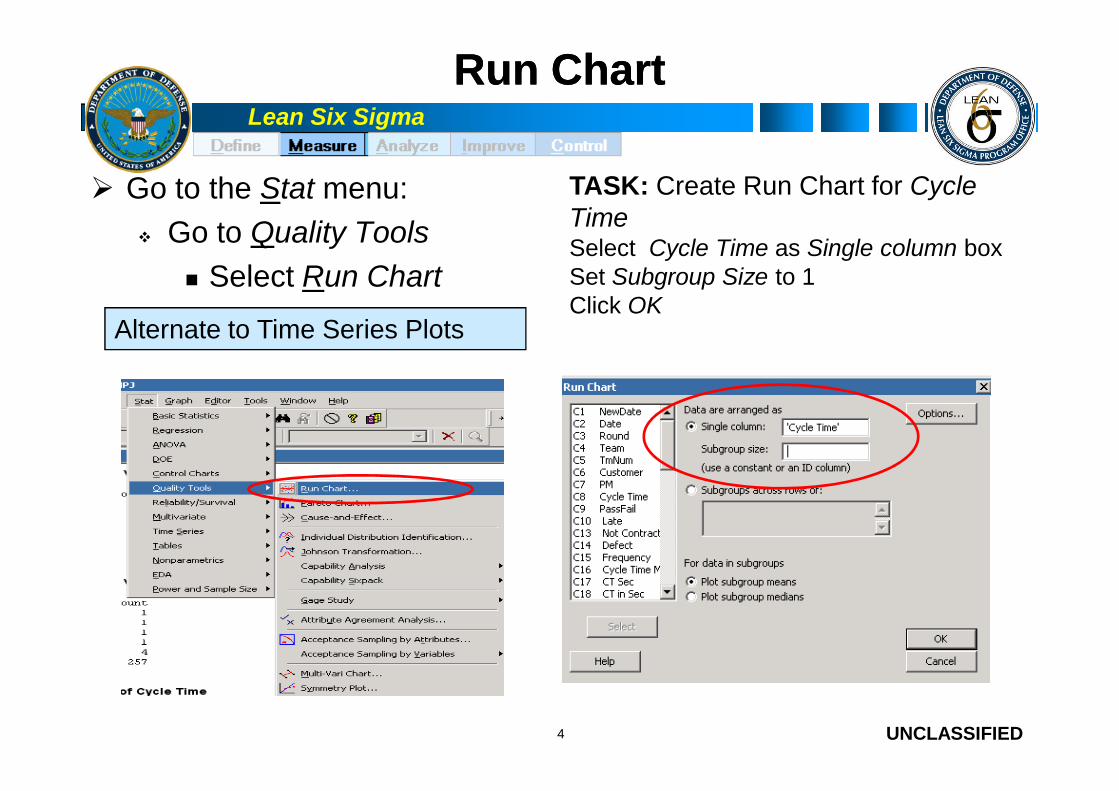
Go to the Stat menu:
Go to Quality Tools
Select Run Chart
Alternate to Time Series Plots
TASK: Create Run Chart for CycleTimeSelect Cycle Time as Single column boxSet Subgroup Size to 1Click OK
UNCLASSIFIED4
Lean Six Sigma
Run ChartRun Chart
UNCLASSIFIED
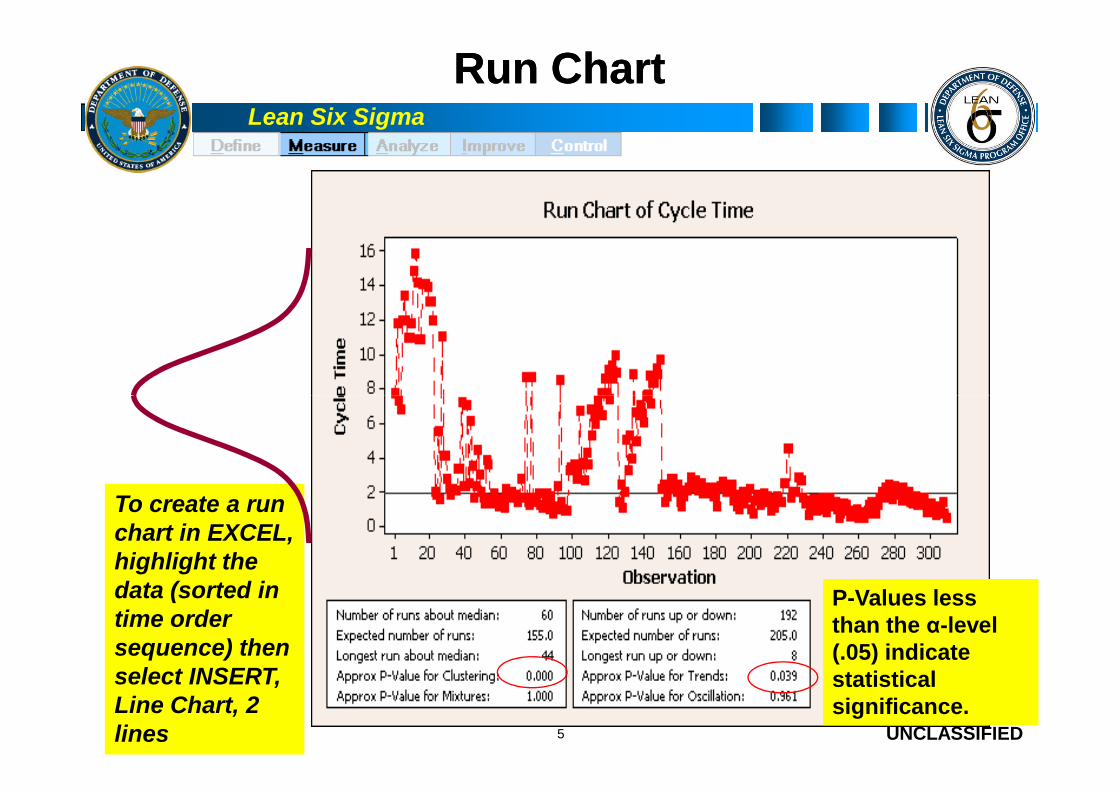
To create a runchart in EXCEL,highlight thedata (sorted intime ordersequence) thenselect INSERT,Line Chart, 2lines 5
P-Values lessthan the α-level(.05) indicatestatisticalsignificance.

Lean Six Sigma
ExerciseExercise:: Run ChartRun Chart
Using the data from Round 1 - create a Run Chart of yoursimulation data cycle time
Results?
UNCLASSIFIED6
10 minutes

Lean Six Sigma
Two Types of VariationTwo Types of Variation
Two types of variation are visible in a Control Chart:
UNCLASSIFIED7
Common CauseAlways present to somedegree in the process
Special CauseSomething different happeningat a certain time and place
Lean Six Sigma
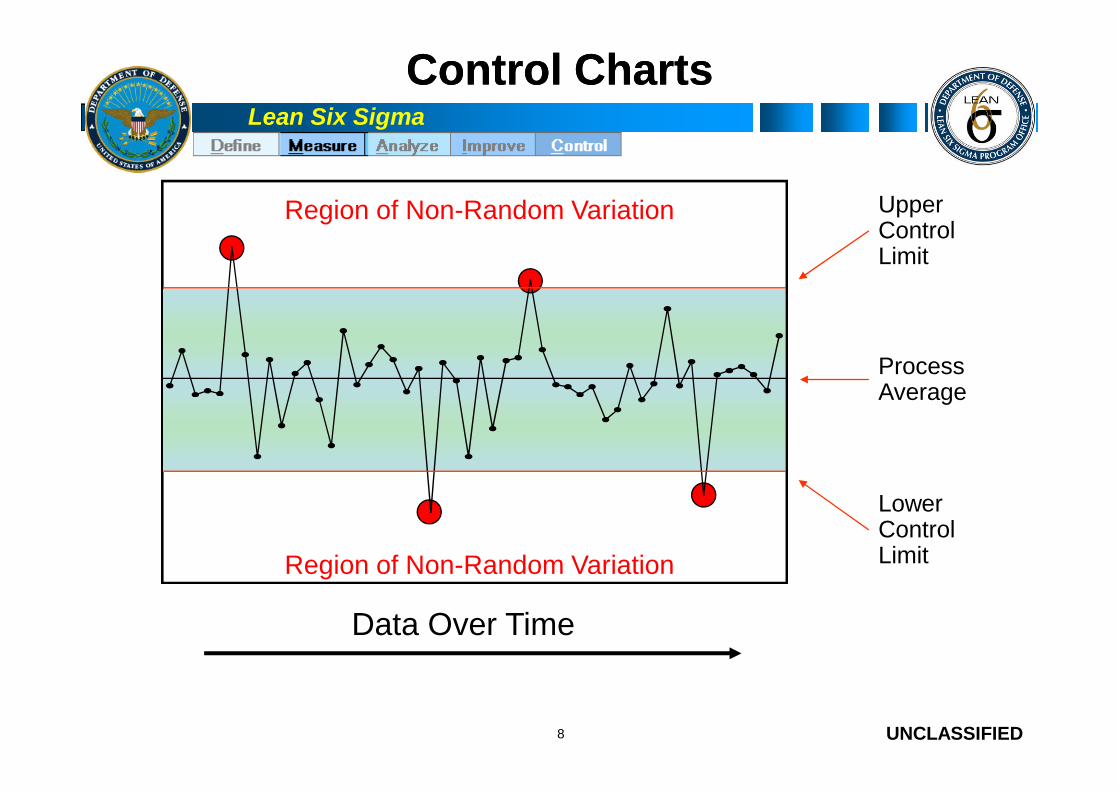
Control ChartsControl Charts
Region of Non-Random Variation UpperControlLimit
ProcessAverage
UNCLASSIFIED8
Region of Non-Random Variation
Data Over Time
Average
LowerControlLimit
Lean Six Sigma
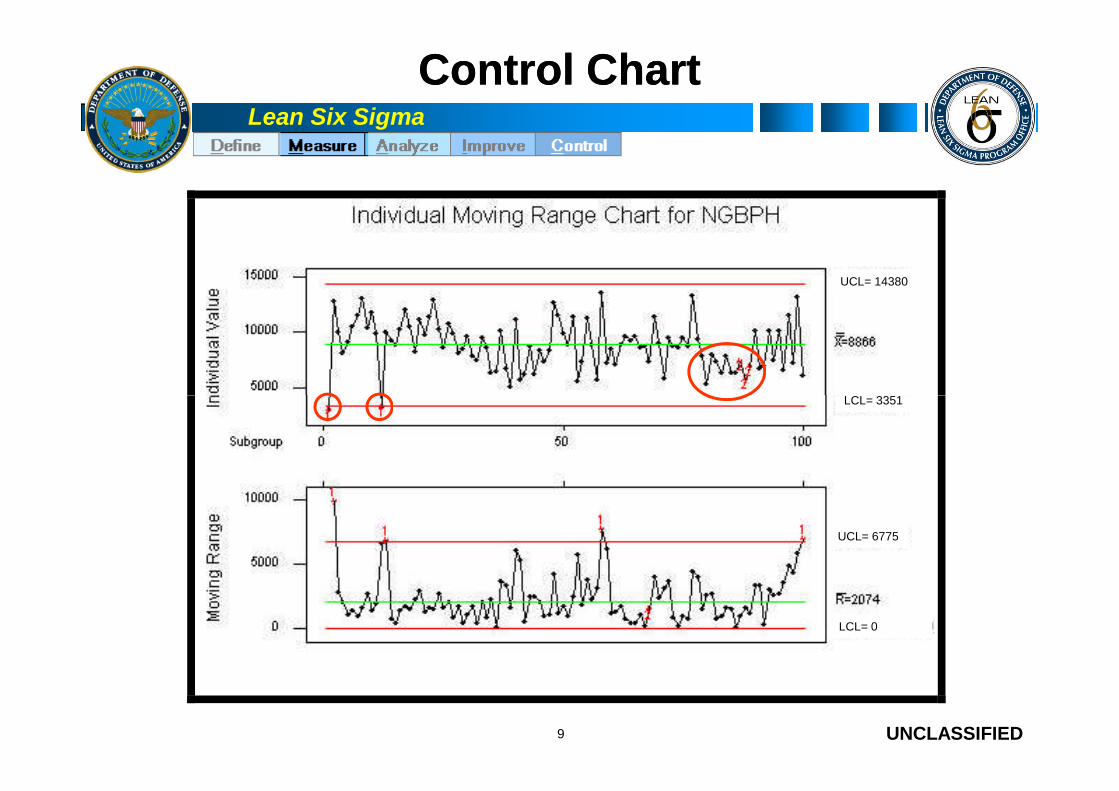
Control ChartControl Chart
UCL= 14380
LCL= 3351
UNCLASSIFIED9
LCL= 3351
UCL= 6775
LCL= 0
Lean Six Sigma
Control ChartsControl Charts
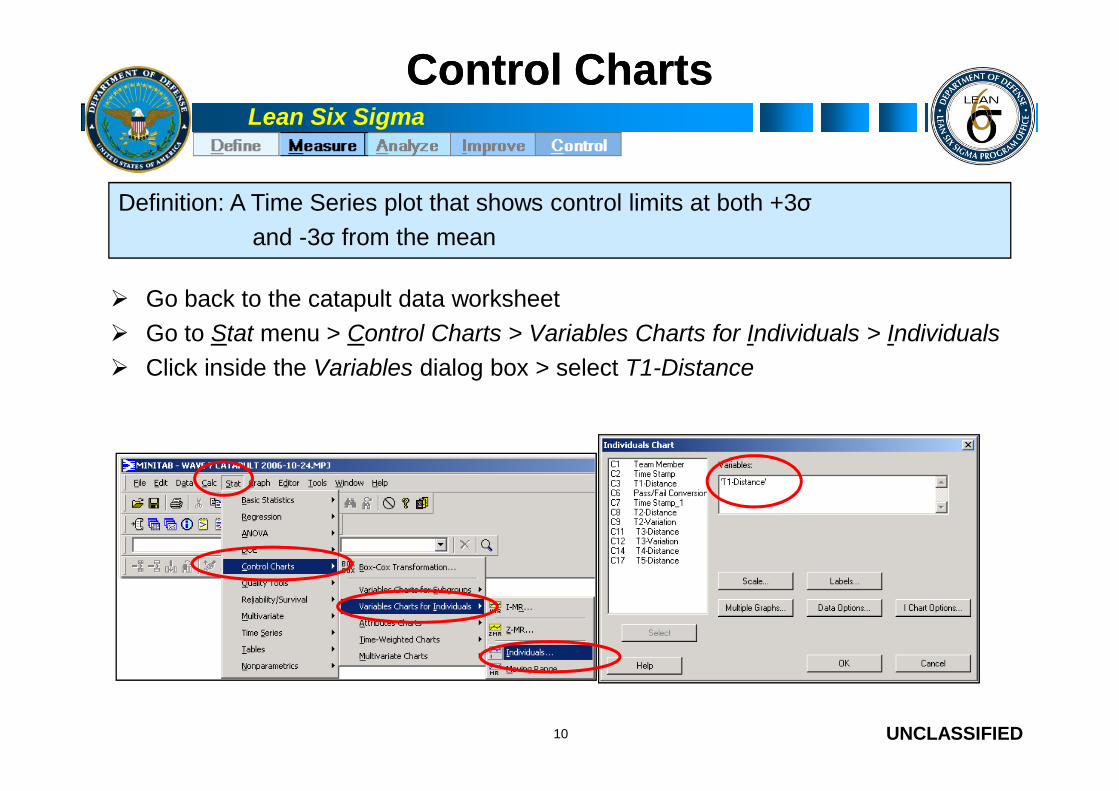
Go back to the catapult data worksheet
Go to Stat menu > Control Charts > Variables Charts for Individuals > Individuals
Click inside the Variables dialog box > select T1-Distance
Definition: A Time Series plot that shows control limits at both +3σ
and -3σ from the mean
UNCLASSIFIED10
Lean Six Sigma
Control ChartsControl Charts
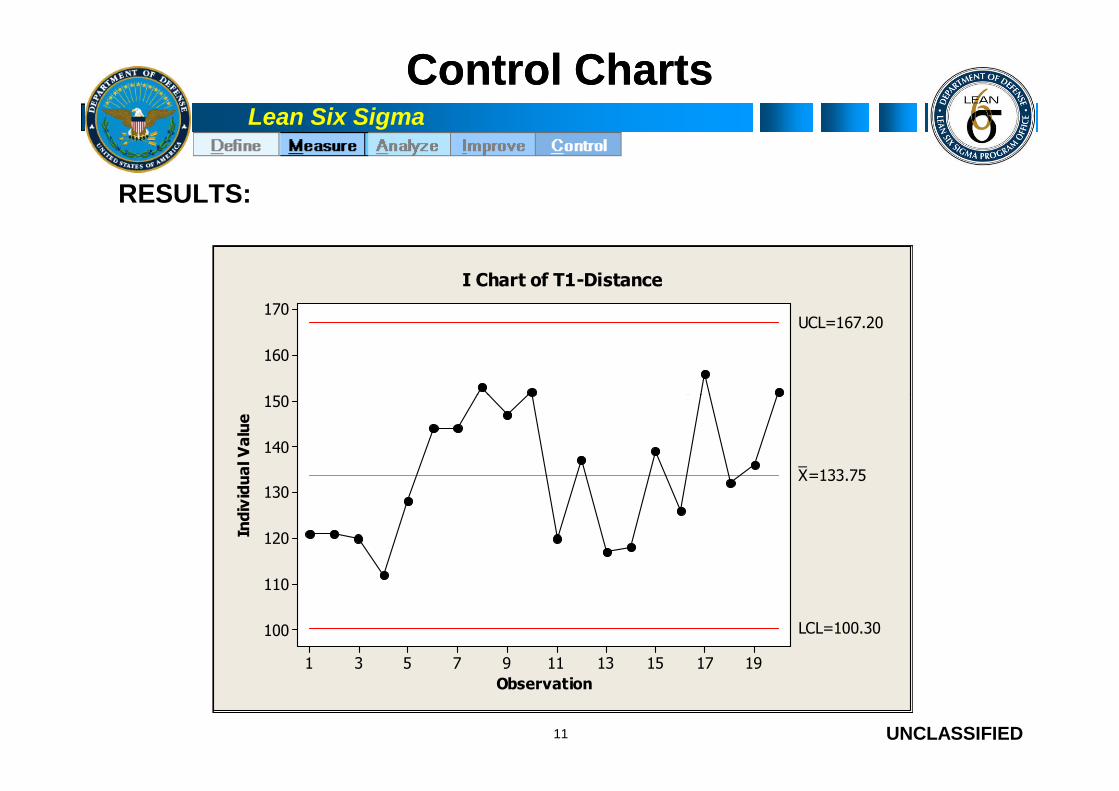
RESULTS:
170
160
150
UCL=167.20
I Chart of T1-Distance
UNCLASSIFIED
Observation
Ind
ivid
ua
lV
alu
e
191715131197531
150
140
130
120
110
100
_X=133.75
LCL=100.30
11

Lean Six Sigma
Control ChartsControl Charts
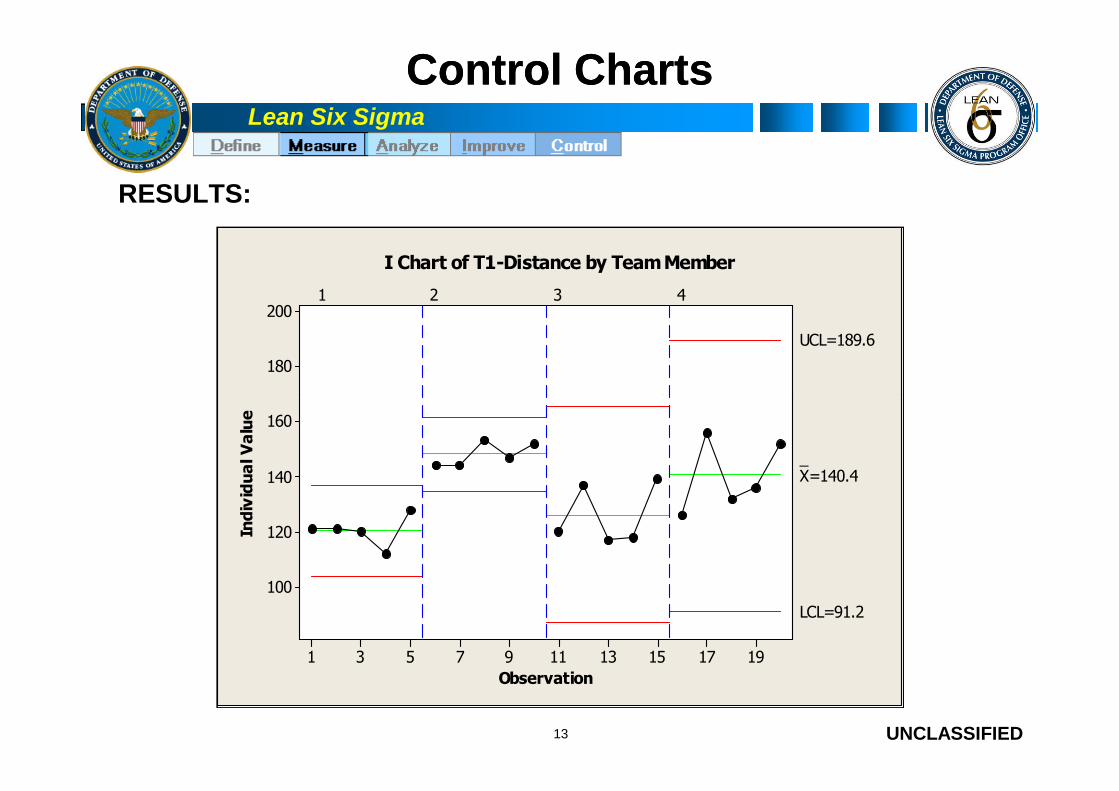
TASK: Remake plot with separate control limits for each team member:
On the toolbar click the icon “Bring up last dialog box” (#9) or use “Control-E”
Click on I Chart Options > Go to Stages tab
Click on the Define Stages box > select Team Member
UNCLASSIFIED
Click on the Define Stages box > select Team Member
Click OK twice
12
Lean Six Sigma
Control ChartsControl Charts
RESULTS:
200
180
UCL=189.6
1 2 3 4
I Chart of T1-Distance by TeamMember
UNCLASSIFIED
Observation
Ind
ivid
ua
lV
alu
e
191715131197531
160
140
120
100
_X=140.4
LCL=91.2
13

Lean Six Sigma
Control ChartsControl Charts
Control charts are simple run charts withstatistically generated limits!
102
103
104
105
UCL
Zone A
Zone B
Zone C
UNCLASSIFIED14
96
97
98
99
100
101
1 2 3 4 5 6 7 8 9 10 11 12 13 14 15 16 17 18 19 20 21 22 23 24 25 26 27 28 29 30
LCL
Center Line
Zone C
Zone B
Zone A

Lean Six Sigma
Out of Control Conditions: Extreme PointsOut of Control Conditions: Extreme Points
Out of control conditions are frequently detected bythe extreme point condition
UCL
Extreme Point (1 Point Beyond UCLor LCL)
A
B
UCL
2 Out of 3 Points on same sideof average in Zone A or Beyond
UNCLASSIFIED15
Note that the out of control point is always circled
CL
LCL
B
C
C
B
A
X
LCL

Lean Six Sigma
Out of Control Conditions: Extreme PointsOut of Control Conditions: Extreme Points
4 Out of 5 Points on the same side of the average inZone B or Beyond
A
B
UCL
UNCLASSIFIED16
B
C
C
B
A
X
LCL

Lean Six Sigma
Out of Control Conditions: Trends & ShiftsOut of Control Conditions: Trends & Shifts
Trend (6 Points in a RowSteadily Increasing or
Decreasing)
UCL UCL
Process Shift (9 Points in aRow on one side of the
average)
UNCLASSIFIED17
UCL
LCL
CL
UCL
LCL
CL

Lean Six Sigma
Out of Control Conditions: OscillationOut of Control Conditions: Oscillation
Oscillation(14 Successive PointsAlternating Up and Down)
UCL
15 Successive Points AlternatingUp and Down in Zone C (aboveand below the average)
A
B
C
UCL
UNCLASSIFIED18
LCL
CLC
C
B
A
X
LCL
Possible Cause(s): Overcontrol of the process, e.g., adjusting the machine after almostevery piece. Two different processes occurring simultaneously, two different machines,
two different operators, etc.
Lean Six Sigma
Control ChartsControl Charts
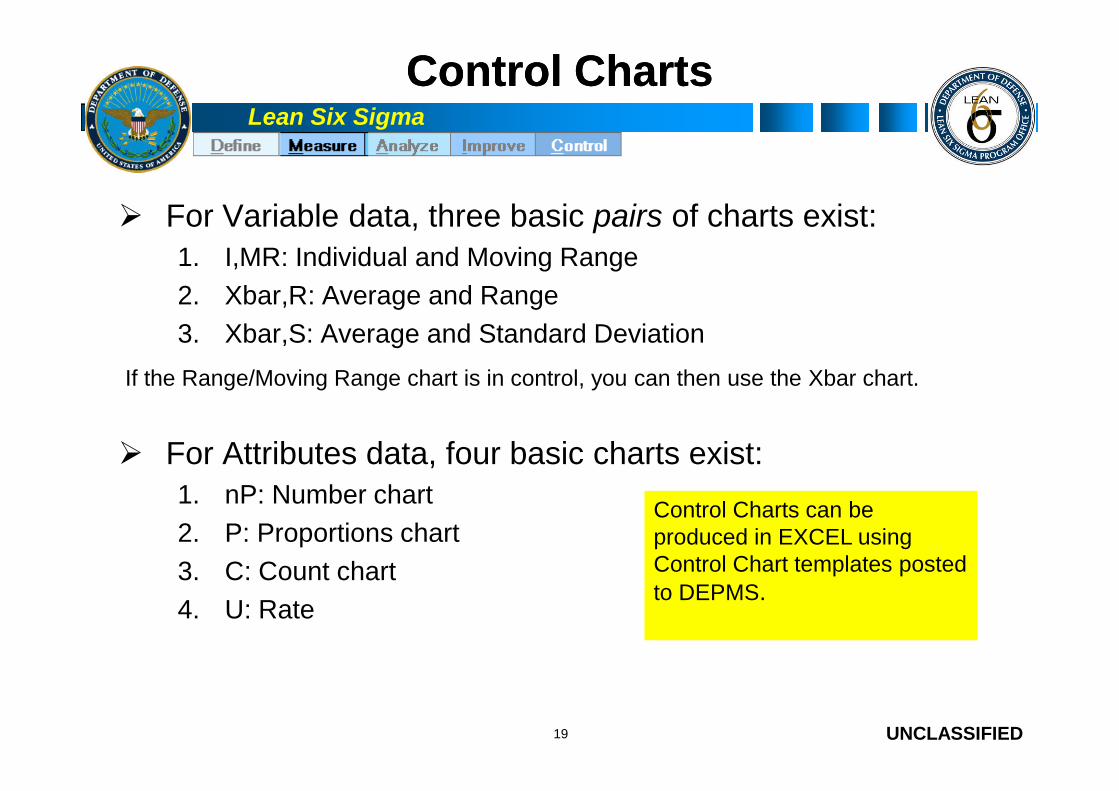
For Variable data, three basic pairs of charts exist:1. I,MR: Individual and Moving Range
2. Xbar,R: Average and Range
3. Xbar,S: Average and Standard Deviation
If the Range/Moving Range chart is in control, you can then use the Xbar chart.
UNCLASSIFIED
For Attributes data, four basic charts exist:1. nP: Number chart
2. P: Proportions chart
3. C: Count chart
4. U: Rate
19
Control Charts can beproduced in EXCEL usingControl Chart templates posted
to DEPMS.

Lean Six Sigma
Continuous Data Control ChartsContinuous Data Control Charts
Measurement(Continuous/Variable Data)
Subgroup Size of 1 Subgroup Size > 9Subgroup Size 3-9
UNCLASSIFIED
Xbar-R
20
I-MR Xbar-S
•Process with few data points•Sampling is very expensive•Sampling is by destructive testing•Building data to begin anotherchart type
•Monitors repetitiveprocesses•Practictioners frequentlychoose subgroups of 5
Similar to Xbar-R ChartLarger sample sizes
Stat > Control Charts > Variable Charts for SubgroupsXbar-R, Enter variableand subgroup size
Xbar-S , Enter variableand subgroup size
Stat > Control Charts > VariableCharts for Individuals > I-MR,Enter variable

Lean Six Sigma
What do you do first?What do you do first?
UNCLASSIFIED21
Since Moving Range Chart is out of control, investigate these out of control pointsfirst to determine cause.
Lean Six Sigma
Attribute ControlAttribute Control ChartsCharts
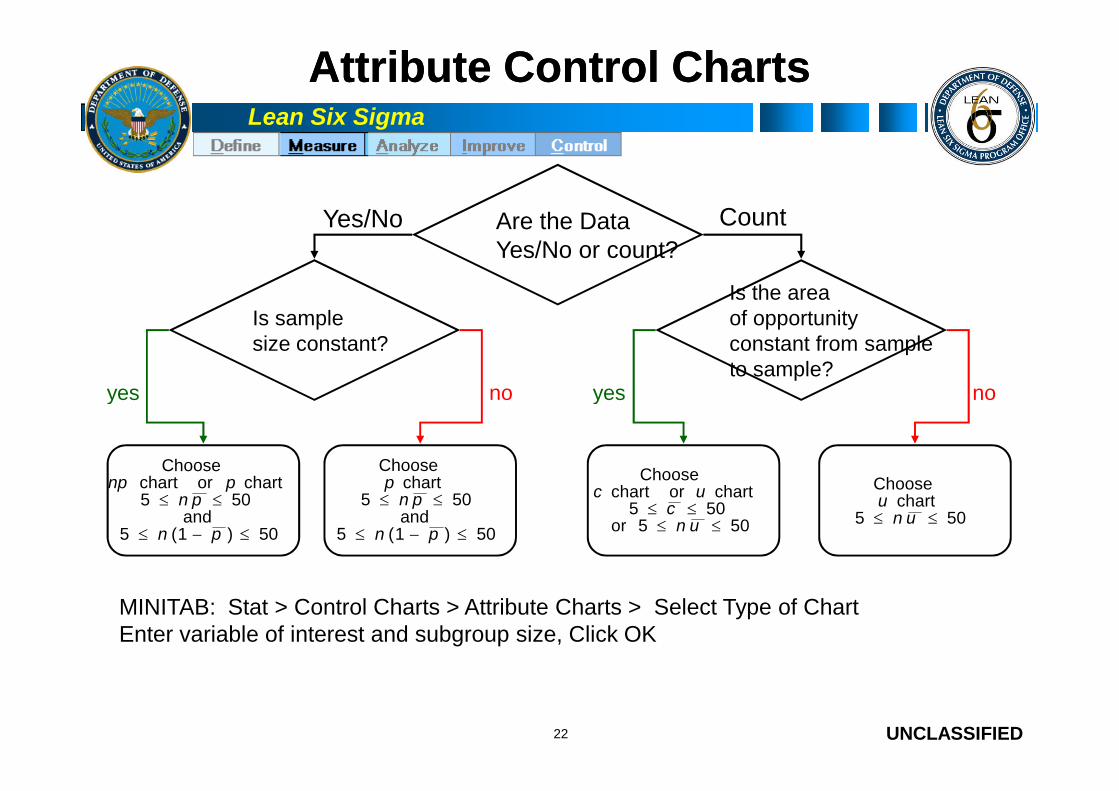
Are the DataYes/No or count?
Is samplesize constant?
Is the areaof opportunityconstant from sampleto sample?
Yes/No Count
yes no yes no
UNCLASSIFIED22
yes no yes no
50)1(5and
505chartorchart
Choose
pn
pnpnp
50)1(5and
505chart
Choose
pn
pnp
505or505chartorchart
Choose
un
cuc
505chart
Choose
unu
MINITAB: Stat > Control Charts > Attribute Charts > Select Type of ChartEnter variable of interest and subgroup size, Click OK

Lean Six Sigma
ExerciseExercise:: Control ChartControl Chart
What type of Control Chart should you use to assess theRound 1 simulation ?
Using the data from Round 1 - create a Control Chart ofyour simulation data cycle time
Results?
UNCLASSIFIED
Results?
23
10 minutes
Lean Six Sigma
TakeawaysTakeaways
When a process is “in control” This implies a stable, predictable amount of variation
(common cause variation)
This does not mean a “good” or desirable amount ofvariation
When a process is “out-of-control”
UNCLASSIFIED
When a process is “out-of-control” This implies an unstable, unpredictable amount of variation
It is subject to both common AND special causes ofvariation
A process can be in statistical control and notcapable of consistently producing good outputwithin specification limit.
24

Lean Six Sigma
Process CapabilityProcess Capability
Once a process is in statistical control, you want todetermine if it is Capable -- Is it meeting specificationlimits and producing “good” or satisfactory services ordeliverables? You can determine capability by computing the # ofDefects per Unit, Defects Per Opportunity and Defects
UNCLASSIFIED25
Defects per Unit, Defects Per Opportunity and DefectsPer Million Opportunities, and Rolled ThroughputYield. You can also determine capability by comparing thewidth of the Process Variation (Voice of the Process) withthe width of the specification limits (Voice of theCustomer).
Measure the # of standard deviations that fit between theProcess mean and the closest specification limit to derive thesigma level.
Lean Six Sigma
Exercise 1AExercise 1A
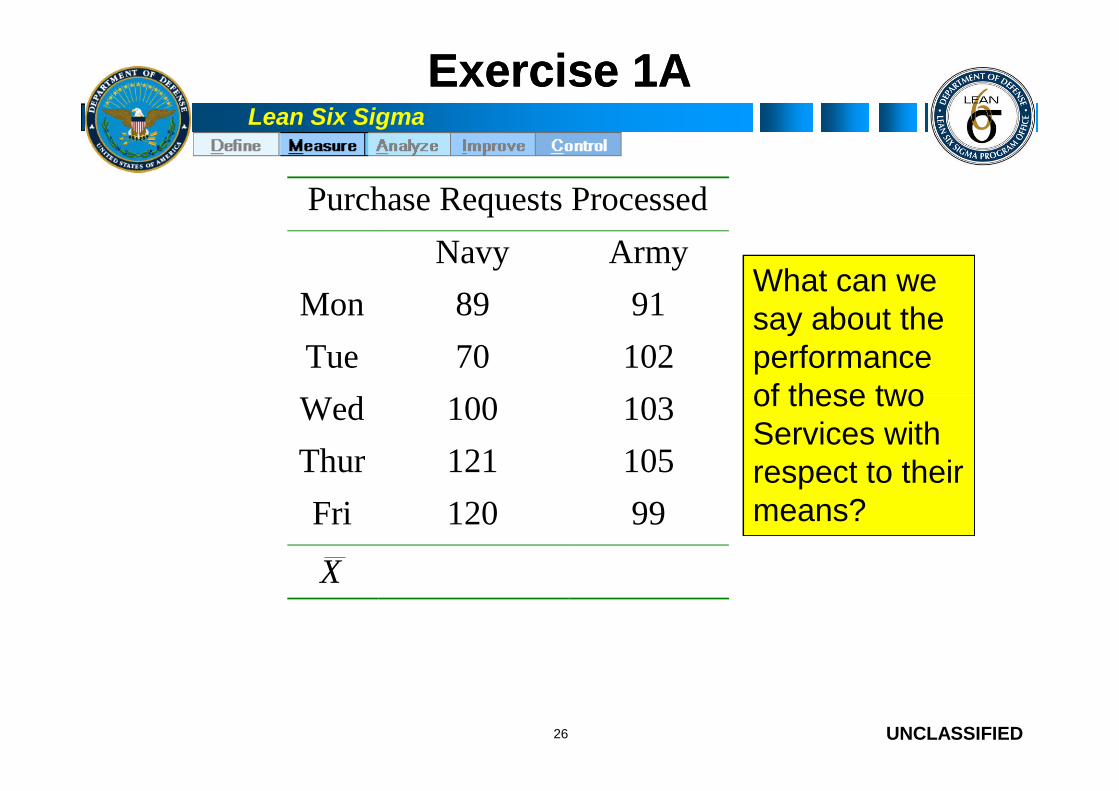
Purchase Requests Processed
Navy Army
Mon 89 91
Tue 70 102
Wed 100 103
What can wesay about theperformanceof these two
UNCLASSIFIED26
Wed 100 103
Thur 121 105
Fri 120 99
X
of these twoServices withrespect to theirmeans?

Lean Six Sigma
Exercise 1AExercise 1A
Purchase Requests Processed
Navy Army
Mon 89 91
Tue 70 102
The Servicesare equal inperformance,
UNCLASSIFIED
Tue 70 102
Wed 100 103
Thur 121 105
Fri 120 99
X
27
but is theremore to thestory?
100 100
Lean Six Sigma
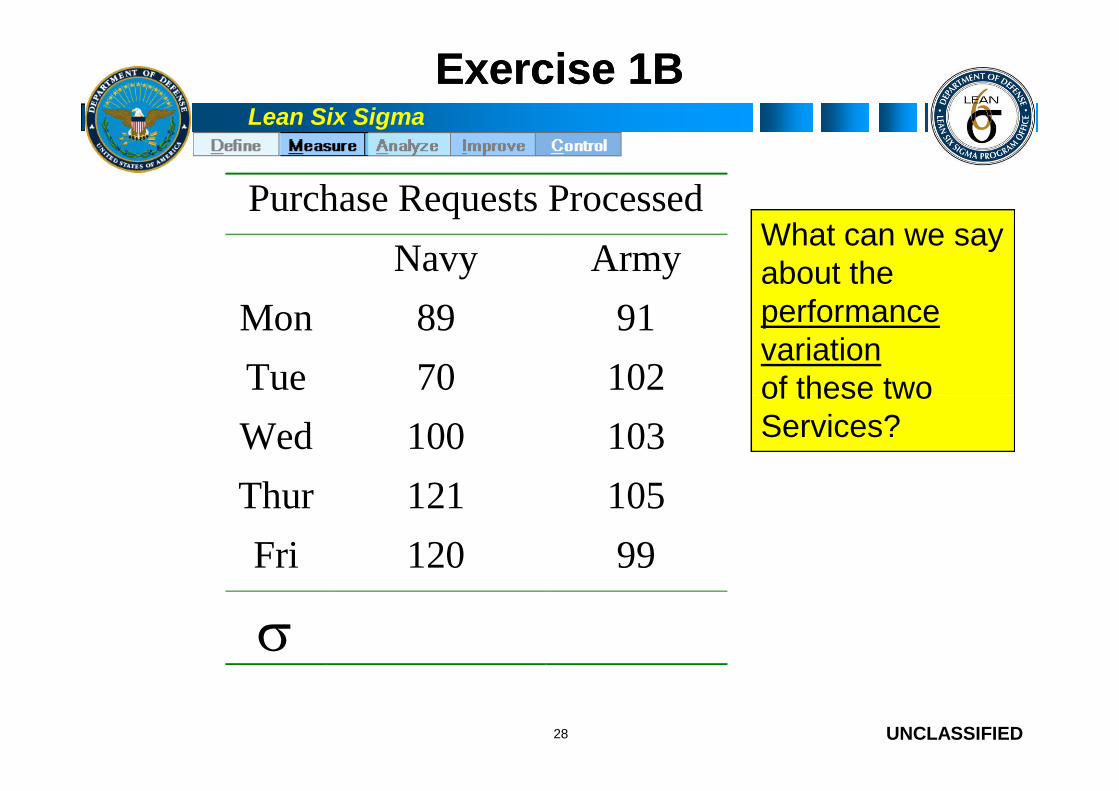
Exercise 1BExercise 1B
What can we sayabout theperformancevariationof these two
Purchase Requests Processed
Navy Army
Mon 89 91
Tue 70 102
UNCLASSIFIED28
of these twoServices?
Tue 70 102
Wed 100 103
Thur 121 105
Fri 120 99

Lean Six Sigma
Exercise 1BExercise 1B
Purchase Requests Processed
Navy Army
Mon 89 91
Tue 70 102
Navy is much morevaried. What arethe implications?
UNCLASSIFIED
Tue 70 102
Wed 100 103
Thur 121 105
Fri 120 99
29
21.6 5.5

Lean Six Sigma
Measures of PerformanceMeasures of Performance
If we know the process mean and the process sigma,then we can describe the performance of the process.
But:How do we know if the process performance is good or bad?
UNCLASSIFIED
How do we know if the process performance is good or bad?
Who should determine if performance is good enough?
30
?
Lean Six Sigma
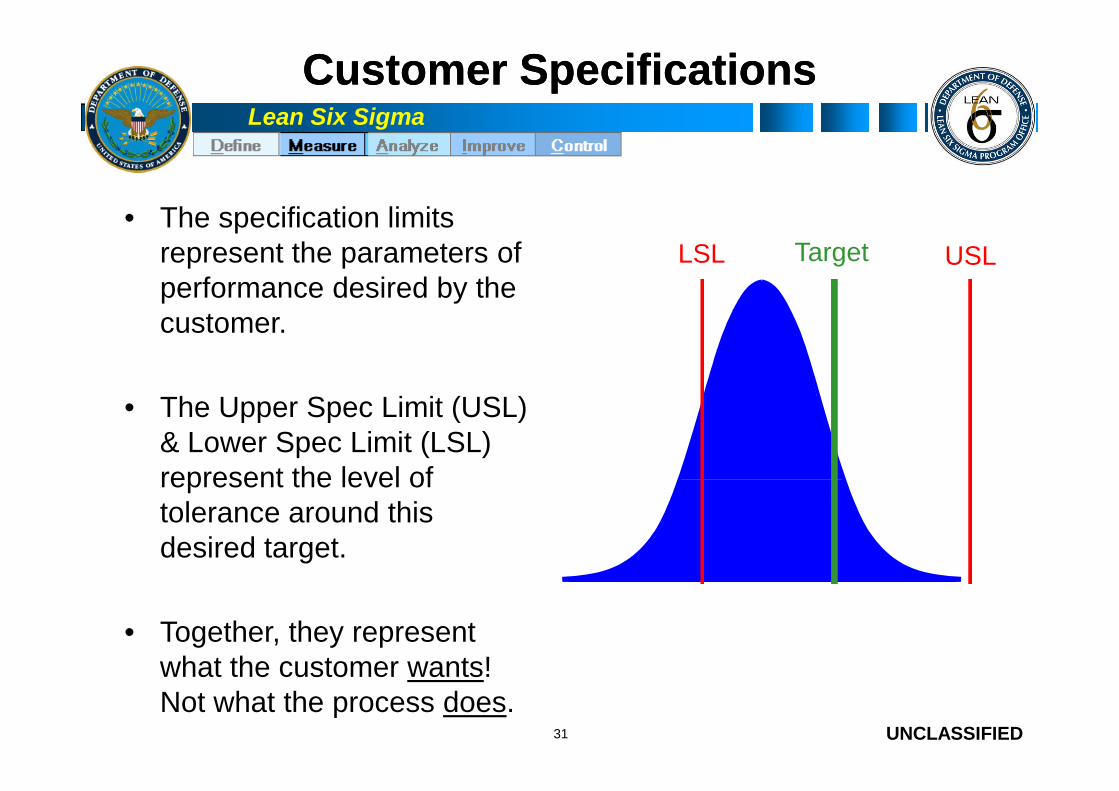
Customer SpecificationsCustomer Specifications
Target USLLSL
• The specification limitsrepresent the parameters ofperformance desired by thecustomer.
• The Upper Spec Limit (USL)
UNCLASSIFIED31
• The Upper Spec Limit (USL)& Lower Spec Limit (LSL)represent the level oftolerance around thisdesired target.
• Together, they representwhat the customer wants!Not what the process does.

Lean Six Sigma
Sigma LevelSigma Level
Sigma Level (or Z-value): the number of Sigma between theprocess mean and the nearest specification limit
Mean Target
If we know:
The Mean of the process +
The s of the process +
UNCLASSIFIED32
Mean1 2 3 4 5-3 -2 -1
Target The Specifications set by
the customer
Then: We can determine the Sigma
Level of the process

Lean Six Sigma
A 3A 3ss ProcessProcess
-6s -5s -4s -3s -2s -1s 1s 2s 3s 4s 5s 6sMean
UNCLASSIFIED33
MeanLSL USL
Lean Six Sigma
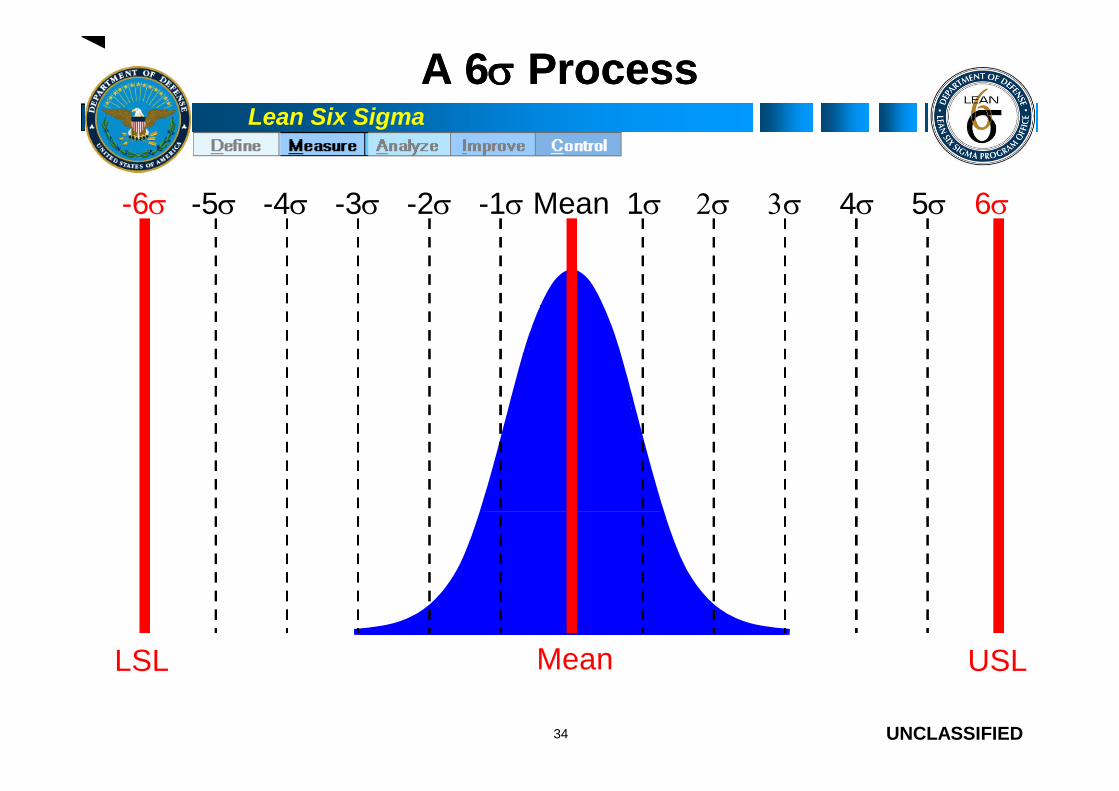
A 6A 6ss ProcessProcess
-6s -5s -4s -3s -2s -1s 1s 2s 3s 4s 5s 6sMean
UNCLASSIFIED34
MeanLSL USL
Lean Six Sigma
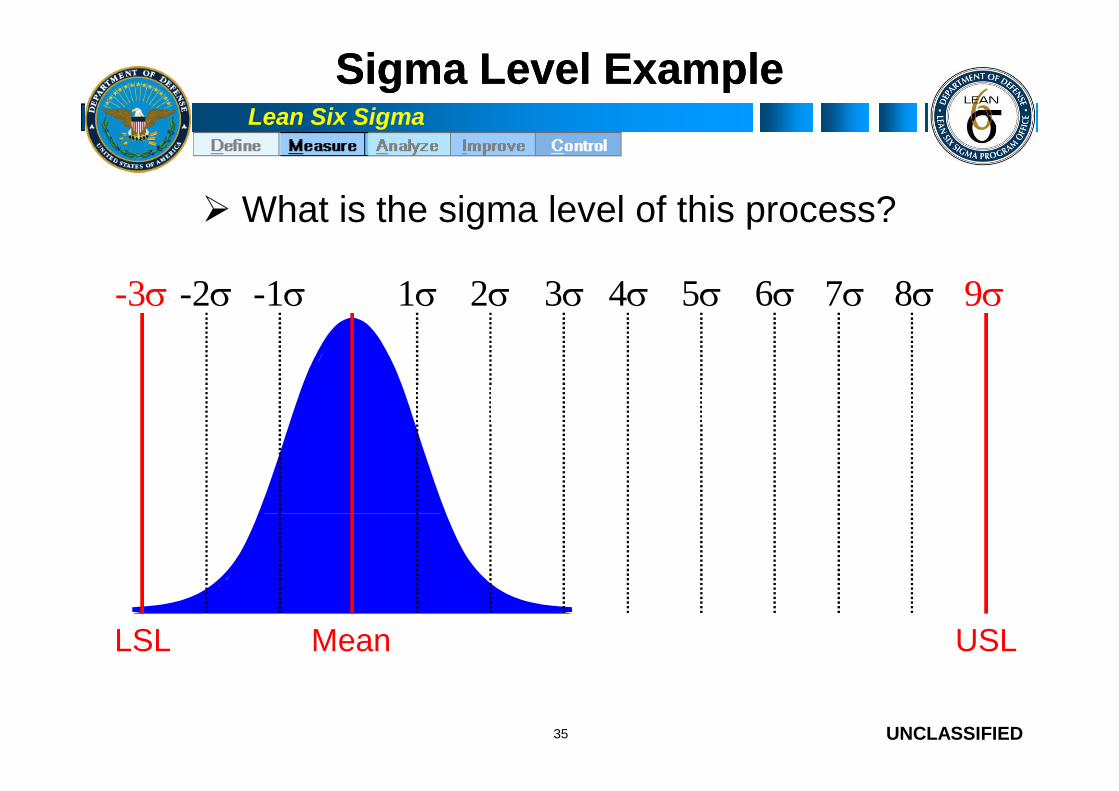
Sigma Level ExampleSigma Level Example
1 2 3 4 5 6-3 -2 -1 7 8 9
What is the sigma level of this process?
UNCLASSIFIED35
Mean USLLSL

Lean Six Sigma
Sigma Level ExampleSigma Level Example
1 2 3 4 5 6-3 -2 -1 7 8 9
UNCLASSIFIED36
Mean USLLSL
USL - Mean = 9
Lean Six Sigma
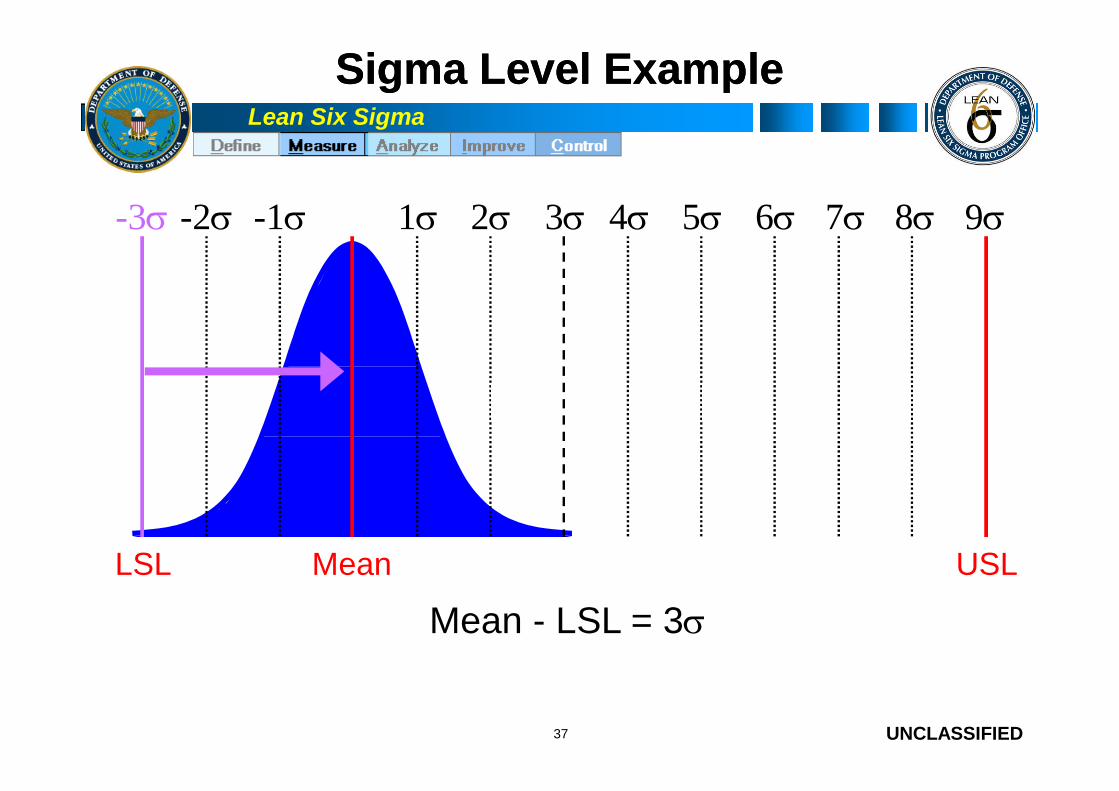
Sigma Level ExampleSigma Level Example
1 2 3 4 5 6-3 -2 -1 7 8 9
UNCLASSIFIED37
Mean USLLSL
Mean - LSL = 3

Lean Six Sigma
Sigma Level ExampleSigma Level Example
1 2 3 4 5 6-3 -2 -1 7 8 9
UNCLASSIFIED38
Mean USLLSL
• The “Process Sigma” is:• The lesser of (USL-Mean) & (Mean-LSL) stated in units of s

Lean Six Sigma
Sigma Level FormulaSigma Level Formula
The Sigma level of a process is the lesser of:
UNCLASSIFIED39
XUSL
LSLX
or
Lean Six Sigma
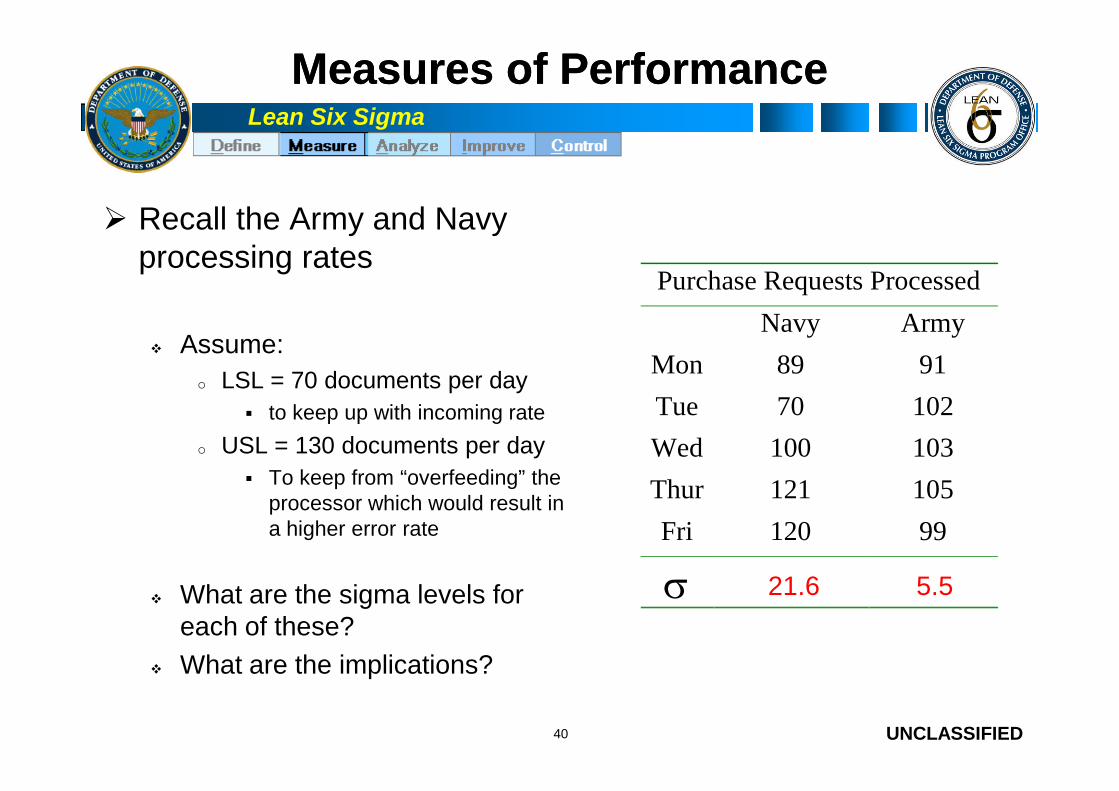
Measures of PerformanceMeasures of Performance
Recall the Army and Navyprocessing rates
Assume:
o LSL = 70 documents per day
Purchase Requests Processed
Navy Army
Mon 89 91
Tue 70 102
UNCLASSIFIED
to keep up with incoming rate
o USL = 130 documents per day
To keep from “overfeeding” theprocessor which would result ina higher error rate
What are the sigma levels foreach of these?
What are the implications?
40
Tue 70 102
Wed 100 103
Thur 121 105
Fri 120 99
21.6 5.5
Lean Six Sigma
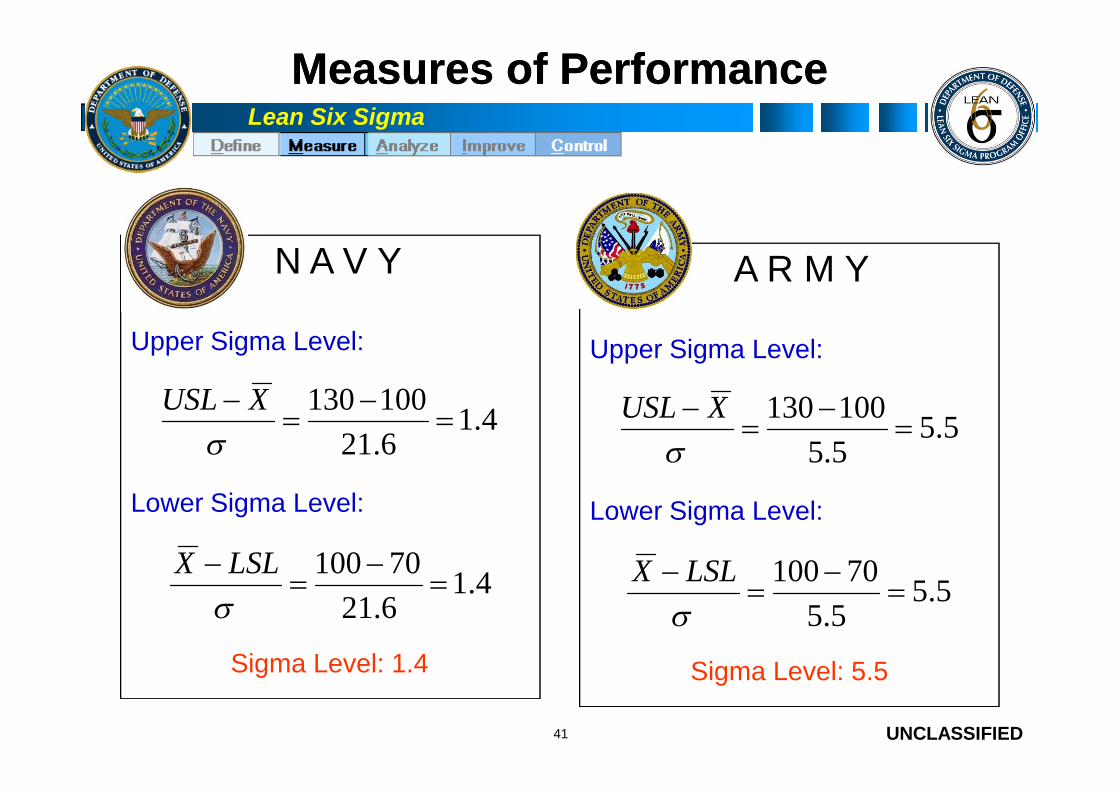
Measures of PerformanceMeasures of Performance
100130 XUSL
Upper Sigma Level:
100130 XUSL
Upper Sigma Level:
A R M YN A V Y
UNCLASSIFIED41
4.16.21
100130
XUSL
4.16.21
70100
LSLX
Lower Sigma Level:
Sigma Level: 1.4
5.55.5
100130
XUSL
5.55.5
70100
LSLX
Sigma Level: 5.5
Lower Sigma Level:
Lean Six Sigma
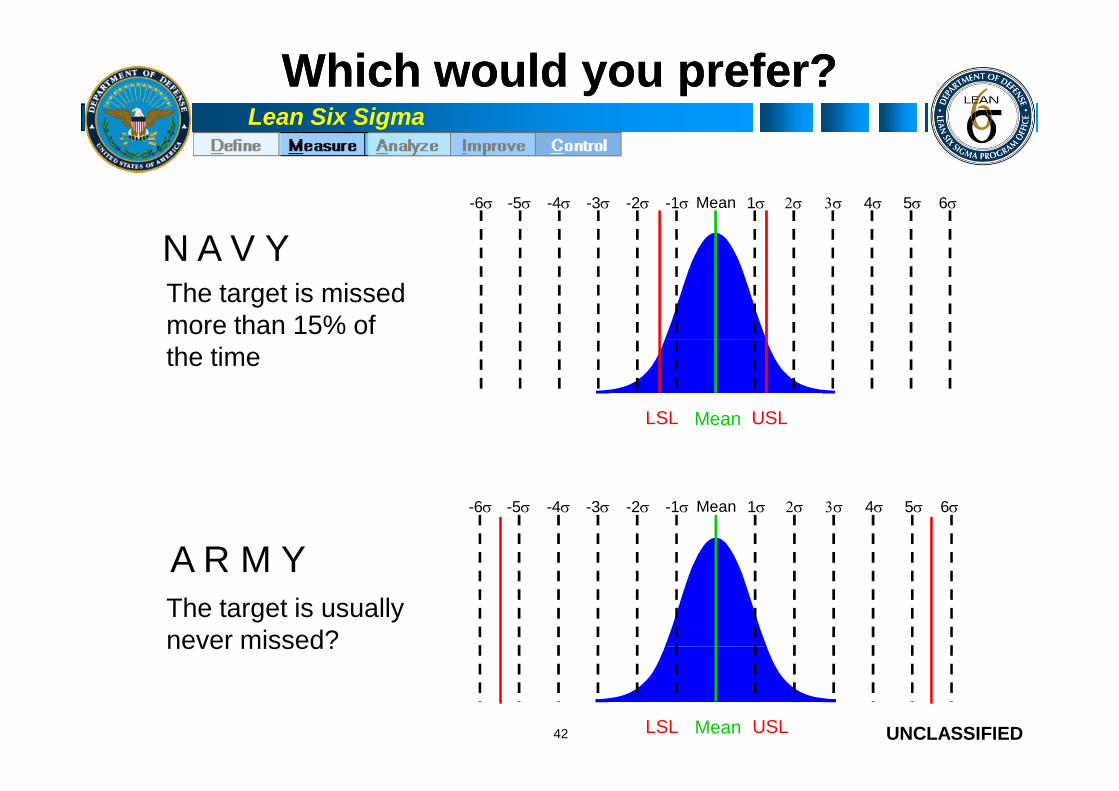
Which would you prefer?Which would you prefer?
-6s -5s -4s -3s -2s -1s 1s 2s 3s 4s 5s 6sMean
The target is missedmore than 15% ofthe time
N A V Y
UNCLASSIFIED42
MeanLSL USL
-6s -5s -4s -3s -2s -1s 1s 2s 3s 4s 5s 6sMean
MeanLSL USL
The target is usuallynever missed?
A R M Y

Lean Six Sigma
Different Sigma Process LevelsDifferent Sigma Process Levels
-6s-5s-4s-3s-2s-1s 1s 2s 3s 4s 5s 6s
3s Process
UNCLASSIFIED43
MeanLSL USL-6s-5s-4s-3s-2s-1s 1s 2s 3s 4s 5s 6s
MeanLSL USL
6s Process

Lean Six Sigma
Importance of Reducing VariationImportance of Reducing Variation
Defects Defects
Too early Too late
Reducevariation
Too early Too late
• To increase a process sigma level, you have to decreasevariation.
UNCLASSIFIED44
Delivery Timevariation
Delivery Time
Spread of variationtoo wide compared
to specifications
Spread of variationnarrow compared to
specifications
• Less variation provides:
Greater reliability in the process
Less waste and rework, which lowers costs
Products and services that perform better and last longer
Happier customers

Lean Six Sigma
ImprovementImprovement--Focused ScaleFocused Scale
DPMO s
308,537 2
66,807 3
6,210 4
Increase inSigmarequiresexponentialdefectreduction
UNCLASSIFIED45
6,210 4
233 5
3.4 6
ProcessCapability
Defects perMillion
Opportunities
(distribution shifted ±1.5s)
reduction
“trim the fat”
Lean Six Sigma
Additional Metrics of Six SigmaAdditional Metrics of Six Sigma
In addition to Sigma Level, four other performancemetrics are of interest: Defects Per Unit (DPU)
Process Capability
Defects Per Million Opportunities (DPMO)
UNCLASSIFIED
Defects Per Million Opportunities (DPMO)
Rolled Throughput Yield
If you know one…you can determine the others
46
Suduko

Lean Six Sigma
Defectives & DefectsDefectives & Defects
A defective unit is that which fails tomeet customer requirements orstandards Late order, incorrect invoice, short-count,
etc.
UNCLASSIFIED
A defect is any reason for such afailure Not filed correctly, incorrect line item,
transposed numbers, etc.
A defective unit can have more thanone defect
47
Lean Six Sigma
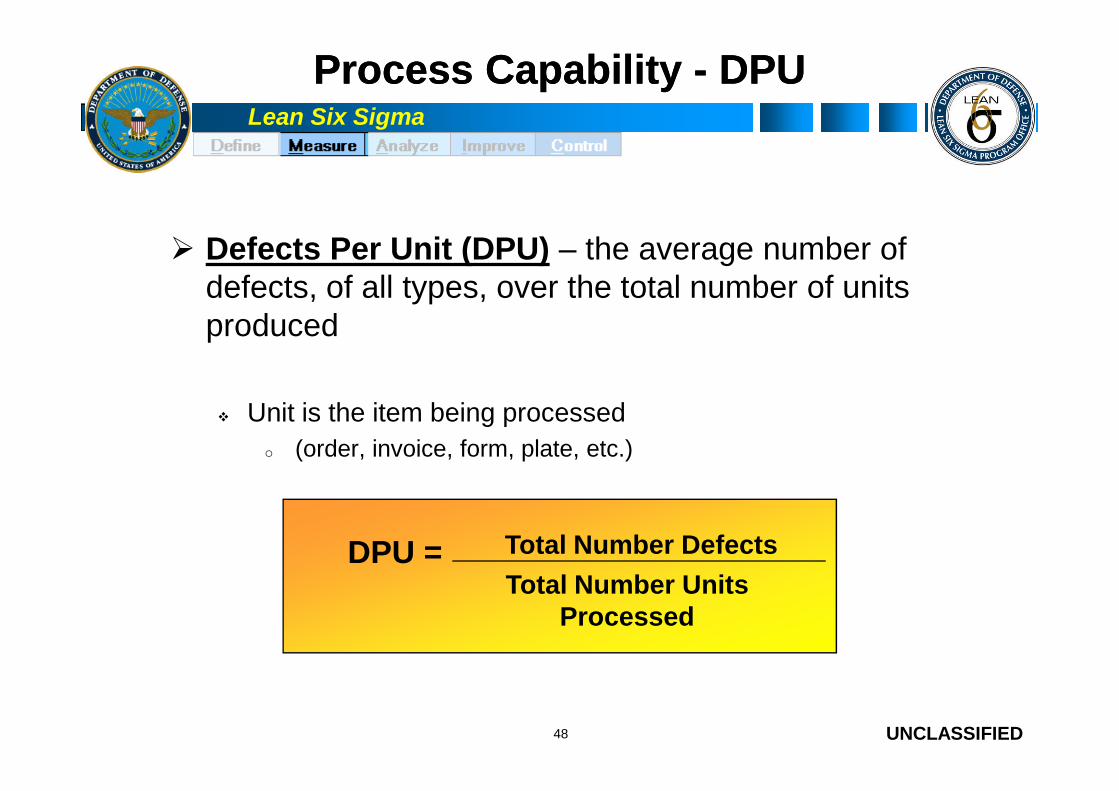
Process CapabilityProcess Capability -- DPUDPU
Defects Per Unit (DPU) – the average number ofdefects, of all types, over the total number of unitsproduced
UNCLASSIFIED
Unit is the item being processed
o (order, invoice, form, plate, etc.)
48
DPU =Total Number Units
Processed
Total Number Defects
Lean Six Sigma
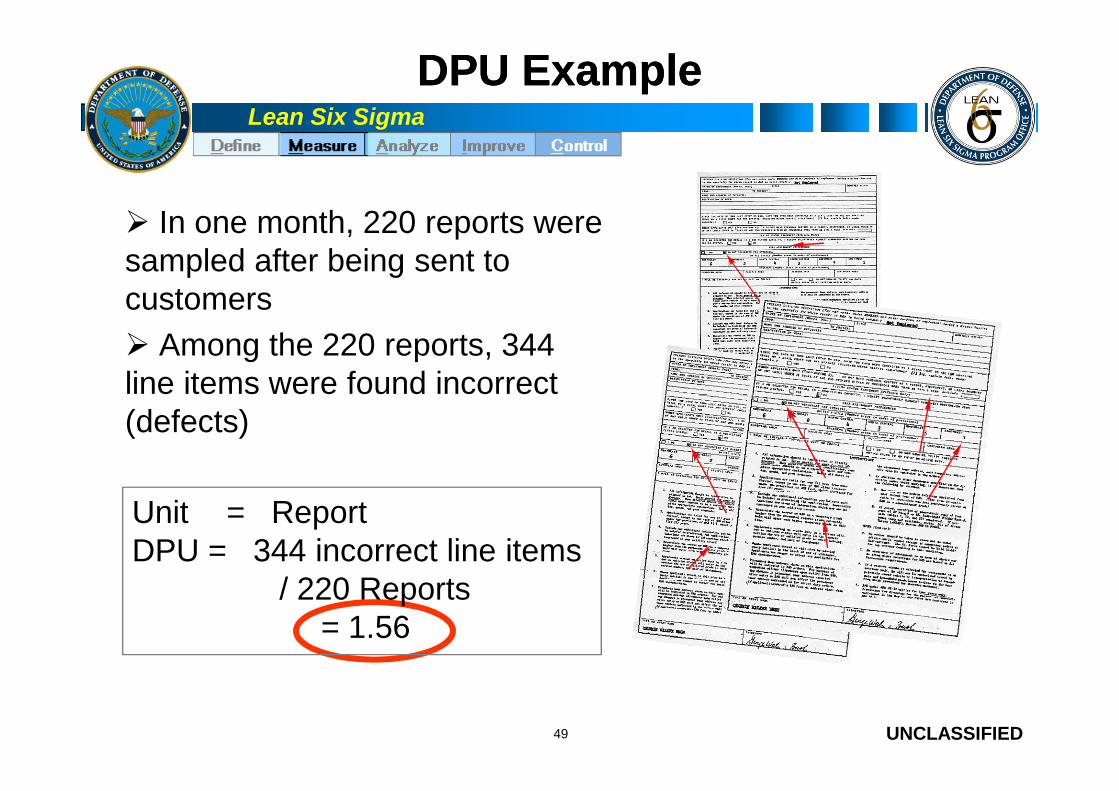
DPU ExampleDPU Example
In one month, 220 reports weresampled after being sent tocustomers
Among the 220 reports, 344line items were found incorrect
UNCLASSIFIED
line items were found incorrect(defects)
49
Unit = ReportDPU = 344 incorrect line items
/ 220 Reports= 1.56

Lean Six Sigma
Process CapabilityProcess Capability –– DPO, DPMO, SLDPO, DPMO, SL
If you were checking 4 fields oneach report, and each fieldrepresented an opportunity for adefect, then the Defects PerOpportunity (DPO) would be344 / (220 * 4) = 344/880= .39
DPO =Total Number Defects
Total Number Opportunities
for Defect
UNCLASSIFIED
Convert DPO to Defects perMillion Opportunities bymultiplying DPO by a million.
DPMO = 390,000
Convert DPMO to Sigma Level(SL) using chart or formula
Sigma Level = 1.78
DPMO = DPO * 1,000,000
50
SL = NORMSINV(1-(DPMO/1000000))+1.5
or
SL= NORMSINV(1 – DPO)+1.5

Lean Six Sigma
Process CapabilityProcess Capability -- RTYRTY
Rolled Throughput Yield(RTY) is the probability thata single unit can passthrough a series of processsteps free of defects.
Process A has 4 steps:
Step 1, 100 units enter, 10 arescrapped and 5 are reworked to get90. Yield = (100- (10+5)) / 100 = .85
Step 2, 90 units in from Step 1, 10scrapped and 7 are reworked to get80. (90-(10+7))/90 = .815 rework
UNCLASSIFIED
80. (90-(10+7))/90 = .81
Step 3, 80 units in from Step 2, 5scrapped and 3 reworked to get 75.(80-(5+3))/80 = .9
Step 4, 75 units in, 5 scrapped and10 reworked to get 70. (75-(5+10)/75= .8
RTY = .85 * .81 * .9 * .8 = .49572
= 50% yield
51
Step 1
Step 2
Step 3
Step 4
100
10
SCRAP
75
80
90
105
5
5 rework
7 rework
3 rework10 rework
70

Lean Six Sigma
266 data pointscollected between 11/1/04thru 11/30/04
Mean 29 days, St. Dev.2.9 days, CP is 1.16indicating process needscentering to the LSL of 10and USL of 30 days. Cpk
LSL Target USL
Potential (Within) C apability
C C pk 1.16
O v erall C apability
Pp 1.24
PPL 2.37
PPU 0.11
Ppk
C p
0.11
1.16
C PL 2.22
C PU 0.10
C pk 0.10Within
Overall
Process Capability of Delivery Time
Process CapabilityProcess Capability
-- ExampleExample --
UNCLASSIFIED52
and USL of 30 days. Cpkis .1 indicating that theprocess is exceeding theUSL.
With an overall PPM of371,895 defects permillion opportunity, thecurrent process has aSigma Quality Level of 1.8or a 62% yield
36322824201612
Process Data
Sample N 266
StDev (Within) 2.87033
StDev (O v erall) 2.69154
LSL 10
Target 20
USL 30
Sample Mean 29.1203
Ppk 0.11
C pm 0.35
O bserv ed Performance
PPM < LSL 0.00
PPM > USL 281954.89
PPM Total 281954.89
Exp. Within Performance
PPM < LSL 0.00
PPM > USL 379619.67
PPM Total 379619.67
Exp. O v erall Performance
PPM < LSL 0.00
PPM > USL 371895.18
PPM Total 371895.18
Required Deliverable

Lean Six Sigma
Class ExerciseClass Exercise
What measure(s) would you use to compute processcapability for the simulation?
How capable is Round 1 Simulation?
UNCLASSIFIED53
10 minutes

Lean Six Sigma
Process Map or FlowchartProcess Map or Flowchart
A Pictorial Representation of a Process Identifies Inputs (X) and Outputs (Y) Identifies Current Data Collection Points Categorizes Inputs (X)
Defines Process Boundaries Identifies customers and suppliers
UNCLASSIFIED
Identifies customers and suppliers
Points out discrepancies in the process
Points out inefficiencies in the process Determines Value-Added and Non-Value-Added Steps
Initiates standardization of procedures
54

Lean Six Sigma
Why Map the Current State?Why Map the Current State?
To show process simply and visually
To clarify organization’s understanding of how thecurrent process actually operates
To create baseline for future improvements to bemade and measured
UNCLASSIFIED
made and measured
55
A current state map is a pictorial view showing how materialand information currently flow.
Lean Six Sigma
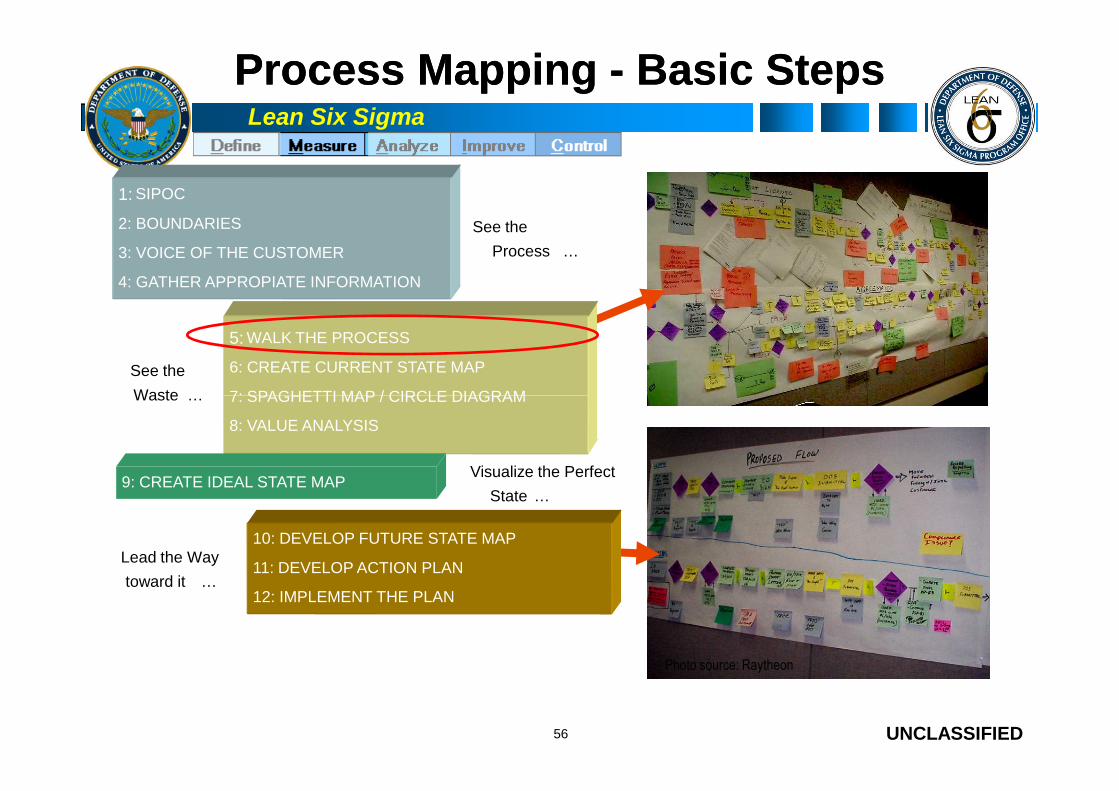
Process MappingProcess Mapping -- BasicBasic StepsSteps
1: SIPOC
2: BOUNDARIES
3: VOICE OF THE CUSTOMER
4: GATHER APPROPIATE INFORMATION
See the
Process …
See the
Waste …
5: WALK THE PROCESS
6: CREATE CURRENT STATE MAP
7: SPAGHETTI MAP / CIRCLE DIAGRAM
UNCLASSIFIED56
Photo source: Raytheon
Waste …
Visualize the Perfect
State …
7: SPAGHETTI MAP / CIRCLE DIAGRAM
8: VALUE ANALYSIS
9: CREATE IDEAL STATE MAP
10: DEVELOP FUTURE STATE MAP
11: DEVELOP ACTION PLAN
12: IMPLEMENT THE PLAN
Lead the Way
toward it …
Lean Six Sigma
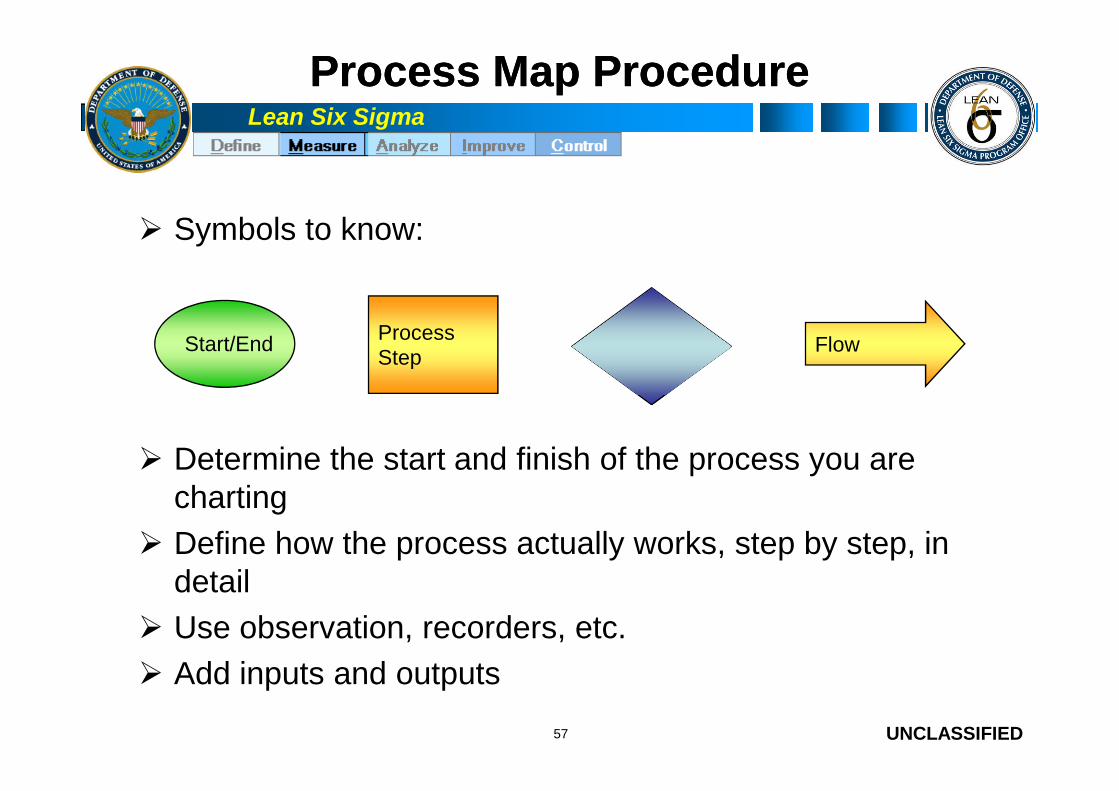
Process Map ProcedureProcess Map Procedure
Symbols to know:
ProcessStep
Start/End Decision Flow
UNCLASSIFIED
Determine the start and finish of the process you arecharting
Define how the process actually works, step by step, indetail
Use observation, recorders, etc.
Add inputs and outputs
57

Lean Six Sigma
Simple Process MapSimple Process Map
Start Step 1 Step 2Decision
• Describes the high-level steps followed day in and day out
UNCLASSIFIED58
Start Step 1
No
YesStep 2
End
Decision
Lean Six Sigma
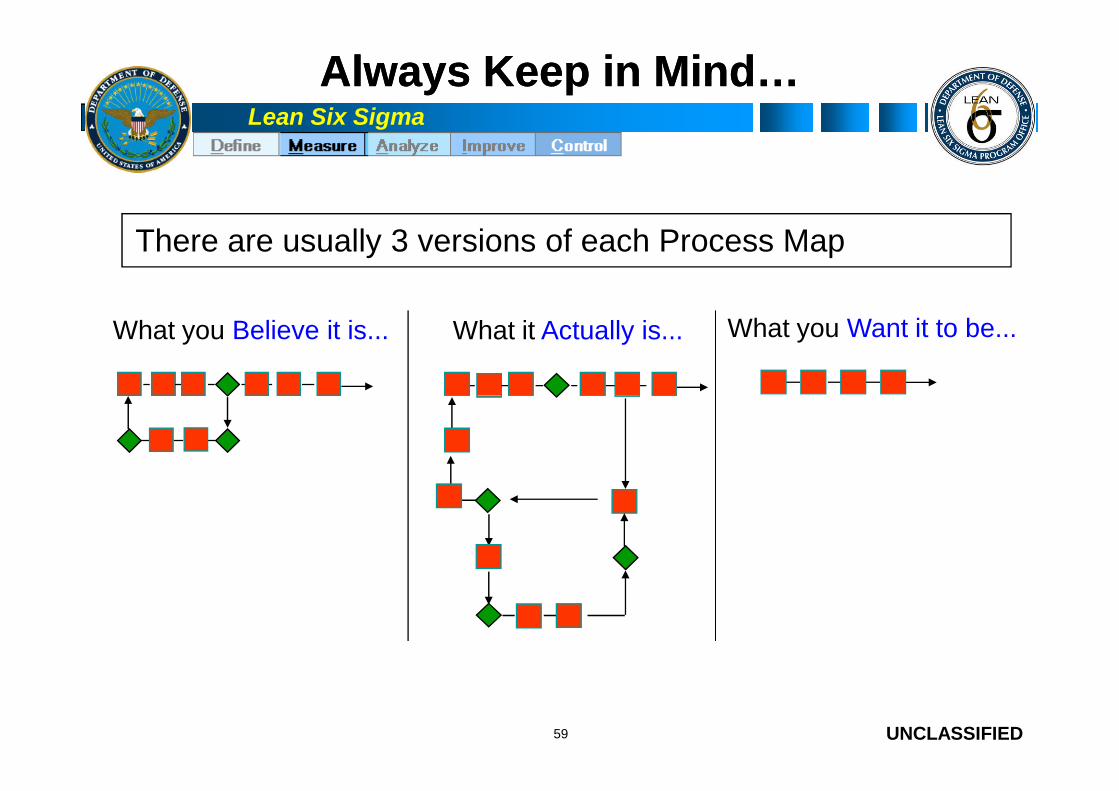
Always Keep in Mind…Always Keep in Mind…
There are usually 3 versions of each Process Map
What you Believe it is... What it Actually is... What you Want it to be...
UNCLASSIFIED59

Lean Six Sigma
PPSS II OO CC
SIPOCSIPOC
SIPOC: The starting point for any process map
UNCLASSIFIED60
Suppliers Inputs Process Outputs Customers
ProcessMap

Lean Six Sigma
Walk the ProcessWalk the Process
Visualize yourself in the place of the product /information
Walk the process backwards (from last step tofirst) OR forwards (from first step to last)
Interview personnel who touch the process
UNCLASSIFIED
Interview personnel who touch the process(look for problems that may be occurring)
Measure people and/or product travel distances
Look for constraints in the system (sharedresources)
Look for 8 types of wastes
61
Lean Six Sigma
Creating a Useful Process MapCreating a Useful Process Map
Step 1: At an actionable level, define the boundaries of the process youneed to improve
Step 2: Identify all operations needed in the production of a product orservice. At each step include:
Cycle time
UNCLASSIFIED
Cycle time
Quality levels
Step 3: Identify each operation above as value-added or non-value-added. A value-added operation “transforms the product in a waymeaningful to the customer”
Step 4: List both internal and external Ys at each process step
62
(continued)

Lean Six Sigma
Creating a Useful Process MapCreating a Useful Process Map
Step 5: List both internal and external Xs at each process step
Step 6: Classify all Xs as one or more of the following: Controllable (C): Inputs you can adjust or control while the process is running
o Examples: Speed, feed rate, temperature, pressure
Standard Operating Procedures (SOPs): Common sense things you always
UNCLASSIFIED
Standard Operating Procedures (SOPs): Common sense things you alwaysdo because they make sense
o Just because it is in a procedure --does not mean it is an SOPo Procedures can be used to specify set-points of controllable parameterso Examples: Cleaning, safety, loading components, setup
Noise (N): Things you cannot control or do not want to control (too expensiveor too difficult)
o Examples: Ambient temperature, humidity, operator
63
(continued)

Lean Six Sigma
Creating a Useful Process MapCreating a Useful Process Map
Step 7: Document any known operating specification for each input andoutput
What are the operational requirements of the process?
Examples: Obligation Rate 8% per month
EOD (End of Day) +/- 1 day
UNCLASSIFIED
Recon Imagery Resolution +/- 1 meter
Step 8: Clearly identify all process data collection points
What are the DPUs of the various process steps?
What is the Rolled Throughput Yield (RTY) of the Process?
RTY = FPY Step 1 x FPY Step 2 x FPY Step 3 …. x FPY Step n
64

Lean Six Sigma
Mapping TipsMapping Tips
Use Post-it® notes on butcher paper.
Place top of process boxes just below the middleof the page.
Leave enough room between process boxes toshow inventory.
UNCLASSIFIED
show inventory.
Decide whether to count all parts or just a samplepart – make the assumptions up front.
Draw only one to three main suppliers/supplieditems.
Title and date map.65
Lean Six Sigma
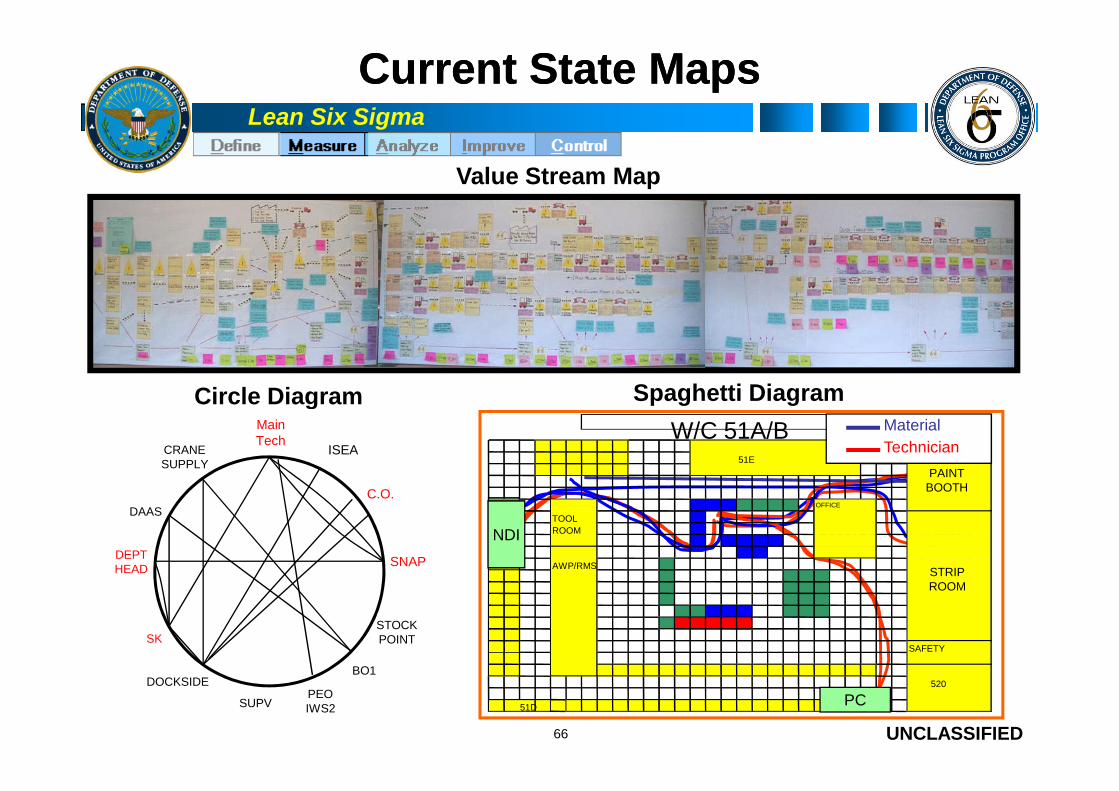
Current StateCurrent State MapsMaps
Value Stream Map
Circle Diagram Spaghetti Diagram
UNCLASSIFIED66
StripTank
PaintBooth
Office
PC
NDI
51E
PAINTBOOTH
N OFFICE
D TOOLI ROOM
AWP/RMSSTRIPROOM
SAFETY
520
51D P.C.
W/C 51A/B
NDI
PC
Material
Technician
MainTech
C.O.
ISEA
SUPVPEOIWS2
STOCKPOINT
SNAPDEPTHEAD
SK
DAAS
BO1
CRANESUPPLY
DOCKSIDE
Circle Diagram Spaghetti Diagram
Lean Six Sigma
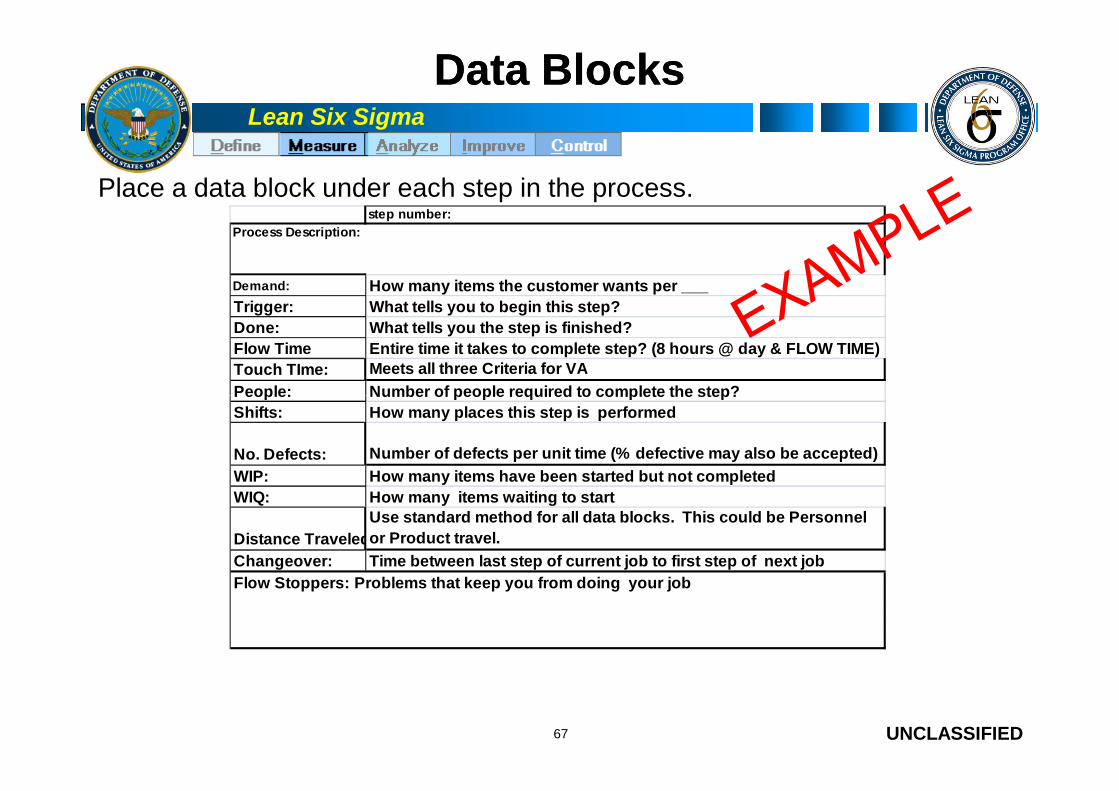
Data BlocksData Blocks
step number:
Demand: How many items the customer wants per ___
Trigger: What tells you to begin this step?
Done: What tells you the step is finished?
Flow Time Entire time it takes to complete step? (8 hours @ day & FLOW TIME)
Touch TIme: Meets all three Criteria for VA
People: Number of people required to complete the step?
Process Description:
Place a data block under each step in the process.
UNCLASSIFIED
People: Number of people required to complete the step?
Shifts: How many places this step is performed
No. Defects: Number of defects per unit time (% defective may also be accepted)
WIP: How many items have been started but not completed
WIQ: How many items waiting to start
Distance Traveled:
Use standard method for all data blocks. This could be Personnel
or Product travel.
Changeover: Time between last step of current job to first step of next job
Flow Stoppers: Problems that keep you from doing your job
67
Lean Six Sigma
ExerciseExercise
Draw a current process map based upon Round 1simulation.
Annotate data blocks
UNCLASSIFIED68
18 minutes

Lean Six Sigma
Measure Tollgate QuestionsMeasure Tollgate Questions
Has an overarching Value Stream Map been completed with data to betterunderstand the process and problem, and show where root causes might reside?
Has the team conducted a value-added and cycle time analysis, identifying areaswhere time and resources are devoted to tasks not critical to the customer?
Has the team identified specific input, process and output measures needing to becollected for both effectiveness and efficiency categories?
Has the team developed clear, unambiguous operational definitions for each
UNCLASSIFIED
measurement and tested them with others to ensure clarity and consistency?
Has a clear, reasonable choice been made between gathering new data or takingadvantage of existing data already collected by the organization?
Has an appropriate sample size and sampling frequency been established to ensurevalid representation of the process we are measuring?
Has the measurement system been checked for repeatability and reproducibility,potentially including training data collectors?
Has the team developed and tested data collection forms or check sheets?
Has baseline performance and process capability been established? How large isthe gap between current performance and customer requirements?
69

Lean Six Sigma
What We Have CoveredWhat We Have Covered
Data – types, collection plans
Data measures – mean, median, standard deviation
Minitab familiarization
Sampling – reasons, types, computing sample size
Measurement System Analysis - purpose,
UNCLASSIFIED
Measurement System Analysis - purpose,components
Normality of data
Run Charts
Control Charts
Process Capability
Process Mapping
70

Lean Six Sigma
Analyze
Define
Measure
Analyze
UNCLASSIFIED71
AnalyzeAnalyze
Improve
Control
Lean Six Sigma
Learning ObjectivesLearning Objectives
Learn and apply analytical and graphical techniques foridentifying the potential root causes of a problem
UNCLASSIFIED72

Lean Six Sigma
Searching for XsSearching for Xs
The primary focus of the analyze phase is to separatethe Critical Few from the Trivial Many
In short: What is driving our deficiency or variation?
UNCLASSIFIED73
All Possible Xs Probable Xs

Lean Six Sigma
Root CauseRoot Cause
Why find the root cause of a defect?
Eliminate the root cause, not the symptom
Problem doesn't show up again
Corrective action must:
Ensure that the error is physically prevented from occurring again
UNCLASSIFIED
Ensure that the error is physically prevented from occurring again
Prevents a defect loop
74
Lean Six Sigma
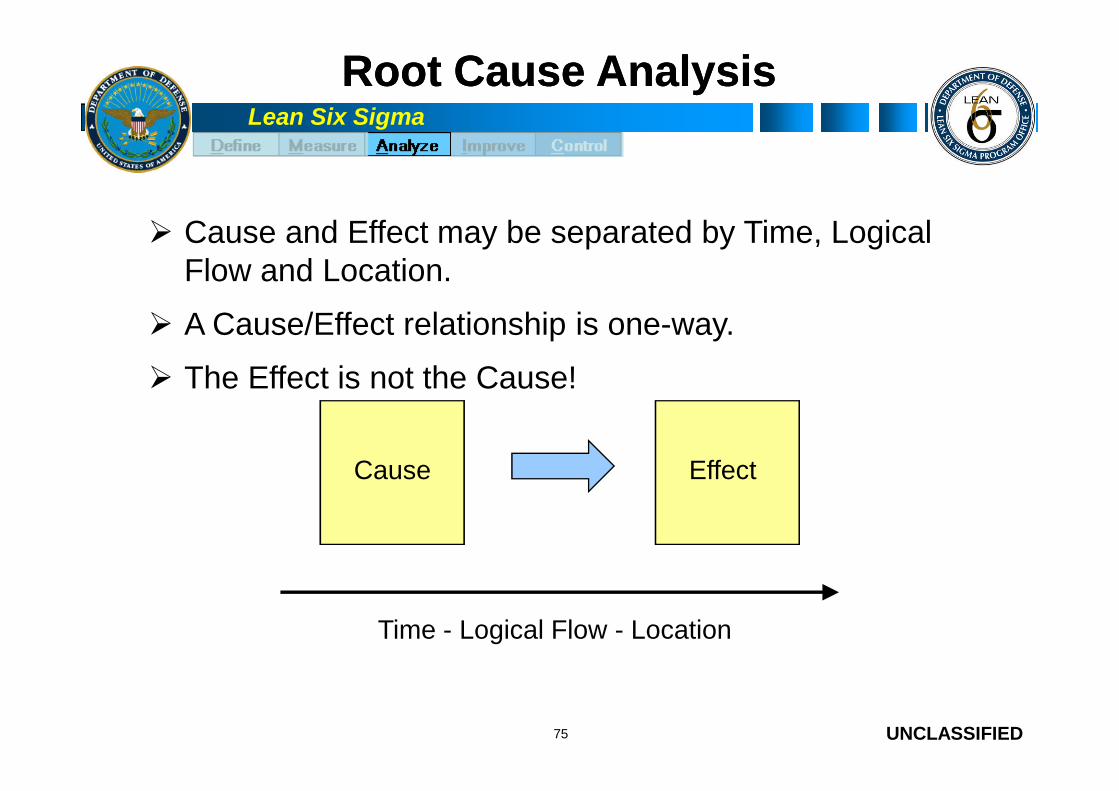
Cause and Effect may be separated by Time, LogicalFlow and Location.
A Cause/Effect relationship is one-way.
The Effect is not the Cause!
RootRoot Cause AnalysisCause Analysis
UNCLASSIFIED75
Time - Logical Flow - Location
Cause Effect

Lean Six Sigma
A single Cause can havemultiple Effects.
Root Cause AnalysisRoot Cause Analysis
EFFECT
EFFECT
EFFECT
CAUSE
UNCLASSIFIED76
A single Effect can havemultiple Causes.
CAUSE
CAUSE
CAUSE
EFFECT

Lean Six Sigma
Tools for Root CauseTools for Root Cause
Process: Five Whys
Fishbone / Ishakawa / Cause and Effect Diagram
XY Matrix
Failure Modes and Effects Analysis (FMEA)
Graphical:
UNCLASSIFIED
Graphical: Pareto Charts
Scatter Diagram
Box Plots
77
Lean Six Sigma
5 Whys5 Whys
Technique to get from symptom to root cause
Asking “Why?” as many as five times to get to root cause
By identifying root cause we can take action to prevent
UNCLASSIFIED
recurrence
78
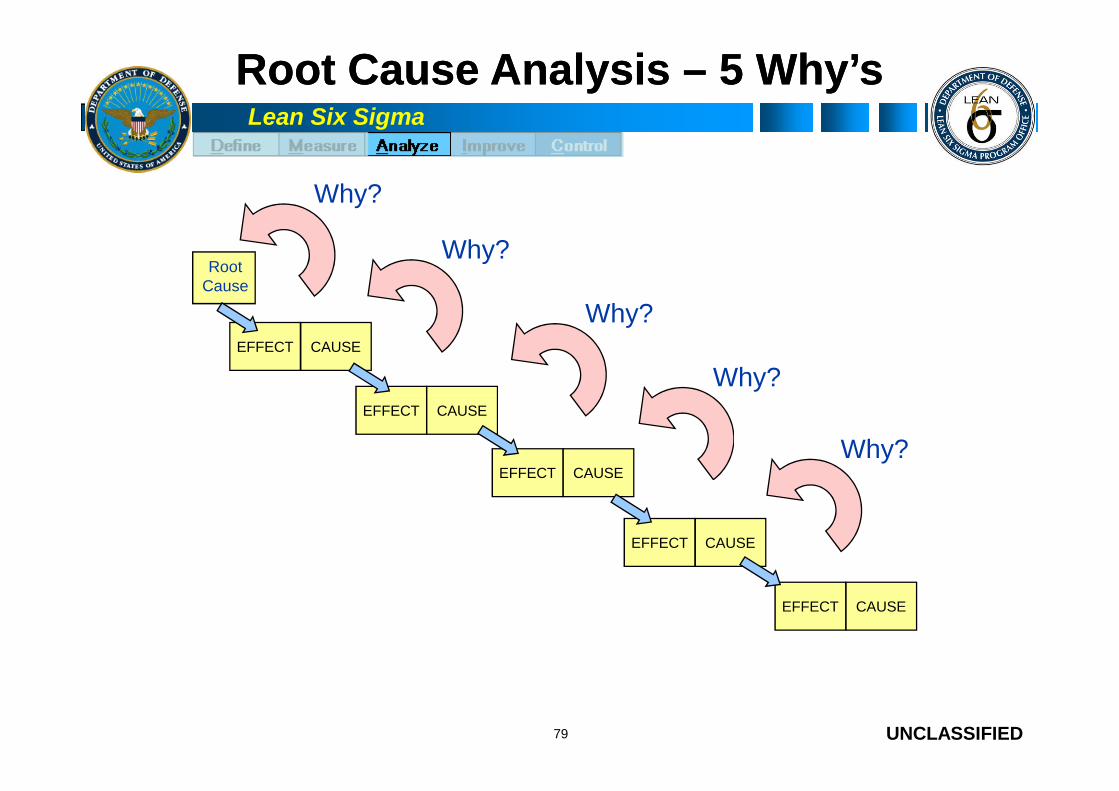
Lean Six Sigma
CAUSEEFFECT
Why?
Why?
Why?
Why?
RootCause
Root Cause AnalysisRoot Cause Analysis –– 5 Why’s5 Why’s
UNCLASSIFIED79
CAUSEEFFECT
CAUSEEFFECT
CAUSEEFFECT
CAUSEEFFECT
Why?
Lean Six Sigma
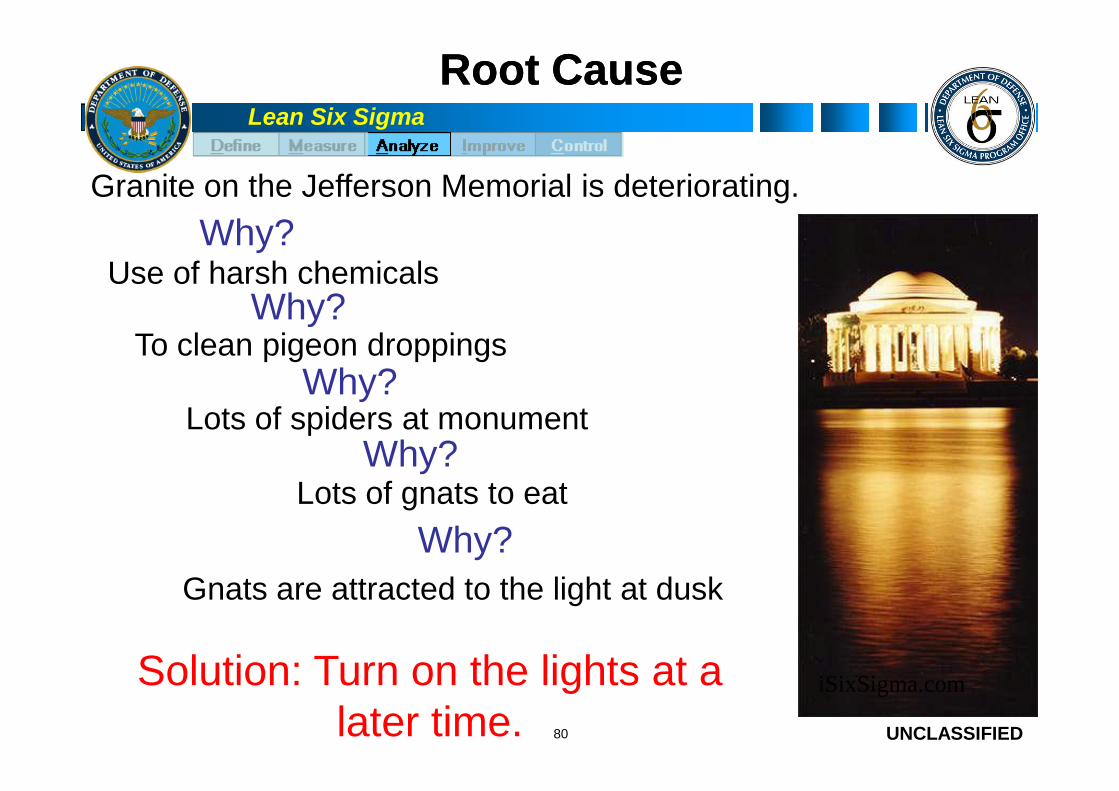
Root CauseRoot Cause
Why?
Granite on the Jefferson Memorial is deteriorating.
Use of harsh chemicals
To clean pigeon droppingsWhy?
Why?
UNCLASSIFIED80
Lots of spiders at monument
Lots of gnats to eat
Gnats are attracted to the light at dusk
Why?
Why?
Why?
iSixSigma.comSolution: Turn on the lights at alater time.

Lean Six Sigma
5 Whys:5 Whys: Late UFRsLate UFRs
Softwareproblem
Late BRCCharts
IncompleteUFRs
Late UFRs
HandlingDamage
Written withBug
WHY?
WHY?WHY?
UNCLASSIFIED81
Did NotFollowDirections
Did NotReadDirections
Late Receiptfrom Field
Damage Bug
Not WrittenClearly Operational
MissionAmbitiousSchedule
PackagingError
Untestedprogram
Typo
WHY?WHY?WHY?
WHY?
WHY?
No Format
No OneAssigned toDevelop
WHY?
WHY?

Lean Six Sigma
FishboneFishbone DiagramDiagram ProcedureProcedure
Write the problem (effect or “Y”) in a box on the right side with anarrow entering from the left
Generate a list of causes that potentially create the problem
Organize the causes into categories
UNCLASSIFIED
Organize the causes into categories
Place causes on the fishbone by category
Breakdown the causes into smaller components by asking “Why?”
Add to fishbone
Examine for patterns, root causes, data needs
82
Lean Six Sigma
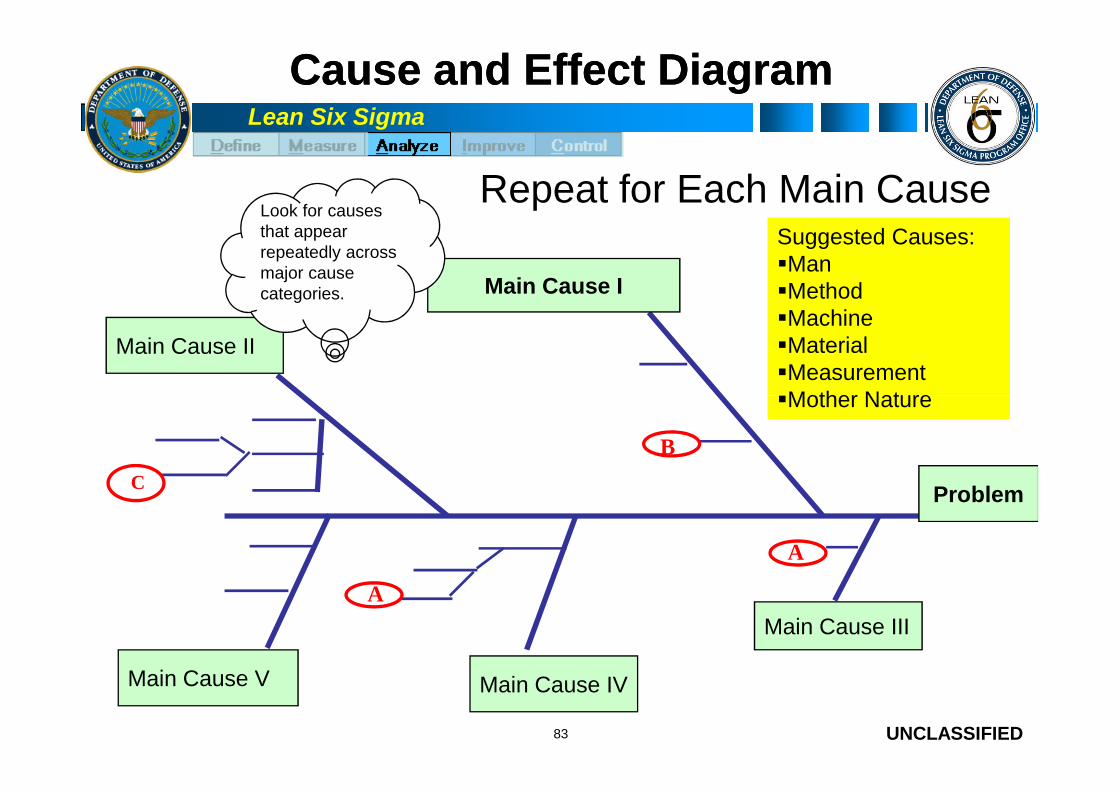
Cause and Effect DiagramCause and Effect Diagram
Main Cause I
Main Cause II
Look for causesthat appearrepeatedly acrossmajor causecategories.
Suggested Causes:ManMethodMachineMaterialMeasurementMother Nature
Repeat for Each Main Cause
UNCLASSIFIED83
Main Cause V Main Cause IV
Main Cause III
ProblemC
A
A
B
Mother Nature
Lean Six Sigma
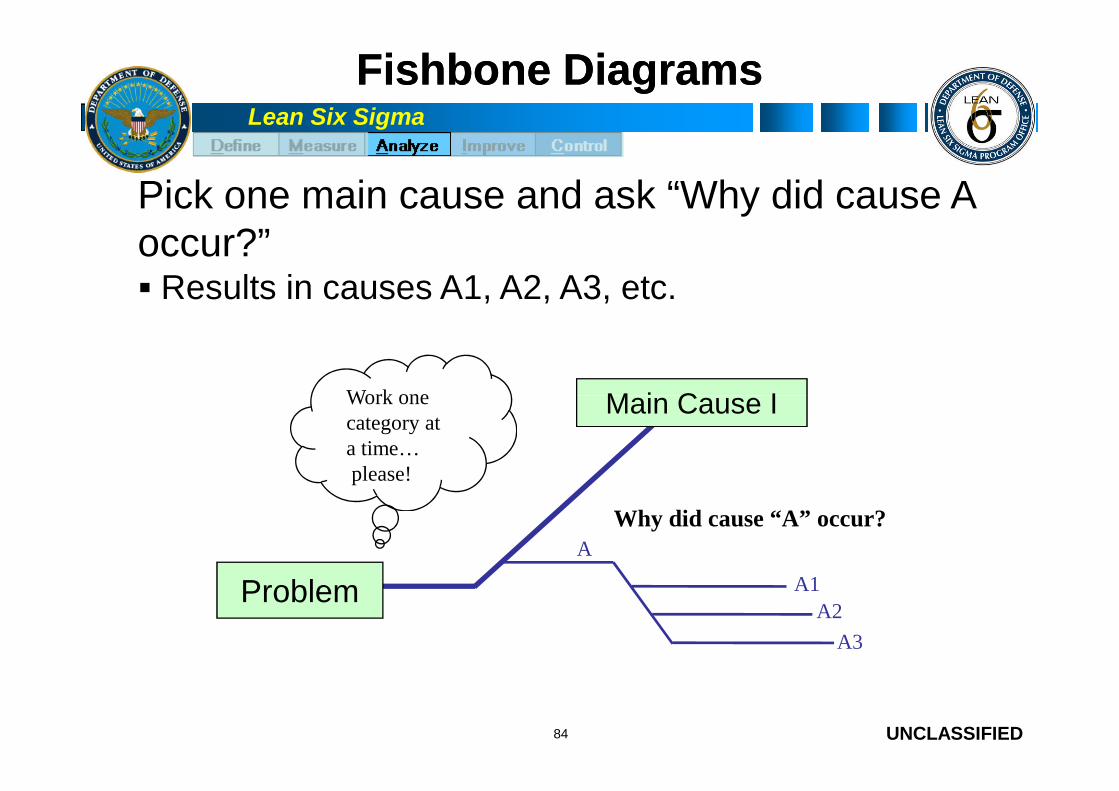
Fishbone DiagramsFishbone Diagrams
Work one Main Cause I
Pick one main cause and ask “Why did cause Aoccur?” Results in causes A1, A2, A3, etc.
UNCLASSIFIED84
Work onecategory ata time…please!
Main Cause I
Why did cause “A” occur?A
A1
A2
A3
Problem
Lean Six Sigma
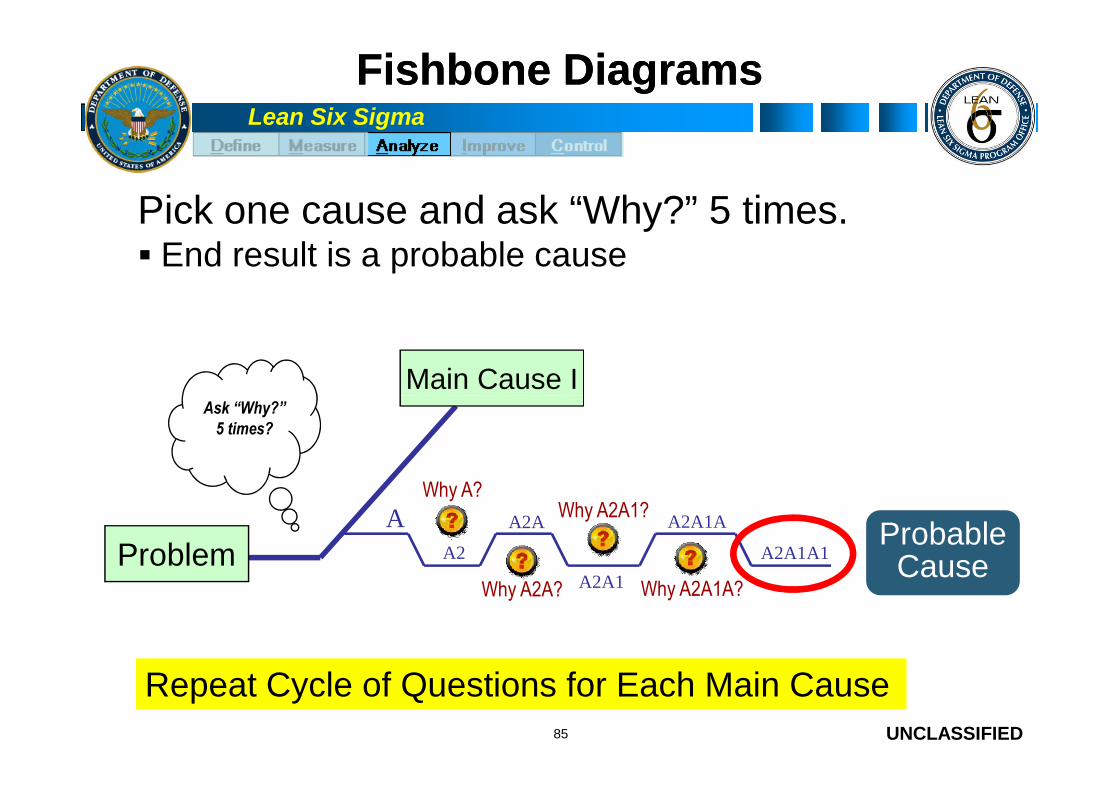
Fishbone DiagramsFishbone Diagrams
Main Cause I
Pick one cause and ask “Why?” 5 times. End result is a probable cause
UNCLASSIFIED85
Ask “Why?”5 times?
Why A2A1?AA2
Why A?
A2A1A1
A2A1
A2A
Why A2A?
A2A1A
Why A2A1A?
ProbableCauseProblem
Repeat Cycle of Questions for Each Main Cause
Lean Six Sigma
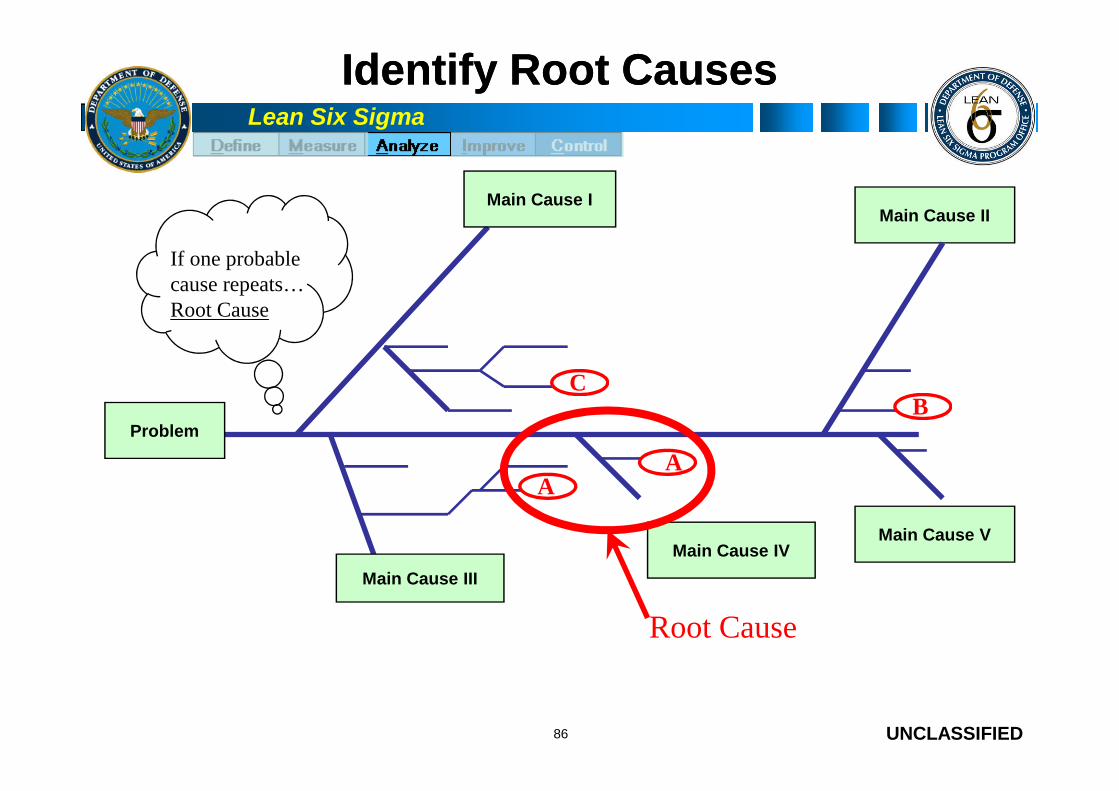
Identify Root CausesIdentify Root Causes
Main Cause IIMain Cause I
If one probablecause repeats…Root Cause
CB
UNCLASSIFIED86
Main Cause VMain Cause IV
Main Cause III
AA
CB
Root Cause
Problem
Lean Six Sigma
ExerciseExercise –– Root Cause AnalysisRoot Cause Analysis
Using the simulation, determine what the effect ofinterest is then brainstorm causes using the 5 Whys
Create Cause and Effect Diagram that concentrateson reducing variation in the Simulation process
UNCLASSIFIED87
10 minutes
Lean Six Sigma
XY MatrixXY Matrix
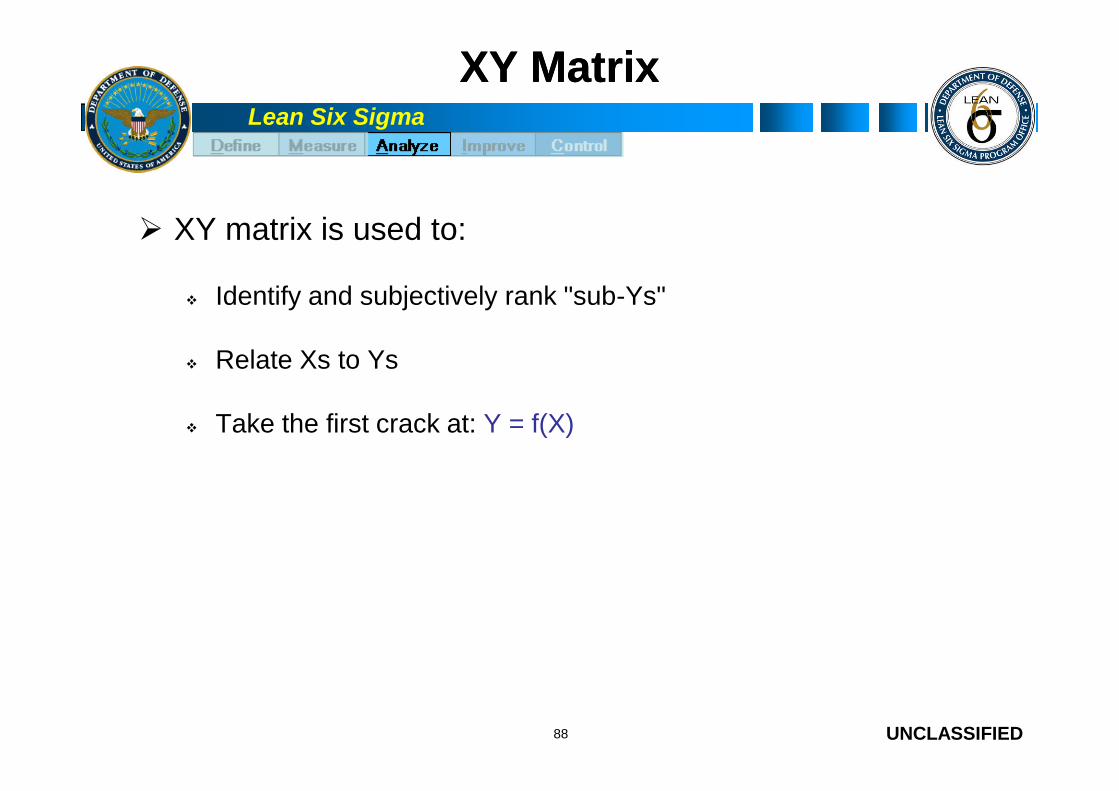
XY matrix is used to:
Identify and subjectively rank "sub-Ys"
Relate Xs to Ys
UNCLASSIFIED
Take the first crack at: Y = f(X)
88
Lean Six Sigma
Why Do We Need an XY Matrix?Why Do We Need an XY Matrix?
To allow everyone involved with a process to agree onoutputs critical to the product and/or customer
Through numerical ranking, an XY matrix enables yourteam to assign a level of importance to each outputvariable
UNCLASSIFIED
variable
Through association, an XY matrix enables a team tonumerically assess the effect of each X on each Y
It provides the team its first stab at determining Y = f(X)
It leads the way to an area of focus on the process“Failure Modes and Effects Analysis” (FMEA)
89

Lean Six Sigma
How to Create a Useful XY MatrixHow to Create a Useful XY Matrix
Step 1:Step 1: Use available information sources like processmaps and fishbones to aid you in your identification ofinputs and outputs.
Step 2:Step 2: List the output variables (Ys) along the top section
UNCLASSIFIED
Step 2:Step 2: List the output variables (Ys) along the top sectionof the matrix. These are outputs that the team and/orcustomer deem important. These may be a subset of thelist of Ys identified on the process map.
Step 3:Step 3: Rank each output numerically using an arbitraryscale (possibly 1 to 10). The most important outputreceives the highest number. Enter these rankings in theOutput Ranking row of the matrix.
90

Lean Six Sigma
How to Create a Useful XY MatrixHow to Create a Useful XY Matrix
Step 4:Step 4: Identify all potential inputs or causes (Xs) that canimpact the various Ys and list these along the left side ofthe matrix.
Step 5:Step 5: Numerically rate the effect of each X on each Y
UNCLASSIFIED
Step 5:Step 5: Numerically rate the effect of each X on each Ywithin the body of the matrix.
Step 6:Step 6: Use the results page to analyze and prioritizewhere to focus your effort when creating the preliminaryFMEA. The XY matrix is a great team brainstorming tool. Itcan also facilitate future team activities.
91
Lean Six Sigma
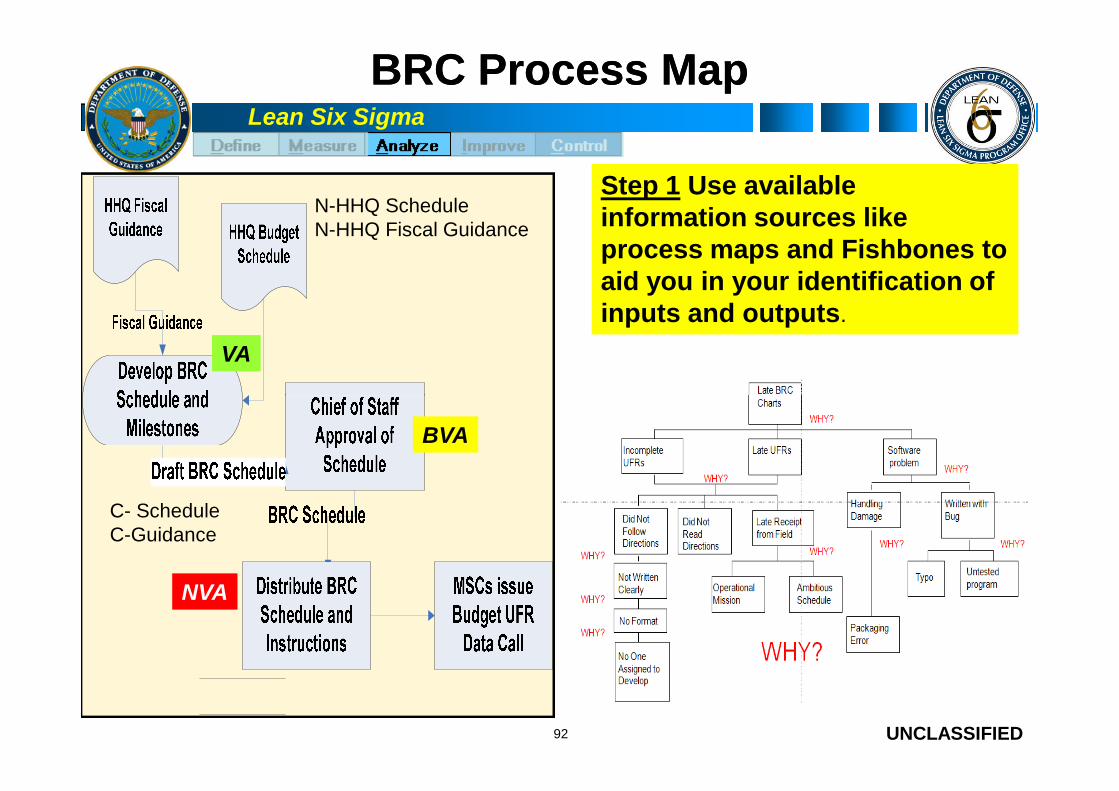
BRC Process MapBRC Process Map
VA
N-HHQ ScheduleN-HHQ Fiscal Guidance
Step 1 Use availableinformation sources likeprocess maps and Fishbones toaid you in your identification ofinputs and outputs.
UNCLASSIFIED92
NVA
BVA
C- ScheduleC-Guidance

Lean Six Sigma
XY MatrixXY Matrix
XY MatrixProject:
Date:
1 2 3
Ou
tpu
tV
ari
ab
les
(Y's
)
An
aly
sis
Eff
ort
Ju
sti
fic
ati
on
Co
mp
lete
Me
et
Du
eD
ate
View Results
Delete
Instructions
DEMO
Step 2 List the importantoutput variables along the topsection of the matrix.
StepStep 33 Rank each outputnumerically using anarbitrary scale. A scale of 1to 10 is often used.
Step 4 Identify potential
UNCLASSIFIED
Ou
tpu
tV
ari
ab
les
(Y's
)
An
aly
sis
Eff
ort
Ju
sti
fic
ati
on
Co
mp
lete
Me
et
Du
eD
ate
Output Ranking 6 9 8Input Variables
(X's) Association Table Rank % Rank
1 Schedule 3 8 9 162 18.71%
2 Training 8 7 1 119 13.74%
3 SOP 7 7 1 113 13.05%
4
Resource
Guidance1 6 1
68 7.85%
5 Fiscal Code 1 5 1 59 6.81%
7 Security Class 6 1 1 53 6.12%
8 Manual Process 6 7 5 139 16.05%
93
Step 4 Identify potentialcauses (failed Xs) that canimpact various outputs, and listeach one along the left side ofthe matrix.
StepStep 55 Numerically rate theeffect of each X on each Ywithin the body of the matrix.
StepStep 66 Use the resulting ranks toanalyze and prioritize futureteam activities.

Lean Six Sigma
InIn--Class ExerciseClass Exercise
Break into your groups
Use your Simulation Round 1 Results
Use the 6-step methodology to create an XY matrix(XYMatrix.xls) for the process
Use the Xs and Ys from your process map as key information
UNCLASSIFIED
Use the Xs and Ys from your process map as key information
Be prepared to report your results
94
10 minutes
Lean Six Sigma
FMEA DefinedFMEA Defined
Failure Modes and Effects Analysis (FMEA) is a detailed documentthat identifies ways a process or product can fail to meet criticalcustomer requirements (Ys) (failure modes)
A living document that lists all possible causes (Xs) of failure From this, list of items for the control plan can be generated
UNCLASSIFIED
A document that allows the team to track and prioritize the actionsrequired to improve the process
FMEA is used to reduce risk, and therefore unintendedconsequences, in the implementation.
In short, a FMEA will: Ultimately capture the entire process Identify ways the product or process failed because of these Xs Facilitate the documentation of a plan to prevent those failures
95
Lean Six Sigma
When to Conduct a FMEAWhen to Conduct a FMEA
Early in the process design or improvement development.
When new systems, products, and processes are beingdesigned.
When existing designs or processes are being changed.
When carry-over designs are used in new applications.
After system, product, or process functions are defined, but
UNCLASSIFIED
After system, product, or process functions are defined, butbefore beginning detailed final design.
When the design concept has been decided.
96
Lean Six Sigma
Types of FMEATypes of FMEA
System - Analyzes systems and subsystems in earlyconcept and design stages
Design – Analyzes new process, product or service designbefore rollout
UNCLASSIFIED
Process – Used to improve existing transactional andoperational processes
97

Lean Six Sigma
FMEA FormFMEA Form
Process or
Product Name:Prepared by: Page ____ of ____
Responsible: FMEA Date (Orig) ______________ (Rev) _____________
Process
Step /
Input
Potential Failure
Mode
Potential Failure
EffectsPotential Causes Current Controls
Actions
RecommendedResp. Actions Taken S
E
O
C
C
D
E
T
S
E
O
C
C
D
E
T
ANALYZE PHASE IMPROVE PHASE
UNCLASSIFIED98
What is the
process
step and
Input under
investiga-
tion?
In what ways does
the Key Input go
wrong?
What is the impact
on the Key Output
Variables
(Customer
Requirements)?
What causes the
Key Input to go
wrong?
What are the existing
controls and
procedures (inspection
and test) that prevent
either the cause or the
Failure Mode?
What are the
actions for
reducing the
occurrence of the
cause, or
improving
detection?
What are the
completed
actions taken
with the
recalculated
RPN?
0 0
0 0
V
E
R
I
T
Y
C
U
R
R
E
N
C
E
T
E
C
T
I
O
N
R
P
N
V
E
R
I
T
Y
C
U
R
R
E
N
C
E
T
E
C
T
I
O
N
R
P
N

Lean Six Sigma
Sample FMEA Rating ScaleSample FMEA Rating Scale
RATING DEGREE OF SEVERITY
LIKELIHOOD OF
OCCURRENCE ABILITY TO DETECT
1 Customer will not notice
the adverse effect or it is
insignificant
Likelihood of occurrence is
remote
Sure that the potential
failure will be found or
prevented before reaching
the next customer
2 Customer will probably
experience slight
annoyance
Low failure rate with
supporting documentation
Almost certain that the
potential failure will be
found or prevented before
reaching the next customer
UNCLASSIFIED99
reaching the next customer
3 Customer will experience
annoyance due to the
slight degradation of
performance
Low failure rate without
supporting documentation
Low likelihood that the
potential failure will reach
the next customer
undetected
4 Customer dissatisfaction
due to reduced
performance
Occasional failures Controls may detect or
prevent the potential
failure from reaching the
next customer
5 Customer is made
uncomfortable or their
productivity is reduced by
the continued degradation
of the effect
Relatively moderate failure
rate with supporting
documentation
Moderate likelihood that
the potential failure will
reach the next customer

Lean Six Sigma
Sample FMEA Rating ScaleSample FMEA Rating Scale –– ContCont
RATING DEGREE OF SEVERITY LIKELIHOOD OF OCCURRENCE ABILITY TO DETECT
6 Warranty repair or significant
manufacturing or assembly complaint
Moderate failure rate without
supporting documentation
Controls are unlikely to detect or
prevent the potential failure
from reaching the next customer
7 High degree of customer
dissatisfaction due to component
failure without complete loss of
function. Productivity impacted by
high scrap or rework levels.
Relatively high failure rate with
supporting documentation
Poor likelihood that the
potential failure will be detected
or prevented before reaching
the next customer
UNCLASSIFIED100
high scrap or rework levels.
8 Very high degree of dissatisfaction
due to the loss of function without a
negative impact on safety or
governmental regulations
High failure rate without
supporting documentation
Very poor likelihood that the
potential failure will be detected
or prevented before reaching
the next customer
9 Customer endangered due to the
adverse effect on safe system
performance with warning before
failure or violation of governmental
regulations
Failure is almost certain based
on warranty data or significant
DV testing
Current controls probably will
not even detect the potential
failure
10 Customer endangered due to the
adverse effect on safe system
performance without warning before
failure or violation of governmental
regulations
Assured of failure based on
warranty data or significant DV
testing
Absolute certainty that the
current controls will not detect
the potential failure

Lean Six Sigma
Example:Example: Budget Review FMEABudget Review FMEA
Process or
Product Name:
Budget Review
Committee UFR
process
Prepared by: Susan
Wheeler
Responsible: Susan Wheeler FMEA Date (Orig) ___1 Oct 2009______ (Rev) _____________
Process Step /
Input
Potential Failure
Mode
Potential Failure
EffectsPotential Causes Current Controls
What is the
process step
and Input
under
investiga-tion?
In what ways
does the Key
Input go wrong?
What is the impact
on the Key Output
Variables
(Customer
Requirements)?
What causes the
Key Input to go
wrong?
What are the existing
controls and
procedures
(inspection and test)
that prevent either
S
E
V
E
R
I
T
O
C
C
U
R
R
E
N
D
E
T
E
C
T
I
RPN
UNCLASSIFIED101
investiga-tion? Requirements)? that prevent either
the cause or the
Failure Mode?
8Activity doesn’t
understand
instructions
5
Each activity is
assigned a budget
ombudsman to
assist activity
2 80
8Low Activity
priority to submit
quality UFR
7
Calendar and email
reminders;
template for UFRs6 336
Panel
Members not
present
UFR not
reviewed by
functional
expert
9Functional Expert
TDY or on leave4 Backup SME 6 216
T
Y
N
C
E
I
O
N
BRC Panels
convened
UFRs
incomplete
UFRs can't be
recommended
for funding
Lean Six Sigma
ExerciseExercise -- FMEAFMEA
Create a FMEA for one process step of the Simulation
UNCLASSIFIED102
15 minutes

Lean Six Sigma
Graphical ToolsGraphical Tools
The primary graphical tools available to helpcharacterize and learn about the process are:
Pareto Charts
Histograms and Dot Plots
UNCLASSIFIED
Histograms and Dot Plots
Run Charts / Control Charts / Time Series Plots
Scatter Plots
Box Plots
103
Lean Six Sigma
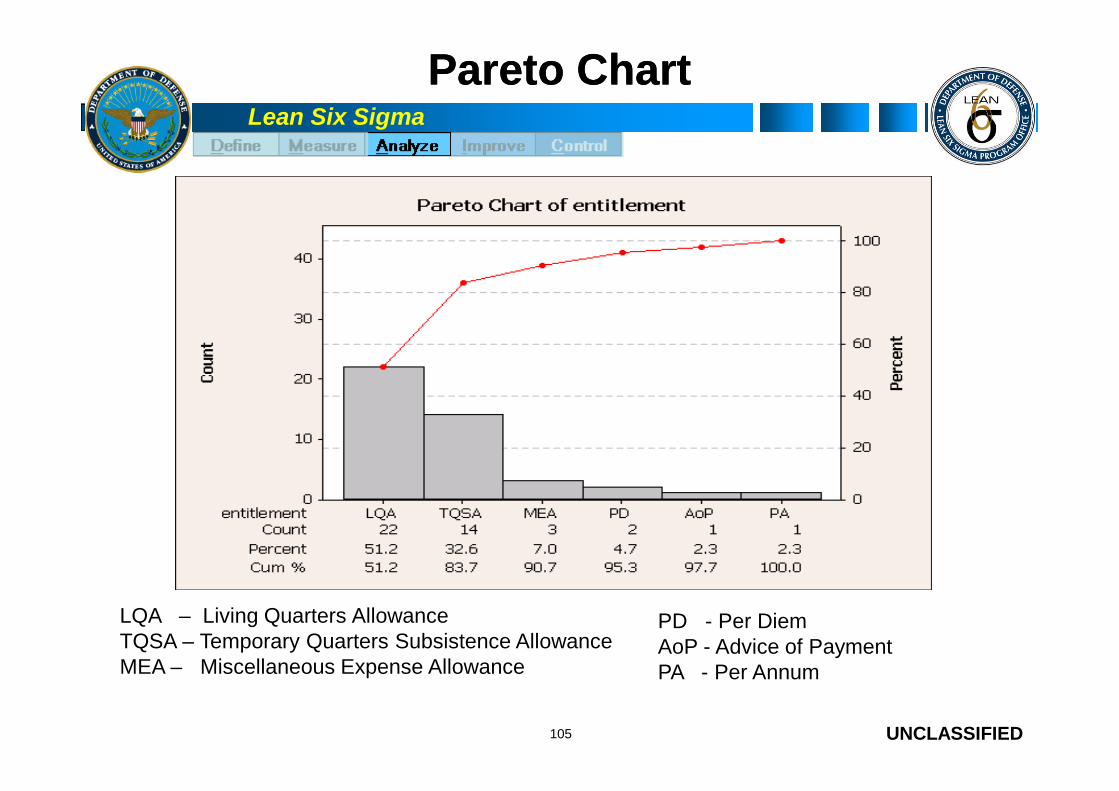
Pareto ChartPareto Chart
The Pareto Chart is a bar chart that displays the relativefrequency of factors or causes that contribute to theproblem.
The Pareto Chart is used to:
Separate the critical few areas from the trivial many
UNCLASSIFIED
Separate the critical few areas from the trivial many
Focus and refine the problem statement
Pareto Effect: 80% of the problem is due to 20% of thepotential causes
104
TIP: Data collected over a short time period, especially from an unstableprocess, can lead to incorrect conclusions. Examine the data forstratification or changes over time. Ensure that categories (X axis) aremeaningful.
Lean Six Sigma
Pareto ChartPareto Chart
UNCLASSIFIED105
LQA – Living Quarters AllowanceTQSA – Temporary Quarters Subsistence AllowanceMEA – Miscellaneous Expense Allowance
PD - Per DiemAoP - Advice of PaymentPA - Per Annum

Lean Six Sigma
Pareto ChartsPareto Charts
TASK: Create a Pareto Chart using the Defect and Frequency data
Go to Stat menu > Quality Tools > Pareto Chart
Click inside the “Chart defects table:” selection box and enter Defects inLabels and Frequency in Frequency boxes
Click OK
UNCLASSIFIED106
Lean Six Sigma
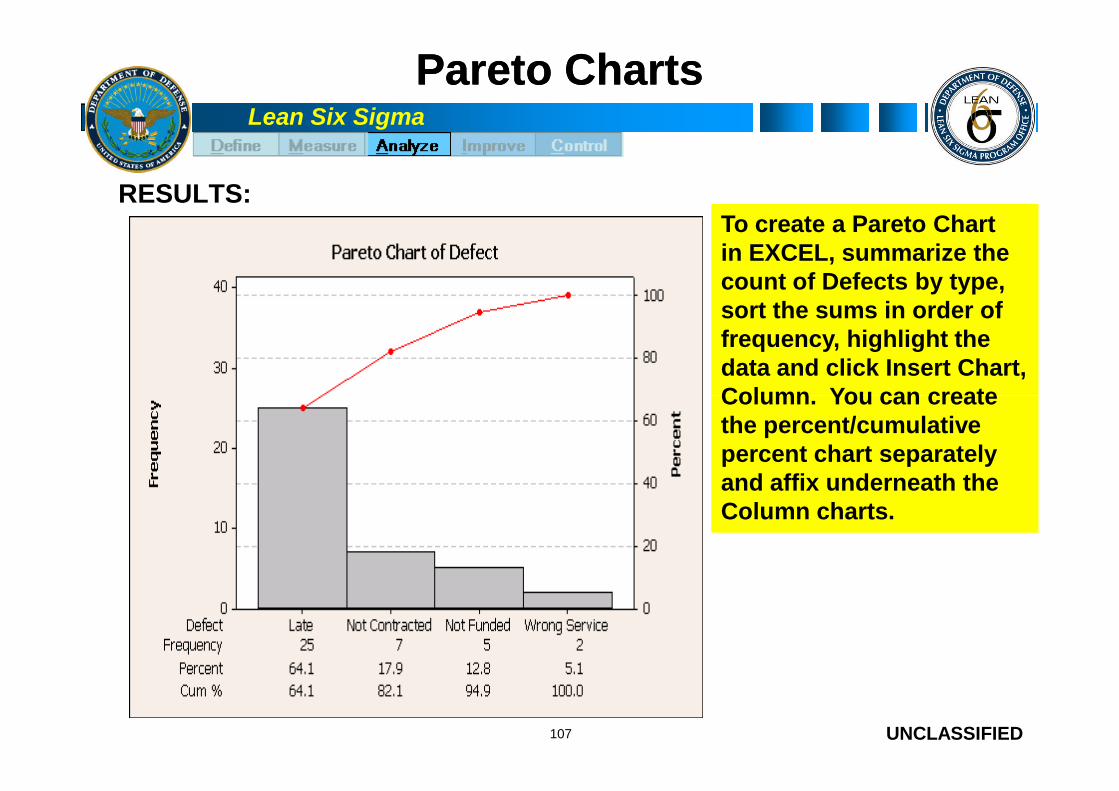
Pareto ChartsPareto Charts
RESULTS:To create a Pareto Chartin EXCEL, summarize thecount of Defects by type,sort the sums in order offrequency, highlight thedata and click Insert Chart,Column. You can create
UNCLASSIFIED107
Column. You can createthe percent/cumulativepercent chart separatelyand affix underneath theColumn charts.
Lean Six Sigma
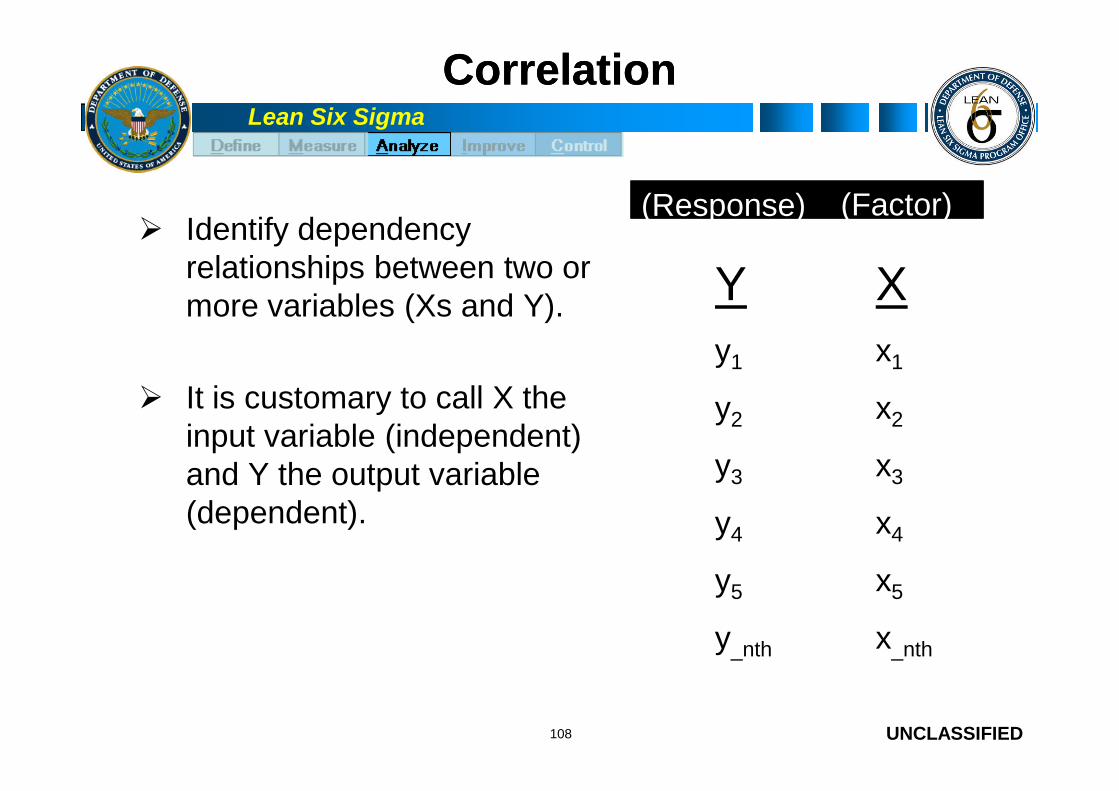
CorrelationCorrelation
Identify dependencyrelationships between two ormore variables (Xs and Y).
It is customary to call X the
X
x1
x
Y
y1
y
(Response) (Factor)
UNCLASSIFIED
It is customary to call X theinput variable (independent)and Y the output variable(dependent).
108
x2
x3
x4
x5
x_nth
y2
y3
y4
y5
y_nth
Lean Six Sigma
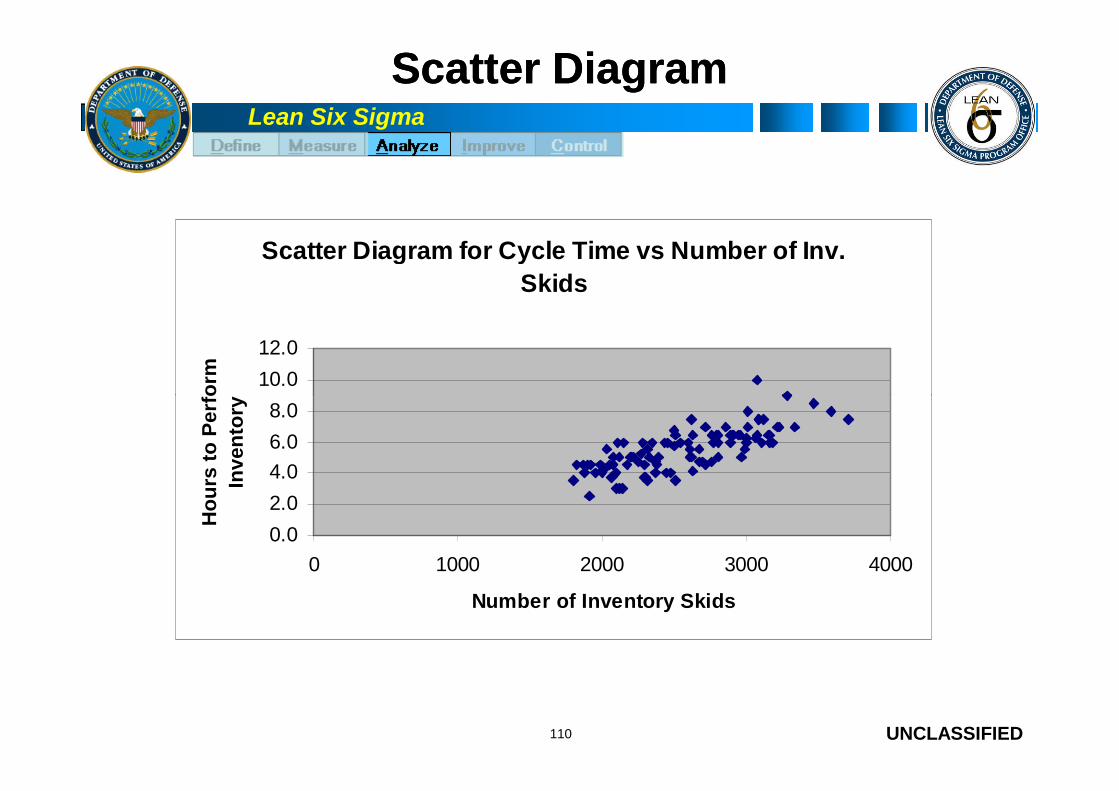
Scatter DiagramScatter Diagram
Good for finding and/or confirming relationships betweenmeasures
Will not prove that a cause-and-effect relationshipexists
Can assist in identifying which process inputs impact the
UNCLASSIFIED
Can assist in identifying which process inputs impact theprocess output
Add evidence to opinion regarding cause and effect
Can identify clues for improvement
Enables teams to test hunches between two factors
Examples:
Ice Cream Sales as they relate to outside temperature
Demand for gasoline as it relates to the price at the pump
109
Lean Six Sigma
Scatter DiagramScatter Diagram
Scatter Diagram for Cycle Time vs Number of Inv.
Skids
10.0
12.0
Ho
urs
toP
erf
orm
UNCLASSIFIED110
0.0
2.0
4.0
6.0
8.0
0 1000 2000 3000 4000
Number of Inventory Skids
Ho
urs
toP
erf
orm
Inven
tory

Lean Six Sigma
Scatter Diagrams PatternsScatter Diagrams Patterns
X and Y appear to be unrelatedY (D
ep
en
de
ntV
aria
ble
)Y is more variable as X increases
Y (De
pe
nd
entV
aria
ble
)
UNCLASSIFIED111
X (Independent Variable)
Y Increases as X Increases(positive linear trend)
X (Independent Variable)
Y (De
pe
nd
entV
aria
ble
)
Y Decreases as X Increases(negative linear trend)
X (Independent Variable)
Y (De
pe
nd
entV
aria
ble
)
X (Independent Variable)
Lean Six Sigma
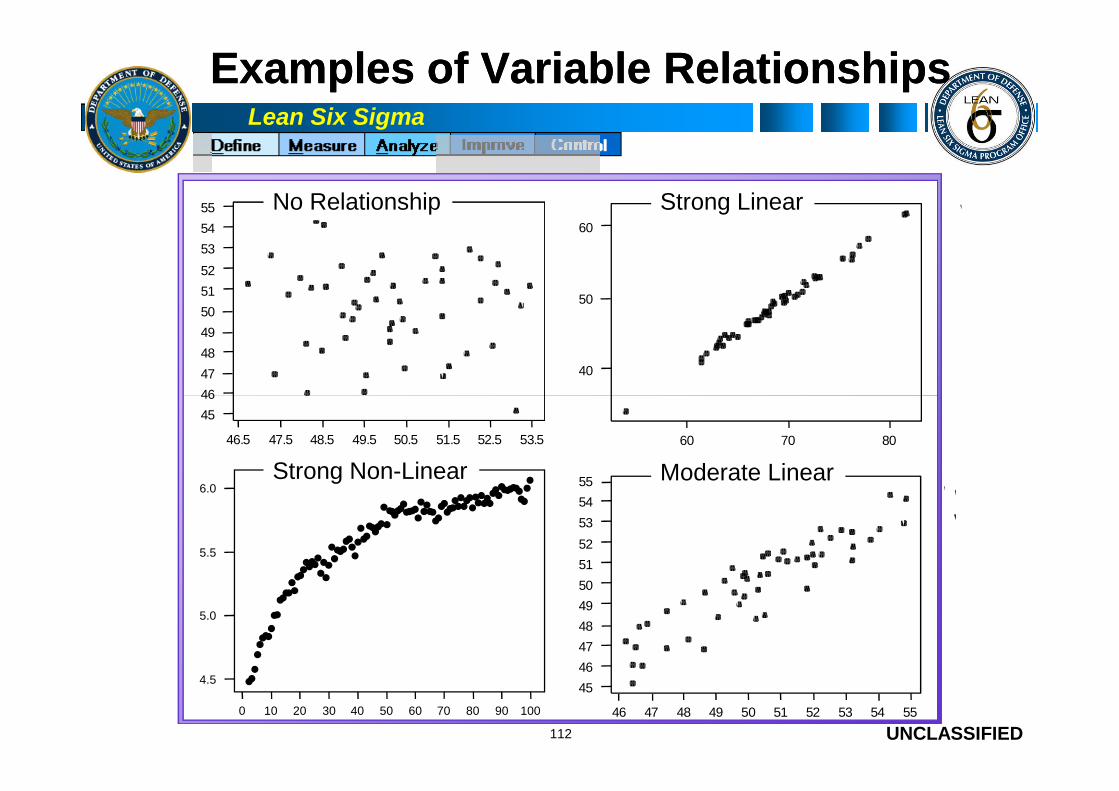
Examples of Variable RelationshipsExamples of Variable Relationships
60
50
40
Strong Linear55
54
53
52
51
50
49
48
47
46
No Relationship
UNCLASSIFIED112
807060
X
53.552.551.550.549.548.547.546.5
46
45
X1
55545352515049484746
55
54
53
52
51
50
49
48
47
46
45
Moderate Linear
0 10 20 30 40 50 60 70 80 90 100
4.5
5.0
5.5
6.0Strong Non-Linear

Lean Six Sigma
Abuse & Misuse of CorrelationAbuse & Misuse of Correlation
If we establish a correlation between X1 and Y, that does NOTnecessarily mean variation in X1 caused variation in Y
A third variable that is associated with both X1 and Y may be“lurking.”
Relationship could be coincidental
UNCLASSIFIED
Relationship could be coincidental
To conclude that there is a relationship between two variablesdoes NOT mean that there is a cause and effect relationship.
113
Correlation Does NOT Determine Causation!
A study conducted in New York indicated there was a proportionalrise in ice cream sales and murder rates during summer months.
Correlation or coincidence?Correlation or coincidence?
Lean Six Sigma
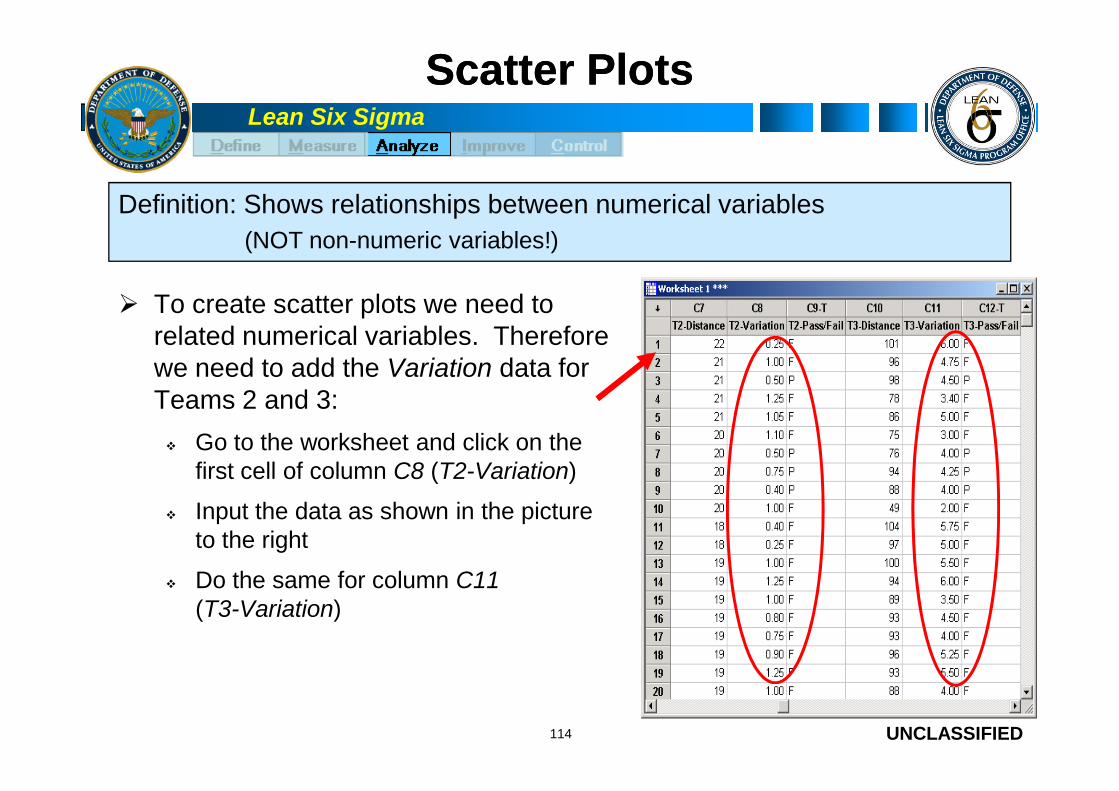
Scatter PlotsScatter Plots
To create scatter plots we need torelated numerical variables. Thereforewe need to add the Variation data forTeams 2 and 3:
Definition: Shows relationships between numerical variables
(NOT non-numeric variables!)
UNCLASSIFIED
Teams 2 and 3:
Go to the worksheet and click on thefirst cell of column C8 (T2-Variation)
Input the data as shown in the pictureto the right
Do the same for column C11(T3-Variation)
114

Lean Six Sigma
Scatter PlotsScatter Plots
TASK: Create a graph showing the relationship between the Distance and the Variationfor Statapult Teams 2 and 3:
• Go to Graph menu > Scatterplot
• Select Simple
• Select X and Y variables
• Click on Multiple Graphs
UNCLASSIFIED115

Lean Six Sigma
Scatter PlotsScatter Plots
Select Overlaid on the samegraph
(Cont...)
6
5
4
T2-Variation * T2-Distance
T3-Variation * T3-Distance
Variable
Scatterplot of T2-Variationvs T2-Distance, T3-Variationvs T3-Distanc
RESULTS:
UNCLASSIFIED116
X-Data
Y-D
ata
1101009080706050403020
4
3
2
1
0

Lean Six Sigma
Scatter PlotsScatter Plots
To create the Scatter Plot in EXCEL, highlight the X then Yvariables for the first team and click Insert Chart, Scatter Plot.Repeat for the second team. Adjust the X and Y matrix scales tomatch the larger dimensions.
7.00
T-3 Variation7.00
T2-Variation
UNCLASSIFIED117
0.00
1.00
2.00
3.00
4.00
5.00
6.00
0 50 100 150
T-3 Variation
0.00
1.00
2.00
3.00
4.00
5.00
6.00
-10 10 30 50 70 90 110 130 150
T2-Variation
Lean Six Sigma
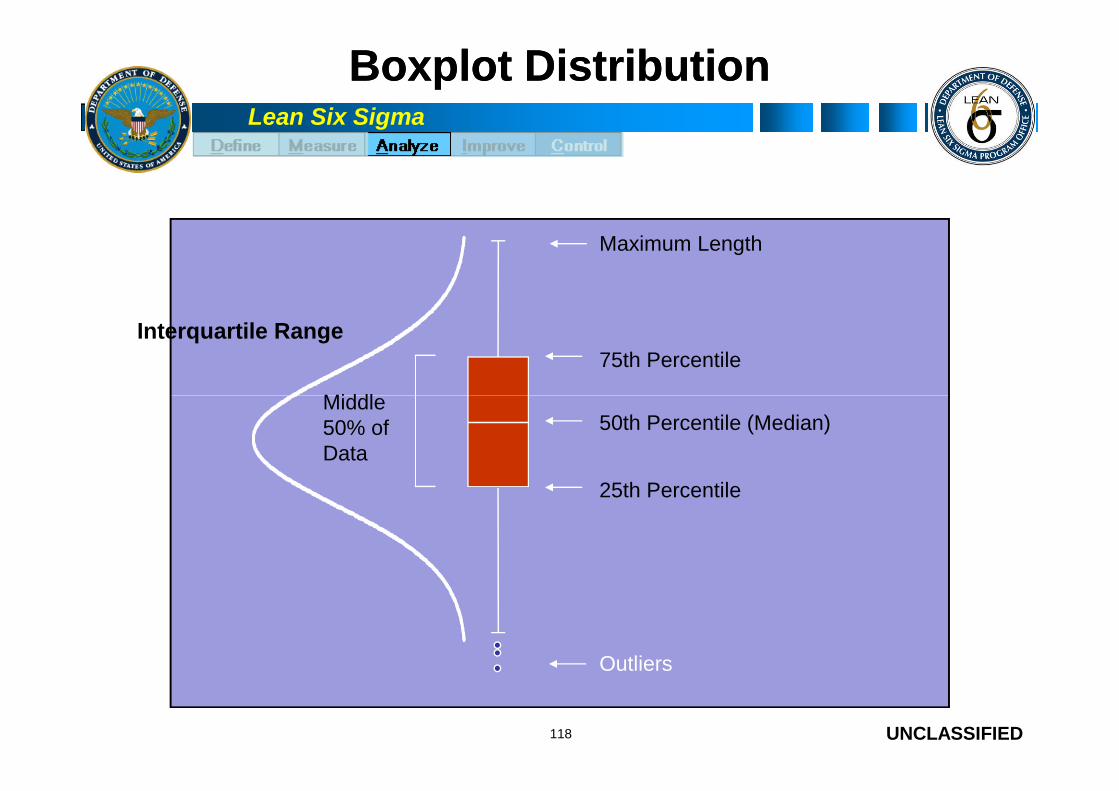
BoxplotBoxplot DistributionDistribution
75th Percentile
Maximum Length
Middle
Interquartile Range
UNCLASSIFIED118
50th Percentile (Median)
25th Percentile
Outliers
Middle50% ofData

Lean Six Sigma
BoxplotsBoxplots
50
Outliers
Top wisker (76 - 100%)40
*
*
Definition: Box plots summarize data in percentages (%) using the
Median (not the Mean!)
Top whisker (76-100%)
UNCLASSIFIED
40
Top box (51 - 75%)30
20 Bottom box (26 - 50%)
10Bottom whisker (0 - 25%)
0
Series
Median
First quartile
Third quartile
119
Lean Six Sigma
BoxplotsBoxplots
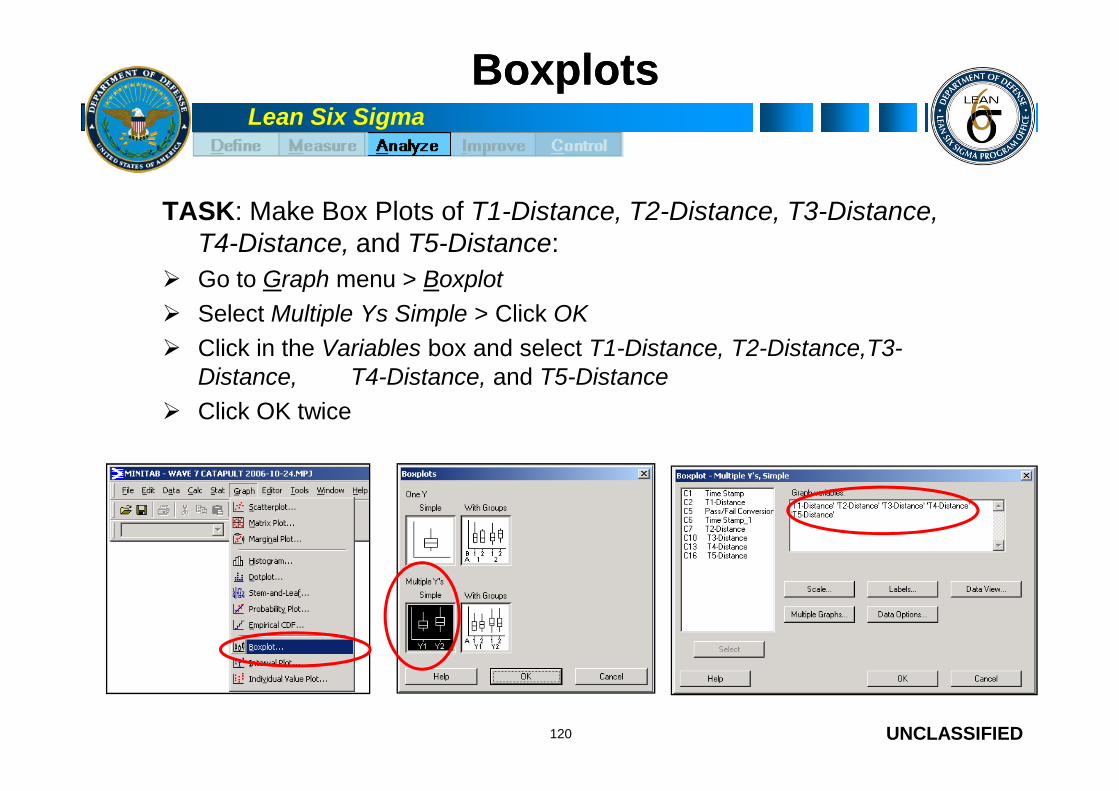
TASK: Make Box Plots of T1-Distance, T2-Distance, T3-Distance,T4-Distance, and T5-Distance:
Go to Graph menu > Boxplot
Select Multiple Ys Simple > Click OK
Click in the Variables box and select T1-Distance, T2-Distance,T3-Distance, T4-Distance, and T5-Distance
UNCLASSIFIED
Click OK twice
120

Lean Six Sigma
BoxplotsBoxplots
RESULTS:
EXCEL does not have aBoxplot template – but itcan be created, althoughthe process is far morecumbersome. Instructionsand a sample are provided
UNCLASSIFIED121
and a sample are providedin the OSD LSSToolssection of the DEPMSSandbox work tree.
Lean Six Sigma
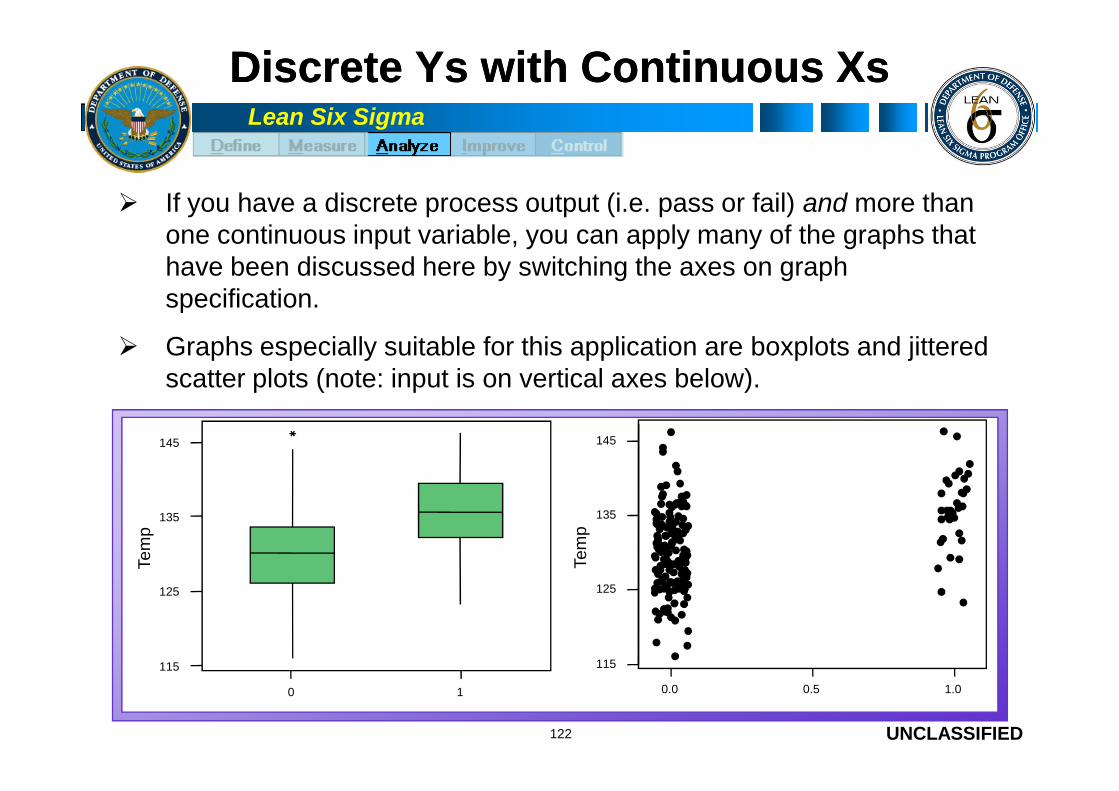
Discrete Ys with Continuous XsDiscrete Ys with Continuous Xs
If you have a discrete process output (i.e. pass or fail) and more thanone continuous input variable, you can apply many of the graphs thathave been discussed here by switching the axes on graphspecification.
Graphs especially suitable for this application are boxplots and jitteredscatter plots (note: input is on vertical axes below).
UNCLASSIFIED122
0 1
115
125
135
145
Tem
p
0.0 0.5 1.0
115
125
135
145
Tem
p
Lean Six Sigma
BoxplotsBoxplots
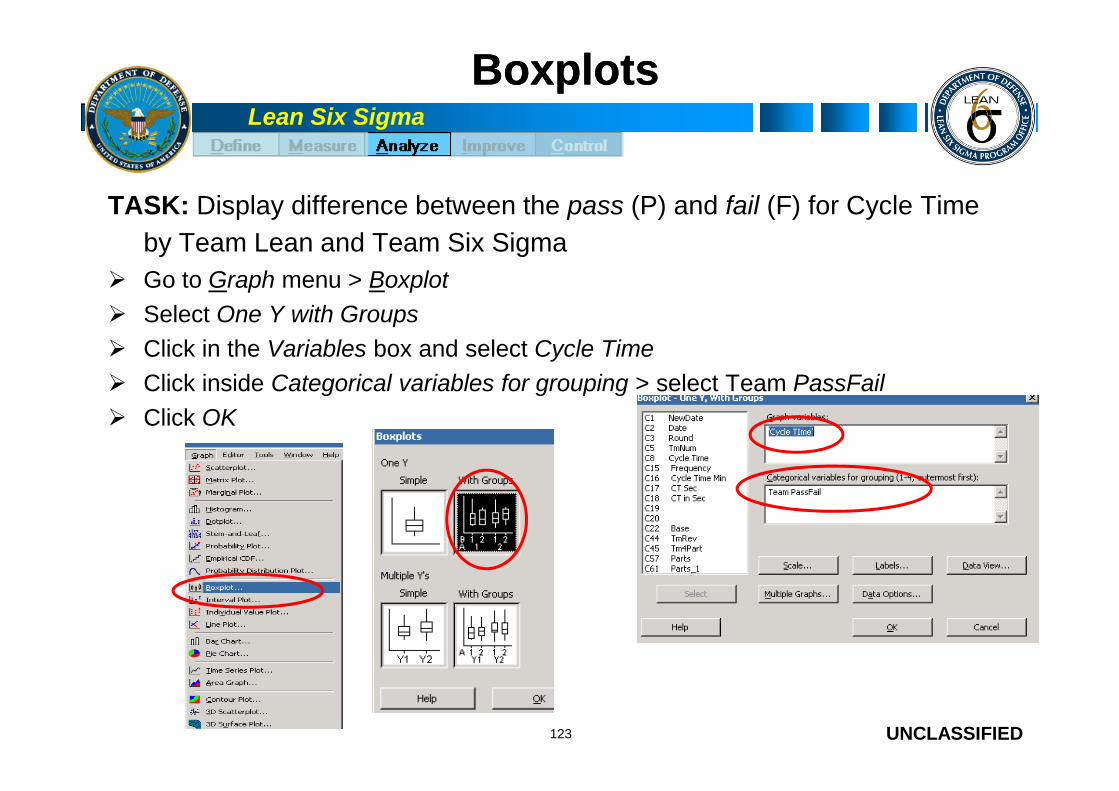
TASK: Display difference between the pass (P) and fail (F) for Cycle Time
by Team Lean and Team Six Sigma
Go to Graph menu > Boxplot
Select One Y with Groups
Click in the Variables box and select Cycle Time
Click inside Categorical variables for grouping > select Team PassFail
UNCLASSIFIED
Click inside Categorical variables for grouping > select Team PassFail
Click OK
123

Lean Six Sigma
BoxplotsBoxplots
RESULTS:
UNCLASSIFIED124

Lean Six Sigma
BoxplotsBoxplots
TASK: Display the mean symbol on
the boxplots
Go to the Add List selector in theGraph Editing Toolbar
Select Data Display
Check the Mean Symbol box
UNCLASSIFIED
Check the Mean Symbol box
Click OK
125
Lean Six Sigma
Exercise:Exercise: SimulationSimulation PerformancePerformance
What graphical tools would you use for thesimulation?
Why?
UNCLASSIFIED
Why?
Create three charts based upon Simulation data.
126
10 minutes

Lean Six Sigma
Analyze StoryboardAnalyze Storyboard
Define
MeasureAnalyze
SigmaPerformance Level of
1.3BUS CASE: Be #2 Fin Service Provider
GOAL: Reduce Loan/Lease CT from9.2 to 8.0 days by July 1
FIN IMPACT: $2.7M per year
Project Charter1.2 DayCCR Gap
-- ExampleExample --
UNCLASSIFIED127
Officer Work & Turnover, Waiting, & AutomationAffect CT; Job Aids affect Variation in CT
Optional Deliverable

Lean Six Sigma
Analyze Review QuestionsAnalyze Review Questions
Based on your analyses, should you refine the project definition?
If so, address why and communicate to the team
Do you have an idea of what Xs may be critical to your Y?
Are those Xs controllable?
What Xs can be changed or addressed based on the data you currently
UNCLASSIFIED
What Xs can be changed or addressed based on the data you currentlyhave?
Which will require further investigation?
Have you communicated your findings?
What issues and barriers exist?
Have you documented these on the action item list?
Are there any action items from Measure still not complete?
128
Lean Six Sigma
Analyze Tollgate QuestionsAnalyze Tollgate Questions
Has the team examined the process and identified potential timetraps/bottlenecks, disconnects, and redundancies that could contribute to theproblem statement?
Has the team analyzed data about the process and its performance to helpstratify the problem, understand reasons for variation in the process, andgenerate hypothesis as to the root causes of the current process performance?
Have the root causes been identified and validated?
UNCLASSIFIED
Does the team understand why the problem is being seen?
Has the team been able to identify and complete any additional “Quick Wins”?
Have findings to date required modification of the Project Charter? If so, havethese changes been approved by the Project Sponsor and the KeyStakeholders?
Have any new risks to project success been identified, added to the RiskMitigation Plan, and a mitigation strategy put in place?
129
Lean Six Sigma
What we have coveredWhat we have covered
Brainstorming captures potential root causes through open-endeddiscussion
Fishbone Diagram organizes potential root causes by source orcategory
XY Matrix prioritizes root causes via their relationship to the output
UNCLASSIFIED
XY Matrix prioritizes root causes via their relationship to the output
FMEA prioritizes root causes analytically by investigating all potentialfailure mechanisms; forms basis for control plan
Pareto Charts show the relative magnitude of a problem
Scatter Diagrams identify or confirm relationships between measures
130
Lean Six Sigma
Improve
Define
Measure
Analyze
UNCLASSIFIED131
ImproveAnalyze
Improve
Control

Lean Six Sigma
Learning ObjectivesLearning Objectives
At the end of this training, you will: Be aware of lean techniques for implementing lead time and on-time delivery improvements in a processBe able to define process flow and process flow improvementApply process flow improvement techniques to a case studyBe aware of statistical techniques for finding the likely places to
UNCLASSIFIED132
improve performance

Lean Six Sigma
ImproveImprove
Recap: Define
You have defined the problem
Measure
You have determined the size of the problem
Analyze
UNCLASSIFIED
Analyze
You have analyzed the data to determine the root causes where theimprovement opportunities are
Improve
Now it’s time to take action in order to CHANGE the processand improve performance
Just DO IT!
133
Lean Six Sigma
Areas of FocusAreas of Focus
Lean the process: Cycle time Redundancy Streamline Consolidate Sources of Consternation
UNCLASSIFIED
Reduce the variation: Attack sources of variation Attack sources of error Attack sources of rework
Together these will: Reduce effort Increase consistency Makes resources available for other needs
134

Lean Six Sigma
ImprovementImprovement TargetsTargets
Reducing cycle time
Reducing inventory
Cost reduction
Increasing available
UNCLASSIFIED
Increasing availablecapacity
Decreasing the areafootprint
Reducing order lead time
135
Lean Six Sigma
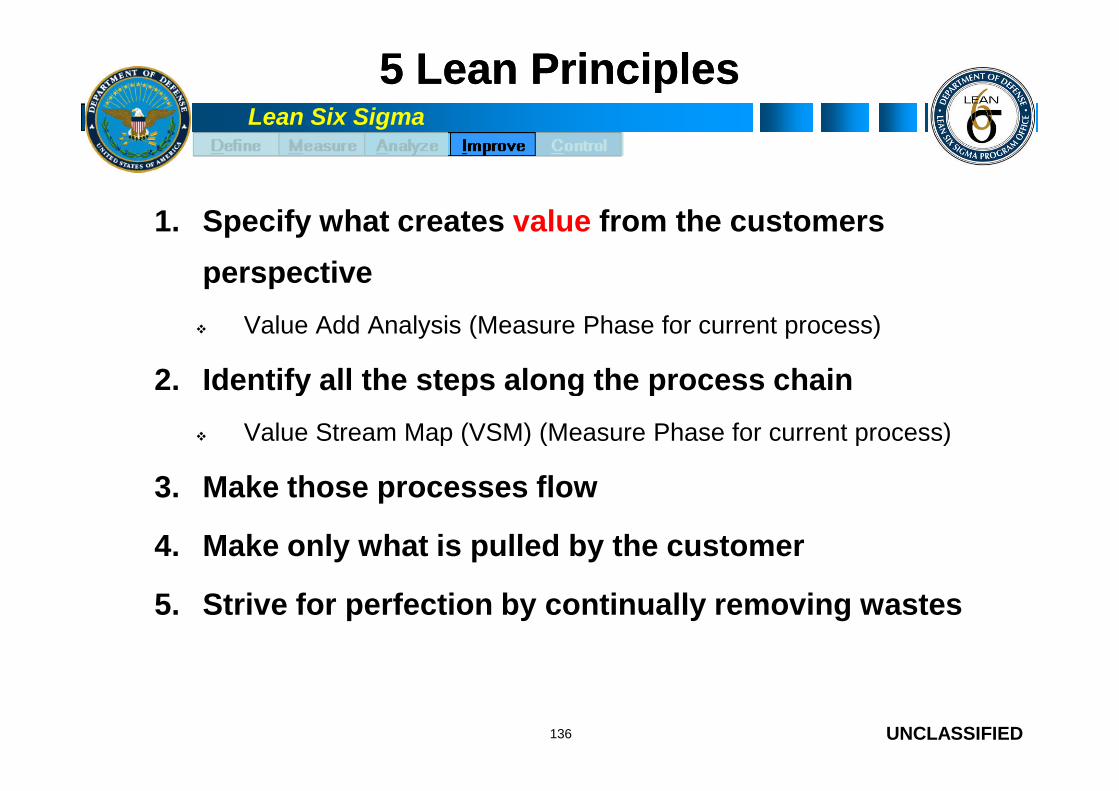
5 Lean Principles5 Lean Principles
1. Specify what creates value from the customers
perspective
Value Add Analysis (Measure Phase for current process)
2. Identify all the steps along the process chain
UNCLASSIFIED
2. Identify all the steps along the process chain
Value Stream Map (VSM) (Measure Phase for current process)
3. Make those processes flow
4. Make only what is pulled by the customer
5. Strive for perfection by continually removing wastes
136

Lean Six Sigma
5S5S
5S is a process and method for creating andmaintaining an organized, clean, and high-performance workplace.
5S enables anyone to distinguish between normaland abnormal conditions at a glance.
UNCLASSIFIED
and abnormal conditions at a glance.
5S is the foundation for continuous improvement,zero defects, cost reduction, and a more productivework space.
5S is a systematic way to improve the workplace, ourprocesses and our products through employeeinvolvement.
137
Lean Six Sigma
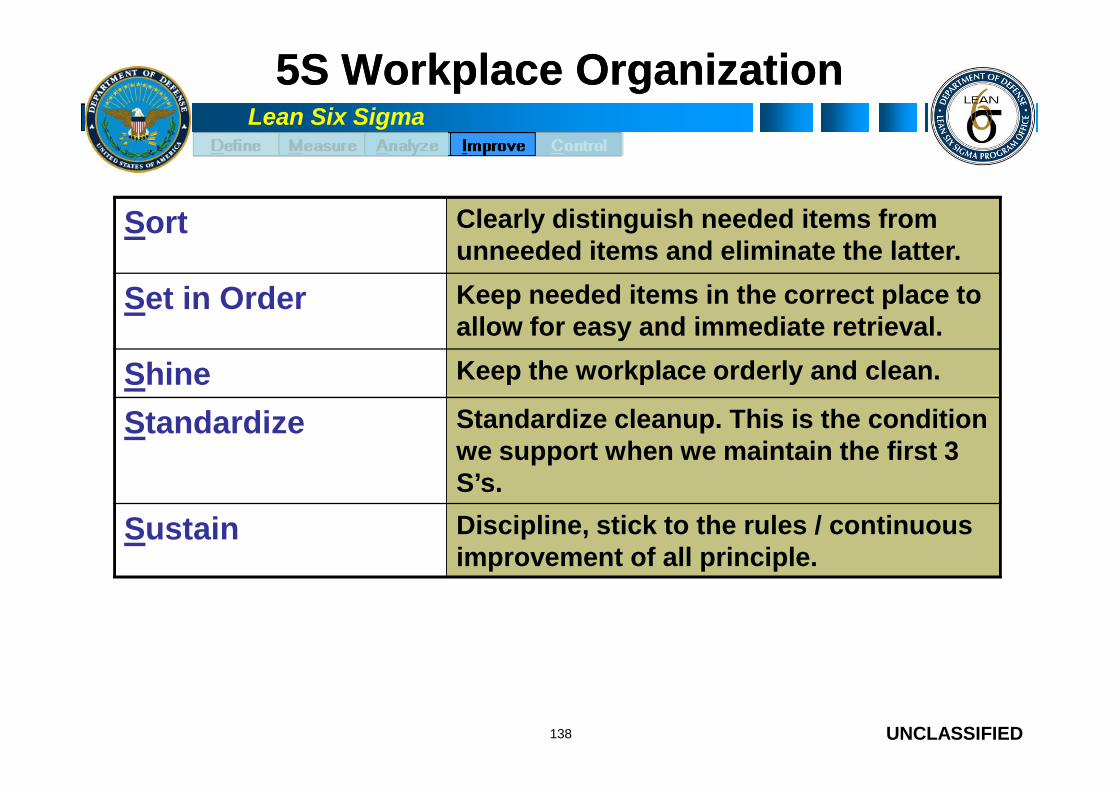
5S Workplace Organization5S Workplace Organization
Sort Clearly distinguish needed items fromunneeded items and eliminate the latter.
Set in Order Keep needed items in the correct place toallow for easy and immediate retrieval.
Shine Keep the workplace orderly and clean.
UNCLASSIFIED
Standardize Standardize cleanup. This is the conditionwe support when we maintain the first 3S’s.
Sustain Discipline, stick to the rules / continuousimprovement of all principle.
138
Lean Six Sigma
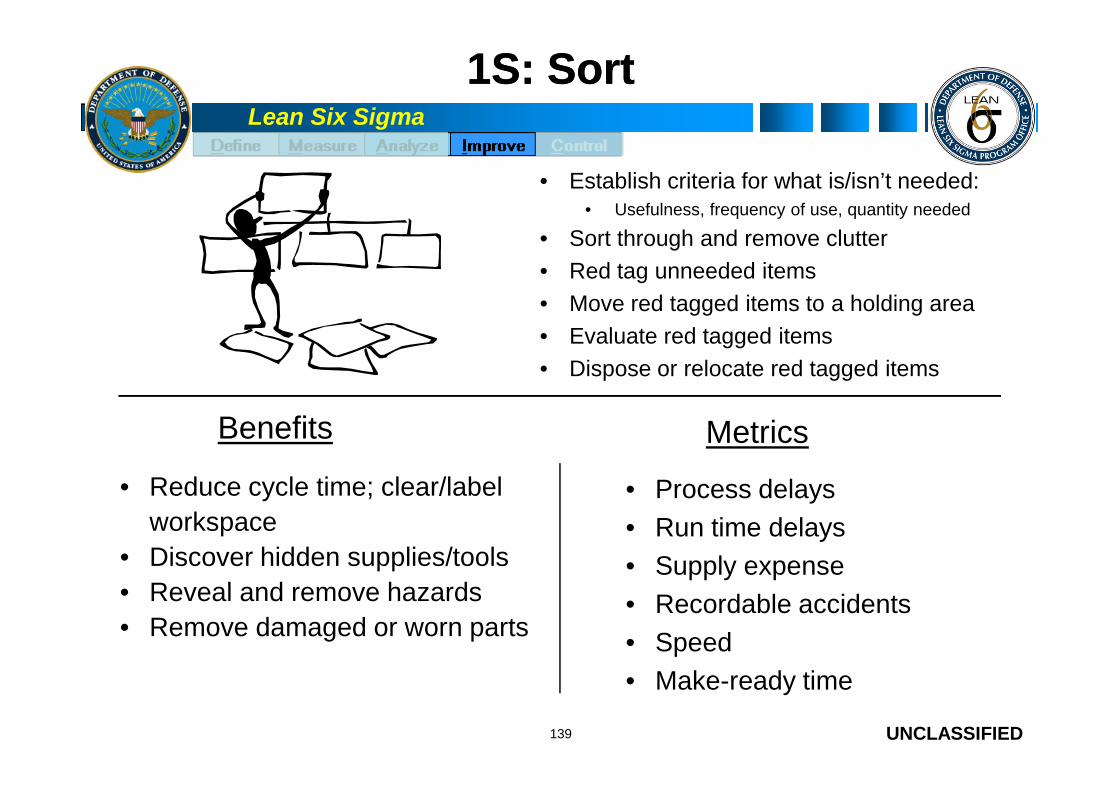
1S: Sort1S: Sort
• Establish criteria for what is/isn’t needed:• Usefulness, frequency of use, quantity needed
• Sort through and remove clutter
• Red tag unneeded items
• Move red tagged items to a holding area
• Evaluate red tagged items
• Dispose or relocate red tagged items
UNCLASSIFIED139
Benefits
• Process delays
• Run time delays
• Supply expense
• Recordable accidents
• Speed
• Make-ready time
• Reduce cycle time; clear/label
workspace
• Discover hidden supplies/tools
• Reveal and remove hazards
• Remove damaged or worn parts
Metrics

Lean Six Sigma
Demo Red TagDemo Red Tag
UNCLASSIFIED
Admit your addiction, or it’ll be an ‘intervention’…

Lean Six Sigma
2S: Set in Order2S: Set in Order
• Review workplace flow
• Decide where and how to keep things
• Consider principles of motion waste
• Work at the proper ergonomic height: 37”- 44”
• Arrange items in neat and organized patterns
• Use label, home addresses, visuals
• Make it obvious where things belong
UNCLASSIFIED141
Benefits
• Process delays
• Run time delays
• Recordable accidents
• Make-ready time
• Make it obvious where things belong
• Reduced movement through
labeling
• Cycle time reduction
• Reduce potential hazards
• Design in ergonomics
compliance requirements
Metrics
Lean Six Sigma
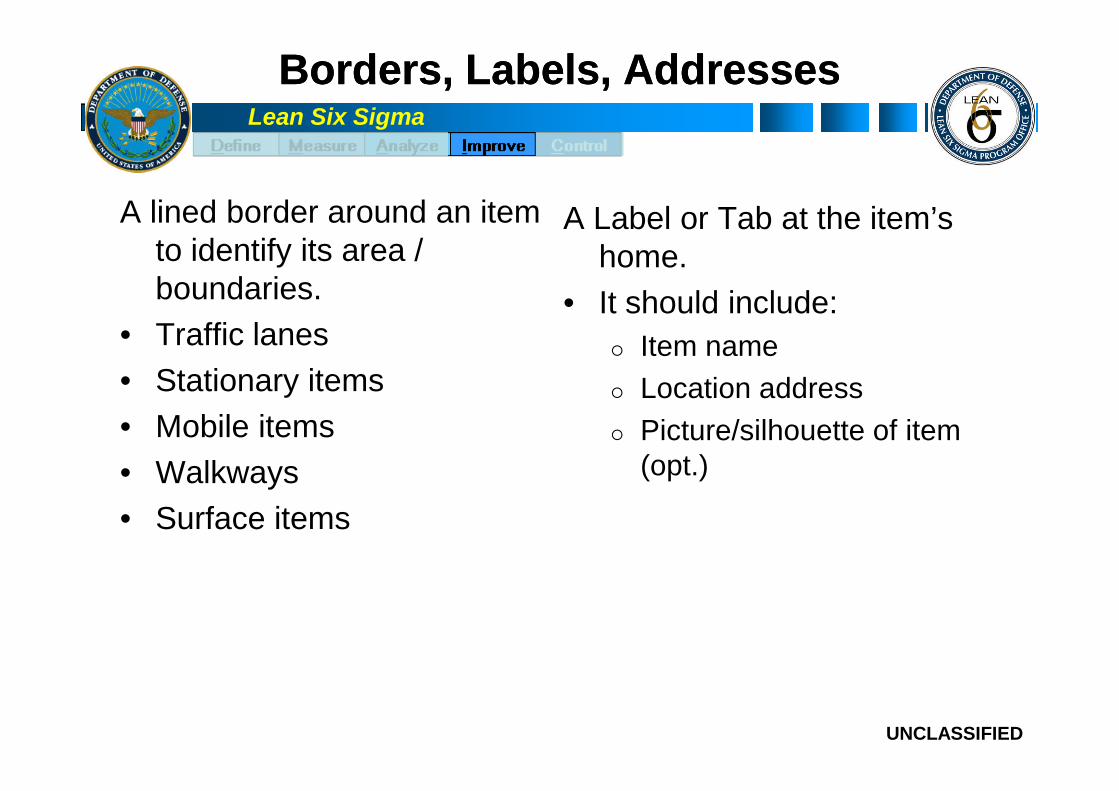
BordersBorders, Labels, Addresses, Labels, Addresses
A lined border around an itemto identify its area /boundaries.
• Traffic lanes
• Stationary items
A Label or Tab at the item’shome.
• It should include:
Item name
Location address
UNCLASSIFIED
• Stationary items
• Mobile items
• Walkways
• Surface items
Location address
Picture/silhouette of item(opt.)

Lean Six Sigma
How to ‘Set in OrderHow to ‘Set in Order’’ -- TheThe 5S Map5S Map
Draw a 5S map showing the best location for files,office equipment, and materials based onfrequency of use and ergonomics.
Store items together if they are used together and store them
UNCLASSIFIED
Store items together if they are used together and store themin the sequence they are used.
Store infrequently used items away from the point of use.

Lean Six Sigma
3S: Shine3S: Shine
• Create a cleanup work plan - top to bottom
• Thoroughly clean entire area, including
equipment
• Identify potential safety hazards
• Identify potential mechanical problems
- Defining Final Solution
UNCLASSIFIED144
Benefits
• Recordable accidents
• Delays
• Make-ready time
• Remove debris / increase safety
• Minimize fire and spill hazards
• Preventative maintenance
Metrics
Create and maintain a neat and clean environment.Make it a habit!
Lean Six Sigma
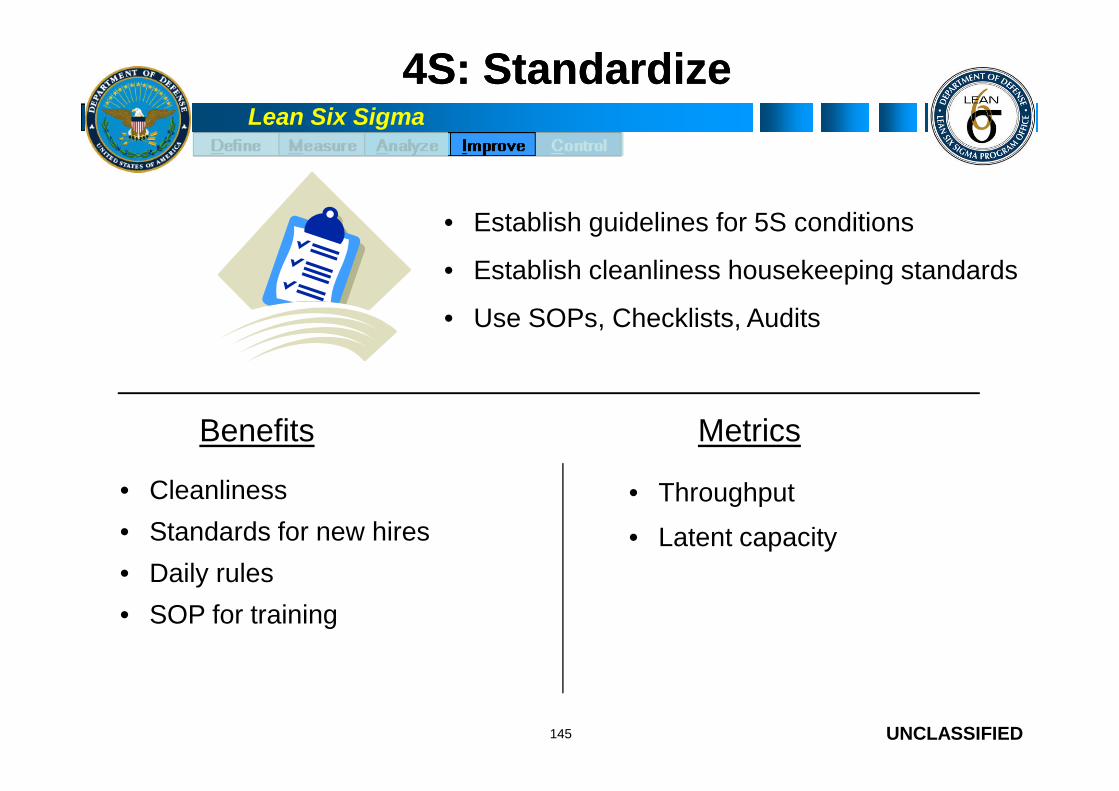
4S: Standardize4S: Standardize
• Establish guidelines for 5S conditions
• Establish cleanliness housekeeping standards
• Use SOPs, Checklists, Audits
UNCLASSIFIED145
Benefits
• Throughput
• Latent capacity
• Cleanliness
• Standards for new hires
• Daily rules
• SOP for training
Metrics

Lean Six Sigma
5S: Sustain5S: Sustain
• Make 5S part of daily routine
• Establish discipline
• Maintain consistency with standards
• Make it part of the culture
UNCLASSIFIED146
Benefits
• Throughput
• Latent capacity
• Sustained improvements in
work environment
Metrics

Lean Six Sigma
Keys to Success for 5SKeys to Success for 5S
1. Get everyone involved
2. Get commitment and authorization
3. Set expectations
4. Establish standards
UNCLASSIFIED
4. Establish standards
5. Establish daily routines
6. Keep it simple
7. Ensure resources are made available
147
Lean Six Sigma
Overall benefits of 5SOverall benefits of 5S
Energizes the workforce
Improves safety (could be 6S)
Improves efficiency
Improves quality
UNCLASSIFIED
Improves quality
Establishes workplace control
Lays the foundation for autonomous maintenance
148
Lean Six Sigma
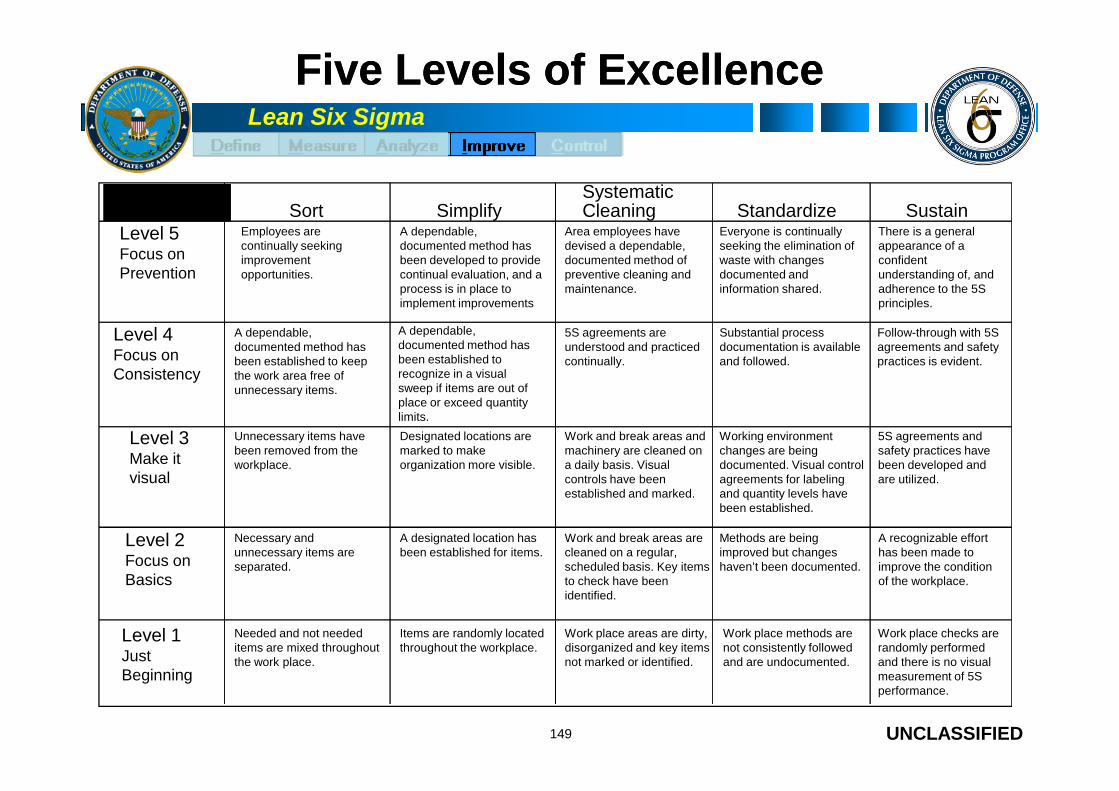
Five Levels of ExcellenceFive Levels of Excellence
Sort SimplifySystematicCleaning Standardize Sustain
Level 5Focus onPrevention
Level 4Focus onConsistency
Employees arecontinually seekingimprovementopportunities.
A dependable,documented method hasbeen developed to providecontinual evaluation, and aprocess is in place toimplement improvements
A dependable,documented method hasbeen established torecognize in a visualsweep if items are out of
A dependable,documented method hasbeen established to keepthe work area free ofunnecessary items.
Area employees havedevised a dependable,documented method ofpreventive cleaning andmaintenance.
Everyone is continuallyseeking the elimination ofwaste with changesdocumented andinformation shared.
There is a generalappearance of aconfidentunderstanding of, andadherence to the 5Sprinciples.
5S agreements areunderstood and practicedcontinually.
Substantial processdocumentation is availableand followed.
Follow-through with 5Sagreements and safetypractices is evident.
UNCLASSIFIED149
Level 3Make itvisual
Level 2Focus onBasics
Level 1JustBeginning
place or exceed quantitylimits.
unnecessary items.
Unnecessary items havebeen removed from theworkplace.
Necessary andunnecessary items areseparated.
Needed and not neededitems are mixed throughoutthe work place.
Designated locations aremarked to makeorganization more visible.
A designated location hasbeen established for items.
Items are randomly locatedthroughout the workplace.
Work and break areas andmachinery are cleaned ona daily basis. Visualcontrols have beenestablished and marked.
Working environmentchanges are beingdocumented. Visual controlagreements for labelingand quantity levels havebeen established.
5S agreements andsafety practices havebeen developed andare utilized.
Work and break areas arecleaned on a regular,scheduled basis. Key itemsto check have beenidentified.
Work place areas are dirty,disorganized and key itemsnot marked or identified.
Methods are beingimproved but changeshaven’t been documented.
A recognizable efforthas been made toimprove the conditionof the workplace.
Work place methods arenot consistently followedand are undocumented.
Work place checks arerandomly performedand there is no visualmeasurement of 5Sperformance.

5S Scorecard5S Scorecard
150

Lean Six Sigma
Visual WorkplaceVisual Workplace
A visual technique for process management aids in sustaininggains
Types of Visual Management Systems:
White Boards
UNCLASSIFIED
Postings of daily activities
Indicator lights
Posted process flow chart with post-its to indicate position of key jobs
Posted control charts and check sheets
151

Lean Six Sigma
The Visual WorkplaceThe Visual Workplace
The first steps of the visual workplace are the 5S standards.
Next, the team should ask, Can we readily identify:
Downtime issues?
Scrap issues?
Setup problems?
Line balancing opportunities?
UNCLASSIFIED
Line balancing opportunities?
Excessive inventory levels?
Extraneous tools and supplies?
If you CANNOT readily identify these opportunities through a VISUALglance of the area, the team should establish a means of immediateidentification.
152
Lean Six Sigma
Visual ControlsVisual Controls
Visual Controls are communication devicesused in the work environment that tell us ata glance how work should be done
Communicate information quickly and clearly
Locate things and places
UNCLASSIFIED
Locate things and places
Highlight defects, over-production and/or under-production
Provide instruction
Spotlight abnormal conditions
Communicate status to all
153
Lean Six Sigma
Examples of Visual ControlsExamples of Visual Controls
Red Tags - identify items to be scrapped
Signs/labels - to position tools, inventory, etc.
White Lines - mark pathways, inventory locations
Alarm Lights - alert team members / supervisors
Kanbans - “pull production”, limit WIP
UNCLASSIFIED
Kanbans - “pull production”, limit WIP
Production boards - show required/actual output
White Board – similar to production board
Standardized Work Charts - process maps
Defective Item Displays - display defects, informationon defect cause and solution
154

Lean Six Sigma
Visual ControlsVisual Controls
UNCLASSIFIED155
Can you distinguish between normal and abnormalconditions in the above photos? Abnormal conditions
should be visually obvious in 5 seconds or less!

Lean Six Sigma
Visual ControlsVisual Controls
UNCLASSIFIED156
5 seconds or less – which kithas all its parts?

Lean Six Sigma
Effective VisualsEffective Visuals
Create a work environment that is…
Self – explaining
UNCLASSIFIED
Self – ordering
Self – regulating
Self - improving
157
Lean Six Sigma
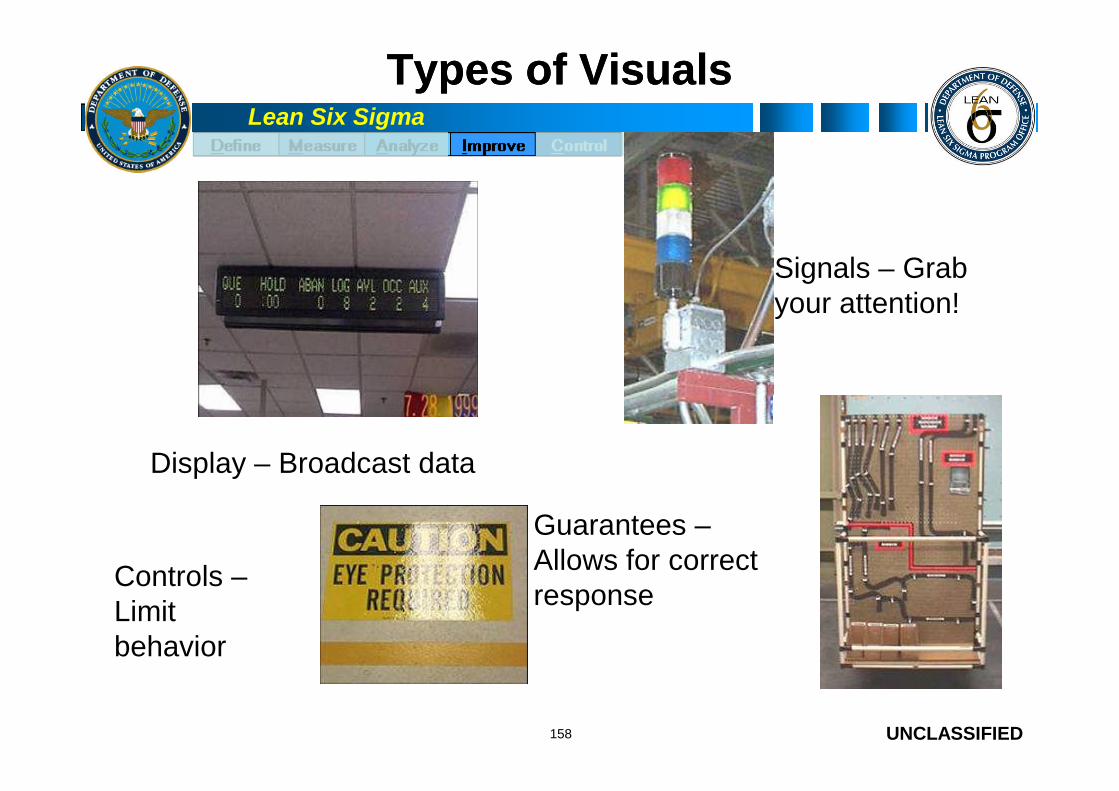
Types of VisualsTypes of Visuals
Signals – Grabyour attention!
UNCLASSIFIED158
Display – Broadcast data
Controls –Limitbehavior
Guarantees –Allows for correctresponse

Lean Six Sigma
Other ExamplesOther Examples
UNCLASSIFIED159
Strike ZonesShadowing
Color SchemesStriping Production ControlBoards
Foot Printing
Lean Six Sigma
Production Control BoardsProduction Control Boards
Tell how many people are needed
Tell who does what
Makes problems visual
Ahead or behind takt time
Quality issues
UNCLASSIFIED
Quality issues
Missing parts, materials, information,people
Down time
Triggers the problem solving process
160
Lean Six Sigma
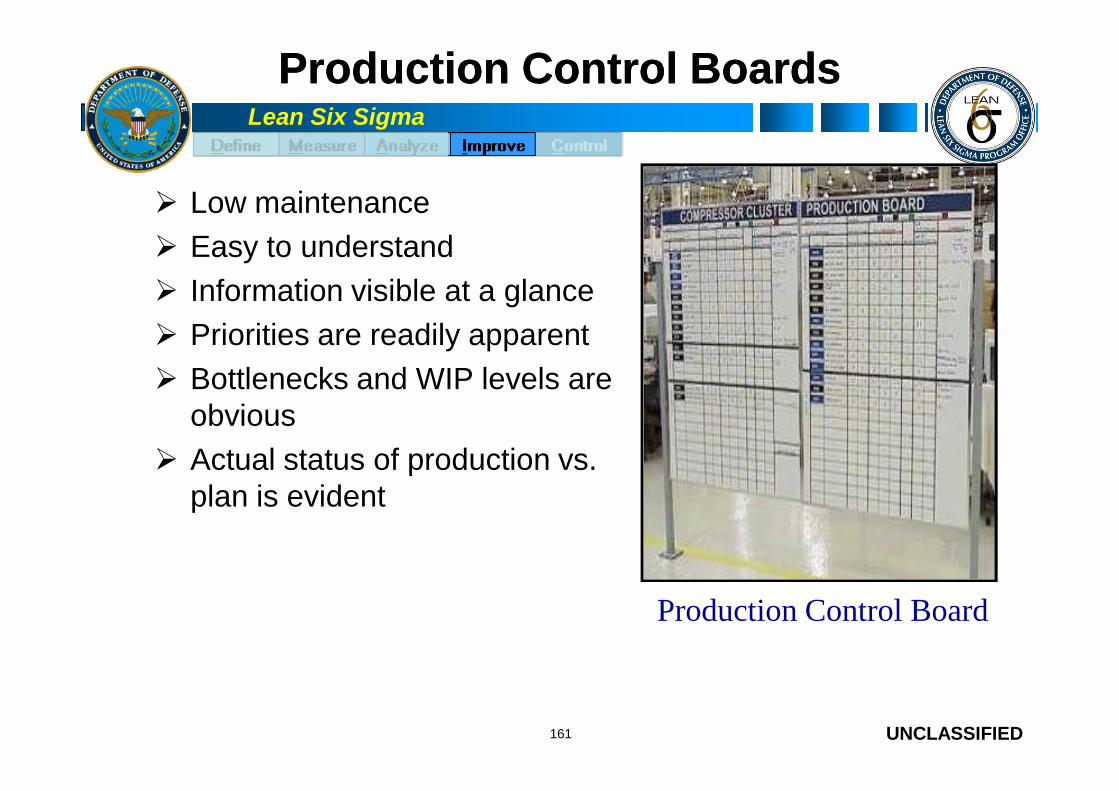
Production Control BoardsProduction Control Boards
Low maintenance
Easy to understand
Information visible at a glance
Priorities are readily apparent
Bottlenecks and WIP levels are
UNCLASSIFIED161
Bottlenecks and WIP levels areobvious
Actual status of production vs.plan is evident
Production Control Board
Lean Six Sigma
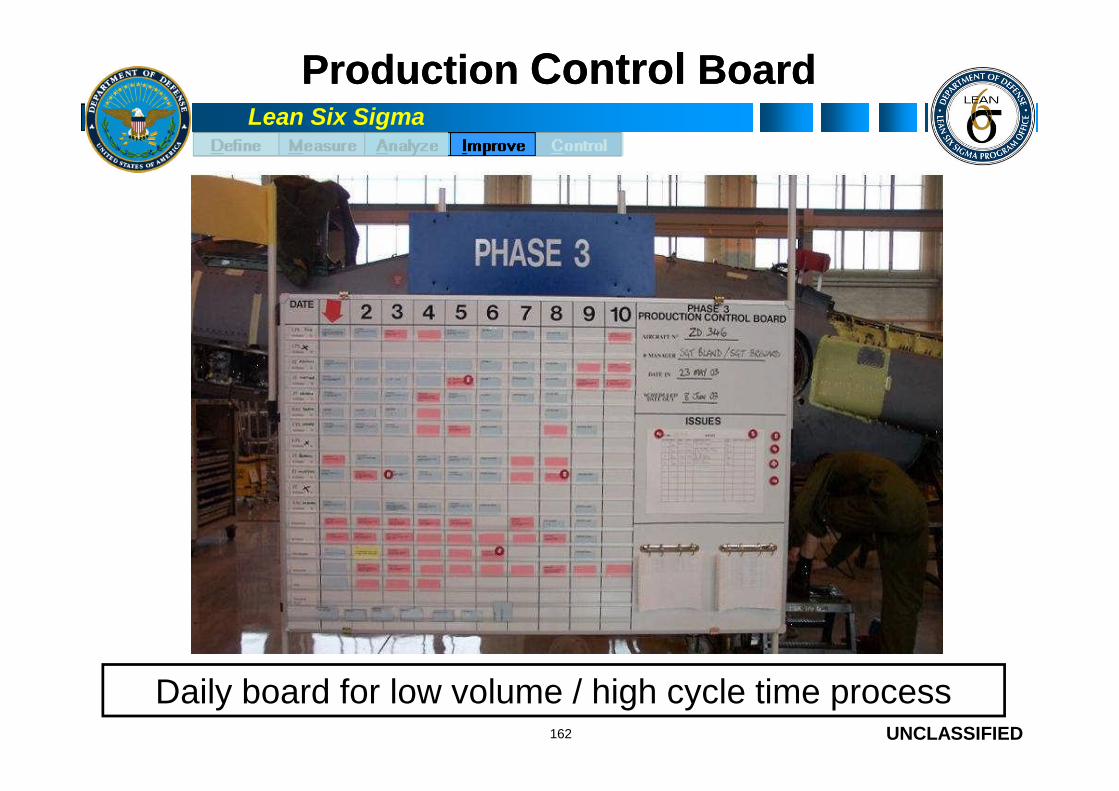
ProductionProduction ControlControl BoardBoard
UNCLASSIFIED162
Daily board for low volume / high cycle time process

Lean Six Sigma
Daily Board WalkDaily Board Walk
Managers review as employeesupdate
Issues are identified, addressed, andcorrective actions established
Exceptions can be identified clearly(priorities)
UNCLASSIFIED163
(priorities)
Targets must be clearly defined
Weekly Meetings– A venue for the cell to discuss general operational issues and
continuous improvement
Agendas– Keeps a meeting focused on its purpose
– Allows participants to prepare
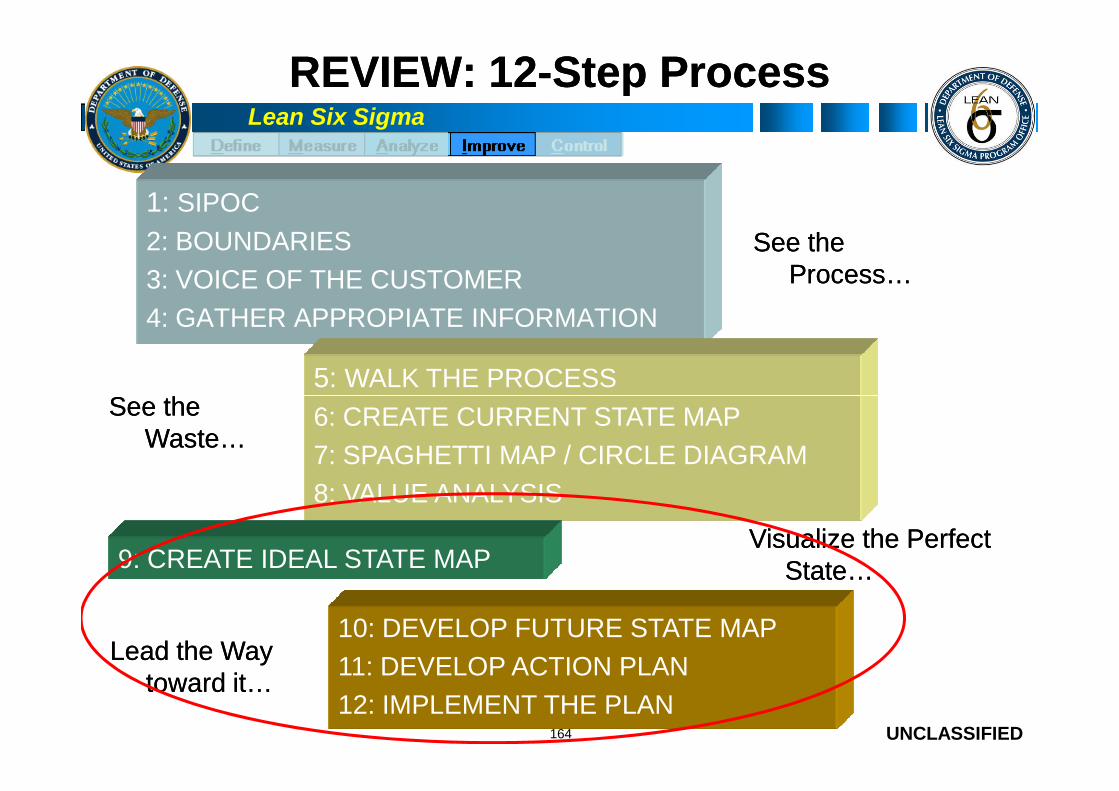
Lean Six Sigma
REVIEW: 12REVIEW: 12--Step ProcessStep Process
1: SIPOC
2: BOUNDARIES
3: VOICE OF THE CUSTOMER
4: GATHER APPROPIATE INFORMATION
See theProcess…
See theProcess…
See theSee the5: WALK THE PROCESS
UNCLASSIFIED164
See theWaste…
See theWaste…
Visualize the PerfectState…
Visualize the PerfectState…
6: CREATE CURRENT STATE MAP
7: SPAGHETTI MAP / CIRCLE DIAGRAM
8: VALUE ANALYSIS
9: CREATE IDEAL STATE MAP
10: DEVELOP FUTURE STATE MAP
11: DEVELOP ACTION PLAN
12: IMPLEMENT THE PLAN
Lead the Waytoward it…
Lead the Waytoward it…
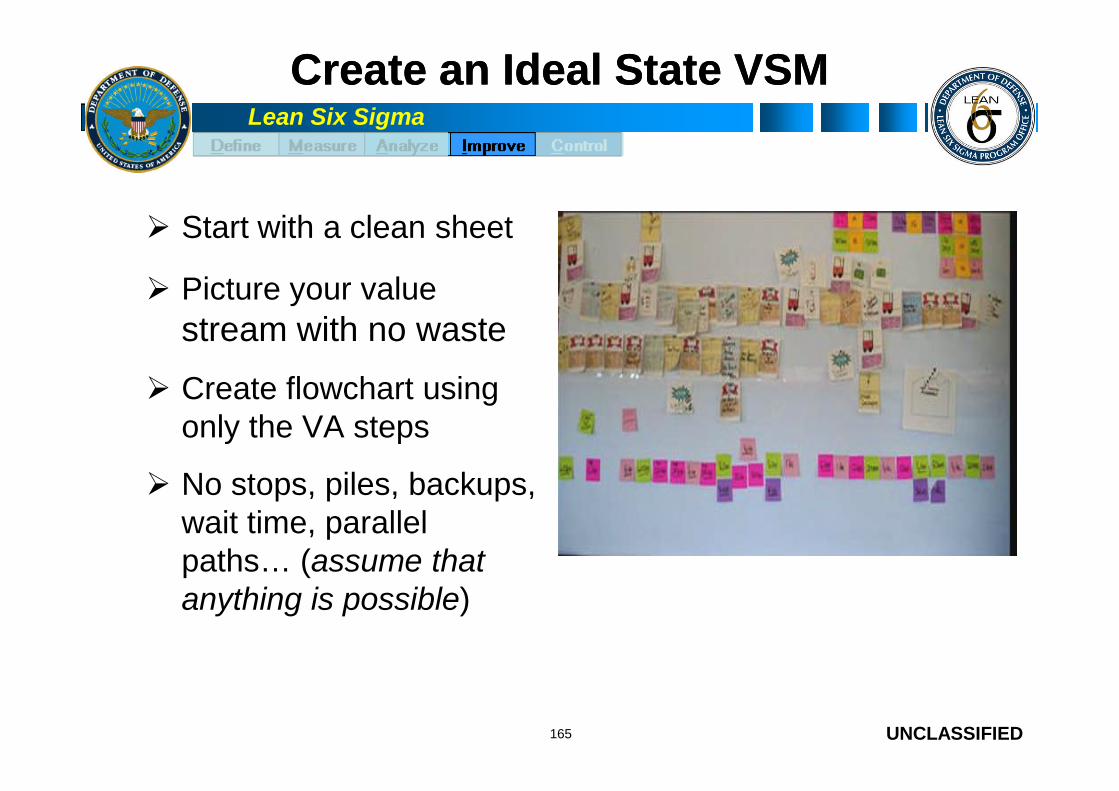
Lean Six Sigma
Create an Ideal State VSMCreate an Ideal State VSM
Start with a clean sheet
Picture your value
stream with no waste
Create flowchart using
UNCLASSIFIED
Create flowchart usingonly the VA steps
No stops, piles, backups,wait time, parallelpaths… (assume thatanything is possible)
165

Lean Six Sigma
What is a Future State Map ?What is a Future State Map ?
Visual of improved material and information flow
Unites Performance Improvement concepts andtechniques
Used to drive detailed implementation plans
What type of improvements are needed and why?
UNCLASSIFIED
What type of improvements are needed and why?
166

Lean Six Sigma
Process StreamliningProcess Streamlining: “: “To Be”To Be”
What
Where
Eliminate
Combine Places
ASK ACT IMPACT
UNCLASSIFIED167
WhereWhenWho
How
CombineRearrange
Simplify
PlacesSequencesPersons

Lean Six Sigma
Future State Map Flow Layout ToolsFuture State Map Flow Layout Tools
Future State Spaghetti Diagrams
Future State Circle Diagrams
Future State Physical Layout
UNCLASSIFIED168
StripTank
PaintBooth
Office
PC
NDI
51E
PAINTBOOTH
N OFFICE
D TOOLI ROOM
AWP/RMSSTRIPROOM
SAFETY
520
51D P.C.
W/C 51A/B
NDI
PC
Material
Technician
MainTech
C.O.
ISEA
SUPVPEOIWS2
STOCKPOINT
SNAPDEPTHEAD
SK
DAAS
BO1
CRANESUPPLY
DOCKSIDE
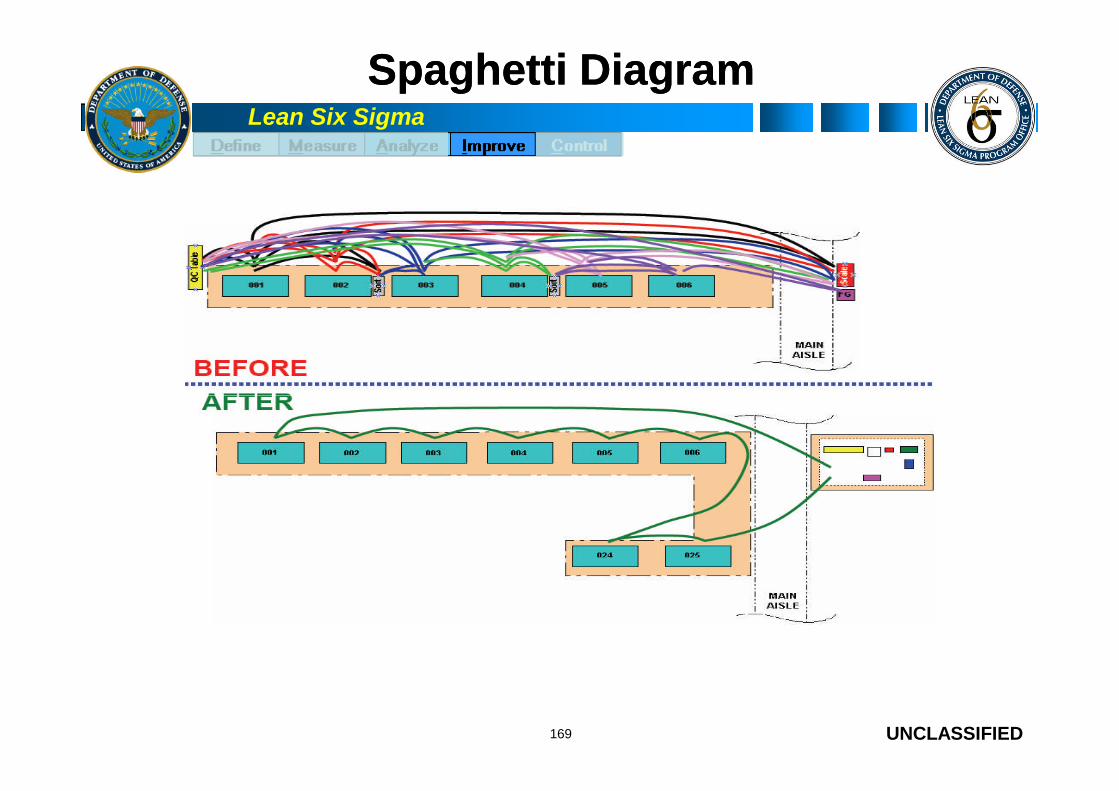
Lean Six Sigma
Spaghetti DiagramSpaghetti Diagram
UNCLASSIFIED169
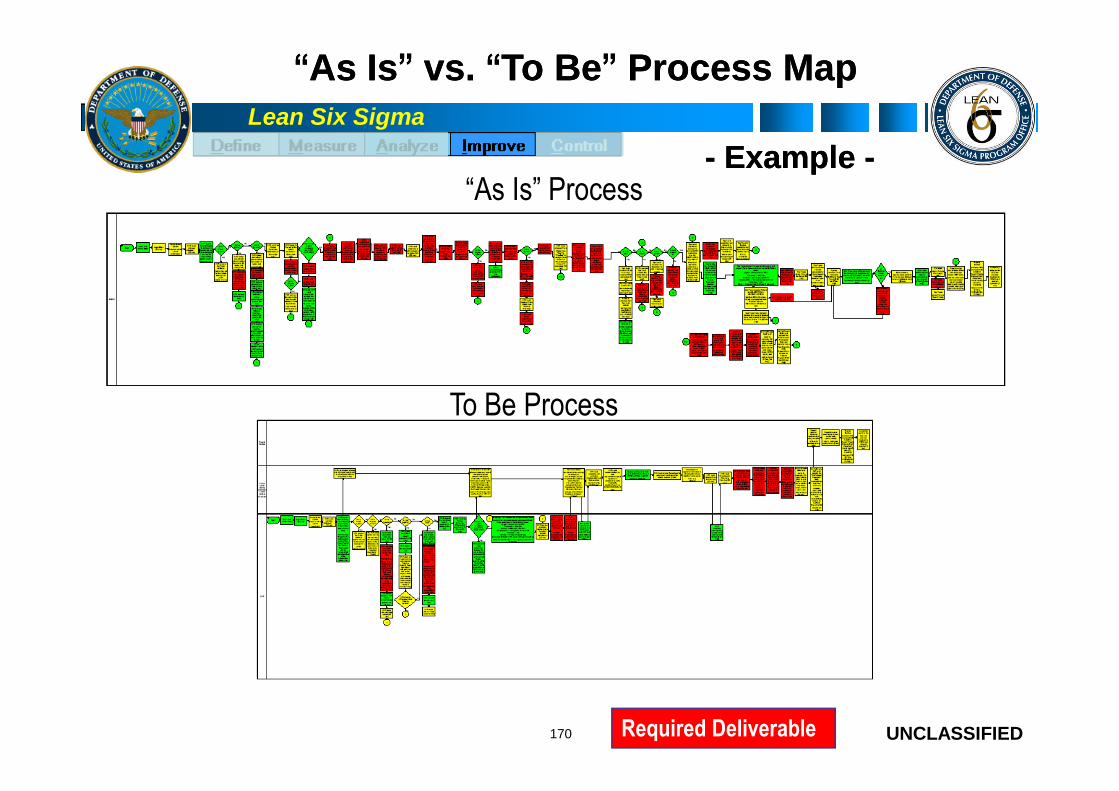
Lean Six Sigma
“As Is” Process
““As IsAs Is”” vs.vs. ““To BeTo Be”” Process MapProcess Map
To Be Process
-- ExampleExample --
UNCLASSIFIED170
To Be Process
Required Deliverable

Lean Six Sigma
Lean the ProcessLean the Process
Wasted Space / Cycle Time
Where is wasted space?
Where are long cycle times?
Rework or Poor Timing
Are there activities that are done more than once?
What percent of the desk-space is allocated to rework?
UNCLASSIFIED171
What percent of the desk-space is allocated to rework?
Done More Than Once?
Where are similar tasks done by more than one function?
Distances
Can distances be reduced?
Decision Points
Due to incomplete or erroneous work / information in previous steps?
Can they be eliminated?
Lean Six Sigma
Lean the ProcessLean the Process
Add cycle times to Process Map. Include: Run Time – time to actually perform the step
Wait Time – time unit sits waiting for movement to next step
Queue Time – time unit sits waiting for processing
Changeover Time – time to change from one unit to next unit
UNCLASSIFIED
Changeover Time – time to change from one unit to next unit
Look for opportunities to reduce cycle time by: Eliminating steps
Changing the sequence of steps
Eliminating/minimizing movement between steps
Etc.
172

Lean Six Sigma
Lean PrinciplesLean Principles -- FlowFlow
Starts at receipt of customer request
Ends at delivery to customer
Flow utilizes the fewest number of steps
The continuous, progressive adding of Value in theeyes of the customer
UNCLASSIFIED
Flow utilizes the fewest number of stepswith no interruptions
Eliminates waste
173
People always working on the productand the product always being worked on

Lean Six Sigma
Typical FlowTypical Flow –– Before ImprovementsBefore Improvements
ORDERPART
REMOVE
INSTALLINSPECT
INSPECT
• Batchoperations
• Isolated
INDUCTWorkplace Layout
UNCLASSIFIED174
TEST
TEST SOLDERSIGN-OFF
• Isolatedprocesses
• Unknownstatus

Lean Six Sigma
Typical FlowTypical Flow –– After ImprovementsAfter Improvements
ORDERPART
• Single-piece flow
• Visual status
REMOVE TEST INDUCT
INSTALL
Workplace Layout
UNCLASSIFIED175
• Visual status
• Reduced travel
INSPECT TEST SIGN-OFFINSPECT
SOLDER

Lean Six Sigma
Work Cell or Office Space?Work Cell or Office Space?
RawMaterials
Andon signalsneed for help
Admin support to keepthe value-added workerson task and undistracted!
UNCLASSIFIED176
Materials
FinishedGoods
Cross-trained employees to flexwith changing demand!
Workplace Layout

Lean Six Sigma
The Ideal State:
Produce and move one piece at a time
One orderenters system
Route partto customer
Route tocorrect person
Order part
One Piece Flow vs. BatchingOne Piece Flow vs. Batching
UNCLASSIFIED177
File
enters system to customercorrect person
Segregate excess WIP away from the improved process;develop a plan to eliminate it.

Lean Six Sigma
One Piece Flow vs. BatchingOne Piece Flow vs. Batching
If One-Piece Flow is best – thenwhy do we batch?
One reason isSET-UP TIME
UNCLASSIFIED178
SET-UP TIME
The amount of time taken to change over from the
completion of the previous process to the beginning
of the next process … ”clock time” not labor time.
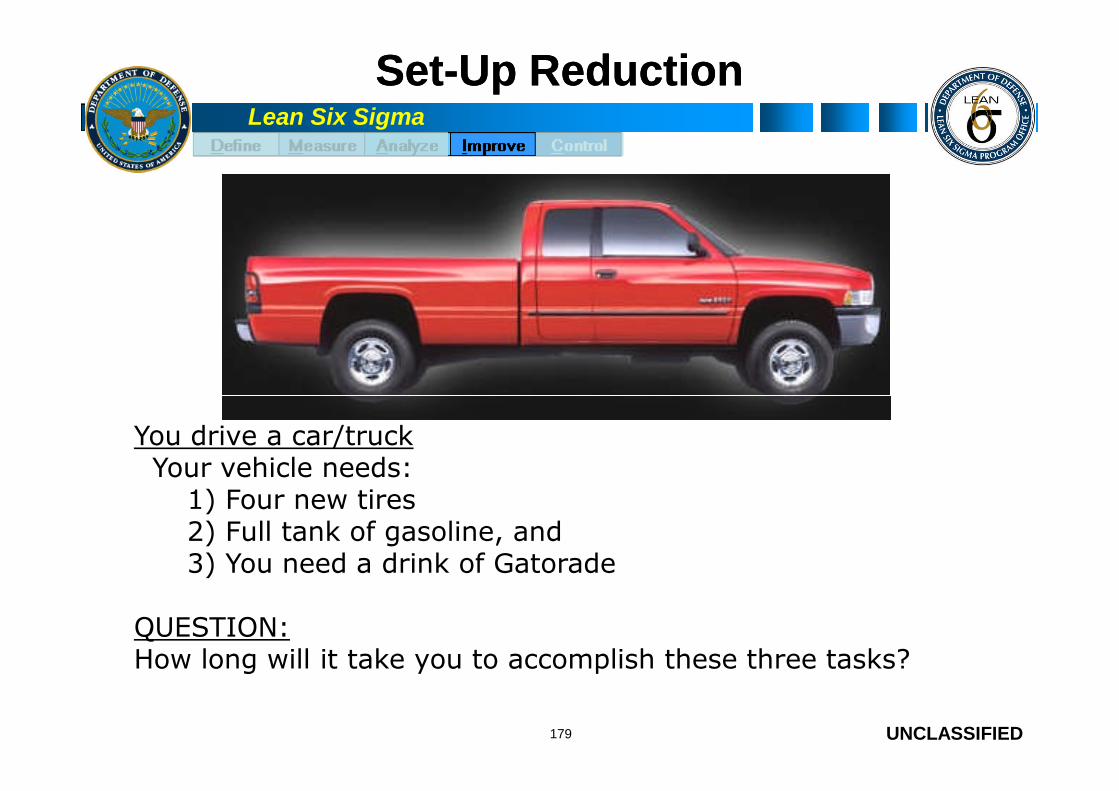
Lean Six Sigma
SetSet--Up ReductionUp Reduction
UNCLASSIFIED179
You drive a car/truckYour vehicle needs:
1) Four new tires2) Full tank of gasoline, and3) You need a drink of Gatorade
QUESTION:How long will it take you to accomplish these three tasks?
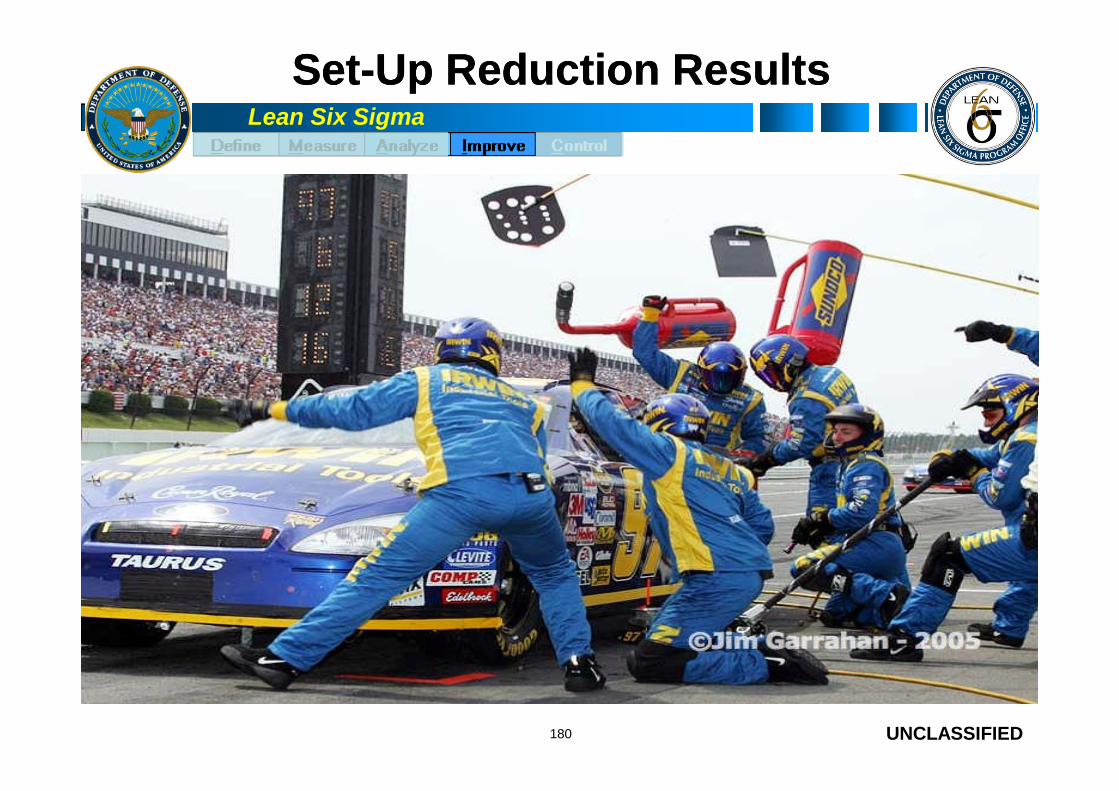
Lean Six Sigma
SetSet--Up Reduction ResultsUp Reduction Results
UNCLASSIFIED180
Lean Six Sigma
SetSet--Up Times and Lot Sizes InteractUp Times and Lot Sizes Interact
Lot sizes are made large because set-ups takea long time.
Attempt to increase total throughput
Ignores underlying issues
Set-ups take a long time because they are not
UNCLASSIFIED
Set-ups take a long time because they are notdone often.
The cycle repeats endlessly.
It’s best to improve set-ups first.
Set-up reduction “feels” contradictory and so it isoften ignored; spend effort improving NVA to improveVA.
181

Lean Six Sigma
Why Address SetWhy Address Set--Ups?Ups?
Improve flow by reducing cycle times
Allows smaller lots
Resources are spent on VA activities
Resource flexibility
Increases ability to change products or servicesin a timely manner
UNCLASSIFIED
in a timely manner
Cost
Reduces WIP and carrying costs
182

Lean Six Sigma
Ways to Streamline SetWays to Streamline Set--UpUp
Change tasks: Eliminate, combine, re-sequence, put inparallel
Fix settings, eliminate adjustment
Eliminate threads
Unit tool changes
UNCLASSIFIED
Unit tool changes
Reduce hand tools
Focus storage
Plan and stage
Use casters & rollers
Standardize
183
Lean Six Sigma
SetSet--Up Time Lessons LearnedUp Time Lessons Learned
Increasing lot sizes above an optimal value will increasecycle time (Little’s Law) and increase material carryingcosts with zero impact on exit rate.
Sometimes WIP is necessary. In these cases, alwaysdetermine optimal WIP and maintain WIP control.
UNCLASSIFIED
Even when WIP helps, it remains NON VALUE ADDED!Where there is WIP (or NVA of any kind), ask “why?” todetermine root cause. In this case, root cause is set-uptime. Use Kaizen / Rapid Improvement Events to reduceset-up time and drive down WIP for HUGE cycle timereductions!
184
Lean Six Sigma
SetSet--Up Time Lessons LearnedUp Time Lessons Learned
Remember: Use set-up time reduction to reduce WIP, notto increase process “up” time. Set-up time reduction aloneresults in only modest gains. But reduce set-up time by50% and optimal WIP is cut in half. Reduce WIP by 50%and cut cycle time by 50% while still maximizing exit rate(in this case, 10 seconds).
UNCLASSIFIED
(in this case, 10 seconds).
If takt requires a higher exit rate than process constraintsallow, WIP cannot fix the problem. Only constraintmanagement can do that! Use Lean and Six Sigma tools atthe constraint to improve exit rate.
185
Lean Six Sigma
SetSet--Up Time Lessons LearnedUp Time Lessons Learned
Often the best way to reduce cycle time is to reduce set-uptime. The REAL constraint is often set-up time, NOT any ofthe individual process steps.
To answer the question “what is the optimum lot size” youhave to balance the cost of adding one more to the lot
UNCLASSIFIED
have to balance the cost of adding one more to the lotagainst time saved by adding it to the lot. Cost BenefitAnalysis is often required, but CBA can only be appliedaccurately if you first understand takt, set-up time, properlot sizing, and the process constraint!
This is not always easy! Ask your Black Belts for help!
186

Lean Six Sigma
BreakthroughBreakthrough StrategiesStrategies
Just-in-time (JIT) The necessary components of production arrive in the necessary quantity at the
necessary time Eliminates inventory
Pull production systems Component supply triggered by signal (e.g. Kanban card) Replaces central planning (push system) Essential mechanism for JIT
UNCLASSIFIED
Essential mechanism for JIT
Production smoothing Mix of units produced based on sales proportions Production sequence based on unit cycle times Goal: “production at the velocity of sales”
General purpose, flexible machines Specialized tools instead of specialized machines Enables production smoothing and quick response to variation in sales
187
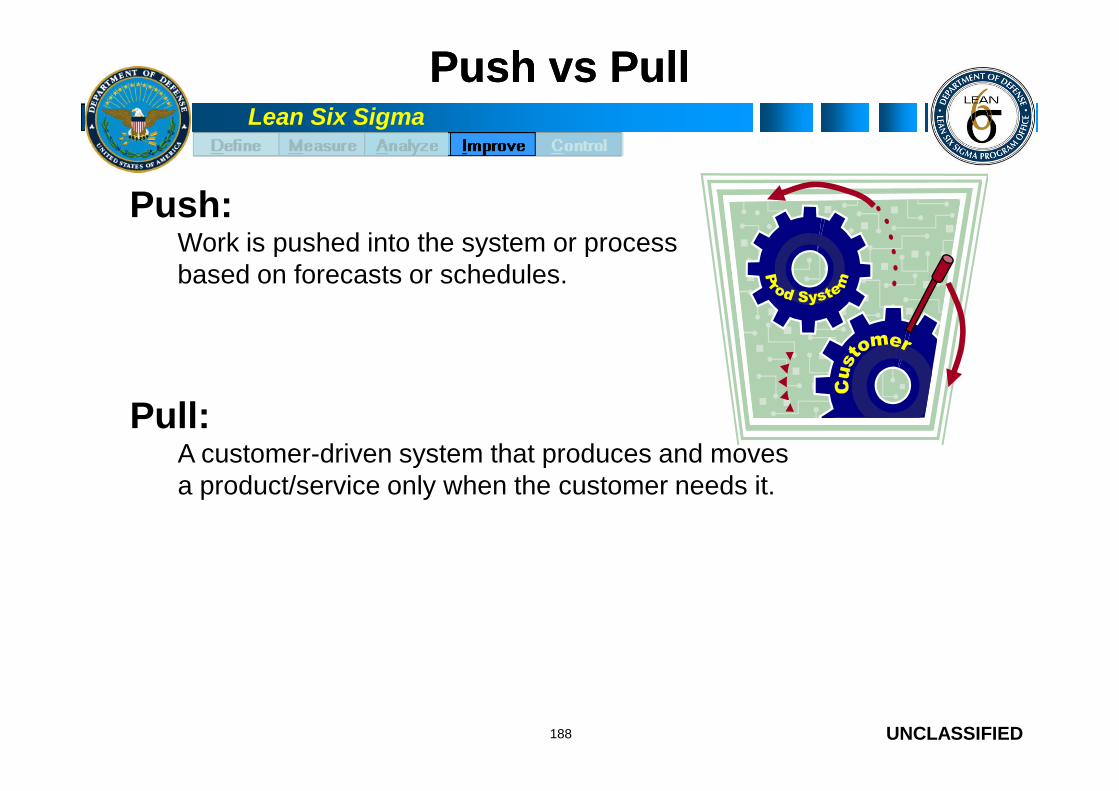
Lean Six Sigma
PushPush vsvs PullPull
Push:Work is pushed into the system or processbased on forecasts or schedules.
Pull:
UNCLASSIFIED188
Pull:A customer-driven system that produces and movesa product/service only when the customer needs it.

Lean Six Sigma
What is Pull?What is Pull?
No one upstreamproduces a productor service until thedownstreamcustomer asks for it.
Activity
Activity
Upstream
UNCLASSIFIED189
Activity
Activity
Downstream
Information FlowsUpstream
Material/Service FlowsDownstream
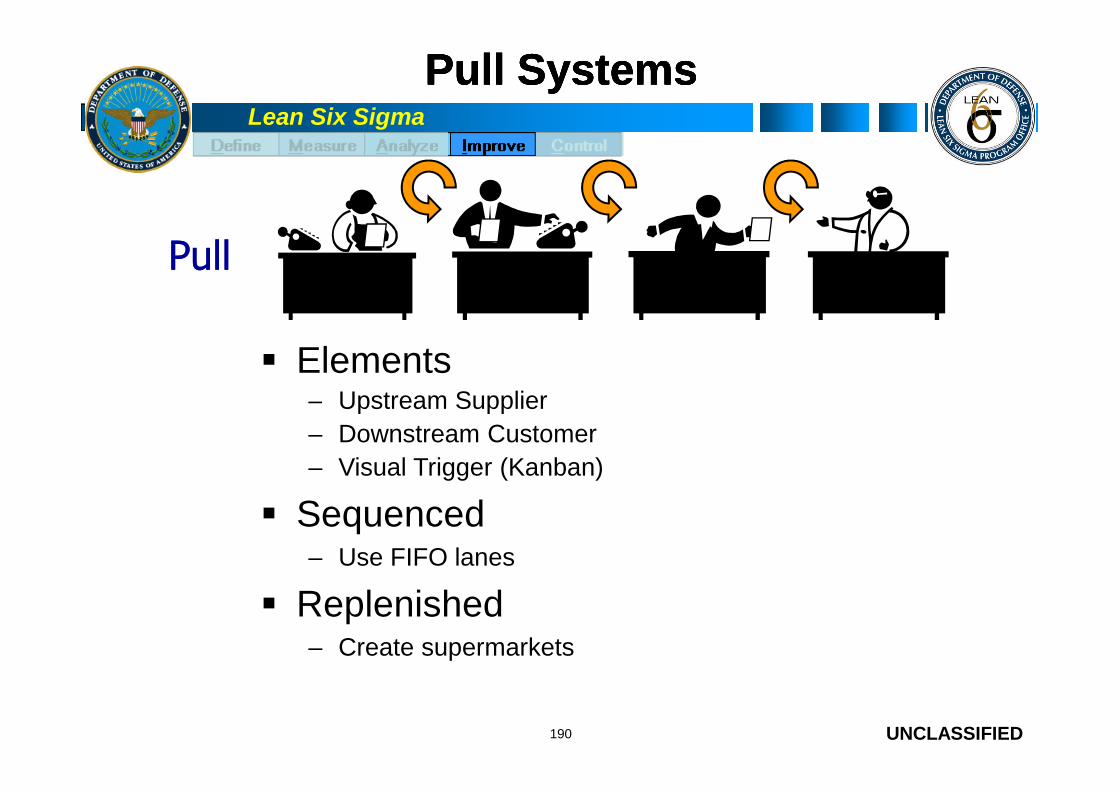
Lean Six Sigma
Pull SystemsPull SystemsPull SystemsPull Systems
PullPull
Elements– Upstream Supplier
UNCLASSIFIED190
– Upstream Supplier
– Downstream Customer
– Visual Trigger (Kanban)
Sequenced– Use FIFO lanes
Replenished– Create supermarkets
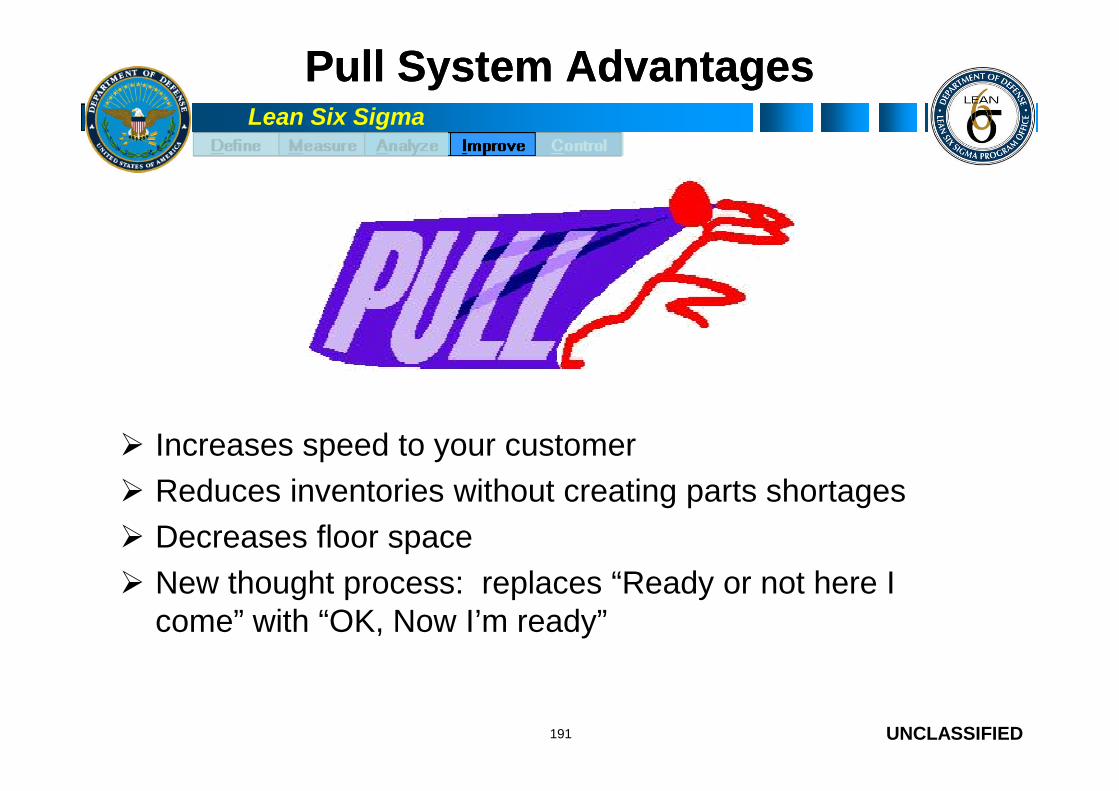
Lean Six Sigma
Pull System AdvantagesPull System Advantages
UNCLASSIFIED
Increases speed to your customer
Reduces inventories without creating parts shortages
Decreases floor space
New thought process: replaces “Ready or not here Icome” with “OK, Now I’m ready”
191
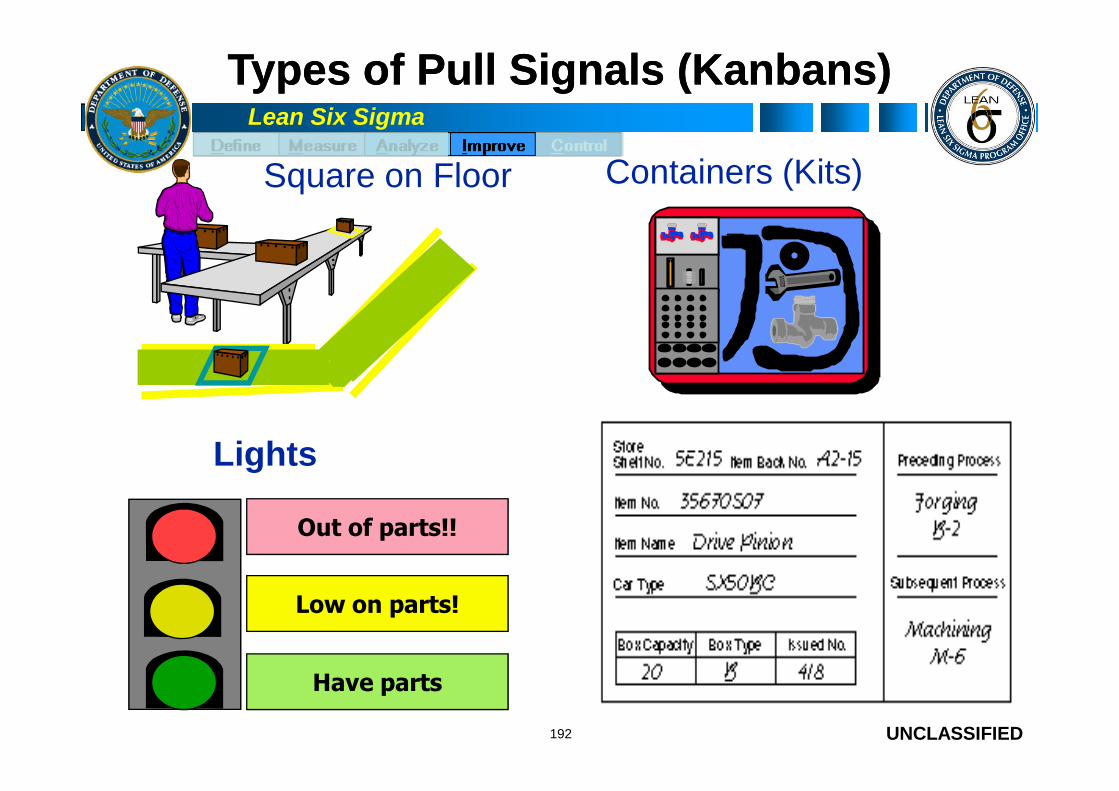
Lean Six Sigma
Types of Pull Signals (Types of Pull Signals (KanbansKanbans))
Square on Floor Containers (Kits)
UNCLASSIFIED192
Lights
Out of parts!!
Low on parts!
Have parts

Lean Six Sigma
KanbanKanban RulesRules
Never move defective items
The customer withdraws only what is needed
Produce only the quantity withdrawn by the customer
UNCLASSIFIED
Produce only the quantity withdrawn by the customer
Level production
Use Kanban to fine-tune production
Stabilize and strengthen the process193
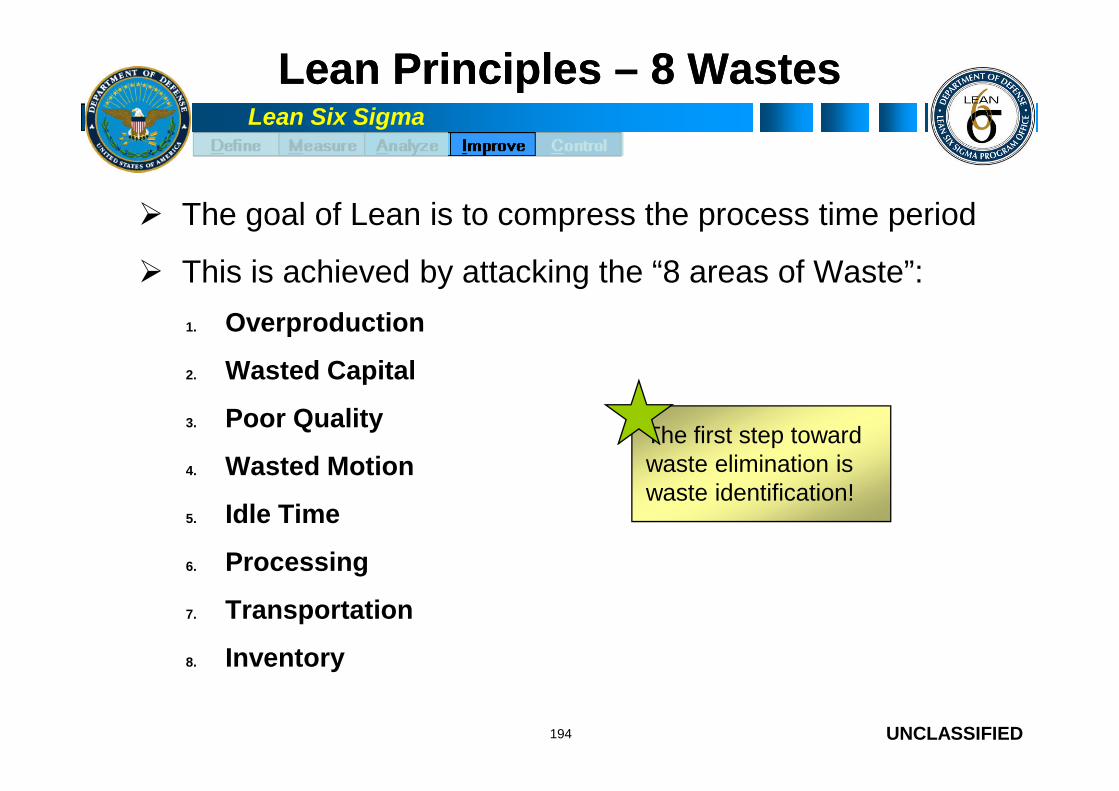
Lean Six Sigma
LeanLean PrinciplesPrinciples –– 8 Wastes8 Wastes
The goal of Lean is to compress the process time period
This is achieved by attacking the “8 areas of Waste”:
1. Overproduction
2. Wasted Capital
UNCLASSIFIED
3. Poor Quality
4. Wasted Motion
5. Idle Time
6. Processing
7. Transportation
8. Inventory
194
The first step towardwaste elimination iswaste identification!

Lean Six Sigma
Rework/CorrectionRework/Correction
Correcting or repairing a defect in materials or parts addsunnecessary costs because of additional equipment and laborexpenses
Example:
The labor costs associated with scheduling employees to work
UNCLASSIFIED
The labor costs associated with scheduling employees to workovertime to re-work defects
195
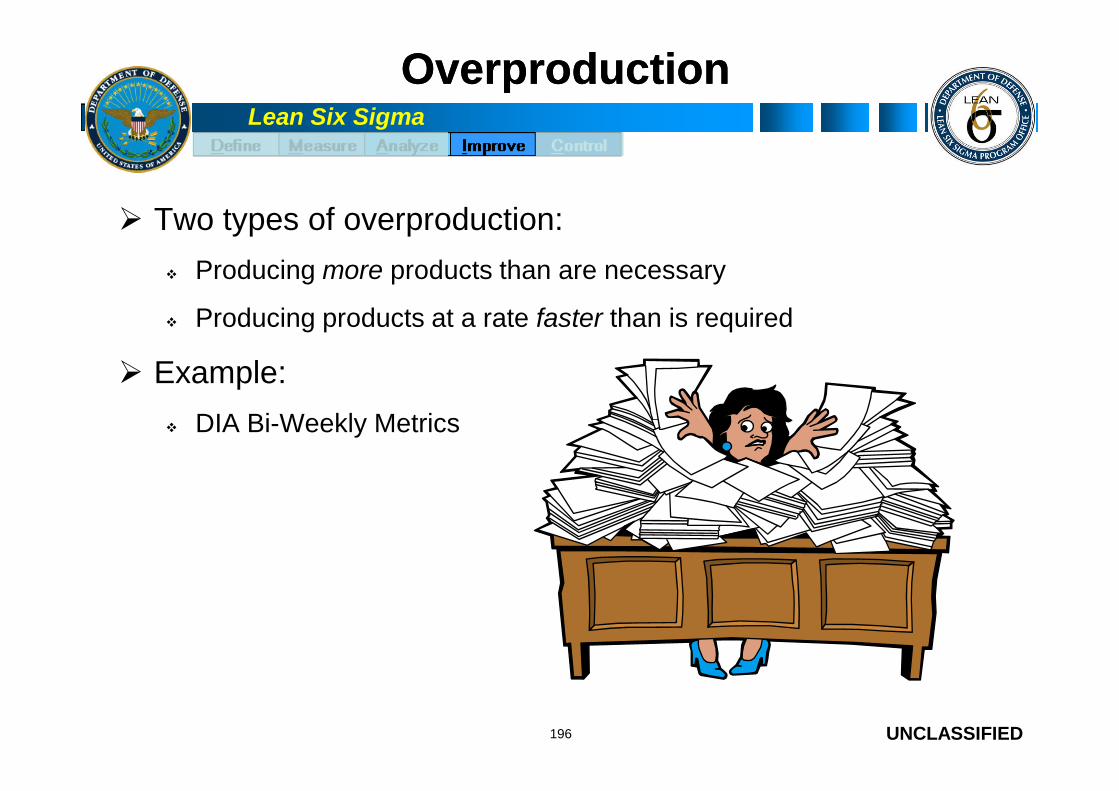
Lean Six Sigma
OverproductionOverproduction
Two types of overproduction:
Producing more products than are necessary
Producing products at a rate faster than is required
Example:
UNCLASSIFIED
DIA Bi-Weekly Metrics
196
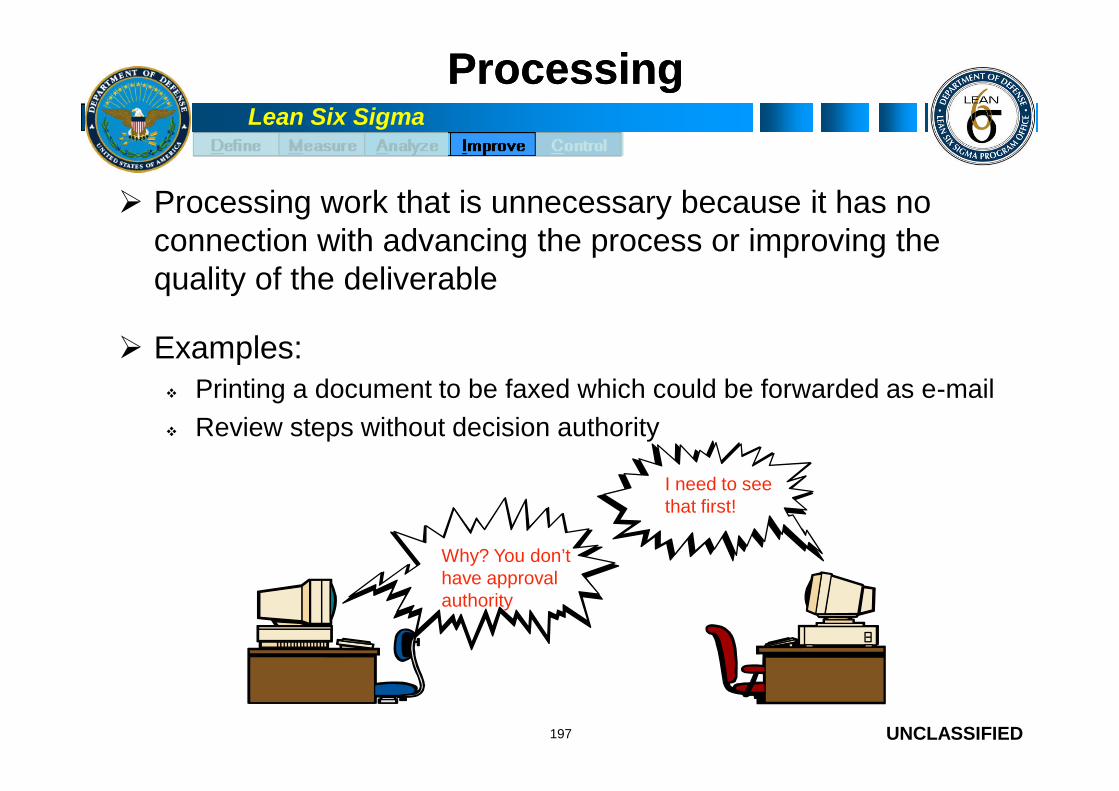
Lean Six Sigma
ProcessingProcessing
Processing work that is unnecessary because it has noconnection with advancing the process or improving thequality of the deliverable
Examples: Printing a document to be faxed which could be forwarded as e-mail
UNCLASSIFIED
Printing a document to be faxed which could be forwarded as e-mail
Review steps without decision authority
197
I need to seethat first!
Why? You don’thave approvalauthority

Lean Six Sigma
Conveyance/TransportationConveyance/Transportation
Conveyance does not directly contribute added value to aproduct. It is an incidental required action.
It is vital to avoid conveyance unless it is supplying itemswhen and where they are needed (JIT)
UNCLASSIFIED
Example:
Stove pipes between collection and analysis (collectors – analysts-warfighters)
198
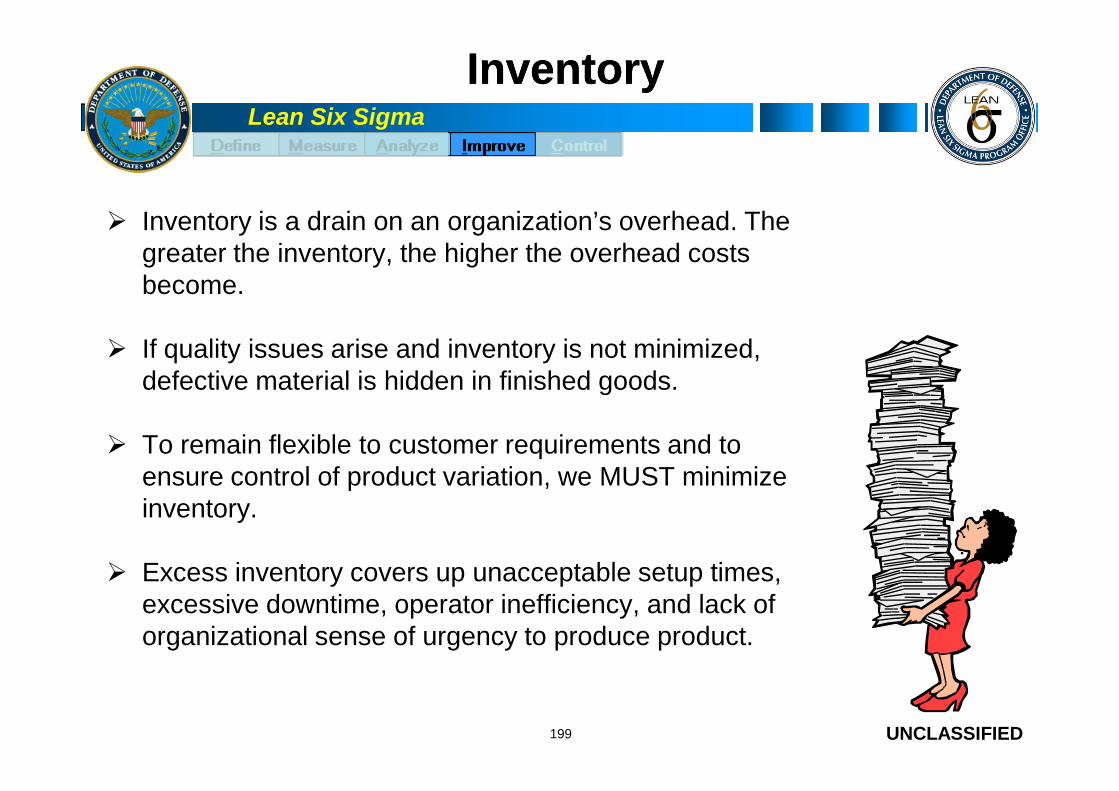
Lean Six Sigma
InventoryInventory
Inventory is a drain on an organization’s overhead. Thegreater the inventory, the higher the overhead costsbecome.
If quality issues arise and inventory is not minimized,defective material is hidden in finished goods.
UNCLASSIFIED
defective material is hidden in finished goods.
To remain flexible to customer requirements and toensure control of product variation, we MUST minimizeinventory.
Excess inventory covers up unacceptable setup times,excessive downtime, operator inefficiency, and lack oforganizational sense of urgency to produce product.
199

Lean Six Sigma
MotionMotion
Movement of people or machinery that does NOTcontribute added value to the product
Examples: Centralized printer/fax locations
UNCLASSIFIED
Centralized printer/fax locations
Excessive walking distance between operations
Key office personnel scattered around various locations
200

Lean Six Sigma
WaitingWaiting
Idle time between operations or events
Examples: An operator waiting for a machine to finish cycling
A machine waiting for an operator to load new parts
Dead time in the engineering development cycle
UNCLASSIFIED
Dead time in the engineering development cycle
LSAs waiting for trouble tickets to come in
201

Lean Six Sigma
Unnecessary Capital InvestmentUnnecessary Capital Investment
Investment in plant, equipment, and systems withoutjustification of need or ability to deliver
Examples:
Building a warehouse to store extra inventory
UNCLASSIFIED
Developing computer applications for dysfunctional manualprocesses without fixing it first
202

Lean Six Sigma
EverydayEveryday MistakeMistake--ProofingProofing
Home
Automated shutoffs on electriccoffee pots
Ground fault circuit breakers forbathroom inside or outsideelectric circuits
Pilotless gas ranges and hot
Office
Spell check in word processingsoftware
A “Do you want to delete?”message after you press the“Delete” button on yourcomputer
UNCLASSIFIED
Pilotless gas ranges and hotwater heaters
Child-proof caps on medications
Butane lighters with a safetybutton
Factory
Dual palm buttons and otherguards on machinery
Automobile
Seat belts
Air bags
Car engine warning lights
Retail
Tamper-proof packaging
203

Lean Six Sigma
MistakeMistake--ProofingProofing
Forgetfulness (not concentrating)
Errors due to misunderstanding (jumping to conclusions)
Errors in identification (viewing incorrectly- too far away)
Errors made by untrained workers
Willful errors (ignoring rules)
Inadvertent errors (distraction, fatigue)
UNCLASSIFIED
Inadvertent errors (distraction, fatigue)
Errors due to slowness (delay in judgment)
Errors due to lack of standards (written and visual)
Surprise errors (equipment malfunctions)
Intentional errors (sabotage- least common)
Errors due to fatigue
204
Poor Communicationis the #1 cause ofmistakes
Lean Six Sigma
MistakeMistake--Proofing MethodsProofing Methods
Performance Step Techniques Require “monitoring” the process to insure the proper steps are
followed, and triggering an outcome if the step is not performedcorrectly.
Examples:
UNCLASSIFIED
o eZHR Appraisal System
o Online expense reporting systems
205

Lean Six Sigma
MistakeMistake--Proofing MethodsProofing Methods
“Make it easy to do it right” True process mistake-proofing techniques are hard to put in place
due to cost or effort associated
In such cases, mistake-proofing “aids” can be used to “make it easyto do it right”
These techniques are not truly 100% mistake-proofing but they can
UNCLASSIFIED
prevent mistakes from occurring
Examples include:
o Color coding
Tire wear stripe
o Shapes
Different shaped electrical plugs for different voltages
Tool shapes on a tool board
o Operator-initiated “auto-detection” systems
Sheet scanners for density and/or register with triggers
Control charts for inputs and outputs206

Lean Six Sigma
MistakeMistake--ProofingProofing
What kinds of mistake-proofing do you see here?
UNCLASSIFIED207

Lean Six Sigma
Transactional MistakeTransactional Mistake--ProofingProofing
Other Tools Checklists
Forms
Posted SOPs and/or schematics
Simplified workflow
UNCLASSIFIED
Keep them simple and short (1 page) or they will not beused
Simplified workflow is always a more desired state
A picture is worth a thousand words
208

Lean Six Sigma
Regulatory FunctionRegulatory Function
RegulatoryFunction
Description
Warnings Signals mistake but allows process to continue.
GaggingSystem shuts down.
Some resetting action required to correct the mistake.
Co
ntr
olM
eth
od
s
UNCLASSIFIED
Non-responseAction leads to no response.
The process does not crash nor does it proceed.
Self-correctProcess stops.
System proposes correction to mistake.
Let’s talk about itProcess seeks information about what was reallyintended.
Teach meProcess associates correct outcomes with incorrectactions.
Co
ntr
olM
eth
od
s

Lean Six Sigma
PokaPoka Yoke: Preventing ErrorsYoke: Preventing Errors
“Hard” mistake-proofing:Designing processesand tasks to ensureerror-free execution Anticipating errors to make
processes “fail-safe”
Allows for preventive actions to
UNCLASSIFIED
Allows for preventive actions tobe part of process design
Initiating individualaccountability to ensure qualitywork before handing off toanother step in the process
“Soft” mistake-proofing:Creating alarm signalsto catch defects as theyoccur and warn people

Lean Six Sigma
Fail SafeFail Safe
Level 0 (No Control): Acceptance, Inspection
Level 1 (Mitigation): Minimize Damage
Build into Inspection: for example
o Double signals (sound and visual)
o Cross footing in financial forms
Level 2 (Detection): Feedback and Control
Feedback shouldbe immediate!
UNCLASSIFIED
Build into Process
o Checks etc.
o Posting Sequence
Level 3 (Avoidance):
– Build into Design
Wrong part or orientation, No fit
Forms design
Level 4 (Replacement):
– Automation or Elimination
Lean Six Sigma
MistakeMistake--Proofing AgendaProofing Agenda
The relationship between errors and defects
Types of errors
Mistake-proofing: using knowledge and ingenuityto create devices that allow you to do your job100% defect/error free 100% of the time
UNCLASSIFIED
Types of errors
The arguments for mistake-proofing
Mistake-proofing versus inspection
Mistake-proofing concepts
Mistake-proofing techniques or devices
Exercise
212
Lean Six Sigma
MistakeMistake--Proofing MethodsProofing Methods
There are an infinite number of methods to mistake-proof a processincluding:
Performance Step Techniques
Fixed-value Techniques
“Make it easy to do it right” Techniques
UNCLASSIFIED
Be creative and imaginative!
213
Lean Six Sigma
MistakeMistake--Proofing MethodsProofing Methods
Fixed-value Techniques Involve setting conditions for a process step (input) and counting to
that value
Triggers can occur when the count is not achieved (over or under) orthe trigger can’t occur unless or until the count is achieved
UNCLASSIFIED
Examples:
o Paying for a fixed amount of gasoline before pumping
o Debit cards
214
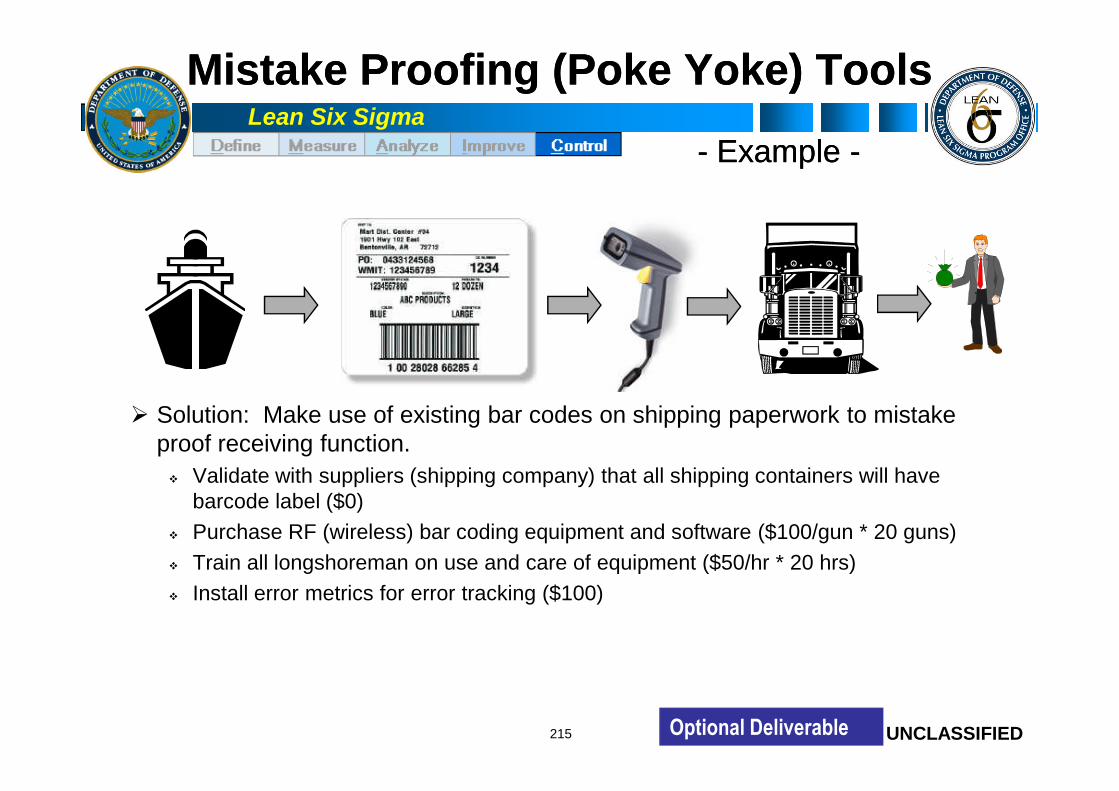
Lean Six Sigma
Mistake Proofing (Poke Yoke) ToolsMistake Proofing (Poke Yoke) Tools
-- ExampleExample --
UNCLASSIFIED
Solution: Make use of existing bar codes on shipping paperwork to mistakeproof receiving function.
Validate with suppliers (shipping company) that all shipping containers will havebarcode label ($0)
Purchase RF (wireless) bar coding equipment and software ($100/gun * 20 guns)
Train all longshoreman on use and care of equipment ($50/hr * 20 hrs)
Install error metrics for error tracking ($100)
215 Optional Deliverable
Lean Six Sigma
The Goal VideoThe Goal Video
“The Goal” Video
The Lean concepts of Flow and Pull workclosely with the 5 Focusing steps of TOC
UNCLASSIFIED216
45 minutes
Lean Six Sigma
From the video, how did they identify theconstraint?
Knowledge CheckKnowledge Check
UNCLASSIFIED

Lean Six Sigma
From the video, how did they subordinateto the constraint?
Knowledge CheckKnowledge Check
UNCLASSIFIED

Lean Six Sigma
SubordinateSubordinate the Constraintthe Constraint
Standard work
Workplace (inside the constraint) layout Spaghetti diagrams
Subordinate the Constraint with Lean Tools:
UNCLASSIFIED
Circle diagrams
Just in Time
Heijunka – Workload balancing
Kanban – Signals to move work
219
We can execute these changes throughProjects and/or RIEs!
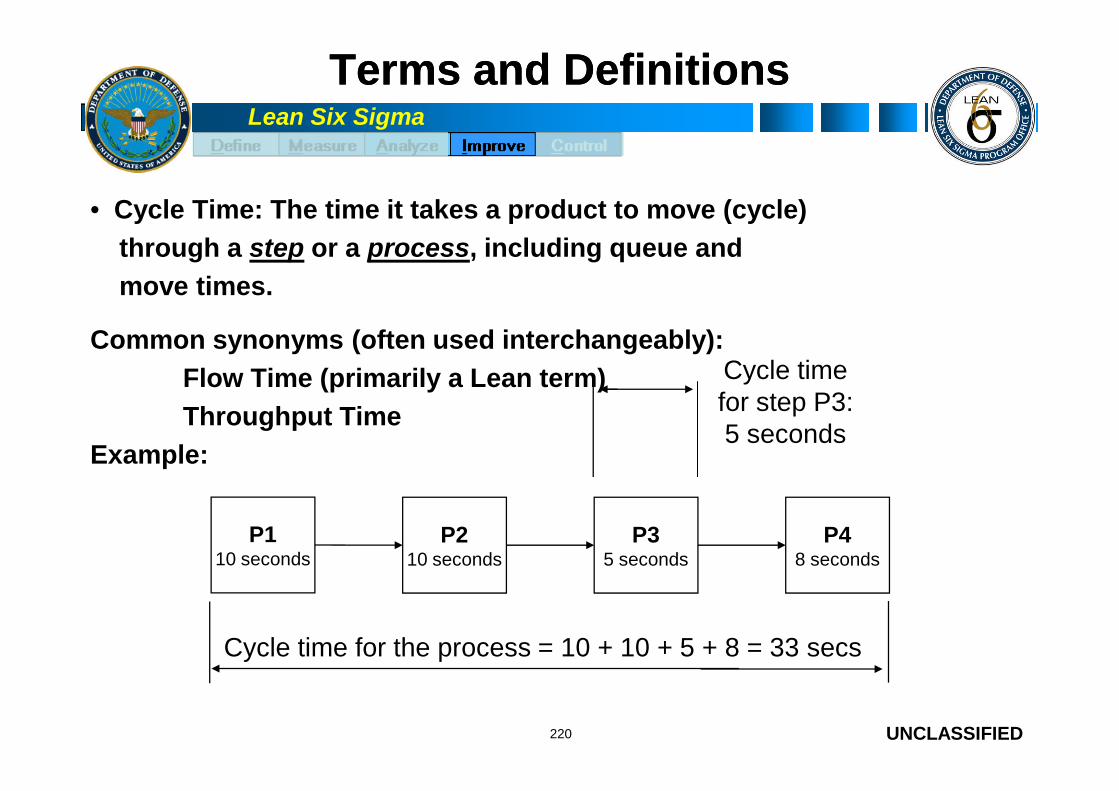
Lean Six Sigma
Terms and DefinitionsTerms and Definitions
• Cycle Time: The time it takes a product to move (cycle)
through a step or a process, including queue and
move times.
Common synonyms (often used interchangeably):
Flow Time (primarily a Lean term) Cycle timefor step P3:
UNCLASSIFIED220
Throughput Time
Example:
for step P3:5 seconds
P110 seconds
P210 seconds
P35 seconds
P48 seconds
Cycle time for the process = 10 + 10 + 5 + 8 = 33 secs

Lean Six Sigma
Terms and DefinitionsTerms and Definitions
Cycle time for a process may be approximated usingLittle’s Law:
Exit Rate
Work in Process (WIP)PCT =
UNCLASSIFIED221
WIP is the “number of things in process” at any giventime
EXIT RATE is the amount of work completed over agiven period of time, which should also equal customerdemand (“completions per hour”).

Lean Six Sigma
Terms and DefinitionsTerms and Definitions
• …and then think about them in July…
Cycle Time =
Cycle Time =
WIP
Exit Rate=
5 people
1 person/minute
5 minutes
Think about the lines at Busch Gardens in March…
UNCLASSIFIED222
• …and then think about them in July…
Cycle Time =
Cycle Time =
WIP
Exit Rate=
13 minutes
…Conclusion: Fixed Capacity (Exit Rate) + IncreasedPeople (WIP) = Slower Cycle Times!
13 people
1 person/min.
Lean Six Sigma
Terms and DefinitionsTerms and Definitions
Takt Time: The rate at which a product or service needs tobe provided to meet customer demand
Time available for work in the given time period
Customer demand for a given time period
UNCLASSIFIED
Process Sequence: The steps necessary to produce aproduct or service, with some process steps beingdependent upon other steps being performed first
Lead Time: The total time from customer order to deliveryof the desired product or service
Pitch: Customer configured delivery requirement based onTakt Time (Takt time x batch quantity)
223
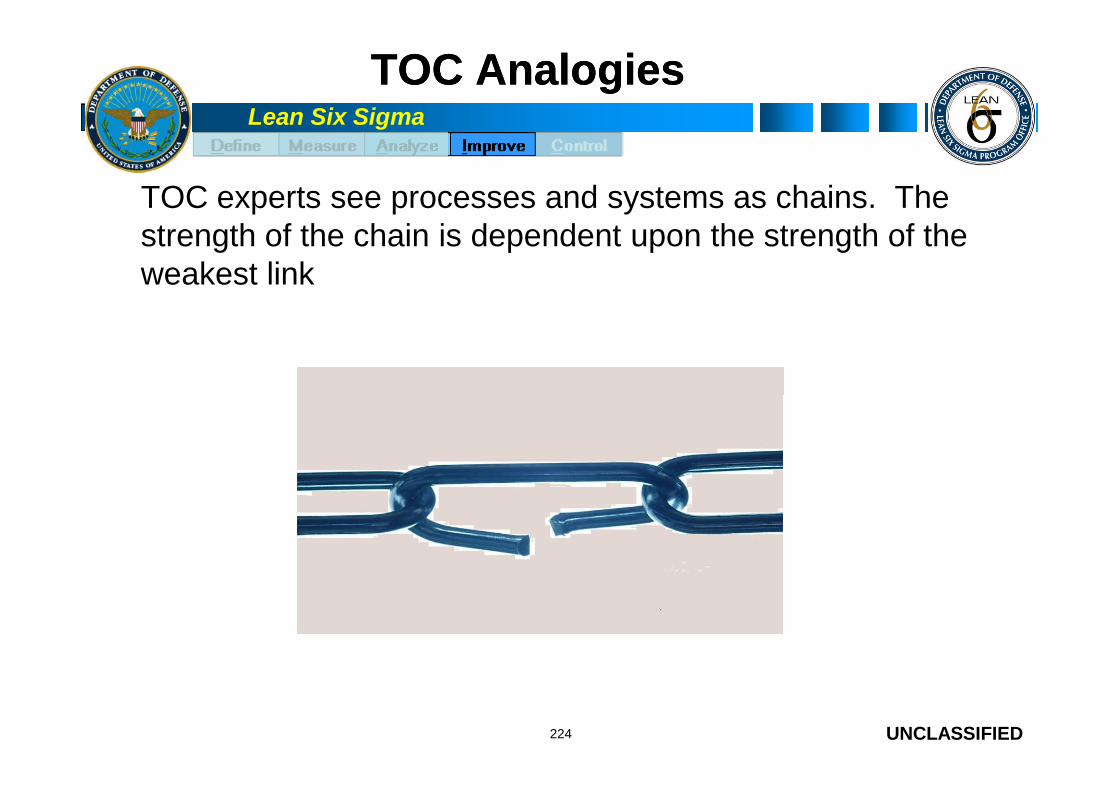
Lean Six Sigma
TOC AnalogiesTOC Analogies
TOC experts see processes and systems as chains. Thestrength of the chain is dependent upon the strength of theweakest link
UNCLASSIFIED224
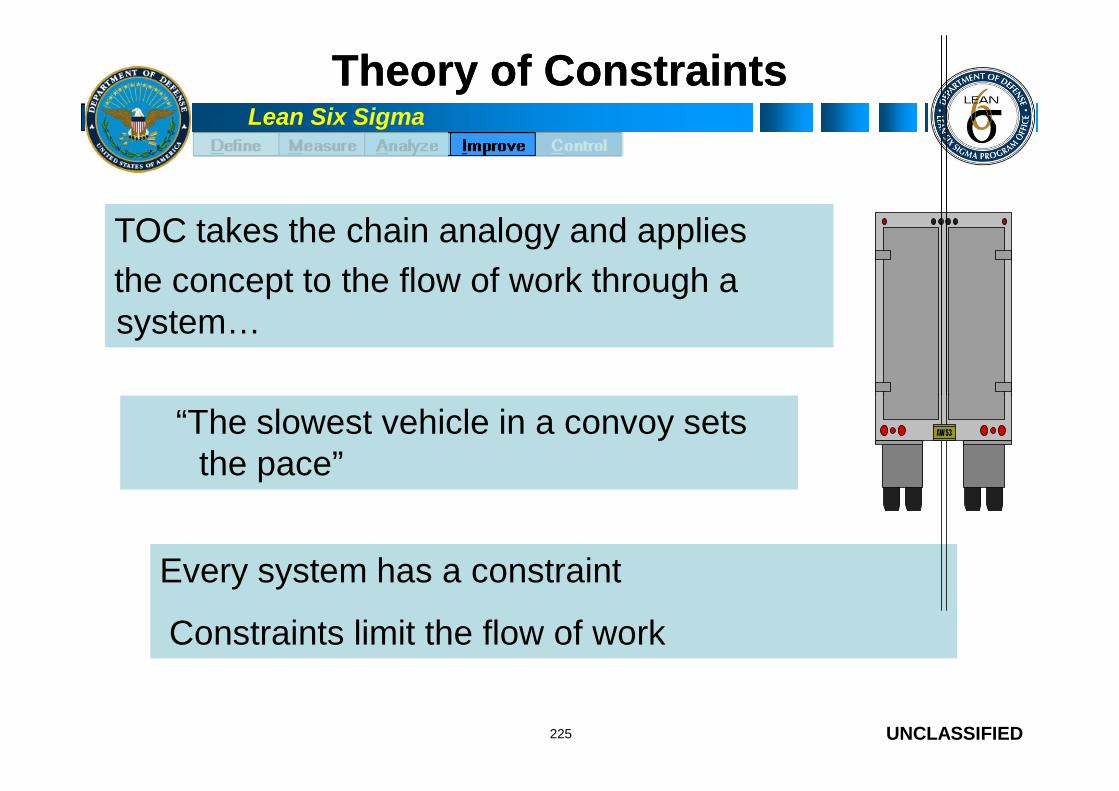
Lean Six Sigma
Theory of ConstraintsTheory of Constraints
TOC takes the chain analogy and applies
the concept to the flow of work through asystem…
UNCLASSIFIED225
“The slowest vehicle in a convoy setsthe pace”
Every system has a constraint
Constraints limit the flow of work
Lean Six Sigma
What is a ConstraintWhat is a Constraint??
Every process has a constraint – a step in theprocess that takes longer to do than other steps
Constraint mitigation is necessary when youcan not meet customer demand
UNCLASSIFIED
can not meet customer demand
226

Lean Six Sigma
The 5 Focusing StepsThe 5 Focusing Steps
1. Identify the constraint
2. Exploit the constraint
3. Subordinate to the constraint
4. Elevate the constraint
5. Re-evaluate, go back to step 1
UNCLASSIFIED
5. Re-evaluate, go back to step 1
227
What phase of DMAIC has us do step 1?What tools do we use for step 1?
How do we use Lean tools to make the constraint as efficient aspossible with little money spent?
Your efforts at steps 2 & 3 may not require you to do step 4
If the process doesn’t meet customer demand after Step 2, how do we subordinateto the constraint?

Lean Six Sigma
WhenWhen we don’twe don’t SubordinateSubordinate
1 2 3 41 2 3 4 5
Picture your value stream as an assembly line.
UNCLASSIFIED228
Lucy Video

Lean Six Sigma
The 5 Focusing StepsThe 5 Focusing Steps
1. Identify the constraint
2. Exploit the constraint
3. Subordinate to the constraint
4. Elevate the constraint
5. Re-evaluate, go back to step 1
After doing steps 2 & 3,check to see if we movedthe constraint. If so, goback to step 1
UNCLASSIFIED
5. Re-evaluate, go back to step 1
229
Elevating the constraint usually requires time and resources.This is primarily Black Belt territory

Lean Six Sigma
DrumDrum--BufferBuffer--RopeRope
Drum – The pace at which the system is operating
Buffer – A way to protect the constraint from being“starved”, to ensure the constraint always has work
UNCLASSIFIED
Rope – the signaling system that allows work to be put intothe system at the appropriate time to support efficient useof the constraint
230
The aim is to protect the constraint, and therefore thesystem as a whole, against process variation.

Lean Six Sigma
JustJust--inin--TimeTime
Don’t produce something unless the customer hasordered it.
Level demand so that work may proceed smoothlythroughout the workspace.
UNCLASSIFIED
throughout the workspace.
Link all processes to customer demand throughsimple visual tools (Kanbans).
Maximize resource flexibility.
231

Lean Six Sigma
Elements of a JIT SystemElements of a JIT System
Heijunka – Workload balancing
Kanban – system of visual tools thatsynchronize and provide instruction tosuppliers and customers
UNCLASSIFIED
suppliers and customers
232
Both Heijunka and Kanban in turn depend on: Quick changeovers Visual Management Capable processes, including methods, workers, and
machines

Lean Six Sigma
HeijunkaHeijunka (Hi(Hi--junkjunk--a)a)
Even distribution of work to meet takt time,especially for different products from the sameprocess Determine pitch for each product
Create a production sequence
UNCLASSIFIED
Create a production sequence table
A heijunka box is the schedule of work thatincludes what things arrive when and whenthey should be done
233

Lean Six Sigma
Workload BalancingWorkload Balancing -- TaktTakt ChartChart
70 sec
45 sec
30 sec 30 sec 35 sec
Takt Time = 65 Seconds
CycleTime
Chart existing operator cycle times
UNCLASSIFIED234
B
30 sec
CA
30 sec
D
35 sec
EOperator
Time
Can we reduce the cycle time of Operator Aas well as reduce manning?
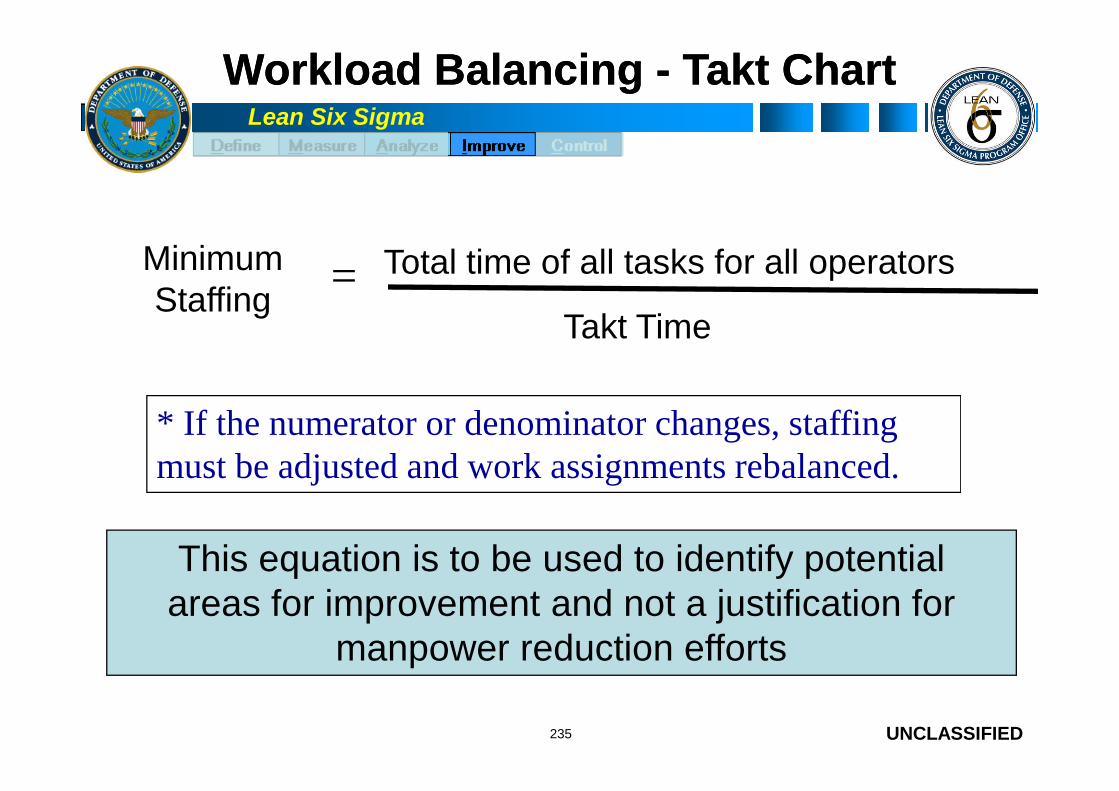
Lean Six Sigma
Workload BalancingWorkload Balancing -- TaktTakt ChartChart
Total time of all tasks for all operatorsMinimumStaffing
=Takt Time
UNCLASSIFIED235
* If the numerator or denominator changes, staffingmust be adjusted and work assignments rebalanced.
This equation is to be used to identify potentialareas for improvement and not a justification for
manpower reduction efforts

Lean Six Sigma
Workload BalancingWorkload Balancing -- TaktTakt ChartChart
Balance Work between operators
Where’s operator E?
57 sec 57 sec39 sec
57 sec
Takt Time = 65 Seconds
CycleTime
UNCLASSIFIED236
B
Where’s operator E?
Available forredeployment!
A C D
By workload balancing we can free up personnel
Lean Six Sigma
TaktTakt ChartsCharts
A tool to see how the process is performing againstthe customer expectations
Data for takt charts are drawn from the data blocksof the Value Stream Map, and from customer
UNCLASSIFIED
of the Value Stream Map, and from customerdemand
Plot the steps on the horizontal axis using time asyour vertical axis
237

Lean Six Sigma
TaktTakt ChartsCharts
Takt Time = 65 Seconds
CycleTime
UNCLASSIFIED238
“Operator A” is a constraint because they cannot meetthe Takt Time.
B CA D EOperators
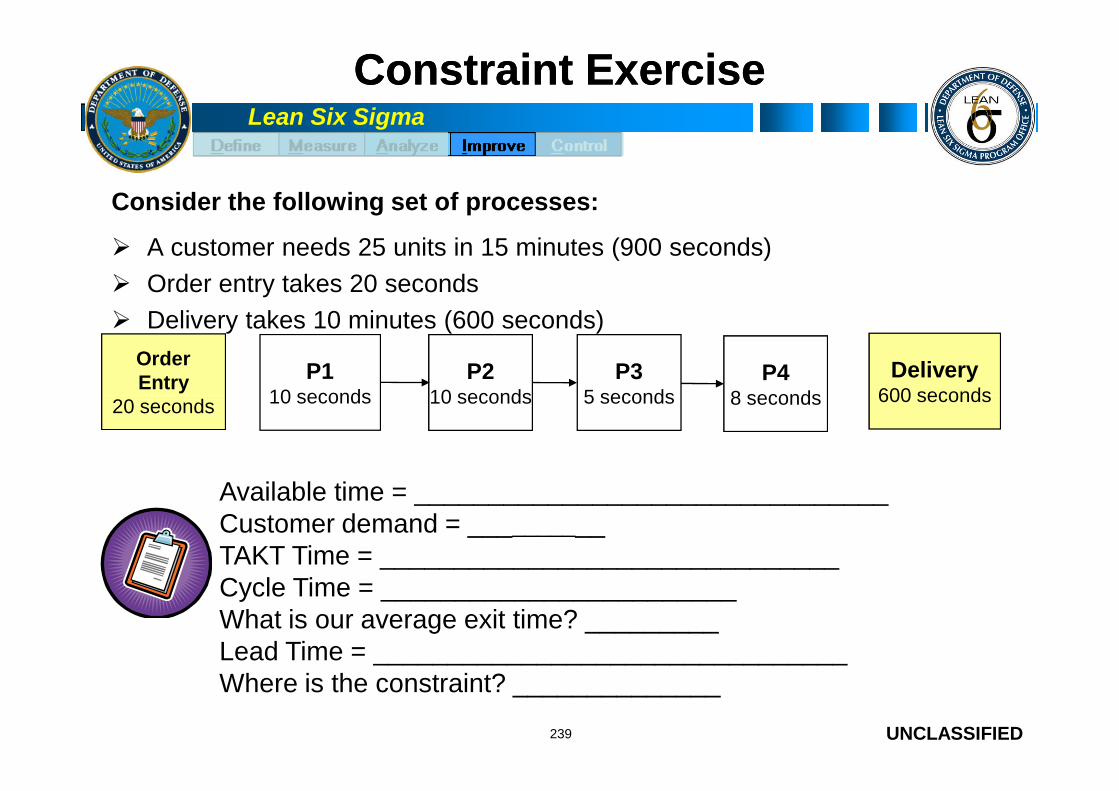
Lean Six Sigma
Constraint ExerciseConstraint Exercise
Consider the following set of processes:
A customer needs 25 units in 15 minutes (900 seconds)
Order entry takes 20 seconds
Delivery takes 10 minutes (600 seconds)
P110 seconds
P210 seconds
P35 seconds
P48 seconds
OrderEntry
20 seconds
Delivery600 seconds
UNCLASSIFIED239
10 seconds 10 seconds 5 seconds 8 seconds
Available time = ________________________________Customer demand = __________TAKT Time = _______________________________Cycle Time = ________________________What is our average exit time? _________Lead Time = ________________________________Where is the constraint? ______________
20 seconds600 seconds

Lean Six Sigma
IT’S A LIE!IT’S A LIE!
Variation happens!
P110 ± 1
seconds
P210 ± 3
seconds
P35 ± 2
seconds
P48 ± 6
seconds
5 min
UNCLASSIFIED240
Cycle Time = _________________
Where is the constraint? _________
Average Exit Time = ________________________
seconds seconds seconds
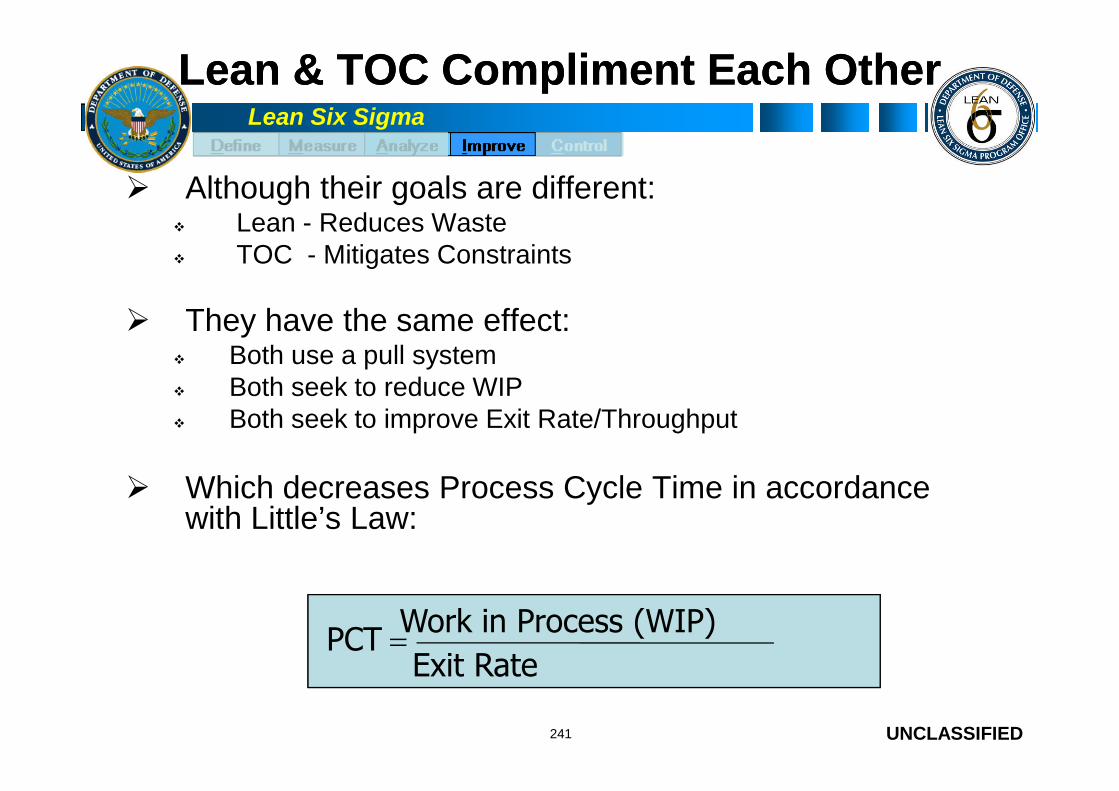
Lean Six Sigma
Lean &Lean & TOC Compliment EachTOC Compliment Each OtherOther
Although their goals are different: Lean - Reduces Waste TOC - Mitigates Constraints
They have the same effect: Both use a pull system Both seek to reduce WIP
UNCLASSIFIED
Both seek to reduce WIP Both seek to improve Exit Rate/Throughput
Which decreases Process Cycle Time in accordancewith Little’s Law:
241
Exit Rate
Work in Process (WIP)PCT =
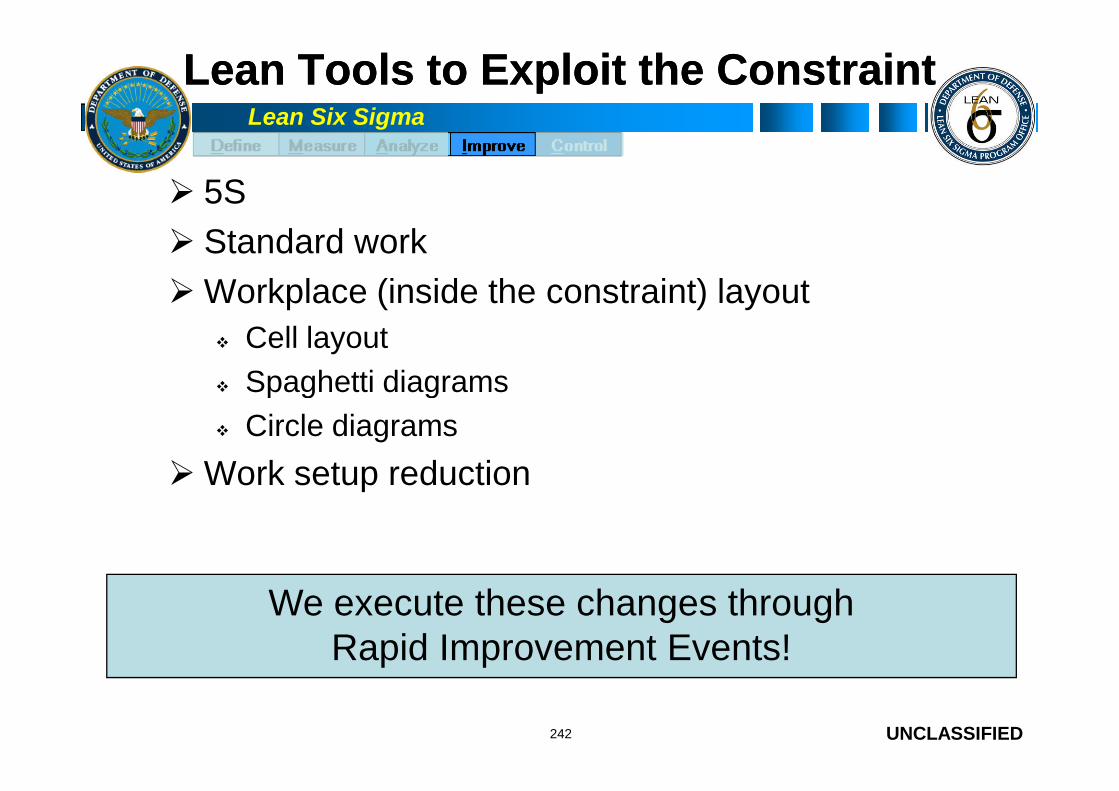
Lean Six Sigma
Lean Tools to Exploit the ConstraintLean Tools to Exploit the Constraint
5S
Standard work
Workplace (inside the constraint) layout
Cell layout
Spaghetti diagrams
UNCLASSIFIED
Spaghetti diagrams
Circle diagrams
Work setup reduction
242
We execute these changes throughRapid Improvement Events!

Lean Six Sigma
MoreMore PerformancePerformance StrategiesStrategies
Process layout for shortened lead times (cellmanufacturing) Sequential processing machines laid out in a “multi-process
holding line” - often U-shaped Multi-function workers process units through multiple operations
(v. multiple single function “departments”)Tends to increase productivity, decreases WIP, balances
UNCLASSIFIED
Tends to increase productivity, decreases WIP, balancesproduction, reduces conveyance
Autonomous defects control Machines stop automatically when process is out of spec Prevents mass production of defects
243
Source: Toyota Production System, Yasuhiro Monden, Engineering and Management Press, 1998

Lean Six Sigma
What We Have CoveredWhat We Have Covered
Applying the TOC five focusing steps to improvingprocess flow
Understanding how the Lean thinking concepts of flowand pull work within the framework of TOC
Demonstrating, using the appropriate tools and
UNCLASSIFIED
Demonstrating, using the appropriate tools andtechniques, how to improve process flow.
244
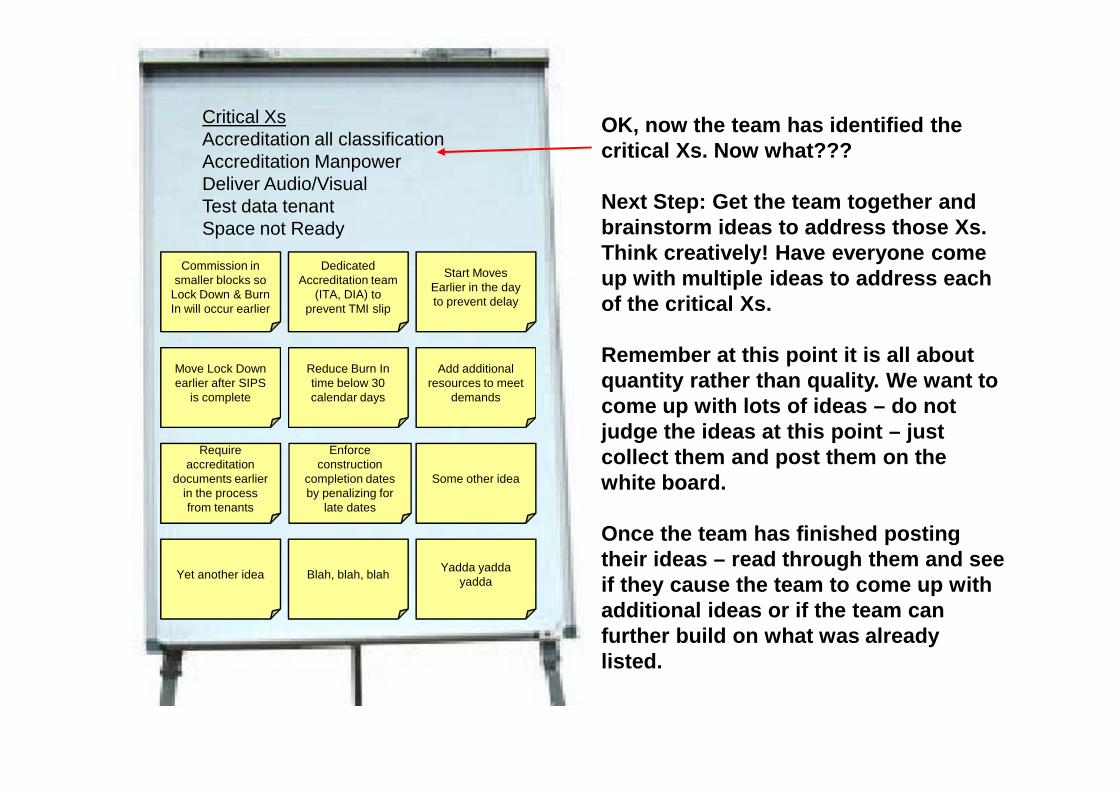
Commission insmaller blocks so
Lock Down & BurnIn will occur earlier
Move Lock Downearlier after SIPS
is complete
DedicatedAccreditation team
(ITA, DIA) toprevent TMI slip
Reduce Burn Intime below 30calendar days
Start MovesEarlier in the dayto prevent delay
Add additionalresources to meet
demands
OK, now the team has identified thecritical Xs. Now what???
Next Step: Get the team together andbrainstorm ideas to address those Xs.Think creatively! Have everyone comeup with multiple ideas to address eachof the critical Xs.
Remember at this point it is all aboutquantity rather than quality. We want tocome up with lots of ideas – do not
Critical XsAccreditation all classificationAccreditation ManpowerDeliver Audio/VisualTest data tenantSpace not Ready
Yet another idea
Enforceconstruction
completion datesby penalizing for
late dates
is complete
Blah, blah, blah
Requireaccreditation
documents earlierin the processfrom tenants
calendar days demands
Some other idea
Yadda yaddayadda
come up with lots of ideas – do notjudge the ideas at this point – justcollect them and post them on thewhite board.
Once the team has finished postingtheir ideas – read through them and seeif they cause the team to come up withadditional ideas or if the team canfurther build on what was alreadylisted.
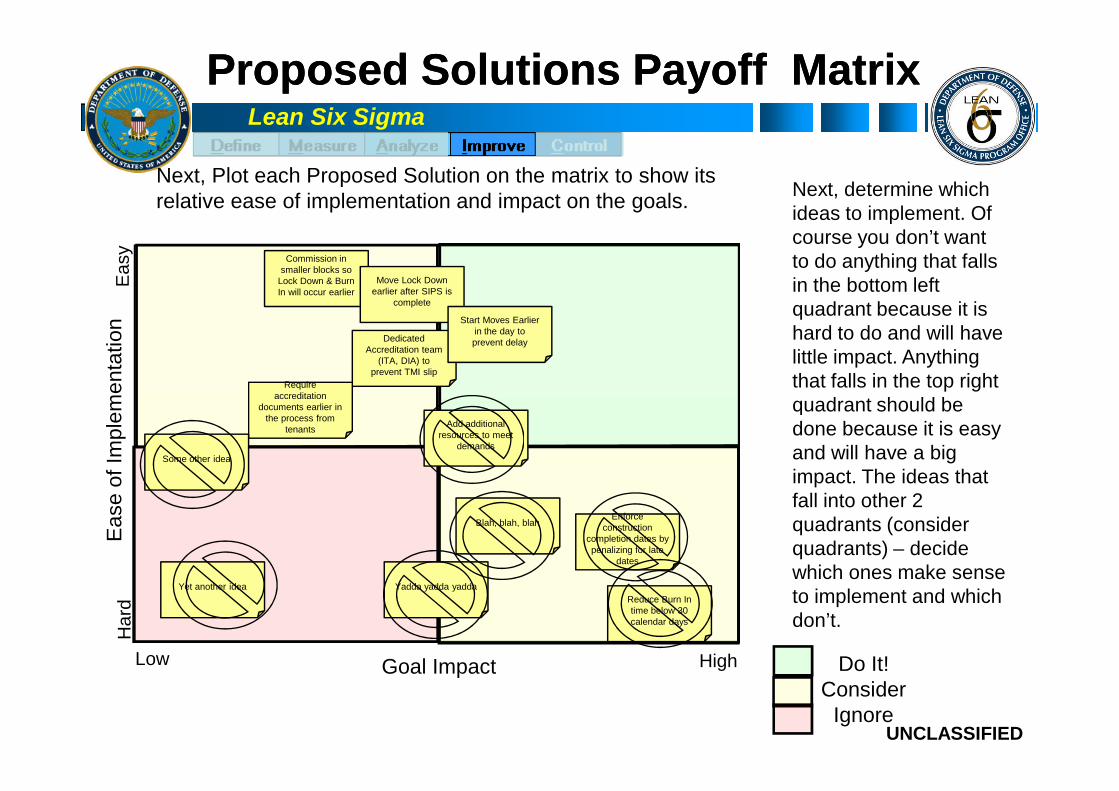
Lean Six Sigma
Next, Plot each Proposed Solution on the matrix to show itsrelative ease of implementation and impact on the goals.
Proposed Solutions Payoff MatrixProposed Solutions Payoff MatrixE
ase
of
Imp
lem
en
tatio
nE
asy
Commission insmaller blocks so
Lock Down & BurnIn will occur earlier
Move Lock Downearlier after SIPS is
complete
DedicatedAccreditation team
(ITA, DIA) toprevent TMI slip
Start Moves Earlierin the day toprevent delay
Requireaccreditation
Next, determine whichideas to implement. Ofcourse you don’t wantto do anything that fallsin the bottom leftquadrant because it ishard to do and will havelittle impact. Anythingthat falls in the top rightquadrant should be
UNCLASSIFIED
Low High
Hard
Goal Impact
Ea
se
of
Imp
lem
en
tatio
n
Do It!Consider
Ignore
Reduce Burn Intime below 30calendar days
Add additionalresources to meet
demands
Yet another idea
Enforceconstruction
completion dates bypenalizing for late
dates
Blah, blah, blah
accreditationdocuments earlier in
the process fromtenants
Some other idea
Yadda yadda yadda
quadrant should bedone because it is easyand will have a bigimpact. The ideas thatfall into other 2quadrants (considerquadrants) – decidewhich ones make senseto implement and whichdon’t.

Lean Six Sigma
Critical Xs to FixCritical Xs to Fix YsYs
Solutions →Critical Xs↓Accreditation allclassification X X X
Commission insmaller blocks so
Lock Down & BurnIn will occur earlier
Move Lock Downearlier after SIPS
is complete
DedicatedAccreditation team
(ITA, DIA) toprevent TMI slip
Requireaccreditation
documents earlierin the processfrom tenants
Start MovesEarlier in the dayto prevent delay
Next, use the matrix to determine which critical Xs the proposed solutions will“fix” by marking them with an “X”. Ensure that the critical Xs will be fixed by thesolutions that you selected.
UNCLASSIFIED
classification X X X
AccreditationManpower X X X
DeliverAudio/Visual X
Test data tenant X X
Space notReady X

Lean Six Sigma
SolutionSolution EvaluationEvaluation MatrixMatrix
-- ExampleExample --
UNCLASSIFIED248
A Solution Selection Matrix is a RequiredDeliverable
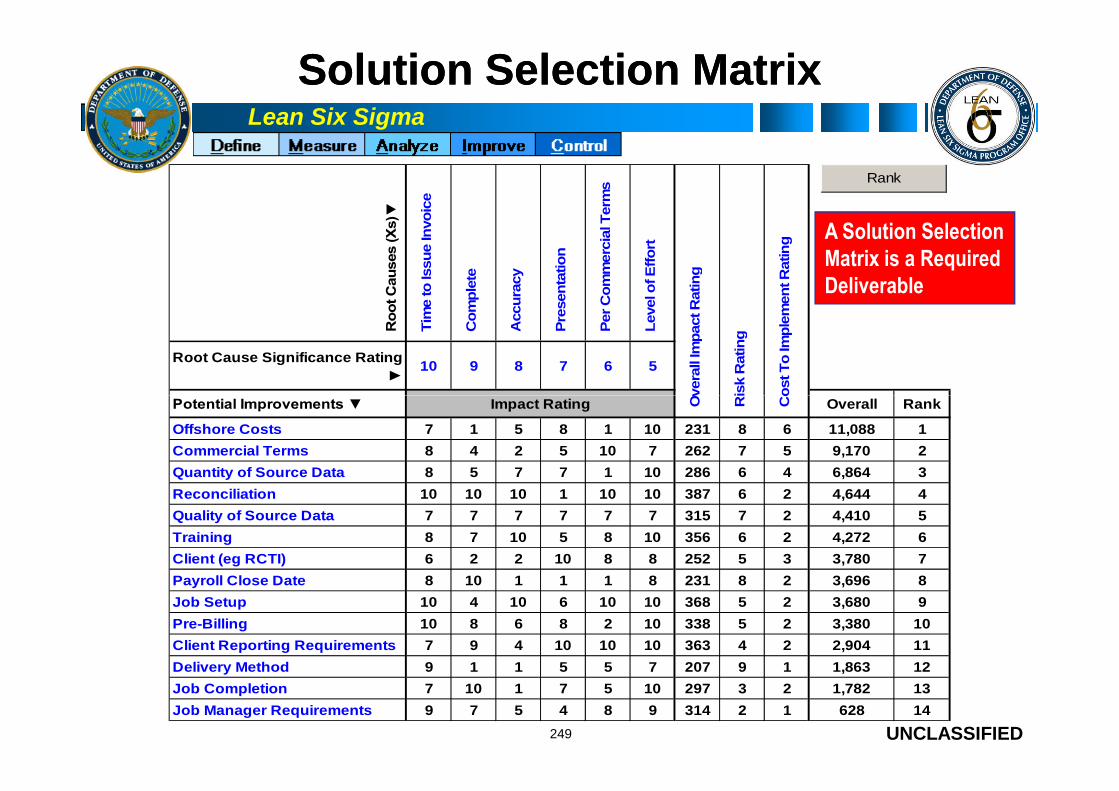
Lean Six Sigma
Solution Selection MatrixSolution Selection Matrix
R
oo
t C
au
ses (X
s)▼
Tim
eto
Issu
eIn
vo
ice
Co
mp
lete
Accu
racy
Pre
sen
tatio
n
Per
Co
mm
erc
ialT
erm
s
Levelo
fE
ffo
rt
Root Cause Significance Rating
► 10 9 8 7 6 5
Overa
llIm
pactR
atin
g
Ris
kR
atin
g
Co
stT
oIm
ple
men
tR
atin
g
Rank
A Solution SelectionMatrix is a RequiredDeliverable
UNCLASSIFIED249
Potential Improvements ▼ Impact Rating Overall Rank
Offshore Costs 7 1 5 8 1 10 231 8 6 11,088 1
Commercial Terms 8 4 2 5 10 7 262 7 5 9,170 2
Quantity of Source Data 8 5 7 7 1 10 286 6 4 6,864 3
Reconciliation 10 10 10 1 10 10 387 6 2 4,644 4
Quality of Source Data 7 7 7 7 7 7 315 7 2 4,410 5
Training 8 7 10 5 8 10 356 6 2 4,272 6
Client (eg RCTI) 6 2 2 10 8 8 252 5 3 3,780 7
Payroll Close Date 8 10 1 1 1 8 231 8 2 3,696 8
Job Setup 10 4 10 6 10 10 368 5 2 3,680 9
Pre-Billing 10 8 6 8 2 10 338 5 2 3,380 10
Client Reporting Requirements 7 9 4 10 10 10 363 4 2 2,904 11
Delivery Method 9 1 1 5 5 7 207 9 1 1,863 12
Job Completion 7 10 1 7 5 10 297 3 2 1,782 13
Job Manager Requirements 9 7 5 4 8 9 314 2 1 628 14O
vera
llIm
pactR
atin
g
Ris
kR
atin
g
Co
stT
oIm
ple
men
tR
atin
g

Lean Six Sigma
Pugh MatrixPugh Matrix
Enter customer CTQs for criteria. You can alsoinclude business criteria such as time to market,complexity, ability to patent, etc.
Criteria rating should be between 1 and 10. Use this toweight the criteria in terms of importance.
Rate each alternative concept as better (+), worse (-),or the same (S) as the baseline concept. Enter +,- or sin each cell for which a criteria and rating have been
An alternative ranking tool
CriteriaRating
(1-10)1 2 n
Criteria 1 8 - + +
Criteria 2 5 - + +
Criteria n 3 - - +
Sum of 0 2 3
UNCLASSIFIED250
in each cell for which a criteria and rating have beenlisted.
Note on entering + and - signs:Type in a + or - and then hit the Enter key.If you use an arrow key, or move to another cell andclick the mouse, Excel thinks you are entering aformula. If this happens, simple hit Enter and thenreturn to the cell and delete. Re-enter + or - and hit theEnter key.
Sum of 0 2 3
Sum of
Negatives3 1 0
Sum of Sames 0 0 0
Weighted Sum
of Positives0 13 16
Weighted Sum
of Negatives16 3 0
A Solution Selection Matrix is a RequiredDeliverable

OPERATION RATING RATING % Change
ID Process Step Potential Failure Mode Potential Failure Effect Potential Causes
SE
V
O
CC
DE
TRPN Current Controls to Monitor Recommendations/ Mitigation
Responsible
(Target Date)Action Taken
SE
V
O
CC
DE
TRPN
% Change
Decrease After
Mitigation
3 Fill out timecardEntered incorrect amount
of LEAPIncorrect count of LEAP for OPM
Employee unaware
of how LEAP Policy10 9 10 900 Supervisor Review
4 Fill out timecard Entered no LEAP Loss of LEAP
Employee didn't work
it or overlooked
column on timecard
10 6 10 600 Supervisor Review
10 Review Timecard Missed Errors Incorrect PayUnclear on LEAP
Policy10 6 10 600 none
9 Review Timecard Missed Errors Incorrect PayNo Workschedule to
validate against10 5 10 500 none
16 Enter data in DCPSNight Differential is
Incorrect PayTimecard reflect
10 7 5 350 none
TimecardCHARACTERISTICS OF FAILURE
Project Name Green BeltMs Shelley Verdejo
DateSponsor
What can the team do tomitigate the risk that wasidentified? (Your solutionsthat you identified shouldhelp mitigate risk)
Who is responsible for thisaction and when is itscheduled to becompleted? If possible, tryto not to have YOUR namefor everything – your teamis there to help!
Once the action iscompleted you candocument what wasdone here.
You should havecompleted the left half in
the Analyze Phase
FMEA
16 Enter data in DCPSNight Differential is
incorrectIncorrect Pay
Timecard reflect
properly10 7 5 350 none
6 Fill out timecard
Entered overtime that was
not approved per PFPA
regualtion
Timecard returned to employee for
corrections
Overtime work
schedule was not
properly filled out
5 5 10 250 Supervisor Review
11 Review Timecard Missed Errors Incorrect PayUnclear on Overtime
Policy5 5 10 250 none
15 Enter data in DCPSNight Differential is
incorrectIncorrect Pay
Timekeeper didn't
enter10 5 5 250 none
2 Fill out timecardEntered wrong pay period
#Data entered for wrong pay period
Employee not pay
attention10 2 10 200 Supervisor Review
1 Fill out timecardList wrong
directoriate/Divisionnone
Employee not aware
directoriate name
has changed
1 10 10 100 Supervisor Review
Will the solution(recommendation) decrease theseverity? Enter new severityhere. HINT: This one rarelychanges from before.Severity (SEV): How significantis the impact of the Effect to thecustomer (Internal or External)1= Least significant10= Most Significant
Will the solution(recommendation)decrease the likelihood ofthe problem occurring?Enter new OCC here.Occurrence (OCC): Howlikely is “Potential FailureMode” to occur because ofthis “Potential cause”?1=Not Likely; 10= VeryLikely
Will the solution(recommendation)increase the likelihood ofdetecting the problem?Enter new DET here.Detection (DET): Howlikely are you to detectthe “Potential FailureMode” if it occurs?1=Likely to Detect10=Not Likely to Detect
Remember - DONOT TYPE IN RPN
COLUMN! Youshould notice thatthe RPN decreasedfrom the previous
RPN.
DO NOT TYPE IN %CHANGE COLUMN!This will tell you the
anticipated %change decrease
after mitigation, i.e.after you put in the
solution.

Lean Six Sigma
Failure Mode EffectsFailure Mode Effects AnalysisAnalysis
Process Step /
Input
Potential Failure
Mode (X)
Potential Failure
Effects (Y)
Potential Root
CausesCurrent Controls
Actions
RecommendedResp. Actions Taken
What is theprocess step
and Inputunder
investigation?
In what ways doesthe Key Input go
wrong?
What is the impacton the Key Output
Variables (CustomerRequirements)?
What causes the KeyInput to go wrong?
What are the existingcontrols and procedures(inspection and test) thatprevent either the cause
or the Failure Mode?
What are theactions for reducingthe occurrence of
the cause, orimprovingdetection?
What are thecompleted actions
taken with therecalculated
RPN?
UpdatingTollgates
Ineffectivetemplates
Ineffective reviews 5Discrepancies: POI vs
Templates4 None 5 100
Adjust templates tomatch POI
PMO 5 2 2 20
Users and leadersdon't buy-in to LSS
Slide purposes notclear
4 None 4 80Adjust slide titles
and notesPMO 1 2 10
Redundant and NVAslides
3 None 4 60Eliminate NVA
slidesPMO 1 2 10
Incomplete SOP or Develop "read me"
S
EVER
ITY
OC
CURR
ENC
E
DETE
CTI
ON
RPN
S
EVER
ITY
OC
CURR
ENC
E
DETE
CTI
ON
R
PN
-- ExampleExample --
UNCLASSIFIED252
Incomplete SOP or"Help" within PS
3 None 5 75Develop "read me"
slidesPMO 1 2 10
UpdatingTollgates
Too many steps tobuild/update
Inefficient updating 3 NVA steps 5 None 4 60Link templates to
PS PhasePMO 3 3 2 18
Users get frustratedand delay projects
Too many choicesbetween templates
4 None 4 48Eliminate NVA;group in folders
PMO 2 2 12
Inconsistent filenames and locations
3 None 4 36Simple names;group in folders
PMO 1 2 6
LSS ToolAccess
Not all LSS tools &refs in PS
User cannot findtools & references
4Not all tools available
in PS5 None 4 80
Revise list of toolsand joggers
PMO 4 2 2 16
Project completion isdelayed
Poor explanation insome references
3 None 3 36Develop directaccess pdf file
PMO 2 2 16
LSS ToolAccess
Too many steps toretrieve tools
Inefficient retrieval ofLSS tools/refs
2Multiple means for
accessing tools3 None 5 30
"Read me" file; onefolder
PMO 2 2 2 8
NVA steps 3 None 5 30Eliminate NVA
stepsPMO 2 2 8
Required Deliverable

Lean Six Sigma
Simulation Round 2Simulation Round 2
Run Round 2 of the Simulation You may make 2 changes to the process
Spend 15 minutes deciding what two changes you want to make
Coordinate with Instructor - Instructor rules what equals a change
You cannot move the Customer or change the Customer’s roles inRound 2
UNCLASSIFIED
Round 2
Update the metrics for your simulation based upon Round 2
Create Takt charts for your process
253
60 minutes

Lean Six Sigma
Implementation PlanImplementation Plan
An organizational tool that allows a Black/Green Beltto lay out their thoughts, leading to an efficient flowof action
Compiling initial concept questions leads to both paralleland serial activities
UNCLASSIFIED
and serial activities
Include all necessary action items that can aid in thesuccess of the project
Graphically represent your approach in a manner thatothers can follow
254
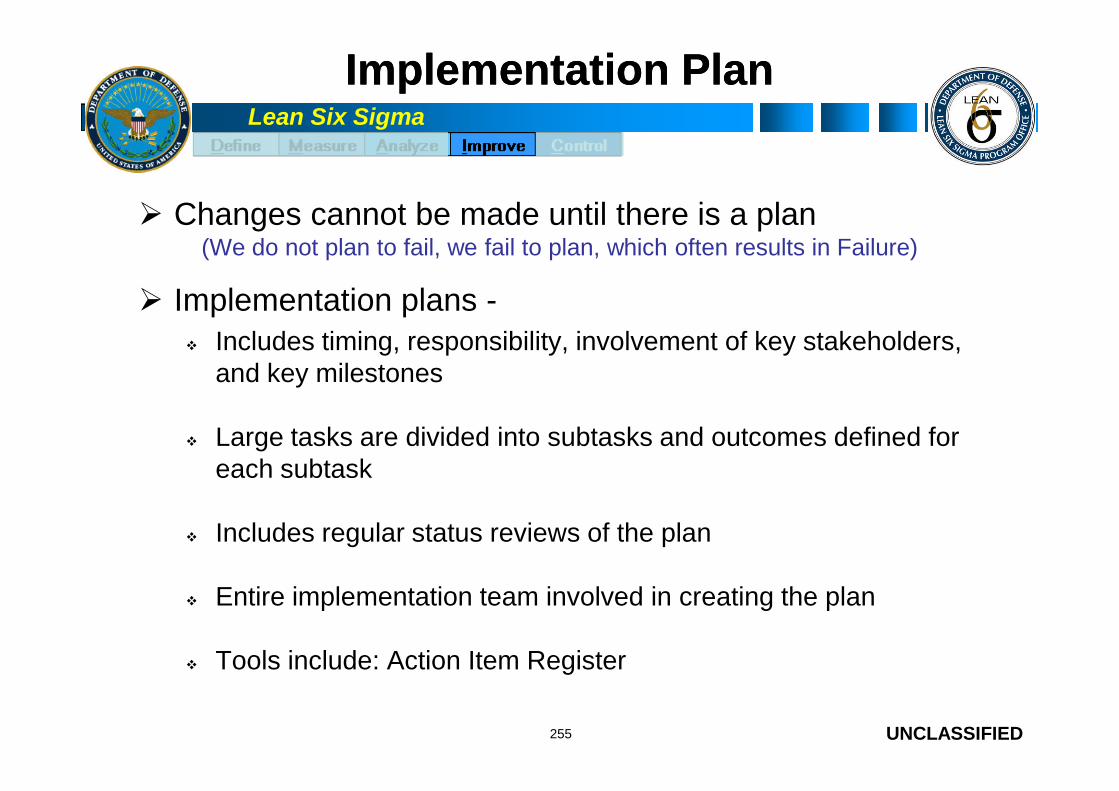
Lean Six Sigma
Implementation PlanImplementation Plan
Changes cannot be made until there is a plan(We do not plan to fail, we fail to plan, which often results in Failure)
Implementation plans - Includes timing, responsibility, involvement of key stakeholders,
and key milestones
UNCLASSIFIED
Large tasks are divided into subtasks and outcomes defined foreach subtask
Includes regular status reviews of the plan
Entire implementation team involved in creating the plan
Tools include: Action Item Register
255

Lean Six Sigma
Implementation PlanImplementation Plan
Responsibility, involvement, and key stakeholders
R = Responsible
o Change agent
o Drives process improvement via Lean Six Sigma
A = Approver
UNCLASSIFIED
A = Approver
Process owner
o Responsible for area impacted by project
C = Contributor
o Who should be consulted regarding changes in the process
I = Informed
o Who needs to be informed regarding process changes
256
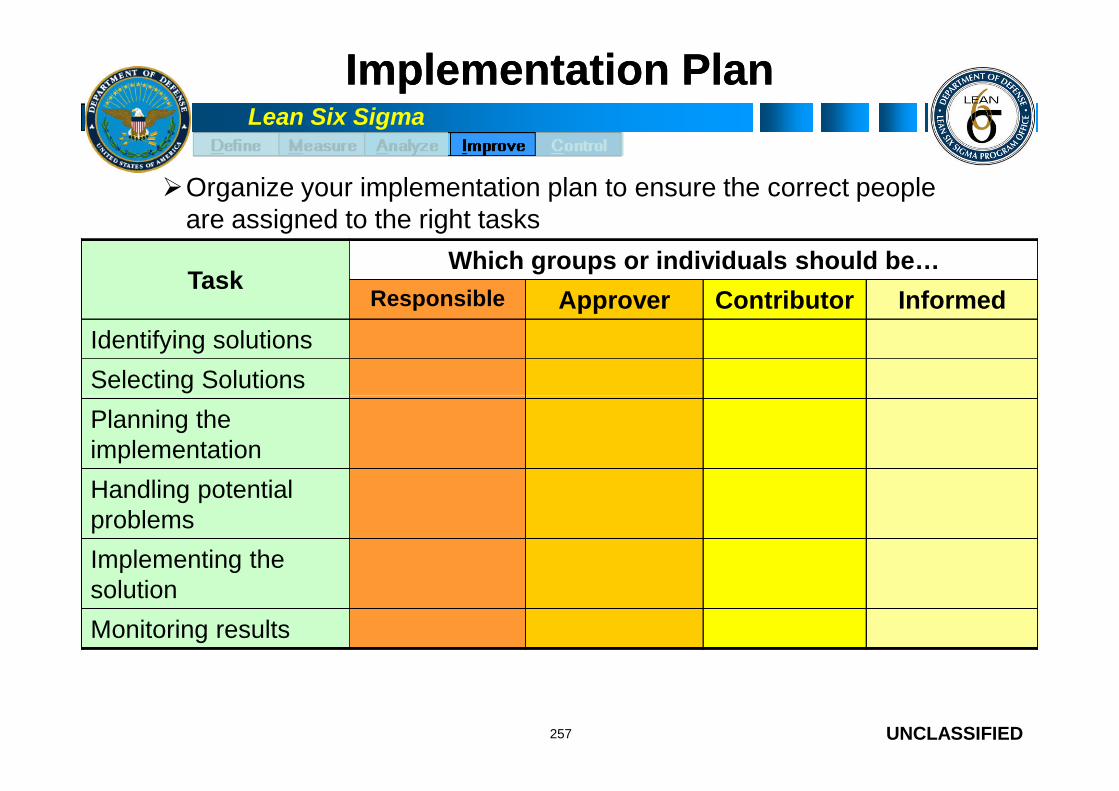
Lean Six Sigma
Implementation PlanImplementation Plan
TaskWhich groups or individuals should be…
Responsible Approver Contributor Informed
Identifying solutions
Selecting Solutions
Organize your implementation plan to ensure the correct peopleare assigned to the right tasks
UNCLASSIFIED
Planning theimplementation
Handling potentialproblems
Implementing thesolution
Monitoring results
257
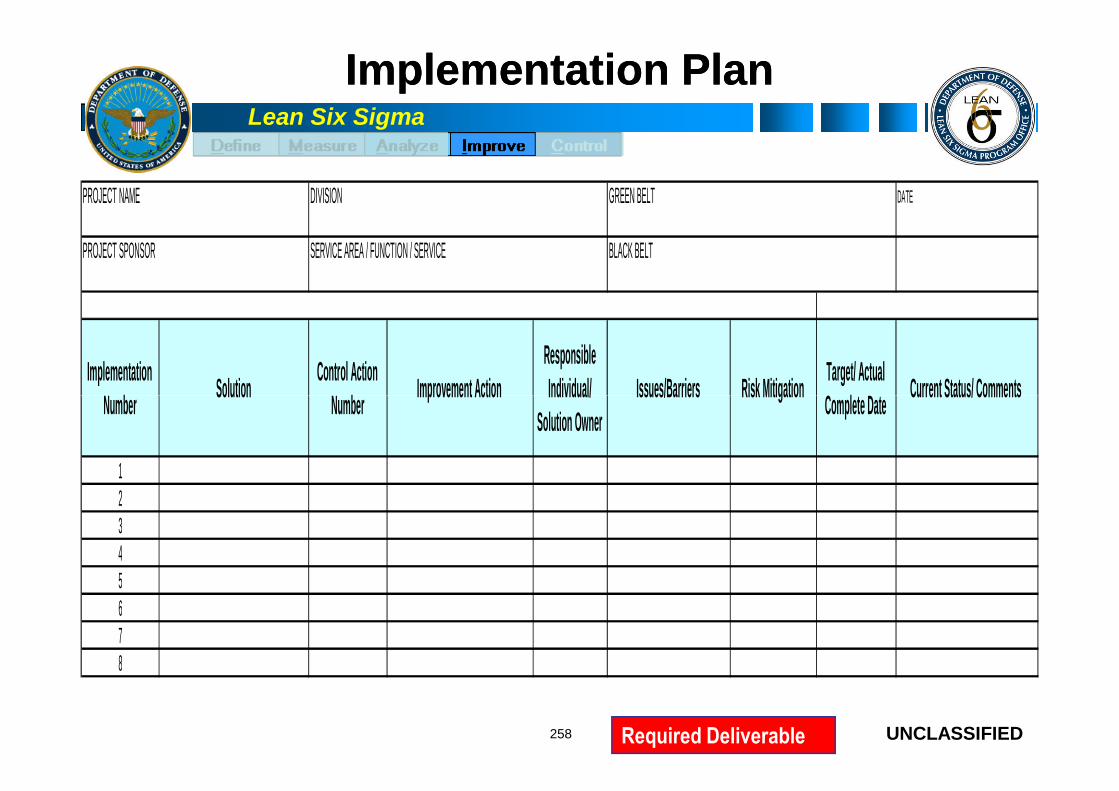
Lean Six Sigma
Implementation PlanImplementation Plan
PROJECT NAME DIVISION GREEN BELT DATE
PROJECT SPONSOR SERVICE AREA / FUNCTION / SERVICE BLACK BELT
Implementation
NumberSolution
Control Action
NumberImprovement Action
Responsible
Individual/ Issues/Barriers Risk MitigationTarget/ Actual
Complete DateCurrent Status/ Comments
UNCLASSIFIED258 Required Deliverable
NumberSolution
NumberImprovement Action Individual/
Solution Owner
Issues/Barriers Risk MitigationComplete Date
Current Status/ Comments
12345678

Lean Six Sigma
Implementation Plan ProceduresImplementation Plan Procedures
Identify what you want to accomplish
Identify the actions needed
Estimate the time and resources required For each action
For people, equipment, supplies, money
UNCLASSIFIED
For people, equipment, supplies, money
Identify measures of progress Is the plan working?
Are we getting the desired results?
Identify potential problems and how to deal with them
Create a document that captures the plan
259
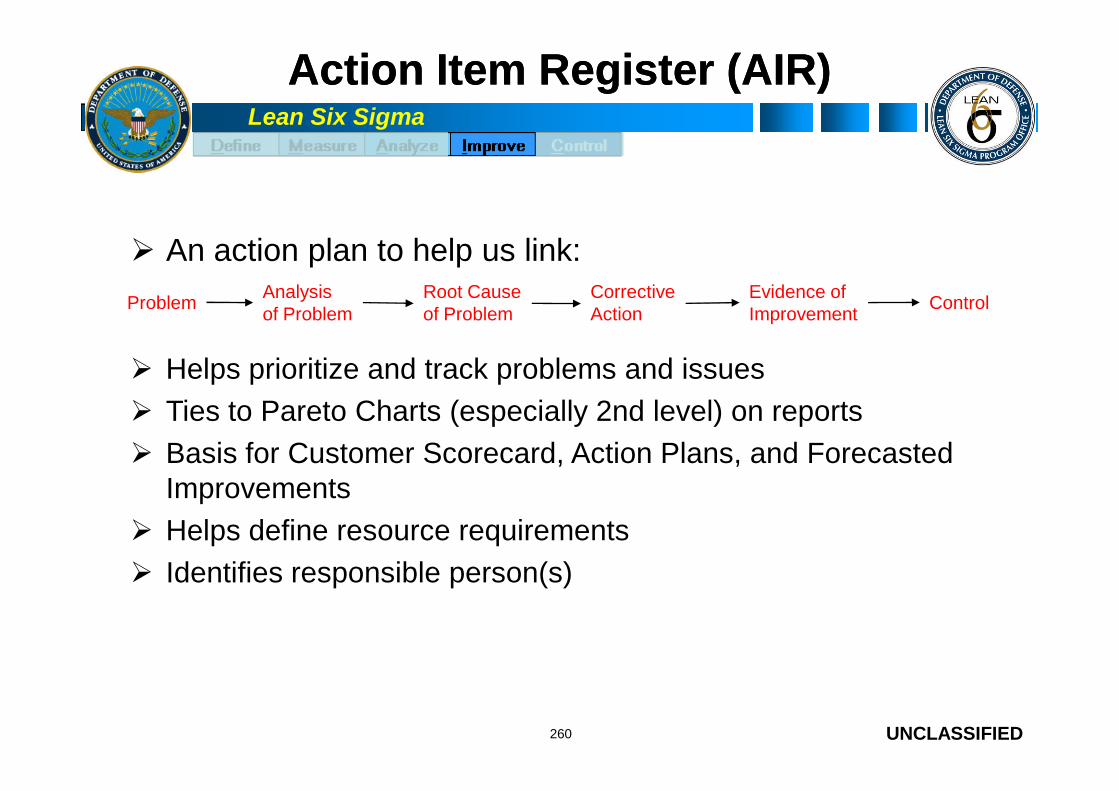
Lean Six Sigma
Action Item Register (AIR)Action Item Register (AIR)
An action plan to help us link:
ProblemAnalysisof Problem
Root Causeof Problem
CorrectiveAction
Evidence ofImprovement
Control
Helps prioritize and track problems and issues
Ties to Pareto Charts (especially 2nd level) on reports
UNCLASSIFIED260
Ties to Pareto Charts (especially 2nd level) on reports
Basis for Customer Scorecard, Action Plans, and ForecastedImprovements
Helps define resource requirements
Identifies responsible person(s)

Lean Six Sigma
AIR Problem TypeAIR Problem Type
Type 1 Problem within the immediate control of the ProcessSupervisor and Team
Type 2 Problem not within the immediate control of the ProcessSupervisor and Team but can be resolved with help fromresources inside the division
UNCLASSIFIED261
resources inside the division
Type 3 Problem for which Team or internal resources cannotidentify the true root cause or permanently fix• 6 Sigma Green Belt projects• Involve outside suppliers/equipment vendors

Lean Six Sigma
AIR ExampleAIR Example
Date Task
CompleteTask
Action
DateDue Date Week Day
+/-
0
Team
Member(s)
Check
CompleteNotes
08/24/06 Update Action Register and post on group share08/24/06 Email notification to CS3 Team informing them of Action Register update:08/24/06 Outlook:\\Public Folders\All Public Folders\DIA\CS-3\CS-3 Contacts
08/29/06 Enough seats to accommodate 60 people at DIAC08/29/06 Ensure room has JWICS and NIPERNET connectivity08/26/06 Ensure room has laptop connectivity08/29/06 Ensure Room Access Code
Schedule out for next 12 months (see attached schedule for course dates)Determine agenda (GB Briefers, GB Learning Session, Group Dialogue)Confirm invitee list
A1 08/24/06 Update Action Register Wed
08/23/06 08/23/06A2 Room Reservation Wed 21 Rollins
21 Rollins08/23/06 08/23/06
Johnson
UNCLASSIFIED
Confirm briefers (2 per MBB suggestion)Confirm facilitator for learning session
09/05/06 Contact briefers and associated MBBs via telephone or in person09/05/06 Email GB Calibration notice (date, time, place, and briefing template attachment):09/05/06 Outlook:\\Public Folders\All Public Folders\DIA\CS-3\CS-3 Contacts
ActonCantwellDeLaroderie
A3 Invite Green Belts
A4 GB Brief Prep
14Wed
Fri 13 Work with briefers in preparation for GB Calibration meeting09/08/06
08/30/0608/30/06
08/31/06
Johnson
Rollins
262
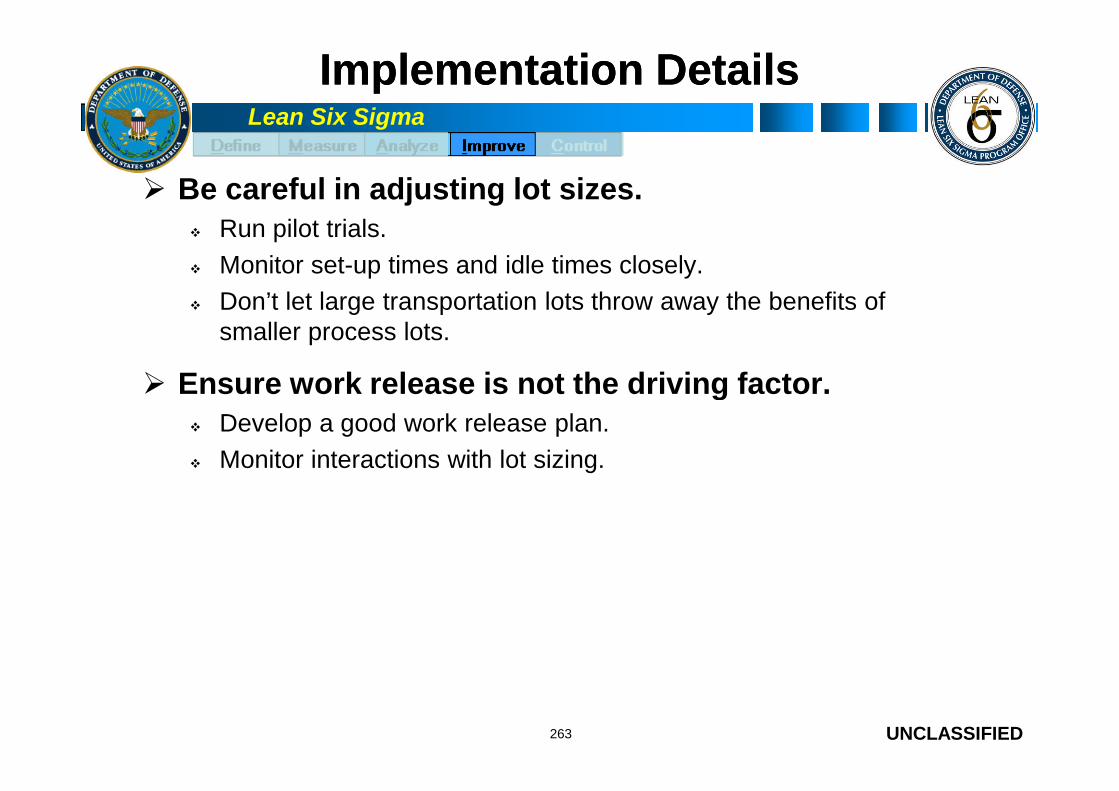
Lean Six Sigma
Implementation DetailsImplementation Details
Be careful in adjusting lot sizes. Run pilot trials.
Monitor set-up times and idle times closely.
Don’t let large transportation lots throw away the benefits ofsmaller process lots.
Ensure work release is not the driving factor.
UNCLASSIFIED
Ensure work release is not the driving factor. Develop a good work release plan.
Monitor interactions with lot sizing.
263

Lean Six Sigma
Pilot PlanningPilot Planning
What – Needs to be piloted
Where – Will the pilots be run
Who – Will be involved
When – (How long) will thepilots run
UNCLASSIFIED
pilots run
How – Will the pilots beconducted
264
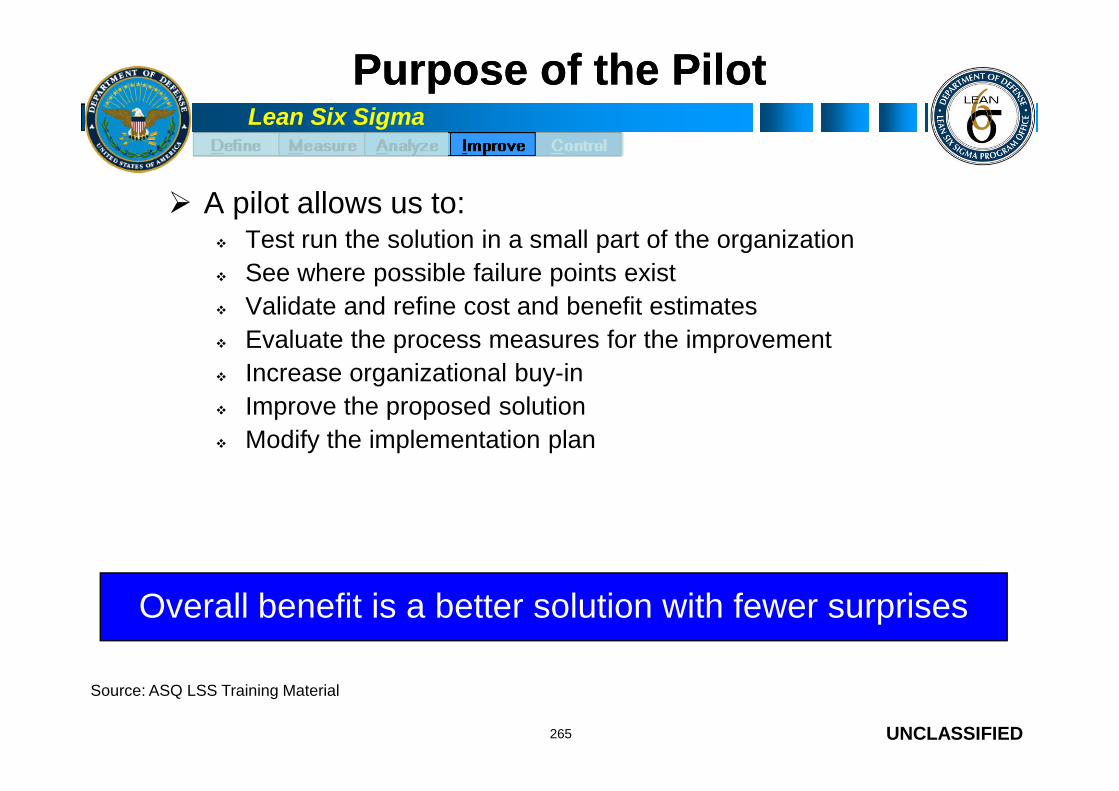
Lean Six Sigma
Purpose of the PilotPurpose of the Pilot
A pilot allows us to: Test run the solution in a small part of the organization
See where possible failure points exist
Validate and refine cost and benefit estimates
Evaluate the process measures for the improvement
Increase organizational buy-in
Improve the proposed solution
UNCLASSIFIED
Improve the proposed solution
Modify the implementation plan
265
Overall benefit is a better solution with fewer surprises
Source: ASQ LSS Training Material
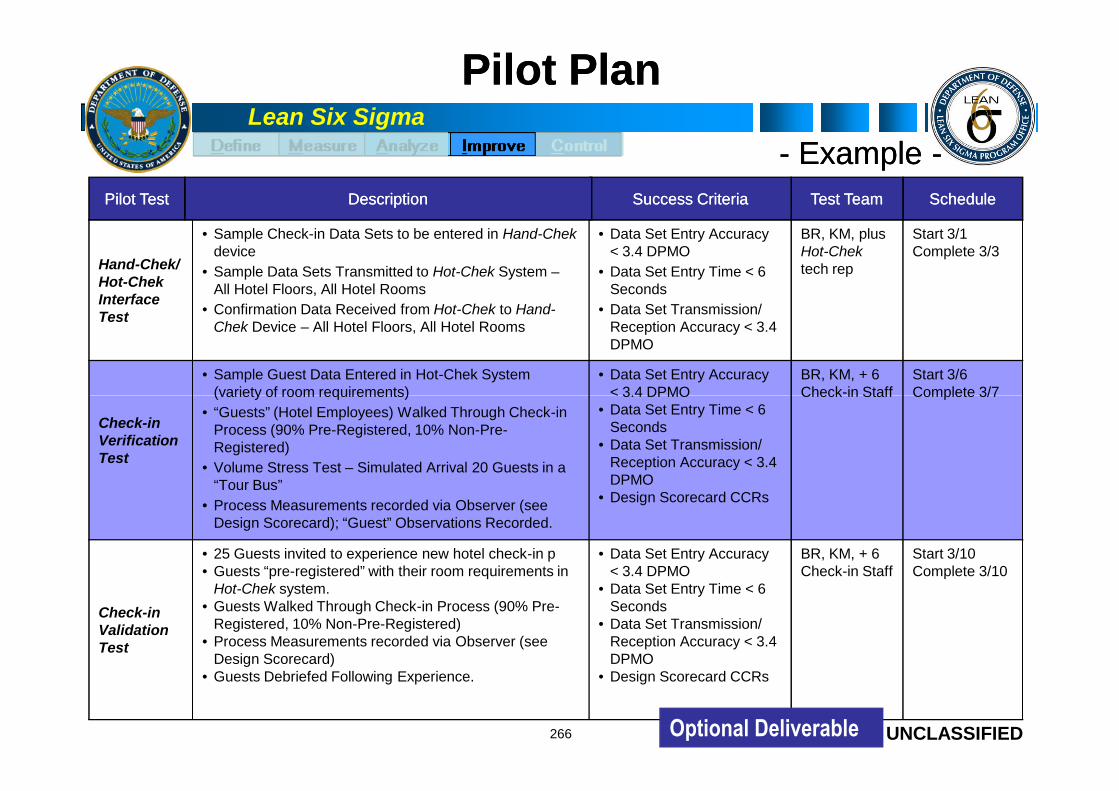
Lean Six Sigma
Pilot PlanPilot Plan
Hand-Chek/Hot-ChekInterfaceTest
• Sample Check-in Data Sets to be entered in Hand-Chekdevice
• Sample Data Sets Transmitted to Hot-Chek System –All Hotel Floors, All Hotel Rooms
• Confirmation Data Received from Hot-Chek to Hand-Chek Device – All Hotel Floors, All Hotel Rooms
• Data Set Entry Accuracy< 3.4 DPMO
• Data Set Entry Time < 6Seconds
• Data Set Transmission/Reception Accuracy < 3.4DPMO
BR, KM, plusHot-Chektech rep
Start 3/1Complete 3/3
• Sample Guest Data Entered in Hot-Chek System(variety of room requirements)
• Data Set Entry Accuracy< 3.4 DPMO
BR, KM, + 6Check-in Staff
Start 3/6Complete 3/7
ScheduleScheduleTest TeamTest TeamSuccess CriteriaSuccess CriteriaDescriptionDescriptionPilot TestPilot Test
-- ExampleExample --
UNCLASSIFIED266
Check-inVerificationTest
(variety of room requirements)
• “Guests” (Hotel Employees) Walked Through Check-inProcess (90% Pre-Registered, 10% Non-Pre-Registered)
• Volume Stress Test – Simulated Arrival 20 Guests in a“Tour Bus”
• Process Measurements recorded via Observer (seeDesign Scorecard); “Guest” Observations Recorded.
< 3.4 DPMO• Data Set Entry Time < 6
Seconds• Data Set Transmission/
Reception Accuracy < 3.4DPMO
• Design Scorecard CCRs
Check-in Staff Complete 3/7
Check-inValidationTest
• 25 Guests invited to experience new hotel check-in p• Guests “pre-registered” with their room requirements in
Hot-Chek system.• Guests Walked Through Check-in Process (90% Pre-
Registered, 10% Non-Pre-Registered)• Process Measurements recorded via Observer (see
Design Scorecard)• Guests Debriefed Following Experience.
• Data Set Entry Accuracy< 3.4 DPMO
• Data Set Entry Time < 6Seconds
• Data Set Transmission/Reception Accuracy < 3.4DPMO
• Design Scorecard CCRs
BR, KM, + 6Check-in Staff
Start 3/10Complete 3/10
Optional Deliverable

Lean Six Sigma
Piloting Helpful HintsPiloting Helpful Hints
Go to the Gemba to observe all activities, effects, andinteractions during the pilot and continue if achieving desiredresults
Set the tone of the pilot (most pilots are not 100% perfect andprepare for set backs) Customers
UNCLASSIFIED
Management
Staff
Refine pilot from lesson learned Often the pilot will show a few opportunities for improvement.
267
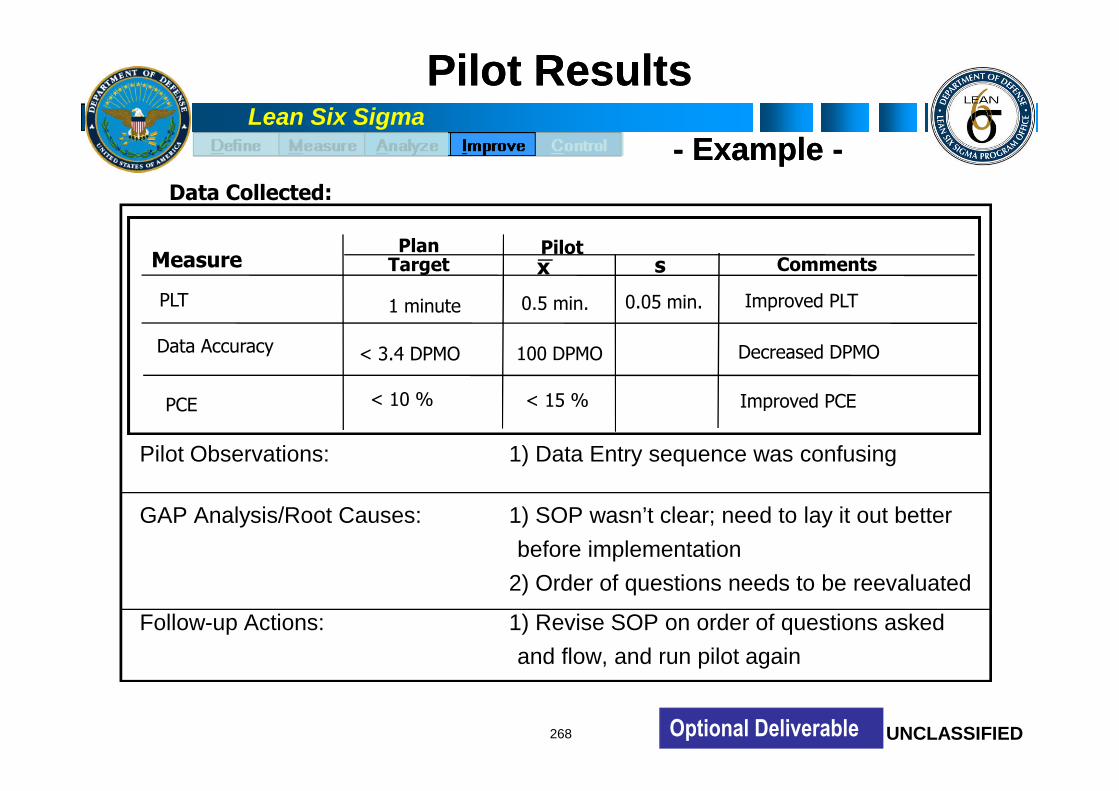
Lean Six Sigma
Pilot ResultsPilot Results
Data Collected:
MeasurePilot
sPlan
Target x
PLT
Data Accuracy
1 minute
< 3.4 DPMO
0.5 min.
100 DPMO
0.05 min.
Comments
Improved PLT
Decreased DPMO
PCE < 15 %< 10 % Improved PCE
-- ExampleExample --
UNCLASSIFIED268
Pilot Observations: 1) Data Entry sequence was confusing
GAP Analysis/Root Causes: 1) SOP wasn’t clear; need to lay it out better
before implementation
2) Order of questions needs to be reevaluated
Follow-up Actions: 1) Revise SOP on order of questions asked
and flow, and run pilot again
PCE < 15 %< 10 % Improved PCE
Optional Deliverable

Lean Six Sigma
“New” Process Capability“As Is” Process Capability
USLUSL
P ro cess C apab ility A nalys is fo r C ontro l
ST
LT
USLUSL
Process Capability Analysis for Cholesterol
ST
LT
DescriptiveDescriptive StatsStats--ProcessProcess CapabilityCapability
-- ExampleExample --
UNCLASSIFIED269 Required Deliverable
240220200180160140260240220200180160140
StDev (LT)
StDev (ST)
Sample N
Mean
LSL
Target
USL
16.3662
20.4206
30
184.967
*
*
220.000
Process Data
StDev (LT)
StDev (ST)
Sample N
Mean
LSL
Target
USL
22.4931
26.0455
30
193.133
*
*
220.000
Process Data

Lean Six Sigma
Lessons LearnedLessons Learned
At the completion of the pilot, capture what workedand what needed improvement.
Include lessons learned in the full roll out of the newprocess: Compile lessons learned
Categorize by type; by defect type, key analysis used, key
UNCLASSIFIED
Categorize by type; by defect type, key analysis used, keywords, problem / opportunity statement, root causes, etc.
Communicate lessons learned to others
270
Source: ASQ LSS Training Material

Lean Six Sigma
Control ChartControl Chart
0.10
ion
P Chart for Total Defectives
3.0SL=0.08162
Feb/Mar Data Confirms Process HasRemained In Control
-- ExampleExample --
UNCLASSIFIED271
150100500
0.05
0.00
Sample Number
Pro
po
rti
P=0.03817
-3.0SL=0.00E+00
Optional Deliverable

Lean Six Sigma
Related Project ConsiderationRelated Project Consideration
Multi-Generation Project Plan (MGPP)Generation 1
(Date)Generation 2
(Date)Generation 3
(Date)
Vision
UNCLASSIFIED272
ProcessGeneration
Platforms /
Technology
Optional Deliverable
Lean Six Sigma
Improve Phase Review QuestionsImprove Phase Review Questions
Do your improvements address the root causes of theproblem?
Have you mistake-proofed your improvements?
UNCLASSIFIED
Do you need to run a pilot?
Did your team contribute to the improvements?
What is the implementation plan?
273

Lean Six Sigma
Summary of Lean Six SigmaSummary of Lean Six Sigma
A relentless process of identifying and eliminating waste
An environmental framework that aids in sustaining gains
It is comprised of 5 building concepts
Kaizen: Philosophy of Continuous Improvement
5S: A systematic method to organize, order, clean, and standardize a
UNCLASSIFIED
5S: A systematic method to organize, order, clean, and standardize a
workplace… and keep it that way
Visual Workplace: A visual technique for real-time process management
Standardize: Use of documented, standardized work procedures to reduce
variation
Breakthrough manufacturing strategies: application of relevant learning from
other organizations to eliminate waste
274

Lean Six Sigma
Improve Tollgate QuestionsImprove Tollgate Questions
What techniques were used to generate ideas for potential solutions?
What narrowing and screening techniques were used to further develop and qualifypotential solutions?
What evaluation criteria were used to select a recommended solution?
Do the proposed solutions address all/most critical identified root causes?
Were the solutions verified with the Project Sponsor and Stakeholders? Has anapproval been received to implement?
UNCLASSIFIED
approval been received to implement?
Was a pilot run to test the solution? What was learned? What was modified?
Has the team seen evidence that the root causes of the initial problems have beenaddressed during the pilot? What are the expected benefits?
Has the team considered potential problems and unintended consequences (FMEA)of the solution and developed preventive and contingency actions to address them?
Has the proposed solution been documented, including participants, job descriptions,and if applicable, their estimated time commitment to support the process?
Has the team developed an implementation plan? What is the status?
Have any new risks to project success been identified and added to the RiskMitigation Plan?
275

Lean Six Sigma
What We Have CoveredWhat We Have Covered
Develop a plan for implementing the improved process.
Apply the concepts required and steps needed toconduct a successful pilot / simulation.
Implement the improved process and monitor results.
UNCLASSIFIED276
Lean Six Sigma
Control
Define
Measure
Analyze
UNCLASSIFIED277
ControlAnalyze
Improve
Control

Lean Six Sigma
Learning ObjectivesLearning Objectives
After this training, you will: Understand the importance of mistake-proofing in a process to
prevent future defects from ever occurring
Be able to develop control plans to transition process improvementsto process owner
Be aware of tools that can be used to implement project follow-up
UNCLASSIFIED
and ensure long-term sustainability of improvements
Understand and apply financial metrics to project benefits
278

Lean Six Sigma
Definition of SustainmentDefinition of Sustainment
The old way is gone, the new way is the way
Human nature resists change and reverts to old habits
PerformanceHistorical
Consistently adhere to process improvements,
ensuring all benefits are fully realized.
UNCLASSIFIED279
Baseline
PerformancewithSustainment
PerformancewithoutSustainment
HistoricalMomentum
RIE #1 RIE #2 RIE #3 RIE #4

Lean Six Sigma
How to Sustain the GainsHow to Sustain the Gains
Change Remember Albert? Don’t Be Insane
Change is uncomfortable for most people
Change takes time to take hold and become routine
New Instructions
UNCLASSIFIED
New Instructions Ensure there are clear SOPs where accountability has been assigned
Ensure there are clear work instructions
Identify Measures Measures must now be converted to Metrics and monitored
Ensure you have a response process should performance dip
Training Ensure everyone is informed and trained on the changes
280
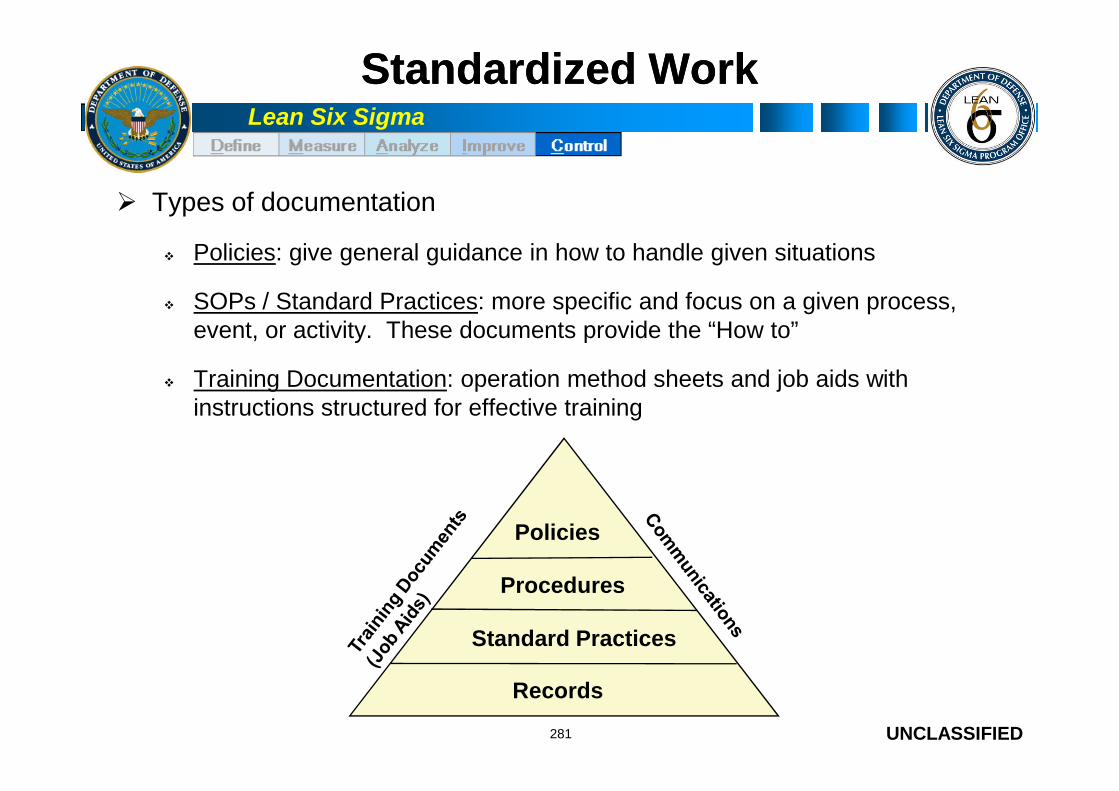
Lean Six Sigma
Standardized WorkStandardized Work
Types of documentation
Policies: give general guidance in how to handle given situations
SOPs / Standard Practices: more specific and focus on a given process,event, or activity. These documents provide the “How to”
Training Documentation: operation method sheets and job aids withinstructions structured for effective training
UNCLASSIFIED
instructions structured for effective training
281
Policies
Procedures
Standard Practices
Records

Lean Six Sigma
Prerequisites for Standardized WorkPrerequisites for Standardized Work
Availability of required tools (5S): Operators cannot be expected to maintain standard work if they are required to
locate needed tools.
Consistent flow of raw material: Operators cannot be expected to maintain standard work if they are hunting
down needed parts.
Visual alert of variation in the process (visual workplace):
UNCLASSIFIED
Visual alert of variation in the process (visual workplace): Operators and material handlers need visual signals to keep “standard work” a
standard. If they can identify new lots of material or other variation, they canidentify potential changes in the process. This visual check will assist in defectidentification and reduction.
Identified and labeled in-process stock (5S): As inventory levels of in-process stock decrease, a visual signal should be sent
to the material handlers to replenish this stock. Operators cannot maintainstandard work without this.
282

Lean Six Sigma
Standard WorkStandard Work -- ExamplesExamples
Parts-Production CapacityWorktableStandard Work Sheet
UNCLASSIFIED283
Work Methods Chart

Lean Six Sigma
SOPsSOPs and Training Plansand Training Plans
SOPs Requiring Revision Responsible Status
FY09 SOP Update
1 Oct 08 – 28 Feb 09
Lead: Branch Chief,
AO: Team Lead
Completed
Next SOP Update schedule
1 Sep 09 – 30 Sep 10
Lead: TSC Chief,
AO: Team Lead
Complete before FY10 NSPSCycle
Next SOP Update schedule Lead: TSC Chief, Complete before FY11 NSPS
SOPs Requiring Revision-- ExampleExample --
UNCLASSIFIED284
Next SOP Update schedule
1 Sep 09 – 30 Sep 10
Lead: TSC Chief,
AO: Team Lead
Complete before FY11 NSPSCycle
Required Training Responsible Status
Office ProfessionalDevelopment
Each Team Members areencouraged to provide OPD
OPD Training Schedule plan isasked to be updated to teammembers.
Individual ProfessionalDevelopment Plan
Branch Chief and Teammembers
Susp Date: Branch Chief andTeam member discuss andfinalize by 1 May 09
Required Training
Required Deliverable
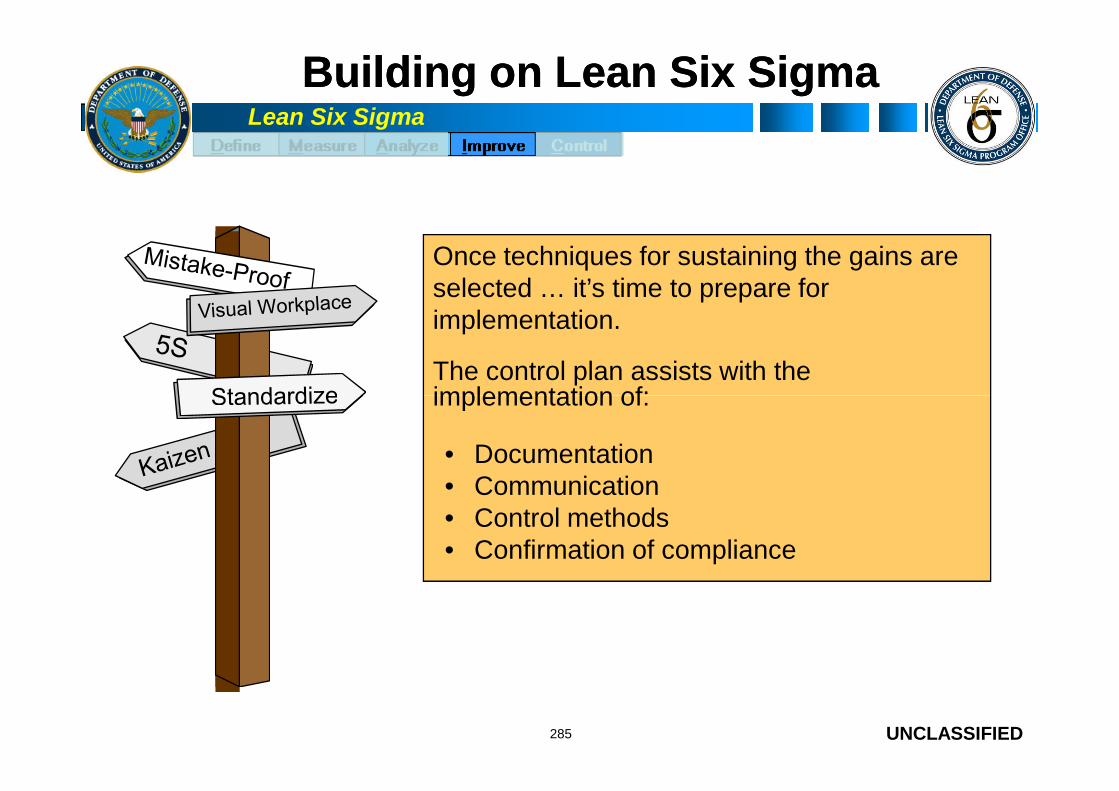
Lean Six Sigma
Building on Lean Six SigmaBuilding on Lean Six Sigma
Once techniques for sustaining the gains areselected … it’s time to prepare forimplementation.
The control plan assists with theimplementation of:
UNCLASSIFIED285
implementation of:
• Documentation• Communication• Control methods• Confirmation of compliance

Lean Six Sigma
What Is a Control Plan?What Is a Control Plan?
Control plans provide a written summary description of the systems used inminimizing variation in the improved process.
Control plans do not replace information contained in detailed instructions(SOPs).
The control plan describes the actions that are required at each phase ofthe process to assure that all process outputs will be in a state of control.
UNCLASSIFIED
Ultimately, the control plan is a living document reflecting current methodsof control and measurement systems used.
Control plans answer the following questions:
What is the process that is being controlled?
What are the process outputs that are being monitored/controlled?
What are the inputs that are being monitored/controlled in order to keep the output at itstarget level?
How are the inputs and outputs being measured, monitored, and controlled?
How does someone react when the inputs or outputs are not in control?
286

Lean Six Sigma
Control PlansControl Plans
Define the Solution
Document the Standard Practice
Who, What, When, Where, Why, How
Established Data Collection Process
Determine Control Tools
Create Training Documentation
Communication & Training Plan
UNCLASSIFIED287
Communication & Training Plan
Communicate & Train
Who, What, When, Where, Why, How
Audit Procedures
Corrective Action Reports
Project Documentation
Translation of Learning (s)
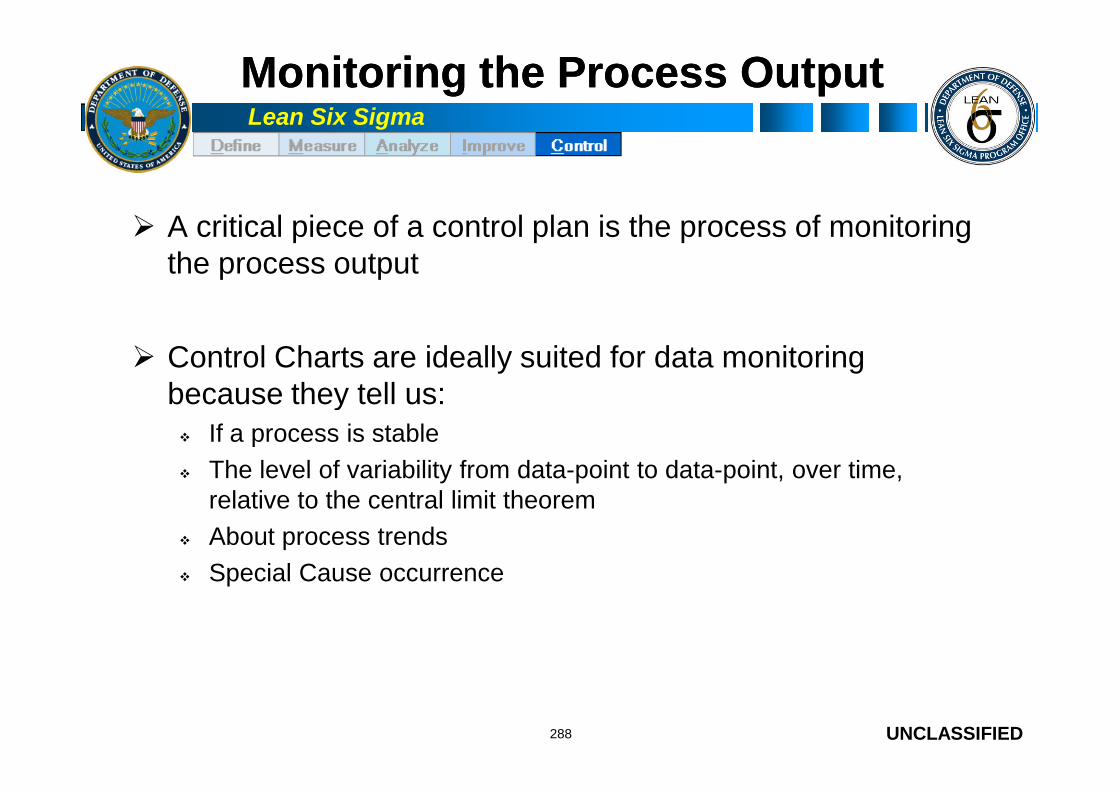
Lean Six Sigma
Monitoring the Process OutputMonitoring the Process Output
A critical piece of a control plan is the process of monitoringthe process output
Control Charts are ideally suited for data monitoringbecause they tell us:
UNCLASSIFIED
because they tell us: If a process is stable
The level of variability from data-point to data-point, over time,relative to the central limit theorem
About process trends
Special Cause occurrence
288

Lean Six Sigma
Control Plan TipsControl Plan Tips
Establish controls to detect failure modes if the failure cannotbe prevented
Use illustrations
Use flow diagrams
Use work instructions that really work
UNCLASSIFIED
Use work instructions that really work
Use reaction plans that really work
Focus on the quality of documentation, not the quantity
Use workers to help with the instruction
Clearly lay out authorities, roles, and responsibilities
289

Lean Six Sigma
Control Plan Tips (Cont.)Control Plan Tips (Cont.)
Focus on the identification of nonconforming services.
Ensure segregation by identification or location to preventinadvertent use.
Address the need for recall or previously provided service.
Ensure the benefit of rework versus loss.
Ensure that rework actually produces first quality service.
UNCLASSIFIED
Ensure that rework actually produces first quality service.
Ensure that corrective actions are initiated whenevernonconforming services are provided.
290
There is nothing wrong with including the Cause and EffectDiagram that helped build the Control Plan as a reference.
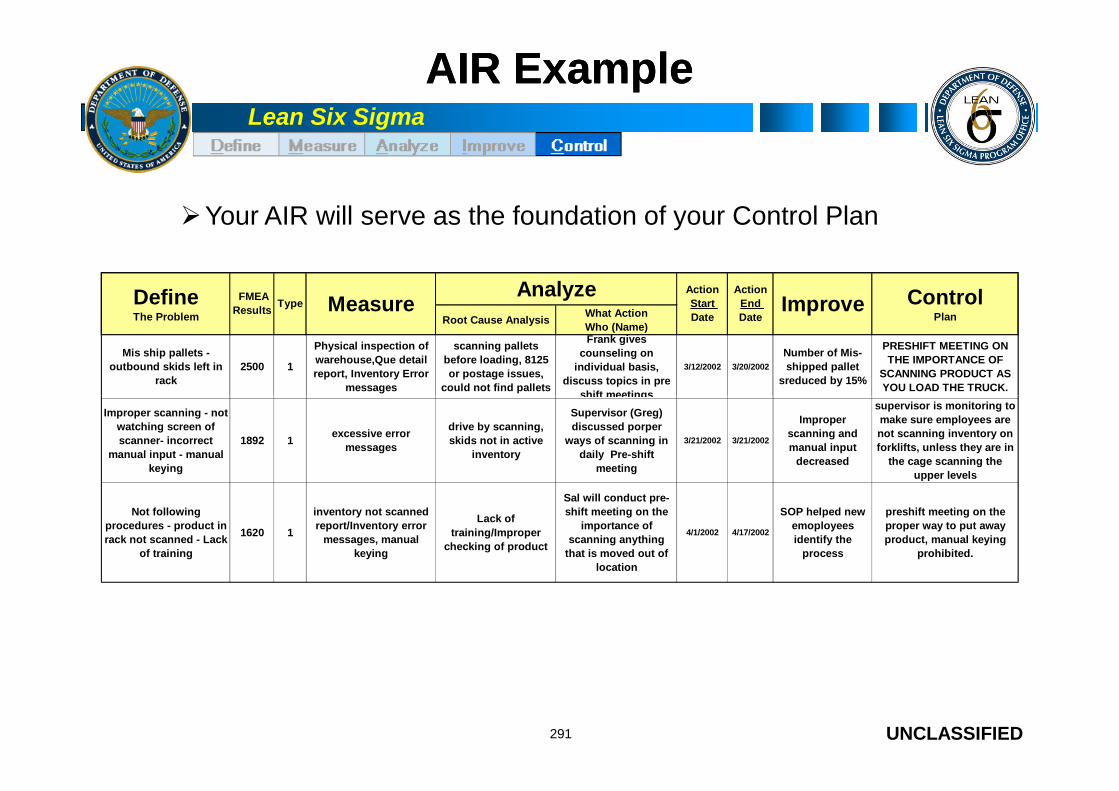
Lean Six Sigma
AIR ExampleAIR Example
Root Cause AnalysisWhat Action
Who (Name)
Mis ship pallets -
outbound skids left in
rack
2500 1
Physical inspection of
warehouse,Que detail
report, Inventory Error
messages
scanning pallets
before loading, 8125
or postage issues,
could not find pallets
Frank gives
counseling on
individual basis,
discuss topics in pre
shift meetings
3/12/2002 3/20/2002
Number of Mis-
shipped pallet
sreduced by 15%
PRESHIFT MEETING ON
THE IMPORTANCE OF
SCANNING PRODUCT AS
YOU LOAD THE TRUCK.
ControlPlan
Action
End
Date
FMEA
ResultsType Improve
AnalyzeDefineThe Problem
MeasureAction
Start
Date
Your AIR will serve as the foundation of your Control Plan
UNCLASSIFIED291
shift meetings
Improper scanning - not
watching screen of
scanner- incorrect
manual input - manual
keying
1892 1excessive error
messages
drive by scanning,
skids not in active
inventory
Supervisor (Greg)
discussed porper
ways of scanning in
daily Pre-shift
meeting
3/21/2002 3/21/2002
Improper
scanning and
manual input
decreased
supervisor is monitoring to
make sure employees are
not scanning inventory on
forklifts, unless they are in
the cage scanning the
upper levels
Not following
procedures - product in
rack not scanned - Lack
of training
1620 1
inventory not scanned
report/Inventory error
messages, manual
keying
Lack of
training/Improper
checking of product
Sal will conduct pre-
shift meeting on the
importance of
scanning anything
that is moved out of
location
4/1/2002 4/17/2002
SOP helped new
emoployees
identify the
process
preshift meeting on the
proper way to put away
product, manual keying
prohibited.

Lean Six Sigma
Utilize ANY and ALL communication vehicles: Memo
Town Hall Meetings
Small Group Meetings
Newsletter
Control Plans: Communicate & TrainControl Plans: Communicate & Train
UNCLASSIFIED
Flyer
Video/DVD
Web Page
292

Lean Six Sigma
Control Plans: AuditControl Plans: Audit
Effective audits must be a function used by management
The purpose for the audit should be well defined
Auditors must be qualified to perform their tasks
Auditing is a process for evaluating compliance to written requirementsand the effectiveness of those requirements in meeting basicmanagement controls. The evaluation compares reality to requirements.
UNCLASSIFIED
Auditors must be qualified to perform their tasks
Confirm auditor can perform audit without bias
Auditor must understand importance of Performance Improvement andStandardization
Measure against a defined standard
Audit is to be performed against written standard operating procedure
Contain conclusions based on fact
Utilization of an effective checklist assures scope and content of audit
Provide reports that focus on the control system
The audit should confirm or refute the control systems work293

Lean Six Sigma
Control Plans: Corrective ActionControl Plans: Corrective Action
Objectives:
Document significant non-conformities
Identify a problem and isolate the underlying cause
Find a solution for the cause of the problem and develop a plan toimplement the solution
UNCLASSIFIED
Document the Corrective Action Plan
Establish a schedule of when actions are
to be initiated and completed
294

Lean Six Sigma
Control Plans: Corrective ActionControl Plans: Corrective Action
Implement immediate containment solution
Create an intervention step as a short term solution: Allows problem to be managed during investigation
Appropriate steps may be inspection and/or increased supervisorinvolvement
UNCLASSIFIED
involvement
Stop-gap measures ensure the problem does not reoccur
295
An effective Corrective Action is:1. Timely2. Effective3. Prevents the recurrence of a problem!
Lean Six Sigma
Control Plans: Translate & DocumentControl Plans: Translate & Document
Next, Transfer ownership of the project to the ProcessOwner
Ensure Division Director is aware of the transfer data
Ensure the Process Owner: is aware of the transfer data
UNCLASSIFIED
is aware of the transfer data
has been fully trained on all aspects of the control plan
is completely aware of his/her responsibility to maintain thecontrol plan going forward
is aware of the reporting responsibilities going forward
296
Leave NO question in ANYONE’S mindthat project and process ownership have changed!

Lean Six Sigma
Ex: Project ControlEx: Project Control Plan DocumentPlan Document
Control Plan #
Date (Original): Prepared by:
Black Belt Key Contact
Control Plan for: Date (Revised): Process Manager
Champion Approval:
Division: Audit Frequency By Supervision By Dept Manager By CIM By Corp CIM Stakeholder Approval:
Audit Details
SIX SIGMA CONTROL PLAN
Equipment / Process
Creative applications of tools used in other ways during the process
UNCLASSIFIED
Division: Audit Frequency By Supervision By Dept Manager By CIM By Corp CIM Stakeholder Approval:
Date of First Audit CI Manager Approval:
Division Director Approval:
Process Process Step Required Action
Process Specif ication (LSL,
USL, Target)
Measurement
Technique Sample Size
Sample
Frequency Control Method Reaction Plan
Sample AuditProcess Measurement
297

Lean Six Sigma
Ex: Process ControlEx: Process Control Plan DocumentPlan Document
Process Control # (
Issued #)
Target
Specificatio
Division Director Approval:
Department Manager Approval:
Date Revised
Hand Off Date:CI Approval/Date: BlackBelt and or CI Mgr.
Original Date:
May 21, 2003
Process Name: Metric Review Process Owner: Director of Continuous
Improvement
MBB Approval - Jesse Johnson
Process Control ItemsReference of Process Item
Action Item Control
UNCLASSIFIED298
Process
Step
Specificatio
n - UCL/LCL,
Target etc.
Operational
Measure
Control
Chart
Audit
Frequency
Audit Date
SOP # SOP DISC Metric Size Freq.
Any Special Tools
required or needed
Specific to
Item
ISO
Format
Explanation
of ISO #
Key Variation
of product
Spec of Item
being controlled
Specifics for data
measurement # #
Type of
Control
Chart used
Specify the Audit
Freq of each line
item
Date of last
Audit
Obtain Strategic Plan
from COO
Strat Plan
Review
CW-122-
2ID CTB
Objectives BU Specific .05 % of Target EBIT 4
1per
QTR I-MRQTRLY Report
1st week of
each new
QTR
Metric Review
Establish
metrics SW-567
Tie CTB
Objectives to
KPIs BU Specific 0.05% EBIT 4
per
QTR I-MRMonthly Report
2nd week of
each new
QTR
Actual Item of Control
(WHAT)
Reference of Process Item(Exhibit, Work Instruction, SOP,
Etc.)SampleProcess, Machine,
Equipment
Machine Number or
Equipment I.D.
Catelog Retail
Business Unit
Catelog Retail
Business Unit
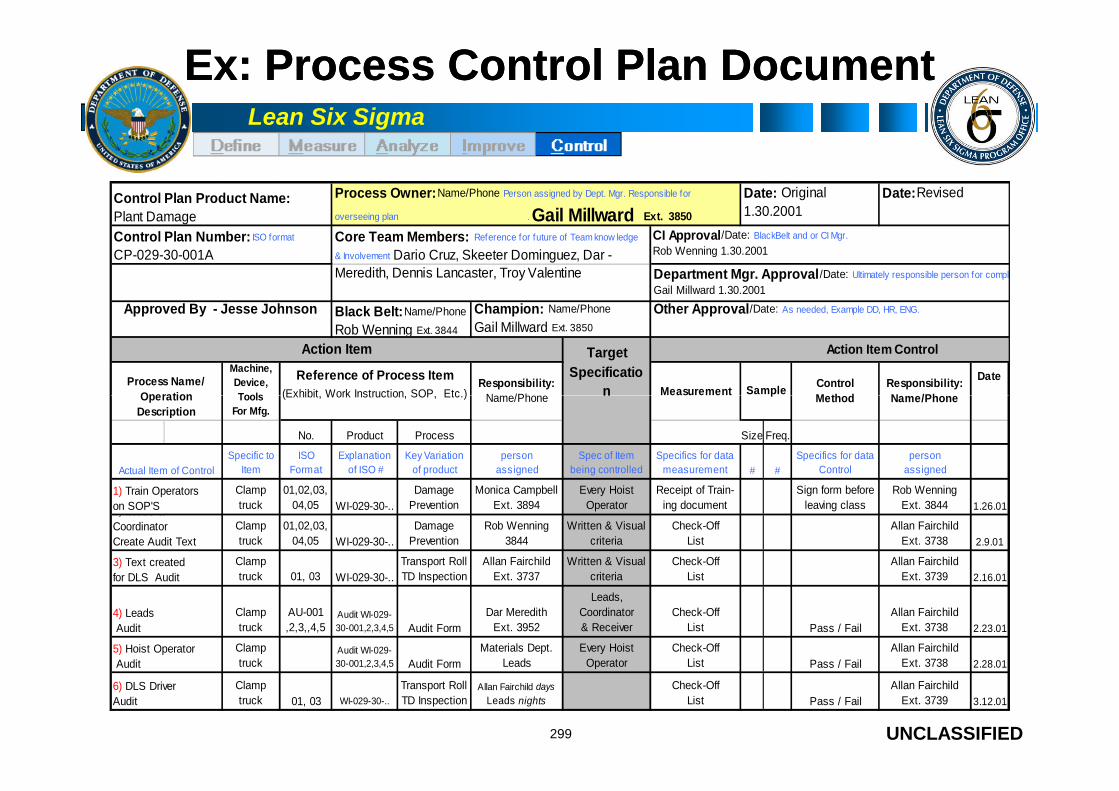
Lean Six Sigma
Ex:Ex: ProcessProcess ControlControl Plan DocumentPlan Document
TargetMachine,
Device,
Tools
Responsibility:
Name/Phone
Specificatio
n MeasurementControl
Method
Responsibility:
Name/Phone
Date
Action Item Action Item Control
Process Name/
Operation
Reference of Process Item
(Exhibit, Work Instruction, SOP, Etc.) Sample
Approved By - Jesse Johnson Black Belt:Name/Phone
Rob Wenning Ext. 3844
Champion: Name/Phone
Gail Millward Ext. 3850
Other Approval/Date: As needed, Example DD, HR, ENG.
Control Plan Number: ISO format
CP-029-30-001A
Core Team Members: Reference for future of Team know ledge
& Involvement Dario Cruz, Skeeter Dominguez, Dar -
CI Approval/Date: BlackBelt and or CI Mgr.
Rob Wenning 1.30.2001
Meredith, Dennis Lancaster, Troy Valentine Department Mgr. Approval/Date: Ultimately responsible person for completion/compliance
Gail Millward 1.30.2001
Control Plan Product Name:
Plant Damage
Process Owner:Name/Phone Person assigned by Dept. Mgr. Responsible for
overseeing plan .Gail Millward Ext. 3850
Date: Original
1.30.2001
Date:Revised
UNCLASSIFIED299
Tools
For Mfg.Name/Phone
n MeasurementMethod Name/Phone
No. Product Process Size Freq.
Specific to
Item
ISO
Format
Explanation
of ISO #
Key Variation
of product
Accountable
person
assigned
Spec of Item
being controlled
Specifics for data
measurement # #
Specifics for data
Control
Accountable
person
assigned
Clamp
truck
01,02,03,
04,05 WI-029-30-..
Damage
Prevention
Monica Campbell
Ext. 3894
Every Hoist
Operator
Receipt of Train-
ing document
Sign form before
leaving class
Rob Wenning
Ext. 3844 1.26.01
Clamp
truck
01,02,03,
04,05 WI-029-30-..
Damage
Prevention
Rob Wenning
3844
Written & Visual
criteria
Check-Off
List
Allan Fairchild
Ext. 3738 2.9.01
Clamp
truck 01, 03 WI-029-30-..
Transport Roll
TD Inspection
Allan Fairchild
Ext. 3737
Written & Visual
criteria
Check-Off
List
Allan Fairchild
Ext. 3739 2.16.01
Clamp
truck
AU-001
,2,3,,4,5Audit WI-029-
30-001,2,3,4,5 Audit Form
Dar Meredith
Ext. 3952
Leads,
Coordinator
& Receiver
Check-Off
List Pass / Fail
Allan Fairchild
Ext. 3738 2.23.01
Clamp
truckAudit WI-029-
30-001,2,3,4,5 Audit Form
Materials Dept.
Leads
Every Hoist
Operator
Check-Off
List Pass / Fail
Allan Fairchild
Ext. 3738 2.28.01
Clamp
truck 01, 03 WI-029-30-..
Transport Roll
TD InspectionAllan Fairchild days
Leads nights
Check-Off
List Pass / Fail
Allan Fairchild
Ext. 3739 3.12.01
5) Hoist Operator
Audit
6) DLS Driver
Audit
Actual Item of Control
1) Train Operators
on SOP'S2) Leads &
Coordinator
Create Audit Text
4) Leads
Audit
3) Text created
for DLS Audit
Operation
Description
(Exhibit, Work Instruction, SOP, Etc.) Sample
Lean Six Sigma
ExerciseExercise –– ControlControl PlanPlan
Brainstorm 3 control measuressuitable for use in a control plan
for the Simulation.
UNCLASSIFIED
for the Simulation.
300
5 minutes

Lean Six Sigma
SummarySummary
Control plans can be likened to sustainment in 5S
SPC is not successful without religious use of control plans
Control Plans are living documents. If processes changeand a new variation cause develops, add it to the ControlPlan
UNCLASSIFIED
Plan
Control plans must identify: What we are measuring
How we monitor
What we do when the process
is out of control
301
“I have been impressed with theurgency of doing.Knowing is not enough; we must apply.Being willing is not enough; we mustdo.”
Leonardo da Vinci
Lean Six Sigma
Bringing the Event to CompletionBringing the Event to Completion
All feasible process improvement ideas have been implemented
The project sponsor/process owner and personnel from theaffected work area have been adequately trained on the processchanges
Project objectives have been met or exceeded (Validate)
1. Ensure that:
UNCLASSIFIED
Project objectives have been met or exceeded (Validate)
Processes are updated
Needed controls are instituted in the process
302
2. Quantify event benefits (ROI)

Lean Six Sigma
RedeploymentRedeployment
Redeployment: Redeployment is the movement of peoplefrom a process that has been improved either throughattrition or by reassigning them to another PerformanceImprovement event or to other critical work.
Ultimately, the key objective of a Performance Improvement
UNCLASSIFIED303
Ultimately, the key objective of a Performance ImprovementThinking organization is to reduce the amount of humaneffort required per unit of output, in other words increaseproductivity and capacity.
Lean Six Sigma
RedeploymentRedeployment
1. Take Attrition (reduce end strength)
2. Reassign people to full-time Performance Improvementwork or other critical work (may require retraining ofindividuals)
3. Eliminate or reduce overtime
UNCLASSIFIED304
3. Eliminate or reduce overtime
4. Reduce contractor support
5. Reduce work backlog

Lean Six Sigma
FollowFollow--up Beyond the Projectup Beyond the Project
Green Belt
Ensure standard work is implemented
Foster success – market results
UNCLASSIFIED305
Foster success – market results
Complete and submit documentation on project
Clean handoff to Process Owner at completion ofproject
Lean Six Sigma
FollowFollow--UpUp BeyondBeyond the Projectthe Project
Event Sponsor / Process Owner
Monitor (control charts, control plans, Gemba)
Drive completion of any outstanding action items Visit the area frequently for several weeks after the project
Address stakeholder issues and concerns
Recognize participants of project and celebrate success
UNCLASSIFIED
Recognize participants of project and celebrate success
Is Takt Time being achieved?
Keep up the pressure completing outstanding action items
306
Lean Six Sigma
Event DocumentationEvent Documentation
Clearly captures the results of the event
Should include:
Charter information
Tools utilized
Improvements made
UNCLASSIFIED
Improvements made
Evidence of data driven decision making
Before / After process flows and metrics
ROI calculations
Other improvement opportunities
307
Create a package that sums up everything
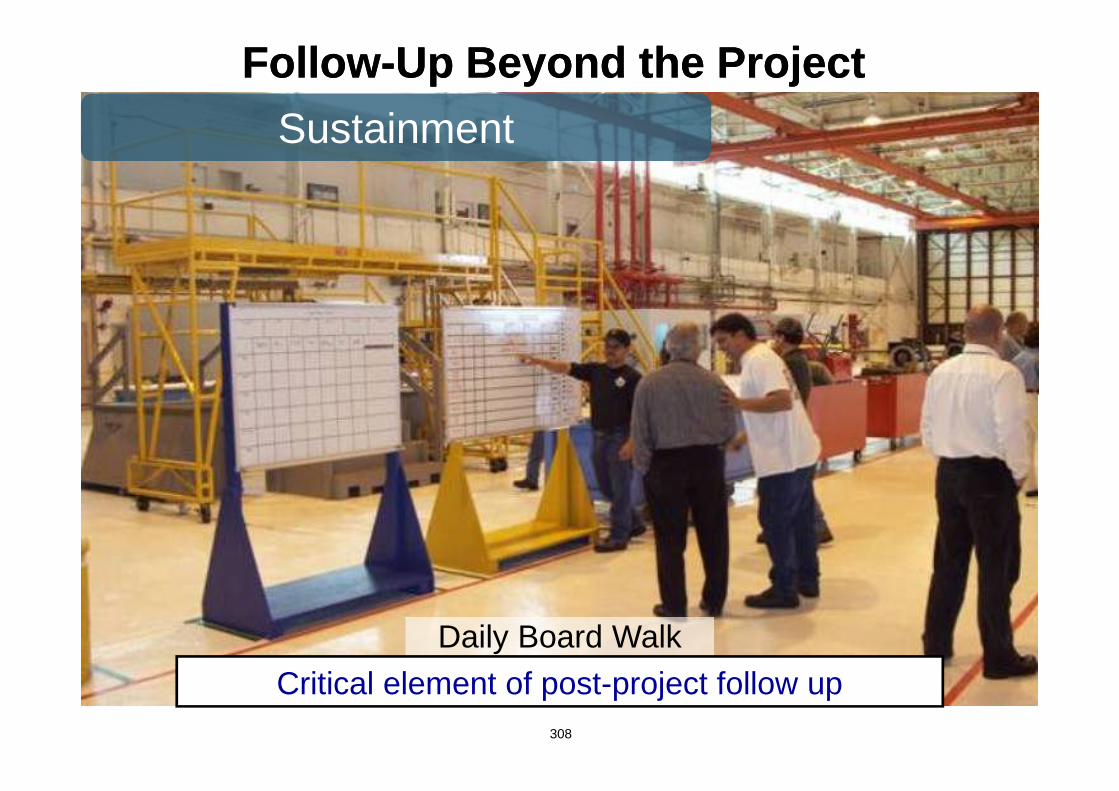
Sustainment
FollowFollow--Up Beyond the ProjectUp Beyond the Project
308
Daily Board Walk
Critical element of post-project follow up
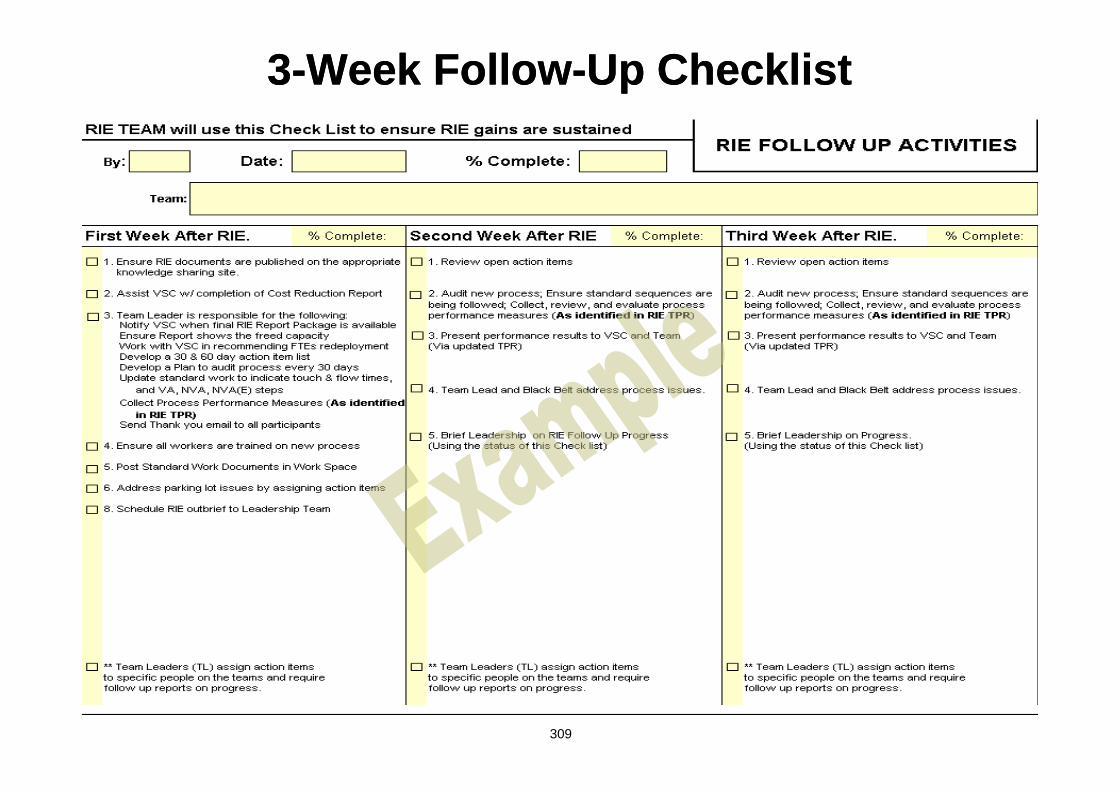
33--Week FollowWeek Follow--Up ChecklistUp Checklist
309
Lean Six Sigma
Lessons LearnedLessons Learned
Every improvement effort offers a lesson.
It is what we do with these lessons that matters.
For successful projects, we want to document our effortsand conclusions to repeat the success.
If not successful, we want to document what went wrong toprevent repeating the same mistakes.
UNCLASSIFIED
prevent repeating the same mistakes.
The availability of this type of information can greatlyaccelerate future efforts.
310
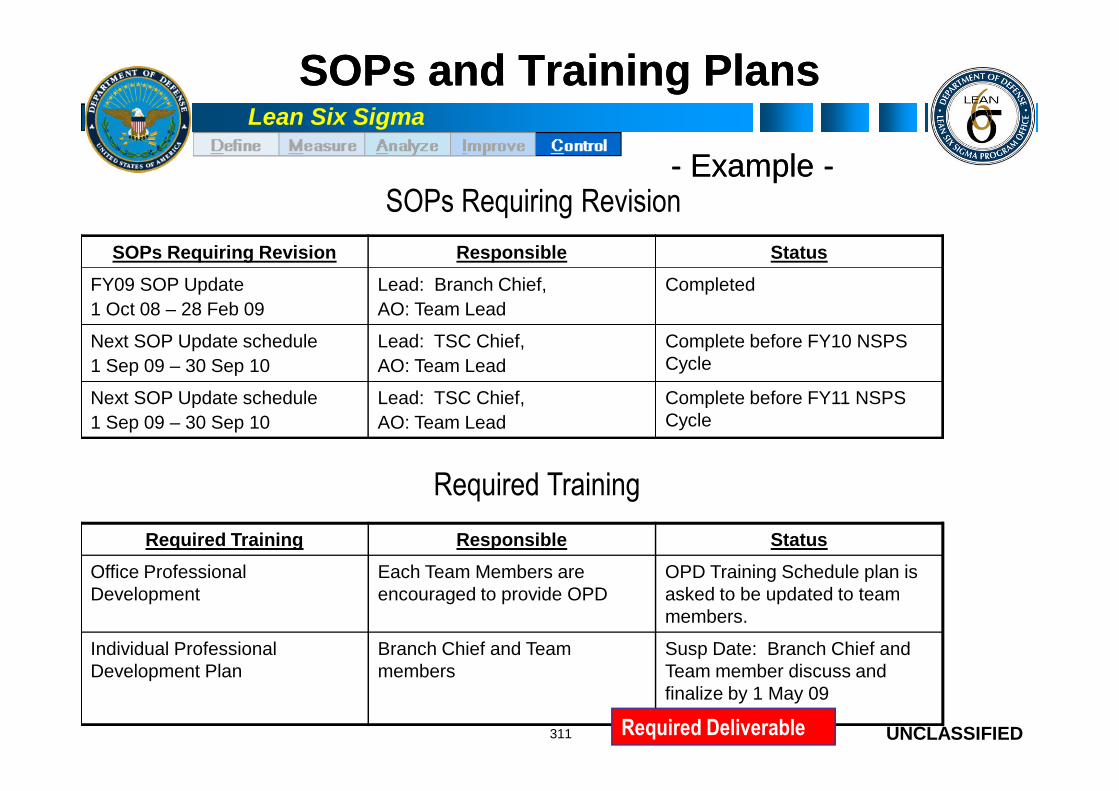
Lean Six Sigma
SOPs andSOPs and Training PlansTraining Plans
SOPs Requiring Revision Responsible Status
FY09 SOP Update
1 Oct 08 – 28 Feb 09
Lead: Branch Chief,
AO: Team Lead
Completed
Next SOP Update schedule
1 Sep 09 – 30 Sep 10
Lead: TSC Chief,
AO: Team Lead
Complete before FY10 NSPSCycle
Next SOP Update schedule Lead: TSC Chief, Complete before FY11 NSPS
SOPs Requiring Revision-- ExampleExample --
UNCLASSIFIED311
Next SOP Update schedule
1 Sep 09 – 30 Sep 10
Lead: TSC Chief,
AO: Team Lead
Complete before FY11 NSPSCycle
Required Training Responsible Status
Office ProfessionalDevelopment
Each Team Members areencouraged to provide OPD
OPD Training Schedule plan isasked to be updated to teammembers.
Individual ProfessionalDevelopment Plan
Branch Chief and Teammembers
Susp Date: Branch Chief andTeam member discuss andfinalize by 1 May 09
Required Training
Required Deliverable

Lean Six Sigma
Visual Process Control ToolsVisual Process Control Tools
• SOP is posted computer desktop for easy reference access.• Mistake proofing system in place - copy of DD214 w/checklist isposted on the counselor’s desk
-- ExampleExample --
UNCLASSIFIED312
Sample DD 214w/ checklist
Optional Deliverable

Lean Six Sigma
Updated Benefits EstimateUpdated Benefits Estimate
-- ExampleExample --Metric Baseline Objective Achieved
Cycle Time 30 days 7 days 5 days
Cost Savings $1.054M $850k $830k
Defect Rate
UNCLASSIFIED313
Additional Benefits/Comments:
The solution was approved 15 May 09 and began fullimplementation on 22 May 09. It is presently beingexecuted by the Process owner with no major issues ordegradation of service to our customers.
Morale has improved significantly with the new layout ofthe office, as indicated by the recent office survey.
Required Deliverable

Lean Six Sigma
Future Projects IdentifiedFuture Projects Identified
• Based on the outcome of this project, the following is a list of“possible areas of concern” and will result in LSS Projects.
PQDR Process
QAR Surveillance Process
-- ExampleExample --
UNCLASSIFIED314314
QAR Surveillance Process
QAR Training Process
MRB Corrective Action Process
NDT Process
Optional Deliverable

Lean Six Sigma
ReplicationReplication OpportunitiesOpportunities
Identify key learnings and data from this project that maybe useful in other areas of the business, or for otherprojects:
Data about upstream process (Input) measures
Data on problem areas outside your team’s scope, butimportant to the business
UNCLASSIFIED
Reduction of waste and non-value added activities
Better utilization of resources
Benchmarking information
Customer requirements
315
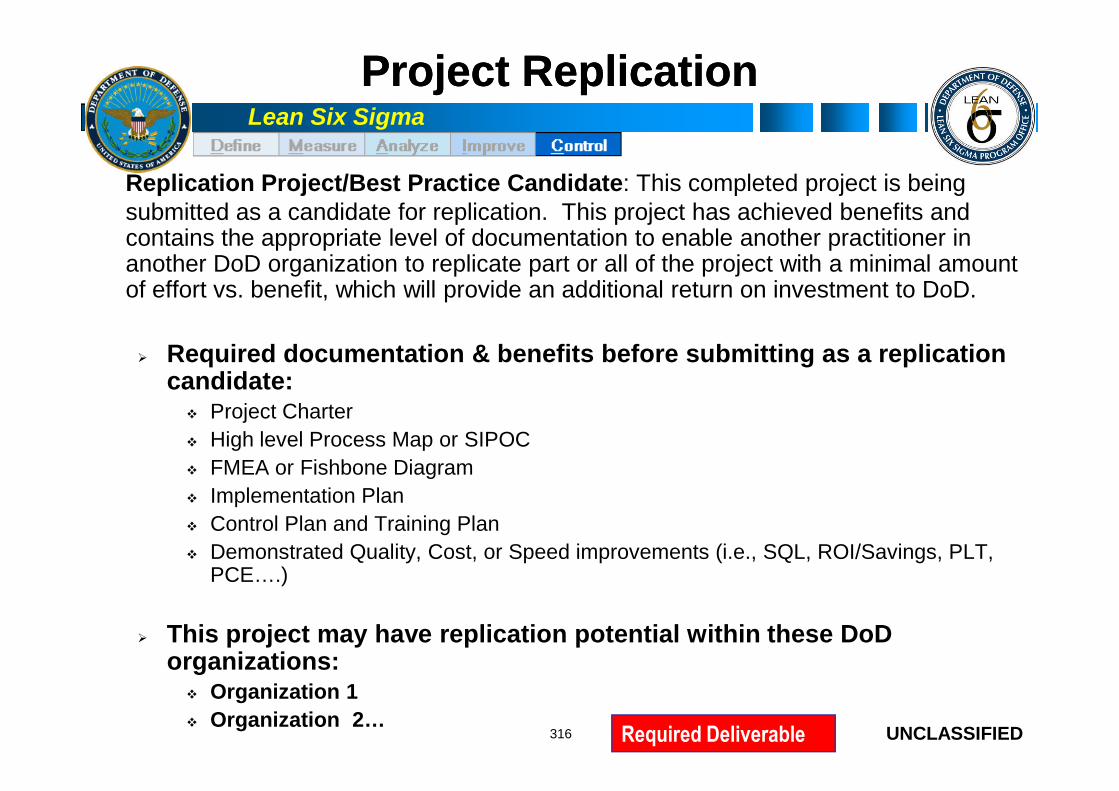
Lean Six Sigma
Project ReplicationProject Replication
Replication Project/Best Practice Candidate: This completed project is beingsubmitted as a candidate for replication. This project has achieved benefits andcontains the appropriate level of documentation to enable another practitioner inanother DoD organization to replicate part or all of the project with a minimal amountof effort vs. benefit, which will provide an additional return on investment to DoD.
Required documentation & benefits before submitting as a replicationcandidate:
UNCLASSIFIED316
Project Charter
High level Process Map or SIPOC
FMEA or Fishbone Diagram
Implementation Plan
Control Plan and Training Plan
Demonstrated Quality, Cost, or Speed improvements (i.e., SQL, ROI/Savings, PLT,PCE….)
This project may have replication potential within these DoDorganizations: Organization 1
Organization 2…Required Deliverable
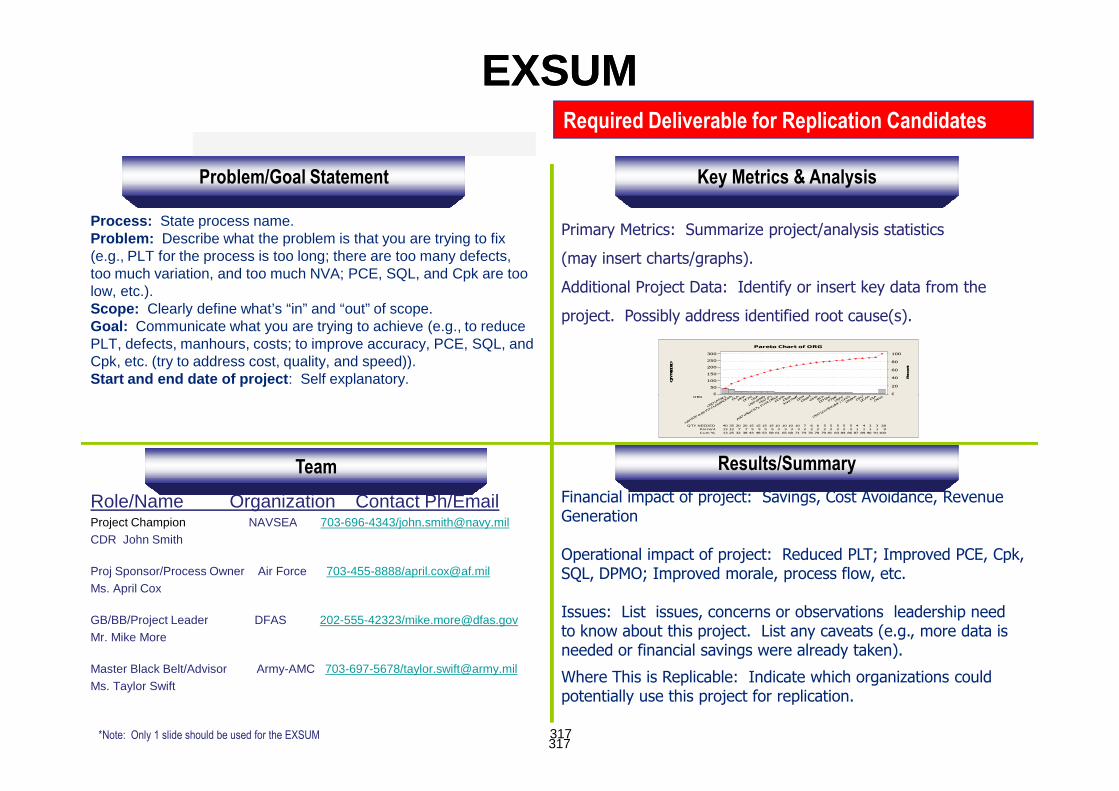
EXSUMEXSUM
Process: State process name.Problem: Describe what the problem is that you are trying to fix(e.g., PLT for the process is too long; there are too many defects,too much variation, and too much NVA; PCE, SQL, and Cpk are toolow, etc.).Scope: Clearly define what’s “in” and “out” of scope.Goal: Communicate what you are trying to achieve (e.g., to reducePLT, defects, manhours, costs; to improve accuracy, PCE, SQL, andCpk, etc. (try to address cost, quality, and speed)).Start and end date of project: Self explanatory.
Problem/Goal Statement Key Metrics & Analysis
Primary Metrics: Summarize project/analysis statistics
(may insert charts/graphs).
Additional Project Data: Identify or insert key data from the
project. Possibly address identified root cause(s).
ORG erAAUAO)F
&E
&EASMNaf
fAAceP )R)ASDAAM
)L)
300
250
200
150
100
50
0
100
80
60
40
20
0
QTYNEEDED
Percent
Pareto Chart of ORG
Required Deliverable for Replication Candidates
317317
Results/SummaryTeam
Role/Name Organization Contact Ph/EmailProject Champion NAVSEA 703-696-4343/[email protected]
CDR John Smith
Proj Sponsor/Process Owner Air Force 703-455-8888/[email protected]
Ms. April Cox
GB/BB/Project Leader DFAS 202-555-42323/[email protected]
Mr. Mike More
Master Black Belt/Advisor Army-AMC 703-697-5678/[email protected]
Ms. Taylor Swift
Financial impact of project: Savings, Cost Avoidance, RevenueGeneration
Operational impact of project: Reduced PLT; Improved PCE, Cpk,SQL, DPMO; Improved morale, process flow, etc.
Issues: List issues, concerns or observations leadership needto know about this project. List any caveats (e.g., more data isneeded or financial savings were already taken).
Where This is Replicable: Indicate which organizations couldpotentially use this project for replication.
QTY NEEDED 10 10 10 10 7 6 6 5 5 540 5 5 4 4 3 3 2835 20 20 15 15 15 15
Percent 3 3 3 3 2 2 2 2 2 213 2 2 1 1 1 1 912 7 7 5 5 5 5
Cum % 61 65 68 71 74 76 78 79 81 8313 84 86 87 89 90 9110025 32 38 43 48 53 58
ORG
Other
DIA
DCAA
DAU
DARP
A
USD
(Comptro
ller/CFO
)
USA
F
PA&
E
DOT&
EBT
AW
HS
DA&M
DON
JointS ta
ff
DIS
A
DCMA
ASD
(NII/C
IO),
Fro
ntOffice
USD
(P)
USD
(P&R)
USA
DF A
SMDA
DLA
LAPT
OP(L
SSPO
CLA
SSRO
OM)
USD
(AT&
L)0 0
*Note: Only 1 slide should be used for the EXSUM

Lean Six Sigma
Completed Project “StoryboardCompleted Project “Storyboard””
Define
MeasureAnalyze
SigmaPerformance Level of
1.3BUS CASE: Be #2 Fin Service Provider
GOAL: Reduce Loan/Lease CT from9.2 to 8.0 days by July 1
FIN IMPACT: $2.7M per year
Project Charter1.2 DayCCR Gap
-- ExampleExample --
UNCLASSIFIED318
Officer Work & Turnover, Waiting, & AutomationAffect CT; Job Aids affect Variation in CT
ImprovePilot Plan
Loan orLease
ScreenEntry
ColorPrintouts
Rewards& Recog
“Officer performsboth” & “Officers
changed”,eliminated as
contributors to highcycle time.
Control
Optional Deliverable

Lean Six Sigma
The Six Sigma Tollgate ToolThe Six Sigma Tollgate Tool
Project Charter Problem Statement Defect Definition Goal Statement Project Scope Business Impact/Case
Value Stream Map/ Detailed ProcessMap
Potential Xs Fishbone Diagram
“To Be” Process Map /ValueStream Map
Process Control Plan
Cross Functional Team Team Selection/Launch
Data Collection Plan Measure Systems Analysis Data Collected
Critical Xs Cause & Effect
Matrix XY Matrix
Improvement Strategy Improvement Model “X” Improvement Target
Replication Opportunities
Measurable Y Voice of
Customer (VOC) Customer Specs Voice of
Business (VOB)
Baseline Data (as-is processperformance)
Run Chart; Histogram;Mean/Stand. Dev
Process Capability (CT) Process Lead Time (CT)
FMEA
Risk Analysis Risk Mitigation Plan
Mistake Proofing Project Documentation ofrevised policies, SOP’s,procedures, and training(Optional)
Define Measure Analyze Improve Control
UNCLASSIFIED319319
Business (VOB) Process Lead Time (CT) Process Cycle Efficiency (CT) Sigma Level
Project Plan/Timeline Statistical Analysis (Optional): Time Series Plots;
Control Charts; BoxPlots
Statistical Analysis(recommended):
Hypothesis Testing (ANOVA,2 Sample T); Pareto Analysis;Takt Rate/Time Analysis, etc.
FMEA Risk Analysis Risk Mitigation
Plan
Visual Process Control Tools(Optional)
SIPOC High Level
Process Map
Control Charts Required for BB Recommended for GB
Optional: Required for BB Recommended for
GB
Control Charts Required for BB Recommended
for GB
Optional: Required for BB Recommended for
GB
I accept the DefineTollgate. Signed:
I accept the MeasureTollgate. Signed:
I accept the AnalyzeTollgate. Signed:
I accept the ImproveTollgate. Signed:
I accept the ControlTollgate. Signed:
(Sponsor) (Sponsor) (Sponsor) (Sponsor) (Sponsor)
(Process Owner) (Process Owner) (Process Owner) (Process Owner) (Process Owner)
(MBB) (MBB) (MBB) (MBB) (MBB)
(Finance Owner) (Finance Owner) (Finance Owner)Required Deliverable

Lean Six Sigma
Control Tollgate QuestionsControl Tollgate Questions
Has the team prepared all the essential documentation for the improved process,including revised/new SOPs, training plan and a process control system/report?
Has the necessary training for process owners/operators been performed?
Have the right metrics (Xs/Ys) been selected and documented as part of the ProcessControl System to monitor performance of the process and the continuedeffectiveness of the solution? Has the metrics briefing plan/schedule beendocumented? Who owns the measures? Has the Process Owner’s job descriptionbeen updated to reflect the new responsibilities? What happens if minimum
UNCLASSIFIED
been updated to reflect the new responsibilities? What happens if minimumperformance is not achieved?
Has the solution been effectively implemented? Do results data confirm that thesolution has achieved the goals defined in the Project Charter?
Has the Financial Benefit Summary been completed and validated?
Has the process been transitioned to the Process Owner, to take over responsibilityfor managing continuing operations? Do they concur with the control plan?
Have other opportunities which weren’t able to be addressed given to management?
Have lessons learned been captured?
Have replication opportunities been identified and communicated to other agencies?
Has the hard work and successful efforts of our team been celebrated?320

Lean Six Sigma
What We Have CoveredWhat We Have Covered
Identifying the appropriate controls and develop a sustainment planto validate and monitor the continued success of implementedprocess improvements.
Developing an appropriate training plan for affected individuals toensure continued support of the improved process.
Identifying the expected future benefits resulting from the improvedprocess.
Demonstrating the ability to communicate to the project sponsor
UNCLASSIFIED
Demonstrating the ability to communicate to the project sponsoradditional improvement and replication opportunities identified in thecurrent project.
Identifying and document the lessons learned and ensure that thoselessons and process successes are disseminated to participants infuture process improvement opportunities.
Recognizing the importance of rewarding/recognizing team membersand celebrating their success.
Explaining the process of formally documenting and handing off theproject to the process owner.
321

Lean Six Sigma
QuestionsQuestions
UNCLASSIFIED322
Recommended