1
SELF-ENFORCING POWERSHARING IN WEAK STATES
Philip Roessler Department of Government College of William and Mary
David Ohls School of International Service
American University [email protected]
Forthcoming in International Organization

2
Acknowledgments
The authors are listed in reverse alphabetical order; equal authorship is implied. Earlier versions of this paper were presented at the Global Governance, Politics, and Secutiy (GGPS) Research Colloquium at the School of International Service, American University; Annual Meeting of the American Political Science Association, Washington, D.C., August 28-31, 2014; Africa Seminar Series at London School of Economics; African Studies Centre at Oxford University; Center for Comparative and International Studies (CIS) Colloquium at ETH-Zurich; and Issues in African Development Seminar at the Institute of African Development, Cornell University. We are grateful to the seminar participants for their valuable advice and suggestions. We would also like to thank the editors at IO and two anonymous referees for incisive feedback. Kyle Titlow (W&M ’15) provided outstanding research assistance.

3
Philip Roessler Department of Government College of William and Mary
David Ohls School of International Service
American University [email protected]

4
SELF-ENFORCING POWERSHARING IN WEAK STATES
Philip Roessler Department of Government College of William and Mary
David Ohls School of International Service
American University [email protected]
Powersharing, in which elites from rival societal groups agree to share control of the central government, is found to be a key source of domestic peace—enabling states to escape devastating cycles of exclusion and civil war. Yet the conditions giving rise to inclusive governance are not well-understood. In this paper we fill this gap. In contrast to existing scholarship that emphasizes the importance of external third-party mediation or strong formal institutions, we point to the structural roots of powersharing—in which political inclusion stems from the distribution of societal power and the balance of threat capabilities it produces. Only when both the ruling group and a given rival group possess strong mobilizational capabilities, such that each could credibly threaten to recapture state power if excluded from the central government, does self-enforcing powersharing emerge. A strong rival induces the ruler to commit to powersharing and to reluctantly accept coup risk over civil war risk. The ruling group’s own threat capabilities, in turn, constrain rivals from trying to convert their share of power into absolute power. Supported by extensive quantitative and qualitative evidence with particular reference to weak states in sub-Saharan Africa, the paper sheds light on the conditions under which the distribution of violence within a state underwrites a peaceful and productive equilibrium. In doing so, it rethinks how scholars approach the study of civil war—rather than conceiving of it in terms of effective resistance, it models civil war as a contest for state power shaped by groups’ capabilities to project force in the capital.

5
Violent ethnic conflict has been one of the key causes of mass killing, economic
underdevelopment, regional instability, and inter-state conflict in the world since World
War II.1 Such conflicts are particularly concentrated in weak states, which lack effective
institutions to regulate the distribution of power and broadcast authority.2 Yet not all
weak states are plagued by ethnically-based civil wars. In some, large-scale political
violence has been averted or managed through powersharing, in which rival groups agree
to share control of the state.3 Understanding the sources of durable powersharing is
important to address the scourge of civil war—the dominant mode of political violence
in contemporary international affairs.
Existing research tends to focus on the importance of either formal institutions4 or
external third-party intervention.5 While both factors can serve as key levers to reduce
uncertainty, most powersharing regimes since World War II have emerged without
1 Gleditsch, Salehyan, and Schultz 2008; Gurr 2000; Harff 2003; Salehyan 2009.
2 Fearon and Laitin 2003; Hironaka 2005.
3 Horowitz 1985; Lijphart 1977; Rothchild 1997; Wimmer, Cederman, and Min 2009.
4 Lijphart 1977; Magaloni, 2008; Norris 2008.
5 Hartzell and Hoddie 2007; Walter 2002.

6
external intervention, and in most weak states informal institutions have greater
influence than formal ones.6
In such quasi-anarchical environments, in which societal groups cannot rely on
strong institutions or external actors to enforce powersharing, the distribution of power
is ultimately determined by the threat of force.7 Rivals must be able to credibly threaten
a rebellion that would oust the ruler should he reject or violate powersharing.8 But
herein lies a paradox: the threat of force is necessary to hold rulers accountable and
sustain powersharing but, as it can also be abused by rivals to grab and monopolize
power for themselves, the shadow of violence can incite the very exclusion it seeks to
deter. When does the threat of force lead to a peaceful and productive equilibrium
underwritten by powersharing and when does it merely reproduce the exclusion-conflict
cycle? Addressing this question is critical to understanding the foundations of political
order. We argue the roots of peaceful powersharing lie in the distribution of societal
power. In contrast to the international relations literature, in which the study of the
balance of power has been central to theories of conflict and cooperation under anarchy,9
6 Helmke, 2004; Reno 1998.
7 North, Wallis, and Weingast 2009; Svolik 2012.
8 Acemoglu and Robinson 2006; Boix and Svolik 2013; Svolik 2012.
9 Copeland 2000; Powell 1999.
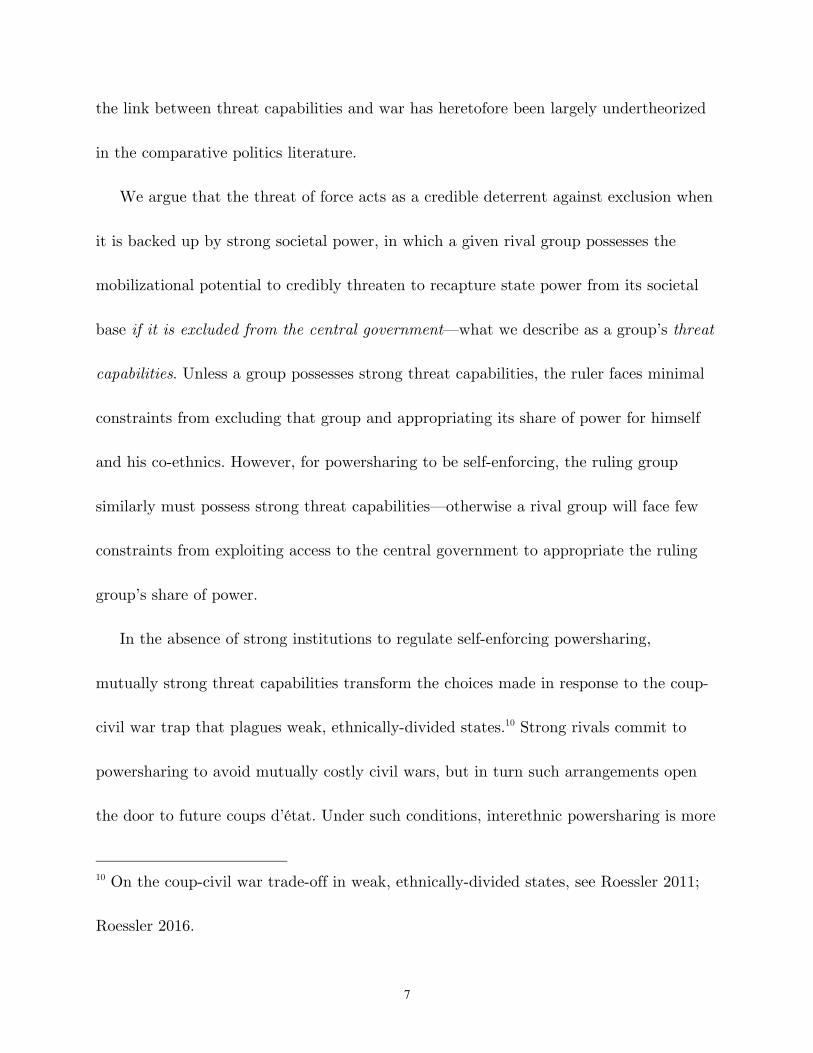
7
the link between threat capabilities and war has heretofore been largely undertheorized
in the comparative politics literature.
We argue that the threat of force acts as a credible deterrent against exclusion when
it is backed up by strong societal power, in which a given rival group possesses the
mobilizational potential to credibly threaten to recapture state power from its societal
base if it is excluded from the central government—what we describe as a group’s threat
capabilities. Unless a group possesses strong threat capabilities, the ruler faces minimal
constraints from excluding that group and appropriating its share of power for himself
and his co-ethnics. However, for powersharing to be self-enforcing, the ruling group
similarly must possess strong threat capabilities—otherwise a rival group will face few
constraints from exploiting access to the central government to appropriate the ruling
group’s share of power.
In the absence of strong institutions to regulate self-enforcing powersharing,
mutually strong threat capabilities transform the choices made in response to the coup-
civil war trap that plagues weak, ethnically-divided states.10 Strong rivals commit to
powersharing to avoid mutually costly civil wars, but in turn such arrangements open
the door to future coups d’état. Under such conditions, interethnic powersharing is more
10 On the coup-civil war trade-off in weak, ethnically-divided states, see Roessler 2011;
Roessler 2016.

8
likely, and violent contestation for power—when it does occur—takes the form of coups,
which lead to a change in executive authority but do not significantly disrupt the
relative distribution of political power.
We empirically test these theoretical expectations both qualitatively and
quantitatively, focusing on sub-Saharan Africa from independence to 2013. We expect
the distribution of societal power to have a particularly important effect on
powersharing in post-colonial Africa given the “strong societies and weak states” political
order that has emerged after decolonization.11 Unable to rely on strong formal
institutions to regulate society, political structure and societal peace hinges on a ruler’s
ability to strike alliances and share power with Big Men embedded in rival ethnic
groups.
Quantitatively, we use data from the Ethnic Power Relations (EPR) 2014 dataset12
and a compatible geo-referenced dataset, GeoEPR,13 to develop a parsimonious
operationalization of threat capabilities derived from a group’s ethnic geography—its
location and size as a proportion of the population—with the expectation that the larger
and the closer to the capital city a group is, the more likely its members can credibly
11 Migdal 1988.
12 Vogt et al. 2015.
13 Vogt et al. 2015; Wucherpfennig et al. 2011.

9
threaten to take power if excluded from the central government. Statistical analysis of
233 politically-relevant ethnic groups in 40 sub-Saharan African countries demonstrates
that ethnic powersharing is most likely when the ruling group and a non-ruling group
possess strong threat capabilities. Strikingly, this is the case despite an elevated risk of
coups. In contrast, when the threat capabilities of either the ruler or the rival are weak,
rulers are more likely to reject powersharing. This strategy is effective at coup-proofing
the regime from ethnic rivals but at an increased risk of civil war.
Qualitatively, we employ a diverse case selection approach to explore the dynamics
of ethno-political bargaining, coups and civil war across different distributions of societal
power. The logic of self-enforcing powersharing accounts for the puzzling historical
pattern seen in Ghana and Benin, in which ethnic rivals traded executive power via
coups yet no one group sought to monopolize power and coup-proof their regimes using
ethno-political exclusion. This stands in stark contrast to Sudan, Liberia, and South
Africa, where policies of ethno-political exclusion were chosen by rulers and their co-
ethnics to monopolize their hold on power, leading to civil war.
This paper advances existing knowledge on powersharing and on civil war in several
important ways. First, it offers a novel theory of self-enforcing powersharing, explaining
how rival groups in weak states can credibly commit to divide economic rents and
political power in a quasi-anarchic environment. While there has been a substantial

10
literature linking civil war to the inability of societal rivals to commit to share power,14
how groups in weak states overcome this challenge remains a key puzzle. Prior work
either emphasizes exogenous policy solutions—external third-party mediation15—or
attributes powersharing to formal institutions, without accounting for why elites are
willing to constrain their power in the first place.16 We diverge from this and instead
offer an internal, structural theory of powersharing that links it to the distribution of
societal power and the balance of threat capabilities between ethnic rivals.
Second, it incorporates the study of civil war into a broader framework that
considers the competing risks rulers face to their hold on power. Civil war studies,
especially the study of ethnic-based conflict, continue to be dominated by a focus on
grievances or opportunity structure,17 often failing to consider how rulers assess
competing threats and why they are unable to simply increase concessions in the face of
14 Cederman, Wimmer, and Min 2010; Horowitz 1985; Posen 1993; Roessler 2011;
Wimmer, Cederman, and Min 2009.
15 Hartzell and Hoddie 2007; Walter 2002.
16 Lijphart 1969; Magaloni 2008.
17 Cederman, Gleditsch, and Buhaug 2013; Collier, Hoeffler, and Rohner 2009; Gleditsch
and Ruggeri 2010.

11
an aggrieved population and weakened capacity to repress.18 A bargaining framework is
essential to address these questions.19
Third, this bargaining approach leads us to challenge the conventional view of civil
war as a form of “effective resistance,”20 in which guerillas win by not losing.21 We
conceive of groups mounting peripheral insurgencies holed up in distant mountainous
terrain as possessing low threat capabilities; they are tolerated exactly because they are
weak. The fact that most theorization of civil war draws from this stylized version of a
guerilla army is problematic because it reveals a selection problem in the study of civil
war—inferences are drawn disproportionately from observable (i.e., weak) insurgencies,
as those groups with the greatest potential to wage violent opposition are compensated
18 Fearon 2010.
19 For earlier applications of the bargaining approach to ethnic-based conflict, see
Cetinyan 2002; Fearon 1995. See also the recent contributions by Francois, Rainer, and
Trebbi 2015 and Wucherpfennig, Hunziker and Cederman 2016, which posit that rulers
are strategic in their use of powersharing and target groups with greater conflict
potential.
20 Sambanis 2004.
21 Kissinger 1969.

12
to not do so.22 Reconceptualizing civil war as a contest for state power, rather than as
simply conflicts in which the opposition is able to avoid defeat at the hands of the
government, shows that (in contrast to the conventional wisdom) strong threat
capabilities underwrite peace, not conflict, as they constrain the ruler from reneging on
powersharing. This represents a departure from some power parity theories of interstate
conflict that suggest equal capabilities worsen information asymmetries, thus increasing
the risk of bargaining failure and war.23 While parity may obscure who will triumph in
war, the high mutual costs of achieving such an outcome will be readily apparent. This
will be particularly the case in the intra-state context, where decisive victory is unlikely
to be achieved short of militarily vanquishing the opposing side. The shadow of total
war thus pushes both sides to choose ethnic accommodation.
Fourth, this theoretical framework helps account for why large, weak states such as
Sudan, Democratic Republic of Congo, Angola, Chad, and Ethiopia are particularly
prone to ethnic exclusion and civil war—a problem particularly acute in sub-Saharan
Africa.24 Big states tend to contain a greater number of distant groups with accordingly
22 This is a key insight that Cetinyan 2002 makes.
23 Reed 2003. On power parity and war, see also Kugler and Lemke 1996; Organski and
Kugler 1980.
24 Clapham 1996; Clapham 2006; Green 2012.

13
low threat capabilities, which lack the ability to hold the ruler accountable for violating
powersharing.
The paper proceeds as follows. Section two analyzes the problem of powersharing in
weak states. Section three explores how the distribution of societal power and the
balance of threat capabilities underwrite durable powersharing. The fourth and fifth
sections test the threat capabilities theory of powersharing, drawing on quantitative and
qualitative data, respectively. Section six concludes with the theoretical implications and
identifies avenues for future research.
The Problem of Powersharing in Weak States
Powersharing entails the joint participation of elites of two or more rival groups in a
governing coalition, in which both sides agree to parcel out the rents that come from
control of the state and each refrains from using force to grab a larger share of power.25
25 We primarily employ a dyadic framework to analyze ethno-political bargaining to
capture the primacy of bilateral ties in weak states, given underlying institutional and
structural conditions that enable leaders to use divide-and-rule policies and selective
incentives to inhibit the emergence of reliable inter-ethnic coalitions. Acemoglu, Verdier,
and Robinson, 2004; Arriola 2012. In the Online Appendix we relax this assumption and
analyze alternative specifications that model cross-group and coalition dynamics to take

14
This implies two necessary conditions. First, the leader in power must choose to bring a
given rival into the government. Rather than attempt to rule the country unilaterally,
keep potential opposition at arms-length, and extract all of the rents accompanying
dominant control of the state apparatus, the ruler must prefer accommodation and
accept the costs and risk of giving rivals positions of some power. Second, the rival
group, once invited to participate in the central government, must accept its share of
power and refrain from leveraging its privileged position to attempt to overthrow the
government in order to gain absolute power.
In accounting for powersharing, extant research tends to focus on the role of formal
institutions and external third-party mediators. The institutional approach emphasizes
the importance that formal rules, such as consociational arrangements,26 and political
organizations, such as parties and legislatures,27 play in helping to regulate the
distribution of power. Such institutions guarantee minorities representation in
into account the potential relevance of the broader strategic environment. Treisman
2004; Walter 2009. Consistent with our dyadic framework, we see no evidence that
levels of extant powersharing or assuming stable coalitions alter the importance of the
balance of threat capabilities.
26 Lijphart 1969; Lijphart 1977; McGarry and O'Leary 1993.
27 Boix and Svolik 2013; Gandhi and Przeworski 2006; Magaloni 2008.

15
government, constrain rulers, and increase transparency, reducing fear and
misperceptions about opponents’ intentions. External approaches view third-party
enforcers, which can both help to forge a political agreement and coerce or sanction
rivals if they renege on the political agreement, as necessary to overcome the
commitment problem.28 These represent important contributions to the study of
peacemaking in ethnically-divided states, but leave several puzzles unresolved.
Empirically, most powersharing regimes since World War II have emerged without
external intervention, and in many weak states politics is defined by personalistic rule
with limited formal institutionalization.29
28 Walter 2002; Hartzell and Hoddie 2007.
29 Helmke 2004; Jackson and Rosberg 1982. In sub-Saharan Africa, about 47 percent of
non-ruling groups are included in the central government. Yet in countries that have
signed an externally-brokered peace agreement in the previous year, the level of
inclusion is around 27 percent. This suggests first, that external intervention targets
countries with higher-levels of ethno-political exclusion and second, that those countries
that have avoided war through powersharing have been able to do so without
intervention, despite the weakness of formal institutions. (Peace agreement data are
from Högbladh 2012.)

16
In the absence of third-party intervention and strong institutions, what sustains
powersharing? One of the few levers that groups can employ to hold each other
accountable is the threat of violence.30 However, the problem with violence as a tool of
deterrence is it can also be used for offensive purposes—to not only protect one’s share
of power but to usurp the power of others.31 Following from Hobbes, this represents the
fundamental barrier to the emergence of political order.32
Analogous to the interstate security dilemma, the inability of rival factions to
credibly commit not to use force to lock-in a larger share of power is a key source of
instability in weak states. In weak, ethnically-divided states this commitment problem
gives rise to a coup-civil war trade-off. 33 The lack of administrative capacity to
broadcast power over their territory and citizens forces weak state rulers to strike
alliances with rivals to extend the reach of the regime and prevent societal-based
rebellion. But bringing one’s rivals to the center of power is risky as it lowers the costs
30 Svolik 2012. Wantchekon 2000, 344 notes that the “most important element of a
constitution is that it depends for its enforcement…on sanctions and incentives internal
to the political system.”
31 Jervis 1978.
32 Hobbes 1986 (1651).
33 Roessler 2011; Roessler 2016.

17
they face to seize power for themselves in a coup d’état.34 When rulers are uncertain of
their rivals’ commitment to powersharing and fearful of losing sovereign authority they
often employ ethno-political exclusion in a bid to consolidate their hold on power.
Although this may lead to civil war, under certain circumstances rulers see armed
rebellion from outside their government as a lesser threat than a coup from within. This
model is consistent with the outbreak of a number of prominent civil wars such as the
Biafran War, the Rwandan genocide, and successive civil wars in Afghanistan, as well as
contemporary conflicts in South Sudan, Syria, and Iraq.35 Yet this outcome is not
ubiquitous. In some weak states, ruling groups have consistently chosen powersharing—
34 Coups and rebellions are distinguished by the organizational basis of the
anti-regime technique. Coup conspirators leverage partial control of the state resources
and materiel in their bid to capture political power, whereas rebels or insurgents lack
such access and build a private military organization to challenge the central
government and its military.
35 Hirsch and Smith 2014; Luckham 1971; Prunier 1995; Robinson 2012; Roessler 2013;
Rubin 2002. South Sudan, Syria and Iraq provide direct examples of rulers choosing to
violate or reject powersharing with an important rival social group as a means to
protect their own hold on power, at the price of large-scale political violence.

18
despite an elevated (and sometimes realized) risk of coup.36 What accounts for whether
rival groups choose, and are able to sustain, powersharing in the shadow of the coup
d’état? In the next section, we argue that the durability of powersharing is conditional
on a country’s ethnic geography and the balance of threat capabilities it produces
between rival groups.
Threat Credibility and the Origins of Self-Enforcing Powersharing
Balance of Power and Inclusive Governance
Political exclusion is an instrument for the consolidation of power. In denying rivals
access to the central government and increasing the costs they face to seize power,
exclusion is a means for rulers to strengthen short-term regime security37 and maximize
their control of rents. We would expect such a strategy, however, to be conditional on a
36 Roessler 2011 offers evidence that powersharing increases coup risk among included
groups.
37 Exclusion from the central government does not wholly negate the possibility of
orchestrating a coup—one could try to execute a coup remotely by allying with those in
the military or key strategic points within the government. But it does make it much
more difficult by increasing the coordination costs anti-regime elements face.

19
rival’s mobilizational potential.38 The stronger a potentially excluded group’s capacity to
recapture state power from its societal base, the less appealing such a policy becomes. If
pursuing ethnic dominance at the cost of civil war necessitates an expensive counter-
insurgency campaign with no guarantee of success, the benefits of exclusion dissipate
and may no longer outweigh the costs. Thus an outside group’s societal power and
threat capabilities—the coercive capacity it has independent of what it might gain from
any role in government—represent the key levers it has to hold the ruler accountable if
he attempts to reject or violate powersharing.
The ruler’s commitment to powersharing, however, is not just a function of another
group’s threat capabilities but also of his own group’s societal power. Unless the rival
faces the same constraints as the ruling group, such that it too would face a strategically
costly civil war if it tried to monopolize power after a coup, there is little preventing it
from exploiting access to the central government to appropriate the ruling group’s share
of power. Thus, for powersharing to be self-enforcing, such that neither group has
incentives to exclude the other, the costs of reneging on powersharing must constrain
not just the incumbent, but constrain in expectation any actor that may seize power in
the future. Only when both sides see little strategic benefit to choosing exclusion will
38 Cetinyan 2002; Francois, Rainer, and Trebbi 2015; Wucherpfennig, Hunziker and
Cederman 2016.

20
each reluctantly accept powersharing. Thus, balances of power are necessary in order to
discourage either side from an attempt to seize total control as well as to reassure both
sides that the other is unlikely to do so. While parity can exacerbate information
asymmetries and uncertainty about whom would ultimately prevail in war,39 in an intra-
state context, in which neither side can retreat to its sovereign territory, politically
eliminating or neutralizing one’s rival is unlikely to be achieved short of complete
military vanquishment. The readily apparent mutual costs of such a total war will
encourage ethnic accommodation.
The presence of mutually strong civil war capabilities—and the shadow of total
war—does not resolve (initially, at least) the commitment problem at the heart of the
coup-civil war trap. Without agreed-upon rules or institutions regulating the
distribution and transfer of sovereign power, elites embedded in each group are still
vying to control the executive (and gain the international recognition and rents that
come with it), and anticipate their rivals have the same intentions. This can lead to
political instability and increase coup risk.40 Under such conditions, however, rival
groups reluctantly choose to attempt powersharing and may trade executive authority
via coups—which do not significantly alter the relative distribution of power—rather
39 Reed 2003.
40 Harkness 2014; Horowitz 1985.

21
than accept the high mutual costs associated with a war for exclusive control of the
state.
This is a striking and counter-intuitive implication of the theory: mutually strong
threat capabilities induce rulers to accept coup risk over civil war risk. Why would
authoritarian rulers adopt a strategy that brings about such high individual political
risks? This seemingly goes against a number of seminal studies on political survival,
which suggest the opposite: authoritarian rulers, in an effort to secure their political and
physical survival, have few qualms about using exclusion and other strategies that may
be in their personal interest but which bring about devastating costs for their citizens
and the state, such as economic crises, international conflict, civil war, and state
collapse.41
To account for this, it is important to distinguish between the interests of the ruler
and interests of the ruling group in which the ruler is embedded (and upon whose
support the ruler depends to stay in power).42 While rulers may prefer to use exclusion
to substitute coup risk for civil war risk to protect their personal hold on power, under
conditions of mutually strong threat capabilities this offers little political or strategic
41 Bates 2008; Bueno de Mesquita et al. 2003; Chiozza and Goemans 2011; Reno 1998;
Roessler 2011.
42 North, Wallis, and Weingast 2009.

22
advantage for the ruling group as a whole, whose relative share of power is secured by
its societal power but also constrained by the strength of its rival. Consequently, in the
face of a devastating civil war—the costs of which would be borne by the group’s
members—the ruling group is unlikely to support the ruler’s rejection of powersharing in
a bid to consolidate his personal hold on power.
The same does not hold for weak groups, however, which lack the capabilities to
reclaim power once displaced from the central government. For these groups, the ruler’s
and the group’s interests are better aligned. A coup from their stronger rivals threatens
not only the individual ruler’s position, but also the group’s relative share of power,
since it lacks the strength to deter the new ruling group from monopolizing power.
Under these conditions, both the ruler and the ruling group favor exclusion, and are
more willing to accept the costs that come along with it.
Rethinking Civil War
In conceiving of civil war as an instrument of deterrence and lever of political
accountability, we diverge from existing scholarship on the subject. Most studies equate
civil war with insurgency, which Fearon and Laitin define as “a technology of military
conflict characterized by small, lightly armed bands practicing guerrilla warfare from

23
rural base areas.”43 The success of an insurgency is often measured based on a group’s
ability to effectively resist the government—that is, inflict at least a minimal level of
costs while avoiding defeat.44 As Henry Kissinger famously quipped, “the guerrilla wins if
he does not lose.”45 Equating civil war with armed insurgency has led scholars to focus
on those conditions that “render insurgency more feasible and attractive”46 and make it
hard for the government to effectively defeat the insurgents. Such factors include
distance from the capital, sanctuary in neighboring countries, mountainous terrain, and
ethnic group concentration.47
We instead conceive of civil war as a contest for state power between the central
government and an organized, armed opposition movement. Rebellion is the lever a
given rival employs, or threatens to employ, to gain a share of power and rents. A
group’s civil war capability, then, is its potential capacity to contest for control of state
power in a dynamic and uncertain bargaining environment. This approach suggests a
43 Fearon and Laitin 2003, 75.
44 Collier 2004; Sambanis 2009.
45 Kissinger 1969, 214.
46 Fearon and Laitin 2003, 75.
47 Buhaug, Cederman, and Rød 2008; Fearon and Laitin 2003; Salehyan 2009;
Weidmann 2009.

24
different conception of capabilities than is conventionally used in the civil war literature.
We expect groups located in remote, mountainous areas far from the capital to pose a
weaker, not stronger, civil war threat. Though these factors make it difficult for the
government to project power over such groups, they also inhibit the use of force in the
opposite direction, constraining the group’s ability to challenge the center. In contrast,
we expect large groups, located closer to the capital, with control over valuable
resources and economic markets, to have the greatest capacity to credibly threaten to
seize control of the central government and thus lock-in a share of power.
Balance of Threat Capabilities and Powersharing: Hypotheses
We argue that strong threat capabilities produce durable (though sometimes fluid)
powersharing, in which rivals prefer inclusion—even when it risks trading power via
coups—to engaging in mutually costly civil wars for absolute power. This leads to our
first hypothesis:
H1: When both the ruling group and rival group have strong threat capabilities, the rival is included in the central government, reducing civil war risk but increasing coup risk.
When groups have asymmetric threat capabilities, however, self-enforcing
powersharing is significantly less likely. While both sides may wish to divide rents and
avoid costly conflict, the power differential undermines any agreement.

25
Most obviously, a weak group bargaining with a strong ruling group lacks the threat
capabilities to hold the ruler accountable if it violates the terms of a deal. The stronger
group’s inability to credibly commit itself to not exploit its greater bargaining leverage
induces the weaker group to stay on a war footing or face political irrelevance. This
increases the likelihood of protracted conflict.48
Additionally, because the weak group’s low civil war capabilities render them
unlikely to be able to reclaim power if they lose access to the central government, they
are more likely to approach political bargaining as a one-shot game and adopt extreme
policies (e.g., coup attempts followed by consolidating power in a repressive ethnocracy)
to hold on to power at all costs. This further drives a strong group toward exclusion as
it sees the marginal costs of a relatively less-threatening civil war as being significantly
lower than the marginal costs of a coup. This leads to our second hypothesis:
H2: When the ruling group’s threat capabilities are high and the rival group’s are low, the rival is excluded from the central government, reducing coup risk but increasing the risk of civil war.
Similar dynamics lead a weak ruling group to universally reject powersharing with
either a strong or a weak competitor. Again, the breakdown of powersharing arises from
the weak group’s limited threat capabilities and thus their political vulnerability. When
bargaining with another weak group, neither side possesses the mobilizational potential
48 Fearon 1995; Walter 2002.

26
to hold the other to account if they renege on powersharing. Consequently, both have
strong incentives to eliminate the other from state power before they themselves are
eliminated, leading to ethnic exclusion and civil war. This leads to our third hypothesis.
H3: When the ruling group’s threat capabilities are low and the rival group’s are also low, the rival is excluded from the central government, reducing coup risk but increasing the risk of civil war.
When the competing group is strong, a weak ruling group faces a more acute
dilemma. Powersharing puts the stronger rival in a position to usurp power in a coup,
likely leading to the permanent exclusion of the weak group. But employing exclusion to
prevent such an outcome provokes a strategically costly civil war. Both are bad
outcomes, but losing power via civil war is seen as more uncertain than in a coup in
which its rival already controls a significant share of the state. This leads to our fourth
hypothesis.
H4: When the ruling group’s threat capabilities are low and the rival group’s are high, the rival is excluded from the central government, reducing coup risk but increasing the risk of civil war.
Figure 1 summarizes the theoretical predictions and how they align with H1-H4

27
Figure 1: Threat Capabilities, Self-Enforcing Powersharing and Coup and Civil War Risk
Strong Rival
Weak Rival
Strong Ruling Group
H1: Powersharing and societal peace (despite high coup risk) Powersharing: Yes
Coup risk: High
Civil war risk: Low
H2: War-prone ethnocracies Powersharing: No
Coup risk: Low
Civil war risk: High
Weak Ruling Group
H4: Repressive minority rule (or unstable powersharing) Powersharing: No
Coup risk: Low
Civil war risk: High
H3: Unstable, violent, exclusionary regimes Powersharing: No
Coup risk: Low
Civil war risk: High
Quantitative Empirical Evidence
To assess the threat capabilities theory of powersharing, we focus our analysis on the
subset of states in sub-Saharan Africa. While we expect the argument to apply to all
weak states with strong, spatially-concentrated societal groups, sub-Saharan Africa
provides a set of comparable states which meet these criteria, with consistent societal

28
data on access to state power49 as well as the ethnicity of those groups launching
rebellions and executing coups.50
There are two primary reasons we would expect the theory to be particularly
relevant to African states. First, the “strong societies and weak states” problem is a
defining characteristic of the political order that emerged after decolonization.51 Unable
to rely on strong state structures to broadcast power, rulers have needed to strike
powersharing deals with ethnic rivals.52 Second, politics in post-independence Africa has
centered almost completely on control of the central government. The decision by
African heads of states at the founding of the Organization of African Unity in the early
1960s to accept the inviolability of colonial state borders has contributed to strong
norms and institutions against state partition, reducing the viability of exit as a policy
response to marginalization or discrimination compared to other regions in the world.53
49 Wimmer et al. 2009.
50 Roessler 2011.
51 Englebert 2002; Herbst 2000; Migdal 1988.
52 Rothchild 1986; Rothchild 1987.
53 Englebert and Hummel 2005.

29
Consequently, even the most peripheral groups have had to target control of the central
government as a means of addressing their material grievances.54
To test our main hypotheses, we estimate models of interethnic powersharing, coups,
and civil war using the Ethnic Power Relations 2014 dataset of ethnic groups in 40
African states from 1946 to 2013.55 The EPR dataset draws from a survey of country-
experts to provide information on the inclusion or exclusion of politically relevant ethnic
groups in central governments across countries in in which ethnicity is politically salient.
Because it does not restrict its analysis to only cabinet posts, but also to representation
within the executive and the military (depending on its de facto power in a given
country), it captures well the actual power structure. Since the theory is about the
interaction between the ruling group and a given rival group, the unit of analysis is a
given incumbent group-non-incumbent group dyad-year, with models including all
54 An increase in support for secession by revisionist neighboring states would change the
bargaining dynamics by strengthening the power of peripheral groups, though
potentially at the cost of increasing risk of inter-state war as seen between Ethiopia and
Somalia in 1977 and 1978.
55 Vogt et al. 2015. We use EPR 2014 available at https://icr.ethz.ch/data/epr/.
Alternative models showing similar results with EPR 3.0 are provided in the Online
Appendix. Wimmer, Cederman, and Min 2009.

30
politically-relevant ethnic groups in relation to the ruling group. Ruling groups are those
identified as being politically-dominant, or having the most politically powerful status
(generally, though not always, this corresponds to the ethnic group of the executive).56
As we are interested in whether particular binary outcomes do or do not occur, we
use a logistic regression specification with standard errors clustered by country to
account for non-independence of ongoing political relationships within states. To
account for temporal dependence within outcomes, each model includes the cubic
polynomial of the dependent variable to approximate the hazard.57
Variables
There are three dependent variables of interest. The first, interethnic powersharing,
is operationalized using a measure of whether a given non-ruling group was included in a
governing coalition in that year. The dichotomous variable, Ethnic powersharing, takes
a value of 1 if the non-ruling group was included in government (coded as monopoly,
56 When there are multiple senior partners in government, we code whichever group
controls the executive as the ruling group. For a list of ruling groups and non-ruling
groups by country-year see the Online Appendix.
57 Carter and Signorino 2010.

31
dominant, senior partner or junior partner) and a 0 if it was not (coded as regional
autonomy, separatist, powerless, or discriminated).58
The second dependent variable, successful coup, identifies whether members of a
given group were key conspirators in a successful coup attempt that year.59 The
dichotomous variable, Successful coup, takes a value of 1 if there was at least one
successful coup and 0 if there was not.
The third dependent variable, group rebellion onset, identifies whether members of a
given ethnic group initiated a major armed rebellion or insurgency against the central
government in a given year.60 The dichotomous variable Group rebellion takes a value of
1 if members of the group launched a rebellion in a given year and 0 if not.
58 We model ethnic powersharing as an incidence variable (that is, we do not drop
ongoing years of inclusion) to capture the dynamic and continuous nature of political
bargaining.
59 Coup data from Roessler 2011, updated through 2013.
60 This measure captures the year a significant number of members of a given group
became involved in a civil war with a minimum of 1000 battlefield deaths. Roessler
2011. We have updated the data through 2013. We also estimated models using
measures of low-level group rebellion onset from ACD2EPR 2014 Vogt et al. 2015, with
substantively similar results.

32
To proxy threat capabilities, we develop a measure based on two factors that
determine a group’s mobilizational potential to threaten the central government. First,
the larger the size of a group, the more popular power it can wield and the larger the
rebellion or uprising it can mobilize.61 To measure this, we use the group’s proportion of
the state’s total population—Group size.62 Second, the more proximate a group is to the
center of power, the lower the mobilizational costs necessary to seize control of the state
apparatus. To measure this, we calculate the Centroid distance in kilometers between
the capital city and the centroid of the ethnic group’s homeland.63 These variables are
61 One barrier to mobilization larger groups face more acutely than smaller ones,
however, is stronger collective action problems. Although not an insignificant obstacle,
we nonetheless expect that (all else equal) representing a larger share of the population
increases, rather than decreases, a group’s capacity to take control of the central
government; in other words, the benefits of a broad societal base outweigh the greater
difficulties of coordination. To the degree this assumption is incorrect, it should
introduce bias against our expected findings, and thus does not undermine the
interpretation of the results.
62 Vogt et al. 2015.
63 Results are nearly identical when using the minimum distance between the capital and
the group’s territory, as shown in the Online Appendix. For the geocoded EPR groups,

33
normalized64 and the distance data are reversed so larger groups and closer groups have
higher values. We then take the arithmetic mean of the distance and size variables to
create a continuous Threat capabilities variable that ranges from 0.03 (least threatening)
to 0.97 (most threatening).65 The variable Ruler threat capabilities measures the
capabilities of the ruling group for a given year using the same approach.
see Vogt et al. 2015; Wucherpfennig et al. 2011. One dimension missing from this
variable that warrants further analysis is how overlapping ethnic homelands and ethnic
homogeneity may affect mobilizational capabilities.
64 As size is measured as a group’s proportion of a given country’s total population, it is
essentially already normalized. Distance is normalized by an absolute distance for all
groups in the sample (the furthest distance between any group’s centroid and a capital
city, which happens to be the Makonde-Yao in Mozambique and Maputo). As we
explain below, we normalize distance the same for all groups across the continent to
reflect the absolute nature of projecting power across space. In the Online Appendix, we
re-run the results using distance normalized at the country-level (the distance between
the capital and the furthest group in a given country). The results are generally similar,
though slightly weaker across most models.
65 The median value of Threat capabilities across all ethnic groups in our dataset is 0.48.
The median values of Group size and Centroid distance are 0.1 and 348, respectively.

34
Using this coding of rival and ruling group threat capabilities, we construct our key
independent variable—the Balance of threat capabilities between the ruling group and a
given competitor. For ease of interpretation, and because we do not expect the joint
effect to necessarily be continuous,66 the balance of threat capabilities measure is
captured through four interaction dummy variables (following Figure 1) based on
whether the ruling group and a given rival have threat capabilities scores above or
below the median for all groups in sub-Saharan Africa.67 Not surprisingly, LH dyads are
66 What matters in expectation is not only the relative threat capabilities of the ruler
and potential competitor but, when threat capabilities are asymmetric, which has the
stronger threat capabilities. A pure continuous interaction term does not allow us to
unpack this categorical effect. In addition, it would inaccurately labeling asymmetric
dyads with one exceptionally strong side as having mutually high threat capabilities.
67 We use the continent median of threat capabilities to construct these quad categories
rather than a country median to reflect the fact that power projection is a function of
both absolute and relational attributes. Whereas size is relational (as any group’s size of
the population is inversely related to other groups in the country), the logistics of
overcoming distance are more absolute (a group’s ability to project power in the capital
across a fixed distance is not affected by the distance other groups must traverse). Using
a common cutpoint for distance allows for the possibility that in some countries,

35
least common, while HH and HL dyads (where the ruling group is strong) are most
common.
Figure 2: Distribution of Ruling Group-Rival Group Dyads by Balance of Threat Capabilities across sub-Saharan Africa, Independence-2013
Strong Rival
Weak Rival
Strong Ruling Group
High-High (HH) Threat Capabilities N= 2,652 Proportion of dyads: 36%
High-Low (HL) Threat Capabilities N= 3,089 Proportion of dyads: 42%
Weak Ruling Group
Low-High (LH) Threat Capabilities N= 617 Proportion of dyads: 8%
Low-Low (LL) Threat Capabilities N= 1,067 Proportion of dyads: 14%
especially large ones, most or all groups have low threat capabilities while in others,
especially small countries, most or all groups have high threat capabilities. Whereas this
points to country size as an important determinant of threat capabilities, we show in the
Online Appendix that the results are robust to controlling for country area or pre-
colonial population density and trade—two factors that Green 2011 finds account for
the size and shape of African states.
36
To evaluate the effect of these various configurations of balance of threat capabilities
on powersharing, coups, and civil war, we estimate specifications containing a number of
control variables that account for alternative explanations of these outcomes:68
• GDP per capita: income-level and state capacity; (lagged) natural log of GDP
per capita in that state-year.69
• Log country population: population size; (lagged) natural log of the total
population of the state.70
• Number of ethnic groups: country’s ethnic diversity; number of politically-
relevant ethnic groups at independence.71
• Institutionalized regime: institutionalization of political power and the stabilizing
effects of party rule; dummy measure of whether a given country is governed by a
constitutionally-based regime (single-party, multi-party, or full democracy) versus
military government.72
68 Unless specified, variables come from the EPR 2014 dataset.
69 Feenstra, Inklaar, and Timmer 2015.
70 Feenstra, Inklaar, and Timmer 2015.
71 In the Online Appendix we also test for the effect of a country’s variation in elevation
and land quality, which Michalopoulos 2012 finds is an important determinant of social
fractionalization.
72 Magaloni 2008; Magaloni, Chu, and Min 2013.
37
• Former French colony: France’s proactive and interventionist foreign policies in
their former colonies;73 dummy measure of a whether a given country was a
former French colony.
• Cold War: increase in externally-brokered powersharing governments in Africa
since the end of the Cold War; dummy measure of whether the year is after 1990.
• Pastcoup: a dummy variable indicating if members of a given group had launched
a successful coup in the past;74
• Pastconflict: a dummy variable indicating if members of a given group had
launched a large-scale rebellion in the past;
• Ongoing rebellion: ongoing civil wars; whether there is an ongoing rebellion in
the country in the previous year.75
• Year: time trends; the year.
Results
The statistical results provide strong support for the paper’s central argument that
mutually strong threat capabilities promote powersharing. The models estimate the
likelihood that members of a given non-ruling group are: included in the central
government (Table 1); lead conspirators in a successful coup (Table 2); or significant
participants in initiating or joining an armed rebellion (Table 3). Since HH dyads are of
primary theoretical interest, we estimate models isolating this type (with all others
73 Clapham 1996.
74 McGowan 2003.
75 Roessler 2011 updated through 2013.

38
combined as the reference category) as well as models including all other types
individually (with HH omitted as the reference category).76
As shown in Table 1, our first hypothesis is broadly supported. HH dyads are
significantly more likely to feature interethnic powersharing (models EP-1, EP-3, and
EP-5). In contrast, HL and LL dyads are statistically significantly less likely to lead to
inclusion when compared to HH dyads (models EP-2, EP-4, and EP-6). Consistent with
the theorized bargaining dynamics, this suggests a group’s inability to credibly threaten
the center reduces horizontal accountability and an equitable distribution of power.
Only two other variables are found to have a robust effect on powersharing: party
76 Because we are interested in the balance of threat capabilities and the influence this
has on the strategic relationships, rather than the individual threat capabilities of
specific groups themselves, we do not include the separate, continuous threat
capabilities variables in the specification. Including these individual capabilities scores
for both ruling and rival groups in robustness models does not affect the statistical or
substantive results for our variables of interest. Models including HL, LH, and LL
indicators with HH as the omitted reference category provide results which are
mathematically equivalent to, and easier to interpret than, an interaction specification
including the HH category and separate indicators for high threat capability status of
ruling and rival groups.

39
institutionalization and the time trend. The former suggests that institutionalized
regimes can support powersharing even under conditions of unfavorable ethnic
geography, whereas the latter suggests that more governments have become more
amenable to powersharing regimes over time. Both of these dynamics require further
analysis to disentangle how weak states can escape adverse societal balances of power.
The origins of institutionalized regimes, especially under disadvantageous power
configurations, remain poorly understood.

40
Table 1: Balance of Threat Capabilities and the Likelihood of Ethnic Powersharing
EP-1 EP-2 EP-3 EP-4 EP-5 EP-6 HH threat capabilities
1.22*** (0.35)
0.62*** (0.21)
0.62*** (0.22)
HL threat capabilities -1.44***
(0.46) -0.70***
(0.26) -0.67**
(0.26) LH threat capabilities -0.26
(0.45) -0.02
(0.34) -0.11
(0.35) LL threat capabilities
-1.18*** (0.40)
-0.78*** (0.27)
-0.94*** (0.30)
Log GDP per capita
0.22
(0.14) 0.23
(0.14) Log country population
0.06
(0.08) 0.08
(0.08) Number of ethnic groups
0.03
(0.05) 0.04
(0.05) Institutionalized regime
0.80*** (0.27)
0.77*** (0.28)
Former French colony
0.63* (0.33)
0.59* (0.32)
Cold War -0.48 (0.37)
-0.46 (0.38)
Year 0.04*** (0.01)
0.04*** (0.01)
t -2.10*** (0.16)
-2.09*** (0.16)
-1.85*** (0.14)
-1.84*** (0.14)
t2 0.10*** (0.01)
0.10*** (0.01)
0.09*** (0.01)
0.08*** (0.01)
t3 -0.00*** (0.00)
-0.00*** (0.00)
-0.00*** (0.00)
-0.00*** (0.00)
constant -0.56 (0.34)
0.65 (0.23)
4.44 (0.37)
5.05 (0.34)
-83.20 (24.79)
-83.86 (25.07)
N states pseudo r2
7404 40
0.06
7404 40
0.07
7404 40
0.76
7404 40
0.76
7127 38
0.77
7127 38
0.78 Notes: This table reports logistic regression estimates. The sample includes all politically-relevant non-ruling group-years in 40 countries in Sub-Saharan Africa from independence (or 1946 for older states) through 2013. The dependent variable is whether the group’s representatives were represented in the central government at the Junior Partner level or above (EPR 2014). Threat capabilities independent variables (HH, HL, LH, LL) indicate whether the ruling group and the given non-ruling group, respectively, are above (high) or below (low) the median threat capabilities for the full sample. Cubic polynomials of time since last powersharing (t, t2, t3) are included to account for temporal dependence. Standard errors are clustered by country and statistical significance is denoted by: ***: p<0.01, **: p<0.05, and *: p<0.10

41
The second part of the argument posits that while mutually strong threat
capabilities produce self-enforcing powersharing, they merely shift, rather than resolve,
the coup-civil war trap that plagues weak, ethnically-divided states. Strong rivals
commit to powersharing even as it opens the door to future coups d’état. Relative to the
prospects of a mutually costly civil war if any side was to try to rule unilaterally,
trading power via coups is a preferable outcome. The ruling group knows that should a
rival successfully seize control over the executive office, it will nonetheless be unlikely to
risk civil war and will be forced to restore powersharing in the future, resulting in a
marginal, rather than absolute, shift in rents from power. Table 2 shows that, consistent
with this expectation, we find that successful coups are statistically significantly more
likely in ethnic dyads characterized by mutually high threat capabilities (models SC-1,
SC-3, and SC-5), particularly compared to HL dyads (models SC-2, SC-4, and SC-6).77
77 Coups are very infrequent in LL dyads as well, consistent with our theoretical
expectations. The only coup in an LL dyad was the assassination of Laurent-Désiré
Kabila in 2001. Given the few number of LL dyads, however, this result tends to be
more sensitive to model specification choices than HL dyads.

42
Table 2: Balance of Threat Capabilities and the Likelihood of Successful Coup SC-1 SC-2 SC-3 SC-4 SC-5 SC-6 HH threat capabilities
1.77*** (0.59)
1.59*** (0.59)
1.15* (0.63)
HL threat capabilities
-2.84*** (0.82)
-2.73*** (0.83)
-2.28** (0.91)
LH threat capabilities
-0.32 (0.60)
-0.13 (0.59)
-0.33 (0.63)
LL threat capabilities
-1.76*** (0.68)
-1.33** (0.53)
-0.89 (0.67)
Log GDP per capita
-0.40 (0.34)
-0.50 (0.35)
Log country population
-0.14 (0.20)
-0.16 (0.19)
Number of ethnic groups
-0.14 (0.10)
-0.09 (0.10)
Institutionalized regime
0.71
(0.43) 0.70* (0.42)
Former French colony
0.29
(0.39) 0.21
(0.40)
Cold War -0.01 (0.85)
-0.00 (0.87)
Year -0.05* (0.03)
-0.05* (0.03)
Past Coup 1.48*** (0.51)
1.29** (0.52)
t -0.28*** (0.10)
-0.29*** (0.10)
-0.22** (0.09)
-0.23** (0.09)
t2 0.01** (0.01)
0.01** (0.01)
0.01*** (0.00)
0.01*** (0.00)
t3 -0.00** (0.00)
-0.00** (0.00)
-0.00** (0.00)
-0.00*** (0.00)
constant -6.27 (0.53)
-4.50 (0.26)
4.49 (0.72)
-2.87 (0.41)
103.35 (59.46)
104.20** (58.91)
N states pseudo r2
7415 40
0.06
7415 40
0.08
7415 40
0.08
7415 40
0.11
7137 38
0.13
7137 38
0.14 Notes: This table reports logistic regression estimates. The sample includes all politically-relevant non-ruling group-years in 40 countries in Sub-Saharan Africa from independence (or 1946 for older states) through 2013. The dependent variable is whether the group carried out a successful coup. Threat capabilities independent variables (HH, HL, LH, LL) indicate whether the ruling group and the given non-ruling group, respectively, are above (high) or below (low) the median threat capabilities for the full sample. Cubic polynomials of time since last successful coup (t, t2, t3) are included to account for temporal dependence. Standard errors are clustered by country and statistical significance is denoted by: ***: p<0.01, **: p<0.05, and *: p<0.10

43
The final set of models tests the effect of the balance of threat capabilities on civil
war risk. We expect the inverse of the results from the coup models: as strong rivals
share power and accept coup risk, they reduce the likelihood either side will choose to
militarily challenge the state from outside of the central government. Thus, we expect
armed rebellion to be more likely in dyads in which at least one bargaining partner is
weak, as rulers see exclusion as a means to increase the costs their rivals face to
displacing them from power. As shown in Table 3, the results support this expectation.
The balance of threat capabilities variables are generally statistically significant and
have the (expected) opposite signs: HH dyads are negatively associated, and other dyads
positively associated, with the onset of rebellion.78
78 The slightly less robust statistical significance in the civil war models may be a result
of a non-monotonic effect of mobilizational capabilities on actual civil wars. Up to a
point, greater ability to launch a civil war presumably makes a rival group more likely
to do so, but beyond that threshold (we theorize) they are threatening enough to be
included, and thus their likelihood drops.

44
Table 3: Balance of Threat Capabilities and the Likelihood of Civil War Onset CW-1 CW-2 CW-3 CW-4 CW-5 CW-6 HH threat capabilities
-0.88** (0.43)
-0.88** (0.43)
-0.77** (0.39)
HL threat capabilities
0.73 (0.54)
0.70
(0.54)
0.53 (0.44)
LH threat capabilities
1.05** (0.50)
1.11** (0.49)
1.07** (0.47)
LL threat capabilities
1.16** (0.45)
1.20*** (0.43)
1.12** (0.51)
Log GDP per capita
-0.65*** (0.21)
-0.68*** (0.19)
Log country population 0.04
(0.17) 0.01
(0.17) Number of ethnic groups
-0.06 (0.09)
-0.04 (0.11)
Institutionalized regime
-0.25 (0.45)
-0.17 (0.40)
Former French colony -0.05
(0.54) -0.13 (0.54)
Cold War -0.96 (0.83)
-0.95 (0.82)
Year 0.04 (0.03)
0.04 (0.03)
Ongoing Rebellion 0.35
(0.73) 0.35
(0.68)
Past Conflict -0.32 (0.61)
-0.33 (0.61)
t -0.06 (0.10)
-0.07 (0.10)
-0.10 (0.10)
-0.10 (0.10)
t2 0.00
(0.00) 0.00
(0.00) 0.00
(0.00) 0.00
(0.00)
t3 -0.00 (0.00)
-0.00 (0.00)
-0.00 (0.00)
-0.00 (0.00)
constant -4.51 (0.25)
-5.39 (0.38)
-4.10 (0.46)
-4.97 (0.68)
-83.00 (53.71)
-77.27 (55.44)
N states pseudo r2
7422 40
0.01
7422 40
0.01
7422 40
0.02
7422 40
0.02
7144 38
0.05
7144 38
0.06 Notes: This table reports logistic regression estimates. The sample includes all politically-relevant non-ruling group-years in 40 countries in Sub-Saharan Africa from independence (or 1946 for older states) through 2013. The dependent variable is whether the group initiated a major armed rebellion or insurgency against the central government. Threat capabilities independent variables (HH, HL, LH, LL) indicate whether the ruling group and the given non-ruling group, respectively, are above (high) or below (low) the median threat capabilities for the full sample. Cubic polynomials of time since last rebellion onset (t, t2, t3) are included to account for temporal dependence. Standard errors are clustered by country and statistical significance is denoted by: ***: p<0.01, **: p<0.05, and *: p<0.10

45
The findings are substantively important as well. Figure 4 reports predicted
probabilities of inclusion, successful coups, and group rebellion (from Models EP-6, SC-
6, and CW-6) using the Clarify statistical software and keeping all control variables at
representative levels.79 The substantive results align closely with the expectations
presented in Figure 1. For dyads in which the ruling group and a given rival possess
threat capabilities above the median of all groups in the sample, the likelihood of the
rival group being included in the central government is approximately 63%, compared to
35-40% in HL and LH dyads. Meanwhile, coup risk in HH dyads is six-fold higher than
in HL dyads and twice as high than in LL dyads, and civil war risk in HH dyads is
lower than other types by one half to two thirds. The substantive results also illustrate
79 King, Tomz, and Wittenberg 2000. These predicted probabilities are generated setting
all control variables to their mean values and omitting the cubic polynomial variables
from these calculations because their extreme right-skew leads to distorted
(unrealistically low) predicted probabilities of all outcomes when included. The
relationship of interest is consistent regardless of values chosen for other variables: HH
dyads are more likely to feature powersharing and coups, and less likely to feature civil
war onset.

46
the strategic challenges that arise in LH dyads, as weak ruling groups bargaining with
stronger groups face both elevated coup and civil war risk.
Figure 3: Predicted Probabilities of Powersharing, Coups and Armed Rebellion
Strong Rival
Weak Rival
Strong Ruling Group
H1:
P(Powersharing): 62.9%
P(Successful coup): 0.6%
P(Armed rebellion): 0.4%
H2:
P(Powersharing): 35.3%
P(Successful coup): 0.1%
P(Armed rebellion): 0.7%
Weak Ruling Group
H4:
P(Powersharing): 55.8%
P(Successful coup): 0.4%
P(Armed rebellion): 1.1%
H3:
P(Powersharing): 39.9%
P(Successful coup): 0.3%
P(Armed rebellion): 1.2%
Summary
Overall the quantitative evidence offers strong support for a threat capabilities
theory of powersharing,80 which brings a new perspective on old debates on balance of
80 The empirical results hold when subjected to a number of robustness tests and
sensitivity analyses (see Online Appendix), including: alternative construction of threat
capabilities measure (employing geometric mean and using a group’s minimum distance

47
power, bargaining, and war. In contrast to economic theories, which predict rulers
should prefer to share power with small, weak groups to maximize their control of
rents,81 or power parity theories that predict an equal distribution of power increases the
risk of war due to greater uncertainty about who will ultimately win,82 we find that
strong rivals—as measured by their capabilities to project power in the capital city—are
to capital city); controlling for cross-group or coalition effects (i.e., the effect of other
groups being included or excluded in the central government); employing alternative
measures of ethnic geography (using Fearon’s dataset on ethnic diversity Fearon 2003,
combined with ethnic geographic data taken from Ethnologue maps) to ensure the
results are not an artifact of EPR’s identification of group boundaries; limiting the
analysis to only those ethnic configurations that exist at the end of colonial rule to
mitigate endogeneity concerns about the effects of post-colonial political bargaining on
ethnic configurations; controlling for determinants of country shape and size and social
fractionalization; controlling for colonial type and transnational ethnic kin; controlling
for cross-cutting non-ethnic social cleavages between groups; and using all coup
attempts instead of successful coups in coup models.
81 Bates 1983.
82 Reed 2003.

48
significantly more likely to share power. Notably, this holds despite the fact that
powersharing also brings an elevated coup risk.
In contrast, when a rival is weak and unable to credibly hold the ruler to account
for reneging on powersharing, exclusion results. This significantly lowers coup risk,
though at the cost of a higher risk of civil war, especially when the ruling group is weak.
Rulers seem to calculate that the strategic benefits of ethno-political exclusion outweigh
the strategic costs, and are willing to tolerate the potential threat of an armed rebellion.
For weak ruling groups bargaining with strong groups, they are between a rock and a
hard place—both powersharing and exclusion are dangerous as they leave the
government vulnerable to coups and strong civil wars, respectively. The empirical record
suggests weak groups employ a mix of strategies—some favor exclusion and others
inclusion—each of which has high costs. Consequently, these dyads experience both high
coup risk (nearly on par with HH dyads) but also high civil war risk (on par with LL
dyads).
Qualitative Empirical Evidence
The quantitative evidence suggests systematic support for the effect of the balance of
societal power on ethno-political bargaining. To further substantiate the paper’s four
hypotheses, we now turn to qualitative evidence. Figure 2 identifies representative
regime types consistent with our four hypotheses. To explore the full range of

49
predictions, we employ a diverse case selection method—drawing on typical cases from
each quadrant.83 While these cases do not in themselves constitute a definitive test, they
are able to illustrate the theorized causal mechanisms in action.
Figure 4: Balance of Threat Capabilities and Powersharing in Africa
Strong Rival
Weak Rival
Strong Ruling Group
H1: Powersharing and societal peace (despite high coup risk) Examples: Benin (1965-1968;1991-1996) Ghana (1957-present) Kenya (1963-present)
H2: War-prone ethnocracies Examples: Ethiopia (before 1991) Mali (1960-present) Sudan (1956-present)
Weak Ruling Group
H4: Repressive minority rule (or unstable powersharing) Examples: Guinea-Bissau (1974-1980) South Africa (before 1994) Ethiopia (after 1991)
H3: Unstable, violent, exclusionary regimes Examples: Zaire/DRC (1960-present) Chad (1980-present) Liberia (1980-1998)
H1: High-High (HH) Threat Capabilities: Ghana and Benin
In countries where multiple groups with strong threat capabilities dominate politics,
we expect consistent, if uneasy, powersharing. Though any one group may prefer to
83 Seawright and Gerring 2008.
50
dominate the central government, its ability to do so is constrained by the strategic
costs and benefits of exclusion. Ghana and Benin represent two cases in which the main
axis of political competition has been between strong ethnic groups based on size and
proximity to the capital. Both countries are relatively small in area (below the median
for Africa) and are divided between four relatively large ethnic or ethno-regional blocs,84
giving each substantial societal power and making it challenging for any one group to
rule alone.
In both cases control of the state and its associated rents largely played out between
elites embedded in these rival groups, who mobilized their co-ethnics in a bid to
maximize their power vis-à-vis their rivals. Despite the existence of formal party
structures, this dynamic often played out through informal or personalist channels.85
The high-stakes contest between ethno-regional rivals for control of state power made
84 In Benin, the EPR dataset identifies the key groups as: Northern (15 percent of
population), Southwestern (15 percent), Southeastern (18.5 percent), and South/Central
(33 percent of population). In Ghana, the four largest groups are Ewe (13 percent of
population), Asante (Akan) (15 percent), Northern Groups (23.5 percent), and Other
Akans (34.5 percent). A fifth group, the Ga-Adangbe (8 percent), is also politically-
relevant.
85 Chazan 1982; Decalo 1995; Ronen 1975; Smock and Smock 1975.
51
politics in Benin and Ghana similar in kind to many other weak states. The difference
lay in their rulers’ inability to employ ethno-political exclusion as a means to lock-in
state power, thus creating vulnerability to coups d’état from ethnic rivals. In fact, both
countries experienced five successful inter-ethnic coups (in which at least some of the
conspirators hailed from a different ethnic group than the head of state) in the first
decades after independence.
This is not to suggest that some rulers did not try to structure their regimes along
ethnic lines in a bid to consolidate power. But when they did, consistent with our
theory, we see evidence that such a policy provoked popular mobilization from a strong
rival, which, raising the specter of civil war, reversed ethnic exclusion. A paradigmatic
example of this is found in Benin in the first few years after independence. Benin’s
inaugural president, Hubert Maga, hailed from the Northern group86 and formed an
unstable alliance with various leaders from the south. As these alliances frayed due to
political conflicts between rival ethnic elites, Maga moved to consolidate his hold on
power by promoting “northerners in large numbers…throughout the entire governmental
system, and the gendarmerie, in particular, was packed with Baribas who often regarded
86 In Benin, the Northern group’s threat capabilities score falls just below the Africa
median (0.465 vs 0.476); it is relatively large in size (66th percentile for Africa) but
relatively far from the capital (36th percentile for Africa).
52
themselves as Maga’s private militia.”87 But in the face of what were perceived as
discriminatory practices combined with austerity measures in the public sector,
southerners, led by the trade unions, launched a general strike and paralyzed the
country’s largest cities along the southern coast of the country, Porto Novo (the official
capital) and Cotonou (the seat of government). As the conflict intensified, “Colonel
Christopher Soglo, Chief of Staff of the Army [a Fon from South/Central group],
announced that the armed forces were taking over power in order to avert civil war.”88
Soglo’s coup not only prevented civil war but upheld an inclusive equilibrium. Though
Maga’s Northern group was politically marginalized, they were never fully purged from
the military. Overall powersharing endured, but given the weakness of political
institutions, irregular competition for executive authority continued. Over the next
decade there would be another five coups, including three that involved military officers
from the Northern group, who exploited their continued presence in the military to stay
in the political game. While trading power via coups can lead to instability and
87 Decalo 1973, 458.
88 Emphasis added. Matthews 1966, 152.

53
uncertainty, these cases illustrate how the societal strength of rivals may force ruling
groups to accept such an outcome over civil war.89
H2: High-Low (HL) Threat Capabilities: Sudan
For strong groups bargaining with weak groups, the strategic problems arising from
consolidating power through ethno-political exclusion are less acute. Once their rivals
are excluded they pose little threat to the regime’s hold on power, except through
remote armed rebellions. Sudan is the archetypical example of this pathway to ethno-
political exclusion and civil war. After independence the Sudanese state was dominated
by those primarily from three riverine Arab tribes (Shaygiyya, Ja’alin, and Danagla)
who ‘inherited’ the state from British colonial rule. Situated in the Nile River Valley
just above the capital, Khartoum, and collectively comprising some 15 percent of the
population (and scored as having high threat capabilities), these groups have dominated
power in Sudan. Helping to consolidate their hold on power has been an alliance with
other Arab tribes located in the heart of the state in Kordofan and Al-Gezira State (also
89 Given this inefficiency, we might expect mutally strong rivals to attempt to
institutionalize the rotation of power rather than continue with the coup trap.
Interestingly, this is precisely what has happened in Benin and Ghana as the countries
have emerged as two of Africa’s most enduring democracies.

54
scored as having high threat capabilities), historically the country’s two dominant
economic zones of production. Sudan’s ‘Arab’-dominated regimes left little room for
smaller non-Arab ethnic groups located in Darfur and South Sudan (including the
Dinka, Nuer, Shilluk, Nuba, Fur, and Zaghawa, all scored as having low threat
capabilities). De facto policies of ethno-political exclusion helped to consolidate the
riverine Arabs hold on power, though at the cost of multiple civil wars.90 Yet given the
size of the country and the fractionalization of society—that the rebels sought to
overcome but never successfully did—the insurgents were unable to mount a credible
threat to the government’s hold on the capital. Instead, the conflicts burned on the
periphery with the costs disproportionately borne by the excluded groups—leading one
Sudan observer to characterize them as a “perfect war” for the ruling elite.91 Only
through heavy international pressure, third-party intervention between the central
government and southern-based rebel groups and the rare case of state partition did
Sudan’s longest running war finally end with the Comprehensive Peace Agreement in
2005 and secession for South Sudan in 2011.
H3: Low-Low (HL) Threat Capabilities: Liberia
90 Johnson 2011.
91 Martin 2002.

55
The Liberia case illustrates the pattern in which elites embedded in two weak groups
far from the capital are unable to maintain powersharing, leading to ethnic exclusion
and civil war. In 1980 a group of non-commissioned officers, led by Samuel Doe, seized
power in a coup, upending the country’s power structure which had been dominated by
the Americo-Liberians for the previous 153-years. Doe’s political position was much
weaker than that of riverine Arabs in Sudan. Coming from a relatively small ethnic
group in the hinterland (the Krahn tribe located primarily in Grand Gedeh County,
scored as having weak threat capabilities), Doe’s political base was relatively narrow.
This increased his vulnerability while weakening his group’s capabilities to come back to
power if it lost hold of it. Doe rose to power, however, backed by individuals from other
small ethnic groups in the hinterland, particularly the Gio tribe located in Nimba
County (also scored as having weak threat capabilities) and led by his high school
friend, Thomas Quiwonkpa. Both sides thus had a lot to lose from infighting. But each
also recognized that their small power base made them vulnerable. When a power
struggle arose between the two shortly after coming to power, Doe felt he could not
afford to allow Quiwonkpa to remain head of the army and purged him.
Fearing for his life, Quiwonkpa fled the capital. Bitter that the man he put in power
betrayed him, Quiwonkpa sought to organize support from his co-ethnics and other
allies to try to forcibly reclaim power. In 1985, Quiwonkpa launched an attack on the

56
Liberian government from Sierra Leone. Though Quiwonkpa reached the capital with
his small force of some two dozen men, they lacked the capabilities and local support to
overthrow Doe.92 After Quiwonkpa’s failed bid to oust Doe from power, the latter
continued to reject powersharing with Quiwonkpa’s co-ethnics while increasing his
reliance on repression to regulate the excluded group. This provoked a civil war in 1989
when Quiwonkpa’s lieutenants launched a rebellion to continue the revolutionary
struggle started by their patron.93
H4: Low-High (LH) Threat Capabilities: Guinea-Bissau and South Africa
Guinea-Bissau, like Liberia before the overthrow of Americo-Liberian rule, was
dominated by a non-indigenous minority. In Guinea-Bissau, the inaugural government
was controlled politically by Cape Verdeans (numbering only in the thousands) who had
been brought in from the islands during the colonial period to work in the bureaucracy.94
Enjoying the modernizing effects of participating in the colonial state, the Cape
Verdeans would play a leadership role in the anti-colonial movement (P.A.I.G.C.) and
the inaugural government. Though the government was led by the Cape Verdeans, the
military, especially the lower-ranks, was dominated by individuals from the Balanta, the
92 Ellis 1999.
93 Ellis 1999.
94 Forrest 1992.

57
largest ethnic group in Guinea-Bissau, comprising some thirty percent of the population
(scored as having high threat capabilities). The Balanta resented their subordinate
political status.95 In 1980 the Balanta-dominated military backed a coup that dismantled
Cape Verdian rule.
The Guinea-Bissau case reveals one of the fundamental dilemmas confronting
minority rule regimes. Reluctant to open the door for their stronger rivals in a way that
might initiate a permanent shift in the distribution of power, rulers favor exclusion. But
exclusion foments resistance and necessitates repression to counter the greater civil war
capabilities of the majority. The problem for the minority group is that they often lack
the manpower to effectively counter-mobilize and may have little choice but to employ
members of the rival majority group to man the coercive apparatus. Without strong
organizational control over the military, this can be the minority group’s undoing, as
the Cape Verdeans experienced (the same fate befell the Americo-Liberians in 1980).
The Afrikaners in South Africa chose an alternate approach. Benefitting from a
much larger size (roughly ten percent of the population), though still a significant
minority (and still scored as having low threat capabilities relative to other groups in
Africa), they institutionalized segregation via Apartheid, including in the military, to
95 Forrest 1987.

58
consolidate their hold on power.96 This effectively blocked any internal risk posed by
‘non-whites’, even as they had to rely more and more on black South Africans in the
military in the 1970s.97 Ultimately, this provoked societal resistance that crossed the
threshold of civil war in the 1980s.98
Both Guinea-Bissau and South Africa reveal the acute strategic dilemma that
minorities face in attempting to rule over larger groups. Trying to partially
accommodate their ethnic rivals can lead to a coup d’état, but excluding them can
provoke civil war.
Conclusion
A large and growing literature points to the pacifying effects of powersharing.99 Yet
the conditions giving rise to inclusive governance are not well-understood. In this paper
96 Beinart 2001.
97 Beinart 2001; Horowitz 1991.
98 Wood 2000.
99 Cederman, Gleditsch, and Buhaug 2013; Cederman, Wimmer, and Min 2010;
Horowitz 1985; Lijphart 1969; Rothchild 1997; Wimmer 2013; Wimmer, Cederman, and
Min 2009; Wucherpfennig, Hunziker, and Cederman 2016.

59
we have advanced a theory to account for credible powersharing in weak states in the
absence of strong political institutions or external guarantors. Counter-intuitively, we
argue that ethnic powersharing is a positive function of the civil war capabilities of both
the ruling and rival groups—that is, their mobilizational potential to forcibly seize
power when they are excluded from the central government. When mutually strong,
both prefer to accept the risk of coups to the risk of civil wars and neither is willing to
systematically exclude the other from government. Continuous, if fluid, powersharing
emerges. Extensive quantitative and qualitative evidence supports our theoretical
argument and provides novel empirical insights into the outcome of the coup-civil war
trap across post-colonial Africa. Overall this paper is one of the first to offer an
integrated and parsimonious theory to account for how the distribution of societal power
leads to durable powersharing in weak states. In doing so, it also unpacks the strategic
relationship between coups and civil war. Coups are significantly more likely from
groups that can credibly demand inclusion with the threat of a strong civil war.
The paper also points to several avenues for future research. One important question
is, if the exclusion-civil war equilibrium is partially determined by a country’s ethnic
geography, what then is the way out? Are these countries not doomed to further cycles
of ethno-political exclusion and devastating civil war? This argument implies that
overcoming the hurdle posed by highly uneven balances of power is paramount for

60
effective peacemaking and longer-term political resolution. In this, perhaps outside
actors can have a role: by acting as a guarantor of status for groups that have
insufficient threat capabilities of their own, international intervention may be able to
reduce incentives for the sort of exclusion through coups and purges that leads to civil
war.
Another related avenue of research is the interplay between societal power and
political institutionalization.100 To what degree has a societal balance of power helped to
undergird democracy in some countries, such as Benin and Ghana? Can political
institutionalization foster inter-ethnic powersharing even under conditions of
unfavorable ethnic geography? The empirical results are suggestive of this possibility
but much more rigorous research is warranted on this front and the antecedent question
of how party rule emerges in the first place, especially in countries with strong power
imbalances.
A final avenue for future investigation is to analyze how potential secession affects
the strategic dynamics and increases peripheral groups’ bargaining power vis-à-vis the
ruling group. Throughout post-independence Africa, the regional system has strongly
discouraged secession, in an attempt to reduce the risk of inter-state war. However, this
has eliminated a powerful source of leverage for peripheral groups—the threat of
100 Moe 2005.

61
exit101—and contributed to their political marginalization. Opening the door to secession
is, of course, no panacea as it can substitute one source of instability for another—as
seen between Ethiopia and Somalia in 1977 and 1978. How to resolve this conundrum—
increasing the bargaining power of weak groups while maintaining regional stability—
remains a major theoretical question and policy challenge but is critical to
understanding and ending the exclusion-conflict cycle in large, weak states.
101 Hirschman 1970.

62
REFERENCES Acemoglu, Daron, and James A. Robinson. 2006. Economic Origins of Dictatorship and
Democracy. Cambridge: Cambridge University Press. Acemoglu, Daron, Thierry Verdier, and James A. Robinson. 2004. Kleptocracy and
Divide-and-Rule: A Model of Personal Rule. Journal of the European Economic Association 2(2-3): 162-92.
Arriola, Leonardo R. 2012. Multi-Ethnic Coalitions in Africa: Business Financing of Opposition Election Campaigns. New York: Cambridge University Press.
Bates, Robert H. 1983. Modernization, Ethnic Competition, and the Rationality of Politics in Contemporary Africa. In State Versus Ethnic Claims: African Policy Dilemmas, edited by Donald Rothchild, and Victor A. Olorunsola, 152-71. Boulder, CO: Westview Press.
———. 2008. When Things Fell Apart: State Failure in Late-Century Africa. New York: Cambridge University Press.
Beinart, William. 2001. Twentieth-Century South Africa. Oxford: Oxford University Press.
Blattman, Christopher, and Edward Miguel. 2010. Civil War. Journal of Economic Literature 48(1): 3-57.
Boix, Carles, and Milan W. Svolik. 2013. The Foundations of Limited Authoritarian Government: Institutions, Commitment, and Power-Sharing in Dictatorships. The Journal of Politics 75(02): 300-16.
Bueno de Mesquita, Bruce, James D. Morrow, Randolph M. Siverson, and Alastair Smith. 2003. The Logic of Political Survival. Cambridge, MA: MIT Press.
Buhaug, Halvard, Lars-Erik Cederman, and Jan Ketil Rød. 2008. Disaggregating Ethno-Nationalist Civil Wars: A Dyadic Test of Exclusion Theory. International Organization 62(3): 531-51.
Carter, David B, and Curtis S Signorino. 2010. Back to the Future: Modeling Time Dependence in Binary Data. Political Analysis 18(3): 271-92.
Cederman, Lars-Erik, Kristian Skrede Gleditsch, and Halvard Buhaug. 2013. Inequality, Grievances, and Civil War. New York: Cambridge University Press.
Cederman, Lars-Erik, Andreas Wimmer, and Brian Min. 2010. Why Do Ethnic Groups Rebel?: New Data and Analysis. World Politics 62(1): 87-119.
Cetinyan, Rupen. 2002. Ethnic Bargaining in the Shadow of Third-Party Intervention. International Organization 56(3): 645-77.
Chazan, Naomi. 1982. Ethnicity and Politics in Ghana. Political Science Quarterly: 461-85.

63
Chiozza, Giacomo, and H. E. Goemans. 2011. Leaders and International Conflict. New York: Cambridge.
Clapham, Christopher. 1996. Africa and the International System: The Politics of State Survival. New York: Cambridge University Press.
Collier, Paul, Anke Hoeffler, and Dominic Rohner. 2009. Beyond Greed and Grievance: Feasibility and Civil War. Oxford Economic Papers 61(1): 1-27.
Copeland, Dale C. 2000. The Origins of Major War. Ithaca: Cornell Univ. Press. Decalo, Samuel. 1995. Historical Dictionary of Benin. Third Edition ed. Lanham, Md.:
Scarecrow Press. ———. 1973. Regionalism, Politics, and the Military in Dahomey. The Journal of
Developing Areas: 449-78. Ellis, Stephen. 1999. The Mask of Anarchy: The Destruction of Liberia and the
Religious Dimension of an African Civil War. New York: New York University Press.
Englebert, Pierre. 2002. State Legitimacy and Development in Africa. Boulder, CO: Lynne Rienner.
Englebert, Pierre, and Rebecca Hummel. 2005. Let’s Stick Together: Understanding Africa’s Secessionist Deficit. African Affairs 104(416): 399-427.
Fearon, James D. 2003. Ethnic and Cultural Diversity by Country. Journal of Economic Growth 8(2): 195-222.
———. 1995. Ethnic War as a Commitment Problem. Paper Presented at the 1994 Annual Meeting of the American Political Science Association, New York August 30-September 2.
———. 2010. Governance and Civil War Onset. In World Development Report 2011. Fearon, James D., and David D. Laitin. 2003. Ethnicity, Insurgency, and Civil War.
American Political Science Review 97(1): 75-90. Feenstra, Robert C, Robert Inklaar, and Marcel P Timmer. 2015. The Next Generation
of the Penn World Table. The American Economic Review 105(10): 3150-82. Forrest, Joshua. 1992. Guinea-Bissau: Power, Conflict, and Renewal in a West African
Nation. Boulder: Westview Press. Forrest, Joshua B. 1987. Guinea-Bissau since Independence: A Decade of Domestic
Power Struggles. The Journal of Modern African Studies 25(01): 95-116. Francois, Patrick, Ilia Rainer, and Francesco Trebbi. 2015. How Is Power Shared in
Africa? Econometrica 83(2): 465-503. Gandhi, Jennifer, and Adam Przeworski. 2006. Cooperation, Cooptation, and Rebellion
under Dictatorship. Economics and Politics 18(1): 1-26. Gleditsch, Kristian Skrede, and Andrea Ruggeri. 2010. Political Opportunity Structures,
Democracy, and Civil War. Journal of Peace Research 47(3): 299-310.

64
Gleditsch, Kristian Skrede, Idean Salehyan, and Kenneth Schultz. 2008. Fighting at Home, Fighting Abroad. Journal of Conflict Resolution 52(4): 479-506.
Green, Elliott. 2012. On the Size and Shape of African States. International Studies Quarterly 56(2): 229-44.
Gurr, Ted R. 2000. People Versus States: Minorities at Risk in the New Century. Washington, D.C.: US Institute of Peace.
Harff, Barbara. 2003. No Lessons Learned from the Holocaust? Assessing Risks of Genocide and Political Mass Murder since 1955. American Political Science Review 97(1): 57-73.
Harkness, Kristen A. 2014. The Ethnic Army and the State: Explaining Coup Traps and the Difficulties of Democratization in Africa. Journal of Conflict Resolution.
Hartzell, Caroline A. , and Matthew Hoddie. 2007. Crafting Peace: Power-Sharing Institutions and the Negotiated Settlement of Civil Wars. University Park, PA: Pennsylvania State Univ. Press.
Helmke, Gretchen, and Steven Levitsky. 2004. Informal Institutions and Comparative Politics: A Research Agenda. Perspectives on Politics 2(4): 725-40.
Herbst, Jeffrey. 2000. States and Power in Africa: Comparative Lessons in Authority and Control. Princeton, NJ: Princeton University Press.
Hironaka, Ann. 2005. Neverending Wars: The International Community, Weak States, and the Perpetuation of Civil War. Cambridge, Mass.: Harvard University Press.
Hirsch, Linda, and Martin Smith. The Rise of Isis. Arlington, VA: Public Broadcasting Service, 2014.
Hirschman, Albert O. 1970. Exit, Voice, and Loyalty: Responses to Decline in Firms, Organizations, and States. Cambridge, Mass.: Harvard Univ. Press.
Hobbes, Thomas. 1986 (1651). Leviathan. Harmondsworth, Eng.: Penguin. Högbladh, Stina. 2012. Peace Agreements 1975-2011-Updating the Ucdp Peace
Agreement Dataset. In States in Armed Conflict 2011, edited by Therése Pettersson and Lotta Themnér, 39-56. Uppsala: Department of Peace and Conflict Research.
Horowitz, Donald L. 1991. A Democratic South Africa? : Constitutional Engineering in a Divided Society. Berkeley: University of California Press.
———. 1985. Ethnic Groups in Conflict. Berkeley: University of California Press. Jackson, Robert H., and Carl G. Rosberg. 1982. Personal Rule in Black Africa.
Berkeley: University of California Press. Jervis, Robert. 1978. Cooperation under the Security Dilemma. World Politics 30(2):
167-214. Johnson, Douglas H. 2011. The Root Causes of Sudan's Civil Wars: Peace or Truce.
Oxford: James Currey

65
King, Gary, Michael Tomz, and Jason Wittenberg. 2000. Making the Most of Statistical Analyses: Improving Interpretation and Presentation. American Journal of Political Science 44(2): 347-61.
Kissinger, Henry A. 1969. The Viet Nam Negotiations. Foreign Affairs: 211-34. Kugler, Jacek, and Douglas Lemke, eds. 1996. Parity and War: Evaluations and
Extensions of the War Ledger. Ann Arbor: Univ. of Michigan Press. Lijphart, Arend. 1969. Consociational Democracy. World Politics 21(02): 207-25. ———. 1977. Democracy in Plural Societies: A Comparative Exploration. New Haven:
Yale University Press. Luckham, Robin. 1971. The Nigerian Military: A Sociological Analysis of Authority &
Revolt 1960-67. Cambridge, UK: Cambridge University Press. Magaloni, Beatriz. 2008. Credible Power-Sharing and the Longevity of Authoritarian
Rule. Comparative Political Studies 41(4-5): 715-41. Magaloni, Beatriz, Jonathan Chu, and Eric Min Min. 2013. Autocracies of the World,
1950-2012. Stanford University. Martin, Randolph. 2002. Sudan's Perfect War. Foreign Affairs 81(2): 111-27. Matthews, Ronald. 1966. African Powder Keg: Revolt and Dissent in Six Emergent
Nations. London: Bodley Head. McGarry, John, and Brendan O'Leary. 1993. Introduction: The Macro-Political
Regulation of Ethnic Conflict. In The Politics of Ethnic Conflict Regulation: Case Studies of Protracted Ethnic Conflicts, edited by John McGarry and Brendan O'Leary. New York: Routledge.
McGowan, Patrick J. 2003. African Military Coups D'état, 1956–2001: Frequency, Trends and Distribution. Journal of Modern African Studies 41(3): 339-70.
Michalopoulos, Stelios. 2012. The Origins of Ethnolinguistic Diversity. The American Economic Review 102(4): 1508.
Migdal, Joel S. 1988. Strong Societies and Weak States: State-Society Relations and State Capabilities in the Third World. Princeton, NJ: Princeton University Press.
Moe, Terry M. 2005. Power and Political Institutions. Perspectives on Politics 3(02): 215-33.
Norris, Pippa. 2008. Driving Democracy: Do Power-Sharing Institutions Work? New York: Cambridge University Press.
North, Douglass Cecil, John Joseph Wallis, and Barry R. Weingast. 2009. Violence and Social Orders: A Conceptual Framework for Interpreting Recorded Human History. Cambridge; New York: Cambridge University Press.
Organski, A. F. K., and Jacek Kugler. 1980. The War Ledger. Chicago: University of Chicago Press.

66
Posen, Barry R. 1993. The Security Dilemma and Ethnic Conflict. Survival: Global Politics and Strategy 35(1): 27 - 47.
Powell, Robert. 1999. In the Shadow of Power: States and Strategies in International Politics. Princeton, NJ: Princeton University Press.
Prunier, Gerard. 1995. The Rwanda Crisis: History of a Genocide. New York: Columbia University Press.
Reed, William. 2003. Information, Power, and War. American Political Science Review 97(4): 633-41.
Reno, William. 1998. Warlord Politics and African States. Boulder, CO: Lynne Rienner Publishers.
Robinson, Glenn E. 2012. Syria's Long Civil War. Current History 111(749): 331. Roessler, Philip. 2011. The Enemy Within: Personal Rule, Coups, and Civil War in
Africa. World Politics 63(2): 300-46. ———. 2016. Ethnic Politics and State Power in Africa: The Logic of the Coup-Civil
War Trap. New York: Cambridge University Press. ———. 2013. Why Violence Exploded in South Sudan. In Monkey Cage. Washington,
D.C. : The Washington Post. Ronen, Dov. 1975. Dahomey: Between Tradition and Modernity. Ithaca: Cornell
University Press. Rothchild, Donald. 1986. Hegemonial Exchange: An Alternative Model for Managing
Conflict in Middle Africa. In Ethnicity, Politics and Development, edited by Dennis L. Thomson, and Dov Ronen, 65-104. Boulder, CO: Lynne Rienner Publisher.
Rothchild, Donald 1997. Managing Ethnic Conflict in Africa: Pressures and Incentives for Cooperation. Washington, D.C.: Brookings Institution Press.
Rubin, Barnett R. 2002. The Fragmentation of Afghanistan: State Formation and Collapse in the International System. New Haven: Yale University Press.
Salehyan, Idean. 2009. Rebels without Borders: Transnational Insurgencies in Word Politics. Ithaca, NY: Cornell University Press.
Sambanis, Nicholas. 2004. What Is Civil War? Journal of Conflict Resolution 48(6): 814-58.
Seawright, Jason, and John Gerring. 2008. Case Selection Techniques in Case Study Research: A Menu of Qualitative and Quantitative Options. Political Research Quarterly 61(2): 294-308.
Smock, David R, and Audrey C Smock. 1975. The Politics of Pluralism: A Comparative Study of Lebanon and Ghana: Cambridge Univ Press.
Svolik, Milan W. 2012. The Politics of Authoritarian Rule. New York: Cambridge University Press.

67
Treisman, Daniel. 2004. Rational Appeasement. International Organization 58(02): 345-73.
Vogt, Manuel, Nils-Christian Bormann, Seraina Rüegger, Lars-Erik Cederman, Philipp Hunziker, and Luc Girardin. 2015. Integrating Data on Ethnicity, Geography, and Conflict: The Ethnic Power Relations Data Set Family. Journal of Conflict Resolution 59(7): 1327-42.
Walter, Barbara F. 2002. Committing to Peace: The Successful Settlement of Civil Wars. Princeton, NJ: Princeton University Press.
———. 2009. Reputation and Civil War: Why Separatist Conflicts Are So Violent. New York: Cambridge University Press.
Wantchekon, Leonard. 2000. Credible Power-Sharing Agreements: Theory with Evidence from South Africa and Lebanon. Constitutional Political Economy 11(4): 339-52.
Weidmann, Nils B. 2009. Geography as Motivation and Opportunity: Group Concentration and Ethnic Conflict. Journal of Conflict Resolution 53(4): 526-43.
Wimmer, Andreas. 2013. Waves of War: Nationalism, State Formation, and Ethnic Exclusion in the Modern World. New York: Cambridge University Press.
Wimmer, Andreas , Lars-Erik Cederman, and Brian Min. 2009. Ethnic Politics and Armed Conflict: A Configurational Analysis of a New Global Dataset. American Sociological Review 74(1): 316-37.
Wood, Elisabeth Jean. 2000. Forging Democracy from Below: Insurgent Transitions in South Africa and El Salvador. Cambridge: Cambridge University Press.
Wucherpfennig, Julian, Philipp Hunziker, and Lars‐Erik Cederman. 2016. Who Inherits the State? Colonial Rule and Postcolonial Conflict. American Journal of Political Science. 60 (4): 882-898.
Wucherpfennig, Julian, Nils B. Weidmann, Luc Girardin, Lars-Erik Cederman, and Andreas Wimmer. 2011. Politically Relevant Ethnic Groups across Space and Time: Introducing the GeoEPR Dataset. Conflict Management and Peace Science 28(5): 423-37.

68
SELF-ENFORCING POWERSHARING IN WEAK STATES
ONLINE APPENDIX
Philip Roessler Department of Government College of William and Mary
Dave Ohls School of International Service
American University [email protected]

69
1. VARIABLE CALCULATION AND SUMMARY STATISTICS......................................70
2. ETHNIC GEOGRAPHY AND THE CONSTRUCTION OF ETHNICITY..................732.1USINGDATAFROMFEARON(2003)ANDETHNOLOGUEASANALTERNATIVEMEASUREOFETHNICGEOGRAPHY............................................................................................................................................................742.2RESTRICTINGTHEANALYSISTOGROUPCONFIGURATIONSATINDEPENDENCE..........................................79
3. VALIDATIONS AND SENSITIVITY ANALYSIS...............................................................823.1ALTERNATIVEMEASURESOFTHREATCAPABILITIES...................................................................................823.1.1 FULL REGRESSION MODELS USING MINIMUM EPR GROUP DISTANCE TO CAPITAL TO CALCULATE THREAT CAPABILITIES............................................................................................................................833.1.2 TESTING THE EFFECT OF THE BALANCE OF THREAT CAPABILITIES USING GEOMETRIC MEAN OF SIZE AND DISTANCE........................................................................................................................................853.1.3 TESTING THE EFFECT OF COALITION CAPABILITIES ON POWERSHARING...................................873.1.4 TESTING THE EFFECT OF COUNTRY-RELATIVE THREAT CAPABILITIES ON POWERSHARING.........................................................................................................................................................................................................903.2ALTERNATIVECLASSIFICATIONOFREBELLION.............................................................................................923.3ALTERNATIVECLASSIFICATIONOFCOUPS.....................................................................................................953.4MODELSWITHADDITIONALCONTROLVARIABLES.......................................................................................973.4.1 CONTROLLING FOR EXTANT LEVELS OF POWESHARING ON ETHNO-POLITICAL BARGAINING (CROSS-GROUP ANALYSIS)...............................................................................................................................................973.4.2 TESTING THE EFFECT OF FORMER BRITISH COLONIES..........................................................................993.4.3 TESTING THE EFFECT OF HAVING ETHNIC KIN ABROAD...................................................................1013.4.4 TESTING THE EFFECT OF SOCIAL DISTANCE BETWEEN ETHNIC GROUPS.................................1043.4.5 CONTROLLING FOR DETERMINANTS OF STATE SIZE AND SHAPE....................................................1063.4.6 CONTROLLING FOR DETERMINANTS OF SOCIAL FRACTIONALIZATION........................................1093.4.7 INTERACTIONS BETWEEN POWERSHARING, COUPS, AND CIVIL WAR...........................................1113.5MODELSUSINGEPR3.0..............................................................................................................................113
4. LIST OF RULING GROUPS AND NON-RULING GROUPS.......................................118

70
1. Variable Calculation and Summary Statistics
The main explanatory variables capture the dyadic balance of threat capabilities between
the ruling group and a given rival group. To construct this, we must first construct a measure of
threat capabilities at the group level. We include two factors in this calculation which we believe
factor into the group’s ability to credibly threaten to seize power: its size as a share of the
population, and the distance between the centroid of its home territory and the state capital.
For group population size as a proportion of the country’s total population, we draw the
data from the EPR 2014 dataset. The power of population is inherently relative: a set number of
people represents a larger share of the population in a smaller state than in a larger state, and
therefore represents more real power in that smaller state. This results in a variable that can
theoretically range from very nearly 0 (the group has only a tiny proportion of the state’s
population) to 1 (the group makes up the entire state population).
The power of proximity is not relative in the same way: the challenges of mobilizing forces
and transporting supplies in order to project power over a certain distance are relatively
constant across countries and across groups within countries. That is, it varies at a constant
rate depending on the distance, whether that distance represents the entirety of the state or just
a small region. Thus, to create this measure, we begin with each group’s capital city distance—
the distance from its centroid (the mathematical average of all points’ latitude and longitude) to
the country’s capital city (drawn from EPR 2014). We then standardize this capital city
distance from 0 to 1 for all groups in the sample, using the group with the shortest capital city
distance (the Americo-Liberians in Liberia whose homeland is calculated as only 15 kilometers
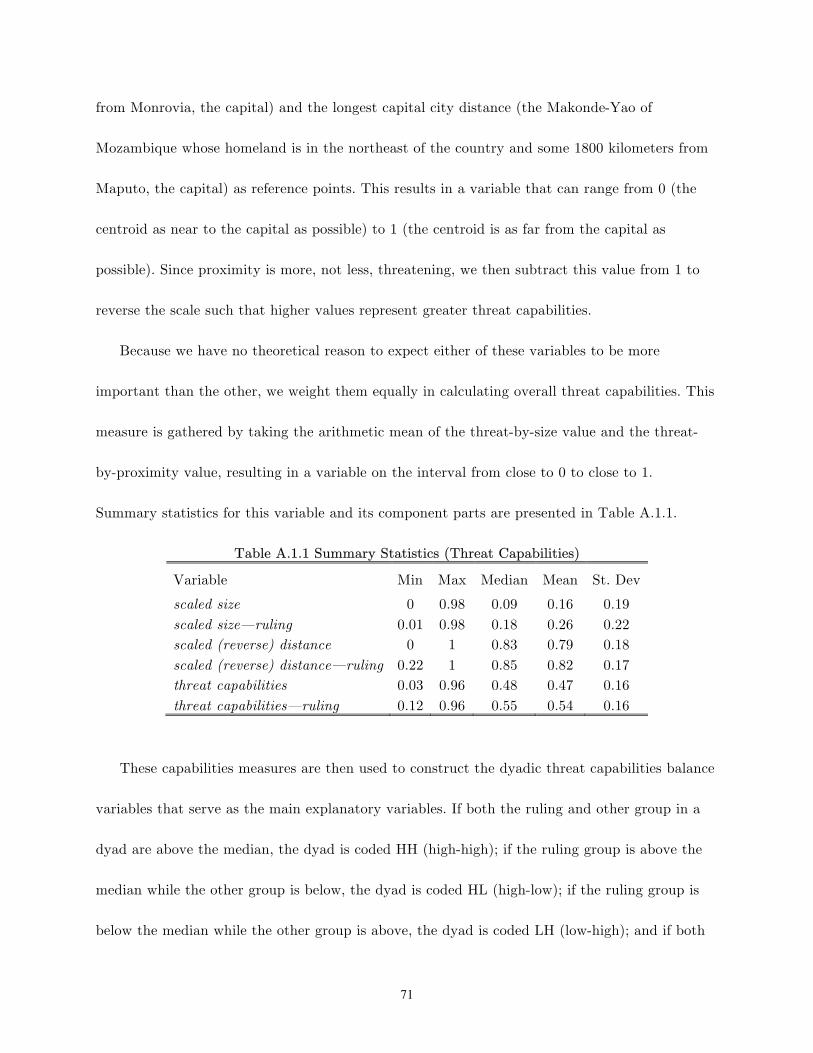
71
from Monrovia, the capital) and the longest capital city distance (the Makonde-Yao of
Mozambique whose homeland is in the northeast of the country and some 1800 kilometers from
Maputo, the capital) as reference points. This results in a variable that can range from 0 (the
centroid as near to the capital as possible) to 1 (the centroid is as far from the capital as
possible). Since proximity is more, not less, threatening, we then subtract this value from 1 to
reverse the scale such that higher values represent greater threat capabilities.
Because we have no theoretical reason to expect either of these variables to be more
important than the other, we weight them equally in calculating overall threat capabilities. This
measure is gathered by taking the arithmetic mean of the threat-by-size value and the threat-
by-proximity value, resulting in a variable on the interval from close to 0 to close to 1.
Summary statistics for this variable and its component parts are presented in Table A.1.1.
Table A.1.1 Summary Statistics (Threat Capabilities)
Variable Min Max Median Mean St. Dev scaled size 0 0.98 0.09 0.16 0.19 scaled size—ruling 0.01 0.98 0.18 0.26 0.22 scaled (reverse) distance 0 1 0.83 0.79 0.18 scaled (reverse) distance—ruling 0.22 1 0.85 0.82 0.17 threat capabilities 0.03 0.96 0.48 0.47 0.16 threat capabilities—ruling 0.12 0.96 0.55 0.54 0.16
These capabilities measures are then used to construct the dyadic threat capabilities balance
variables that serve as the main explanatory variables. If both the ruling and other group in a
dyad are above the median, the dyad is coded HH (high-high); if the ruling group is above the
median while the other group is below, the dyad is coded HL (high-low); if the ruling group is
below the median while the other group is above, the dyad is coded LH (low-high); and if both

72
are below the median the dyad is coded LL (low-low). Frequencies of each of these categories
are presented in Table A.1.2.
Table A.1.2: Summary Statistics (Explanatory Variables)
Variable Min Max Frequency
HH threat capabilities 0 1 0.357 HL threat capabilities 0 1 0.416 LH threat capabilities 0 1 0.083 LL threat capabilities 0 1 0.144
Descriptive summary statistics for the main outcome variables (interethnic powersharing,
successful coups, and civl war onset) are presented in Table A.1.3, and summaries of the control
variables are presented in Table A.1.4.
Table A.1.3: Summary Statistics (Outcome Variables)
Variable Min Max Frequency interethnic powersharing 0 1 0.467 successful coup 0 1 0.005 civil war onset 0 1 0.009
Table A.1.4: Summary Statistics (Control Variables)
Variable Min Max Median Mean St. Dev log GDP per capita 4.96 9.77 7.46 7.57 0.85 log country population 12.53 18.94 16.06 15.89 1.31 number of ethnic groups 0 13 5 5.23 3.08 institutionalized regime 0 1 0.73 0.44 former French colony 0 1 0.29 0.45 Cold War 0 1 0.46 0.50 pastcoup 0 1 0.13 0.33 pastconflict 0 1 0.13 0.33 ongoing rebellion 0 1 0.21 0.40 year 1946 2013 1987 1986.52 16.46

73
2. Ethnic Geography and the Construction of Ethnicity
The statistical tests in the paper provide strong support for the threat capabilities theory of
powersharing. Employing a parsimonious measure of the distribution of societal power based on
a group’s size and geographic distance to the capital city, we are able to account for the
durability of powersharing and a ruler’s willingness to accept coup risk versus civil war risk. But
relying on ethnic geography as a measure of threat capabilities is not without limitations.
Ethnicity’s constructivist foundations, which accept that ethnic boundaries (and groups) are
not fixed and that individuals possesses multiple identities whose salience is situational,102 pose
two potential challenges to the credibility of the empirical results. First, identifying a stable and
objective set of politically-relevant ethnic groups is difficult, as a number of different ethnic and
ethno-regional cleavages in a country could be seen as salient and lead to competing units of
analysis.103 For example, in Uganda one could categorize Northerners as a single ethno-regional
grouping or disaggregate the region into distinct ethnic groups (e.g., Acholi, Alur, Kakwa,
Lango, Lugbara, Madi and Teso). Which coding one chooses has material consequences on the
groups included in the sample and the threat capabilities scores assigned to those groups.
Second, competition for state power and the coups and civil war that arise from this could shape
the existence and intensity of a country’s ethnic divisions, making identifiably different ethnic
groups endogenous to political structures and events.104
102 Chandra 2012. 103 Fearon 2003. 104 Fearon 2000; Eifert et al. 2010.

74
To address both of these concerns and mitigate the problems that may arise from ethnicity’s
endogeneity to post-colonial politics, we check the sensitivity of the findings to alternative
means of selecting relevant ethnic groups and their boundaries. The results are highly robust to
both alternative statistical analyses.
2.1 Using Data from Fearon (2003) and Ethnologue as an Alternative Measure of
Ethnic Geography
For an alternate set of ethnic units of analysis, we re-run the analysis using data from
Fearon’s (2003) dataset of ethnic and cultural diversity across the globe, which provides
information on the relative size of all ethnic groups that make up at least 1 percent of the
population in 160 countries. While this dataset provides an alternative list of relevant ethnic
configurations in sub-Saharan Africa, it does not provide any data on the geographic location of
the ethnic groups or their relative access to state power. For the latter—a group’s representation
in the central government—we carefully match one-by-one the ethnic groups in the EPR 3.0
dataset105 with the list of ethnic groups in Fearon’s dataset to identify whether the groups
corresponded to each other as exact matches, partial matches (in which the Fearon group was a
subset of the EPR group or vice versa), or no match. Groups we could not match were dropped
from the analysis.
105 We matched this data with EPR 3.0. Available at http://www.epr.ucla.edu/ Wimmer, Cederman and Min 2009.

75
Of the 35 countries covered in both datasets,106 EPR 3.0 identifies 217 ethnic groups and
Fearon identifies 292 ethnic groups. The key difference in the datasets is the level of aggregation
they choose to demarcate ethnic group boundaries; EPR tends to identify the relevant
boundaries at a higher level of aggregation than Fearon. In the case of Northern Uganda
mentioned previously, EPR codes the relevant social boundary as Northerners (Langi, Acholi,
Teso, Madi, Kakwa-Nubian, Lugbara, Alur) whereas Fearon’s dataset includes each of these
sub-groups as individual units.107
We were able to match 237 ethnic groups from Fearon’s dataset as corresponding to a
similar ethnic configuration in the EPR dataset.108 Of these, 135 groups, or 57%, represent
perfect matches with EPR groups and the rest represent partial matches, in which the Fearon
groups are nested in a broader EPR group or vice versa. The high degree of consistency between
the two independent attempts to systematically identify relevant ethnic groups in sub-Saharan
Africa represents a nice validity check of the EPR dataset, which is widely used in the study of
ethnic politics.
To calculate a group’s threat capabilities using Fearon’s groups as the unit of analysis, we
need additional information on the group’s location (Fearon does report the relative group size,
106 The following sub-Saharan African countries are excluded from the data analysis: Botswana, Burkina Faso, Cape Verde, Comoros, Djibouti, Equatorial Guinea, Eritrea, Lesotho, Mauritius, Seychelles, São Tomé and Príncipe, Somalia, South Sudan, Swaziland, and Tanzania because the countries do not meet the size criteria (a population of at least 1 million and a surface area of at least 500,000 square kilometers as of 2005), ethnicity is considered to be of low salience, or a newly independent country. 107 Though the EPR, taking into account identity changes, recategorizes the relevant ethnic groups over time as region becomes less salient and ethnic identities more so. 108 Most of the 55 ethnic groups in Fearon that are un-matched with groups in EPR are due to EPR considering these groups as politically-irrelevant. There were 12 EPR groups that we could not match to Fearon’s dataset. Overall of the matched groups, there were 237 Fearon groups to 205 EPR groups.

76
the other component of threat capabilities). For the perfectly matched groups, we calculate this
data from the polygons created by the GeoEPR-ETH dataset. For partially matched groups
(which often represent subset of larger EPR groups), however, we need additional information
on each ethnic group’s homeland or geographic area. To identify these areas, we rely on maps
from Ethnologue, which reports spatial concentrations of ethnic groups in many African
countries. 109 With the size and distance data, we then recalculated the balance of threat
capabilities for the ruling group and a given opposition group and place each group in the
relevant dyad. The categories break down as follows:
• High-high (HH) threat capabilities: N=2,206 group-years (31%) • High-low (HL) threat capabilities: N=1,850 group-years (26%) • Low-high (LH) threat capabilities: N=1,202 group-years (17%) • Low-low (LL) threat capabilities: N=1,800 group-years (26%)
Using Fearon’s data on ethnic groups leads to a different distribution of dyadic configurations,
most notably a higher number of LH and LL dyads (a result of its tendency to rely on lower
levels of group aggregation). To identify powersharing, coups, and group rebellion, we rely on
the same data sources as above, and conduct additional research when necessary to identify
whether a given subgroup was a participant in a coup or rebellion.
Table A.2.1 reports re-estimated logistic regression models with all controls (models EP-5
and EP-6, SC-5 and SC-6, and CW-5 and CW-6 from Tables 1, 2, and 3, respectively) using the
dyads defined by Fearon’s groups as the unit of analysis. Results are very similar to those using
the EPR 2014 ethnic group configurations, with the additional finding that LH dyads reach
significance in powershairng and civil war models. Ruling groups are significantly more likely to
109 Available at http://www.ethnologue.com/.

77
include a given rival into their central government when both possess strong threat capabilities,
significantly reducing civil war risk but increasing coup risk.

78
Table A.2.1: Balance of Threat Capabilities and the Likelihood of Ethnic Inclusion, Coups and Civil War using Ethnic Configurations from Fearon (2003)
Ethnic Powersharing Successful
Coup Rebellion
Onset 1 2 3 4 5 6 HH threat capabilities
0.70*** (0.22)
0.52** (0.22)
-1.32*** (0.38)
HL threat capabilities
-0.49** (0.24)
-0.89** (0.38)
1.16*** (0.35)
LH threat capabilities
-1.06*** (0.34)
-0.28 (0.33)
1.73*** (0.54)
LL threat capabilities
-0.82** (0.37)
-0.32 (0.44)
1.12* (0.60)
Log GDP per capita 0.26* (0.14)
0.29** (0.14)
-0.66* (0.38)
-0.70* (0.36)
-0.53** (0.25)
-0.53** (0.25)
Log country population
0.26** (0.13)
0.28** (0.14)
-0.22 (0.24)
-0.24 (0.22)
-0.17 (0.19)
-0.13 (0.20)
Ethnic fractionalization
0.40 (1.01)
0.60 (0.94)
-0.57 (0.80)
-0.75 (0.85)
-2.32** (1.05)
-2.26** (0.92)
Institutionalized regime
0.40 (0.26)
0.38 (0.26)
0.73 (0.47)
0.75* (0.45)
-0.05 (0.33)
-0.05 (0.29)
Former French colony
0.60 (0.37)
0.64 (0.37)
0.27 (0.32)
0.27 (0.32)
-0.94* (0.56)
-0.99* (0.57)
Pastcoup 2.01*** (0.44)
1.92*** (0.46)
Pastconflict 0.45
(0.36) 0.26
(0.36)
Cold War 0.59 (0.58)
0.61 (0.58)
0.56 (0.89)
0.57 (0.88)
1.25* (0.75)
1.19 (0.73)
Ongoing rebellion -0.33 (0.84)
-0.33 (0.88)
Year 0.04* (0.02)
0.04** (0.02)
-0.05* (0.03)
-0.05* (0.03)
0.03 (0.03)
0.03 (0.03)
t -1.78*** (0.19)
-1.77*** (0.19)
-0.16 (0.11)
-0.16 (0.11)
-0.12 (0.16)
-0.11 (0.16)
t2 0.07*** (0.02)
0.07*** (0.02)
0.01* (0.01)
0.01* (0.01)
0.01 (0.01)
0.01 (0.01)
t3 -0.00*** (0.00)
-0.00*** (0.00)
-0.00* (0.00)
-0.00* (0.00)
-0.00 (0.00)
-0.00 (0.00)
constant -73.03 (38.70)
-72.10 (38.62)
90.33 (51.68)
93.79 (52.77)
-61.30 (57.88)
-69.06 (61.91)
N states pseudo r2
6487 34
0.78
6487 34
0.78
6391 34
0.09
6391 34
0.10
6391 34
0.07
6391 34
0.07 Notes: This table reports logistic regression estimates replicating results predicting interethnic powersharing (Models 1 and 2, following EP-5 and EP-6 in Table 1 in main paper), successful coups (Models 3 and 4, following SC-5 and SC-6), and civil war onset (Models 5 and 6, following CW-5 and CW-6). Fearon’s data of ethnic and cultural diversity is used to identify relevant ethnic groups for analysis. Threat capabilities independent variables (HH, HL, LH, LL) indicate whether the ruling group and a given non-ruling group, respectively, are above (high) or below (low) the median threat capabilities for the full sample. Cubic polynomials of time since last powersharing (t, t2, t3) are included to account for temporal dependence. Standard errors are clustered by country and statiscial significance is denoted by: ***: p<0.01, **: p<0.05, and *: p<0.10

79
2.2 Restricting the Analysis to Group Configurations at Independence
The second potential concern is that the results suffer from endogeneity bias as competition
for state power leads to changes in ethnic geography consistent with the purported hypotheses.
Although plausible, this critique encounters significant theoretical and empirical limitations.
Theoretically, while the effect of civil war on ethnic divisions is well discussed in the literature,
there is almost no research suggesting endogenous construction of large identity groups from
coups. Why these forms of violent conflict would have opposite effects on the construction of
identity is not obvious.
Similarly, there are contradicting theories of whether access to power and the rents that
come from power should lead to group enlargement110 or group narrowing.111 According to the
EPR dataset, the active cases of fractionalization in post-colonial Africa are consistent with the
latter group-narrowing hypothesis, which biases the results against us. The EPR 2014 dataset
codes 18 instances of larger ethnic coalitions splitting into smaller ethnic divisions (with 52
resulting groups), of which 94% (all but one) occurred when the group was in, or coming into,
power. Ethnic recombination is less common, with only 5 incidents (from 11 original groups).
Nonetheless, to limit the potential bias that may arise as ethnic configurations change
during the post-colonial period, we re-run the analysis only with the ethnic configurations as
they exist at independence, which reduces the total observations by about seven percent. By
110 Posner 2005. 111 Bates 1983; Bueno de Mesquita et al. 2003; Caselli and Coleman 2013.

80
only including groups as they exist at independence, it will exclude any incidences of
fractionalization and amalgamation as a result of post-colonial politics.
The results, using EPR 2014 and replicating the main models in the paper, are reported in
Table A.2.2. The findings are nearly identical, especially for the effect on powersharing and coup
risk, increasing our confidence that the empirics are not merely driven by post-colonial changes
in ethnic geography.

81
Table A.2.2: Balance of Threat Capabilities and the Likelihood of Ethnic Inclusion, Coups and Civil War with Independence Group Configurations
Ethnic Powersharing Successful Coup Rebellion Onset 1 2 3 4 5 6 HH threat capabilities
0.63*** (0.24)
1.43** (0.65)
-0.54 (0.41)
HL threat capabilities
-0.68** (0.28)
-3.09** (1.20)
0.40
(0.47) LH threat capabilities
0.05 (0.35)
-0.55 (0.69)
0.89* (0.53)
LL threat capabilities
-1.05*** (0.37)
-0.78 (0.66)
0.63
(0.53) Log GDP per capita
0.31** (0.15)
0.30** (0.14)
-0.37 (0.35)
-0.49 (0.36)
-0.44* (0.23)
-0.46** (0.22)
Log country population
-0.01 (0.08)
0.01 (0.08)
-0.20 (0.19)
-0.24 (0.18)
0.22 (0.23)
0.22 (0.22)
Number of ethnic groups
-0.01 (0.05)
0.00 (0.06)
-0.10 (0.09)
-0.04 (0.10)
-0.03 (0.08)
-0.02 (0.09)
Institutionalized regime
0.84*** (0.29)
0.78*** (0.30)
0.73* (0.44)
0.71* (0.41)
-0.18 (0.48)
-0.17 (0.46)
Former French colony
0.49 (0.36)
0.41 (0.35)
0.23 (0.38)
0.19 (0.38)
0.10 (0.65)
0.07 (0.68)
Cold War -0.65 (0.41)
-0.63 (0.42)
-0.03 (0.86)
-0.03 (0.88)
-1.10 (0.87)
-1.10 (0.85)
Year 0.05*** (0.01)
0.05*** (0.01)
-0.07** (0.03)
-0.07** (0.03)
0.03 (0.03)
0.03 (0.03)
Past coup 1.92*** (0.46)
1.69*** (0.50)
Ongoing rebellion 0.13 (0.70)
0.12 (0.70)
Past conflict 0.31 (0.59)
0.29 (0.58)
t -1.80*** (0.16)
-1.79*** (0.16)
-0.19* (0.11)
-0.20* (0.11)
-0.17 (0.11)
-0.17 (0.11)
t2 0.08*** (0.01)
0.08*** (0.01)
0.01** (0.01)
0.01** (0.00)
0.01** (0.00)
0.01** (0.01)
t3 -0.00*** (0.00)
-0.00*** (0.00)
-0.00** (0.00)
-0.00** (0.00)
-0.00** (0.00)
-0.00** (0.00)
constant -101.88 (25.40)
-103.39 (26.41)
139.09 (62.47)
134.57 (62.85)
-60.42 (55.49)
-60.65 (57.18)
N states pseudo r2
6313 38
0.78
6313 38
0.79
6318 38
0.14
6318 38
0.16
6323 38
0.05
6323 38
0.05 Notes: This table reports logistic regression estimates replicating results predicting interethnic powersharing (Models 1 and 2, following EP-5 and EP-6 in main paper), successful coups (Models 3 and 4, following SC-5 and SC-6), and civil war onset (Models 5 and 6, following CW-5 and CW-6). Only ethnic groups which existed at the time of independence are included in the analysis. Threat capabilities independent variables (HH, HL, LH, LL) indicate whether the ruling group and a given non-ruling group, respectively, are above (high) or below (low) the median threat capabilities for the full sample. Cubic polynomials of time since last powersharing (t, t2, t3) are included to account for temporal dependence. Standard errors are clustered by country and statiscial significance is denoted by: ***: p<0.01, **: p<0.05, and *: p<0.10

82
3. Validations and Sensitivity Analysis
Measuring inherently abstract concepts such as threat capabilities, and specifying models
across broad cross-sectional time-series data, requires certain estimation choices. It is important
to validate the results through sensitivity analysis showing whether, and when, these choices
influence the patterns observed. In the discussion below, we present the results of a wide variety
of alternative choices for variable operationalization, case identification criteria, and model
specification. These models demonstrate that the main results are highly robust, and not unduly
influenced by minor details of the empirical strategy.
3.1 Alternative Measures of Threat Capabilities
Central to the paper’s theoretical argument is that it is the balance of threat capabilities
between the ruling group and a given rival group that ultimately shapes political bargaining
outcomes in weak states. To explore these effects, we construct a measure of threat capabilities
of individual groups based on their size and distance from the capital. To code the balance of
threat capabilities for any given non-ruling group relative to the current ruling group, we
construct four dummy variables that measure whether the ruling group’s and the rival group’s
threat capabilities are below or above the median of threat capabilities for all groups in post-
colonial Africa.
In this section we test four adjusted measures of balance of threat capabilities. The first
reports results in which threat capabilities are calculated using a given EPR group’s minimum
distance to the capital city rather than the centroid point of the group. The second reports
results in which size and distance factors are combined into a single measure of threat

83
capabilities by taking their geometric mean, rather than their arithmetic mean. The third
relaxes our dyadic framework (modeling each ruling group versus a given rival group) and
instead takes into account coalitional politics (e.g., alliances between included groups). The
fourth measures threat capabilities specific to each country.
3.1.1 Full Regression Models Using Minimum EPR Group Distance to Capital to Calculate Threat Capabilities
Measuring the effective distance between a given ethnic group and the capital requires
identifying a specific location for that ethnic group. For the main results, we do this by
calculating the centroid of the ethnic group’s territorial polygon—that is, the mathematical
average in two dimensions of latitude and longitude. This midpoint of the area covered by a
group provides a sort of average of how far away its members are from the capital. However, it
may be the case that proximity of any area under territorial control provides a sort of
launching-off point to challenge the capital, and thus the nearest point of the ethnic group’s
territory, not the average position, is more relevant. As a check on the results, we re-calculate
the threat capabilities variable substituting the ICRGrid-cell closest to the capital that
intersects with the group polygon as their location. As shown in Table A.3.1.1, this does not
generally change the direction or significance of the results.
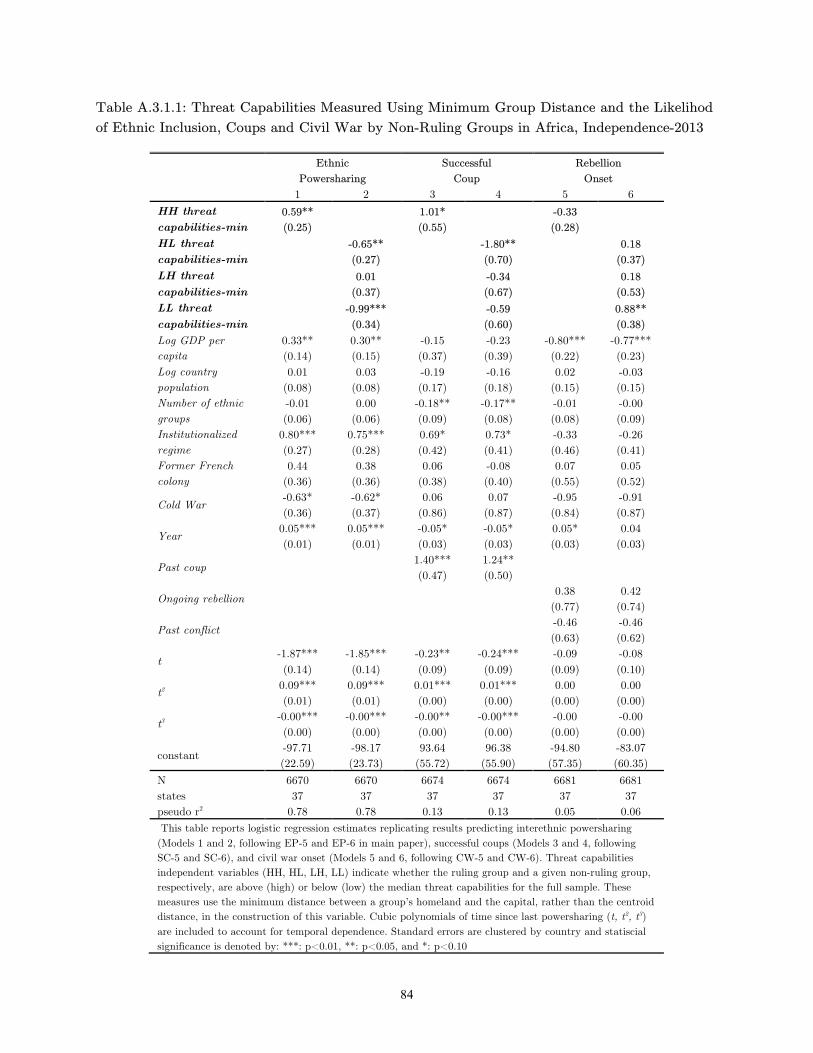
84
Table A.3.1.1: Threat Capabilities Measured Using Minimum Group Distance and the Likelihod of Ethnic Inclusion, Coups and Civil War by Non-Ruling Groups in Africa, Independence-2013
Ethnic Powersharing
Successful Coup
Rebellion Onset
1 2 3 4 5 6 HH threat capabilities-min
0.59** (0.25)
1.01* (0.55)
-0.33 (0.28)
HL threat capabilities-min
-0.65** (0.27)
-1.80** (0.70)
0.18 (0.37)
LH threat capabilities-min 0.01
(0.37) -0.34
(0.67) 0.18
(0.53) LL threat capabilities-min -0.99***
(0.34) -0.59
(0.60) 0.88**
(0.38) Log GDP per capita
0.33** (0.14)
0.30** (0.15)
-0.15 (0.37)
-0.23 (0.39)
-0.80*** (0.22)
-0.77*** (0.23)
Log country population
0.01 (0.08)
0.03 (0.08)
-0.19 (0.17)
-0.16 (0.18)
0.02 (0.15)
-0.03 (0.15)
Number of ethnic groups
-0.01 (0.06)
0.00 (0.06)
-0.18** (0.09)
-0.17** (0.08)
-0.01 (0.08)
-0.00 (0.09)
Institutionalized regime
0.80*** (0.27)
0.75*** (0.28)
0.69* (0.42)
0.73* (0.41)
-0.33 (0.46)
-0.26 (0.41)
Former French colony
0.44 (0.36)
0.38 (0.36)
0.06 (0.38)
-0.08 (0.40)
0.07 (0.55)
0.05 (0.52)
Cold War -0.63* (0.36)
-0.62* (0.37)
0.06 (0.86)
0.07 (0.87)
-0.95 (0.84)
-0.91 (0.87)
Year 0.05*** (0.01)
0.05*** (0.01)
-0.05* (0.03)
-0.05* (0.03)
0.05* (0.03)
0.04 (0.03)
Past coup 1.40*** (0.47)
1.24** (0.50)
Ongoing rebellion 0.38
(0.77) 0.42
(0.74)
Past conflict -0.46 (0.63)
-0.46 (0.62)
t -1.87*** (0.14)
-1.85*** (0.14)
-0.23** (0.09)
-0.24*** (0.09)
-0.09 (0.09)
-0.08 (0.10)
t2 0.09*** (0.01)
0.09*** (0.01)
0.01*** (0.00)
0.01*** (0.00)
0.00 (0.00)
0.00 (0.00)
t3 -0.00*** (0.00)
-0.00*** (0.00)
-0.00** (0.00)
-0.00*** (0.00)
-0.00 (0.00)
-0.00 (0.00)
constant -97.71 (22.59)
-98.17 (23.73)
93.64 (55.72)
96.38 (55.90)
-94.80 (57.35)
-83.07 (60.35)
N states pseudo r2
6670 37
0.78
6670 37
0.78
6674 37
0.13
6674 37
0.13
6681 37
0.05
6681 37
0.06 This table reports logistic regression estimates replicating results predicting interethnic powersharing (Models 1 and 2, following EP-5 and EP-6 in main paper), successful coups (Models 3 and 4, following SC-5 and SC-6), and civil war onset (Models 5 and 6, following CW-5 and CW-6). Threat capabilities independent variables (HH, HL, LH, LL) indicate whether the ruling group and a given non-ruling group, respectively, are above (high) or below (low) the median threat capabilities for the full sample. These measures use the minimum distance between a group’s homeland and the capital, rather than the centroid distance, in the construction of this variable. Cubic polynomials of time since last powersharing (t, t2, t3) are included to account for temporal dependence. Standard errors are clustered by country and statiscial significance is denoted by: ***: p<0.01, **: p<0.05, and *: p<0.10

85
3.1.2 Testing the Effect of the Balance of Threat Capabilities Using Geometric Mean of Size and Distance
Combining two attributes creating societal power—each groups’ size as a share of the
population and its relative proximity to the capital city—requires choices about how to factor
each component into calculations of a single threat capabilities measure. Because we have no
prior reason to believe one is more important than the other, we treat them equally by scaling
both to the [0,1] interval (with similar standard deviations), where 0 represents the minimum
possible strength and 1 the maximum. In the main analysis, we then combine them by
calculating the arithmetic mean: adding the two values and dividing the resulting sum by two.
An alternative approach would be to combine these scaled variables using their geometric
mean: multiplying the two values and taking the square root of the resulting product. This
would capture an interaction of the two factors--even a large group is non-threatening if it is
extremely far away, and even a close group is non-threatening if it is extremely small. To check
whether the effect of threat capabilities on powersharing is robust to such an alternative
construction, we recalculate the main models using threat category codings based on the
geometric mean.112 As shown in Table A.3.1.2, this does not substantially change the results.
112 This measure (intentionally places more weight on the smaller value—combining a 0.1 and a 0.9 will result in a smaller score than combining a 0.5 and a 0.5. Since the mean of scaled group size (0.17) is substantially smaller than the mean of scaled (and reversed) group distance (0.74), the resulting measure is more heavily influenced by, and much more strongly correlated with, values of group size.

86
Table A.3.1.2: Threat Capabilities Measured Using Geometric Mean and the Likelihod of Ethnic Inclusion, Coups and Civil War by Non-Ruling Groups in Africa, Independence-2013
Ethnic Powersharing
Successful Coup
Rebellion Onset
1 2 3 4 5 6 HH threat capabilities-geo
0.74*** (0.19)
1.25** (0.59)
-0.74** (0.37)
HL threat capabilities-geo
-0.75*** (0.20)
-2.20*** (0.85)
0.35 (0.45)
LH threat capabilities-geo -0.45
(0.33) -0.42
(0.91) 1.43**
(0.58) LL threat capabilities-geo -0.89***
(0.31) -0.75
(0.71) 1.21**
(0.51) Log GDP per capita
0.21 (0.14)
0.20 (0.14)
-0.39 (0.34)
-0.42 (0.33)
-0.63*** (0.21)
-0.61*** (0.18)
Log country population
-0.00 (0.08)
0.01 (0.08)
-0.26 (0.18)
-0.22 (0.20)
0.11 (0.15)
0.13 (0.14)
Number of ethnic groups
0.02 (0.05)
0.02 (0.05)
-0.17* (0.09)
-0.14 (0.09)
-0.04 (0.09)
-0.01 (0.11)
Institutionalized regime
0.77*** (0.27)
0.76*** (0.28)
0.73 (0.47)
0.71* (0.41)
-0.23 (0.46)
-0.09 (0.42)
Former French colony
0.40 (0.31)
0.41 (0.31)
-0.18 (0.46)
-0.05 (0.48)
0.16 (0.57)
0.29 (0.48)
Cold War -0.46 (0.36)
-0.47 (0.37)
0.00 (0.86)
0.02 (0.86)
-0.98 (0.82)
-0.95 (0.84)
Year 0.05*** (0.01)
0.05*** (0.01)
-0.06 (0.04)
-0.05 (0.03)
0.04 (0.03)
0.04 (0.03)
Past coup 1.67*** (0.61)
1.39* (0.71)
Ongoing rebellion 0.32
(0.72) 0.27
(0.63)
Past conflict -0.35 (0.64)
-0.44 (0.66)
t -1.85*** (0.13)
-1.84*** (0.13)
-0.20** (0.10)
-0.23** (0.11)
-0.11 (0.09)
-0.11 (0.10)
t2 0.09*** (0.01)
0.09*** (0.01)
0.01** (0.00)
0.01** (0.01)
0.00 (0.00)
0.01 (0.00)
t3 -0.00*** (0.00)
-0.00*** (0.00)
-0.00** (0.00)
-0.00** (0.00)
-0.00 (0.00)
-0.00 (0.00)
constant -88.61 (24.49)
-88.71 (24.78)
113.38 (71.01)
103.10 (67.83)
-80.86 53.76
-72.32 (54.64)
N states pseudo r2
7127 38
0.78
7127 38
0.78
7137 38
0.13
7137 38
0.14
7144 38
0.05
7144 38
0.07 This table reports logistic regression estimates replicating results predicting interethnic powersharing (Models 1 and 2, following EP-5 and EP-6 in main paper), successful coups (Models 3 and 4, following SC-5 and SC-6), and civil war onset (Models 5 and 6, following CW-5 and CW-6). Threat capabilities independent variables (HH, HL, LH, LL) indicate whether the ruling group and a given non-ruling group, respectively, are above (high) or below (low) the median threat capabilities for the full sample. Size and distance are combined into threat capabilities using their geometric mean, rather than their arithmetic mean. Cubic polynomials of time since last powersharing (t, t2, t3) are included to account for temporal dependence. Standard errors are clustered by country and statiscial significance is denoted by: ***: p<0.01, **: p<0.05, and *: p<0.10

87
3.1.3 Testing the Effect of Coalition Capabilities on Powersharing
In the paper we assess relative capabilities in the context of a strategic environment in
which each ethnic group vying for power does so independently of each other. The single ruling
group which is most politically powerful and nearly always controls the executive represents the
power base that must be challenged for an alternative group (either within or outside the
government) to seize control. The relevant balance of capabilities is thus between this ruling
group and others. Other groups which are included in the governing coalition in a secondary role
are not treated as automatic allies of the ruling group. Given the challenges to cross-cutting
mobilization, the difficulty ensuring loyalty between multiple leaders sitting atop distinct power
bases, and the fact that coalitions—even (or especially) those which successfully rise to power
(see section 2.2 above) —frequently splinter, this assumption is theoretically and empirically
defensible. Nonetheless, it is the case (and, indeed, is the focus of our paper) that interethnic
power sharing does occur. Plausibly, then, the appropriate understanding of the strategic
circumstances would consider the entire ruling coalition, not just the specific group whose
representative holds executive office, as the entity in power. To account for this, we re-calculate
our dyadic threat capabilities aggregating all of those groups included in the government on the
ruling side. With respect to potential challenger groups excluded from the government, the
ruling ‘group’ then includes this full aggregation. With respect to potential challenger groups
included in the government, the ruling ‘group’ aggregates only all other groups in power (since
presumably an attempt to seize control would take its own power base on the side of the
challenger). Table A.3.1.3 reports the results of these analyses using the aggregated coalition
measure in the construction of the threat capability dyad variables, showing that the direction

88
and significance of variables of interest are not affected in any meaningful way by this
alternative coding choice. The only differences of note are that the coefficient for LL groups in
powersharing models is no longer significant, while the coefficient for LH groups is significant. It
is not surprising that these terms might shift slightly given what this alternative measure
represents; when aggregating all groups within the ruling coalition, it is relatively infrequent for
a state to have a low threat capability ruler (8.6% and 4.9% of the sample in LH and LL,
respectively).

89
Table A.3.1.3: Coalition Measure of Ruling Group Threat Capabilities and the Likelihod of Ethnic Inclusion, Coups and Civil War by Non-Ruling Groups in Africa, Independence-2013
Ethnic Powersharing
Successful Coup
Rebellion Onset
1 2 3 4 5 6 HH threat capabilities-coalit
0.79*** (0.21)
1.27* (0.77)
-0.86** (0.37)
HL threat capabilities-coalit
-0.85*** (0.23)
-2.44*** (0.94)
0.65 (0.40)
LH threat capabilities-coalit -1.14*
(0.62) 0.76
(1.23) 2.16***
(0.57) LL threat capabilities-coalit 0.14
(0.63) 0.87
(1.09) 1.12*
(0.63) Log GDP per capita
0.22 (0.14)
0.21 (0.14)
-0.41 (0.35)
-0.67 (0.42)
-0.63*** (0.20)
-0.69*** (0.17)
Log country population
0.06 (0.08)
0.03 (0.09)
-0.21 (0.20)
-0.30 (0.22)
0.05 (0.17)
0.11 (0.17)
Number of ethnic groups
0.04 (0.05)
0.04 (0.05)
-0.13 (0.09)
-0.05 (0.09)
-0.06 (0.09)
-0.02 (0.09)
Institutionalized regime
0.77*** (0.27)
0.85*** (0.26)
0.70 (0.45)
0.86 (0.53)
-0.23 (0.45)
-0.02 (0.42)
Former French colony
0.55* (0.32)
0.58* (0.33)
0.03 (0.40)
0.20 (0.43)
0.06 (0.56)
0.23 (0.55)
Cold War -0.49 (0.37)
-0.45 (0.38)
-0.01 (0.82)
0.00 (0.82)
-0.94 (0.82)
-0.81 (0.77)
Year 0.04*** (0.01)
0.04*** (0.01)
-0.05* (0.03)
-0.05* (0.03)
0.04 (0.03)
0.04 (0.02)
Past coup 1.45*** (0.50)
1.41*** (0.47)
Ongoing rebellion 0.37
(0.73) 0.38
(0.74)
Past conflict -0.34 (0.63)
-0.32 (0.64)
t -1.84*** (0.14)
-1.83*** (0.14)
-0.24*** (0.09)
-0.25*** (0.09)
-0.09 (0.10)
-0.07 (0.10)
t2 0.09*** (0.01)
0.08*** (0.01)
0.01*** (0.00)
0.01*** (0.01)
0.00 (0.00)
0.00 (0.00)
t3 -0.00*** (0.00)
-0.00*** (0.00)
-0.00*** (0.00)
-0.00** (0.00)
-0.00 (0.00)
-0.00 (0.00)
constant -85.77 (25.18)
-84.54 (25.31)
99.69 (59.13)
99.17 (52.70)
-81.05 (51.87)
-74.34 (47.38)
N states pseudo r2
7142 38
0.78
7142 38
0.78
7152 38
0.13
7152 38
0.16
7159 38
0.06
7159 38
0.07 This table reports logistic regression estimates replicating results predicting interethnic powersharing (Models 1 and 2, following EP-5 and EP-6 in main paper), successful coups (Models 3 and 4, following SC-5 and SC-6), and civil war onset (Models 5 and 6, following CW-5 and CW-6). Threat capabilities independent variables (HH, HL, LH, LL) indicate whether the ruling group and a given non-ruling group, respectively, are above (high) or below (low) the median threat capabilities for the full sample. Ruling group capabilities are considered as the aggregate of all groups in the governing coalition, rather than simply the group holding the executive office. Cubic polynomials of time since last powersharing (t, t2, t3) are included to account for temporal dependence. Standard errors are clustered by country and statiscial significance is denoted by: ***: p<0.01, **: p<0.05, and *: p<0.10

90
3.1.4 Testing the Effect of Country-Relative Threat Capabilities on Powersharing
Our analysis operationalizes threat capabilities based on a group’s size and distance from the
capital city, which are scaled and combined into a single threat measure. Size is scaled as a
proportion of that country’s population. The ability of a certain number of people to challenge
for control inherently depends on the number of people with whom they would be fighting.
Distance, however, is scaled relative to the continent as a whole, rather than the country itself.
The challenges of power projection—moving and supplying forces and equipment across space—
are more directly related to the actual distance traveled, regardless of whether that distance
represents the entirety of the country or just a small portion. The combined measure of of
threat capabilities for each group-year that results is then classified as above or below the
overall median of this variable in the data, which allows for the possibility that states may have
many high threat capability groups (and thus be more likely to feature interethnic powersharing
and/or coups) or very few high threat capability groups (and thus be more prone to civil war).
An alternative approach would scale both threat components relative to the given country,
and to define high and low threat capabilities relative to the median of the given country.
Although this is less consistent with our theoretical mechanism (and does not allow for countries
to have mostly-high or mostly-low threat capability groups), there is nonetheless some merit to
this approach, given the relative nature of power. Table A.3.1.4 shows models estimated using
this alternative measurement. The empirical results are slightly weaker, but still tell essentially
the same story—all coefficients retain the same sign, and statistical significance is retained in
most cases.

91
Table A.3.1.4: Country-Relative Measure of Group Threat Capabilities and the Likelihod of Ethnic Inclusion, Coups and Civil War by Non-Ruling Groups in Africa, Independence-2013
Ethnic Powersharing
Successful Coup
Rebellion Onset
1 2 3 4 5 6 HH threat capabilities-relat
0.34* (0.19)
0.66* (0.38)
-0.68** (0.32)
HL threat capabilities-relat
-0.32 (0.23)
-0.80** (0.39)
0.44 (0.39)
LH threat capabilities-relat -0.06
(0.29) -0.65
(0.59) 0.86*
(0.44) LL threat capabilities-relat -0.71**
(0.34) -0.19
(0.78) 1.21***
(0.34) Log GDP per capita
0.32** (0.14)
0.28* (0.15)
-0.19 (0.35)
-0.22 (0.39)
-0.66*** (0.25)
-0.64*** (0.24)
Log country population
-0.01 (0.08)
0.01 (0.09)
-0.27 (0.18)
-0.27 (0.18)
0.22 (0.19)
0.17 (0.20)
Number of ethnic groups
-0.03 (0.06)
-0.02 (0.06)
-0.25*** (0.08)
-0.26*** (0.08)
0.02 (0.07)
0.03 (0.09)
Institutionalized regime
0.81*** (0.29)
0.76** (0.30)
0.59 (0.46)
0.60 (0.45)
0.10 (0.40)
0.16 (0.36)
Former French colony
0.45 (0.38)
0.42 (0.37)
-0.03 (0.42)
-0.04 (0.42)
0.33 (0.62)
0.28 (0.63)
Cold War -0.59* (0.35)
-0.61* (0.37)
0.13 (0.84)
0.14 (0.84)
-1.22 (0.88)
-1.18 (0.91)
Year 0.05*** (0.01)
0.05*** (0.01)
-0.05* (0.03)
-0.05* (0.03)
0.05 (0.03)
0.05 (0.03)
Past coup 1.57*** (0.46)
1.54*** (0.53)
Ongoing rebellion 0.58
(0.78) 0.59
(0.74)
Past conflict -0.82 (0.60)
-0.80 (0.58)
t -1.87*** (0.15)
-1.85*** (0.15)
-0.23** (0.09)
-0.23** (0.09)
-0.11 (0.11)
-0.11 (0.12)
t2 0.09*** (0.01)
0.08*** (0.01)
0.01*** (0.00)
0.01*** (0.00)
0.00 (0.00)
0.00 (0.01)
t3 -0.00*** (0.00)
-0.00*** (0.00)
-0.00*** (0.00)
-0.00*** (0.00)
-0.00 (0.00)
-0.00 (0.00)
constant -93.91 (21.69)
-95.81 (22.65)
99.66 (55.00)
99.45 (55.00)
-102.10 (60.24)
-93.58 (60.87)
N states pseudo r2
6843 35
0.78
6843 35
0.78
6847 35
0.12
6847 35
0.12
6854 35
0.05
6854 35
0.06 This table reports logistic regression estimates replicating results predicting interethnic powersharing (Models 1 and 2, following EP-5 and EP-6 in main paper), successful coups (Models 3 and 4, following SC-5 and SC-6), and civil war onset (Models 5 and 6, following CW-5 and CW-6). Threat capabilities independent variables (HH, HL, LH, LL) indicate whether the ruling group and a given non-ruling group, respectively, are above (high) or below (low) the median threat capabilities for the state in question—rather than the full sample. Cubic polynomials of time since last powersharing (t, t2, t3) are included to account for temporal dependence. Standard errors are clustered by country and statiscial significance is denoted by: ***: p<0.01, **: p<0.05, and *: p<0.10

92
3.2 Alternative Classification of Rebellion
In the paper, we analyze the effect of threat capabilities on civil war onset, expecting that
strong rivals will be significantly less likely to engage in large-scale political violence. The
empirical evidence is largely consistent with this expectation. In this section we re-run the
models with alternative codings of the rebellion dependent variable, using both measures of
large-scale rebellion113 and smaller-scale rebellion from the UCDP/PRIO Armed Conflict
Dataset114 and varying the use of either onset or incidence (coded 1 for every year the group is
engaged in large-scale rebellion). The results using smaller-scale rebellion, reported in table
A.3.2.1, are generally similar to those in the main analysis but with more conflicts in HL dyads.
The results using the incidence dependent variable, reported in table A.3.2.2, are substantially
weaker than the onset models. Interestingly in the LL dyads the sign is now negative, perhaps
suggesting that while LL dyads are more likely experience civil war (see Table 3 in main paper)
these are unlikely to be long wars.
113 Roessler 2011 updated through 2013. 114 Vogt 2015; Gleditsch et al. 2002.

93
Table A.3.2.1: Balance of Threat Capabilities and Low-Level Rebellion by Non-Ruling Groups in Africa
Rebellion Onset 1 2 HH threat capabilities
-0.54* (0.29)
HL threat capabilities
0.58* (0.32)
LH threat capabilities
0.84* (0.43)
LL threat capabilities 0.23
(0.32)
Log GDP per capita -0.35** (0.17)
-0.36** (0.17)
Log country population
0.25 (0.16)
0.28 (0.17)
Number of ethnic groups
-0.05 (0.07)
-0.05 (0.06)
Institutionalized regime
0.22 (0.56)
0.20 (0.56)
Former French colony 0.23 (0.36)
0.21 (0.35)
Cold War 0.25 (0.74)
0.27 (0.74)
Year -0.01 (0.02)
-0.01 (0.02)
Ongoing rebellion 0.56 (0.44)
0.57 (0.43)
Past conflict 0.51 (0.43)
0.52 (0.43)
t -0.16** (0.06)
-0.16** (0.06)
t2 0.01** (0.00)
0.01** (0.00)
t3 -0.00** (0.00)
-0.00** (0.00)
constant 7.53
(33.68) 7.54
(32.88) N states pseudo r2
7145 38
0.06
7145 38
0.07 This table reports logistic regression estimates replicating results predicting civil war onset (Models 1 and 2, following CW-5 and CW-6 in main paper). Coding of the dependent variable is adapted to generate a larger set of (smaller scale) rebellions. Threat capabilities independent variables (HH, HL, LH, LL) indicate whether the ruling group and a given non-ruling group, respectively, are above (high) or below (low) the median threat capabilities for the full sample. Cubic polynomials of time since last powersharing (t, t2, t3) are included to account for temporal dependence. Standard errors are clustered by country and statiscial significance is denoted by: ***: p<0.01, **: p<0.05, and *: p<0.10

94
Table A.3.2.2: Balance of Threat Capabilities and Rebellion Incidence by Non-Ruling Groups in Africa, Independence-2013
Large-Scale Rebellion Incidence
Low-Level Rebellion Incidence
1 2 3 4 HH threat capabilities
-0.17 (0.28)
-0.12 (0.23)
HL threat capabilities
0.47 (0.32)
0.21 (0.24)
LH threat capabilities 0.49
(0.45) 0.67*
(0.36) LL threat capabilities -0.48*
(0.26) -0.52*
(0.28)
Log GDP per capita -0.06 (0.14)
-0.07 (0.16)
-0.47** (0.22)
-0.53** (0.20)
Log country population
0.14 (0.12)
0.25** (0.11)
0.29* (0.17)
0.36** (0.17)
Number of ethnic groups
-0.03 (0.05)
-0.06 (0.04)
0.01 (0.05)
0.01 (0.05)
Institutionalized regime
-0.36 (0.31)
-0.30 (0.31)
-0.31 (0.28)
-0.25 (0.28)
Former French colony 0.01 (0.23)
0.13 (0.27)
-0.19 (0.24)
-0.19 (0.22)
Cold War -1.13*** (0.33)
-1.02*** (0.30)
-0.86** (0.36)
-0.75* (0.38)
Year 0.03 (0.02)
0.03* (0.02)
0.03*** (0.01)
0.03*** (0.01)
Ongoing rebellion 1.65*** (0.26)
1.66*** (0.30)
0.82*** (0.26)
0.85*** (0.28)
Past conflict 1.24*** (0.39)
1.31*** (0.38)
0.64*** (0.21)
0.73*** (0.22)
t -1.10*** (0.12)
-1.06*** (0.12)
-0.98*** (0.08)
-0.95*** (0.09)
t2 0.05*** (0.01)
0.05*** (0.01)
0.04*** (0.01)
0.04*** (0.01)
t3 -0.00*** (0.00)
-0.00*** (0.00)
-0.00*** (0.00)
-0.00*** (0.00)
constant -58.17 (38.52)
-55.48 (30.71)
-66.57 (19.50)
-59.29 (20.26)
N states pseudo r2
7145 38
0.70
7145 38
0.71
7145 38
0.58
7145 38
0.59 This table reports logistic regression estimates replicating results predicting civil war (Models 5 and 6, following CW-5 and CW-6 in main paper), using any civil war incidence rather than only civil war onset, for both large scale (Models 1 and 2) and small scale (Models 3 and 4) rebellion. Threat capabilities independent variables (HH, HL, LH, LL) indicate whether the ruling group and a given non-ruling group, respectively, are above (high) or below (low) the median threat capabilities for the full sample. Cubic polynomials of time since last powersharing (t, t2, t3) are included to account for temporal dependence. Standard errors are clustered by country and statiscial significance is denoted by: ***: p<0.01, **: p<0.05, and *: p<0.10

95
3.3 Alternative Classification of Coups
The main analysis of coup outcomes includes only successful coups—those which resulted in
the removal of the executive from power. This ensures that models are including only credible
challenges to seize authority. However, the theoretical logic does not necessarily require this
restriction—even failed coups may be the result of the strategic processes identified. Table A.3.3
below presents estimated models using total coup attempts (successful or unsuccessful) as the
outcome of interest, and shows that the substantive and statistical results are not greatly
influenced by this specification choice.

96
Table A.3.3: Total Coups by Non-Ruling Groups in Africa, Independence-2013
Total Coups 1 2 HH threat capabilities
0.74** (0.31)
HL threat capabilities
-1.22*** (0.43)
LH threat capabilities
-0.38 (0.42)
LL threat capabilities
-0.54 (0.47)
Log GDP per capita -0.37 (0.23)
-0.42* (0.24)
Log country population
-0.14 (0.15)
-0.15 (0.15)
Number of ethnic groups
-0.02 (0.09)
0.02 (0.10)
Institutionalized regime
-0.37 (0.23)
-0.34 (0.22)
Former French colony
0.55* (0.28)
0.53* (0.29)
Cold War -0.39 (0.46)
-0.37 (0.47)
Year 0.00 (0.01)
-0.00 (0.01)
Past coup 1.14*** (0.39)
1.08*** (0.37)
t -0.20** (0.08)
-0.21** (0.08)
t2 0.01** (0.00)
0.01** (0.00)
t3 -0.00** (0.00)
-0.00** (0.00)
constant 1.27 (29.54)
6.43 (28.18)
N states pseudo r2
7137 38
0.14
7137 38
0.14 This table reports logistic regression estimates replicating results predicting coups (Models 1 and 2, following SC-5 and SC-6 in main paper). Coding of the dependent variable is adjusted to include all coup attempts, successful or otherwise. Threat capabilities independent variables (HH, HL, LH, LL) indicate whether the ruling group and a given non-ruling group, respectively, are above (high) or below (low) the median threat capabilities for the full sample. Cubic polynomials of time since last powersharing (t, t2, t3) are included to account for temporal dependence. Standard errors are clustered by country and statiscial significance is denoted by: ***: p<0.01, **: p<0.05, and *: p<0.10

97
3.4 Models with Additional Control Variables
Finally, we assess the robustness of the empirical results by estimating models with
additional, or alternative, control variables.
3.4.1 Controlling for Extant Levels of Powesharing on Ethno-Political Bargaining (Cross-Group Analysis)
Interactions between ruling groups and other groups do not occur in a vacuum—each dyadic
relationship may be influenced by other relationships in the same state-year. The nature of this
influence is not theoretically clear: inclusion of one group may increase the likelihood others’
inclusion as the benefits of peace are expanded, it may decrease the likelihood of others’
inclusion as the increasingly strong coalition has less need for further allies, or it may have no
effect on the likelihood of others’ inclusion beyond the underlying exogenous propensity of a
particular ruling group to seek out governing partners. To explore this, we generate variables
measuring whether and how much powersharing is occurring in a given year—a binary indicator
of whether there were any groups beyond the executive included in the ruling coalition and a
count of the number of groups in the ruling coalition. The results of powersharing models
including this control variable are presented in Table A.3.4.1. The threat capability variables of
interest remain strongly and consistently statistically significant in the expected direction.

98
Table A.3.4.1: Controlling for Extant Levels of Ethnic Powersharing on and the Likelihod of Ethnic Inclusion by Non-Ruling Groups in Africa, Independence-2013
Ethnic Powersharing 1 2 3 4 HH threat capabilities
0.69*** (0.20)
0.63*** (0.23)
HL threat capabilities
-0.67*** (0.21)
-0.47* (0.27)
LH threat capabilities
-0.23 (0.36)
-0.23 (0.37)
LL threat capabilities -1.18***
(0.36) -1.35***
(0.33)
Log GDP per capita -0.01 (0.14)
-0.02 (0.14)
0.12 (0.17)
0.12 (0.17)
Log country population
-0.00 (0.06)
0.03 (0.06)
0.04 (0.10)
0.10 (0.10)
Number of ethnic groups
-0.05 (0.05)
-0.04 (0.05)
-0.06 (0.05)
-0.06 (0.05)
Institutionalized regime
0.49* (0.26)
0.40 (0.27)
0.58** (0.24)
0.44* (0.25)
Former French colony 0.62** (0.25)
0.60** (0.24)
0.48 (0.34)
0.47 (0.32)
Cold War -0.92** (0.38)
-0.94** (0.38)
-0.64 (0.41)
-0.61 (0.43)
Year 0.05*** (0.01)
0.05*** (0.01)
0.04*** (0.01)
0.04*** (0.01)
Non-ruling groups in power (count)
0.41*** (0.10)
0.42*** (0.10)
Non-ruling groups in power (yes/no)
2.01*** (0.40)
2.19*** (0.40)
t -1.95*** (0.15)
-1.93*** (0.15)
-1.90*** (0.14)
-1.88*** (0.14)
t2 0.09*** (0.01)
0.09*** (0.01)
0.09*** (0.01)
0.09*** (0.01)
t3 -0.00*** (0.00)
-0.00*** (0.00)
-0.00*** (0.00)
-0.00*** (0.00)
constant -94.06 (26.40)
-96.56 (26.66)
-96.76 (26.64)
-83.13 28.35
N states pseudo r2
7072 38
0.80
7072 38
0.80
7072 38
0.80
7072 38
0.81 This table reports logistic regression estimates replicating results predicting ethnic powersharing (following EP-5 and EP-6 in Table 1 in main paper), including the count of non-ruling groups in the governing coalition (Models 1 and 2) or simply the existence of any non-ruling groups in the governing coalition (Models 3 and 4) as control variables. Threat capabilities independent variables (HH, HL, LH, LL) indicate whether the ruling group and a given non-ruling group, respectively, are above (high) or below (low) the median threat capabilities for the full sample. Cubic polynomials of time since last powersharing (t, t2, t3) are included to account for temporal dependence. Standard errors are clustered by country and statiscial significance is denoted by: ***: p<0.01, **: p<0.05, and *: p<0.10

99
3.4.2 Testing the Effect of Former British Colonies
In the paper we test the effect of a country being a former French colony in order to control
for possible external effects on powersharing. France had a particularly interventionist post-
colonial foreign policy and went to great lengths to protect favored rulers. There results show
that there is no consistent or significant effect that being a former French colony had on ethnic
powersharing, coups, or civil war.
In this section we control for the effect of being a former British colony. We do not
necessarily expect the British legacy to work similarly to the French legacy in terms of an
external guarantor for certain regimes. Instead, Wucherpfennig, Hunizker, and Cederman (2016)
suggest that the British legacy effects on powersharing are more institutional. British policies of
indirect rule empowered peripheral groups and increased their political capabilities to gain a
share of the inaugural governments, resulting in path dependent effects beyond independence.115
Thus, in British colonies this institutional legacy may mitigate differentials in societal power and
facilitate powersharing with groups with low threat capabilities. Table A.3.4.2 reports our
baseline models for powersharing, coups, and group rebellion, but controlling for former British
colonies instead of former French colonies. Incorporating a former British colony variable in the
models has no effect on the statistical significance of the balance of threat capabilities variables
(and does not itself show evidence of significant association with the outcomes of interest).
115 Wucherpfennig et al. 2015.

100
Table A.3.4.2: The Effect of British Institutional Legacies on the Likelihood of Ethnic Inclusion, Coups and Civil War by Non-Ruling Groups in Africa, Independence-2013
Ethnic Powersharing
Successful Coup
Rebellion Onset
1 2 3 4 5 6 HH threat capabilities
0.56** (0.22)
1.09* (0.66)
-0.69* (0.41)
HL threat capabilities
-0.62** (0.25)
-2.23** (0.92)
0.50 (0.46)
LH threat capabilities -0.04
(0.37) -0.18
(0.65) 0.99**
(0.50) LL threat capabilities -0.97***
(0.28) -0.73
(0.73) 1.03*
(0.53) Log GDP per capita
0.21 (0.14)
0.22 (0.14)
-0.38 (0.32)
-0.49 (0.33)
-0.64*** (0.22)
-0.68*** (0.22)
Log country population
-0.00 (0.08)
0.03 (0.08)
-0.17 (0.19)
-0.19 (0.18)
0.07 (0.14)
0.04 (0.14)
Number of ethnic groups
-0.01 (0.05)
0.01 (0.05)
-0.17* (0.10)
-0.13 (0.09)
-0.03 (0.09)
-0.03 (0.10)
Institutionalized regime
0.80*** (0.27)
0.77*** (0.28)
0.71 (0.44)
0.68 (0.43)
-0.18 (0.42)
-0.16 (0.40)
Former British colony
-0.21 (0.34)
-0.25 (0.35)
0.03 (0.47)
0.19 (0.47)
-0.31 (0.38)
-0.12 (0.40)
Cold War -0.47 (0.36)
-0.45 (0.37)
0.05 (0.86)
0.07 (0.87)
-1.00 (0.82)
-0.98 (0.81)
Year 0.04*** (0.01)
0.04*** (0.01)
-0.05* (0.03)
-0.05* (0.03)
0.04 (0.03)
0.04 (0.03)
Past coup 1.51*** (0.49)
1.31*** (0.49)
Ongoing rebellion 0.34
(0.70) 0.35
(0.67)
Past conflict -0.36 (0.60)
-0.36 (0.67)
t -1.87*** (0.14)
-1.85*** (0.14)
-0.23** (0.10)
-0.23** (0.10)
-0.10 (0.10)
-0.10 (0.10)
t2 0.09*** (0.01)
0.09*** (0.01)
0.01*** (0.00)
0.01*** (0.00)
0.01 (0.00)
0.00 (0.00)
t3 -0.00*** (0.00)
-0.00*** (0.00)
-0.00** (0.00)
-0.00*** (0.00)
-0.00 (0.00)
-0.00 (0.00)
constant -80.07 (24.95)
-81.21 (25.15)
108.88 (59.81)
110.78 (60.17)
-84.06 (54.04)
-79.14 (56.00)
N states pseudo r2
7127 38
0.77
7127 38
0.77
7137 38
0.13
7137 38
0.14
7144 38
0.06
7144 38
0.06 This table reports logistic regression estimates replicating results predicting interethnic powersharing (Models 1 and 2, following EP-5 and EP-6 in main paper), successful coups (Models 3 and 4, following SC-5 and SC-6), and civil war onset (Models 5 and 6, following CW-5 and CW-6). A control variable is included for being a former British colony, replacing that for former French colony. Threat capabilities independent variables (HH, HL, LH, LL) indicate whether the ruling group and a given non-ruling group, respectively, are above (high) or below (low) the median threat capabilities for the full sample. Cubic polynomials of time since last powersharing (t, t2, t3) are included to account for temporal dependence. Standard errors are clustered by country and statiscial significance is denoted by: ***: p<0.01, **: p<0.05, and *: p<0.10

101
3.4.3 Testing the Effect of Having Ethnic Kin Abroad
In modeling the effect of threat capabilities on ethno-political bargaining in Africa’s weak
states, we focus solely on the domestic determinants of a given group’s mobilizational potential.
Of course, states are not self-contained units and external factors can have a strong bearing on
domestic political bargaining and conflict. We include basic controls for potential external
sources of powesharing, including being a former French colony and the end of the Cold War,
which has led to a significant increase in negotiated political settlements and peacekeeping
missions. Neither has a strong effect on the domestic determinants of powersharing. An external
factor that may be more likely to have a direct bearing on inter-ethnic bargaining is whether a
given group has ethnic kin abroad. Cetinyan finds that ethnic groups having powerful kin
groups abroad receive better concessions from the government and are less likely to face political
discrimination; he hypothesizes this is precisely due to the greater mobilizational capabilities
that such groups gain from external support.116
Following from this we test the effect of having ethnic kin in a neighboring country. Data for
this variable comes from Cederman et al., who systematically code whether a given EPR group
represents a transnational ethnic group or is largely concentrated in a single state.117 Table
A.3.4.3 reports the results of including a dummy variable for whether a given EPR group
represents a transnational ethnic group. Including this variable also has no effect on the
statistical or substantive significance of our measures of balance of threat capabilities. The
116 Cetinyan 2002. 117 Cederman et al. 2013.
102
variable itself is not a statistically significant predictor of ethnic powersharing, coups, or civil
wars.

103
Table A.3.4.3: The Effect of Transnational Ethnic Linkages on the Likelihood of Ethnic Inclusion, Coups and Civil War by Non-Ruling Groups in Africa, Independence-2013
Ethnic Powersharing
Successful Coup
Rebellion Onset
1 2 3 4 5 6 HH threat capabilities
0.62*** (0.22)
1.14* (0.63)
-0.77** (0.38)
HL threat capabilities
-0.66*** (0.25)
-2.27** (0.91)
0.53
(0.44) LH threat capabilities
-0.11 (0.35)
-0.32 (0.63)
1.07** (0.46)
LL threat capabilities
-0.94*** (0.30)
-0.87 (0.68)
1.13** (0.51)
Log GDP per capita 0.22 (0.14)
0.23* (0.14)
-0.40 (0.34)
-0.50 (0.35)
-0.64*** (0.20)
-0.68*** (0.19)
Log country population
0.06 (0.08)
0.08 (0.08)
-0.13 (0.19)
-0.15 (0.18)
0.05 (0.17)
0.01 (0.17)
Number of ethnic groups
0.03 (0.05)
0.04 (0.05)
-0.13 (0.10)
-0.09 (0.10)
-0.05 (0.09)
-0.04 (0.10)
Institutionalized regime
0.80*** (0.27)
0.77*** (0.28)
0.73* (0.44)
0.71* (0.42)
-0.26 (0.46)
-0.18 (0.4`)
Former French colony
0.62* (0.33)
0.58* (0.32)
0.29 (0.39)
0.21 (0.39)
-0.05 (0.54)
-0.13 (0.54)
Cold War -0.48 (0.37)
-0.46 (0.38)
-0.00 (0.86)
0.01 (0.88)
-0.96 (0.83)
-0.96 (0.82)
Year 0.04*** (0.01)
0.04*** (0.01)
-0.05* (0.03)
-0.05* (0.03)
0.04 (0.03)
0.04 (0.03)
Transnational ethnic kin
-0.09 (0.22)
-0.09 (0.21)
0.17 (0.30)
0.16 (0.29)
0.08 (0.30)
0.12 (0.28)
Past coup 1.53*** (0.53)
1.33** (0.53)
Ongoing rebellion 0.35 (0.73)
0.36 (0.67)
Past conflict -0.32 (0.61)
-0.34 (0.62)
t -1.85*** (0.14)
-1.84*** (0.14)
-0.22** (0.09)
-0.23** (0.09)
-0.10 (0.10)
-0.10 (0.10)
t2 0.09*** (0.01)
0.08*** (0.01)
0.01*** (0.00)
0.01*** (0.00)
0.00 (0.00)
0.00 (0.00)
t3 -0.00*** (0.00)
-0.00*** (0.00)
-0.00** (0.00)
-0.00*** (0.00)
-0.00 (0.00)
-0.00 (0.00)
constant -83.89 (24.01)
-84.52 (24.34)
106.24 (61.91)
106.04 (60.40)
-82.21 (52.90)
-76.21 (54.76)
N states pseudo r2
7127 38
0.77
7127 38
0.78
7137 (38) 0.13
7137 38
0.14
7144 38
0.05
7144 38
0.06 This table reports logistic regression estimates replicating results predicting interethnic powersharing (Models 1 and 2, following EP-5 and EP-6 in main paper), successful coups (Models 3 and 4, following SC-5 and SC-6), and civil war onset (Models 5 and 6, following CW-5 and CW-6). A control variable measuring whether the group has ethnic kin in a neighboring country is added. Threat capabilities independent variables (HH, HL, LH, LL) indicate whether the ruling group and a given non-ruling group, respectively, are above (high) or below (low) the median threat capabilities for the full sample. Cubic polynomials of time since last powersharing (t, t2, t3) are included to account for temporal dependence. Standard errors are clustered by country and statiscial significance is denoted by: ***: p<0.01, **: p<0.05, and *: p<0.10

104
3.4.4 Testing the Effect of Social Distance Between Ethnic Groups
Cultural factors provide another possible cause of patterns of conflict and cooperation among
ethnic groups. According to such a view, powersharing is cemented not by the balance of threat
capabilities but rather by cross-cutting cultural institutions that facilitate inter-ethnic
cooperation. Ruling groups may be more likely to include in government others with whom they
share religious, linguistic, or racial commonalities.
To ensure that our results are robust to this potential influence, we use the EPR-Ethnic
Dimensions Dataset118 to construct variables indicating whether or not the case group and the
ruling group in a given dyad-year shared the same primary religion, primary language, or
primary race. Table A.3.4.4 reports the results of models including these control variables. The
importance of the core threat capabilities variables is not greatly affected—all coefficients retain
the same sign and approximate magnitude, and nearly all retain statistical significance.
Interestingly, there is mixed evidence of the effect of ethnic similarity itself on our outcomes of
interest. None are statistically significant predictors of interethnic powersharing. All are
associated with coup likelihood, but in different directions—religious ties are associated with
lesser coup probability, while linguistic or racial ties are associated with greater coup
probability. Only shared race has a (negative) association with the likelihood of civil war. These
results are curious, and bear further examination in future research.
118 Bormann et al. 2015.

105
Table A.3.4.4: The Effect of Social Distance on the Likelihood of Ethnic Inclusion, Coups and Civil War by Non-Ruling Groups in Africa, Independence-2013
Powersharing Coups Rebellion 1 2 3 4 5 6 HH threat capabilities
0.53** (0.22)
1.13* (0.65)
-0.91** (0.38)
HL threat capabilities
-0.58** (0.26)
-1.99** (0.89)
0.53 (0.46)
LH threat capabilities
0.03 (0.36)
-0.56 (0.82)
1.37*** (0.43)
LL threat capabilities -0.83*** (0.29)
-0.93 (0.74)
1.29*** (0.46)
Log GDP per capita 0.25** (0.13)
0.26** (0.13)
-0.31 (0.34)
-0.36 (0.36)
-0.67*** (0.21)
-0.77*** (0.22)
Log country population 0.06 (0.07)
0.09 (0.08)
0.13 (0.16)
0.12 (0.18)
0.08 (0.17)
0.04 (0.17)
Number of ethnic groups 0.04 (0.06)
0.05 (0.06)
-0.12 (0.12)
-0.10 (0.12)
-0.08 (0.06)
-0.06 (0.07)
Institutionalized regime 0.84*** (0.29)
0.82*** (0.30)
0.73 (0.49)
0.69 (0.47)
-0.13 (0.36)
-0.04 (0.32)
Former French colony 0.66* (0.35)
0.60* (0.33)
1.07** (0.53)
0.94* (0.56)
-0.21 (0.63)
-0.35 (0.58)
Cold War -0.48 (0.38)
-0.46 (0.38)
-0.91 (0.66)
-0.89 (0.67)
-0.99 (0.80)
-0.96 (0.80)
Year 0.04*** (0.01)
0.04*** (0.01)
-0.03 (0.03)
-0.03 (0.03)
0.04 (0.03)
0.04 (0.03)
Common primary religion
-0.07 (0.29)
-0.00 (0.29)
-0.75* (0.44)
-0.64 (0.49)
0.23 (0.30)
0.25 (0.30)
Common primary language
1.31** (0.61)
1.31** (0.63)
1.54** (0.63)
1.43** (0.62)
0.86 (0.53)
0.80 (0.52)
Common primary race 0.01 (0.34)
-0.03 (0.34)
1.31*** (0.34)
1.14*** (0.38)
-0.81*** (0.29)
-1.08*** (0.33)
Past coup 1.10* (0.59)
0.99* (0.59)
Ongoing rebellion 0.24 (0.77)
0.23 (0.72)
Past conflict -0.42 (0.56)
-0.52 (0.58)
t -1.90*** (0.14)
-1.89*** (0.14)
-0.21* (0.11)
-0.23* (0.12)
-0.09 (0.10)
-0.09 (0.10)
t2 0.09*** (0.01)
0.09*** (0.01)
0.01* (0.01)
0.01** (0.01)
0.00 (0.00)
0.00 (0.00)
t3 -0.00*** (0.00)
-0.00*** (0.00)
-0.00* (0.00)
-0.00** (0.00)
-0.00 (0.00)
-0.00 (0.00)
constant -81.68 (25.97)
-82.07 (26.40)
46.75 (56.81)
48.54 (55.69)
-87.19 (50.39)
-83.60 (50.74)
N states pseudo r2
7095 38
0.78
7089 38
0.78
7099 38
0.16
7099 38
0.17
7106 38
0.07
7106 38
0.07 This table reports logistic regression estimates replicating results predicting interethnic powersharing (Models 1 and 2, following EP-5 and EP-6 in main paper), successful coups (Models 3 and 4, following SC-5 and SC-6), and civil war onset (Models 5 and 6, following CW-5 and CW-6). Control variables are added indicating whether the non-ruling group shares a common primary religion, language, or race with the ruling group. Threat capabilities independent variables (HH, HL, LH, LL) indicate whether the ruling group and a given non-ruling group, respectively, are above (high) or below (low) the median threat capabilities for the full sample. Cubic polynomials of time since last powersharing (t, t2, t3) are included to account for temporal dependence. Standard errors are clustered by country and statiscial significance is denoted by: ***: p<0.01, **: p<0.05, and *: p<0.10

106
3.4.5 Controlling for Determinants of State Size and Shape
One implication of our use of an absolute measure of threat capabilities is, as to be expected,
the index is strongly correlated with country size. Most HH dyad-years (about 75%) are in
countries below the median in terms of size. Our argument thus sheds light on the mechanisms
by which Africa’s large states tend to have significantly higher levels of ethnopolitical exclusion.
But this correlation also points to a potential source of endogeneity—the measure is sensitive to
the size and shape of Africa’s states, which may otherwise influence or be influenced by political
outcomes. This is not a problem if Africa’s borders are arbitrary, as scholars often treat them.
But in an illuminating paper, Green (2012) suggests this assumption is problematic. The size of
African states is significantly correlated with pre-colonial population density and trade
networks. In Green’s interpretation, the European colonizers, concerned about the financial
viability of prospective colonies, partitioned territory based on the density of its potential tax
base and the intensity of trade networks in a given territory (the greater the intensity of trade,
the less need for a larger area). Thus, it could be that the relationship between threat
capabilities and powersharing is driven by these favorable demographic and trade conditions
that facilitated economic development and state consolidation, underwriting inter-ethnic
cooperation.
To account for this possibility, we re-estimate our main models (EP-5, EP-6, SC-5, SC-6,
CW-5, CW-6) controlling for pre-colonial population density and trade (distance to coast) taken

107
from Green.119 The results reported below (see Table A.3.4.5) show that including these
historical factors does not alter the results.
119 Green 2012.

108
Table A.3.4.5: Controlling for Historical Determinants of State Size and Shape
Powersharing Coups Rebellion 1 2 3 4 5 6 HH threat capabilities
0.60*** (0.23)
0.81
(0.62)
-0.91** (0.39)
HL threat capabilities
-0.70*** (0.22)
-1.92** (0.94)
0.71
(0.44) LH threat capabilities
-0.14 (0.37)
-0.12 (0.64)
1.12** (0.50)
LL threat capabilities
-0.93** (0.38)
-0.34 (0.73)
1.23** (0.54)
Log GDP per capita 0.21 (0.14)
0.22 (0.14)
-0.23 (0.40)
-0.32 (0.41)
-0.54** (0.28)
-0.57** (0.26)
Log country population
0.08 (0.09)
0.10 (0.09)
-0.13 (0.16)
-0.13 (0.15)
0.01 (0.22)
-0.02 (0.22)
Number of ethnic groups
0.05 (0.06)
0.06 (0.06)
-0.12 (0.10)
-0.07 (0.10)
-0.08 (0.10)
-0.06 (0.12)
Institutionalized regime
0.72*** (0.27)
0.69** (0.28)
0.61 (0.46)
0.62 (0.44)
-0.14 (0.41)
-0.08 (0.36)
Former French colony
0.59 (0.41)
0.53 (0.40)
0.48 (0.41)
0.40 (0.40)
-0.03 (0.58)
-0.07 (0.62)
Cold War -0.57 (0.36)
-0.54 (0.37)
0.04 (0.87)
0.07 (0.89)
-0.95 (0.81)
-0.94 (0.81)
Year 0.05*** (0.01)
0.05*** (0.01)
-0.05 (0.03)
-0.05 (0.03)
0.04 (0.03)
0.04 (0.03)
Population density (1850)
-0.13 (0.22)
-0.17 (0.23)
0.46* (0.28)
0.44* (0.26)
0.29 (0.25)
0.30 (0.27)
Pre-colonial trade -0.36*** (0.13)
-0.35*** (0.13)
-0.14 (0.21)
-0.15 (0.20)
0.46 (0.36)
0.40 (0.35)
Past coup 1.31*** (0.46)
1.14** (0.48)
Ongoing rebellion 0.28 (0.72)
0.30 (0.68)
Past conflict -0.29 (0.58)
-0.32 (0.59)
t -1.84*** (0.14)
-1.82*** (0.14)
-0.23** (0.10)
-0.24** (0.10)
-0.10 (0.11)
-0.10 (0.11)
t2 0.08*** (0.01)
0.08*** (0.01)
0.01** (0.01)
0.01*** (0.01)
0.01 (0.00)
0.01 (0.00)
t3 -0.00*** (0.00)
-0.00*** (0.00)
-0.00** (0.00)
-0.00** (0.00)
-0.00 (0.00)
-0.00 (0.00)
constant -88.49 (22.10)
-88.70 (22.19)
97.42 (59.38)
96.98 (58.16)
-83.05 (56.91)
-79.04 (57.87)
N states pseudo r2
6945 37
0.78
6945 37
0.78
6949 37
0.14
6949 37
0.15
6956 37
0.06
6956 37
0.06 This table reports logistic regression estimates replicating results predicting interethnic powersharing (Models 1 and 2, following EP-5 and EP-6 in main paper), successful coups (Models 3 and 4, following SC-5 and SC-6), and civil war onset (Models 5 and 6, following CW-5 and CW-6). Control variables are added measuring pre-colonial population density and trade exposure to account for factors determining the size and shape (and thus ethnic composition) of states. Threat capabilities independent variables (HH, HL, LH, LL) indicate whether the ruling group and a given non-ruling group, respectively, are above (high) or below (low) the median threat capabilities for the full sample. Cubic polynomials of time since last powersharing (t, t2, t3) are included to account for temporal dependence. Standard errors are clustered by country and statiscial significance is denoted by: ***: p<0.01, **: p<0.05, and *: p<0.10

109
3.4.6 Controlling for Determinants of Social Fractionalization
Another potential source of endogeneity may be the determinants of social fractionalization.
Similar to state size and shape, threat capabilities are correlated with the level of ethnic
fractionalization of a given country—the more groups, the weaker their threat capabilities. In
our main models we control for the number of groups in a given country. But it could be the
case that the association between the outcomes of interest and threat capabilities is endogenous
to the factors that produce ethnic fractionalization—such as variation in land and elevation.120
Rugged terrain and uneven land suitability may produce both groups with weak threat
capabilities and civil wars. To control for this we re-estimate our main models including
variables capturing a country’s standard deviation of elevation and standard deviation of land
quality taken from Michalopolous (2012). As shown in Table A.3.4.6 the results are robust to
the inclusion of these determinants as well. Quite interestingly, countries with varied terrain are
significantly less likely to have coups and civil wars, whereas civil wars appear to be significantly
more likely in countries with high variation in land quality and low variation of elevation. These
patterns bear further analysis in future research.
120 Michalopoulos 2012.

110
Table A.3.4.6: Controlling for Determinants of Social Fractionalization
Ethnic Powersharing
Successful Coup
Rebellion Onset
1 2 3 4 5 6 HH threat capabilities
0.63*** (0.21)
0.64
(0.56)
-0.83** (0.37)
HL threat capabilities
-0.72*** (0.24)
-1.78** (0.88)
0.39
(0.49) LH threat capabilities
-0.06 (0.35)
0.10
(0.70)
1.33*** (0.47)
LL threat capabilities
-0.87*** (0.30)
0.09
(0.57)
2.11*** (0.45)
Log GDP per capita 0.28* (0.15)
0.29* (0.15)
-0.38 (0.33)
-0.54 (0.35)
-0.64*** (0.23)
-0.79*** (0.21)
Log country population
0.07 (0.11)
0.10 (0.12)
0.54*** (0.19)
0.59*** (0.20)
-0.01 (0.25)
-0.11 (0.17)
Number of ethnic groups
0.01 (0.06)
0.03 (0.06)
-0.32** (0.15)
-0.29** (0.12)
-0.14* (0.08)
-0.17*** (0.06)
Institutionalized regime
0.85*** (0.30)
0.84*** (0.31)
0.84** (0.41)
0.89** (0.41)
-0.24 (0.42)
-0.10 (0.35)
Former French colony
0.46 (0.37)
0.40 (0.35)
-0.29 (0.40)
-0.33 (0.41)
-0.53 (0.54)
-1.14** (0.46)
Cold War -0.62* (0.36)
-0.61 (0.37)
-0.16 (1.01)
-0.14 (1.03)
-0.91 (0.77)
-0.84 (0.81)
Year 0.05*** (0.01)
0.05*** (0.01)
-0.06* (0.03)
-0.06* (0.03)
0.04* (0.03)
0.04 (0.03)
Variation in elevation
-0.49 (0.51)
-0.49 (0.53)
-3.21*** (0.80)
-3.49*** (0.75)
-1.20** (0.55)
-2.09*** (0.52)
Variation in land quality
0.08 (0.20)
0.03 (0.22)
-0.81** (0.38)
-0.80** (0.36)
0.65* (0.39)
1.11*** (0.22)
Past coup 1.09** (0.44)
0.85* (0.45)
Ongoing rebellion 0.24 (0.67)
0.20 (0.57)
Past conflict -0.43 (0.57)
-0.55 (0.57)
t -1.84*** (0.14)
-1.83*** (0.13)
-0.21** (0.10)
-0.21** (0.10)
-0.10 (0.09)
-0.10 (0.09)
t2 0.08*** (0.01)
0.08*** (0.01)
0.01** (0.01)
0.01** (0.01)
0.01 (0.00)
0.01 (0.00)
t3 -0.00*** (0.00)
-0.00*** (0.00)
-0.00** (0.00)
-0.00** (0.00)
-0.00 (0.00)
-0.00 (0.00)
constant -96.54 (22.55)
-96.86 (22.75)
108.57 (62.91)
108.86 (61.62)
-83.69 (50.37)
-66.13 (54.59)
N states pseudo r2
6945 37
0.78
6945 37
0.78
6949 37
0.17
6949 37
0.19
6956 37
0.07
6956 37
0.09 This table reports logistic regression estimates replicating results predicting interethnic powersharing (Models 1 and 2, following EP-5 and EP-6 in main paper), successful coups (Models 3 and 4, following SC-5 and SC-6), and civil war onset (Models 5 and 6, following CW-5 and CW-6). Control variables are added measuring variation in land quality and land elevation to account for factors influencing ethnic fractionalization. Threat capabilities independent variables (HH, HL, LH, LL) indicate whether the ruling group and a given non-ruling group, respectively, are above (high) or below (low) the median threat capabilities for the full sample. Cubic polynomials of time since last powersharing (t, t2, t3) are included to account for temporal dependence. Standard errors are clustered by country and statiscial significance is denoted by: ***: p<0.01, **: p<0.05, and *: p<0.10

111
3.4.7 Interactions between Powersharing, Coups, and Civil War
As we argue theoretically, the outcomes of powersharing, coups, and rebellions are not
independent of each other—they are different outcomes emerging from the underlying strategic
processes of and choices available to groups vying for power. To explore whether this association
alone is driving results, rather than the threat capabilities variables we believe to be the
underlying cause of this association, we estimate additional models including lagged values of
the other dependent variables—whether the previous year featured powersharing, coup, or civil
war between the two groups. The results are presented in Table A.3.4.7. The findings are
extremely similar to those in the main analysis—the balance of threat capabilities variables
retain statistical significance, in the expected directions.
The lagged dependent variables themselves show mixed results. There is no evidence of any
separate effect of prior coups or civil wars on the likelihood of powersharing. Ethnic
powersharing has a statistically significant and negative association with the likelihood of
rebellion (though not with the likelihood of coups), while a prior coup has a statistically
significant and positive association with civil war when controlling for inclusion (i.e., groups that
seize power in a coup in a given year but then lose power in the subsequent year are more likely
to rebel).121
121 The onset of a rebellion in the previous period is dropped from the model predicting coups because there are no cases where rebellion is followed by a coup in the following year. This is unsurprising for both political and coding reasons. Strategically, rulers facing active rebellions are unlikely to accord them a partial share of the state—which would further increase their military capabilities—without some kind of credible gurantees they will not leverage this to usurp power for themselves. For research purposes, an attempt to violently seize power in the context of an ongoing civil war will likely be coded as part of that conflict, rather than as a distinct coup event.

112
Table A.3.4.7: Interactive Effects of Past Outcomes and the Likelihod of Ethnic Inclusion, Coups and Civil War by Non-Ruling Groups in Africa, Independence-2013
Ethnic Powersharing Successful Coup Rebellion Onset 1 2 3 4 5 6 HH threat capabilities
0.56** (0.23)
1.15* (0.64)
-0.77* (0.42)
HL threat capabilities
-0.61** (0.26)
-2.31** (0.91)
0.45 (0.43)
LH threat capabilities
-0.05 (0.36)
-0.32 (0.63)
1.19** (0.53)
LL threat capabilities
-0.84*** (0.30)
-0.90 (0.72)
1.14** (0.52)
Log GDP per capita 0.22 (0.14)
0.22 (0.14)
-0.41 (0.34)
-0.49 (0.36)
-0.59*** (0.22)
-0.62*** (0.20)
Log country population 0.05 (0.08)
0.07 (0.08)
-0.14 (0.20)
-0.16 (0.20)
0.03 (0.18)
-0.00 (0.18)
Number of ethnic groups
0.02 (0.05)
0.03 (0.05)
-0.14 (0.09)
-0.09 (0.09)
-0.06 (0.08)
-0.04 (0.10)
Institutionalized regime 0.84*** (0.28)
0.81*** (0.29)
0.71 (0.46)
0.71 (0.45)
-0.02 (0.46)
0.08 (0.42)
Former French colony 0.60* (0.33)
0.55* (0.32)
0.28 (0.44)
0.22 (0.45)
0.19 (0.64)
0.14 (0.60)
Cold War -0.51 (0.38)
-0.49 (0.38)
-0.02 (0.87)
-0.00 (0.89)
-0.88 (0.78)
-0.85 (0.78)
Year 0.04*** (0.01)
0.04*** (0.01)
-0.05* (0.03)
-0.05* (0.03)
0.05* (0.03)
0.05* (0.03)
Past coup 1.47*** (0.51)
1.30** (0.51)
Ongoing rebellion 0.29 (0.73)
0.31 (0.68)
Past conflict -0.47 (0.59)
-0.53 (0.60)
Ethnic powersharing (lag)
-0.01 (0.55)
-0.11 (0.55)
-1.35*** (0.37)
-1.44*** (0.39)
Successful coup (lag) 3.55** (1.45)
3.55** (1.46)
3.15*** (0.87)
3.16*** (0.90)
Rebellion onset (lag) -0.64 (0.67)
-0.60 (0.70)
[dropped] [dropped]
t -1.88*** (0.15)
-1.87*** (0.15)
-0.23** (0.10)
-0.24** (0.10)
-0.08 (0.09)
-0.07 (0.10)
t2 0.09*** (0.01)
0.09*** (0.01)
0.01** (0.01)
0.01*** (0.00)
0.00 (0.00)
0.00 (0.00)
t3 -0.00*** (0.00)
-0.00*** (0.00)
-0.00** (0.00)
-0.00*** (0.00)
-0.00 (0.00)
-0.00 (0.00)
constant -83.96 (25.35)
-84.37 (25.57)
101.49 (59.47)
101.59 (58.73)
-98.78 (50.73)
-91.27 (51.89)
N states pseudo r2
7120 38
0.78
7120 38
0.78
7072 38
0.13
7072 38
0.14
7137 38
0.09
7137 38
0.10 This table reports logistic regression estimates replicating results predicting interethnic powersharing (Models 1 and 2, following EP-5 and EP-6 in main paper), successful coups (Models 3 and 4, following SC-5 and SC-6), and civil war onset (Models 5 and 6, following CW-5 and CW-6). Control variables are added for lagged dependent variables of the other two outcomes (e.g. the occurrence of a coup or a rebellion onset in the previous year in models of ethnic powersharing). Threat capabilities independent variables (HH, HL, LH, LL) indicate whether the ruling group and a given non-ruling group, respectively, are above (high) or below (low) the median threat capabilities for the full sample. Cubic polynomials of time since last powersharing (t, t2, t3) are included to account for temporal dependence. Standard errors are clustered by country and statiscial significance is denoted by: ***: p<0.01, **: p<0.05, and *: p<0.10

113
3.5 Models Using EPR 3.0
In the main paper we use EPR 2014 to run the analysis. EPR 2014 has data on ethnic
powersharing through 2013 and has group-level data on 40 countries in Africa. An alternative
dataset is EPR 3.0,122 which has coverage through 2010 and has group-level data on 37
countries. Though both stem from the original EPR 1.1 dataset and do not include major
differences in their codings of access to state power in Africa, they do not correspond perfectly.
The differences in the datasets are not substantial but they are noticeable when we reconstruct
our threat capabilities’ dyads using EPR 3.0. With EPR 3.0, there are more LH and LL dyads
and fewer HH and HL dyads, as reported in Table A.3.5.1. We thus re-run the main models in
the paper using EPR 3.0 to be sure the results are not sensitive to coding choices on group
configurations made in EPR 2014.
Table A.3.5.1 Comparison of Threat Capabilities Dyads with EPR 2014 and EPR 3.0
Variable EPR 2014 Frequency EPR 3.0 Frequency HH threat capabilities 0.36 0.34 HL threat capabilities 0.42 0.37 LH threat capabilities 0.08 0.11 LL threat capabilities 0.14 0.18
Tables A.3.5.2-A.3.5.4 report the results of rerunning the main powersharing, coup and civil
war models in the paper using EPR 3.0 data. The results are very similar. But with the shift in
groups to the LH and LL dyads and the increased number of observations in these quadrants,
122 Wimmer, Cederman and Min 2009.

114
we see an even more robust negative effect of mutually-low threat capabilities (LL dayds) on
successful coups d’état.

115
Table A.3.5.2: Balance of Threat Capabilities and the Likelihood of Ethnic Powersharing with EPR 3.0
EP-1 EP-2 EP-3 EP-4 EP-5 EP-6 HH threat capabilities
1.04*** (0.33)
0.48** (0.22)
0.60** (0.23)
HL threat capabilities
-1.21*** (0.45)
-0.57** (0.27)
-0.55** (0.28)
LH threat capabilities
-0.15 (0.52)
0.05
(0.41)
-0.40 (0.41)
LL threat capabilities
-1.28*** (0.39)
-0.66** (0.27)
-0.87** (0.40)
Log GDP per capita 0.45**
(0.21) 0.48** (0.24)
Log country population 0.07
(0.11) 0.10
(0.11) Number of ethnic groups -0.01
(0.06) -0.02 (0.08)
Institutionalized regime 0.39
(0.28) 0.37
(0.30) Former French colony 0.38
(0.37) 0.34
(0.37)
Cold War 0.82* (0.49)
0.87* (0.50)
Year 0.05** (0.02)
0.05** (0.02)
t -1.83*** (0.18)
-1.82*** (0.18)
-1.65*** (0.16)
-1.65*** (0.16)
t2 0.08*** (0.01)
0.08*** (0.01)
0.07*** (0.01)
0.07*** (0.01)
t3 -0.00*** (0.00)
-0.00*** (0.00)
-0.00*** (0.00)
-0.00*** (0.00)
constant -0.46 (0.35)
0.58 (0.29)
4.26 (0.43)
4.73 (0.40)
-93.65 (39.57)
-95.94 (38.63)
N states pseudo r2
6002 35
0.04
6002 35
0.06
6002 35
0.75
6002 35
0.75
5791 35
0.77
5791 35
0.77 Notes: This table reports logistic regression estimates predicting interethnic powersharing, replicating all results in Table 1 of the main paper, substituting the EPR 3.0 data for the EPR 2014 data. Threat capabilities independent variables (HH, HL, LH, LL) indicate whether the ruling group and a given non-ruling group, respectively, are above (high) or below (low) the median threat capabilities for the full sample. Cubic polynomials of time since last powersharing (t, t2, t3) are included to account for temporal dependence. Standard errors are clustered by country and statiscial significance is denoted by: ***: p<0.01, **: p<0.05, and *: p<0.10
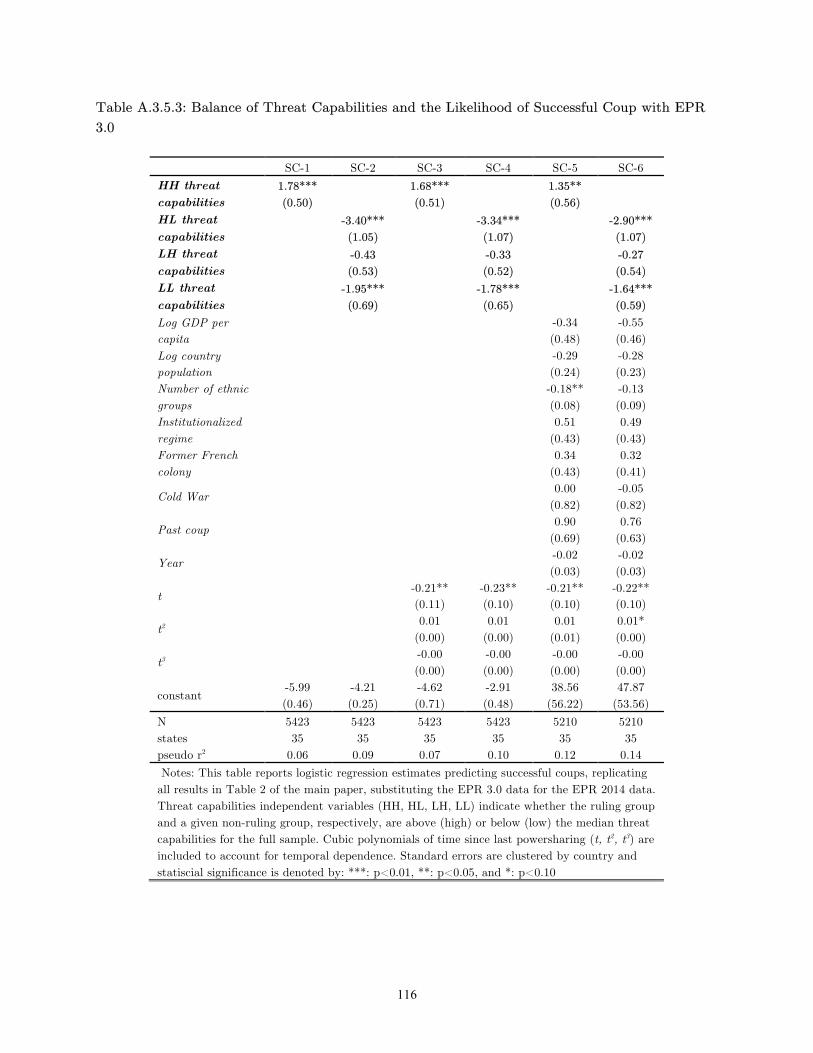
116
Table A.3.5.3: Balance of Threat Capabilities and the Likelihood of Successful Coup with EPR 3.0
SC-1 SC-2 SC-3 SC-4 SC-5 SC-6 HH threat capabilities
1.78*** (0.50)
1.68*** (0.51)
1.35** (0.56)
HL threat capabilities
-3.40*** (1.05)
-3.34*** (1.07)
-2.90*** (1.07)
LH threat capabilities
-0.43 (0.53)
-0.33 (0.52)
-0.27 (0.54)
LL threat capabilities
-1.95*** (0.69)
-1.78*** (0.65)
-1.64*** (0.59)
Log GDP per capita -0.34
(0.48) -0.55 (0.46)
Log country population -0.29
(0.24) -0.28 (0.23)
Number of ethnic groups -0.18**
(0.08) -0.13 (0.09)
Institutionalized regime 0.51
(0.43) 0.49
(0.43) Former French colony 0.34
(0.43) 0.32
(0.41)
Cold War 0.00 (0.82)
-0.05 (0.82)
Past coup 0.90 (0.69)
0.76 (0.63)
Year -0.02 (0.03)
-0.02 (0.03)
t -0.21** (0.11)
-0.23** (0.10)
-0.21** (0.10)
-0.22** (0.10)
t2 0.01 (0.00)
0.01 (0.00)
0.01 (0.01)
0.01* (0.00)
t3 -0.00 (0.00)
-0.00 (0.00)
-0.00 (0.00)
-0.00 (0.00)
constant -5.99 (0.46)
-4.21 (0.25)
-4.62 (0.71)
-2.91 (0.48)
38.56 (56.22)
47.87 (53.56)
N states pseudo r2
5423 35
0.06
5423 35
0.09
5423 35
0.07
5423 35
0.10
5210 35
0.12
5210 35
0.14 Notes: This table reports logistic regression estimates predicting successful coups, replicating all results in Table 2 of the main paper, substituting the EPR 3.0 data for the EPR 2014 data. Threat capabilities independent variables (HH, HL, LH, LL) indicate whether the ruling group and a given non-ruling group, respectively, are above (high) or below (low) the median threat capabilities for the full sample. Cubic polynomials of time since last powersharing (t, t2, t3) are included to account for temporal dependence. Standard errors are clustered by country and statiscial significance is denoted by: ***: p<0.01, **: p<0.05, and *: p<0.10

117
Table A.3.5.4: Balance of Threat Capabilities and the Likelihood of Civil War Onset with EPR 3.0
CW-1 CW-2 CW-3 CW-4 CW-5 CW-6 HH threat capabilities
-0.74 (0.46)
-0.76* (0.45)
-0.89** (0.44)
HL threat capabilities
0.78 (0.51)
0.77
(0.51)
0.77 (0.49)
LH threat capabilities
0.63 (0.52)
0.65
(0.51)
1.13** (0.54)
LL threat capabilities
0.76 (0.55)
0.81
(0.54)
1.16* (0.65)
Log GDP per capita -1.05***
(0.40) -1.15*** (0.42)
Log country population -0.29
(0.18) -0.33 (0.19)
Number of ethnic groups 0.10
(0.07) 0.14
(0.08) Institutionalized regime -0.52
(0.37) -0.47 (0.39)
Former French colony -0.22
(0.62) -0.24 (0.60)
Cold War 1.01 (0.71)
0.99 (0.69)
Past conflict -0.61 (0.64)
-0.58 (0.65)
Ongoing rebellion -0.17 (0.71)
-0.18 (0.68)
Year 0.05* (0.03)
0.05* (0.03)
t -0.05 (0.10)
-0.05 (0.11)
-0.11 (0.11)
-0.11 (0.11)
t2 0.00 (0.00)
0.00 (0.01)
0.00 (0.01)
0.00 (0.01)
t3 -0.00 (0.00)
-0.00 (0.00)
-0.00 (0.00)
-0.00 (0.00)
constant -4.37 (0.26)
-5.11 (0.41)
-4.06 (0.48)
-4.81 (0.73)
-97.46 (55.70)
-94.63 (56.33)
N states pseudo r2
5423 35
0.01
5423 35
0.01
5423 35
0.01
5423 35
0.01
5210 35
0.05
5210 35
0.05 Notes: This table reports logistic regression estimates predicting civil war onset, replicating all results in Table 3 of the main paper, substituting the EPR 3.0 data for the EPR 2014 data. Threat capabilities independent variables (HH, HL, LH, LL) indicate whether the ruling group and a given non-ruling group, respectively, are above (high) or below (low) the median threat capabilities for the full sample. Cubic polynomials of time since last powersharing (t, t2, t3) are included to account for temporal dependence. Standard errors are clustered by country and statiscial significance is denoted by: ***: p<0.01, **: p<0.05, and *: p<0.10

118
4. List of Ruling Groups and Non-Ruling Groups
Country Years Ruling Group Non-Ruling Groups
Angola 1976-2013
Mbundu-Mestico Bakongo Cabindan Mayombe Lunda-Chokwe Ovimbundu-Ovambu
Benin 1961-1963
Northern (Bariba, Peul, Ottamari, Yoa-Lokpa, Dendi, Gourmanchéma)
South/Central (Fon) Southeastern (Yoruba/Nagot
and Goun)
1964-1965
Southeastern (Yoruba/Nagot, Goun)
Northern (Bariba, Peul, Ottamari, Yoa-Lokpa, Dendi, Gourmanchéma)
South/Central (fon)
1966-1967
South/Central (Fon) Northern (Bariba, Peul, Ottamari, Yoa-Lokpa, Dendi, Gourmanchéma)
Southeastern (Yoruba/Nagot and Goun)
1968-1989
Northern (Bariba, Peul, Ottamari, Yoa-Lokpa, Dendi, Gourmanchéma)
South/Central (Fon) Southeastern (Yoruba/Nagot
and Goun)
1990-1995
South/Central (Fon)
Northern (Bariba, Peul, Ottamari, Yoa-Lokpa, Dendi, Gourmanchéma)
Southeastern (Yoruba/Nagot and Goun)
Southwestern (Adja)
1996-2013
Northern (Bariba, Peul, Ottamari, Yoa-Lokpa, Dendi, Gourmanchéma)
South/Central (Fon) Southeastern (Yoruba/Nagot
and Goun) Southwestern (Adja)

119
Botswana 1967-2013
Tswana Birwa Herero/Mbanderu Kalanga Kgalagadi Mbukushu Twapong White Yeyi
Burundi 1963-2003
Tutsi Hutu
Burundi 2004-2013
Hutu Tutsi
Cameroon 1961-1982
Fulani (and other northern Muslim peoples)
Bamileke Bassa/Duala Beti (and related peoples) Northwestern Anglophones
(Grassfielders) Southwestern Anglophones
(Bakweri etc)
Cameroon 1983-2013
Beti (and related peoples) Bamileke Bassa/Duala Fulani (and other Northern
Muslim peoples) Northwestern Anglophones
(Grassfielders) Southwestern Anglophones
(Bakweri etc)
Central African Republic
1961-1981
Riverine groups (Mbaka, Yakoma, Banziri, etc)
Northern groups (Baya, Banda, Mandjia, Sara, Goula)
Central African Republic
1982-1993
Yakoma Mbaka Northern groups (Baya, Banda,
Mandjia, Sara, Goula)
Central African Republic
1994-2002
Sara Baya Mbaka Yakoma
Central African Republic
2003-2013
Baya Goula Mbaka Sara Yakoma

120
Chad 1960-1978
Sara Arabs Muslim Sahel groups Toubou
Chad 1979-1979
State collapse
Chad 1980-1990
Toubou Arabs Hadjerai Muslim Sahel groups Sara Zaghawa, Bideyat
Chad 1991-2013
Zaghawa, Bideyat Arabs Hadjerai Sara Toubou
Congo, Rep 1961-1963
Lari Bakongo Batéké Mbochi Vili
Congo, Rep 1964-1968
Bakongo Batéké Lari Mbochi Vili
Congo, Rep 1969-1976
Mbochi Batéké Lari/Bakongo Vili
Congo, Rep 1977-1990
Mbochi (proper) Batéké Kouyou Lari/Bakongo Vili
Congo, Rep 1991-1991
Lari/Bakongo Batéké Kouyou Lari/Bakongo Vili
Congo, Rep 1992-1997
Bembe Batéké Kouyou Lari/Bakongo Mbochi (proper) Vili

121
Congo, Rep 1998-2013
Mbochi (proper) Batéké Bembe Kouyou Lari/Bakongo Vili
Congo, Dem Rep 1961-1996
Ngbandi Bakongo Luba Kasai Luba Shaba Lulua Lunda-Yeke Mbandja Mongo Ngbaka Other Kivu groups Tetela-Kusu Tutsi-Banyamulenge
Congo, Dem Rep 1997-1997
Tutsi-Banyamulenge Bakongo Luba Kasai Luba Shaba Lulua Lunda-Yeke Mbandja Mongo Ngbaka Other Kivu groups Tetela-Kusu
Congo, Dem Rep 1998-2013
Luba Shaba Bakongo Luba Kasai Lulua Lunda-Yeke Mbandja Mongo Ngbaka Ngbandi Other Kivu groups Tetela-Kusu
Côte d’Ivoire 1960-1999
Baule (Akan) Kru Northerners (Mande and
Voltaic/Gur) Other Akans Southern Mande

122
Côte d’Ivoire 2000-2000
Southern Mande Kru Northerners (Mande and
Voltaic/Gur) Other Akans
Côte d’Ivoire 2001-2011
Kru Baule (Akan) Northerners (Mande and
Voltaic/Gur) Other Akans Southern Mande
Côte d’Ivoire 2012-2013
Northerners (Mande and Voltaic/Gur)
Baule (Akan) Kru Other Akans Southern Mande
Djibouti 1977-2013
Isaas (Somali) Afar
Eritrea 1993-2013
Christians Afar Kunama Other Muslims Saho
Ethiopia 1946-1991
Amhara Afar Christian Eritreans Muslim Eritreans Oroma Somali (Ogaden) Tigry
Ethiopia 1992-2013
Tigry Afar Amhara Anuak Beni-Shugal-Gumez Christian Eritreans Harari Muslim Eritreans Oroma Other Southern Nations Somali (Ogaden)
Gabon 1960-1967
Fang Eshira/Bapounou Myene
Gabon 1968-2013
Mbede (Nzebe, Bateke, Obamba)
Eshira/Bapounou Fang Myene Nkomi Orungu

123
Ghana 1957-1965
Other Akans Asante (Akan) Ewe Ga-Adangbe Northern Groups (Mole-
Dagbani, Gurma, Grusi)
Ghana 1966-1969
Ga-Adangbe Asante (Akan) Ewe Northern Groups (Mole-
Dagbani, Gurma, Grusi) Other Akans
Ghana 1970-1971
Other Akans Asante (Akan) Ewe Ga-Adangbe Northern Groups (Mole-
Dagbani, Gurma, Grusi)
Ghana 1972-1981
Asante (Akan) Ewe Ga-Adangbe Northern Groups (Mole-
Dagbani, Gurma, Grusi) Other Akans
Ghana 1982-1999
Ewe Asante (Akan) Ga-Adangbe Northern Groups (Mole-
Dagbani, Gurma, Grusi) Other Akans
Ghana 2000-2008
Asante (Akan) Ewe Ga-Adangbe Northern Groups (Mole-
Dagbani, Gurma, Grusi) Other Akans
Ghana 2009-2012
Other Akans Asante (Akan) Ewe Ga-Adangbe Northern Groups (Mole-
Dagbani, Gurma, Grusi)
Ghana 2013-2013
Northern Groups (Mole-Dagbani, Gurma, Grusi)
Asante (Akan) Ewe Ga-Adangbe
Guinea 1959-1983
Malinke Peul Susu

124
Guinea 1984-2008
Susu Malinke Peul
Guinea 2009-2010
[Non-EPR Group] Malinke Peul Susu
Guinea 2011-2013
Malinke Peul Susu
Guinea-Bissau 1982-1999
Papel Balanta Manjaco
Guinea-Bissau 2000-2003
Balanta Manjaco Papel
Guinea-Bissau 2004-2004
Papel Manjaco
Guinea-Bissau 2005-2005
Balanta Manjaco Papel
Guinea-Bissau 2006-2009
Papel Balanta Manjaco
Guinea Bissau 2010-2013
[Non-EPR Group] Balanta Manjaco Papel
Kenya 1964-1978
Kikuyu-Meru-Emb Kalenjin-Masai-Turkana-Samburu
Kamba Kisii Luhya Luo Mijikenda Somali
Kenya 1979-2002
Kalenjin-Masai-Turkana-Samburu
Kamba Kikuyu-Meru-Emb Kisii Luhya Luo Mijikenda Somali

125
Kenya 2003-2013
Kikuyu-Mero-Emb Kalenjin-Masai-Turkana-Samburu
Kamba Kisii Luhya Luo Mijikenda Somali
Liberia 1947-1980
Americo-Liberians Indigenous Peoples
Liberia 1981-1989
Krahn (Guere) Americo-Liberians Gio Mano
Liberia 1990-1997
State collapse
Liberia 1998-2013
Americo-Liberians Geo Krahn (Guere) Mandingo Mano
Madagascar 1961-1972
Côtiers Highlanders
Madagascar 1973-1975
Highlanders Côtiers
Madagascar 1976-2001
Côtiers Highlanders
Madagascar 2002-2013
Ethnicity irrelevant
Malawi 1965-1994
Chewa (Central) Northerners (Tumbuka, Tonga, Ngonde)
Southerners (Lomwe, Mang’anja, Nyanja, Yao)
Malawi 1995-2013
Southerners (Lomwe, Mang’anja, Nyanja, Yao)
Chewa (Central) Northerners (Tumbuka, Tonga,
Ngonde)
Mali 1961-2013
Blacks (Mande, Peul, Voltaic, etc)
Arabs/Moors Tuareg
Mauritania 1961-1977
White Moors (Beydan) Black Africans Haratins (Black Moors)

126
Mauritania 1978-1983
Haratins (Black Moors) Black Africans Sahrawis White Moors (Beydan)
Mauritania 1984-2013
White Moors (Beydan) Black Africans Haratins (Black Moors)
Mauritius 1970-1987
Hindus Black Creoles Creoles Franco-Mauritians Gens-de-Couleur Muslims
Mauritius 1988-2013
Hindi-speaking Hindus Black Creoles Creoles Franco-Mauritians Gens-de-Couleur Marathis Muslims Tamils and Telugus
Mozambique 1976-2013
Tsonga-Chopi Makonde-Yao Shona-Ndau
Namibia 1991-2013
Ovambo Baster Basubia Coloreds Damara Herero, Mbanderu Himba Kavango Mafwe Nama San Whites
Niger 1961-1990
Djerma-Songhai Hausa Kanouri Toubou Tuareg
Niger 1991-1995
Hausa Djerma-Songhai Kanouri Toubou Tuareg
Niger 1996-2011
Djerma-Songhai Hausa Kanouri Toubou Tuareg

127
Niger 2012-2013
Hausa Djerma-Songhai Kanouri Toubou Tuareg
Nigeria 1961-1998
Hausa-Fulani and Muslim Middle Belt
Igbo Ijaw Ogoni Tiv Yoruba
Nigeria 1999-2007
Yoruba Hausa-Fulani and Muslim Middle Belt
Igbo Ijaw Ogoni Tiv
Nigeria 2008-2010
Hausa-Fulani and Muslim Middle Belt
Igbo Ijaw Ogoni Tiv Yoruba
Nigeria 2011-2013
Ijaw Hausa-Fulani and Muslim Middle Belt
Igbo Ogoni Tiv Yoruba
Rwanda 1963-1994
Hutu Tutsi
Rwanda 1995-2013
Tutsi Hutu
Senegal 1961-1980
Serer Diola Mandingue (and other eastern
groups) Pulaar (Peul, Toucouleur) Wolof
Senegal 1981-2012
Wolof Diola Mandingue (and other eastern
groups) Pulaar (Peul, Toucouleur) Serer

128
Senegal 2013-2013
Pulaar (Peul, Toucouleur) Diola Mandingue (and other eastern
groups) Serer
Sierra Leone 1962-1967
Mende Kono Northern Groups (Temne,
Limba)
Sierra Leone 1968-1991
Limba Kono Mende Temne
Sierra Leone 1992-1996
State collapse
Sierra Leone 1997-1997
Mende Kono Northern Groups (Temne,
Limba)
Sierra Leone 1998-2002
State collapse
Sierra Leone 2003-2007
Mende Kono Northern Groups (Temne,
Limba)
Sierra Leone 2008-2013
Temne Kono Limba Mende
South Africa 1948-1993
Afrikaners Blacks Coloreds English Speakers
South Africa 1994-2008
Xhosa Afrikaners Coloreds English Speakers Ndebele Pedi (North Sotho) San South Sotho Swazi Tsonga Tswana Venda Zulu

129
South Africa 2009-2013
Zulu Afrikaners Coloreds English Speakers Ndebele Pedi (North Sotho) San South Sotho Swazi Tsonga Tswana Venda Xhosa
South Sudan 2012-2013
Dinka Anyuak Azande Bari Didinga Mundari Murle Nuer Shilluk Toposa
Sudan 1957-2013
Shaygiyya, Ja’aliyyin and Danagla (Arab)
Azande Bari Beja Dinka Fur Latoka Masalit Nuba Nuer Other Arab groups Other Northern groups Other Southern groups Rashaida Shilluk Zaghawa
Tanzania 1965-2009
Mainland Africans Maasai Shirazi (Zanzibar Africans) Zanzibar Arabs
Tanzania 2010-2013
Others Mainland (Christians and traditional religions)
Maasai Mainland Muslims Shirazi (Zanzibar Africans) Zanzibar Arabs

130
The Gambia 1966-1993
Wolof Diola Fula Mandinka
The Gambia 1994-1994
Ethnicity irrelevant
Togo 1961-1966
Ewe (and related groups) Kabre
Togo 1967-2013
Kabre Ewe (and related groups)
Uganda 1963-1965
Northerners (Langi, Acholi, Teso, Madi, Kakwa-Nubian, Lubara, Alur)
Baganda Basoga South-Westerners (Ankole,
Banyoro, Toro, Banyarwanda)
Uganda 1966-1969
Northerners (Langi, Acholi, Madi, Kakwa-Nubian, Lugbara, Alur)
Baganda Basoga South-Westerners (Ankole,
Banyoro, Toro, Banyarwanda)
Teso
Uganda 1970-1971
Langi/Acholi Baganda Basoga Far North-West Nile (Kakwa-
Nubian, Madi, Lugbara, Alur)
South-Westerners (Ankole, Banyoro, Toro, Banyarwanda)
Teso
Uganda 1972-1973
Far North-West Nile (Kakwa-Nubian, Madi, Lugbara, Alur)
Asians Baganda Basoga Karamojong Langi/Acholi South-Westerners (Ankole,
Banyoro, Toro, Banyarwanda)
Teso

131
Uganda 1974-1979
Kakwa-Nubian Baganda Basoga Far North-West Nilers (Madi,
Lugbara, Alur) Karamojong Langi/Acholi South-Westerners (Ankole,
Banyoro, Toro, Banyarwanda)
Teso
Uganda 1980-1985
Northerners (Langi, Acholi, Teso)
Baganda Basoga Far North-West Nile (Kakwa-
Nubian, Madi, Lugbara, Alur)
Karamojong South-Westerners (Ankole,
Banyoro, Toro, Banyarwanda)
Uganda 1986-1989
South-Westerners (Ankole, Banyoro, Toro, Banyarwanda)
Baganda Basoga Far North-West Nile (Kakwa-
Nubian, Madi, Lugbara, Alur)
Karamojong Langi/Acholi Teso
Uganda 1990-2013
South-Westerners (Ankole, Banyoro, Toro)
Baganda Banyarwanda Basoga Langi/Acholi Teso
Zambia 1965-2001
Bemba Speakers Kaonde (NW Province) Lozi (Barotse) Luanda (NW Province) Luvala (NW Province) Nianja speakers (Easterners) Tonga-Ila-Lenge (Southerners)

132
Zambia 2002-2008
Tonga-Ila-Lenje (Southerners) Bemba Speakers Kaonde (NW Province) Lozi (Barotse) Luanda (NW Province) Luvala (NW Province) Nianja speakers (Easterners)
Zambia 2009-2011
Nianja speakers (Easterners) Bemba Speakers Kaonde (NW Province) Lozi (Barotse) Luanda (NW Province) Luvala (NW Province) Tonga-Ila-Lenje (Southerners)
Zambia 2012-2013
Bemba speakers Kaonde (NW Province) Lozi (Barotse) Luanda (NW Province) Luvala (NW Province) Nianja speakers (Easterners) Tonga-Ila-Lenge (Southerners)
Zimbabwe 1966-1979
Europeans Africans
Zimbabwe 1980-1981
Shona Europeans Ndebele-Kalanga-(Tonga)
Zimbabwe 1982-1987
Shona (minus Ndau) Europeans Ndau (Shona sub-group) Ndebele-Kalanga-(Tonga)
Zimbabwe 1988-1991
Shona (minus Manyika & Ndau) Europeans Manyika (Shona sub-group) Ndau (Shona sub-group) Ndebele-Kalanga-(Tonga)
Zimbabwe 1992-2013
Shona Europeans Ndebele-Kalanga-(Tonga)

133
REFERENCES
Bates, Robert H. 1983. Modernization, Ethnic Competition, and the Rationality of Politics in Contemporary Africa. In State Versus Ethnic Claims: African Policy Dilemmas, ed. D. Rothchild, and Victor A. Olorunsola. Boulder, CO: Westview Press.
Bormann, Nils-Christian, Lars-Erik Cederman, and Manuel Vogt. 2015. Language, Religion, and Ethnic Civil War. Journal of Conflict Resolution:0022002715600755.
Bueno de Mesquita, Bruce, James D. Morrow, Randolph M. Siverson, and Alastair Smith. 2003. The Logic of Political Survival. Cambridge, MA: MIT Press.
Caselli, Francesco, and Wilbur John Coleman. 2013. On the Theory of Ethnic Conflict. Journal of the European Economic Association 11 (s1):161-92.
Cederman, Lars-Erik, Kristian Skrede Gleditsch, Idean Salehyan, and Julian Wucherpfennig. 2013. Transborder Ethnic Kin and Civil War. International Organization 67 (02):389-410.
Cetinyan, Rupen. 2002. Ethnic Bargaining in the Shadow of Third-Party Intervention. International Organization 56 (3):645-77.
Chandra, Kanchan. 2012. Introduction. In Constructivist Theories of Ethnic Politics, ed. K. Chandra. New York: Oxford University Press.
Eifert, Benn, Edward Miguel, and Daniel N. Posner. 2010. Political Competition and Ethnic Identification in Africa. American Journal of Political Science 54 (2):494-510.
Fearon, James D. 2003. Ethnic and Cultural Diversity by Country. Journal of Economic Growth 8 (2):195-222.
Fearon, James D., and David D. Laitin. 2000. Violence and the Social Construction of Ethnic Identities. International Organization 54 (4):845-77.
Gleditsch, Nils Petter, Peter Wallensteen, Mikael Eriksson, Margareta Sollenberg, and Havard Strand. 2002. Armed Conflict, 1946-2001: A New Dataset. Journal of Peace Research 39 (5):615-37.
Green, Elliott. 2012. On the Size and Shape of African States. International Studies Quarterly 56 (2):229-44.
Michalopoulos, Stelios. 2012. The Origins of Ethnolinguistic Diversity. The American Economic Review 102 (4):1508.
Posner, Daniel N. 2005. Institutions and Ethnic Politics in Africa. New York: Cambridge University Press.
Roessler, Philip. 2011. The Enemy Within: Personal Rule, Coups, and Civil War in Africa. World Politics 63 (2):300-46.
Wucherpfennig, Julian, Philipp Hunziker, and Lars‐Erik Cederman. 2016. Who Inherits the State? Colonial Rule and Postcolonial Conflict. American Journal of Political Science. 60 (4): 882-898.
Vogt, Manuel, Nils-Christian Bormann, Seraina Rüegger, Lars-Erik Cederman, Philipp Hunziker, and Luc Girardin. 2015. Integrating Data on Ethnicity, Geography, and Conflict: The Ethnic Power Relations Data Set Family. Journal of Conflict Resolution 59(7): 1327-42.
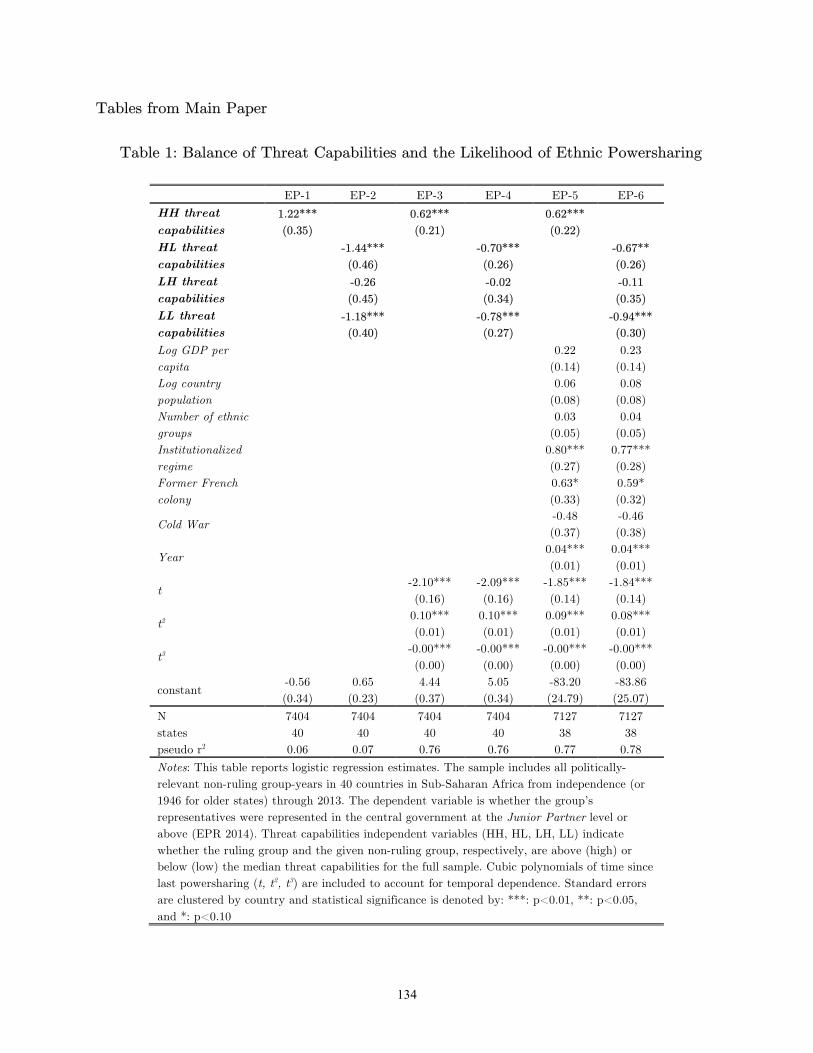
134
Tables from Main Paper
Table 1: Balance of Threat Capabilities and the Likelihood of Ethnic Powersharing
EP-1 EP-2 EP-3 EP-4 EP-5 EP-6 HH threat capabilities
1.22*** (0.35)
0.62*** (0.21)
0.62*** (0.22)
HL threat capabilities
-1.44*** (0.46)
-0.70*** (0.26)
-0.67** (0.26)
LH threat capabilities
-0.26 (0.45)
-0.02 (0.34)
-0.11 (0.35)
LL threat capabilities
-1.18*** (0.40)
-0.78*** (0.27)
-0.94*** (0.30)
Log GDP per capita 0.22
(0.14) 0.23
(0.14) Log country population 0.06
(0.08) 0.08
(0.08) Number of ethnic groups 0.03
(0.05) 0.04
(0.05) Institutionalized regime 0.80***
(0.27) 0.77*** (0.28)
Former French colony 0.63*
(0.33) 0.59* (0.32)
Cold War -0.48 (0.37)
-0.46 (0.38)
Year 0.04*** (0.01)
0.04*** (0.01)
t -2.10*** (0.16)
-2.09*** (0.16)
-1.85*** (0.14)
-1.84*** (0.14)
t2 0.10*** (0.01)
0.10*** (0.01)
0.09*** (0.01)
0.08*** (0.01)
t3 -0.00*** (0.00)
-0.00*** (0.00)
-0.00*** (0.00)
-0.00*** (0.00)
constant -0.56 (0.34)
0.65 (0.23)
4.44 (0.37)
5.05 (0.34)
-83.20 (24.79)
-83.86 (25.07)
N states pseudo r2
7404 40
0.06
7404 40
0.07
7404 40
0.76
7404 40
0.76
7127 38
0.77
7127 38
0.78 Notes: This table reports logistic regression estimates. The sample includes all politically-relevant non-ruling group-years in 40 countries in Sub-Saharan Africa from independence (or 1946 for older states) through 2013. The dependent variable is whether the group’s representatives were represented in the central government at the Junior Partner level or above (EPR 2014). Threat capabilities independent variables (HH, HL, LH, LL) indicate whether the ruling group and the given non-ruling group, respectively, are above (high) or below (low) the median threat capabilities for the full sample. Cubic polynomials of time since last powersharing (t, t2, t3) are included to account for temporal dependence. Standard errors are clustered by country and statistical significance is denoted by: ***: p<0.01, **: p<0.05, and *: p<0.10

135
Table 2: Balance of Threat Capabilities and the Likelihood of Successful Coup
SC-1 SC-2 SC-3 SC-4 SC-5 SC-6 HH threat capabilities
1.77*** (0.59)
1.59*** (0.59)
1.15* (0.63)
HL threat capabilities
-2.84*** (0.82)
-2.73*** (0.83)
-2.28** (0.91)
LH threat capabilities
-0.32 (0.60)
-0.13 (0.59)
-0.33 (0.63)
LL threat capabilities
-1.76*** (0.68)
-1.33** (0.53)
-0.89 (0.67)
Log GDP per capita -0.40
(0.34) -0.50 (0.35)
Log country population -0.14
(0.20) -0.16 (0.19)
Number of ethnic groups -0.14
(0.10) -0.09 (0.10)
Institutionalized regime 0.71
(0.43) 0.70* (0.42)
Former French colony 0.29
(0.39) 0.21
(0.40)
Cold War -0.01 (0.85)
-0.00 (0.87)
Year -0.05* (0.03)
-0.05* (0.03)
Past Coup 1.48*** (0.51)
1.29** (0.52)
t -0.28*** (0.10)
-0.29*** (0.10)
-0.22** (0.09)
-0.23** (0.09)
t2 0.01** (0.01)
0.01** (0.01)
0.01*** (0.00)
0.01*** (0.00)
t3 -0.00** (0.00)
-0.00** (0.00)
-0.00** (0.00)
-0.00*** (0.00)
constant -6.27 (0.53)
-4.50 (0.26)
4.49 (0.72)
-2.87 (0.41)
103.35 (59.46)
104.20** (58.91)
N states pseudo r2
7415 40
0.06
7415 40
0.08
7415 40
0.08
7415 40
0.11
7137 38
0.13
7137 38
0.14 Notes: This table reports logistic regression estimates. The sample includes all politically-relevant non-ruling group-years in 40 countries in Sub-Saharan Africa from independence (or 1946 for older states) through 2013. The dependent variable is whether the group carried out a successful coup. Threat capabilities independent variables (HH, HL, LH, LL) indicate whether the ruling group and the given non-ruling group, respectively, are above (high) or below (low) the median threat capabilities for the full sample. Cubic polynomials of time since last successful coup (t, t2, t3) are included to account for temporal dependence. Standard errors are clustered by country and statistical significance is denoted by: ***: p<0.01, **: p<0.05, and *: p<0.10

136
Table 3: Balance of Threat Capabilities and the Likelihood of Civil War Onset
CW-1 CW-2 CW-3 CW-4 CW-5 CW-6 HH threat capabilities
-0.88** (0.43)
-0.88** (0.43)
-0.77** (0.39)
HL threat capabilities
0.73 (0.54)
0.70
(0.54)
0.53 (0.44)
LH threat capabilities
1.05** (0.50)
1.11** (0.49)
1.07** (0.47)
LL threat capabilities
1.16** (0.45)
1.20*** (0.43)
1.12** (0.51)
Log GDP per capita -0.65***
(0.21) -0.68*** (0.19)
Log country population 0.04
(0.17) 0.01
(0.17) Number of ethnic groups -0.06
(0.09) -0.04 (0.11)
Institutionalized regime -0.25
(0.45) -0.17 (0.40)
Former French colony -0.05
(0.54) -0.13 (0.54)
Cold War -0.96 (0.83)
-0.95 (0.82)
Year 0.04 (0.03)
0.04 (0.03)
Ongoing Rebellion 0.35 (0.73)
0.35 (0.68)
Past Conflict -0.32 (0.61)
-0.33 (0.61)
t -0.06 (0.10)
-0.07 (0.10)
-0.10 (0.10)
-0.10 (0.10)
t2 0.00 (0.00)
0.00 (0.00)
0.00 (0.00)
0.00 (0.00)
t3 -0.00 (0.00)
-0.00 (0.00)
-0.00 (0.00)
-0.00 (0.00)
constant -4.51 (0.25)
-5.39 (0.38)
-4.10 (0.46)
-4.97 (0.68)
-83.00 (53.71)
-77.27 (55.44)
N states pseudo r2
7422 40
0.01
7422 40
0.01
7422 40
0.02
7422 40
0.02
7144 38
0.05
7144 38
0.06 Notes: This table reports logistic regression estimates. The sample includes all politically-relevant non-ruling group-years in 40 countries in Sub-Saharan Africa from independence (or 1946 for older states) through 2013. The dependent variable is whether the group initiated a major armed rebellion or insurgency against the central government. Threat capabilities independent variables (HH, HL, LH, LL) indicate whether the ruling group and the given non-ruling group, respectively, are above (high) or below (low) the median threat capabilities for the full sample. Cubic polynomials of time since last rebellion onset (t, t2, t3) are included to account for temporal dependence. Standard errors are clustered by country and statistical significance is denoted by: ***: p<0.01, **: p<0.05, and *: p<0.10

137
Figures from Main Paper Figure 1: Threat Capabilities, Self-Enforcing Powersharing and Coup and Civil War Risk
Strong Rival
Weak Rival
Strong Ruling Group
H1: Powersharing and societal peace (despite high coup risk) Powersharing: Yes
Coup risk: High
Civil war risk: Low
H2: War-prone ethnocracies Powersharing: No
Coup risk: Low
Civil war risk: High
Weak Ruling Group
H4: Repressive minority rule (or unstable powersharing) Powersharing: No
Coup risk: Low
Civil war risk: High
H3: Unstable, violent, exclusionary regimes Powersharing: No
Coup risk: Low
Civil war risk: High

138
Figure 2: Distribution of Ruling Group-Rival Group Dyads by Balance of Threat Capabilities across sub-Saharan Africa, Independence-2013
Strong Rival
Weak Rival
Strong Ruling Group
High-High (HH) Threat Capabilities N= 2,652 Proportion of dyads: 36%
High-Low (HL) Threat Capabilities N= 3,089 Proportion of dyads: 42%
Weak Ruling Group
Low-High (LH) Threat Capabilities N= 617 Proportion of dyads: 8%
Low-Low (LL) Threat Capabilities N= 1,067 Proportion of dyads: 14%
Figure 3: Predicted Probabilities of Powersharing, Coups and Armed Rebellion
Strong Rival
Weak Rival
Strong Ruling Group
H1:
P(Powersharing): 62.9%
P(Successful coup): 0.6%
P(Armed rebellion): 0.4%
H2:
P(Powersharing): 35.3%
P(Successful coup): 0.1%
P(Armed rebellion): 0.7%
Weak Ruling Group
H4:
P(Powersharing): 55.8%
P(Successful coup): 0.4%
P(Armed rebellion): 1.1%
H3:
P(Powersharing): 39.9%
P(Successful coup): 0.3%
P(Armed rebellion): 1.2%

139
Figure 4: Balance of Threat Capabilities and Powersharing in Africa
Strong Rival
Weak Rival
Strong Ruling Group
H1: Powersharing and societal peace (despite high coup risk) Examples: Benin (1965-1968;1991-1996) Ghana (1957-present) Kenya (1963-present)
H2: War-prone ethnocracies Examples: Ethiopia (before 1991) Mali (1960-present) Sudan (1956-present)
Weak Ruling Group
H4: Repressive minority rule (or unstable powersharing) Examples: Guinea-Bissau (1974-1980) South Africa (before 1994) Ethiopia (after 1991)
H3: Unstable, violent, exclusionary regimes Examples: Zaire/DRC (1960-present) Chad (1980-present) Liberia (1980-1998)
Recommended