Application of hydrogeochemistry to delineateflow in fractured granite near Oracle, Arizona
Item Type Thesis-Reproduction (electronic); text
Authors Winstanley, Daniel John.
Publisher The University of Arizona.
Rights Copyright © is held by the author. Digital access to this materialis made possible by the University Libraries, University of Arizona.Further transmission, reproduction or presentation (such aspublic display or performance) of protected items is prohibitedexcept with permission of the author.
Download date 04/07/2018 21:22:32
Link to Item http://hdl.handle.net/10150/191868
APPLICATION OF HYDROGEOCHEMISTRY TO DELINEATE FLOW
IN FRACTURED GRANITE NEAR ORACLE, ARIZONA
by
Daniel John Winstanley
A Thesis Submitted to the Faculty of the
DEPARTMENT OF HYDROLOGY AND WATER RESOURCES
In Partial Fulfillment of the RequirementsFor the Degree of
MASTER OF SCIENCEWITH A MAJOR IN HYDROLOGY
In the Graduate College
THE UNIVERSITY OF ARIZONA
1985
STATEMENT BY AUTHOR
This thesis has been submitted in partial fulfillment of re-quirements for an advanced degree at The University of Arizona and isdeposited in the University Library to be made available to borrowersunder rules of the Library.
Brief quotations from this thesis are allowable without specialpermission, provided that accurate acknowledgment of source is made.Requests for permission for extended quotation from or reproduction ofthis manuscript in whole or in part may be granted by the head of themajor department or the Dean of the Graduate College when in his or herjudgment the proposed use of the material is in the interests of schol-arship. In all other instances, however, permission mut be obtainedfrom the author.
SIGNED: jeh- 04)7t.
APPROVAL BY THESIS DIRECTOR
This thesis has been approved on the date shown below:
E. S. SIMPSONProfessor of Hydrology
and Water Resources
8-4 Date
This thesis is dedicated to my mom, dad, brothers, and sisters,
who, whether they realize it or not, aided in the completion of this
thesis and my studies. Their energies, especially my mother's, are felt
every day.
ACKNOWLEDGMENTS
This work was completed with partial funding from Nuclear Regu-
latory Commission Contract NRC-04-78-275.
I wish to express my appreciation to my thesis advisor, Dr.
Eugene S. Simpson, for his help and guidance through the course of this
study and throughout my studies at the University of Arizona.
I wish to thank Dr. Stanley N. Davis and Dr. Daniel D. Evans
for being on my committee and for providing their constructive comments.
I am indebted to Ronald T. Green, fellow student and cohort,
for review of my original draft and for being my friend since my
"appearance" at the Department of Hydrology.
iv
TABLE OF CONTENTS
Page
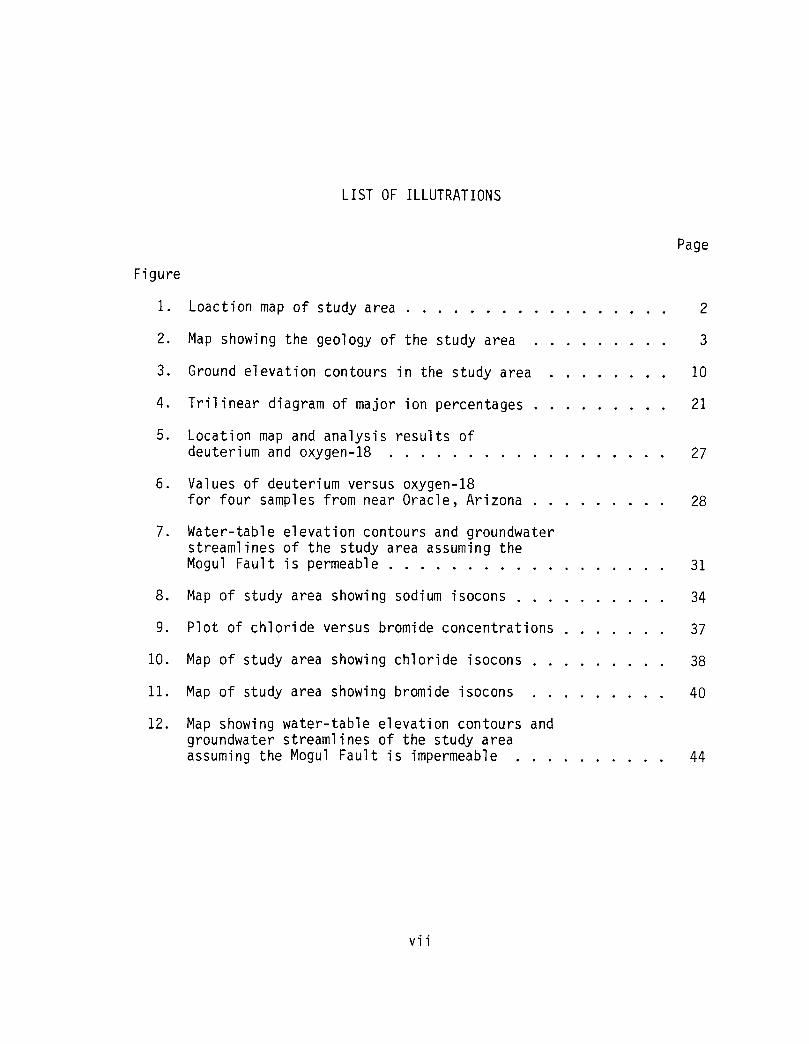
LIST OF ILLUSTRATIONS vii
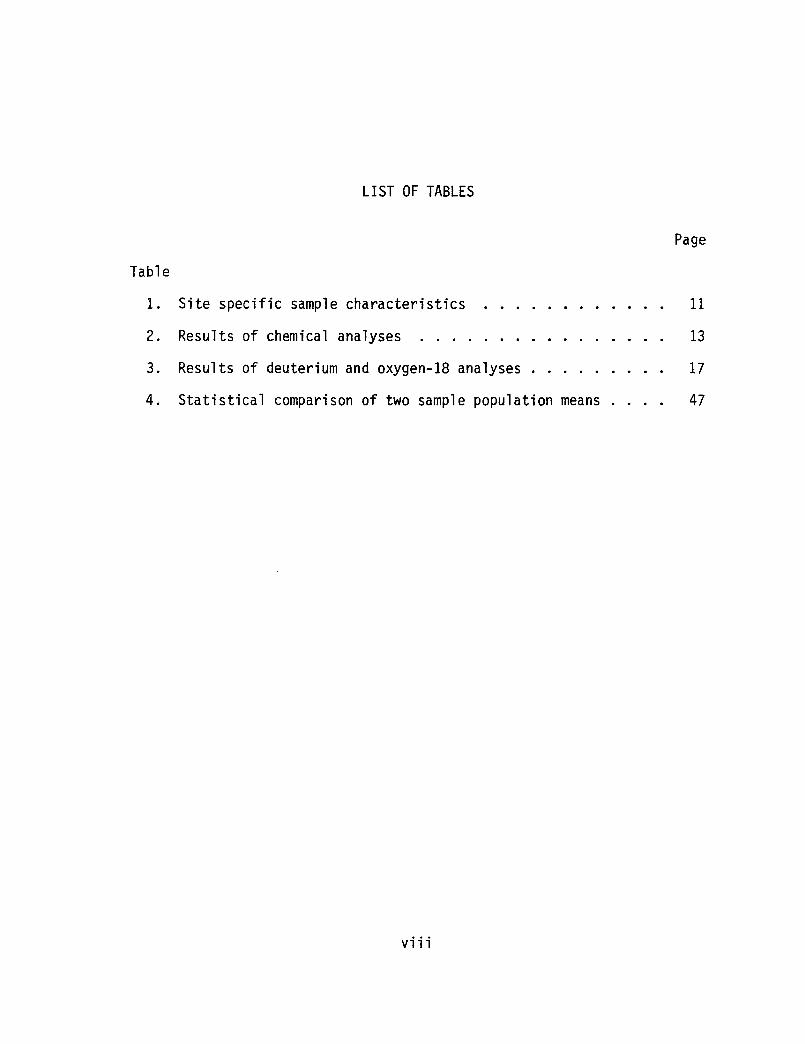
LIST OF TABLES viii
ABSTRACT ix
1. INTRODUCTION 1
2. GEOLOGY OF THE STUDY AREA 6
3. METHODS OF COLLECTING WATER SAMPLES 9
Sample Containers, Filtering, and Preservation 9Chemical Measurements in the Field 12
Conductivity and Temperature 12pH 14Alkalinity 15
4. LABORATORY ANALYSIS OF GROUNDWATER 16
5. CHEMICAL RESULTS 20
Group 1 and Group 2 Waters 20Group 3 Type Waters 24Environmental Isotopes 26
6. FLOW SYSTEM 30
Groundwater Flow 30Use of Cations to Aid in Delineating the Flow System 32Use of Anions to Delineate the Flow System 35Role of the Mogul and Associated Faults 41Discussion of Isotope Results 48
7. SUMMARY AND CONCLUSIONS 51
APPENDIX A: ANALYSES OF WATER FROM REPRESENTATIVEWELLS IN THE ORACLE AND ORACLE JUNCTIONAREA, PINAL COUNTY, ARIZONA
54
vi
TABLE OF CONTENTS--Continued
Page
APPENDIX B: SUMMARY OF WELL CONSTRUCTION FORSOME BOREHOLES AT THE UNIVERSITYOF ARIZONA'S FRACTURED ROCK TESTSITE NEAR ORACLE, ARIZONA 56
APPENDIX C: COMPUTER CONTOUR PLOTS OF SELECTED IONS 58
REFERENCES 65
LIST OF ILLUTRATIONS
Figure
Page
1. Loaction map of study area 2
2. Map showing the geology of the study area 3
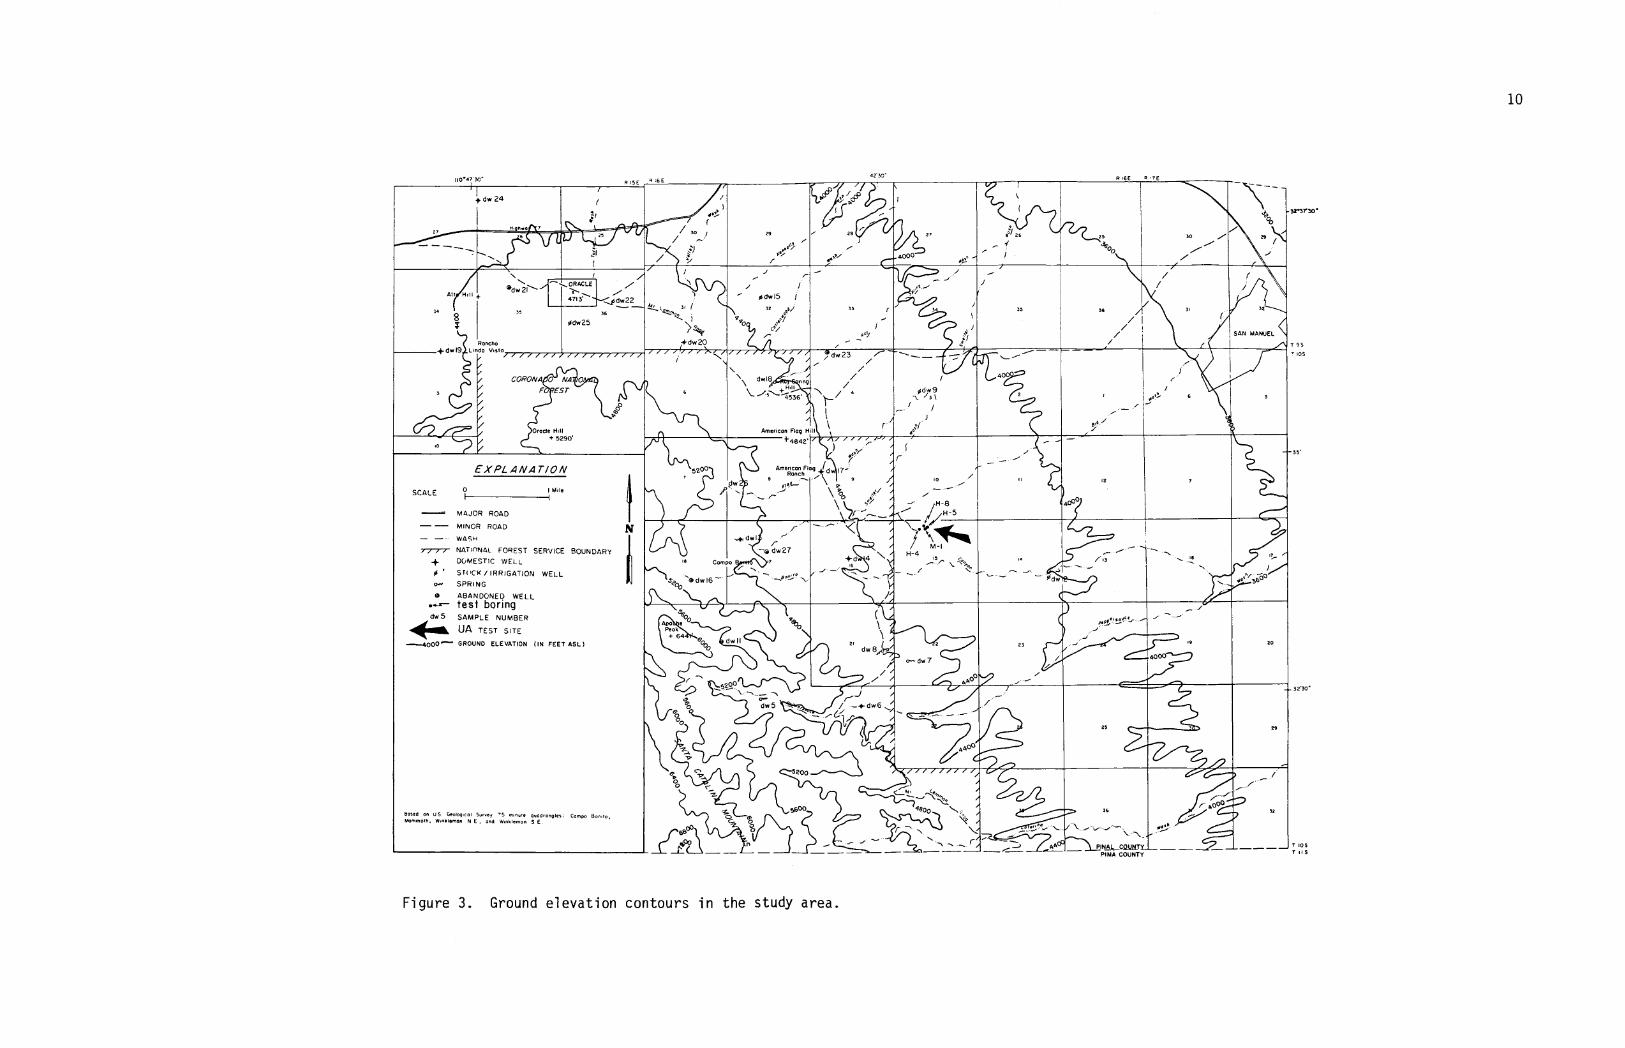
3. Ground elevation contours in the study area 10
4. Trilinear diagram of major ion percentages 21
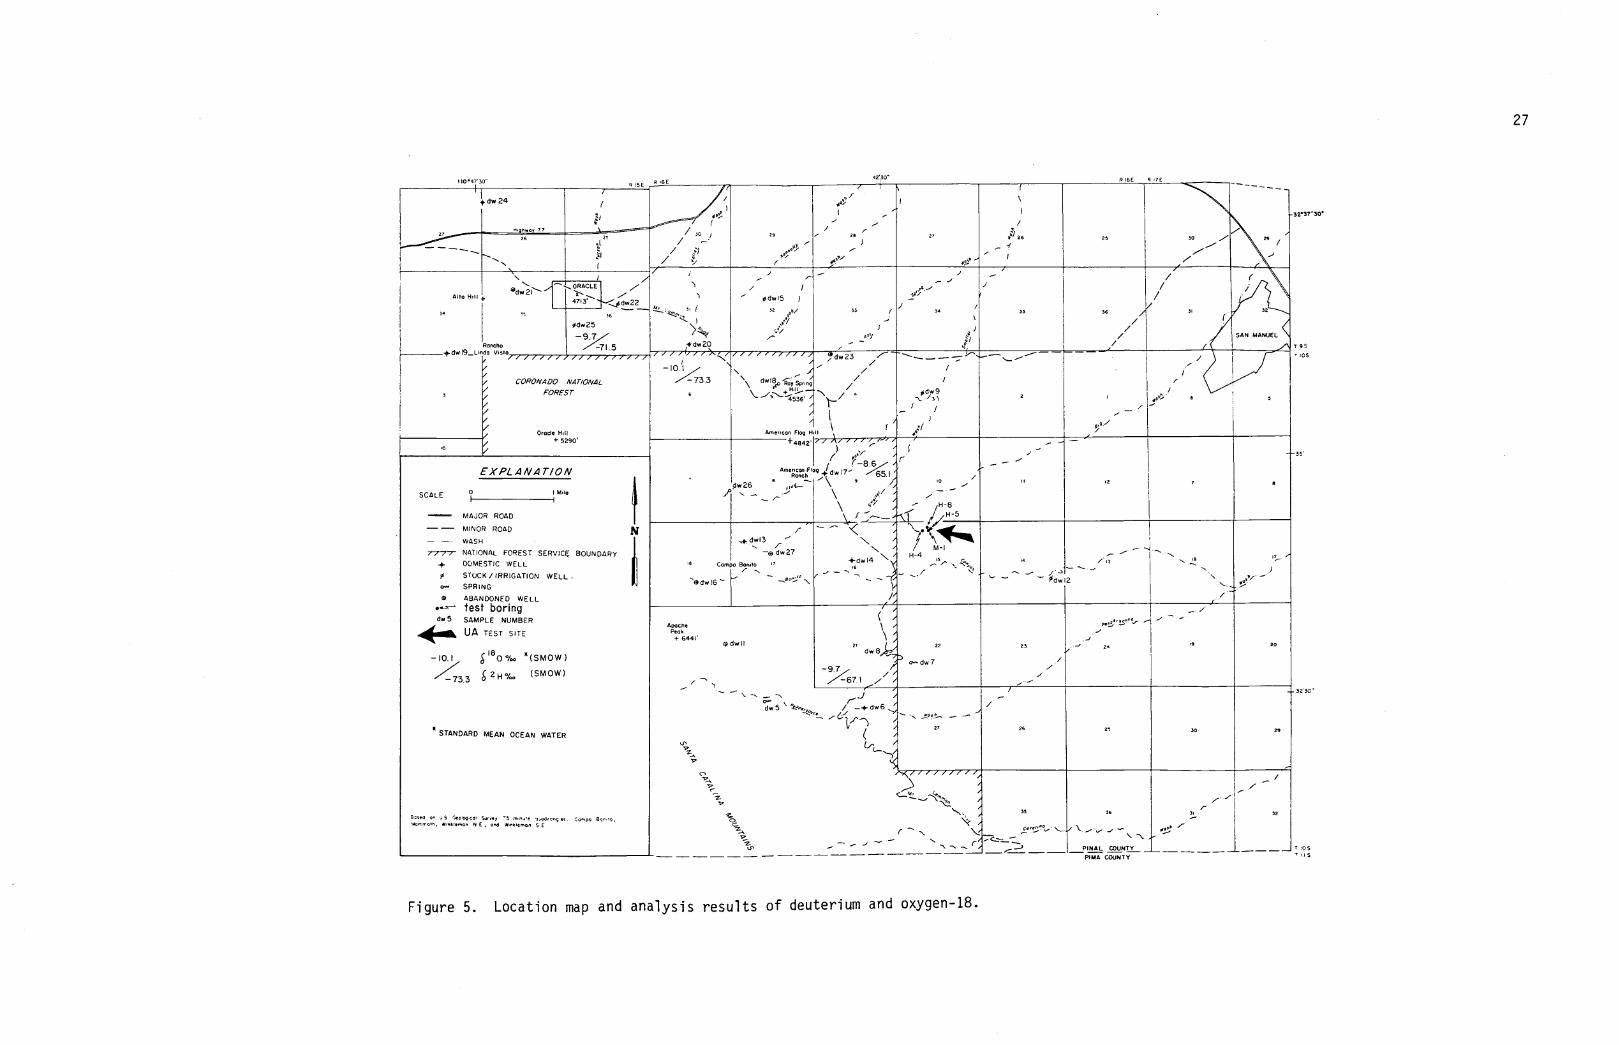
5. Location map and analysis results ofdeuterium and oxygen-18 27
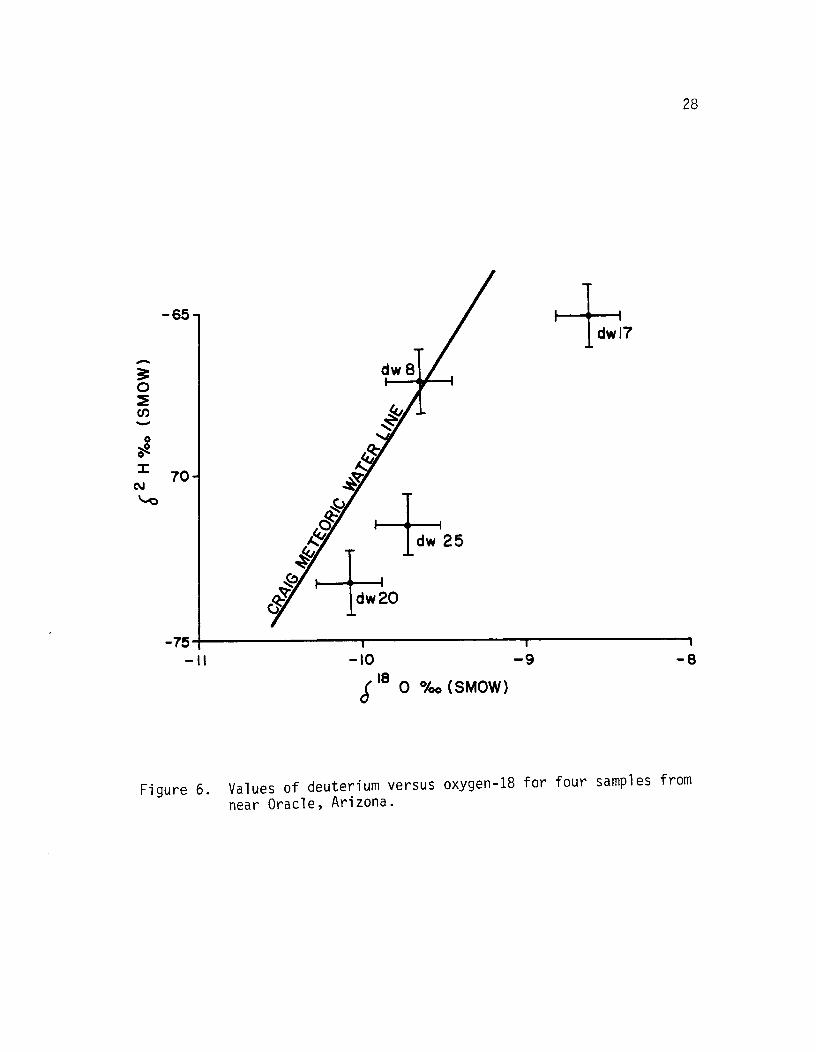
6. Values of deuterium versus oxygen-18for four samples from near Oracle, Arizona 28
7. Water-table elevation contours and groundwaterstreamlines of the study area assuming theMogul Fault is permeable 31
8. Map of study area showing sodium isocons 34
9. Plot of chloride versus bromide concentrations 37
10. Map of study area showing chloride isocons 38
11. Map of study area showing bromide isocons 40
12. Map showing water-table elevation contours andgroundwater streamlines of the study areaassuming the Mogul Fault is impermeable 44
vii
LIST OF TABLES
Table
Page
1. Site specific sample characteristics 11
2. Results of chemical analyses 13
3. Results of deuterium and oxygen-18 analyses 17
4. Statistical comparison of two sample population means . . . . 47
vi ii
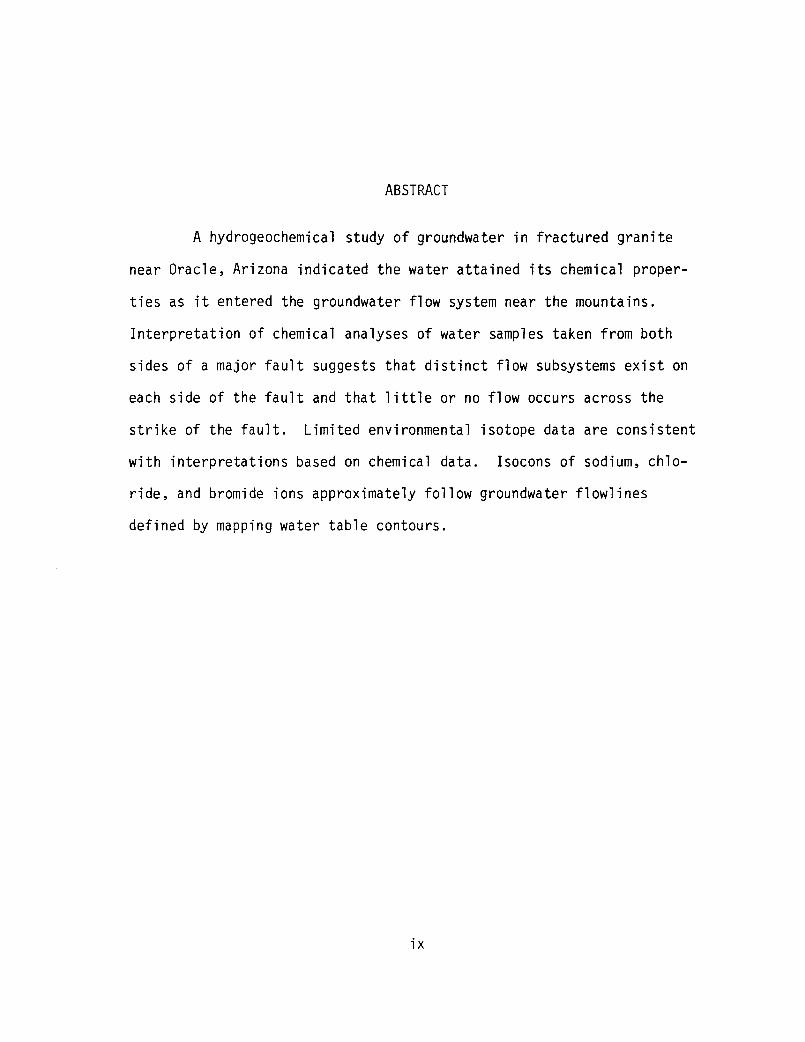
ABSTRACT
A hydrogeochemical study of groundwater in fractured granite
near Oracle, Arizona indicated the water attained its chemical proper-
ties as it entered the groundwater flow system near the mountains.
Interpretation of chemical analyses of water samples taken from both
sides of a major fault suggests that distinct flow subsystems exist on
each side of the fault and that little or no flow occurs across the
strike of the fault. Limited environmental isotope data are consistent
with interpretations based on chemical data. Isocons of sodium, chlo-
ride, and bromide ions approximately follow groundwater flowlines
defined by mapping water table contours.
ix
CHAPTER 1
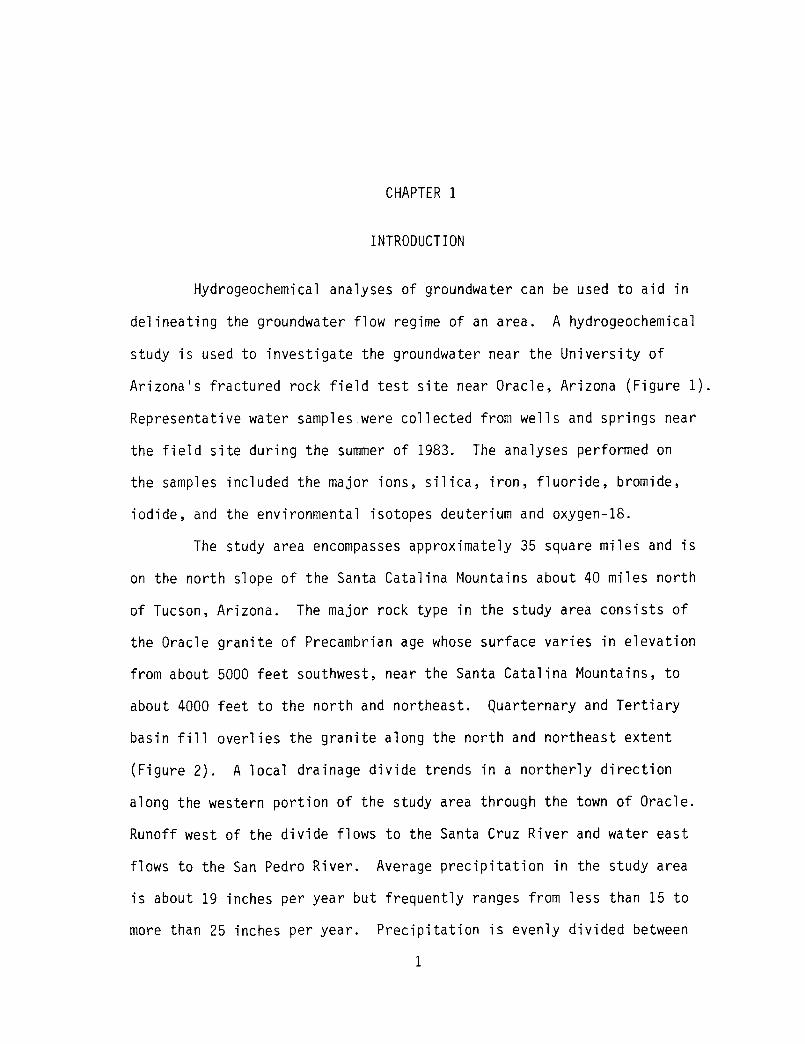
INTRODUCTION
Hydrogeochemical analyses of groundwater can be used to aid in
delineating the groundwater flow regime of an area. A hydrogeochemical
study is used to investigate the groundwater near the University of
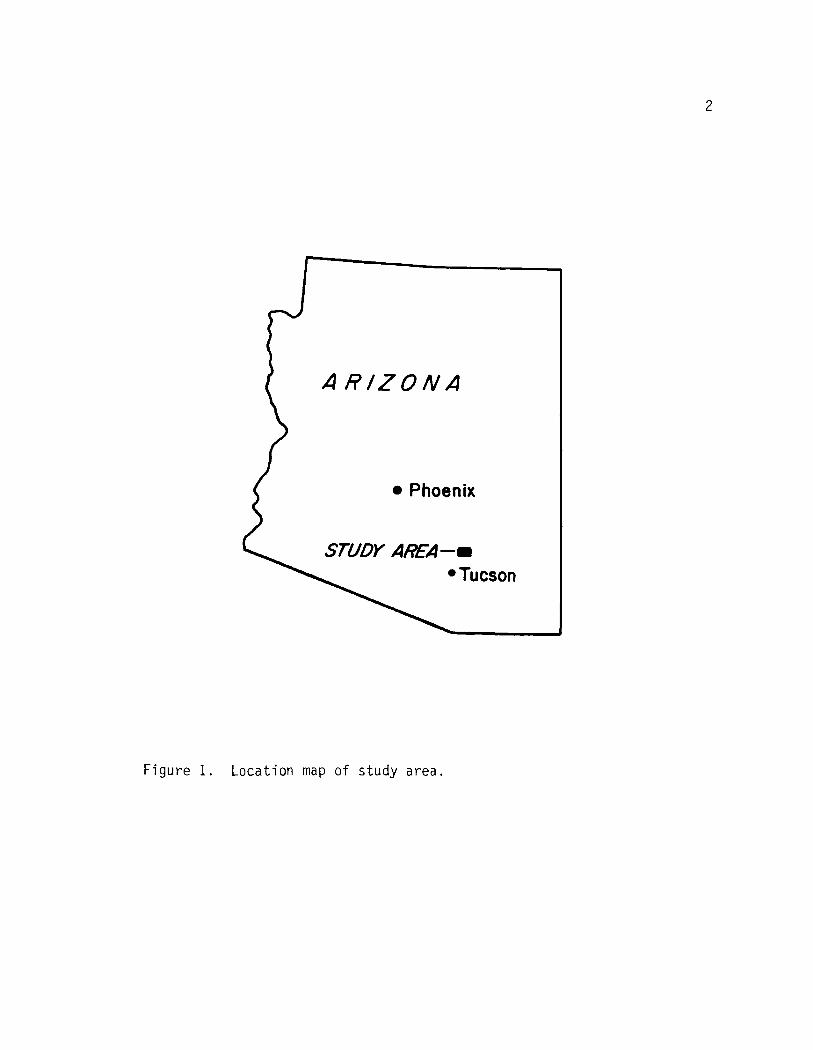
Arizona's fractured rock field test site near Oracle, Arizona (Figure 1).
Representative water samples were collected from wells and springs near
the field site during the summer of 1983. The analyses performed on
the samples included the major ions, silica, iron, fluoride, bromide,
iodide, and the environmental isotopes deuterium and oxygen-18.
The study area encompasses approximately 35 square miles and is
on the north slope of the Santa Catalina Mountains about 40 miles north
of Tucson, Arizona. The major rock type in the study area consists of
the Oracle granite of Precambrian age whose surface varies in elevation
from about 5000 feet southwest, near the Santa Catalina Mountains, to
about 4000 feet to the north and northeast. Quarternary and Tertiary
basin fill overlies the granite along the north and northeast extent
(Figure 2). A local drainage divide trends in a northerly direction
along the western portion of the study area through the town of Oracle.
Runoff west of the divide flows to the Santa Cruz River and water east
flows to the San Pedro River. Average precipitation in the study area
is about 19 inches per year but frequently ranges from less than 15 to
more than 25 inches per year. Precipitation is evenly divided between
1
2
Figure 1. Location map of study area.
3
nor 4r3o" 6 6E
4, dw 24 /
P
\db
\OP-
.4/1
l
1 -"IN
--
• 'r
/ ,,,
,J,0 Ts
2>
,. /
26/ .-..) / )
*6 25 30 /'— g rn
Sif
/ .)
/. 0
/
,/
iv'e:!•° '
! z.,'
....'
.d
/ph .0 -,
_...,---7_,
,/ .
—__\\ , _.....9„. __..... /
17. / ^ d b,_, ,,, '.. . /-
_-
Alto Halci.'dw21 "'4.
--- --_4713' --"-/".....4edw22
/k 1
) .-- \ \31"15d0!14!...t, /
,Si)r
Al /
/,
/
(
3. 35 36 ‘''''\ 2/\.‹L''''‹ d \ 1 p
33 .
, . , 135
/
31
(ildw25> \ 1/ 01/' 1
// <Rancho
i*dvi20
1 )V
/ - /SAN MANUEL
-}dw19_Londo V n sta/ / / ... / / / / / / / 7 / / / / / /
// \ l\
/--9dw23/
' /
js,
I \..-
fn._ ---" ../
!/ CORONADO NAT/ONAL/
\ 8\ dw1 f oft , 9 // QTs . .
FOREST/ 6 \-/5-,2t--,‘ - . • ./.
/3 •
1 1\•/
).-.% 2 i•
..s s
/ \I -,-/
// Oracle Hill
I dbArnericqn Flag
- - - /\ r.
7dbI f .
- ti 4,,,n.-+ 5290'/
/1,44342k
\
1
pa../
(
/ / A / / / / /„.. /J.,
() ,,/ g r\ ,(
••
.— -- .
_-
EXPLANATION I i db Amegggiog 4 dw 17,'
\f
SCALE 0 i[
Mole\>,0
g rw26
• ,,t---'\..,..___. .
..._ . ' Ç'
'\. 9..
_\ \\ --..,
./ e db\
79
I
11 1 ' H-8 s•-.)MAJOR
— — MINOR
ROAD
ROAD NFOREST SERVICE BOUNDARY
I 1 - -- .a.----- //H-5---_,
..a.t3 .-- .- . „t ,0 dw 27
1 \<-...I.': N"'/ ,, 44n\. N
,-_- . - - -- .
nNATIONAL
+ DOMESTIC WELL
ow SPRING
COMPO 8ona4 1 ,/ ) db
' 16 - -."---- --•.-
\H-4
si 5T(( / IRRIGATION WELL
,,,,...
1 --
•
e - -\
'
''' -' _...ii,
/ 13
-- _.....
6, le. . .
•.1
0 ABANDONED WELL----• -- test boring
Au gu/ A,,,-lilt i ) /
In
i (
dw 5 SAMPLE NUMBER
*aft UA TEST SITE
ç --_,db
n-- n
( VsMe 1
\
U-•GI \`‘ db
\\
rn
.,..2.1...,. — .. 'pod,' \ _....Pe+"64.i;" -
OTS SILT, SAND, GRAVEL and CONGLOMERATE, D co d -'71`nn To \..\,,Tertiary . /Quarternary. 11 dw 8 -
za -.. -, 24; 20
Kg GRANODIORITE PORPHYRY, Cretaceous/Tertiory.\It -----'-‘—, db \
"- -- -- - - \Ca ,- Kal
.. .. QTcls. /
Ko AMERICAN FLAG FORMATION,n
"--.k
Cretaceous/Tertiary. \\ _, f,----N, \Me ESCABROSA LIMESTONE, Mississippian.
Co BOLSA QUARTZITE and ABRIGO FORMATION
--\-- db ..)--' ..- -:-/ -,--- --C1
.---...71• . .t...,
e nn\
-+ dw6
_
including Troy Quartzite, Cambrian.db DIABASE, Precambrian/ Tertiary. p
/ .S.-....- --/ Au k-10/‘
N. Q Ts
Au APACHE GROUP, Mescal Limestone, Dripping\ 11 z,Crrsk g r ( --n
n zC"'
's 26\
25 30 29
Springs Quartzite and Pioneer Formation,Precambrian.
iss..ffi Li'1-.''' "Nz.- j rs .,...)
\sp.\9' ORACLE GRANITE, Precambrian.
,-P' 1 1 /1
eKa n
n-— --- CONTACT sireyesivey THRUST FAULT, Teeth on
.'-'4Kg f ( 1Ca
u - - F A U LTUpper Plate ,- I k\
7 5 rmnu.e awodrompes Corn. Bonoto.a. 1.9mittemon 5E
/ , )) ......l' ) (/0 .
l// '
mammoth, W , nkieman hi E.
35 56.--
•
32
D
Based o, US Geotog.cai SuFve,
KgC.,'",• O'o-
/I '....-\
\
-/ Au / I .2-\ ,..-- -- --' -
nI / ( '° n
, ----'
\ - -\ -
_
32.37.30'
T esr 105
r IOSr
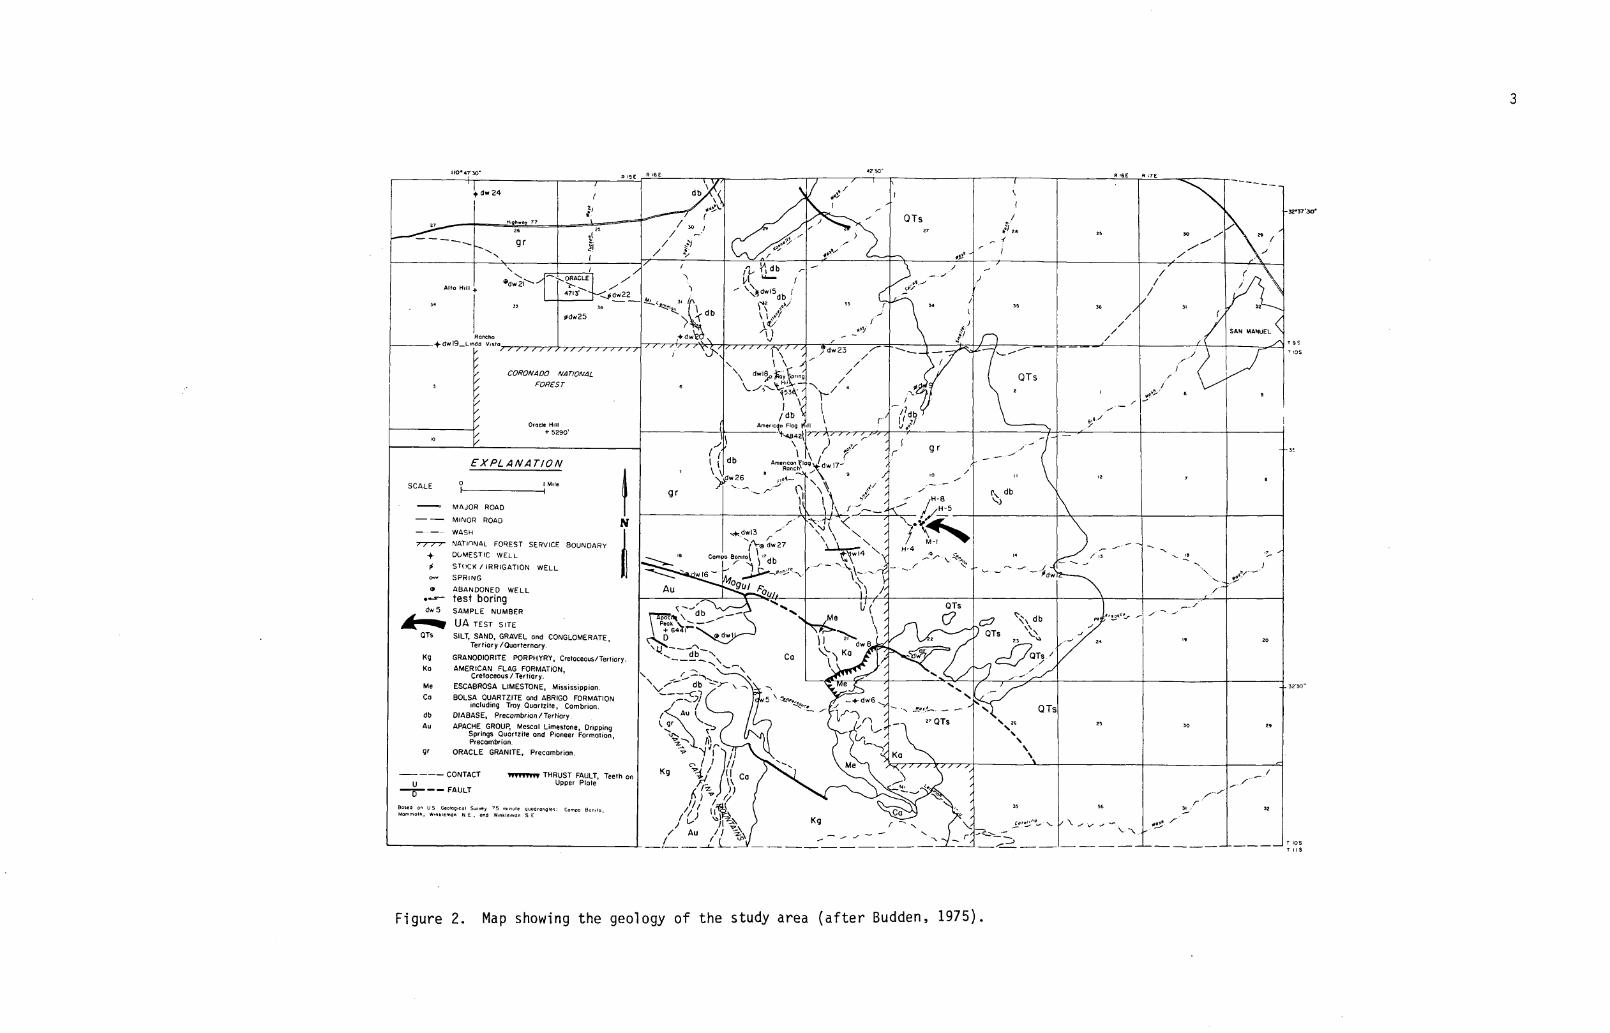
Figure 2. Map showing the geology of the study area (after Budden, 1975).
4
the winter and summer rainy periods. During the winter much of the pre-
cipitation occurs as snow above 4500 feet. Mean annual temperature is
60°F.
Heindl (1955a,b) presented a summary of the major ion chemistry
for selected groundwater samples near Oracle and Oracle Junction (about
12 miles west of Oracle) (Appendix A), but Heindel's data were not used
in this thesis. Rice (1984) conducted a geochemical investigation of
seepage downgradient from leach ponds at the San Manuel copper smelter
on the San Pedro River (about 4 miles northeast of Oracle). Rice's
study extended from the town of Mammoth (about 10 miles northeast of
Oracle) to just south of the Pinal-Pima County line in the alluvium
along the San Pedro River; Rice's study area is about 4 miles outside
the current study area.
Several workers conducted site specific hydraulic and dispersive
studies at the University of Arizona's field site. Hsieh, Simpson and
Neuman (1983) measured in situ hydraulic conductivities using single-
hole packer tests in conjunction with cross-hole injection tests.
Hsieh's conductivity values ranged from 5 x 10 6 x 10 -11 meters per
second in the fractured granite to 10-6
meters per second in a brec-
ciated fault zone in the granite. Jones et al. (1985) described the
petrology and structure of the test site using geophysical techniques
and proposed a method to estimate hydraulic conductivities in areas not
hydraulically tested. They used known neutron logs and the relatively
high correlation between neutron log response and the measured hydraulic
conductivity in fractured rock. Flynn (1984) conducted heat-tracer

5
experiments to delineate fracture interconnections in the granite at the
test site.
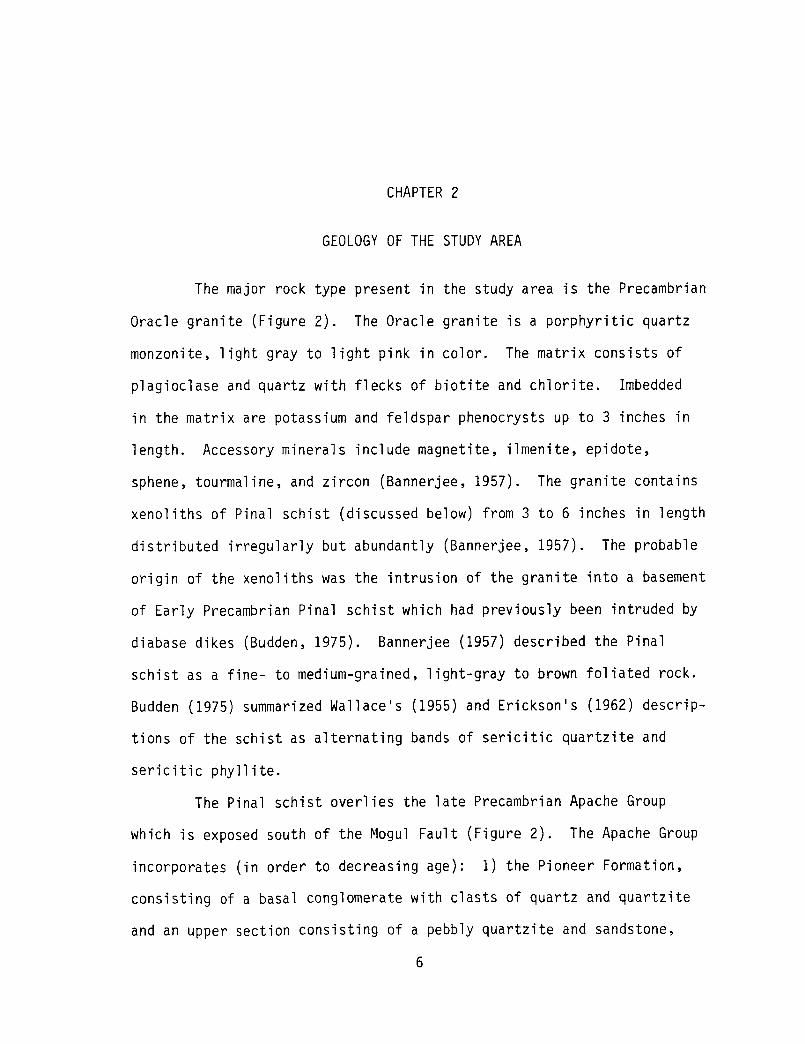
CHAPTER 2
GEOLOGY OF THE STUDY AREA
The major rock type present in the study area is the Precambrian
Oracle granite (Figure 2). The Oracle granite is a porphyritic quartz
monzonite, light gray to light pink in color. The matrix consists of
plagioclase and quartz with flecks of biotite and chlorite. Imbedded
in the matrix are potassium and feldspar phenocrysts up to 3 inches in
length. Accessory minerals include magnetite, ilmenite, epidote,
sphene, tourmaline, and zircon (Bannerjee, 1957). The granite contains
xenoliths of Pinal schist (discussed below) from 3 to 6 inches in length
distributed irregularly but abundantly (Bannerjee, 1957). The probable
origin of the xenoliths was the intrusion of the granite into a basement
of Early Precambrian Pinal schist which had previously been intruded by
diabase dikes (Budden, 1975). Bannerjee (1957) described the Pinal
schist as a fine- to medium-grained, light-gray to brown foliated rock.
Budden (1975) summarized Wallace's (1955) and Erickson's (1962) descrip-
tions of the schist as alternating bands of sericitic quartzite and
sericitic phyllite.
The Pinal schist overlies the late Precambrian Apache Group
which is exposed south of the Mogul Fault (Figure 2). The Apache Group
incorporates (in order to decreasing age): 1) the Pioneer Formation,
consisting of a basal conglomerate with clasts of quartz and quartzite
and an upper section consisting of a pebbly quartzite and sandstone,
6
7
tuff, and slate (Creasy, 1967); 2) the Dripping Spring quartzite which
has a basal member of pebbles, cobbles, and quartzite in a quartz-
feldspar matrix grading upward into a feldspathic quartzite with minor
shale partings; and 3) the cherty, Mescal limestone.
The Middle Precambrian Bolsa quartzite unconformably overlies
the Apache Group. Budden (1975) correlated the Troy quartzite mapped
by Wallace (1955) with the Bolsa quartzite. Conformably overlying the
Bolsa quartzite is the Abrigo Formation comprised of a porous, red and
yellow dolomitic limestone. The remaining stratigraphic column consists
of the Mississippian Escabrosa limestone which is a gray to white, fine-
grained limestone (Wallace, 1955) and the Cretaceous, American Flag
Formation which is a fresh-water conglomerate and graywacke (Creasy,
1967).
Several different types of mafic intrusions were described and
mapped by Bannerjee (1957) in the study area. These included: coarse-
and fine-grained basaltic and diabase, pegmatite, latite, andesite, and
rhyolite dikes striking mostly northwest; quartz veins; and aphte frac-
ture fill. The diabase dikes are most prominent in total area (Figure
2). An exact age relationship has not been established among the dif-
ferent intrusive types, however the coarse-grained diabase was probably
the first intruded into the Oracle granite (Bannerjee, 1957). Figure 2
does not distinguish between the fine- and coarse-grained diabase dikes.
The dikes vary in width from small stringers to a maximum of 800 feet
(Bannerjee, 1957).
The major structural element present in the study area is the
west-northwest trending Mogul Fault (Figure 2). The Oracle granite was
8
uplifted and underwent left lateral movement along the fault zone.
Wallace (1955), Bannerjee (1957), Budden (1975), Drewes (1981), and
Jones et al. (1985) described the sequence of events before and after
the presence of the Mogul Fault and date the movement along the fault
as occurring intermittently from the Precambrian to the present.
Figure 2 illustrates the Mogul Fault along with associated en echelon
and thrust faults. South of the Mogul Fault are the Apache and younger
rocks. The fault zone varies in width from 1 mile at its western extent
to less than 1000 feet at its eastern extent (Bannerjee, 1957).
Borehole geophysical, core, and surface field data have been
collected from eight test boreholes at the field site. Examination of
the core samples (Jones et al., 1985) suggests that hydrothermal activ-
ity resulted in the feldspars having been altered to sericite, kaolin-
ite, or zeolites, and biotite and muscovite altered to chlorite. Zones
of brecciation indicate the rock is weathered and the fracture zones
are filled with kaolinite and iron and magnesian oxides.
The orientation and spacing of fractures was measured using a
downhole televiewer (Jones et al., 1985). They calculated an average
fracture spacing of about 1.4 feet based on data from four of the bore-
holes in the granite. They also observed that the surface exposure of
the diabase dikes are "highly fractured," but core data revealed the
diabase to be competent with depth and that deposition of calcite had
sealed many of the fractures.
CHAPTER 3
METHODS OF COLLECTING WATER SAMPLES
Samples of groundwater were collected from 26 locations in the
Oracle area (Figure 3). All 26 samples were analyzed for the major ions
including iron, bromide, and iodide. Four of the 26 samples included
analyses for two environmental isotopes, deuterium and oxygen-18.
Abandoned and currently used domestic, stock, and irrigation wells, and
flowing springs, were sampled. When possible, water level measurements
were made before sampling, however, difficulties were encountered with
some wells because of the lack of an access hole needed to make water
level and depth of well measurements. Also, some pumps on wells pre-
vented collection of the samples at the well head. Abandoned wells were
sampled by either a hand suction pump with the inlet hose lowered from
2 to 5 feet below the surface or with a 2-1/2 foot long flow-through
type brass bailer lowered from 2 to 28 feet below the water surface.
Most of the abandoned wells were not covered; therefore precipitation
and solid debris could enter the wells directly. Depth of well, depth
to water, sampling difficulties, and other data relevant to specific
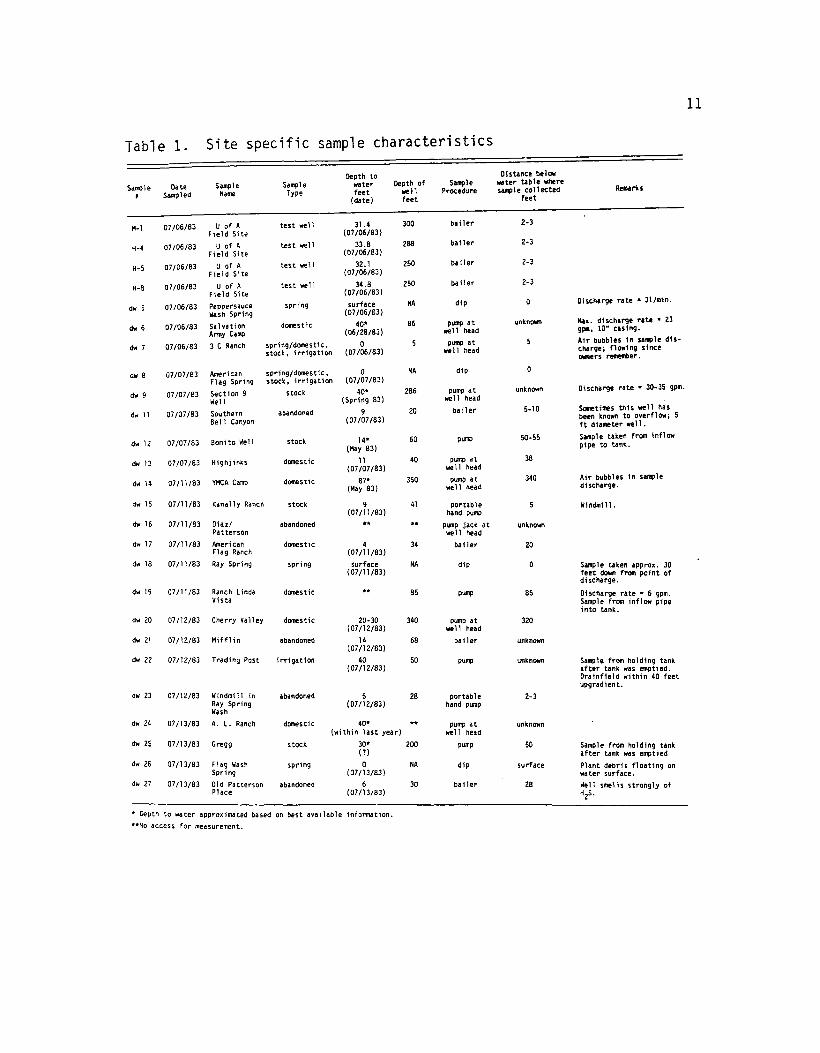
sampling locations are summarized in Table 1.
Sample Containers, Filtering, and Preservation
Groundwater samples for major ion analyses were collected in
two 1-liter and one 250-ml linear polyethylene bottles. The 250-ml
bottle contained the sample used in cation analyses while the two
9
4210'
+ dw 24
-12.37'30'
00w15All
Odw25
Romeo+0 19 Lnclo Vmio//////////////////
CORONA •
Fo -
3/ ( 52 op/. 33
j
4R4,,
+aw 20 L,.
r-
//. Ow 23
IW S mg
/ 4
Orocie+ 5290'
SCALE
MAJOR ROAD
MINOR ROAD
WASH
NATIDNAL FOREST SERVICE BOUNDARY+ DOMESTIC WELL
0 STICK / IRRIGATION WELL
ce+ SPRING
0 ABANDONED WELLtest boring
dws SAMPLE NUMBER
41ft UA TEST SITE
---4000" GROUND ELEVATION (IN FEET ASIJ
Amenco÷n 4Feiog42N ,II
)1/
(1\-1\1\,
r8z00
Ranch .(
I4./.'
4,0 .
Amerman Flog , d 17 /
iw E1"
79 9 / lo
‘S O ..,','‘/ ...'
\ I/ / _.,- H -8
IS
.---- //H-6
comoo -'+dw --.6 dw 27
/
7
/ H-4
.\ .—.11":164‘
'e) —
,—,:' -,,.
+d 49
dw 16 47.../!'
— .....,/
in,
-o'
Apob5ePeok
.1- 64
EXPLANATION
O 1 1.111e
20
-.- 3230"
24
based on US 0e0109100. Survey , 5 rnmure quadrangles: Carn20 Bon.,MOrnmpth, Walln lernan N E. and VOnklernan S E
480o N , 36 32
NA
ESr
10
Figure 3. Ground elevation contours in the study area.
11
Table 1. Site specific sample characteristics
DateSampled
SampleName
SampleType
Depth towater Depth offeet well(date) feet
SampleProcedure
Distance belowwater table wheresample collected
feet
07/06/83 U of A test well 31.4 300 bailer 2-3
Field Site (07/06/83)
07/06/83 U of A test well 33.8 288 bailer 2-3
Field Site (07/06/83)
07/06/83 U of A test well 32.1 250 bailer 2-3
Field Site (07/06/83)
07/06/83 U of A test well 34.8 250 bailer 2-3
Field Site (07/06/83 )
07/06/83 PePpersauce spring surface NA dip 0
Wash Spring (07/06/83)
07/06/83 Salvation domestic 40. 86 pump at unknown
Army Camp (06/28/83 ) well head
07/06/83 3 C Ranch spring/domestic, 0 5 pump at 5
stock, irrigation (07/06/83) well head
07/07/83 American spring/domestic, 0 NA dip 0
Flag Spring stock, irrigation (07/07/83)
07/07/83 Section 9 stock 40. 286 pump at unknown
Well (Spring 83) well head
07/07/83 Southern abandoned 9 20 bailer 5-10
Bell Canyon (07/07/83)
07/07/83 Bonito Well stock 14. 60 pump 50-55
(May 83)
07/07/83 Highjinks domestic 11(07/07/83)
40 pump atwell head
38
07/11/83 YMCA Camp domestic 87.(May 83)
350 pump atwell head
340
07/11/83 Kanally Ranch stock 9 41 portable 5(07/11/133 ) hand pump
07/11/83 Diaz/Patterson
abandoned ww ww pump jack atwell head
unknown
07/11/83 American domestic 4 34 bailer 20Flag Ranch (07/11/83)
07/11/83 Ray Spring spring surface NA dip 0(07/11/83)
07/11/83 Ranch Linda domestic 85 pump 85Vista
07/12/83 Cherry Valley domestic 20-30 340 pump at 320(07/12/83) well head
07/12/83 Mifflin abandoned 14 68 bailer unknown(07/12/83)
07/12/83 Trading Post irrigation 40 50 pump unknown(07/12/83)
07/12/83 Windmill in abandoned 5 28 portable 2-3Ray Spring (07/12/83) hand pumpWash
07/13/83 A. L. Ranch domestic 40. ww pump at unknown(within last year) well head
07/13/83 Gregg stock 30. 200 pump 50(7)
07/13/83 Flag Wash spring 0 NA dip surfaceSpring (07/13/83)
07/13/83 Old Patterson abandoned 6 30 bailer 28Place (07/13/83)
Sample
w_l
4-4
4-5
4-8
dw 5
du 6
dw 7
dc 8
dw 9
dw 11
dc 12
dw 13
dw 14
dc 15
du 16
dc 17
dc 18
dc 19
dc 20
dc 21
dw 22
dw 23
dw 24
dc 25
dc 26
dw 27
Remarks
Discharge rate • 31/min.
Max. discharge rate . 239Pn. 10" casing.
Air bubbles in sample dis-charge; flowing sinceowners remember.
Discharge rate • 30-35 gpm.
Sometimes this well hasbeen known to overflow; 5
ft diameter well.
Sample taken from inflowpipe to tank.
Air bubbles in sampledischarge.
Windmill.
Sample taken approx. 30feet down from point ofdischarge.
Discharge rate • 6 gpm.Sample from inflow pipeinto tank.
Sample from holding tankafter tank was emptied.Drainfield within 40 feetupgradient.
Sample from holding tankafter tank was emptied
Plant debris floating onwater surface.
Well smells strongly ofH2S '
• Depth to water approximated based on best available information...No access for measurement.
12
1-liter bottles contained the sample needed for analysis of the anions.
All of the polyethylene bottles had been washed in Alkonox detergent,
rinsed with hydrochloric acid, and then rinsed with distilled water
prior to sampling. Samples for analyses of deuterium and oxygen-18
were collected in new, 30-ml and 100-ml amber glass bottles. All bot-
tles were rinsed repeatedly with sample water, filled to overflowing,
and then tightly capped. The glass bottles were sealed with multiple
wrappings of Parafilm wax.
The 250-ml samples were filtered through a 45 im filter in the
field when visual inspection revealed debris in the collected sample.
During the filtering process, the filter apparatus was repeatedly rinsed
with sample water. Approximately 0.5 ml of concentrated sulfuric acid
was added to the 250-ml samples to prevent precipitation of the cations.
The two 1-liter bottles were immediately iced and kept refriger-
ated until laboratory analysis of the anions was performed. An effort
was made to prevent agitation and to minimize the trapped air in the
bottles during collection of the sample.
Chemical Measurements in the Field
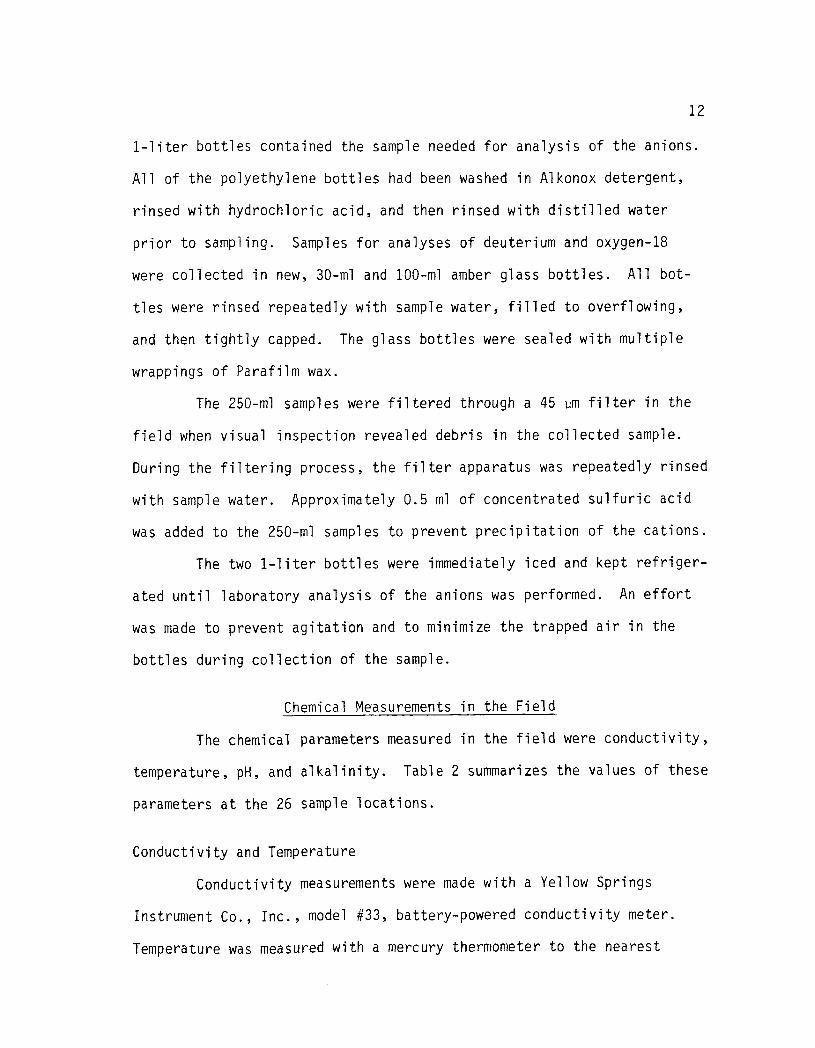
The chemical parameters measured in the field were conductivity,
temperature, pH, and alkalinity. Table 2 summarizes the values of these
parameters at the 26 sample locations.
Conductivity and Temperature
Conductivity measurements were made with a Yellow Springs
Instrument Co., Inc., model #33, battery-powered conductivity meter.
Temperature was measured with a mercury thermometer to the nearest
CO
0-
0 E
c
0,E
O.
f,
= o N..O.
8 E
0000000000000CDOCCOpc,c cpcsc cso200000022e, N0,001001Lny.,,_ e..,00,00.0cy .0 0 Ln 40 Ln Ln un Ca 0 0 in y., y, e, Cy n•-•
nChennoNCO O n.- . 000 O Lnc, aa-OLnemesicnr,COn/N. n e LO r, .- it es, in 0 rn0upeee.- 4.nce,00Cy en en en en n, ta 'cc r, e en es, e r,ta en en
eo'eetao' en.+0.10. CY YI SO 0.1 0, CV .-0; 0 c ce; N. N. ** ** ,,,,,,,,,,,,
0202 O 0 00OL22 00000 ,200e00.002•2
CO; d cr, o a: c.; cr:tx; acs, c,:, oe;.- .- - es; Cs4
in en en CO n (mines/00 en.Chneneq.chenene0.-oD Io n. te, en ne o e eL,
,-enton.1000In..0,coc0.
Le, en en 01 CU ne tainta - r•••• ta Cv in0,C 0 0 0 0 0 0 0 CD 0 0 0 0 0 0 C 0 0 0 0 0 0 OC
d 66 ddd 6 d 6d d d 6 dd d dd d dd 6 d6 d d
LAI Ln un
(.0c0 E
Cn inta ta 04 r, e en ta y> in ta -- - - --- ,e o- o o 9 9 9 —
en.Z. 0 0Ln 0 a• 0 to Ln C.) n) 0 rsj
-0
(-)
2E0 0 0 0 0 en 0 0 0 0 0 0 0 0 ON m c..)
y y L. r, c0
e ite tata - ta tainta ta en a) tar, ch Ln CO 0 en n r, .- ta it
CL) L. •-• • 6 6 6 d c.; 6 c.; c..; 6 0.; 0.; ec, 0.;
0C.)
L0 cOn.n.ln..enen.ChcOOnne.-- LOCOnan)n).00.- n- Ln en n) en ce n a LN it r.. to CO Ln es,
V)CL)
r-
0. oe,
ra10,0,
QE
en-
Ch 0 ID n 0 en n r, in ON 0 0 esi ru n 00 ni cr, ta e in r..en en • .0NtO, - COLett, ta esJecheenc0.00.-.em Ln en es,
s:
o
cu0.
2E
.-07000chenCnr...00, 00.0,00, YD fnch0.-er.-0,es) r, in ch c, en ch en 0 in en 0 esn in Csi Le, N. .- a ni GO 0 c.)
eneneNinNienr1000ento0.00.1LnenLnerer,007o
0.•
ro
rcsI; 0,1.6E
CY en C.! 0.1 eV 0.1 en C..1 LN.1 tatatuata intaru Cs) CL1 ta 0.1 Cu n
CDO000000000000C00000000000 0v v v v v v v v v v v v v v v
-rn
N.ta,Or,U'tuoer-.eOinr-.r,Oin0naOen COrtS(-) E
. . . . . . • . . . . . . . . . . . . . . . . . . CD 04 NI r, ---------- ta
Ln
Ln
•T-E Ma;
(1.)+
ncr•e e‘j ,ØN.aN.inr,aN. r, 07 Ln Ln in n CO CM CL!in CY 0,20;
0..- COCOL2000,0•ACC000 0.- 0,0,120, 2 8 5(-) ZE
4- L+. a)
o 0 E
th4-)
CL)
010;SE
n.,e1
E
Ln LO CO LID INN en r, Ln 0 en Ln n er c0 n en 0n n/ n,r- . en .- .er en en er en en en en
in t.. in in co Lnin c= Ln 0c0.-0 0, 2032.-0, 0in r, CL.1 n.cncn.arler cocnoco cal
oz
=eu
1-•••42
erC
in
••••n 01C000000O.-0 e N. in in c3+..,.....-0en0,020.50.L0
•-• cgC`..1
cu
rcsF-
E
o
o.•00ccz
V V V V v v V
•-• In 0 Ln ,t N. CO ON o fn 0 2 LOCO C71 CL1 es.1 04 eNi
Un CO .6 4 .4 3.6 4 4 4 4 4
0+.
g.s .0
Ln,o
a) .0cnc.,
13
14
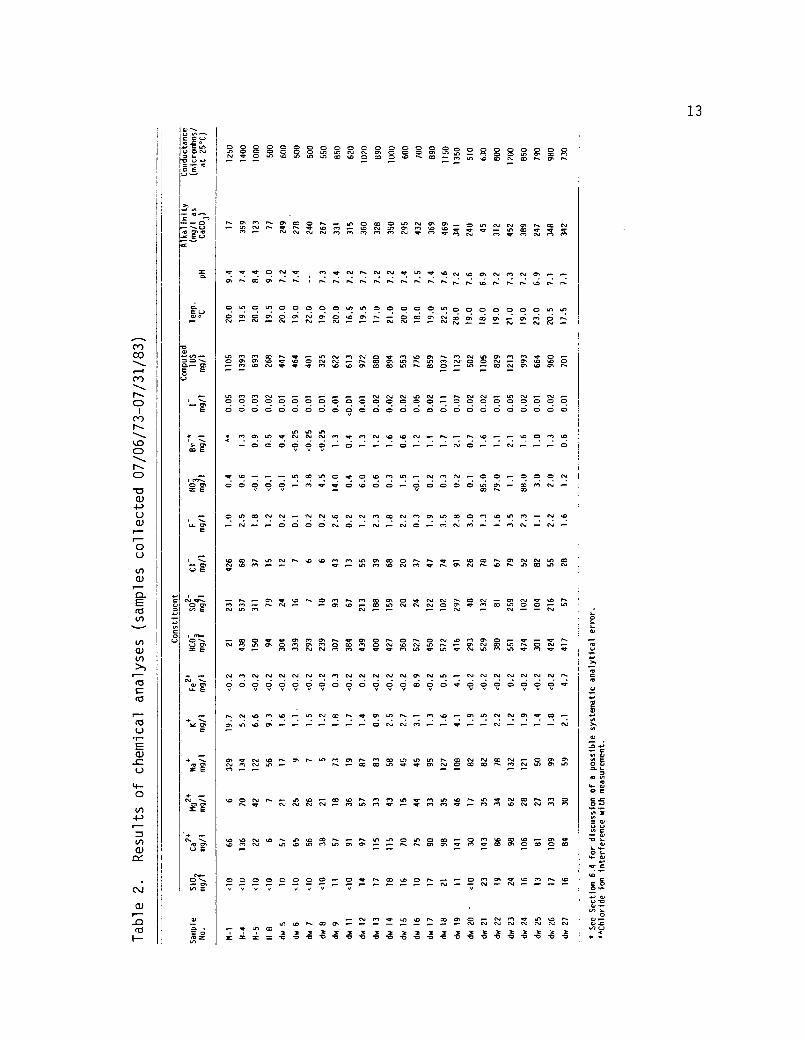
±0.5°C. Water was collected in a plastic pail which had been rinsed
with sample water, then shaded from the sun until the measurements were
made. Samples collected with bailer or hand suction pump were emptied
into the pail until a sufficient quantity was obtained to submerge the
probes. Conductivity and temperature measurements from springs were
taken by immersing the probes directly into the discharging water and
allowing 3 to 5 minutes for the readings to stabilize.
pH
The pH was measured using a Digi-Sense, model #5986-10 battery-
powered pH meter. The meter was calibrated to standard buffer solutions
at every sample location. The sample for pH measurement was collected
in a 0.5-liter polyethylene bottle that had been rinsed with sample
water and shaded from the sun. The pH was measured after the conduc-
tivity measurement.
The pH of water from wells with operating pumps was measured in
discharging water which flowed directly into a polyethylene bottle with
care taken to minimize the entrapped air in the bottle. The pH measure-
ments for the discharging waters were recorded after the reading stabi-
lized to the nearest ±0.02 pH units. The pH readings for samples
collected with bailer or hand suction pump tended to drift continuously
to lower readings after an initial rapid drift of the readings. For
readings that drifted, the pH measurement was recorded immediately after
the initial rapid drift.
15
Alkalinity
Alkalinity measurements were made subsequent to the conductivity
and temperature measurements. The sample used for the alkalinity meas-
urement was collected in a 0.5-liter polyethylene bottle which had been
rinsed repeatedly with sample water. A 100-ml sample was quickly trans-
ferred from the plastic bottle to a glass beaker, then titrated to a pH
4.5 endpoint using acid dispensed through a digital titrater while con-
stantly stirring with a portable magnetic stirrer.
CHAPTER 4
LABORATORY ANALYSIS OF GROUNDWATER
Chemical analyses were performed using facilities and equipment
at the University of Arizona. The environmental isotopes were analyzed
by personnel at the Isotope Geochemistry Laboratory and the author per-
formed the remainder of the chemical analyses. Ion concentration
results are listed in Table 2 and the isotope results are listed in
Table 3. The analytical methods employed for ion analysis were colon-
metric, turbidimetric, specific ion electrode, high performance liquid
chromatography, and atomic adsorption spectrophotometry. The anlayses
were performed using standard techniques for each particular method.
The reliability of the analyses is estimated by calculating the total
charge balance, in millequivalents, between the cations and the anions.
All analyses had less than seven percent charge balance discrepancy.
The analyses were performed within one year from the time of
sample collection. During the one year lapse, the two 1-liter anion
samples were continuously refrigerated and the 250-ml cation samples
and the isotope samples were stored at room temperature. All sample
containers remained tightly sealed during storage.
Sulfate was analyzed using a modification of the American
Public Health Association's barium sulfate turbidimetric method
(Operator's Manual, Hach Direct Reading Field Test Kit, model DR-EL/4).
Chloride concentration was determined using a modification of the
16
17
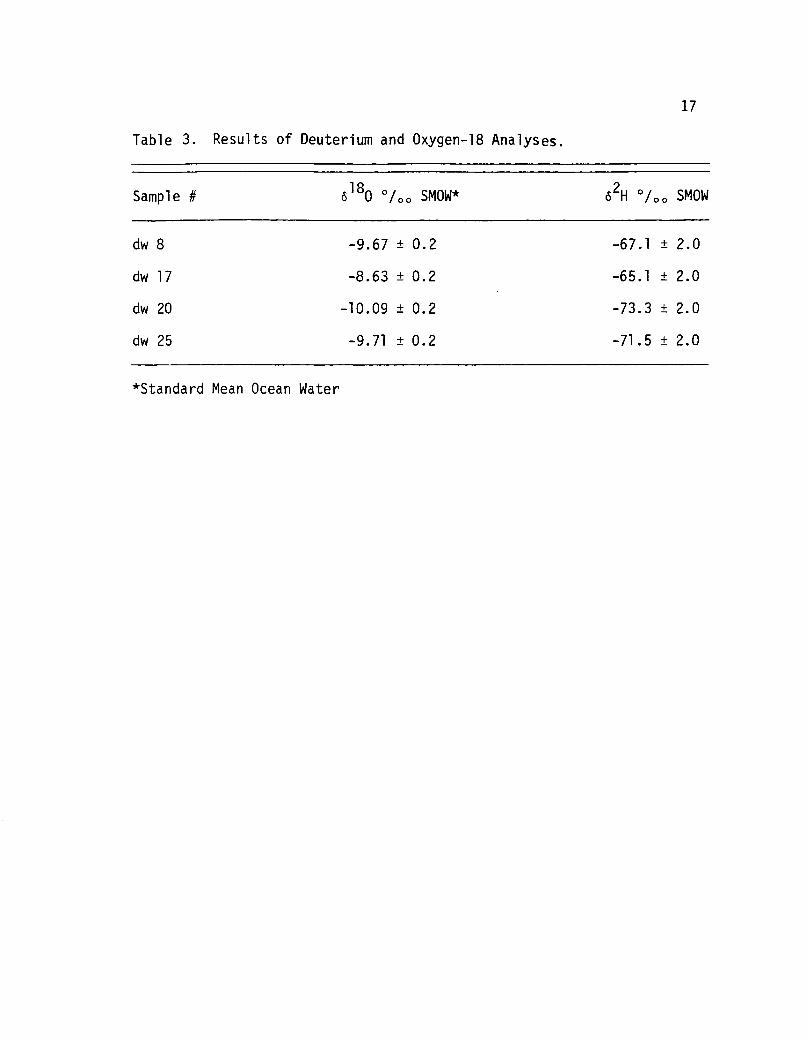
Table 3. Results of Deuterium and Oxygen-18 Analyses.
d180 0 / 00 SMOW* 6
2H 0 / 00 SMOW
-9.67 ± 0.2 -67.1 ± 2.0
-8.63 ± 0.2 -65.1 ± 2.0
-10.09 ± 0.2 -73.3 ± 2.0
-9.71 ± 0.2 -71.5 ± 2.0
Sample #
dw 8
dw 17
dw 20
dw 25
*Standard Mean Ocean Water
18
colorimetric technique (American Society for Testing and Materials,
1980). During the colorimetric technique, a diphenylcarbazone indicator
was added to a measured amount of sample which was titrated to violet
endpoint by adding mercuric nitrate. Standard solutions were prepared
to establish calibration curves for both the sulfate and chloride anal-
yses.
Fluoride, iodide, and bromide anions were measured using spe-
cific ion electrodes. Fluoride was measured using an Orion Research
model #96-09 combination electrode, with a detection limit of 0.02 mg/1
and a reproducibility of 12 percent. Bromide was measured using a
Corning model #476128 electrode, and model #476067 reference electrode,
with sensitivity to 0.04 mg/l. Iodide was measured with a Graphic Con-
trols model #PHI91500 combination electrode with sensitivity to 0.0063
mg/l. Standard solutions were prepared and analyzed for the electrode
measured ions.
Independent analysis of two iodide samples (dw 5 and dw 8) were
conducted (Fabryka-Martin, 1984) using the ceric-arsenious acid oxida-
tion-reduction method (Method I-2371-78 in Skougstad et al., 1979).
Correction for chloride interference was accomplished using iodine-free
NaC1 to adjust samples and standards to the same chloride concentration
(Lloyd et al., 1982). The difference in these measurements relative to
electrode values for samples dw 5 and dw 8 were seven and two percent,
respectively.
Nitrate concentrations were measured with high performance
liquid chromatography using a Spectra Physics model #4100 computing
integrator, a Schoeffl Instrument Corp. model #GM770 ultra-violet
19
detector, and a Sax 5 11M ion exchange column. Sensitivity was calcu-
lated to be 0.1 mg/1 using standard solutions.
Major cations and non-ionic silica were measured with a Varian,
model #475, atomic absorption spectrophotometer at the University of
Arizona's Analytical Center. All measurements were made using the flame
photometric method. Sodium, calcium, magnesium, and potassium had
detection limits of 0.05 mg/l. Iron had a detection limit of 0.15 mg/l.
Silica had a detection limit of 10 mg/l. Standard solutions were pre-
pared and analyzed for the major cations and non-ionic silica.
Oxygen-18 was analyzed by allowing a measured amount of water
sample to equilibrate with CO 2 gas that had a known oxygen-18 content.
After equilibration, the CO 2 gas was analyzed for oxygen-18 and the
amount of oxygen-18 that transferred between the water sample and the
CO2 gas was calculated. The accuracy of the oxygen-18 measurement was
±0.2 per mil. Deuterium was analyzed by placing a measured amount of
water over heated zinc. The zinc was oxidized and hydrogen gas was
emitted from which the deuterium amount was calculated. The accuracy
of the deuterium measurement was ±2 per mil.
CHAPTER 5
CHEMICAL RESULTS
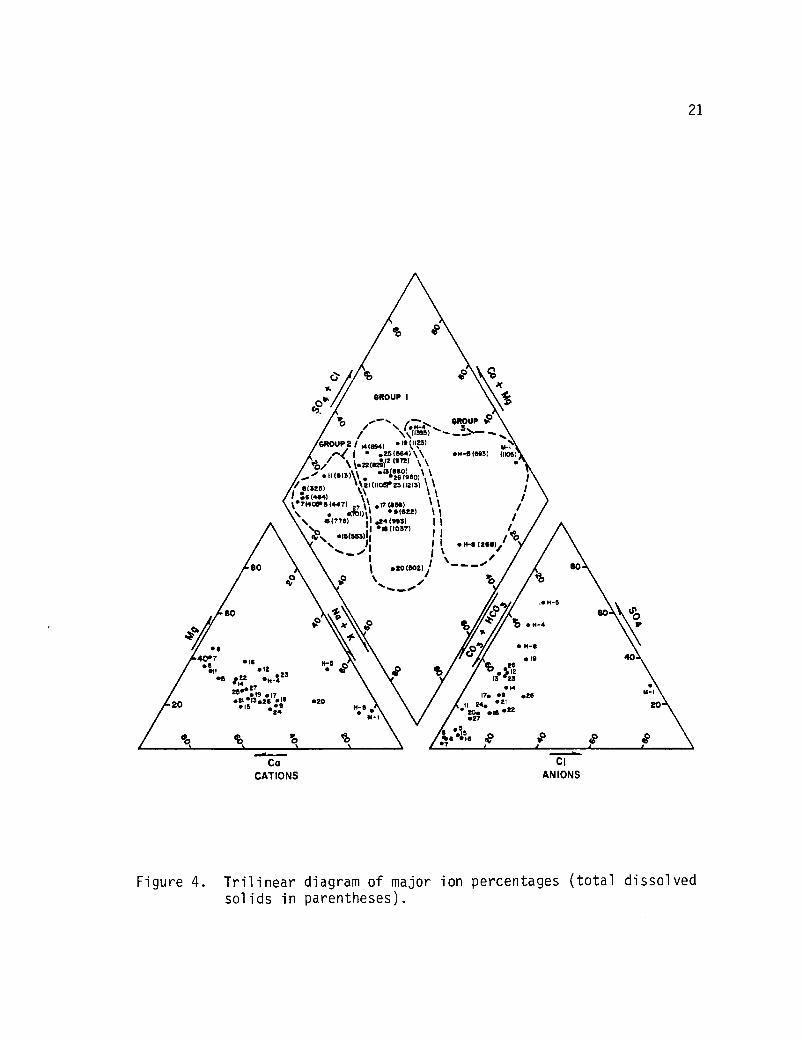
A trilinear plot (Figure 4) of the major ions indicates the 26
samples can be classified into three groups based upon their water
chemistry. The majority (14) of the samples originate from wells and
springs in the granite and are labelled Group 1 which can be classified
as a water type high in Ca2+
-Mg2+
content. Eight samples comprise
Group 2 which is high in Ca2+-Mg 2+-HCO 3
- content. Five of the eight
samples in Group 2 were collected from the Precambrian to Cenozoic age
sediments, metamorphics, and intrusive dikes south of the Mogul Fault.
The remaining three samples in Group 2 (dw 15, dw 16, and dw 27) were
collected from wells in the Oracle granite. Sample location dw 15 is
about 3 1/2 miles north of the Mogul Fault and samples dw 16 and dw 27
are immediately north of the fault (within 1 mile) (Figure 2). A third
water type (labelled Group 3) is comprised of the samples collected from
boreholes at the University of Arizona's field site, all of which were
affected by previous injections of off-site water and either saline
solutions or chemical tracers.
Group 1 and Group 2 Waters
Group 1 water chemistry values are distributed across the Cl - +
SO2- and the CO2- + NCO - axes and indicate no dominant anion (Figure 4).
4 3 3
Group 2 suggests a (CO 32- + HCO -3 ) anion dominance. The bicarbonate con-
centrations reported in Table 2 and plotted on Figure 4 are determined
20
660UP I
60
VI
X
• 1914;5
-I
20920
eg136 '23
• 1417, •9 •25
II 9444 521..• Mao • 63 •••••
6°546 *•0
• •
40,7 • 16• 6 • 12• 6 Att •H.223
20.1119 •4121•13 •26174, 1620 • is
SI '6
BO
o
° /'.----• 4--•-•'•,. _/
\ \ ow) ..... Of60........11,F1 Mi.....40
wowo264 (em) • 191e)
,i44-omm (1,05)167."(Nt 1‘.22.(82.7:(16724))•
\ \ •
....• • II (II3A,1 . *Ntr490)\\ 1/ 8(325) 21(1106r 23 (I21S) 1 1
/I'.6(454) \\ \ 1
V 1 76105 6 (447) 2., il .11 ;(11,159(6) 22) \ \ //\
\ 16s(776).r7U1)1.11 04 (9911) I I\ /
/...11404, s. .15(555) i: *16 (1037)
N 1 I 5 14-111 4 2 11110// ..4114
li
**•• ,... / 1 / \I /
1 64045021‘...... •• .4.
/0\/ lbM %
21
41C
CoCATIONS
CIANIONS
Figure 4. Trilinear diagram of major ion percentages (total dissolvedsolids in parentheses).
22
by dividing the total alkalinity (mg/1 CaCO3 determined in the field)
by 0.8202 (Hem, 1983). The bicarbonate concentrations for Group 1
waters range from 301 to 572 mg/1 and Group 2 waters range from 239 to
527 mg/l. The bicarbonate anion dominance of the Group 2 samples may
be a result of the proximity of the Escabrosa limestone and the Apache
Group (containing the Mescal limestone) to the Group 2 sample locations.
An exception to this is sample dw 15 which is located in the Oracle
granite. The limestones provide a source for calcite (CaCO 3 ) which, in
the presence of dissolved CO 2 (H 2CO 3 ), may contribute to the formation_
of HCO3 and Ca2+
ions (Freeze and Cherry, 1979):
CaCO3 + H2 CO3 Z Ca2+
+ 2HCO 3'
The range in concentration values of the other major ions for
the classified groups are the calcium values which range from 57 to 143
mg/1 for Group 1 waters and from 19 to 45 mg/1 for Group 2 waters.
Magnesium values range from 17 to 62 mg/1 and 15 to 44 mg/1 for Group 1
and Group 2 waters, respectively. Sodium values range from 19 to 132
mg/1 and 5 to 59 mg/1 for Group 1 and Group 2 waters, respectively.
Potassium concentrations range from 0.9 to 4.1 mg/1 for Group 1 waters
and from 1.1 to 3.1 mg/1 for Group 2 waters. Iron ranges from less
than 0.2 to 8.9 mg/1 for Group 1 waters and was below the detection
limit of 0.2 mg/1 for Group 2 waters.
Besides grouping the water types, the trilinear plot displays
the values for computed, total dissolved solids (TDS) (Hem, 1983). The
average TDS are 936 and 535 mg/1 for Group 1 and Group 2 waters, respec-
tively. The sulfate values range from 20 to 297 mg/1 for Group 1 waters
23
and from 7 to 67 mg/1 for Group 2 waters. The lower TDS values in
Group 2 waters is, in part, attributable to lower overall sulfate and
chloride anion concentrations. In arid and semi-arid areas, such as the
study area, soils commonly accumulate excess solutes near the surface
because of high amounts of evapotranspiration relative to the total
amount of precipitation. The excess solutes can be leached by the in-
filtrating waters proportional to the rate and volume of infiltration.
Therefore, small infiltration rates in arid or semi-arid zones occasion-
ally result in high solute concentrations in the groundwater (Hem,
1983). The effect of the rate and volume of infiltration controlling
the solute concentrations infers that the low TDS Group 2 waters are
being flushed either more frequently or more rapidly than the higher
TDS Group 1 waters.
Silica concentrations range from less than 10 mg/1 to 23 mg/1
for Group 1 waters and from less than 10 mg/1 to 10 mg/1 for Group 2
waters. Nitrate concentrations range from 0.1 to 88 mg/1 for Group 1
waters and from less than 0.1 mg/1 to 4.5 mg/1 for Group 2 waters. High
nitrate concentrations occur for Group 1 samples dw 21, dw 22, and dw
24, of 85, 79, and 88 mg/1, respectively. The high nitrate values for
well sample dw 22 may be explained by the presence of a domestic septic
system within 20 feet of the well allowing seepage of effluent into the
well bore. The higher nitrate values of samples dw 21 and dw 24 may be
explained by human or stock impact in the vicinity of the well. How-
ever, evidence of current human or stock influence near this area is not
apparent. Verification by property owners of the presence of septic
systems or former stock pastures has not been possible.
24
Bromide concentrations range from 0.7 to 2.1 mg/1 and from less
than 0.25 mg/1 to 1.2 mg/1 for Group 1 and Group 2 waters, respectively.
It is suspected that the measured bromide concentrations are affected
by a systematic analytical error causing elevated bromide values. Dis-
cussion of this error is included in Chapter 6. Iodide ranges from
0.01 to 1.1 mg/1 for Group 1 waters and from less than 0.01 mg/1 to
0.05 mg/1 for Group 2 waters. The iodide concentration of sample dw 18
is approximately 1 1/2 times higher than the other samples.
Group 3 Type Waters
The water samples from four boreholes at University of Arizona's
field site comprise the Group 3 type waters. The four samples were col-
lected in July 1983 during a period of active testing. The water chem-
istry of the samples from boreholes M-1, H-4, H-5, and H-8 had been
affected by at least one of the following:
1) Recent well construction with the use of drilling additives.
2) Introduction of a chloride solution during geophysical testing.
3) Introduction of chemical tracers.
4) Introduction of trucked-in water from the town of Oracle's
water supply system (which originates from alluvial aquifers
near the town of Oracle Junction).
Construction of boreholes M-1, H-1, H-2, H-3, and H-4 occurred
during the summer of 1981. Boreholes H-5 through H-8 were constructed
during the fall of 1982. Appendix B summarizes the construction
methods. Drilling additives were used during the initial stage of con-
struction to maintain an open borehole near the surface in the weathered
25
and fractured portion of the granite. Casing was driven to the depth of
competent rock, and drilling was resumed by either air hammer without
foam or by coring (criculating trucked-in water). Relative to other
samples collected from the granite, the sample from well M-1 has high
pH (9.4), high sodium (329 mg/1), high chloride (426 mg/1), and high
potassium values (20 mg/1). The high sodium and chloride values for
the water sample from well M-1 probably result from injection of a
sodium chloride solution on 22 March 1981 by Lawrence Livermore National
Laboratory for a geophysical experiment. The high potassium value in
well M-1 probably results from injection of potassium phthalate (KHP)
during a converging tracer test on 3 April 1981. Also added to well M-1
during the tracer test on 3 April 1981 was thiocyanate (SCN), but its
effect on the chemistry of the water in the well is not apparent.
The sample from well H-4 displays high potassium (5 mg/1), high
sulfate (438 mg/1), and high TDS (1393 mg/1). During a test on 3 April
1981, sodium benzoate was added to well H-4. The sample from well H-5
displays high pH (8.4), high potassium (7 mg/1), and high sulfate (311
mg/1). Water from well H-8 has high pH (9.0) and high potassium (9.3
mg/1), and low TDS (268 mg/1).
The borings at the test site have received water foreign to
the natural flow system during the tests over the past few years.
Included in Appendix A are the chemical analyses of water samples from
two wells in the general geographic vicinity of the trucked-in water to
help explain the possible influence of the foreign water on water at
the test site. However, no attempt is made in this thesis to explain
26
the chemistry of the water samples from the four borings at the test
site.
Environmental Isotopes
Four of the 26 samples from the study area were analyzed for
the stable environmental isotopes, deuterium (2H) and oxygen-18 (
180).
The results of the analyses of the four samples, dw 8, dw 17, dw 20, and
dw 27, are listed in Table 3. Sample dw 8 is from south of the Mogul
Fault (Figures 2 and 5) and the remaining samples originate north of the
Mogul Fault in the Oracle granite. Oxygen-18 ranges from -10.09 to
-8.63 per mil and deuterium ranges from -73.3 to -65.1 per mil. Sample
dw 8 was from a flowing spring discharging from an approximately 60-
cubic-foot cistern covered with a solid metal door. Sample dw 17 was
from a domestic well, 3 feet in diameter and 34 feet deep, collected by
a bailer from 20 feet below the water table. Well dw 17 was covered
with a solid metal door. Sample dw 20 was obtained from a 340-foot deep
domestic well that had pumped several well volumes before sampling.
Sample dw 25 was drawn from a 200-foot deep stock well which had been
pumped for several minutes before sampling. The surface elevation of
the four sample locations are approximately the same, with dw 17 at
about 4400 feet and dw 8, dw 20, and dw 25 at about 4600 feet.
Figure 6 is a graph of deuterium versus oxygen-18 values for the
four water samples. Water sample dw 8 plots on the Craig meteoric
water line and samples dw 20, dw 25, and dw 17 plot below the line. The
equation of a line through the three latter samples is expressed as
62H% = 5.5 (5
180% - 18.
31 1
sO%04 ./
34
Alto ffill
3.33
79 eI OS
32.37'30.
35
(Klw25-9.7
Rancho+dwl9_Linda v3sto
////////////////,
CORONADO NATIONAL
FOREST
Oracle 401. 5290'
3 79-
-10.173.3 3/4d:2
odw 9
L
/2 I
dw 20r
I SIAmerman Flog II \21
.4842'
(5V
r 5 —35'
\22
Ow 7/'
/ /
ApachePeak+ 6441'
0 dw11
27
Amencon F1 ci + d . i 7.... 65 I. Ranch , \
dw 26 ,,,.-- // .-_
\ ,/r.' ; -^ H -8
\ 1 _.,..-- — I/H -5
f <'' 'N'i"S1064‘
N. N„ 5 2 M-I
4- 0w 14 ‘'s ,,
. '( ....- ..- N .,;,,,.- <'
-‘ ... S. 4' - -- fS. __,egs:.!' -,1/I/
fi
EXPLANATION
SCALE O
I Moe
MAJOR ROAD
MINOR ROAD
WASH
/ z NATIONAL FOREST SERVICE BOUNDARY
+ DOMESTIC WELL
STOCK / IRRIGATION WELL
- SPRING
* ABANDONED WELL
test boringdw 5 SAMPLE NUMBER
4Mdk UA TEST SITE
- 10. 1- 18
0 °too l (SMOW)
( 2 ( SM OW)Z73.3
' CRON 16
dw13dw 27
Campa Benno
—
23
111clw 12
/13
zo
le STANDARD MEAN OCEAN WATER
eased onis estapool Survey 75 rnteee osadrangre Cam,. 9 ,1P 01,Von,no1n. Molten,. 34 E and el ,nir1edson SE
30 29
35 3' 52
;
36
PINAL COUNTY
PIMA COUNTY
Figure 5. Location map and analysis results of deuterium and oxygen-18.
dw 8
-65—
28
75 i 1—8
e18
0 °km (SMOW)
Figure 6. Values of deuterium versus oxygen-18 for four samples from
near Oracle, Arizona.
(
— I I
29
Sample dw 17 exhibits the most enriched isotope values relative to the
other samples and dw 20 displays the least enriched.
CHAPTER 6
FLOW SYSTEM
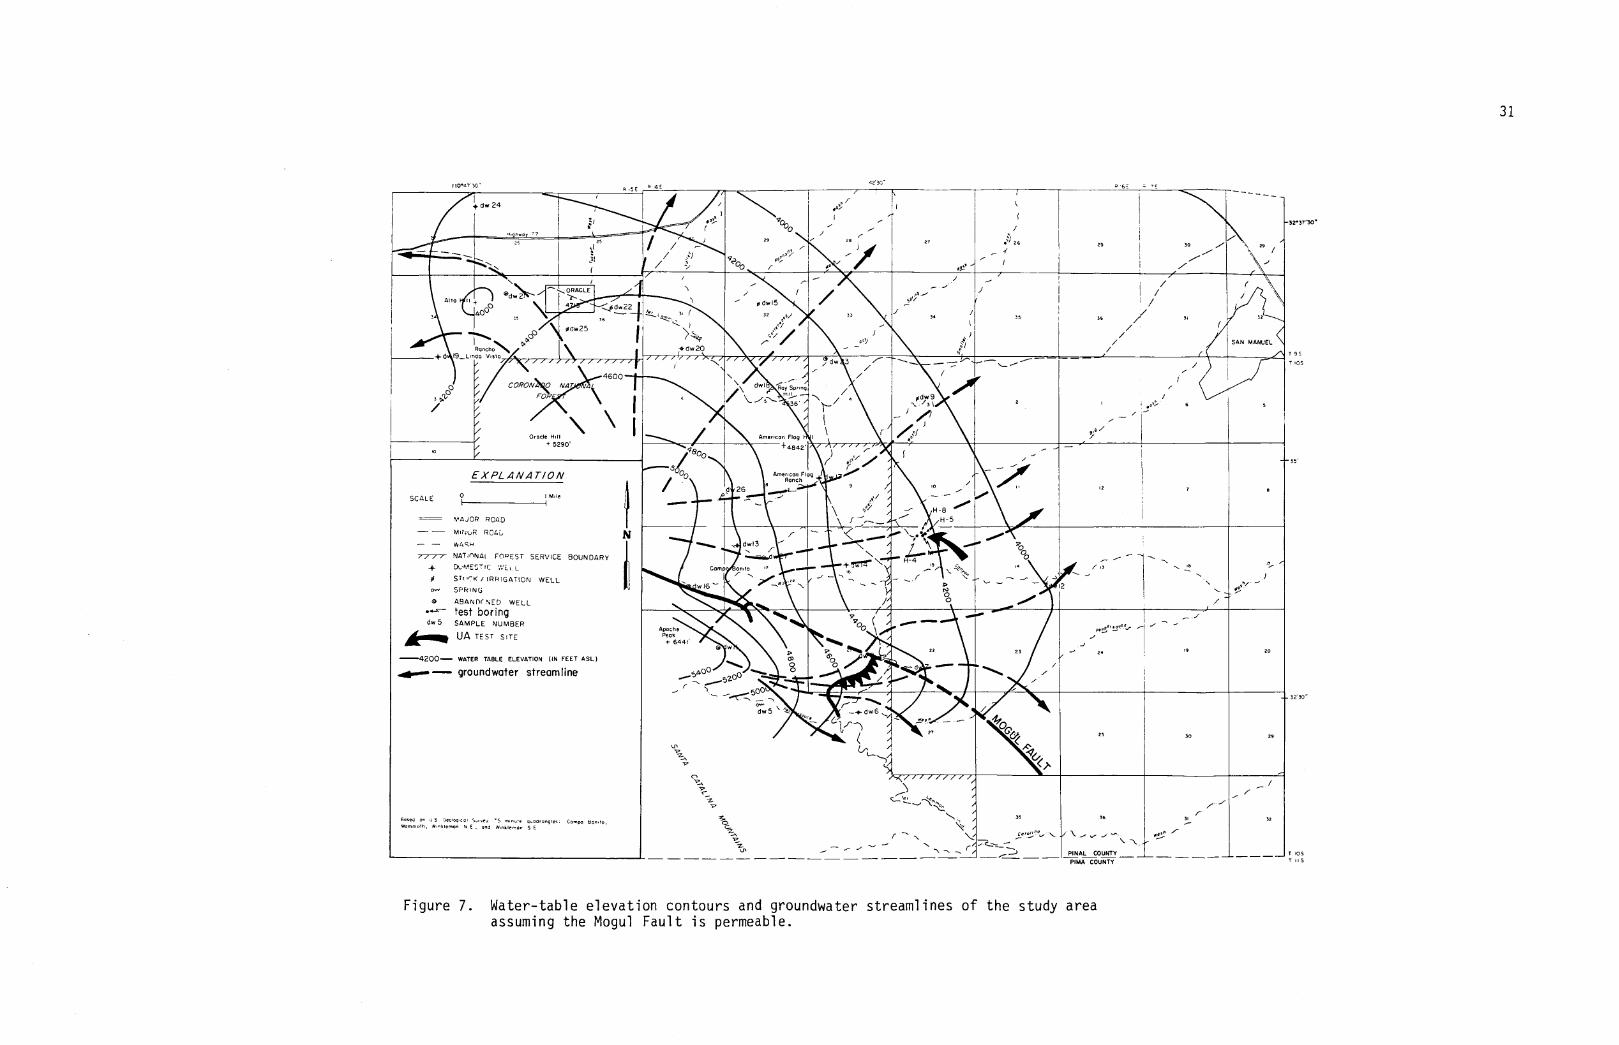
Examination of the water-table elevation map (Figure 7) provides
a basis for interpretation of the groundwater flow system in the study
area. The water-table elevation contours are produced from depth to
water measurements made during July 1983 and from the best available
knowledge (the well operators) of depth to water for wells that did not
allow access of a measuring device. Table 1 distinguishes between water
depths that were measured at the time of sampling and those that were
approximated. The depth to water measured by the well operators is con-
sidered only an approximation because the degree of pumping and length
of recovery before taking the water depth measurement was not recorded.
Groundwater Flow
The water table is highest in the southeast corner of the study
area. Groundwater flows from this area to the east in the southern half
of the study area and toward the north in the northern portion. The
water-table elevation contours are sub-parallel to the surface elevation
contours (Figure 3). The hydraulic gradient is, in general, greater
near the mountains and less along the granite pediment. In the southern
portion of the study area, southeast of Apache Peak, the water-table
contours indicate a groundwater ridge trending to the east.
Flowline construction, based on the water-table contours (Figure
7), indicates that flow originates from a topographic ridge system
30
31
I I0.4 , 30' - E
b '6E
• ...%
29
/
e»
r
/
n
1'
l
(
/
/126
,_ 1
25 30 ../*.
--,..../..-
r"....,
...• M.
)..---
2 --'
‘
Q..... )--,R>' ,80w 20
..-- ..^
/
"-- 0 dve 15
s°‘,..%
/-
-..-
......,,V/
/ 3,1
.., 1
r r,,i__ -
35
/I /1 /
36/
3
/ .
//
/
(
l /
1 2
SAN MANUEL
ANo
406)
'-....... ORACLE
4 ....4dw22---
7.1
-.......
RonchN
+d 9__L n nao 0,510
36
00w25
/ FO/
V
..--•Roy Soneel
3w /-',-
OW9
,/
k .1\ _Ar
*
•._---
.7
/ —/
../
/--
//
)).'!' 5--
5
.
4600/ CORON 0 NAT \
///
\ \// Oracle HIN
/
.d 26--
-_
. 1,,,,- --( ./- —, _9
/ -/--
.-, ....."f ----___..4-\ . H - 5
7 B
EXPLANAT/ON
0 ISCALE MU
I I
— MAJOR ROAD
— — MINuP RCAN
- - INL/SH
corno•
16 -
/3w13'
n /-••nfie,d
:onto I,
' /- ' Ho "
•
/ •\'-- < ........".... --/.1/ .....e
....... / '7:,N / L.. 0
\ ......"... H -4 0+ !Mir v .. ..-... _,-
_. --e, - --- / .e. 12N0
F 0/
,..._ --- --/ , 3
nn .
/
r
/ / / / NATicINAt FOPEST SERVICE BOUNDARY-4, EX:MESTIC WL,. ,_0 STi<( n c / IRRIGATION WELL
ow SPRING
e ABANDF NED WELL
---- test boringdw 5 SAMPLE NUMBER
AMU. UA TEST SITE
—4200— WATER TABLE ELEVATION ON FEET ASL )
.illomm. groundwater streamline
based oa a 5 GeWoo ,c, So n ee, '5 ro.ete quadrangle, Campo leon.,,Yornrnoln, Waltiernan N E , ono 2,nmerban 5 E
ApachePeek+ 644I T
63 W5.CD
- 0-54
-• ...---"*52.00, ,
/ / -...--7 / ---•0 (0 \ ....4.
..44, y./
2220
••4..44
. . r.
7.121%4`-`
-./ 20/
, -_. ....
J9 20
_. 50°'•-- --....r--_,- __,dw5 \ --• V -+-dw6 ,:
44-,,P---)
L-
. t....,-,
. .-/
1.1,t/". r
A's-Z.
-V
25 30 29
E', /////////.5.-.
-5. \
-5.
"g- 350C- ';:\''-Z...
r' r--------Q. -, , -, _-,/-
36
1 PINAL COUNTY—
31,-
00 ...,
___. ___
32
_ —PIMA COUNTY
Figure 7. Water-table elevation contours and groundwater streamlines of the study areaassuming the Mogul Fault is permeable.
32.37'30•
7 90
, 05
35 .
32 . 30'
T 037 5
32
extending from Oracle Hill in the northwest, to Apache Peak in the
southeast. Two factors affecting the infiltration of water along the
topographic ridge are: first, the greater elevation of the mountains
giving a greater yearly rainfall amount compared to the lower elevation
areas; and second, the steep slopes which result in decreased soil
thickness requiring less time for infiltration to take place.
Use of Cations to Aid in Delineating the Flow System
Infiltrating rainwater contains dissolved CO 2 that reacts with
the water to form hydrogen ions. The hydrogen ions can be considered
the major controlling factor of mineral dissolution in silicate terrain
(Hem, 1983). The production of hydrogen ions from the reaction of CO 2
with water is expressed as:
CO 2 (aq) + H 20 = HCO; + H+ .
Hydrogen ions attack feldspars which produce clay minerals, silica, and
cations (Hem, 1983), which in the case of albite can be expressed as:
2 NaA1Si308
+ H2O + 2H+
= Al 2 Si 205(OH)
4 + 2Na
+ + H
4 SiO
4 .-Albite Kaolinite
and for anorthite can be written:
CaAl2Si
208
+ H2O + 2H+
= Al2Si
205(OH)
4 + Ca
2+.
Anorthite Kaolinite
The rate at which the above reactions proceed is a function of concen-
tration of H+, surface area of the reactants, rate of water circulation
33
through the reaction sites, and temperature. Equilibrium is not
achieved in most natural groundwater flow systems. Calcium, magnesium,
and sodium ions in solution are susceptible to adsorption by and ion ex-
change with minerals in the solid phase until thermodynamic equilibrium
is reached (Mandel and Shiftan, 1981). Because of this, calcium, mag-
nesium, and sodium ions can react along the groundwater flow paths.
The order of preference of the above cations in cation exchange reac-
tions is usually (Hillel, 1982)
Ca >Mg> Mg2+
> Na+
.
Thus, the sodium ion would be expected to be the best indicator of
groundwater flow relative to the calcium and magnesium ions.
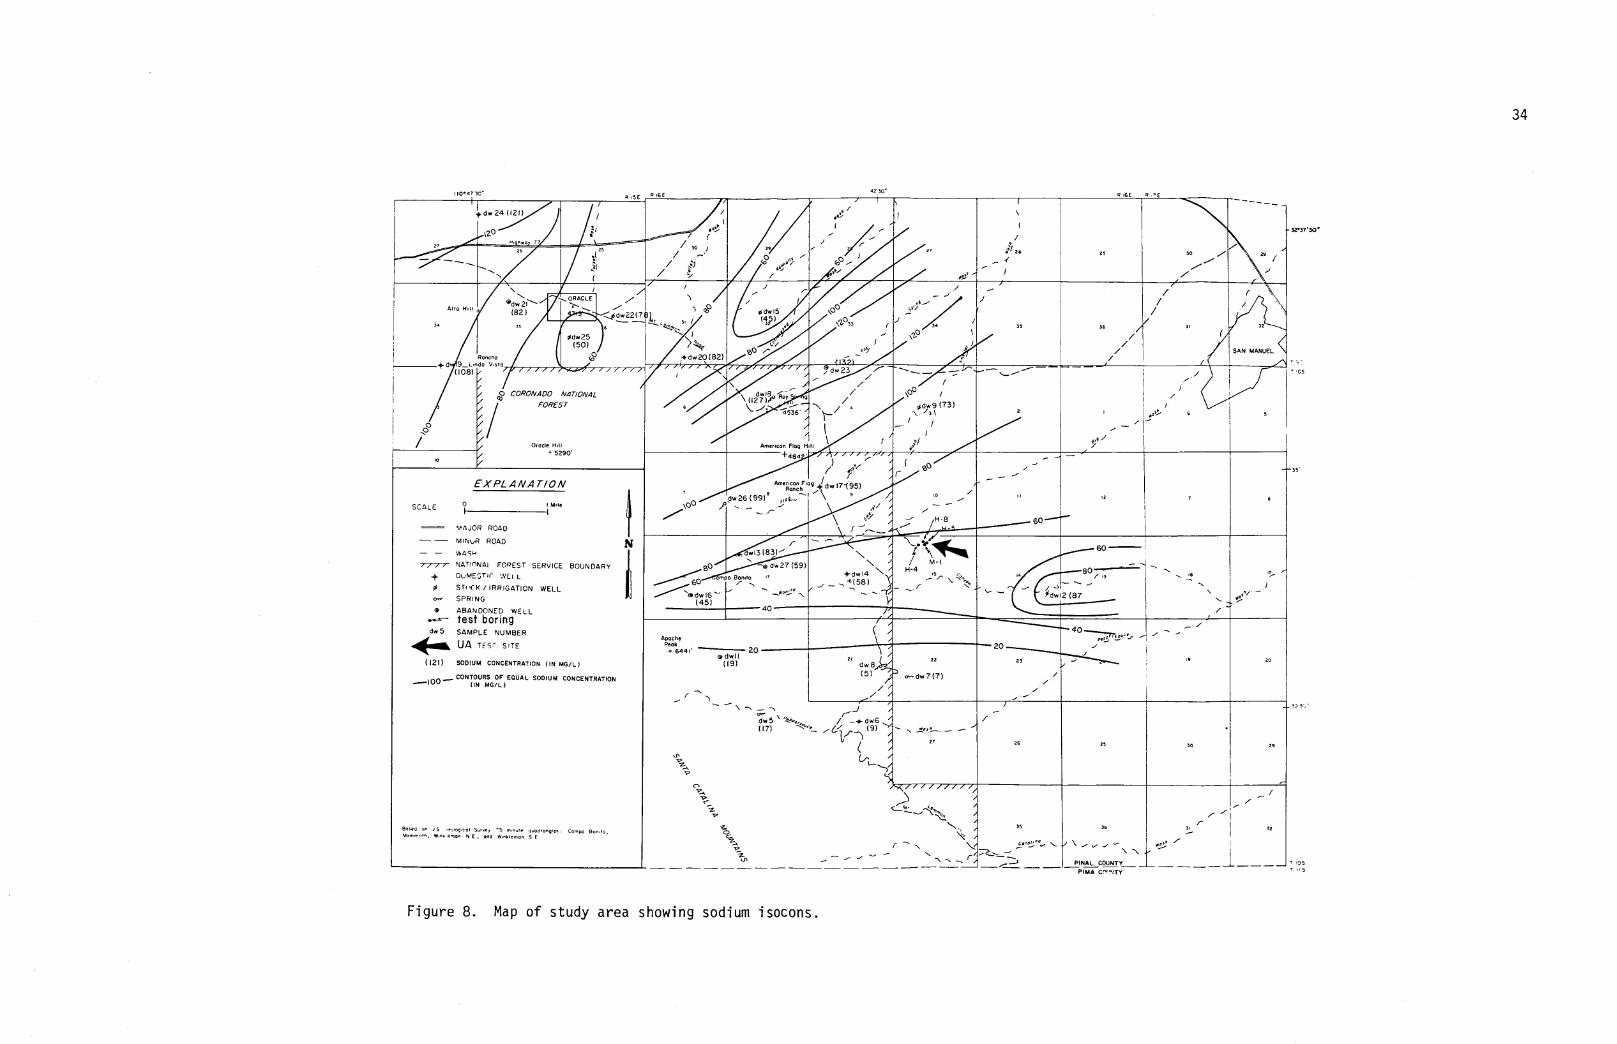
Sodium isocons are hand drawn for the study area (Figure 8)
The hand drawn isocons correspond well with computer generated contours
of sodium values included in Appendix C. General east-west and
southwest-northeast trending isocons may be drawn in the southern and
central portions of the study area, respectively. The trend of the
sodium isocons and the groundwater streamlines (Figure 7) seem to be
consistent with each other. This consistency, if real, would indicate
a minimum of ion exchange and adsorption of sodium along the groundwater
flow path, i.e., chemical equilibrium of sodium may be achieved; thus,
sodium isocons may be a valid indicator of the groundwater flow system
in the southern and central portions of the study area. Contour plots
of calcium, magnesium, and potassium, show no discernible trends
(Appendix C).
34
110 . 4,
n No"
ii.dw2402,)
kzo
(
•
re;/ .
/ ,,.../..,"0 i
0,„e'i
de/ -.-1 .
-
co° ---
/-
i n(
/li 2.
,._ ?
....-'-'..'
../.'
.../
6
\
25
:5‘(
./ /.. /\—7/
\-.. ORACLE 7\ ..". ...._ ../
/Alto H I
(82 )''.2.-- -----<.0dw22(7 ) - /
3. 35(iP) ,A <1253 r J /
3. 35 36 le
Odw25'2-. ) ..... <29 1 ////
(50) >4.2r ,../ 1 /
+ 9__undoPonCh0
v.sta
/
,Cg) + dw 20 (82)
z / 1///),./
ZO /-* a5%__ - /
/
SAN MANUEL
(108) / // ' / / ?dw 23
r.- -._—
\/ •
// 0 CORONADO N4T/ONAL
ro/ FORES T/
/
8,-1-0
\- 5--;6'7 '.-./ '
\C§) i
0.9 (73)-L. ie 1
/
/ I/ I/ / 1
-- 1
/Oracle Hill
/ rAmerican Flog HI
if
4/
/
H+ 5290'/ / / / / , // /-+484 /- —.._ --1 • "
/ ),
('0 ../ -
( /EXPLANATION
7
cacnFiAn:Rni:
9 9 ) '
9.7.tj\dw ..71?5)
lo /
../
/-
I; e0 ISCALESCALE WM \
fotSw2.6.( . _,,,..,i /
— --/
ROAD60
MAJOR
— — MINuR ROAD r --- , .N.._.1,— — • • WAS. wI3 (83)'' N.
/
60
FOREST SERVICE BOUNDARY
WEI L
/ IRRIGATION WELL
WELL
sO
60• PO
'011:1w 16 —(45)
o dw 27 (59)
Bonito ,,/- -,.
'----
N.N /
+dw14'6(58) Y....:4):__ .....
..,....a--807
—n
,`,.. ....-
r / / r NATIf1NAI
+ DuMESTIC
0 sroCK
0.... SPRING
0 ABANDONED 40
test boring.---- -/
dw 5 SAMPLE NUMBERA
( // vol., -pache !-:
40 .......--.7„.„.„,". --
, -- ....
.4111&, UA TEsT SITE Peak+ 644i'
\20 -/
20CadWil
(19) dw 8„,h-o/22
(121) SODIUM CONCENTRATION (IN MG/L)23 -.• 49 20
,.., CONTOURS OF EQUAL SODIUM CONCENTRATION ( 5 ) :7„,t? 0....dw 7 (7) /
------10. (IN MG/L),,
./../
r"--
/---dw 5 ‘ ".f.,...„
' / -0- dw6 /
( ( 7) .,.... , 6„/ (9) --/ -- _.......S.--- — ----- lir-- 2,
26 25 30 29C. /
Li,v
-..,v
c-, ,,LK////////v....vc-
„
..-----
7c_m• <a
v I...\?2, 7
Basra on , .1 5 .mmmpcal Surv n.n
e, -5 .oe apadrongie, Campo 130, 10.s'...,,,
035 36
-.-
/-'32
..larnmo , P. Win• r...,, N E. ana WmPleman 5 E 0Z.,,
2-Ln
\ Z ,
--.' -..f \,.../
`,.. _, .. r ----, _. , ....... ._,
C2.t.:.", ,- \ ....- '- -.- --\ - \
FINAL COUNTY
0° ,. /-
-J- -- — —PIMA CPUNTY
Figure 8. Map of study area showing sodium isocons.
35
Use of Anions to Delineate the Flow System
The chloride anion does not significantly participate in oxida-
tion or reduction reactions, form many solute complexes, form salts of
low solubility, adsorb significantly on mineral surfaces, or enter into
vital biochemical roles (Hem, 1983). The bromide anion displays a con-
servative behavior similar to the chloride anion (Hem, 1983). These
properties of both the chloride and bromide anions allow them to be use-
ful for tracing the movement and mixing of water types along groundwater
flow paths. The use of the chloride anion as an indicator of ground-
water flow is facilitated because of the relative ease and accuracy of
analyzing chloride concentration. Bromide anion concentration in
groundwater is generally lower than the chloride anion.
The applicability of using the bromide anion as a physical
indicator of a groundwater flow system was demonstrated by Koglin
(1983). Koglin used bromide concentrations and chloride-bromide ratios
in a portion of the Tucson Basin in Arizona to distinguish water types
and trace sewage effluent migration in the groundwater flow system.
Koglin investigated several different analytical procedures for determi-
nation of bromide anion concentrations in groundwater. He found that
by using the specific ion electrode, his measurements of bromide concen-
trations, relative to results obtained using neutron activation (his
most accurate analytical technique) were in error from 50 to 100 per-
cent. Koglin determined an average chloride-bromide ratio for his study
area of 130:1 using neutron activation analysis. Koglin also included
a compilation of 44 chloride-bromide ratios from runoff, precipitation,
seawater, and effluent for the Tucson Basin and around the world. The
36
"world average" chloride-bromide ratio is approximately 100:1 excluding
the two effluent samples and one seawater sample.
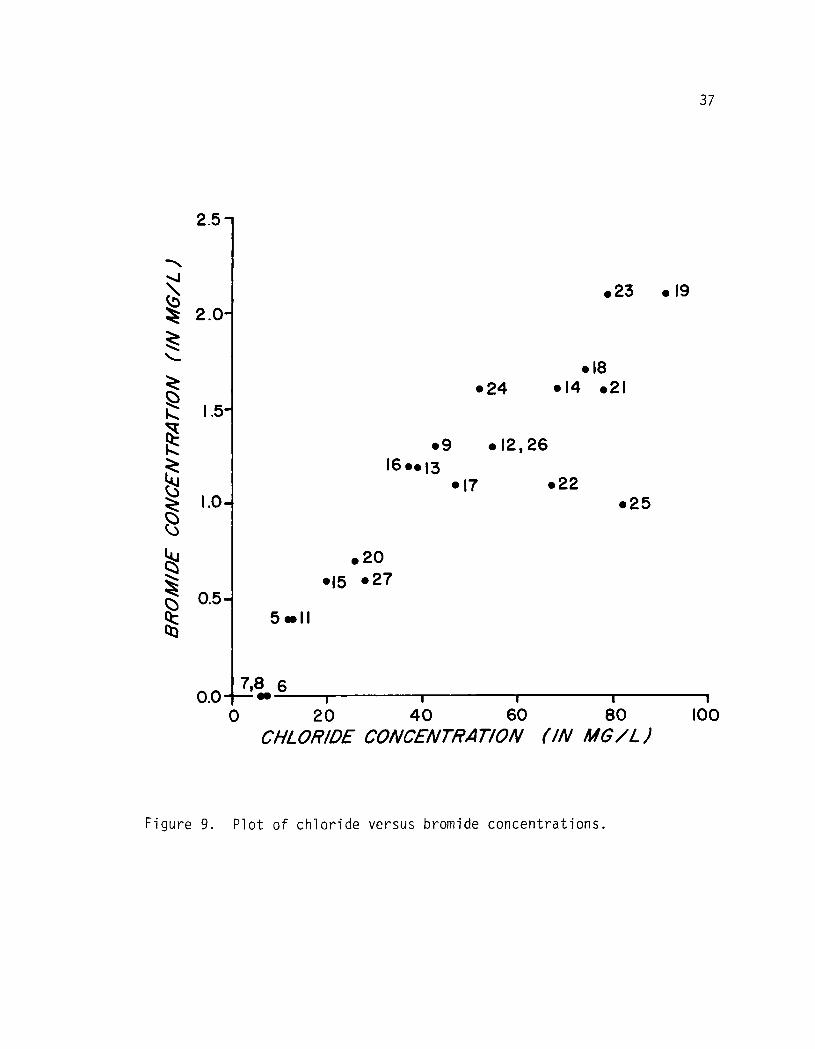
The bromide values presented in this thesis were determined
using the specific ion electrode. A graph of chloride versus bromide
sample concentrations (Figure 9) demonstrates a good linear correlation.
A line may be fit through the data using a linear, least squares analy-
sis. By omitting samples dw 22 and dw 25, a correlation coefficient of
0.93 and an inverse slope of approximately 40:1 is obtained. (The omis-
sion of these two samples is due to sample location considerations and
is discussed later in this section.) This ratio is approximately three
times less than determined by Koglin for his study area and approximate-
ly two and one-half times less than the "world average" (see above).
Thus, if the chloride values are assumed accurate, the measured bromide
values for the study area near Oracle may demonstrate a systematic
measurement error, i.e., the measured bromide values are elevated.
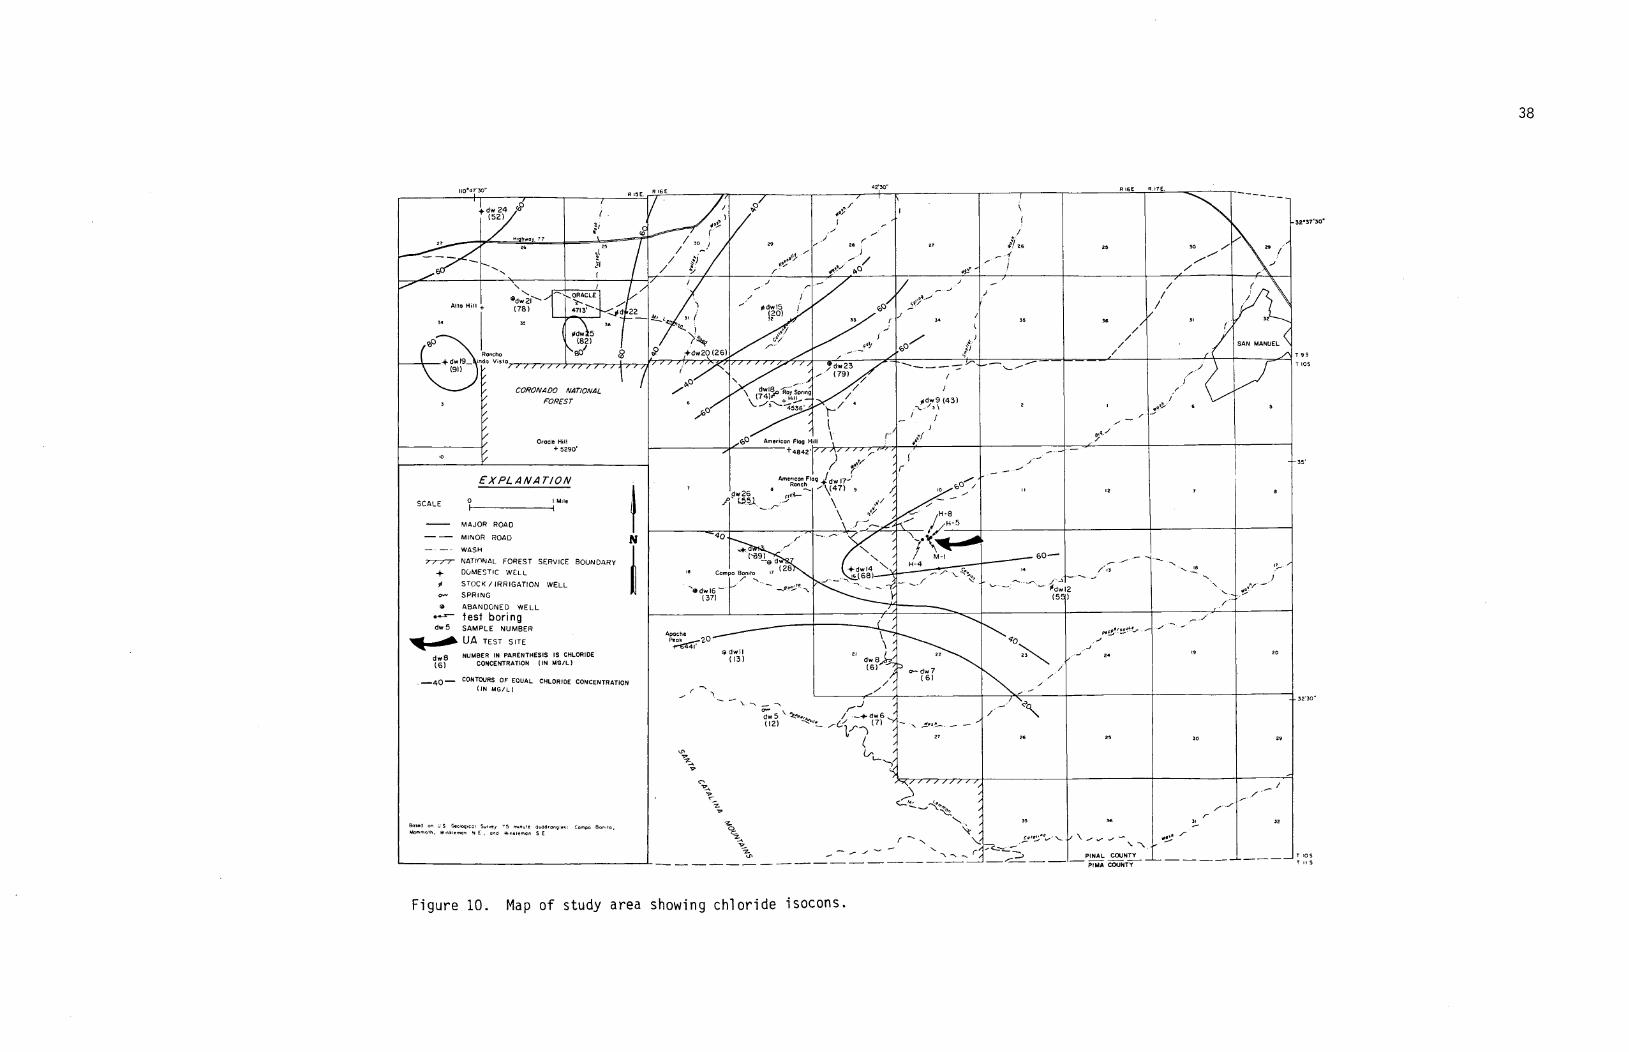
Hand drawn chloride isocons are illustrated on Figure 10 for the
study area. The hand drawn chloride isocons are generally consistent
with computer generated chloride isocons (Appendix C). The southern
extent of the study area displays a general, easterly trend of chloride
isocons except in the region east of Campo Bonito. In the northern part
of the study area, the chloride isocons trend to the northeast except
near the village of Oracle. The linear trends of the chloride anion in
the southern and central portions of the study area seem to be consist-
ent with the groundwater streamlines (Figure 7) which suggests that iso-
cons of the chloride anion may be a general indicator of the groundwater
flow path in the southern and central portions of the study area.
37
--...i\C.
2.5 -
923 • 19
: 2.0-
n-.18
Zt0 • 24 .14 .211,. 1.5-TCkk .9 • 12,26
16..13kiC3
1.0—• 17 • 22
• 250C3
• 20ZZ' • 15 • 27
kco
0.5-5 sell
718 6se0.0 I 1 I t t
0 20 40 60 80 100CHLORIDE CONCENTRATION (IN MG /L)
Figure 9. Plot of chloride versus bromide concentrations.
Alto Hill
se
(RI(82)
Rancho SO
-} dw 19_ Inds v n slo(91) r
••
CORONADO NAT/ORAL
FORES T
SAN MANUEL <-4-dw20 (26)
Ow 9 (43)/3 )
62'30"
-32.37 . 30 .
HiO float 77
(78)
/ t
Arnericon Flag H11 1.,71
+ 48 41 '.: 4:,./7 )1 +1','9: P , ,)
( / //
Arnencon Flog (d v.,17-i'Ranch
/
dw 26 4—a /
0 /re ' L55-I.
\ v6'/ __-• /
H-8
N /
// 'n oiç7116.mmoOlL
/68I N. /
--- — (4dw 2
_.-..— ..." \. -ec -,,
— —4 — --fS":.' r -5
(55 )
21
dw 8-2"22
16) dw 7( 6)
// /
s. ---. _ -.cr.. .dw 5\ -te., / —4- dw 6 '(12) ----''''—. -6"/ 171 '''' — . .J.,..1-- — — -'
1(/---)1 / 27
--A
)1c+ r‘s(•••,/•/./, „y--Ay /
s--.... ....-- /2V ----. --., . L2z0.2 /.
-g-'
/, 5502-, f ---- -,, \,..!s,
/ ,e,.-----_•_--us
'0
-.. -.... -- r / _...,2
......
r
Oracle Hill
+ 5290'
EXPLANATION
SCALE O I Mile
MAJOR ROAD
MINOR ROAD
WASH
rr zr NATIONAL FOREST SERVICE BOUNDARY+ DOMESTIC WELL
STOCK/IRRIGATION WELL
SPRING
a ABANDONED WELL
• test boringdw 5 SAMPLE NUMBER
itimaiin UA TEST SITE
d NUMBER IN PARENTHESIS IS CHLORIDE
(6)Yi
CONCENTRATION
_40— CONTOURS OF EQUAL CHLORIDE CONCENTRATION
CHEG/TTION (IN SAS/L)LRA
Based on US Geo66tcv Sur.e, 7 5 nun.re quadrangles: Corn60 Boric.IA0000111, ..nkieman t E and .001e00n S E
le
(-99)—0 d
Campo Bonito 17 (28
dw 16(37)
Apache
iB dwill(13)
26
20
29
3i 32
a
Figure 10. Map of study area showing chloride isocons.
•
38
39
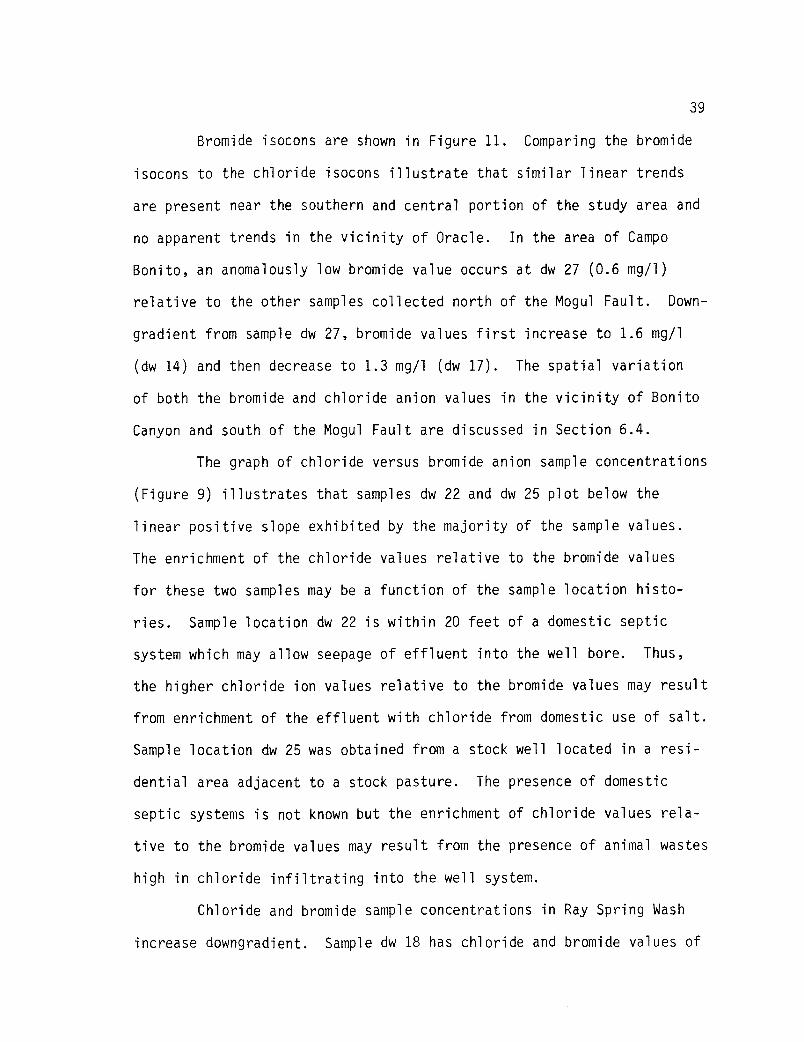
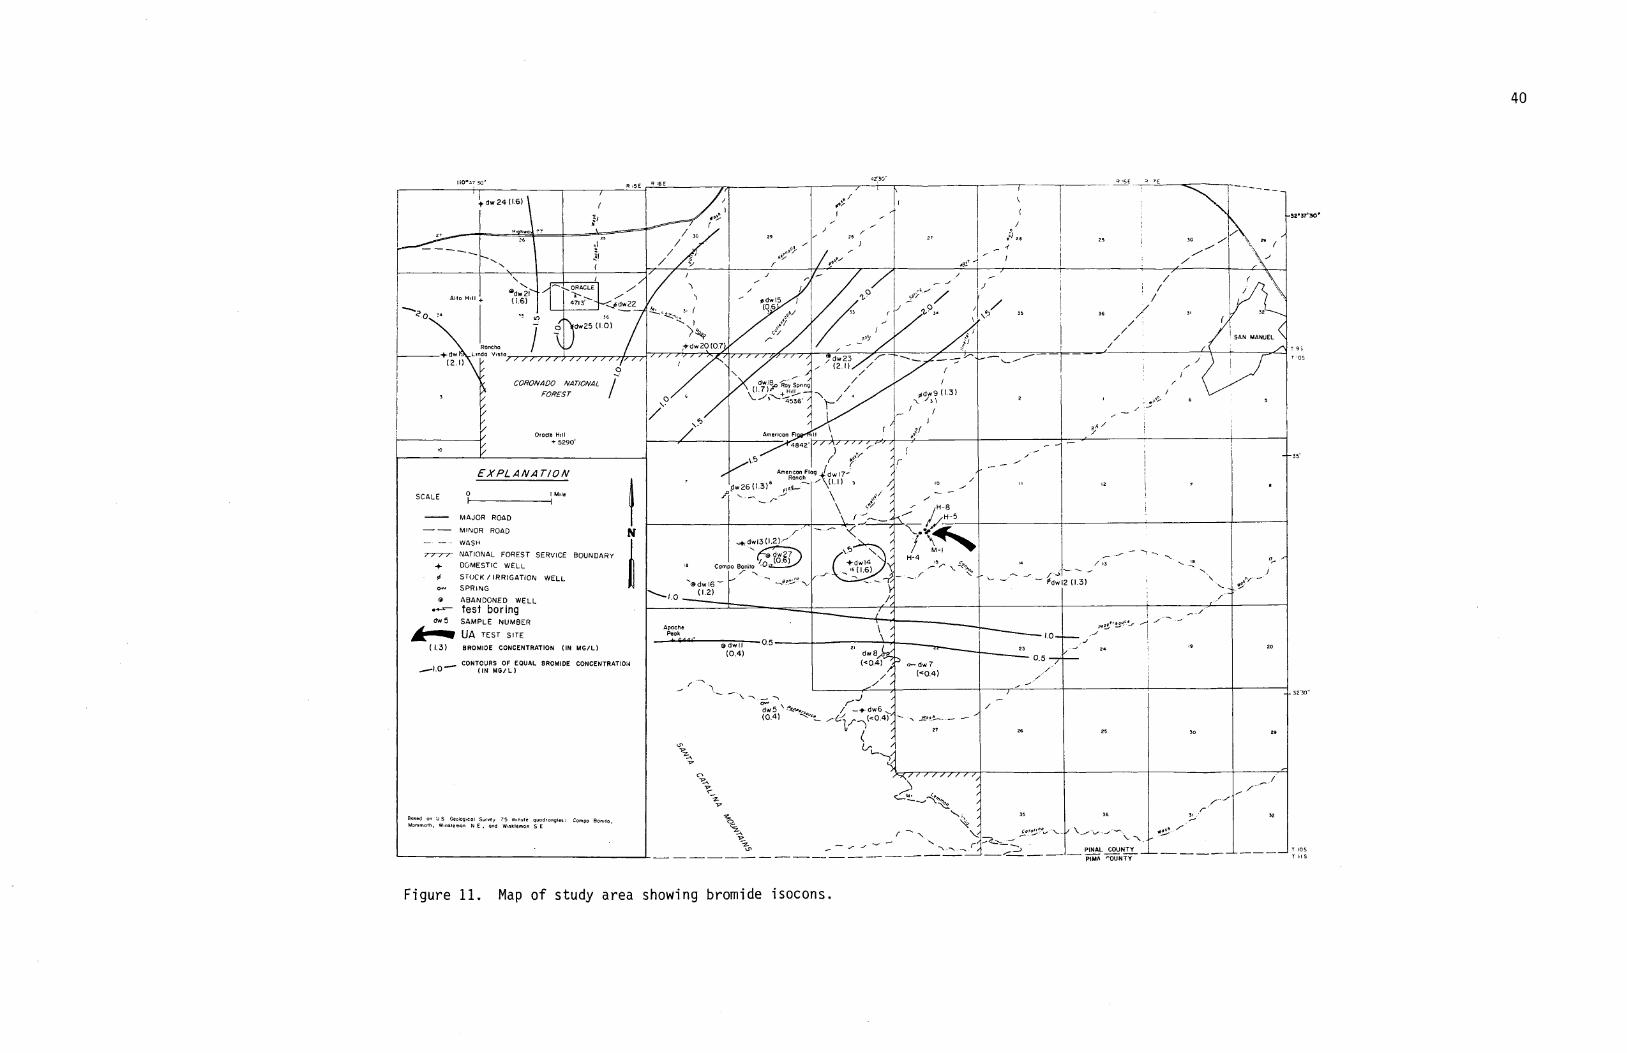
Bromide isocons are shown in Figure 11. Comparing the bromide
isocons to the chloride isocons illustrate that similar linear trends
are present near the southern and central portion of the study area and
no apparent trends in the vicinity of Oracle. In the area of Campo
Bonito, an anomalously low bromide value occurs at dw 27 (0.6 mg/1)
relative to the other samples collected north of the Mogul Fault. Down-
gradient from sample dw 27, bromide values first increase to 1.6 mg/1
(dw 14) and then decrease to 1.3 mg/1 (dw 17). The spatial variation
of both the bromide and chloride anion values in the vicinity of Bonito
Canyon and south of the Mogul Fault are discussed in Section 6.4.
The graph of chloride versus bromide anion sample concentrations
(Figure 9) illustrates that samples dw 22 and dw 25 plot below the
linear positive slope exhibited by the majority of the sample values.
The enrichment of the chloride values relative to the bromide values
for these two samples may be a function of the sample location histo-
ries. Sample location dw 22 is within 20 feet of a domestic septic
system which may allow seepage of effluent into the well bore. Thus,
the higher chloride ion values relative to the bromide values may result
from enrichment of the effluent with chloride from domestic use of salt.
Sample location dw 25 was obtained from a stock well located in a resi-
dential area adjacent to a stock pasture. The presence of domestic
septic systems is not known but the enrichment of chloride values rela-
tive to the bromide values may result from the presence of animal wastes
high in chloride infiltrating into the well system.
Chloride and bromide sample concentrations in Ray Spring Wash
increase downgradient. Sample dw 18 has chloride and bromide values of
SAN MANUEL <
+ 5290'
)(
/ AmenconhFlag
dw 26 (1.3)O
dw( ) 3
EXPLANAT/ON
SCALE O
I Moe
Oracle I-1111 Amerman PI
4842'
aZ30-
dw 24 (1.6)
25
Alto Hill +
36
o dw25 ( ( .0)
RanchoOncla Viola
MAJOR ROAD
MINOR ROAD
WASH
NATIONAL FOREST SERVICE BOUNDARY+ DOMESTIC WELL
91 STOCK / IRRIGATION WELL
ow SPRING
@ ABANDONED WELL
test boringdw 5 SAMPLE NUMBER
W".188 UA TEST SITE
( ( .3 ) BROMIDE CONCENTRATION (IN MG/L)
CONTOURS OF EQUAL BROMIDE CONCENTRATIO4
••••••-• 1 .0 (IN MG/L
Based on U S Geolog ncal Eurve, 75 mmute quadrangles: Campo Bemis,Mamma., W.rAlemon N E , and Walkleman S E
ii dw160(1.2)
ApachePeak
dw
(0.4)
0.5
-• _ , Jr"dw 5 ' .-fe...„ / -+ dw6 ..,...(0.4) -"-='`!_.. .....- cif (<0.4)
ts+
7...37,
L5:/
-o.TA
-A
..---L.-Z. (----...-. ...-.. '-k6
3. . 33
0C. s'''‹
, r - "s. \..... ..'-'''" s--7-
,P.-Z. —0, .._ „,- .... '''' ---
\\ -....
-- C-_---
....--
36
2‘30"
dw 7(00.4)
52
FINAL COUNTY —
40
Figure 11. Map of study area showing bromide isocons.
41
74 and 1.7 mg/1, respectively. Sample dw 23, downgradient from dw 18,
has chloride and bromide values of 79 and 2.1 mg/1, respectively. The
increase of the chloride and bromide values may be explained by evapora-
tion. Sample location dw 23 is an abandoned windmill covered with loose
fitting planks. The sample was obtained near the surface (5 feet) using
a hand suction pump. Lack of circulation in the well and its exposure
to the atmosphere may allow the water in the well bore to undergo evapo-
ration which may increase the chloride and bromide sample concentrations
relative to the concentrations present in the groundwater.
Examination of the chloride and bromide sample concentrations
in Flag Wash suggests contradictory trends in concentrations along the
flowlines. The chloride concentrations of samples collected in Flag
Wash (from high to low hydraulic gradient) are 55 mg/1 (dw 26), 47 mg/1
(dw 17), and 43 mg/1 (dw 9). The decrease in chloride concentrations
downgradient may indicate some recharge of rainwaters low in TDS. The
bromide concentrations of samples collected from Flag Wash however,
decreases from 1.3 mg/1 (dw 26) to 1.1 mg/1 (dw 17), then increases to
1.3 mg/1 (dw 9) downgradient, which infers a more complex process.
Role of the Mogul and Associated Faults
The groundwater flow path south of the Mogul Fault appears to
originate at the groundwater recharge divide near Apache Peak (Figure
7). Groundwater flows to the southeast and northeast away from the
groundwater ridge and to the east along the ridge. Immediately north
of the Mogul Fault, groundwater originates near an unnamed topographic
42
high (about 5400 feet) northwest of Campo Bonito, and flows in an east-
erly direction.
There is evidence that the Mogul Fault acts as conduit for
groundwater flow southeast of Apache Peak. Samples dw 7 and dw 8 are
located in the Mogul Fault zone. Both sample locations are continuously
flowing springs which supply water for domestic and livestock use. The
locations of samples dw 7 and dw 8 are associated with a northeast-
trending thrust fault which intersects the groundwater recharge divide.
Both the Mogul Fault and the thrust fault appear to act as conduits to
the discharge points at sample locations dw 7 and dw 8. Sample dw 11
was obtained from a well near the upper reaches of Apache Peak at the
end of a small fault which separates the Bolsa quartzite and the Abrigo
Formation. This well overflows at certain times of the year as reported
by local residents but no detailed records have been kept.
Faults often exhibit reduced permeability in the direction per-
pendicular to the fault plane. The reduction of permeability can be
caused by several mechanisms including fracturing of materials in the
fault zone, offset of impermeable beds, elongated and planar clasts be-
ing oriented parallel to the fault surface, and deposition and altera-
tion of minerals on the fault surface (Davis and DeWeist, 1966).
Construction of groundwater flow lines (Figure 7) indicates groundwater
flow crossing the Mogul Fault in a northeasterly direction and veering
to the east within 1 mile north of the fault. Thus, the fault appears
to be permeable, allowing mixing of the fresher (low chloride and bro-
mide) waters from the south with the higher TDS waters to the north.
Reconstruction of the water elevation contours is required if the fault
43
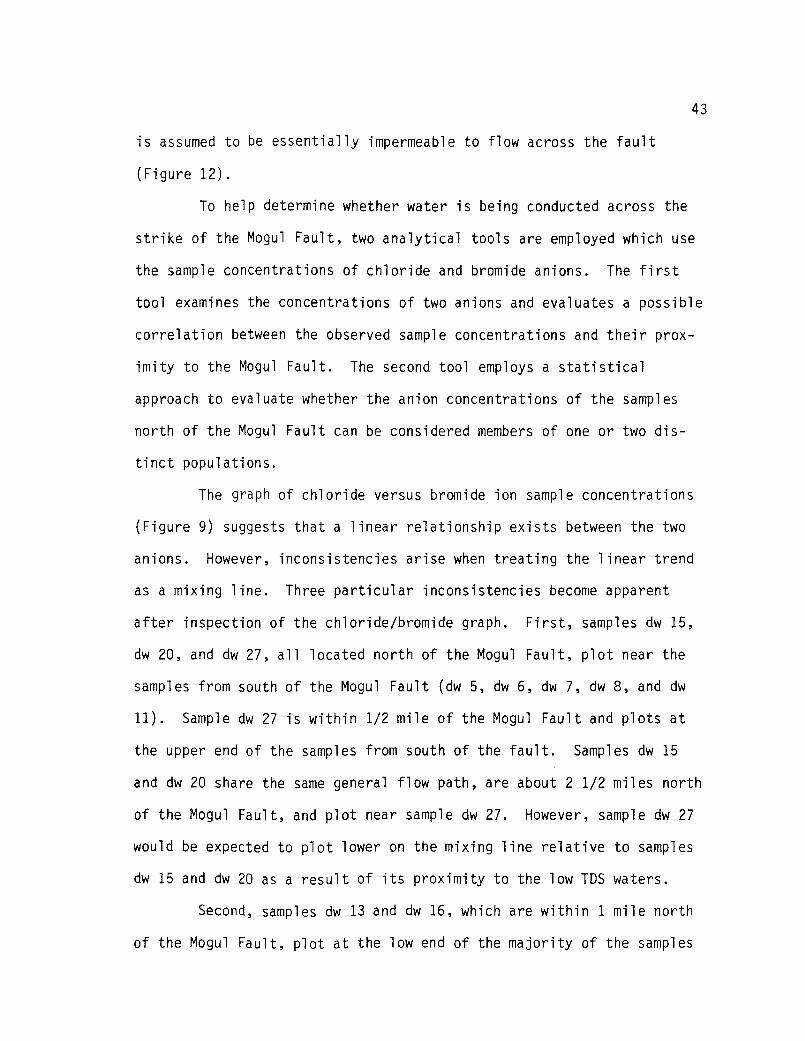
is assumed to be essentially impermeable to flow across the fault
(Figure 12).
To help determine whether water is being conducted across the
strike of the Mogul Fault, two analytical tools are employed which use
the sample concentrations of chloride and bromide anions. The first
tool examines the concentrations of two anions and evaluates a possible
correlation between the observed sample concentrations and their prox-
imity to the Mogul Fault. The second tool employs a statistical
approach to evaluate whether the anion concentrations of the samples
north of the Mogul Fault can be considered members of one or two dis-
tinct populations.
The graph of chloride versus bromide ion sample concentrations
(Figure 9) suggests that a linear relationship exists between the two
anions. However, inconsistencies arise when treating the linear trend
as a mixing line. Three particular inconsistencies become apparent
after inspection of the chloride/bromide graph. First, samples dw 15,
dw 20, and dw 27, all located north of the Mogul Fault, plot near the
samples from south of the Mogul Fault (dw 5, dw 6, dw 7, dw 8, and dw
11). Sample dw 27 is within 1/2 mile of the Mogul Fault and plots at
the upper end of the samples from south of the fault. Samples dw 15
and dw 20 share the same general flow path, are about 2 1/2 miles north
of the Mogul Fault, and plot near sample dw 27. However, sample dw 27
would be expected to plot lower on the mixing line relative to samples
dw 15 and dw 20 as a result of its proximity to the low TDS waters.
Second, samples dw 13 and dw 16, which are within 1 mile north
of the Mogul Fault, plot at the low end of the majority of the samples

61,547 C7/22
SAN MANUEL
CORo CO Mar
American FIN
-7 4842 .
EXPLAN4rtoN
0 i u.1eSCALE
M.1..;CR ROAD
MiNCR RCAD
WASH
FL.PEST SERVICE BOUNDARY
DCMEST , C 'NELL+0STCCK I iRRIGATION WELL
SPRiNG
Ast.NsoNso WELL
test boring0.5 SAMPLE NUMBER
,00.1916, UA TEST SITE
...4200—water table elevation (in feet ASL)
........O.groundwater streamline
a.23ecl e3 L S :••••• • 5 m n nute ,LC? . Zarren ear wo.31cœ,a111. 4 , 3 1•, ,, ME . w,ntoernOn SE
L‘nApache
PeoR
"2 6441
/
dw 12
0... V' 5 20 0 0
a -1109,... ___.t,_5, 0 00, ,c _ .. ::;=::,...)r--
°;:. 57 ..„.. / - }cive6
1 - ' '''" oP I 27
32 .30 4
1‘
A, AA
—.. A .CS7. 115
1 2
25
-z.
44
Figure 12. Map showing water-table elevation contours and groundwater streamlines of the studyarea assuming the Mogul Fault is impermeable.
45
which originate from the granite. The grouping of samples dw 13 and
dw 16 which are lower in TDS relative to the majority of the samples
from the granite, may imply that lower TDS water is mixing with the
higher TDS waters. However, samples dw 17 and dw 9, which are removed
(greater than 1 mile) from the fault, plot near samples dw 16 and dw 13
suggesting that simple mixing is not occurring north of the fault.
Third, sample dw 14 plots in the midst of the samples taken from
the granite. The relationship of sample dw 14 to the majority of the
wells from the granite suggests that sample dw 14 possesses a typical
chloride-bromie ratio for a sample obtained from the granite that is
not being influenced by mixing with low TDS waters from south of the
Mogul Fault. However, sample location dw 14 is close to the Mogul Fault
and is not centrally located in the Oracle granite. The chloride and
bromide values of sample dw 14 are also inconsistent (higher than ex-
pected) relative to the three samples (dw 13, dw 16, and dw 27) up-
gradient. The hypothesis of mixing of low TDS waters flowing from the
south to the north across the Mogul Fault is not substantiated using a
chloride-bromide analysis with the available data.
A two-sample Student 's ttest (Hawkins and Weber, 1980) is
employed to test the hypothesis whether the concentrations of chloride
and bromide in the five samples immediately north of the Mogul Fault
are randomly distributed with respect to all other samples from the
granite or whether the five samples belong to a separate distinct popu-
lation. The test is used to examine the difference between the means
of two sample populations by assuming the populations are normally dis-
tributed with unknown but equal population variances. The test
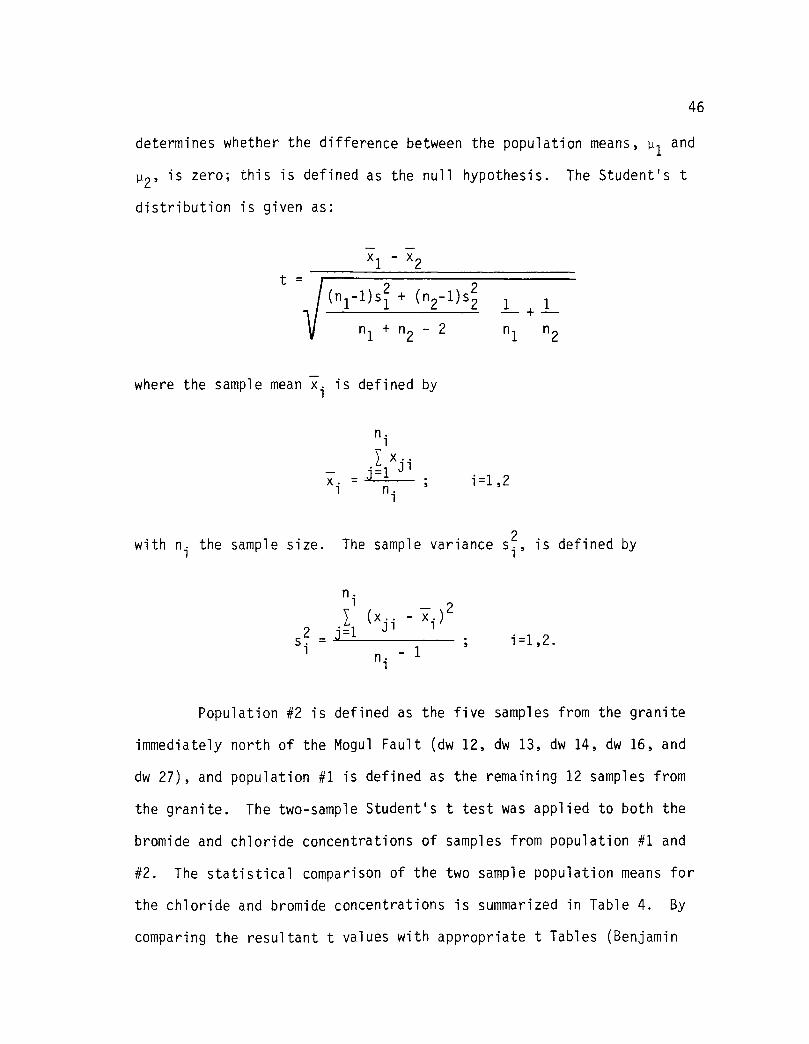
46
determines whether the difference between the population means, p i and
p 2 , is zero; this is defined as the null hypothesis. The Student's t
distribution is given as:
t (n..-1)s 2 + (n -1)s 2
1 1 2 2 1 4. 1
n1
+ n2
- 2 n1
n2
where the sample mean -X-i is defined by
n.i1 x... Ji
3-(- . = j=1 ; i=1,2i n.i
2
with ni the sample size. The sample variance s i., s defined byi
n.i1 (x.. -;- .) 22
-J4 . 1Ji i
s.1 n. - 1
1
i=1,2.
Population #2 is defined as the five samples from the granite
immediately north of the Mogul Fault (dw 12, dw 13, dw 14, dw 16, and
dw 27), and population #1 is defined as the remaining 12 samples from
the granite. The two-sample Student's t test was applied to both the
bromide and chloride concentrations of samples from population #1 and
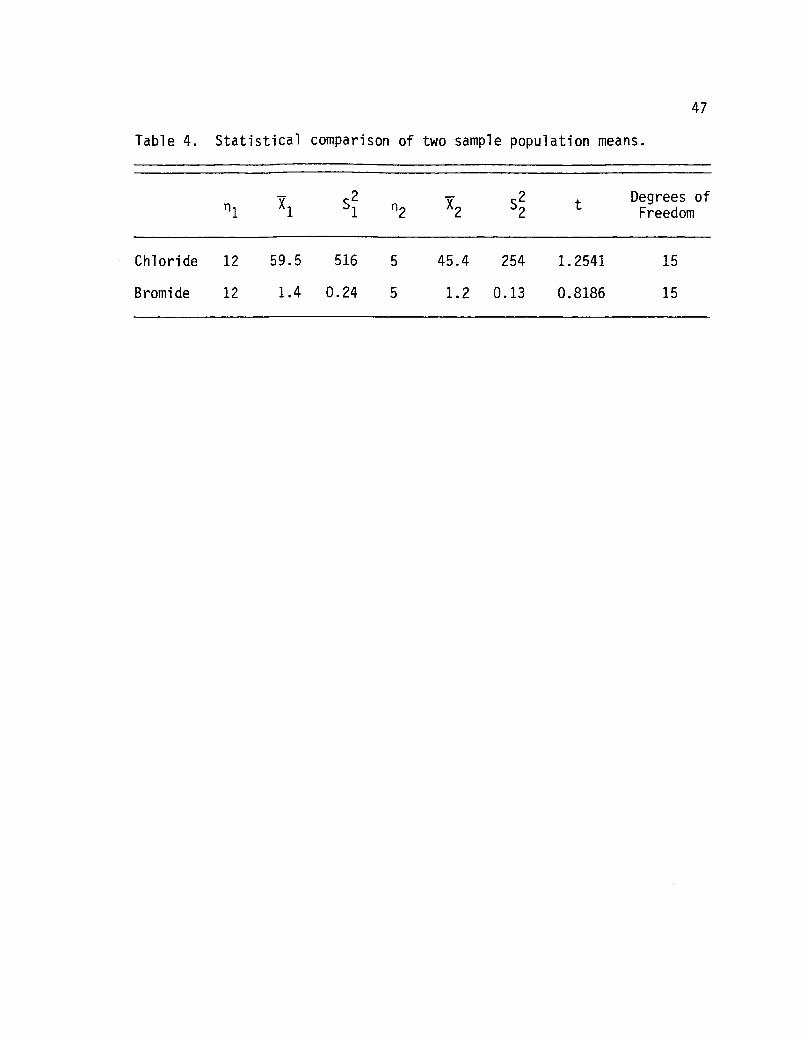
#2. The statistical comparison of the two sample population means for
the chloride and bromide concentrations is summarized in Table 4. By
comparing the resultant t values with appropriate t Tables (Benjamin
47
Table 4. Statistical comparison of two sample population means.
s2 T.(-2s2 Degrees of
n 1 1 n2 2 Freedom
Chloride 12 59.5 516 5 45.4 254 1.2541 15
Bromide 12 1.4 0.24 5 1.2 0.13 0.8186 15
48
and Cornell, 1970; and Steel and Torrie, 1980), the null hypothesis is
accepted based on a confidence interval of 10 percent. This acceptance
implies that the concentrations of the five samples directly north of
the Mogul Fault are part of the same population as the remaining wells
in the granite.
The flow system near the Mogul Fault is not clearly understood.
Lack of sufficient sample points in the area prevents a precise evalua-
tion of groundwater flow across the fault. The graph of chloride and
bromide ion values suggests inconsistencies in the ion values with
respect to a sample's proximity to the Mogul Fault. The application of
a two-sample Student's t test to the sample concentration means for the
chloride and bromide ions suggests that all samples collected from the
granite are members of a single population. Both analytical tests
reject the hypothesis of mixing of waters from south of the Mogul Fault
with the waters from the granite. Based on the results of the two
aforementioned analyses, a second groundwater flow map can be con-
structed (Figure 12). In this groundwater flow map, the Mogul Fault is
assumed to be a barrier to north-south groundwater flow. Thus, the
lower TDS waters south of the Mogul Fault would not mix with the waters
to the north of the fault.
Discussion of Isotope Results
Four samples from the study area were analyzed for deuterium
and oxygen-18 (Figure 5) to aid in determining the age and elevation of
the source of the water in the study area (Mandel and Shiftan, 1980;
Freeze and Cherry, 1979; and Payne, 1972). All the samples were
49
collected in July, 1983. The spatial distribution of the samples rep-
resent four different flow subsystems based on hydraulic information
(Figure 7). Isotope values from sample dw 17 are the most highly en-
riched in deuterium (-65.1) and oxygen-18 (-8.6) relative to the other
three samples. A lower altitude of recharge for the groundwater at
sample location dw 17 or recharge from summer (versus winter) precipita-
tion, could explain these high values (Mohrbacher, 1984; Dreyer, 1982).
The explanation of a lower altitude of recharge is consistent with the
observation that chloride and sodium concentrations decrease down-
gradient slightly from dw 27 to dw 17 and from dw 17 to dw 9 along Flag
Wash. The decreasing ion concentrations downgradient may indicate a
dilution of solutes in the groundwaters by recharge along the flow path
at lower elevations with low TDS rainwater.
Evaluation of the plot of deuterium versus oxygen-18 values
(Figure 6) illustrates that a straight line can be drawn through the
plots of samples collected from wells in the Oracle granite (dw 17, dw
20, and dw 25). Sample dw 17 has the greatest enrichment of all four
samples and plots the farthest off the Craig meteoric water line. This
deviation from the meteoric water line suggests that the water has
undergone significant changes from the original rainwater. The slope
of the line (5.5) is within the range of values (4-6) observed for ter-
restrial waters undergoing evaporation. The evaporative process causes
a preferential enrichment of 1H 2
180 relative to
1H2H160 (Thatcher, 1967
and Payne, 1972). The evaporative process in this case may be the high
rate of evaporation in the desert environment occurring from the time
the water is released as precipitation to the point of impact on the
50
earth's surface and subsequent recharge into the groundwater. The
linear relationship between samples dw 17, dw 20, and dw 25 suggests
that the three samples may share a similar source (elevation, area, time
of year, or all three) in contrast to sample dw 8. The difference in
isotope values between samples dw 20 and dw 25 may be insignificant when
taking into account the overlapping error bars (Figure 6).
The lack of multiple analyses of the four isotope samples and
a limited number of sample points in the study area prevent any defini-
tive interpretation of the isotope values. The linear distribution of
samples dw 17, dw 20, and dw 25 appears to represent one water type and
sample dw 8 another. This suggestion of two water types agrees with the
interpretation of the major ion chemistry. The two water types may rep-
resent different elevations of recharge or the season in which the re-
charge occurred, or both.
CHAPTER 7
SUMMARY AND CONCLUSIONS
A hydrogeochemical study of groundwater in the vicinity of the
University of Arizona's test site near Oracle, Arizona was used to aid
in the delineation of the groundwater flow subsystems. Twenty-one of
the 26 water samples collected from wells and springs in the study area
came from the Precambrian Oracle granite in the northern part of the
study area. The remaining water samples came from the Precambrian to
Cenozoic age sediments, metamorphics, and intrusive dikes in the south-
ern part of the study area. The west-northwest trending Mogul Fault and
its associated en echelon and thrust faulting separates the northern
and southern parts of the study area.
The water samples were analyzed for the major ions, silica,
iron, fluoride, bromide, and iodide. Four of the 26 samples were ana-
lyzed for the environmental isotopes, deuterium and oxygen-18. Three
water groupings were labelled and possible hypotheses given for their
chemical variations along the groundwater flow paths. A water type
relatively high in Ca 2+-Mg2+ and high in TDS characterizes the water
samples from north of the Mogul Fault and a water type relatively high
in Ca2+
-Mg2+
-HCO;
but low in TDS characterizes the water south of the
fault. A third water type, with highly variable chemistry, character-
izes the water sampled from boreholes at the field site. The boreholes
at the field site were subjected to introduction of groundwater tracers
51
52
and water trucked in from the Oracle public water supply during field
studies; as a result, their chemistry was not included in the analysis
of the flow system.
In general, the groundwater appears to be obtaining its chemical
characteristics as it infiltrates into the flow subsystems in the moun-
tains. Hand drawn isocons of two conservative anions (chloride and
bromide) and the sodium cation exhibit similar trends. Computer contour
plots of these three ions coincide well with the hand drawn contours.
The trends of the isocons are consistent with the groundwater stream-
lines in the southern and central portions of the study area suggesting
a lack of infiltration in the lower elevation areas east of the moun-
tains in the granite. The trend of the sodium isocons suggests chemical
equilibrium of sodium along the flow paths in the southern and central
portions of the study area.
Portions of the Mogul Fault appear to act as permeable conduits
for groundwater flow along the fault zone as evidenced by continuously
flowing springs from areas of the fault. Groundwater level measurements
indicate that groundwater is flowing in an easterly direction in the
vicinity of the Mogul Fault, but lack of sufficient water elevation data
adjacent to the fault prevents a precise determination of the nature of
flow across the strike of the fault. Water chemistry analysis was used
to aid in determining the flow system across the fault. The water
chemistry of samples taken from both sides of the Mogul Fault suggests
that distinct flow subsystems exist on each side of the fault. The
environmental isotope data demonstrates differing isotopic signatures
for a sample south of the fault relative to three samples taken from
53
north of the fault. The graph of chloride to bromide suggests several
inconsistencies in characterizing flow across the strike of the Mogul
Fault. The mean concentration of the chloride and bromide anions for
two sample populations from the granite were tested with a two-sample
Student's t test to determine the probability that both the populations
are part of the same population. One sample population was comprised
of the five wells immediately north of the Mogul Fault, and the other
was comprised of the remaining wells from the granite. The Student's t
test results, based on a 10 percent confidence level, indicated that the
two sample populations were from the same population.
In conclusion, the groundwater appears to attain its chemical
character as it enters the groundwater flow system near the mountains.
The groundwater south of the Mogul Fault is lower in TDS and appears to
spend less time in the groundwater flow system relative to the flow sys-
tem north of the fault. Little or no groundwater flow appears to be
occurring across the strike of the Mogul Fault.
APPENDIX A
ANALYSES OF WATER FROM REPRESENTATIVE WELLS IN THE ORACLEAND ORACLE JUNCTION AREA, PINAL COUNTY, ARIZONA
54
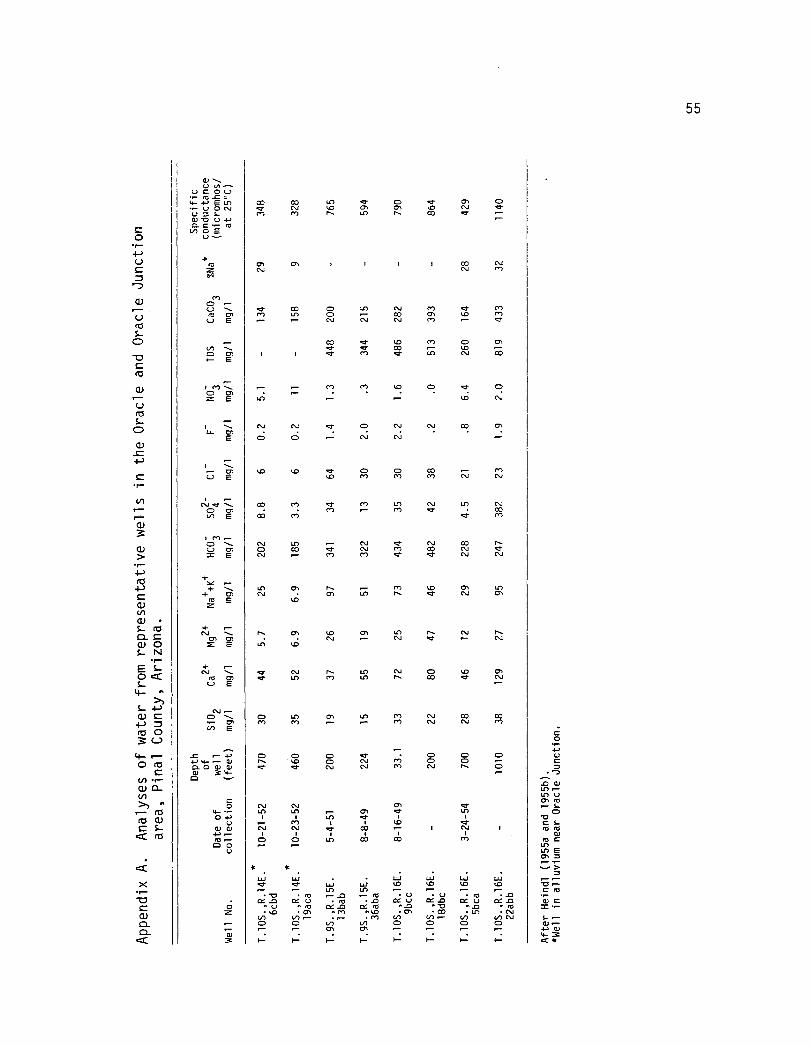
o4-)
et5S-O
(15
cos-cp
_c4-3
• r-
r-
e/
(15
VIa)s-o_ rcs
oN
CUL.) •-•C CD C.)
-C4- 5.5 E
u 0 CVc S-
CV Q UC
V) 0 E
+
2e5t
c")0 F
rt:1L.) E
V) •-nDE
I 010 cn
E
D
ce,E
I
0 05E
I 01 .-0C.) 0)
E
ez5 E
+•N
co 0)E
r-
CO
Cr)0.4
CD.
to
CO
OC5.1
LC)
CO
c•-)
to
LC)co
N.
C5.1
vD
•er(51
Co
•cr
C5.1.
C51
L. L7)
D
OD
VDOD
LLD
rn
V)c")
c")E
LCI
OCO
Dc")
n")
LII
c5.1
COL.")
CV
COE
LO
CON.
LD
L.C.)
OD
LC)
CO
CV
D
cr)0.1cl•
C5.1.
OD
LO
oE < CL..1
,c3•41.
LO12)L.0 N. OD
LIDC5.1
4- ^
S- CV .-
4-1C 0
FUl D ul CO
CLJCOc")
(I5 0(/) E
o.-
••n••4.1
4- -C F 0 0 0 •LS- 0 0 0
0 MS5-) 4- 05D. 0 CU
N.":1-
).0c1-
0C5.1
NJCV
elC•1
0NJ
0N.
..--0
Q.) 3 4- F •
V).10
(1) L0 ,—1.0
>5 0 CV CV01 CO
CO0 +5
ulI
LC)I LCI
01cl-
•cr ul O
C(1.)&- WE CV
01CV.
I 8CV
CL.,0
CC CO 41-E-
8O
j., d:.0:) en
Q.)CD C
D 0 UlE
>•
LLI•
LLI • .•
1.1.1•
U..1•
LLI.
1+.1
• r-
V-F.
• '0
crF.
• ,C)
1.1JLII-.0
1-Llul-E
1.0F
• U
LC)F
• (..)
LC)F
• MS
VD,- C
••-•
oCG -CI" U
CG U. cl
• 25CG .0
• .0CG .5-1
CC t.)..• -0
CC .0^ ID
CC U"-CI
CC .0.. tri
C
CI)JO
V)0
• 01V) t-0
" en
V)
^ LO• C.,
V)
• 01Le)0
• COV) •-•0
• LOV)0
• CVV) CV0
•--CU •-•
c:[
1-- F 01 01 r•-• F F e•-• .1-)4- 3
55
APPENDIX B
SUMMARY OF WELL CONSTRUCTION FOR SOME BOREHOLES AT THEUNIVERSITY OF ARIZONA'S FRACTURED ROCK TEST SITE
NEAR ORACLE, ARIZONA
56
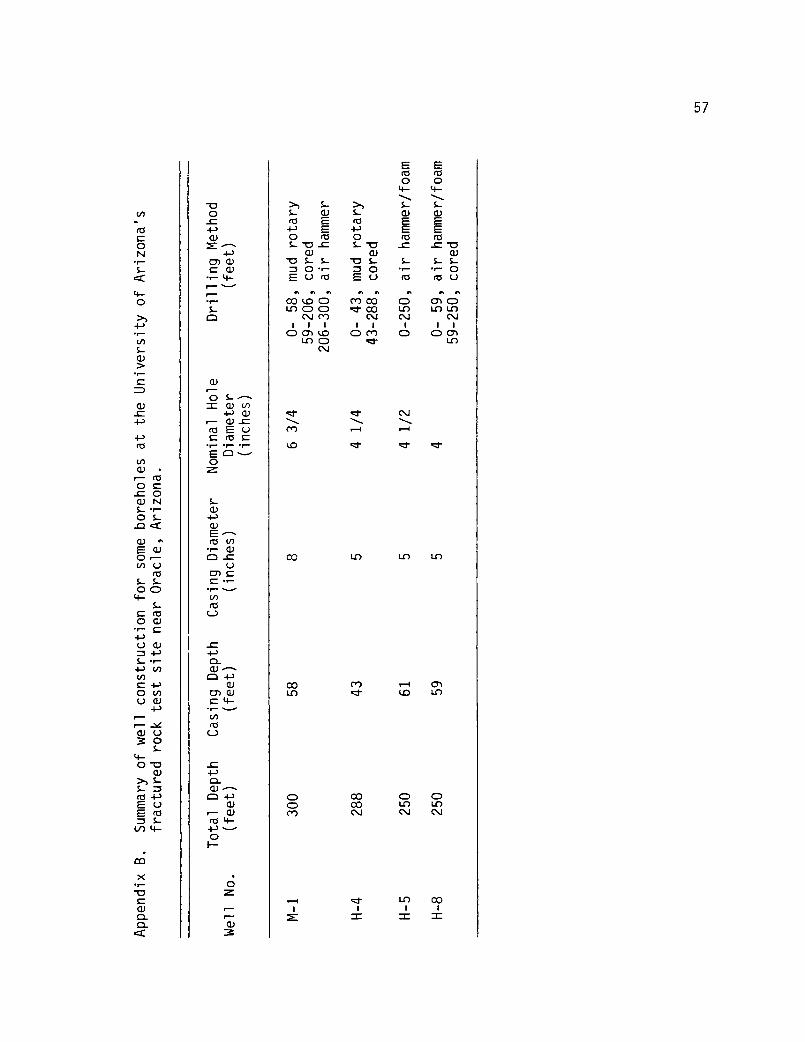
57
(LS d0 04- 4-
S- ›•) S-S- CL) L al a)
E rd E EE 4-)
0 d 0S- "CS _C _C
Q)QS-S- -C1 S- S- S- S-D 0 •,-• 0 •r- 0E cd EQ ci (15 U
CO O CD CO CD• CrlLo 0 0 d- co I-0 LO
Cs.) COI I I I I I I I
0 CI k.0 co 0 0 crNLo
CN.1
dr d- CV-....„ -.... -.....
co 1-1 v--I
lfp GI" .:j" Gt"
00 CS)L.0 tO
co 0 0co LC) ix)C') C.)
cr,
0
•r-S-cr
4-0
4-3•1-
V)S.-Q)
4-)
4-)
tr)0.) •
OC.0 0CL) N
• S-rcr
CI) •'`E Cll0 r—V) C.)
rCSS- S-O 04-
S-C c00 0:13
c4-)• CL)
4--)S- •r-
4--1cr)C 4-)O U)
CU4-3
1— _X• (...)• 0
S-
"C:1
>, S-S-• 4-)EE c0
S-C ) 4-
CO
X•,-
CL)0_0_
0_C4-)CL)
4-)CI a)
▪ 4-r-- •-•-•
S-
0 5-= CL) V)
4-) CL)_C
rcS EC ccs C
EO
APPENDIX C
COMPUTER CONTOUR PLOTS OF SELECTED IONS
Computer generated contour plots for selected ions were com-
pleted using Golden Software* by creating a regularly spaced grid from
irregularly spaced data based on the inverse distance squared between
data points. The contours were smoothed towards the mean of the data
input using a factor of 0.98.
*Golden Software, 1984. TOPO, Version 1.0 for the IBM Personal Com-puter, Golden Software, Golden, Colorado, U.S.A.
58
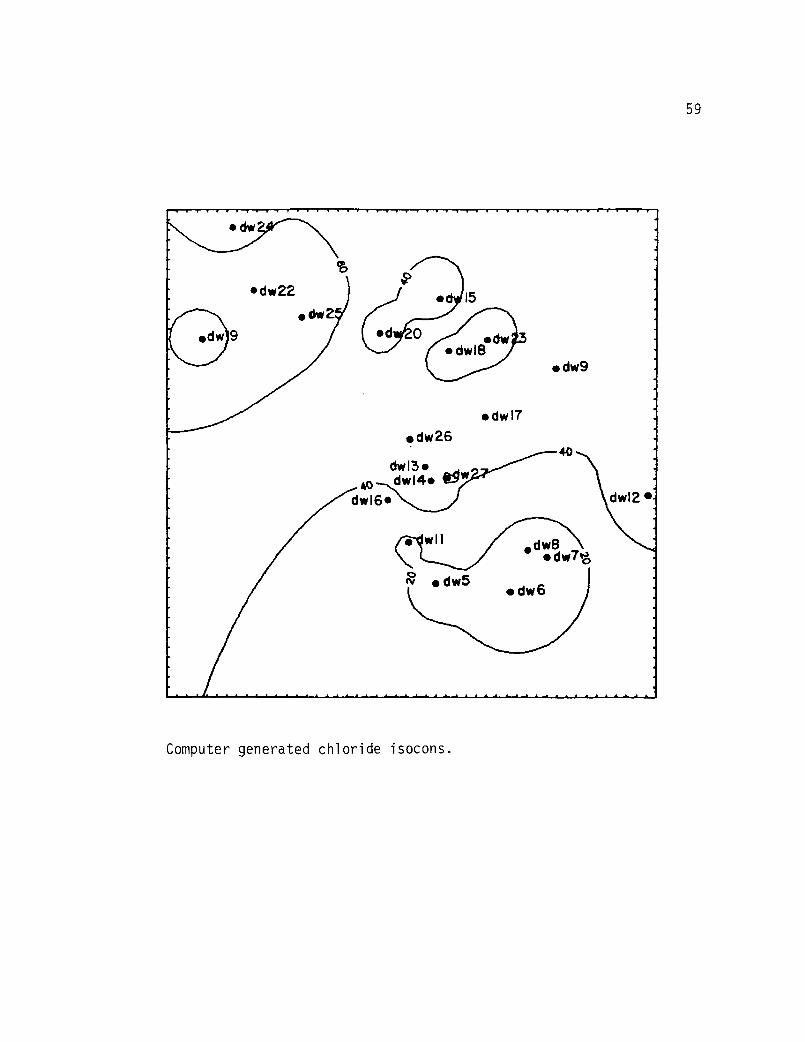
59
Computer generated chloride isocons.
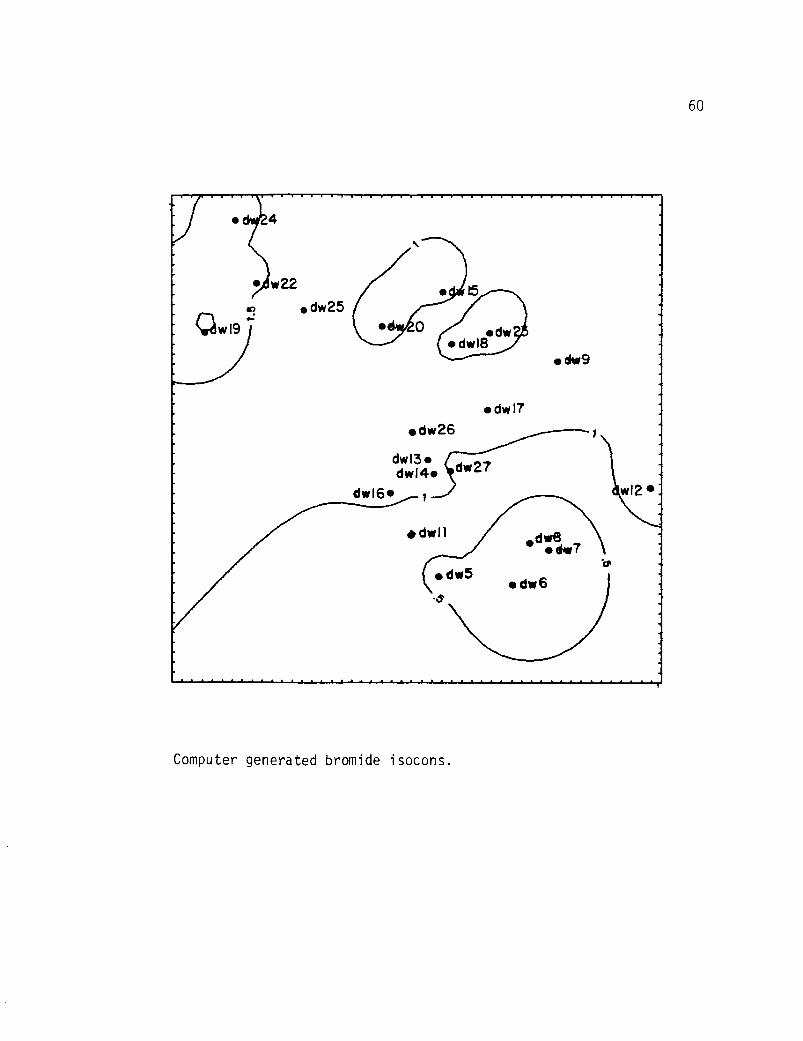
w22
e) • dw25
4(;1'wI9
• dw9
• dw17
• dw26
dw13.dw14. dw27
dw16* 1
• dwIl
• dw5
.$
dw.ei- • aiw7
• dw 6
If
60
Computer generated bromide isocons.
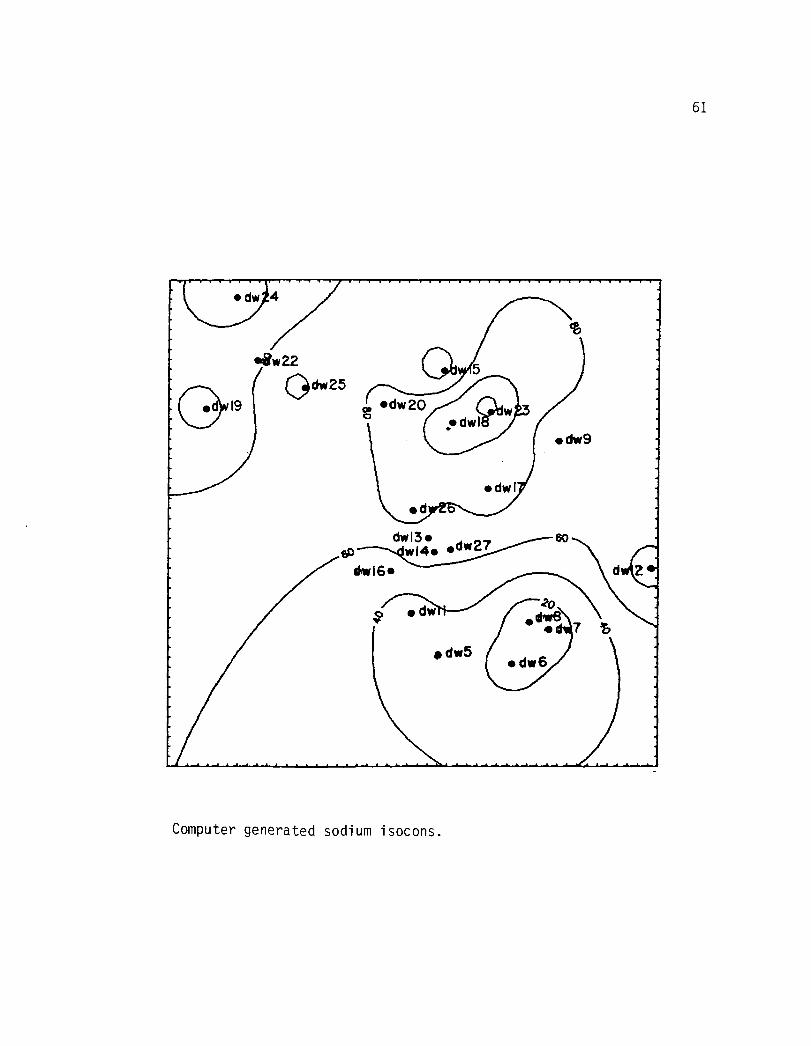
-
61
Computer generated sodium isocons.
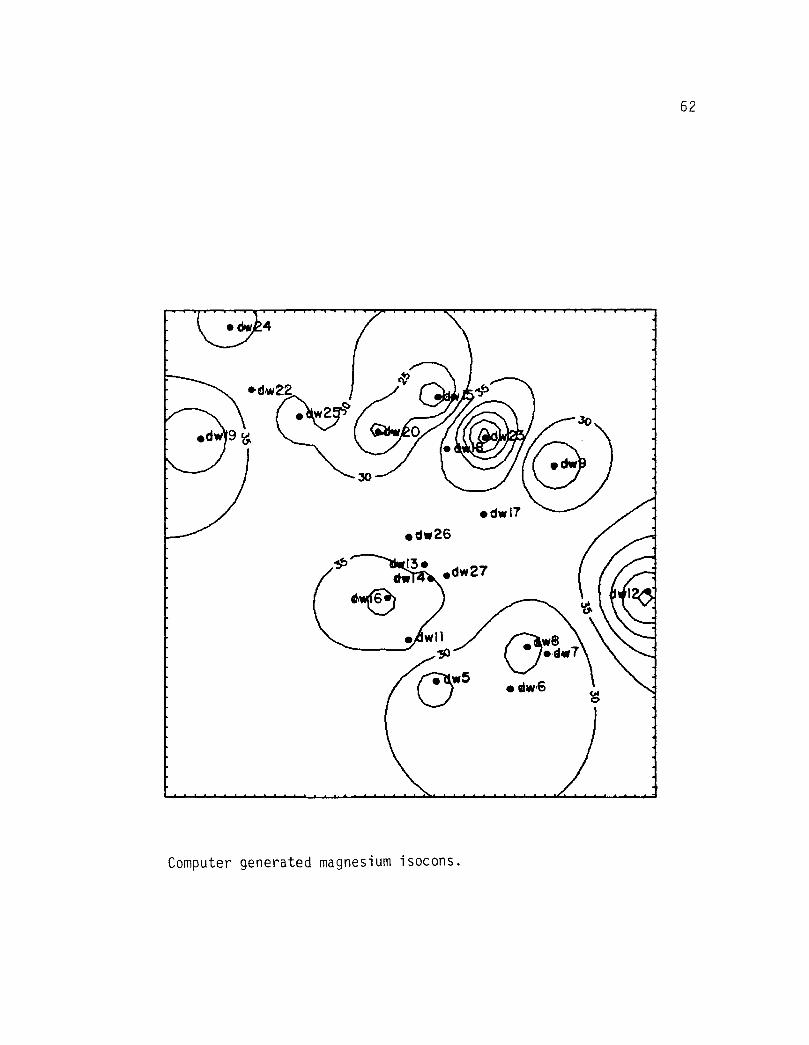
62
Computer generated magnesium isocons.
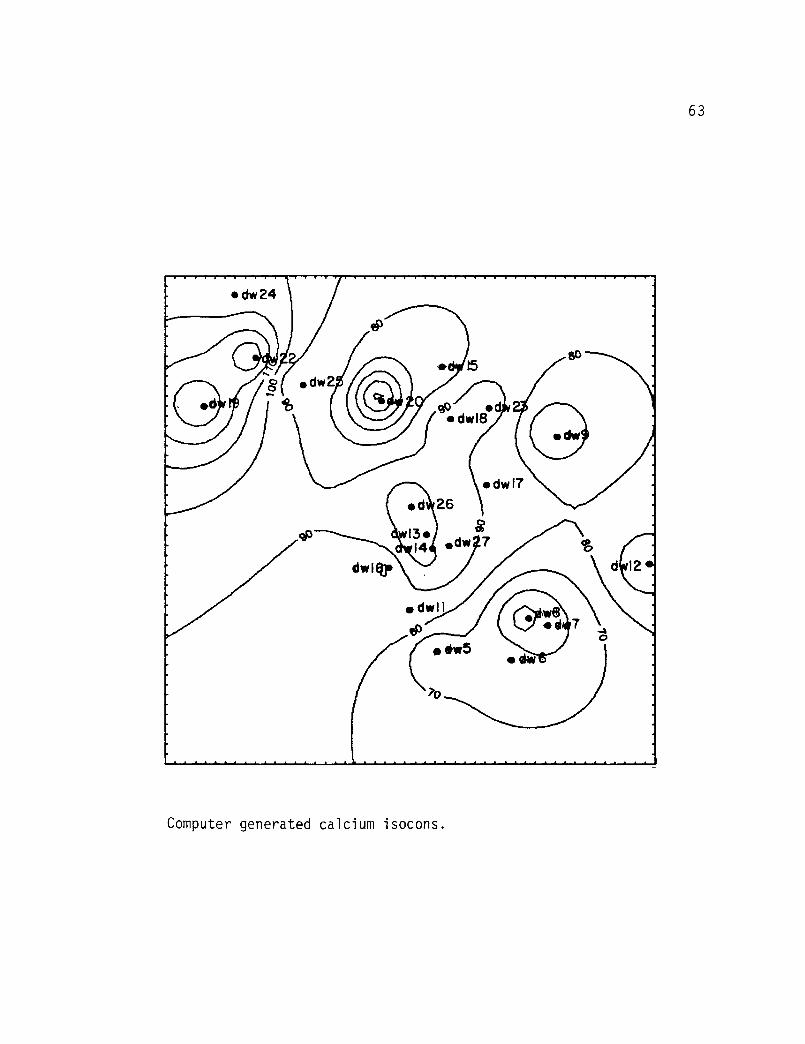
-
63
Computer generated calcium isocons.
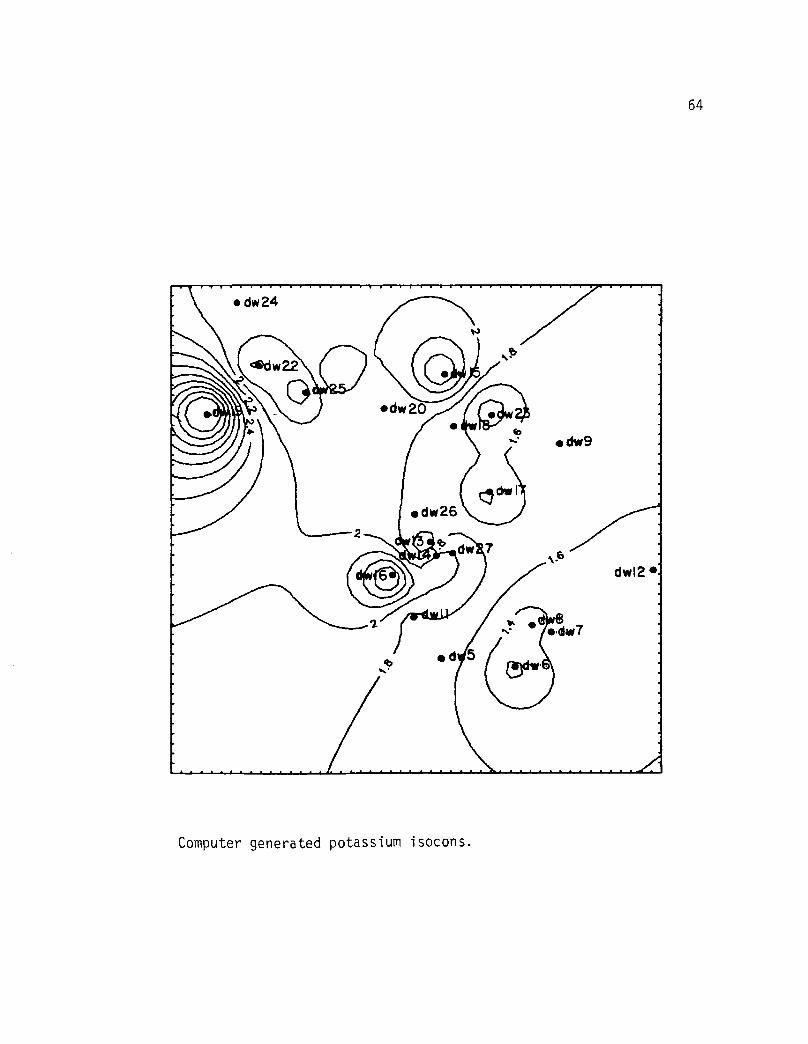
64
Computer generated potassium isocons.
REFERENCES
American Society for Testing and Materials, 1980, Standard test methodsfor chloride ion in water, D512-80: American Society for Testingand Materials, Philadelphia, PA.
Bannerjee, A. K., 1957, Geology of the Oracle Granite, Ph.D. Disserta-tion: University of Arizona, Tucson, Arizona.
Benjamin, J. R. and Cornell, C. A., 1970, Probability, Statistics, and Decision for Civil Engineers, Table A.3: McGraw Hill.
Budden, R. T., 1975, The Tortolita-Santa Catalina Mountain complex:M.S. Thesis, University of Arizona, Tucson, Arizona.
Creasy, S. C., 1967, General geology of the Mammoth quadrangle, PimaCounty, Arizona: U.S. Geol. Survey Bull. 1218, 94 p.
Davis, S. N. and DeWiest, R. J. M., 1966, Hydrogeology, Chaps. 3, 4, and11: John Wiley and Sons.
Dreyer, J. I., 1982, The Geochemistry of Natural Waters, Chaps. 5, 7,and 15: Prentice Hall.
Drewes, H. D., 1981, Tectonics of southern Arizona: U.S. Geol. Survey Professional Paper 1144.
Erickson, R. C., 1962, Petrology and structure of an exposure of thePinal Schist, Santa Catalina Mountains, Arizona: M.S. Thesis,University of Arizona, Tucson, Arizona, 71 p.
Fabryka-Martin, J., 1984, Personal communication: Dept. of Hydrologyand Water Resources, University of Arizona.
Flynn, T., 1984, Unpublished M.S. Thesis, University of Arizona, Tucson,Arizona.
Freeze, R. A. and Cherry, J. A., 1979, Groundwater, Chaps. 3 and 7:Prentice Hall, N.J.
Hawkins, C. A. and Weber, J. E., 1980, Statistical Analysis, Applica-tions to Business and Economics, Chap. 9: Harper and Row, NY.
Heindl, L. A., 1955a, Memorandum on geology and groundwater resourcesin the vicinity of Oracle, Pinal County, Arizona: Memorandum by U.S. Geol. Survey in cooperation with Arizona State Land Dept., 7 p.
65
66
Heindl, L. A., 1955b, Conditions between Oracle and Oracle Junction,Pinal County, Arizona: Supplement to Memorandum on geology andgroundwater resources in the vicinity of Oracle, Pinal County,Arizona, U.S. Geol. Survey in cooperation with Arizona State Land Dept., 7 p.
Hem, J. D., 1983, Study and interpretation of the chemical characteris-tics of natural water, 2nd ed.: U.S. Geol. Survey Water-Supply Paper 1473, 363 p.
Hillel, D., 1982, Introduction to Soil Physics, Chap 3: Academic Press,NY
Hsieh, P. A., Simpson, E. S., and Neuman, S. P., 1983, Pressure testingof fractured rocks -- a methodology employing three-dimensionalborehole tests, NUREG/CR-3213, Nuclear Regulatory Commission
Jones, J. W., Simpson, E. S., Neuman, S. P., and Keys, W. S.,Field and theoretical investigation of fractured crystallinerock near Oracle, southern Arizona, NUREG/CR-3736, NuclearRegulatory Commission, to be published in 1985.
Koglin, E. N., 1984, Bromide as an environmental tracer in ground waterof the Tucson basin, Arizona: M.S. Thesis, University of Ari-zona, Tucson, Arizona.
Loyd, J. W., Howard, K. W. F., Pacey, N. R., and Tellam, J. H., 1982,The value of iodide as a parameter in the chemical characteri-zation of groundwaters: J. Hydrol. 57, p. 247-265.
Mandel, S. and Shiftan, Z. L., 1981, Groundwater Resources, Investiga-tion and Development, Chaps. 9 and 10: Academic Press, NY.
Mohrbacher, C. J., 1984, Mountain front recharge to the Tucson basinfrom the Santa Catalina Mountains: M.S. Thesis, University ofArizona, Tucson, Arizona.
Payne, B. R., 1972, Isotope hydrology: Adv. in Hydroscience, vol. 8,p. 95-138.
Rice, G., 1984, Unpublished M.S. Thesis: University of Arizona,Tucson, Arizona.
Skougstad, M. W., Fishman, M. J., Freedman, L. C., Erdmann, D. C., andDuncan, S. S. (eds.), 1979, Methods for determination ofinorganic substances in water and fluvial sediments: U.S. Geol. Survey Techniques of Water-Resources Investigations, Book 5,Chap. Al.
67
Steel, R. G. D. and Torrie, J. H., 1980, Principles and Procedures of Statistics, A Biometrical Approach, 2nd ed., Chaps. 3, 4, and 5:McGraw Hill.
Wallace, R. M., 1955, Structures at the northern end of the Santa Cata-lina Mountains, Arizona, Ph.D. Dissertation: University ofArizona, Tucson, Arizona.
Recommended