PRESENTATION ON NIS GROUP’S RESULTS for Q1 2017
May 10th, 2017 Anton Federov Finance, Economics, Planning and Accounting Function

• Well Is-X-5 (in a recently discovered oil reservoir Idjos) tested and pre-commissioning started
• 3D data acquisition completed in South Banat I
• 3D data acquisition started at Turija III
• Gas field Ostrovo – reservoir Sm-4 (GGS/CNG) pre-commissioning started
• GGS Velika Greda South pre-commissioning started
• Drilling of well Тeremia-1000 in block Ex-7 finished
2
NIS in Q1 2017 Exploration and Production

3
NIS in Q1 2017 Refining
• Workover of Bitumen plant
• Catalyst at С-400 regenerated
• EPCm bids received in a bidding procedure for work package 2 in the Bottom of the Barrel project
• The process of implementation of OMS action plan started
• Revitalization of plant Old Claus
• New crude oil type Novy Port tested in the refining process
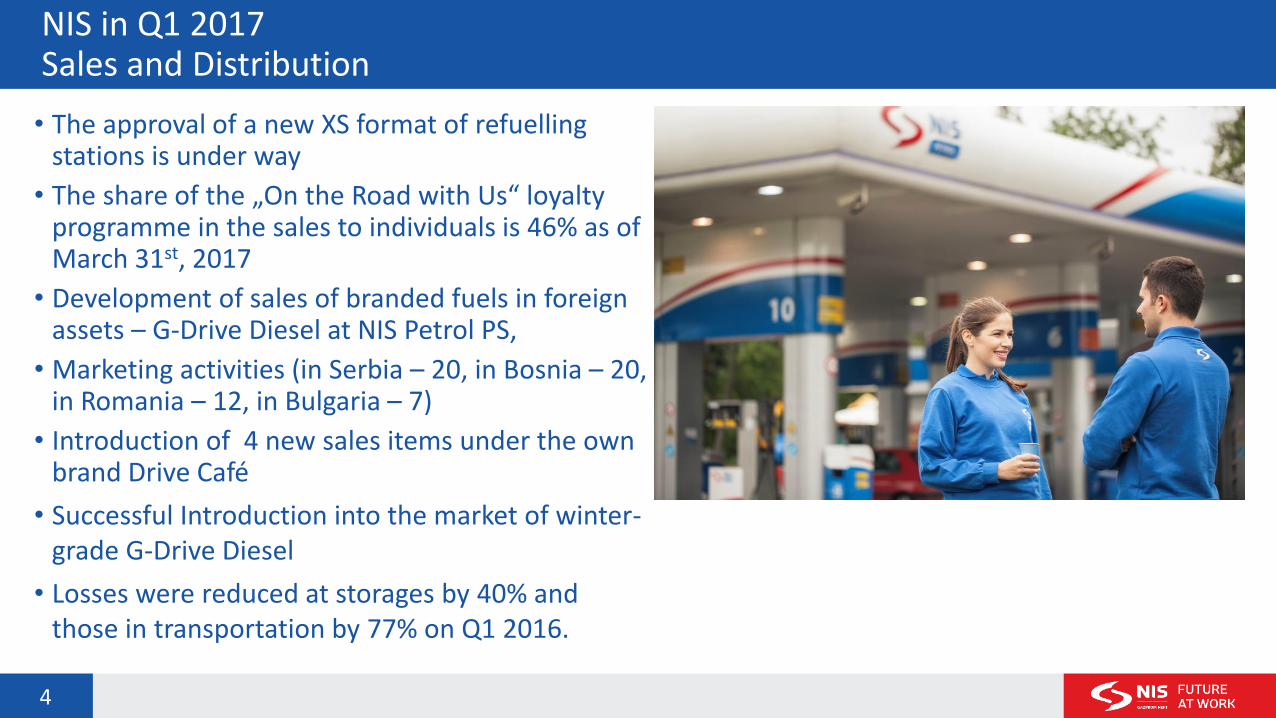
• The approval of a new XS format of refuelling stations is under way
• The share of the „On the Road with Us“ loyalty programme in the sales to individuals is 46% as of March 31st, 2017
• Development of sales of branded fuels in foreign assets – G-Drive Diesel at NIS Petrol PS,
• Marketing activities (in Serbia – 20, in Bosnia – 20, in Romania – 12, in Bulgaria – 7)
• Introduction of 4 new sales items under the own brand Drive Café
• Successful Introduction into the market of winter-grade G-Drive Diesel
• Losses were reduced at storages by 40% and those in transportation by 77% on Q1 2016.
4
NIS in Q1 2017 Sales and Distribution

• Preparation and reconciliation of EPC contract with the selected contractor and project financing contract for CHPP Pancevo is ongoing.
• Negotiations started for the construction project of small power plant Novo Milosevo by BOOT model
• With regard to the small power plant Velebit 3 the design required for obtaining a building permit completed; feasibility study prepared
• Pre-commissioning of CNG plant at reservoir Ostrovo started
• Simplified mining design (URP) and factory testing of equipment for CNG Zarkovo 2 finished
• Agreed electricity trading volume amounting to 1.78 TWh
5
NIS in Q1 2017 Energy

Exchange rate USD/RSD
+4% Price of crude oil type Urals RCMB, $/bbl
+62%
Macroeconomic indicators Stable exchange rate, higher oil price
6
20
30
40
50
60
1/3 1/19 2/6 2/22 3/10 3/28
2016
Average 2016
2017
Average 2017
105
110
115
120
1/1 1/16 1/31 2/15 3/1 3/16 3/31
2016
Average 2016
2017
Average 2017

HSE indicators Positive trend
7
Transparency increase LTIF RAR
Q1 2016 Q1 2017
13,862 15,181
206 235
20 25
4 2 Major incidents
Medium Incidents
Minor incidents
Near miss incidents
1.96
1.30 1.71
Q1 2016 Q1 2017 Plan2017
2017
Plan2017
2016
0.32 0.30 0.31
Q1 2016 Q1 2017 Plan2017
2017
Plan2017
2016
13% 3% 3%
32%

Key indicators NIS Group
8
Key indicators Unit of measurement
Q1 2017 Q1 2016 ∆
Urals $/bbl 52.2 32.2 +62%
Net profit bn RSD 5.4 0.3 +18x
EBITDA bn RSD 11.1 3.8 +3x
OCF bn RSD 4.5 3.6 +25%
Calculated commitments related to public revenue bn RSD 35.6 32.8 +8%
Oil and gas production thousand TOE 343 377 -9%
Crude oil and semi-finished products refining volume thousand tons 765 776 -1%
Total turnover of petroleum products thousand tons 717 703 +2%
CAPEX bn RSD 4.7 4.6 +1%
Total indebtedness to banks (the overall debt to banks + letters of credit)
mn USD 664 633 +5%

Trends in the motor fuel market Q1 2017/Q1 2016
9
Regional consumption of motor fuels is on the rise: - macroeconomic trends - fuel consumption growth in the transport
sector, processing industries, construction industry
Serbia
• Diesel consumption growth: — better results in the construction and processing
industries — transport growth
• Some diesel fuel consumption remains in the grey economy
Slovenia
3.1%
Croatia
1.9%
Bosnia and Herzegovina
1.3% Bulgaria
1.2%
Romania
1.4%
Hungary
2.9%
Serbia 1%
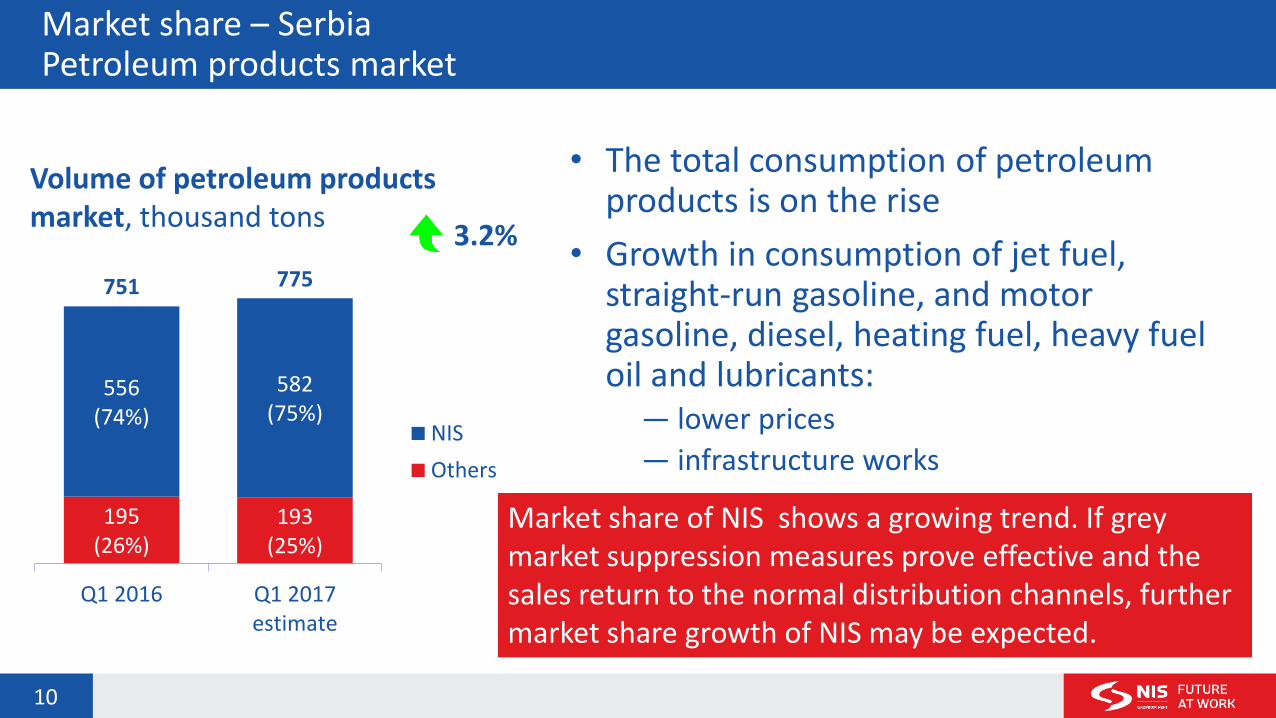
Market share – Serbia Petroleum products market
• The total consumption of petroleum products is on the rise
• Growth in consumption of jet fuel, straight-run gasoline, and motor gasoline, diesel, heating fuel, heavy fuel oil and lubricants:
— lower prices
— infrastructure works
• Lower consumption of LPG, bitumen, coke and other petroleum products
10
195 (26%)
193 (25%)
556 (74%)
582 (75%)
751 775
Q1 2016 Q1 2017estimate
NIS
Others
3.2%
Volume of petroleum products market, thousand tons
Market share of NIS shows a growing trend. If grey market suppression measures prove effective and the sales return to the normal distribution channels, further market share growth of NIS may be expected.
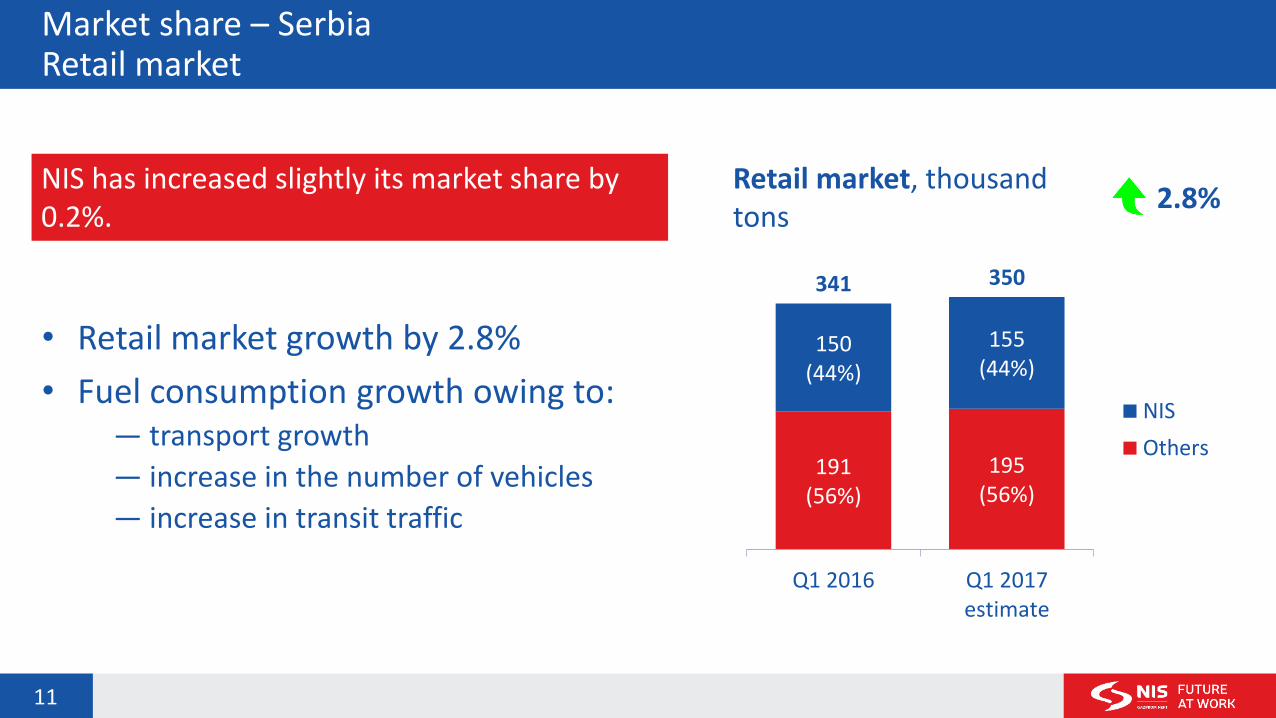
Market share – Serbia Retail market
• Retail market growth by 2.8%
• Fuel consumption growth owing to: — transport growth
— increase in the number of vehicles
— increase in transit traffic
11
191 (56%)
195 (56%)
150 (44%)
155 (44%)
341 350
Q1 2016 Q1 2017estimate
NIS
Others
2.8% Retail market, thousand tons
NIS has increased slightly its market share by 0.2%.

Market share – region Q1 2017/Q1 2016
12
Bosnia and Herzegovina
Number of PS: 35* Total market %: 11.1% Retail market %: 10.7%
Romania
Number of PS: 18 Total market %: 0.9% Retail market %: 1.5%
Bulgaria
Number of PS: 35 Total market %: 6.4% Retail market %: 4.8%
*and two petrol stations in DODO operating model

Operation indicators Exploration and Production
• Volume of oil and gas production in first quarter of 2017 was down by 9% compared with same period previous year.
13
251 227
112 105
14 11
377 343
Q1 2016 Q1 2017
Angola
Domesticgas
Domesticoil
Oil and gas production, thous. TOE -9%

Operation indicators Refining
• The volume of refining is a result of meeting the needs of the market, available stocks and optimisation of the basket of raw materials (growth in crude oil refining, reduction of additional raw material)
14
-1 %
245 224
474 491
56 51
776 765
Q1 2016 Q1 2017
Semi-FinishedProducts
Imported Crude
Domestic Crude
Refining of crude oil and semi-finished products, thousand tons
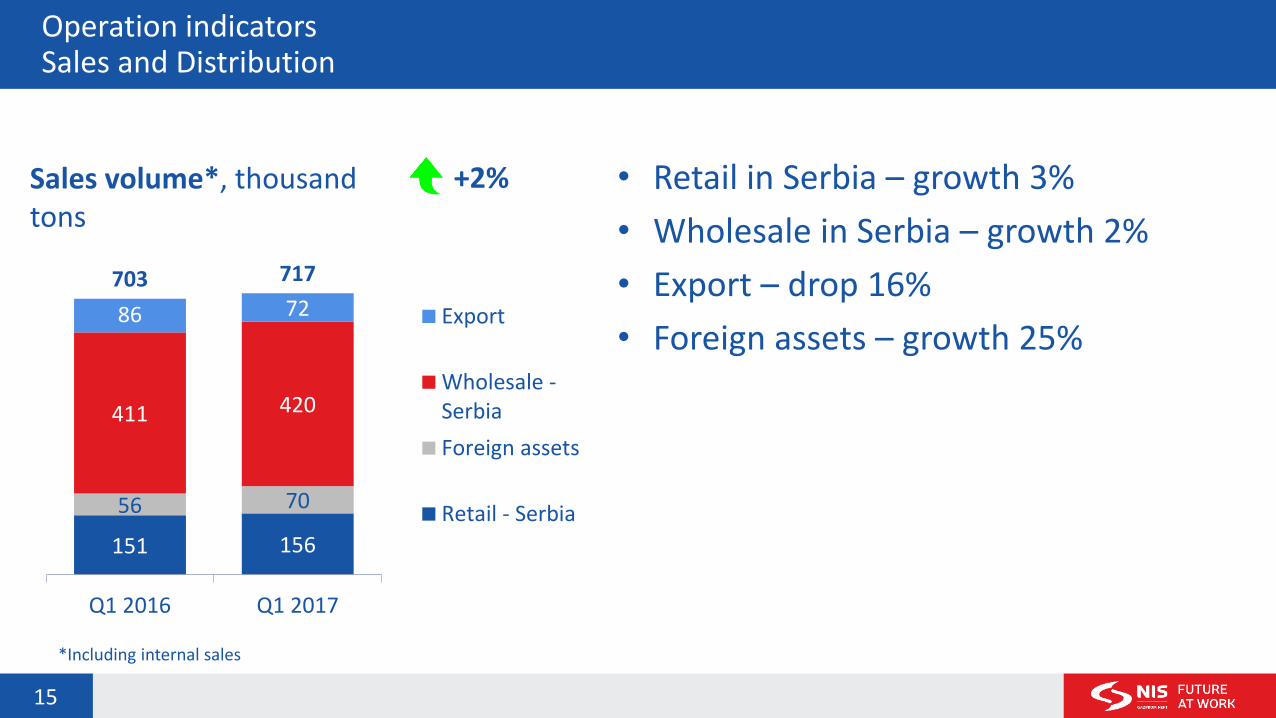
Operation indicators Sales and Distribution
• Retail in Serbia – growth 3%
• Wholesale in Serbia – growth 2%
• Export – drop 16%
• Foreign assets – growth 25%
15
151 156
56 70
411 420
86 72 703 717
Q1 2016 Q1 2017
Export
Wholesale -Serbia
Foreign assets
Retail - Serbia
+2% Sales volume*, thousand tons
*Including internal sales
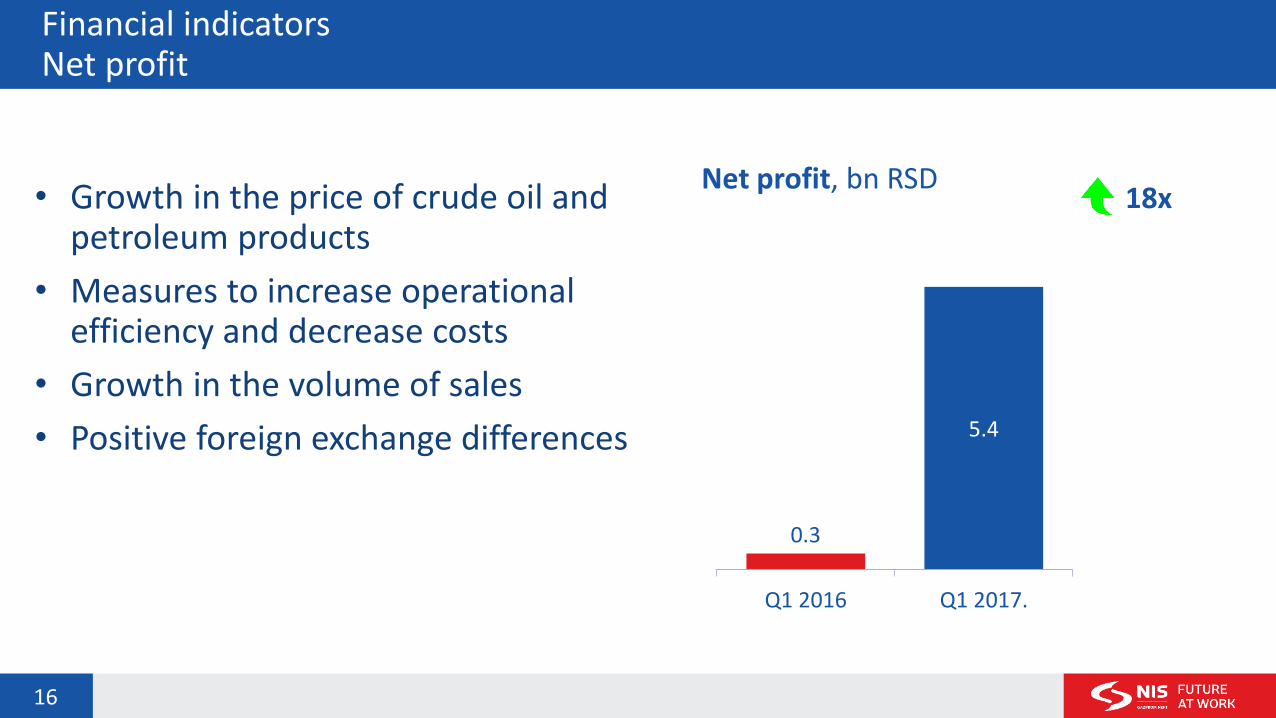
Financial indicators Net profit
• Growth in the price of crude oil and petroleum products
• Measures to increase operational efficiency and decrease costs
• Growth in the volume of sales
• Positive foreign exchange differences
16
0.3
5.4
Q1 2016 Q1 2017.
18x Net profit, bn RSD

Financial indicators EBITDA
• Growth in the price of crude oil and petroleum products
• Measures to increase operational efficiency and decrease costs
• Growth in the volume of sales
17
3.8
11.1
Q1 2016 Q1 2017
3x EBITDA, bn RSD

Financial indicators OCF
• Higher inflows — higher prices of petroleum products
— higher EBITDA
18
3.6 4.5
Q1 2016 Q1 2017
+25% OCF, bn RSD

Financial indicators CAPEX
19
4.6 4.7
Q1 2016 Q1 2017
+0.7% CAPEX, bn RSD
66% 4%
24%
4% 1% 1% Exploration andProduction
Services
Refining
Sales andDistribution
Energy
Corporate Centre
CAPEX by segment
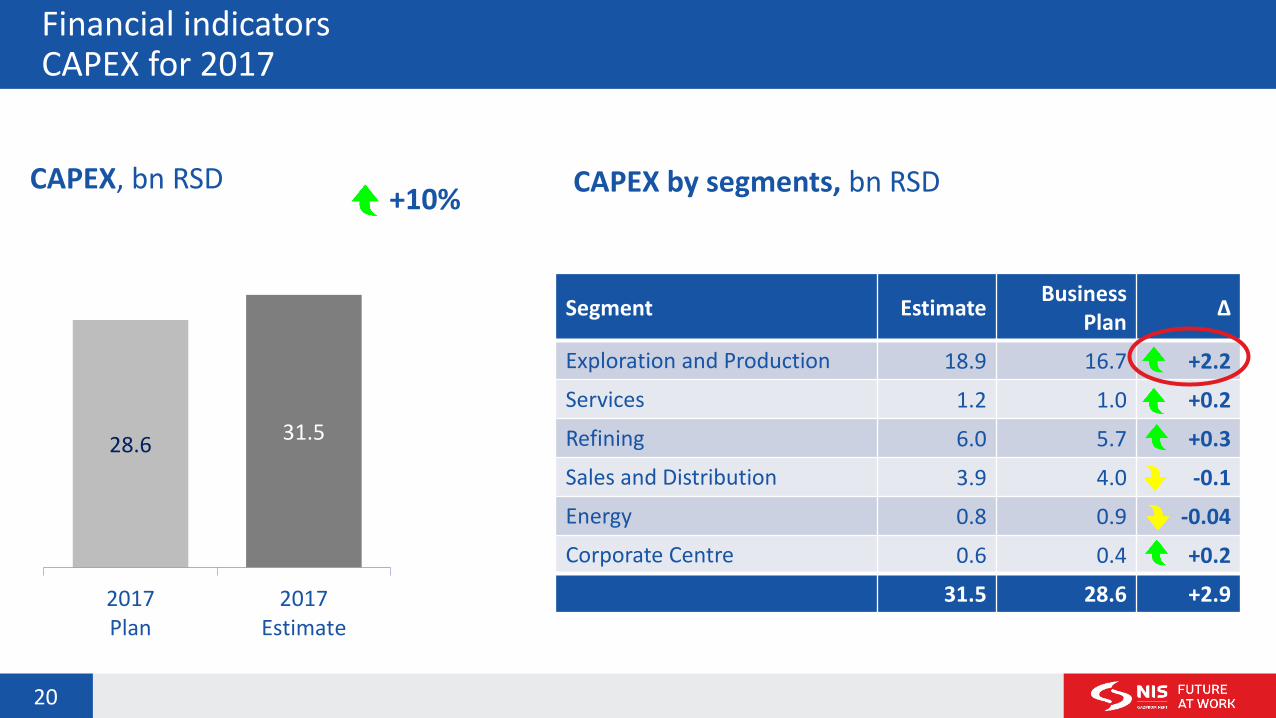
Financial indicators CAPEX for 2017
20
+10% CAPEX, bn RSD CAPEX by segments, bn RSD
28.6 31.5
2017Plan
2017Estimate
Segment Estimate Business
Plan ∆
Exploration and Production 18.9 16.7 +2.2
Services 1.2 1.0 +0.2
Refining 6.0 5.7 +0.3
Sales and Distribution 3.9 4.0 -0.1
Energy 0.8 0.9 -0.04
Corporate Centre 0.6 0.4 +0.2
31.5 28.6 +2.9
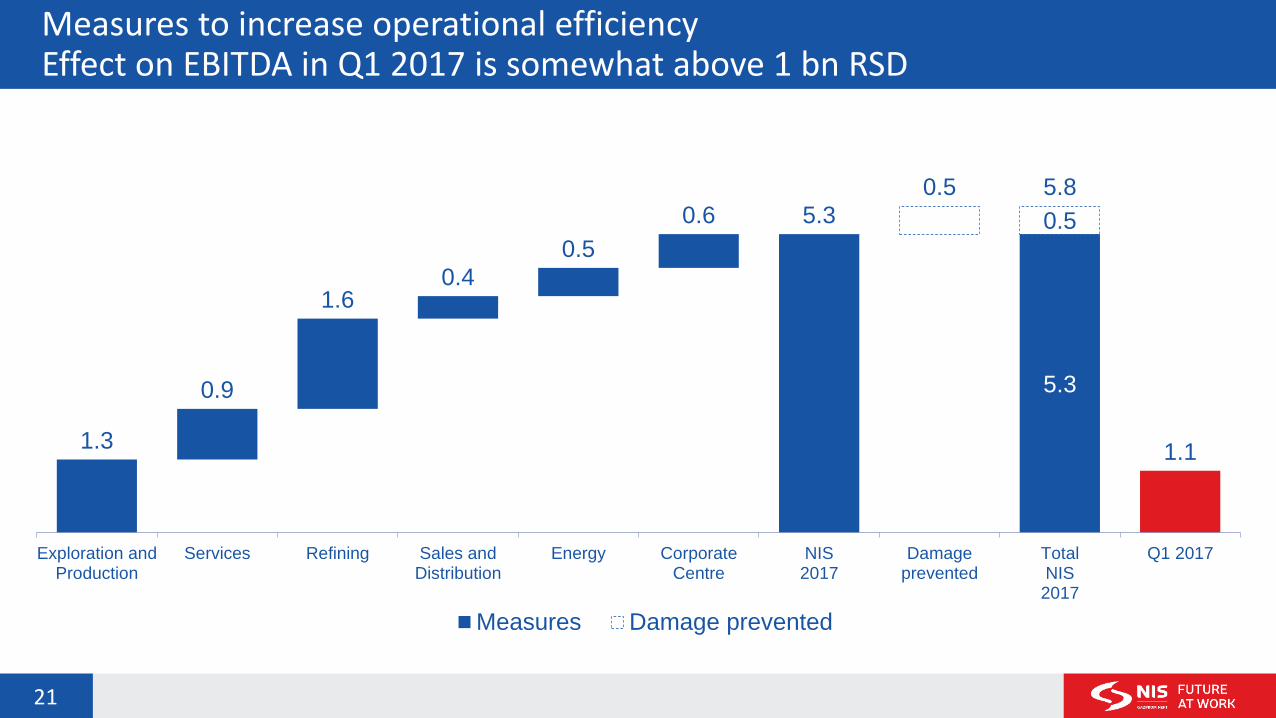
Measures to increase operational efficiency Effect on EBITDA in Q1 2017 is somewhat above 1 bn RSD
21
5.3
0.5
1.3
0.9
1.6 0.4
0.5
0.6 5.3
0.5 5.8
1.1
Exploration andProduction
Services Refining Sales andDistribution
Energy CorporateCentre
NIS2017
Damageprevented
TotalNIS2017
Q1 2017
Measures Damage prevented

OMS - elements
22
Operational risks management
Change management
Contractor and supplier management
Project management
Information, documentation, policy and standard management
Emergency preparedness management
Managing stakeholder expectations
LEADERSHIP AND CULTURE
EFFICIENCY MANAGEMENT AND CONSTANT DEVELOPMENT
Man
ag
ing
the o
rgan
izati
on
an
d c
om
pete
nces
Man
ag
ing
pro
du
cti
on
pro
cesses
Man
ag
ing
eq
uip
men
t
reli
ab
ilit
y a
nd
inte
gri
ty
THE PEOPLE USE EQUIPMENT

Bank indebtedness Structure of loan portfolio in terms of maturity and currency
23
278
275
28
47
271
91
153
186
116
516
336
418
356
184
507
511
477
543
793
611
446
403
456
598
664
662
659
12/31/'09
12/31/'10
12/31/'11
12/31/'12
12/31/'13
12/31/'14
12/31/'15
12/31/'16
3/31/'17
up to 1 year
over 1 year
-0.4%
Debt to banks, mn USD
233
33
13
14
34
28
12
3
4
793
611
446
403
455
598
664
662
659
1,026
644
458
418
489
626
675
666
664
12/31/'09
12/31/'10
12/31/'11
12/31/'12
12/31/'13
12/31/'14
12/31/'15
12/31/'16
3/31/'17
Letters of credit
Debt to banks
-0.3%
Bank indebtedness, mn USD
Debt structure: USD 51% EUR 48% Other 1%
GPN Loan -4% 291 mn EUR
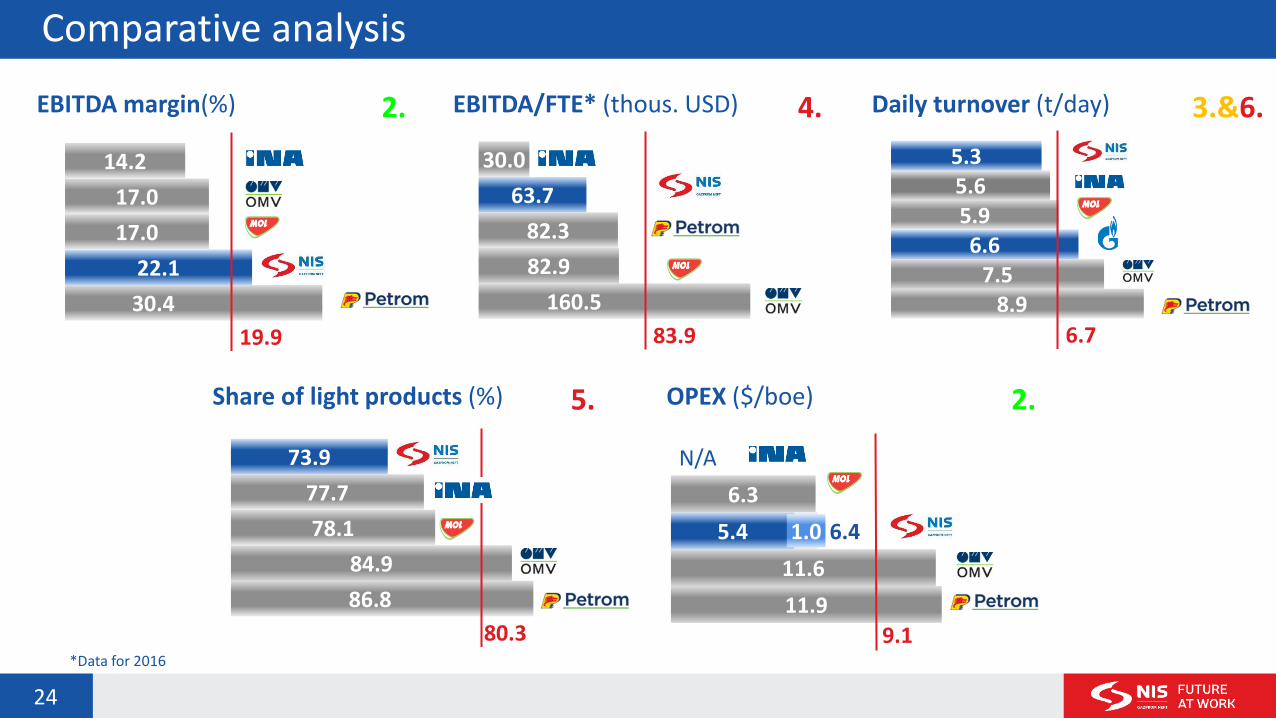
Comparative analysis
24
EBITDA margin(%) 2. EBITDA/FTE* (thous. USD) 4. Daily turnover (t/day) 3.&6.
30.4
22.1
17.0
17.0
14.2
19.9
160.5
82.9
82.3
63.7
30.0
83.9
8.9 7.5
6.6 5.9 5.6 5.3
6.7
Share of light products (%) 5. OPEX ($/boe) 2.
86.8
84.9
78.1
77.7
73.9
80.3 11.9
11.6
5.4
6.3
N/A
1.0 6.4
9.1 *Data for 2016
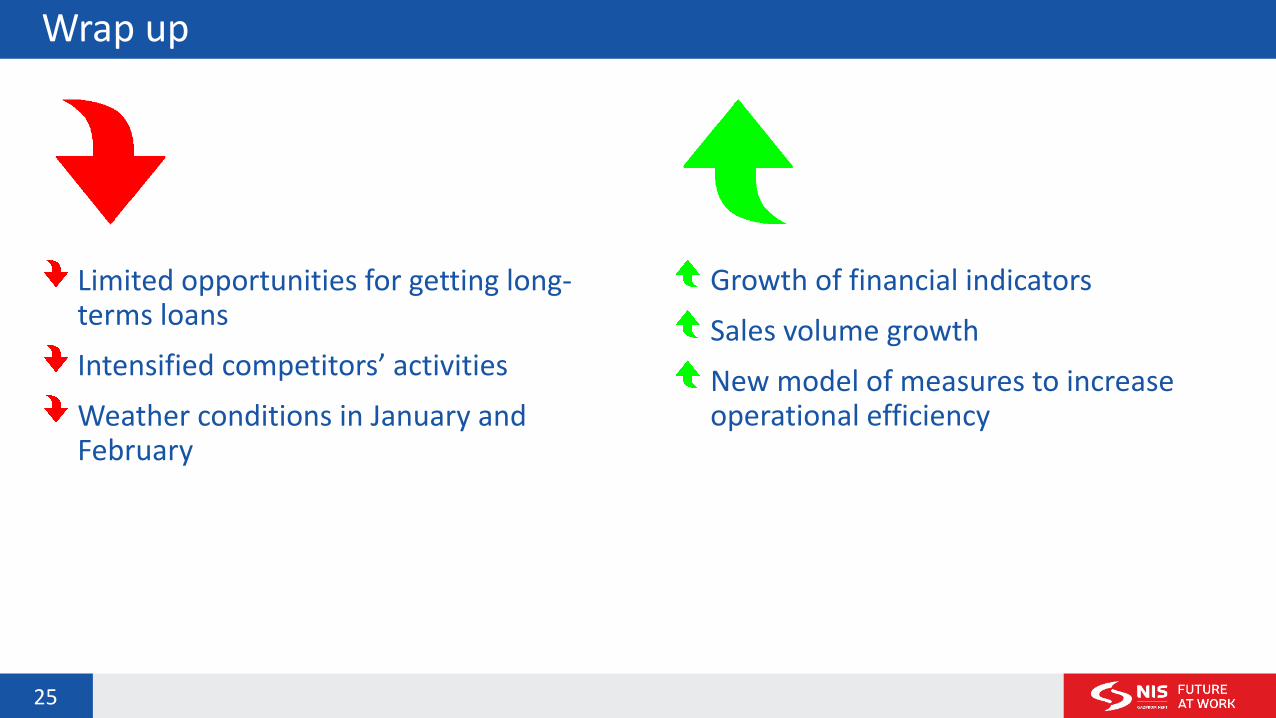
Wrap up
25
Limited opportunities for getting long-terms loans
Intensified competitors’ activities
Weather conditions in January and February
Growth of financial indicators
Sales volume growth
New model of measures to increase operational efficiency

Disclaimer
This presentation has been prepared by NIS j.s.c. Novi Sad ("Company") and consists of slides containing the information about NIS Group for the purpose of presentation to investors. This presentations does not represent any bid or invitation to bid, or any encouragement for submitting a bid for the sale or purchase or registration of shares or other securities of the Company, and furthermore, this presentation or any part of it or the fact that this presentation is made available or distributed, may not represent a basis for any contract or investment decision and for these purposes it cannot be relied on.
All visitors to this presentation who consider purchase or sale of securities are warned hereby that any purchase or sale should be performed on the basis of the information contained in other publicly available documents which should be used in accordance with the restrictions indicated in these documents. There may be no relying for any purposes whatsoever on the information contained in this presentation or any information given during its presentation, or on its completeness, accuracy or correctness. The information given in this presentation may not be treated as the provision of investment advice or recommendation. All reasonable measures have been taken to ensure the correctness of the facts given in this presentation and the correctness and fairness of considerations therein. This presentation has not been adopted by the Company bodies. Consequently, no statement or guarantee, explicit or implicit, with regard to the accuracy, completeness or correctness of the information or opinions contained or considered in this presentation is not given by or on behalf of the Company or any of its shareholders, directors, representatives, employees or any other person. Neither the Company nor any of its shareholders, directors, representatives, employees or any other persons accept any responsibility for any loss that may occur on the basis or in relation to the use of this presentation or its content or in any other way related to this presentation.
The information in this presentation contains statements on uncertain future events. The Statements on uncertain future events include the statements that are not historical facts, statements related to the intentions of the Company and NIS Group, beliefs and current expectations with regard to, inter alia, the performance results of NIS Group, financial situation and liquidity, prospects, growth, strategies and the areas of industry in which the NIS Group operates. In view of the fact that they refer to the events and depend on the circumstances which may or may not happen in the future, statements on uncertain future events by their nature imply risks and uncertainty, including but not limited to the risks and uncertainties identified by the Company and NIS Group in other publicly available documents. The Company warns that there is no guarantee that the statements on uncertain future events will happen in the future and that the actual performance results, financial situation and liquidity, as well as the development of the area of industry in which the Company and NIS Group operate may significantly differ from those presented or assumed in the statements on uncertain future events contained in this presentation. Additionally, even if the performance results of NIS group, its financial liquidity and liquidity, as well as the development of the area of industry in which the Company and NIS Group operate come to be in accordance with the statements given here on uncertain future events, such results and development are not indicative for the results and development in the coming periods. The information contained in this presentation is given on the date hereof and is subject to changes without notice.
No person has any obligation to update and keep updated the data contained herein.
By visiting this presentation you are considered to be acquiainted with the above mentioned disclaimer.
Recommended