QIBA Profile: Lung Nodule Assessment in CT Screening Profile - 2017
Page: 1
1
2
3
QIBA Profile: 4
Lung Nodule Volume Assessment and Monitoring in 5
Low Dose CT Screening 6
7
Stage: Publicly Reviewed (draft) 8
9
When referencing this document, please use the following format: CT Volumetry Technical Committee. Lung Nodule Assessment in CT Screening Profile - 2017, Quantitative Imaging Biomarkers Alliance. Publicly Reviewed Draft. QIBA.
QIBA Profile: Lung Nodule Assessment in CT Screening Profile – 2017
Page: 2
Table of Contents 10 1. Executive Summary ........................................................................................................................................ 3 11 2. Clinical Context and Claims............................................................................................................................. 4 12 3. Profile Activities .............................................................................................................................................. 8 13
3.1. Product Validation ................................................................................................................................. 10 14 3.2. Staff Qualification .................................................................................................................................. 11 15 3.3. Equipment Quality Assurance ............................................................................................................... 12 16 3.4. Protocol Design ...................................................................................................................................... 13 17 3.5. Subject Selection ................................................................................................................................... 16 18 3.6. Subject Handling .................................................................................................................................... 16 19 3.7. Image Data Acquisition .......................................................................................................................... 19 20 3.8. Image Data Reconstruction ................................................................................................................... 21 21 3.9. Image Quality Assurance ....................................................................................................................... 23 22 3.10. Image Analysis ..................................................................................................................................... 24 23
4. Assessment Procedures ................................................................................................................................ 26 24 4.1. Technical Evaluation Methods .............................................................................................................. 26 25
4.2. Equipment Vendor Assessment Procedures ............................................................................................. 29 26 4.3. Clinical Site Assessment Procedure ....................................................................................................... 33 27
References ........................................................................................................................................................ 34 28 Appendices ....................................................................................................................................................... 37 29
Appendix A: Acknowledgements and Attributions ...................................................................................... 37 30 Appendix B: Background Information .......................................................................................................... 39 31 B.1 Summary of selected references on nodule volumetry accuracy .......................................................... 39 32 B.2 Summary of selected references on nodule volumetry precision ......................................................... 39 33 Appendix C: Metrology Methods ................................................................................................................. 40 34
35
QIBA Profile: Lung Nodule Assessment in CT Screening Profile - 2017
Page: 3
1. Executive Summary 36
The goal of a QIBA Profile is to help achieve a useful level of performance for a given biomarker. 37
The Claim (Section 2) describes the biomarker performance. 38 The Profile Activities (Section 3) contribute to generating the biomarker. Requirements are placed on the 39 Actors that participate in those activities as necessary to achieve the Claim. 40 Assessment Procedures (Section 4) defines the technical methods to be used for evaluating conformance 41 with profile requirements. This includes the steps needed for clinical sites and equipment vendors to be 42 compliant with the profile. 43
This QIBA Profile (Lung Nodule Volume Assessment and Monitoring in Low Dose CT Screening) addresses 44 the accuracy and precision of quantitative CT volumetry as applied to solid lung nodules of 6-12 mm 45 diameter. It places requirements on Acquisition Devices, Technologists, Radiologists and Image Analysis 46 Tools involved in activities including Periodic Equipment Quality Assurance, Subject Selection, Subject 47 Handling, Image Data Acquisition, Image Data Reconstruction, Image Quality Assurance, and Image 48 Analysis. 49
The requirements are focused on achieving sufficient accuracy and avoiding unnecessary variability of the 50 lung nodule volume measurement. 51
Two sets of claims are provided within this profile. The first claim establishes 95% confidence intervals for 52 volumetric measurement of solid lung nodules that fall within four different diameter and volume size 53 ranges. The second claim provides guidance on the amount of volumetric change percentage needed for a 54 nodule to start to exhibit true change with 95% confidence. In addition, the second claim also provides 55 guidance on the 95% confidence interval for a volumetric size change measurement, again based on the 56 size of the nodule at two time points. 57
This document is intended to help clinicians basing decisions on this biomarker, imaging staff generating 58 this biomarker, vendor staff developing related products, purchasers of such products and investigators 59 designing trials with imaging endpoints. 60
Note that this Profile document only states requirements to achieve the claim, not “requirements on 61 standard of care.” Further, meeting the goals of this Profile is secondary to properly caring for the patient. 62
QIBA Profiles addressing other imaging biomarkers using CT, MRI, PET and Ultrasound can be found at 63 qibawiki.rsna.org. 64
65
QIBA Profile: Lung Nodule Assessment in CT Screening Profile – 2017
Page: 4
2. Clinical Context and Claims 66
67 Clinical Context 68
The clinical context of this profile is the quantification of volumes and volume changes over time of solid 69 lung nodules with a longest diameter between 6 mm and 12 mm. Nodules with diameter ≥ 12 mm (volume 70 ≥ 905 mm3) are the subject of the document “QIBA Profile: CT Tumor Volume Change (CTV-1)”. 71
Conformance with this Profile by all relevant staff and equipment supports the following claims 72
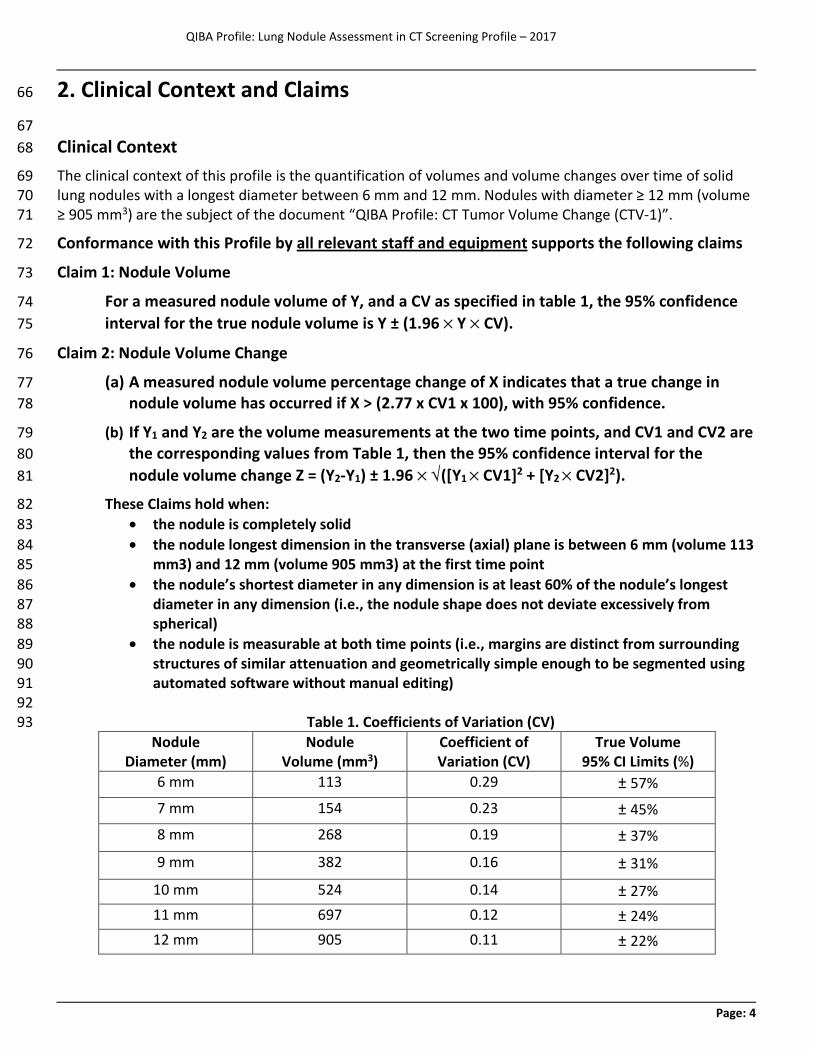
Claim 1: Nodule Volume 73
For a measured nodule volume of Y, and a CV as specified in table 1, the 95% confidence 74 interval for the true nodule volume is Y ± (1.96 ´ Y ´ CV). 75
Claim 2: Nodule Volume Change 76
(a) A measured nodule volume percentage change of X indicates that a true change in 77 nodule volume has occurred if X > (2.77 x CV1 x 100), with 95% confidence. 78
(b) If Y1 and Y2 are the volume measurements at the two time points, and CV1 and CV2 are 79 the corresponding values from Table 1, then the 95% confidence interval for the 80 nodule volume change Z = (Y2-Y1) ± 1.96 ´ Ö([Y1 ´ CV1]2 + [Y2 ´ CV2]2). 81
These Claims hold when: 82 · the nodule is completely solid 83 · the nodule longest dimension in the transverse (axial) plane is between 6 mm (volume 113 84
mm3) and 12 mm (volume 905 mm3) at the first time point 85 · the nodule’s shortest diameter in any dimension is at least 60% of the nodule’s longest 86
diameter in any dimension (i.e., the nodule shape does not deviate excessively from 87 spherical) 88
· the nodule is measurable at both time points (i.e., margins are distinct from surrounding 89 structures of similar attenuation and geometrically simple enough to be segmented using 90 automated software without manual editing) 91 92
Table 1. Coefficients of Variation (CV) 93 Nodule
Diameter (mm) Nodule
Volume (mm3) Coefficient of Variation (CV)
True Volume 95% CI Limits (%)
6 mm 113 0.29 ± 57% 7 mm 154 0.23 ± 45% 8 mm 268 0.19 ± 37%
9 mm 382 0.16 ± 31% 10 mm 524 0.14 ± 27% 11 mm 697 0.12 ± 24% 12 mm 905 0.11 ± 22%
QIBA Profile: Lung Nodule Assessment in CT Screening Profile - 2017
Page: 5
Discussion 94
Low dose CT provides an effective means of detecting and monitoring pulmonary nodules, and can lead to 95 increased survival (1) and reduced mortality (2) in individuals at high risk for lung cancer. Size quantification 96 on serial imaging is helpful in evaluating whether a pulmonary nodule is benign or malignant. Currently, 97 pulmonary nodule measurements most commonly are obtained as the average of two perpendicular 98 dimensions on axial slices. Investigators have suggested that automated quantification of whole nodule 99 volume could solve some of the limitations of manual diameter measurements (3-9), and many studies 100 have explored the accuracy in phantoms (10-18) and the in vivo precision (19-25) of volumetric CT 101 methods. This document proposes standardized methods for performing repeatable volume measurements 102 on CT images of solid pulmonary nodules obtained using a reduced radiation dose in the setting of lung 103 cancer screening and nodule follow-up in the interval between scans (52). 104
Lung cancer CT screening presents the challenge of developing a protocol that balances the benefit of 105 detecting and accurately characterizing lung nodules against the potential risk of radiation exposure in this 106 asymptomatic population of persons who may undergo annual screening for more than two decades. Our 107 understanding of the extent to which performing scans at the lowest dose possible with the associated 108 increase in noise impacts our ability to accurately measure these small nodules is still evolving. Therefore, 109 any protocol will involve a compromise between these competing needs. 110
This QIBA Profile makes Claims about the confidence with which lung nodule volume and changes in lung 111 nodule volume can be measured under a set of defined image acquisition, processing, and analysis 112 conditions, and provides specifications that may be adopted by users and equipment developers to meet 113 targeted levels of clinical performance in identified settings. The intended audiences of this document 114 include healthcare professionals and all other stakeholders invested in lung cancer screening, including but 115 not limited to: 116
· Radiologists, technologists, and physicists designing protocols for CT screening 117 · Radiologists, technologists, physicists, and administrators at healthcare institutions considering 118
specifications for procuring new CT equipment 119 · Technical staff of software and device manufacturers who create products for this purpose 120 · Biopharmaceutical companies 121 · Clinicians engaged in screening process 122 · Clinical trialists 123 · Radiologists and other health care providers making quantitative measurements on CT images 124 · Oncologists, regulators, professional societies, and others making decisions based on quantitative 125
image measurements 126 · Radiologists, health care providers, administrators and government officials developing and 127
implementing policies for lung cancer screening 128
Note that specifications stated as “requirements” in this document are only requirements to achieve the 129 Claim, not “requirements on standard of care.” Specifically, meeting the goals of this Profile is secondary to 130 properly caring for the patient. 131
This Profile is relevant to asymptomatic persons participating in a CT screening and surveillance program 132 for lung cancer. In theory, the activities covered in this Profile also pertain to patients with known or 133 incidentally-detected solid pulmonary nodules in the 6-12 mm diameter range, though surveillance in this 134 or other settings is not specifically addressed by this Profile. 135
QIBA Profile: Lung Nodule Assessment in CT Screening Profile – 2017
Page: 6
136 Clinical Interpretation For Claim 1 (nodule volume) 137
The true size of a nodule is defined by the measured volume and the 95% confidence intervals. The 138 confidence intervals can be thought of as “error bars” or “uncertainty” or “noise” around the 139 measurement, and the true volume of the nodule is somewhere within the confidence intervals. 140 Application of these Claims to clinical practice is illustrated by the following examples: 141
Example 1: A nodule is measured as having a volume of 150 mm3 (6.6 mm diameter). There is a 95% 142 probability that the true volume of the nodule is between 65 mm3 [150 – (150 x 1.96 x 0.29)] (5.0 mm 143 diameter) and 235 mm3 [150 + (150 x 1.96 x 0.29)] (7.7 mm diameter). 144
Example 2: A nodule is measured as having a volume of 500 mm3 (9.8 mm diameter). There is a 95% 145 probability that the true volume of the nodule is between 343 mm3 [500 - (500 x 1.96 x 0.16)] (8.7 mm 146 diameter) and 657 mm3 [500 + (500 x 1.96 x 0.16)] (10.8 mm diameter). 147
Example 3: A nodule is measured as having a volume of 800 mm3 (11.5 mm diameter). There is a 95% 148 probability that the true volume of the nodule is between 612 mm3 [800 - (800 x 1.96 x 0.12)] (10.5 mm 149 diameter) and 988 mm3 [800 + (800 x 1.96 x 0.12)] (12.4 mm diameter). 150
If the activities specified in this Profile are followed, the measured volume of nodules in each of the given 151 size ranges can be considered accurate to within the given 95% confidence limits. The different coefficients 152 of variation of the different nodule size ranges in Claim 1 reflect the increasing variability introduced as the 153 resolution limits of the measuring device are approached, and the likely impact of variations permitted by 154 the Specifications of this Profile. 155
The guidance provided here represents an estimate of minimum measurement error when conforming to 156 the Profile over a wide range of scanner models. However, these estimates can be reduced substantially 157 when using more advanced scanning equipment with improved performance characteristics. 158 159 These Claims have been informed by clinical trial data, theoretical analysis, simulations, review of the 160 literature, and expert consensus. They have not yet been fully substantiated by studies that strictly conform 161 to the specifications given here. The expectation is that during implementation in the clinical setting, data 162 on the actual performance will be collected and any appropriate changes made to the Claim or the details 163 of the Profile. At that point, this caveat may be removed or re-stated. 164
Clinical Interpretation For Claim 2 (nodule volume change) 165
The precision value in the Claim statement is the change necessary to be 95% certain that there has really 166 been a change. If a tumor changes size beyond these limits, you can be 95% confident there has been a true 167 change in the size of the tumor, and the perceived change is not just measurement variability. Note that 168 this does not address the biological significance of the change, just the likelihood that the measured change 169 is real. 170
Application of these Claims to clinical practice is illustrated by the following examples: 171
QIBA Profile: Lung Nodule Assessment in CT Screening Profile - 2017
Page: 7
Example 1: A nodule measuring 524 mm3 at baseline (10.0 mm diameter) measures 917 mm3 (12.0 mm 172 diameter) at follow-up, for a measured volume change of +393 mm3 (or a 75% increase in volume) [i.e. 173 (917-524)/524 x 100 = 75%]. For this 10 mm nodule at baseline, we apply the CV from the fifth row of Table 174 1: since 75% > 39% [i.e. 75% > 2.77 x 0.14 x 100], we are 95% confident that the measured change 175 represents a real change in nodule volume. To quantify the magnitude of the change, we construct the 176 95% confidence for the true change. The 95% confidence interval for the true change is (917-524) + 1.96 x Ö 177 ([0.14 x 524]2 + [0.11 x 917]2), which equals 393 ± 244. The 95% CI for the change in volume is thus [149 178 mm3 – 637 mm3]. This means that the nodule at time point 2 is between 149 and 637 mm3 larger than at 179 baseline. 180
Example 2: A nodule measuring 180 mm3 at baseline (7.0 mm diameter) measures 270 mm3 (8.0 mm 181 diameter) at follow-up, for a measured volume change of 90 mm3, or +50% [i.e. (270-180)/180 x 100 = 182 50%]. Since this was a 7 mm nodule at baseline, we apply the CV from the first row of the table: since 50% < 183 80% [i.e. 50% < 2.77 x 0.23 x 100]; we cannot be confident that this measured change represents a real 184 change in the tumor volume. 185 186 If the activities specified in this Profile are followed, the measured change in volume of nodules in each of 187 the given size ranges can be considered accurate to within the given 95% confidence limits. The different 188 coefficients of variation of the different nodule size ranges in Claim 1 reflect the increasing variability 189 introduced as the resolution limits of the measuring device are approached, and the likely impact of 190 variations permitted by the Specifications of this Profile. 191 192 These Claims represent the repeatability coefficient (RC = 1.96 ´ √2 × 𝑤𝑤𝑤𝑤𝑤𝑤) for nodules in each size range. 193 The Claims have been informed by clinical trial data, theoretical analysis, simulations, review of the 194 literature, and expert consensus. They have not yet been fully substantiated by studies that strictly conform 195 to the specifications given here. The expectation is that during implementation in the clinical setting, data 196 on the actual performance will be collected and any appropriate changes made to the Claim or the details 197 of the Profile. At that point, this caveat may be removed or re-stated. 198 199 Claim 2 assumes the same compliant actors (acquisition device, radiologist, image analysis tool, etc.) at the 200 two time points. If one or more of the actors are different, it is expected that the measurement 201 performance will be reduced. 202
A web based calculator for computing the equations in the Claims is available at 203 http://www.accumetra.com/NoduleCalculator.html. 204
205
QIBA Profile: Lung Nodule Assessment in CT Screening Profile – 2017
Page: 8
3. Profile Activities 206
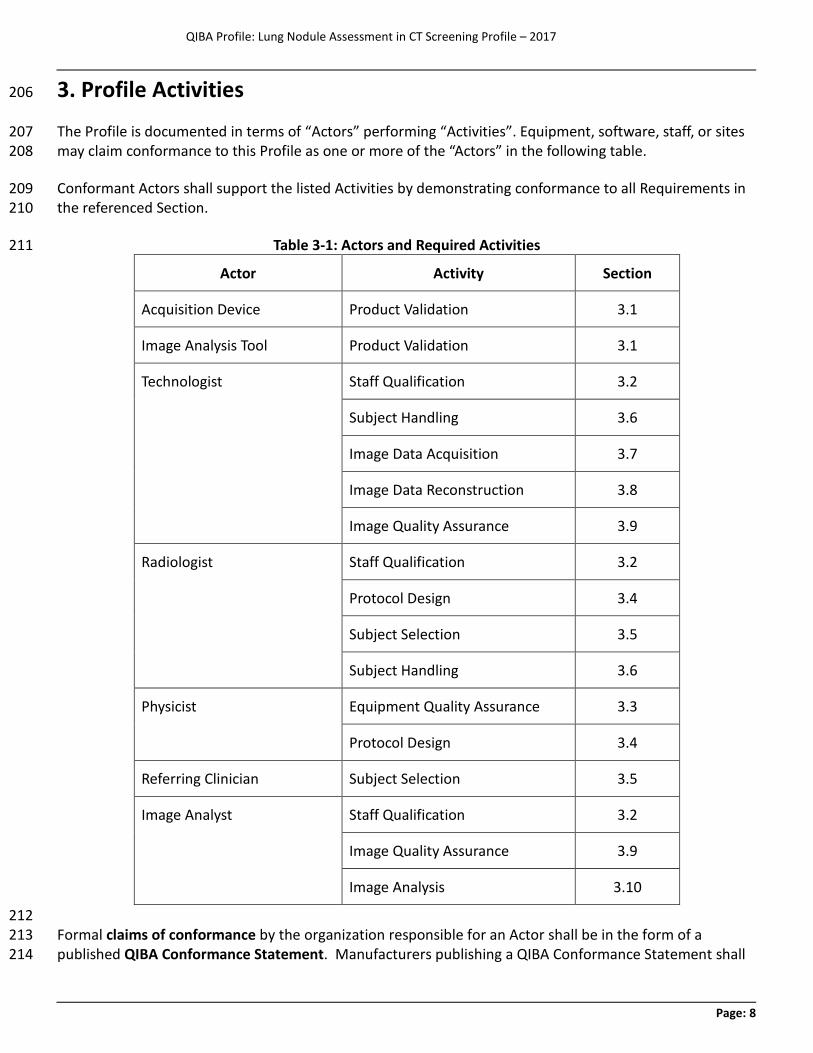
The Profile is documented in terms of “Actors” performing “Activities”. Equipment, software, staff, or sites 207 may claim conformance to this Profile as one or more of the “Actors” in the following table. 208
Conformant Actors shall support the listed Activities by demonstrating conformance to all Requirements in 209 the referenced Section. 210
Table 3-1: Actors and Required Activities 211
Actor Activity Section
Acquisition Device Product Validation 3.1
Image Analysis Tool Product Validation 3.1
Technologist Staff Qualification 3.2
Subject Handling 3.6
Image Data Acquisition 3.7
Image Data Reconstruction 3.8
Image Quality Assurance 3.9
Radiologist
Staff Qualification 3.2
Protocol Design 3.4
Subject Selection 3.5
Subject Handling 3.6
Physicist Equipment Quality Assurance 3.3
Protocol Design 3.4
Referring Clinician Subject Selection 3.5
Image Analyst Staff Qualification 3.2
Image Quality Assurance 3.9
Image Analysis 3.10
212 Formal claims of conformance by the organization responsible for an Actor shall be in the form of a 213 published QIBA Conformance Statement. Manufacturers publishing a QIBA Conformance Statement shall 214
QIBA Profile: Lung Nodule Assessment in CT Screening Profile - 2017
Page: 9
provide a set of “Model-specific Parameters” describing how their product was configured to achieve 215 conformance. 216
The Specifications and Assessment Procedures described in Sections 3 & 4 of this Profile reflect those 217 expected in standard clinical CT practice, including the settings in which the data that support the Claims of 218 this Profile were acquired. There is potential to specify more rigorous assessment procedures for both CT 219 equipment and analysis tool software that justify a reduction in the measurement variance found in the 220 current Claims. Through continued investigation of technical sources of variance, and quantitative 221 characterization of the improvements in accuracy and precision that can be achieved by further refining the 222 Specifications of this Profile, it is anticipated that future versions of this Profile will contain both improved 223 Claims and more specific Assessment Procedures relevant to quantitative imaging. 224
The requirements in this Profile do not codify a Standard of Care; they only provide guidance intended to 225 achieve the stated Claims. Failing to comply with a “shall” in this Profile is a protocol deviation. Although 226 deviations invalidate the Profile Claims, such deviations may be reasonable and unavoidable and the 227 radiologist or supervising physician is expected to do so when required by the best interest of the patient or 228 research subject. How study sponsors and others decide to handle deviations for their own purposes is 229 entirely up to them. 230
For the Acquisition Device and Image Analysis Tool actors, while it will typically be the manufacturer who 231 claims the actor is conformant, it is certainly possible for a site to run the necessary tests/checks to confirm 232 conformance and make a corresponding claim. This might happen if a manufacturer is no longer promoting 233 an older model device but a site needs a conformance statement to participate in a clinical trial. 234
The Physicist actor is the preferred person at the site responsible for managing the equipment performance 235 related specifications. At some sites this will be a staff physicist, and at other sites it may be a person who 236 manages a contractor or a service provided by a vendor. 237
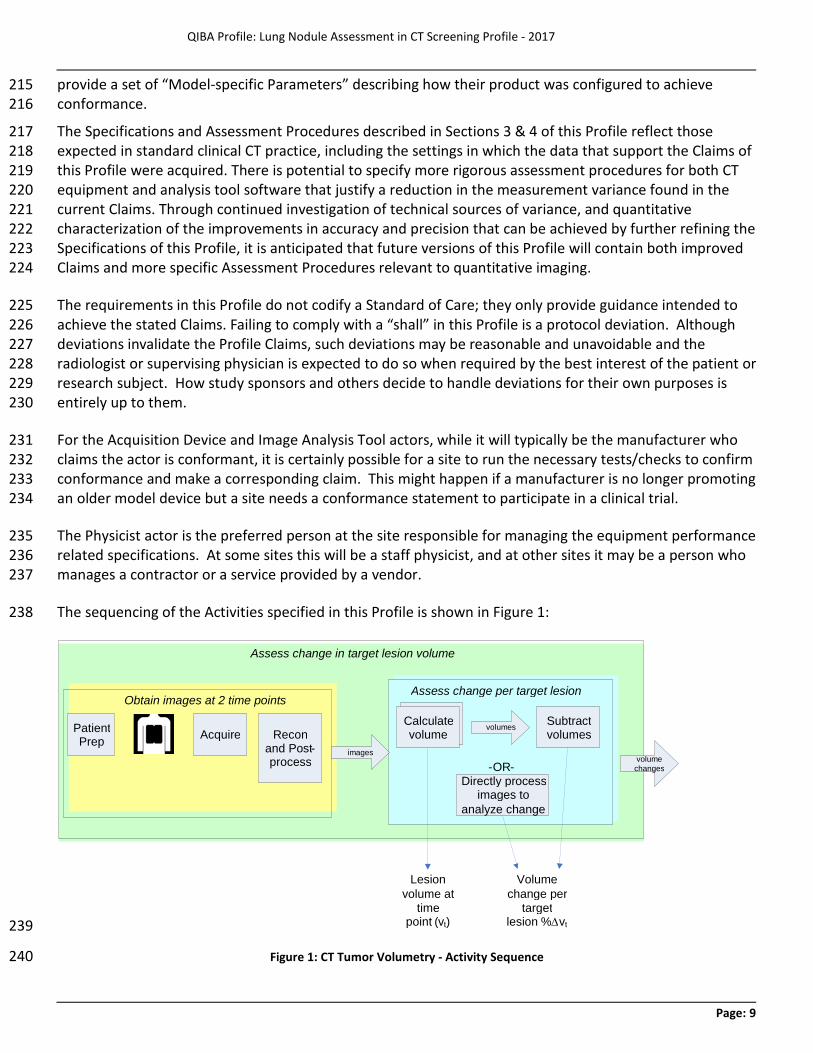
The sequencing of the Activities specified in this Profile is shown in Figure 1: 238
239
Figure 1: CT Tumor Volumetry - Activity Sequence 240
Acquire Subtract volumes Patient
Prep Recon and Post - process
Directly process images to
analyze change
Obtain images at 2 time points
images
Assess change per target lesion
- OR -
Assess change in target lesion volume
Volume change per
target lesion % ∆ v t
Lesion volume at
time point ( v t )
Calculate volume Calculate
volume volume
changes
volumes
QIBA Profile: Lung Nodule Assessment in CT Screening Profile – 2017
Page: 10
The method for measuring change in tumor volume may be described as a multistage process. Subjects are 241 prepared for scanning, raw image data is acquired and images are reconstructed and possibly post-242 processed. Such images are obtained at one or more time points. Image analysis assesses the degree of 243 change between two time points for each evaluable target nodule by calculating absolute volume at each 244 time point and subtracting. When expressed as a percentage, volume change is the difference in volume 245 between the two time points divided by the volume at time point 1. Although this introduces some 246 asymmetry (volume measurements of 50cm3 and 100cm3 represent either a 100% increase or a 50% 247 decrease depending on which was measured first), it is more familiar to clinicians than using the average of 248 the two time points as the denominator. 249
The change may be interpreted according to a variety of different response criteria. These response criteria 250 are beyond the scope of this document. Detection and classification of nodules are also beyond the scope 251 of this document. 252
The Profile does not intend to discourage innovation, although it strives to ensure that methods permitted 253 by the profile requirements will result in performance that meets the Profile Claim. The above pipeline 254 provides a reference model. Algorithms which achieve the same result as the reference model but use 255 different methods may be permitted, for example by directly measuring the change between two image 256 sets rather than measuring the absolute volumes separately. Developers of such algorithms are 257 encouraged to work with the appropriate QIBA committee to conduct any groundwork and assessment 258 procedure revisions needed to demonstrate the requisite performance. 259
The requirements included herein are intended to establish a baseline level of capabilities. Providing higher 260 performance or advanced capabilities is both allowed and encouraged. The Profile does not intend to limit 261 how equipment suppliers meet these requirements. 262
3.1. Product Validation 263
This activity involves evaluating the product Actors (Acquisition Device and Image Analysis Tool) prior to 264 their use in the Profile (e.g. at the factory). It includes validations and performance assessments that are 265 necessary to reliably meet the Profile Claim. 266
3.1.1 Discussion 267 Performance measurements of specific protocols are not addressed here. Those are included in section 268 3.4.2. 269
The Number of Detector Rows can influence the scan duration, z-axis resolution, and radiation dose. A 270 primary consideration leading to the requirement that CT scanners have a minimum of 16 detector rows is 271 the desire for the Scan Duration to be no greater than the time for imaging the entire length of the lungs in 272 a single breath-hold, to minimize motion artifacts, at a pitch that provides adequate z-axis resolution. 273 Scanners with fewer than 16 detectors and pitch high enough to allow the entire lung to be scanned in a 274 single breath hold may result in Z-axis resolution that is inadequate for nodule volumetry in some patients 275 (52). Published investigations have demonstrated the accuracy of CT nodule volumetry meeting the Claims 276 of this Profile using 16-detector scanners. 277
QIBA Profile: Lung Nodule Assessment in CT Screening Profile - 2017
Page: 11
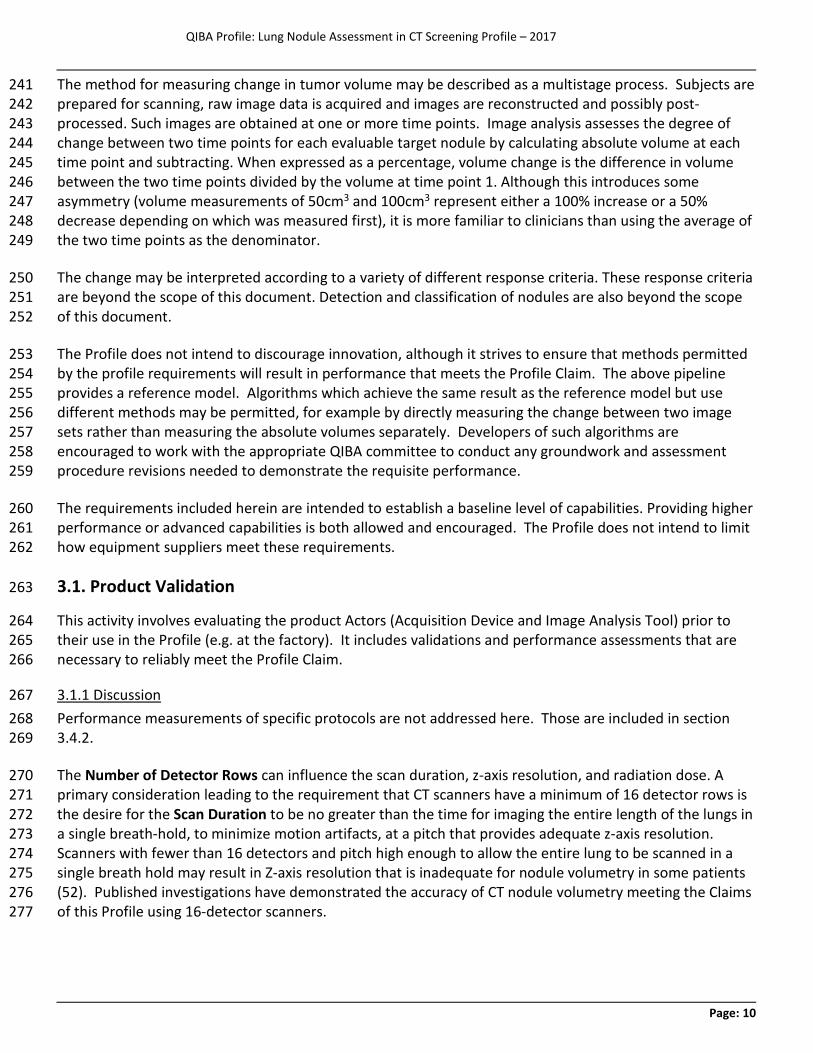
3.1.2 Specification 278
Parameter Actor Requirement
Acquisition Protocol
Acquisition Device
Shall be capable of storing protocols and performing scans with all the parameters set as specified in section 3.4.2 "Protocol Design Specification".
Acquisition Device
Shall prepare a protocol conformant with section 3.4.2 "Protocol Design Specification" and validate that protocol as described in section 3.4.2.
Acquisition Protocol Variation
Acquisition Device
Shall also validate the protocol under varying conditions from each preferred protocol setting using a Design of Experiments (DOE) approach. See section 4.2 Equipment Vendor Procedures for more information on DOE methods.
Acquisition Consistency Technologist Shall use the same compliant scanner and acquisition protocol for acquisition
of all time points. Reading Consistency Image Analyst Shall analyze all time points and shall use the same conformant image
analysis tool at all analysis time points. Number of Detector Rows
Acquisition Device Shall have 16 or more detector rows.
Image Header Acquisition Device
Shall record in the DICOM image header the actual values for the tags listed in the DICOM Tag column in section 3.4.2 "Protocol Design Specification".
Reading Paradigm
Image Analysis Tool Shall present Images from both time points side-by-side for comparison.
Change Calculation
Image Analysis Tool
Shall calculate change as the difference in volume between two time points relative to the volume at the earlier time point, expressed in mm3 units.
Scientific Validation
Image Analysis Tool
Shall have appropriate scientific validation, including the properties of measurement linearity, coefficient of variation, and zero bias.
279
3.2. Staff Qualification 280
This activity involves evaluating the human Actors (Radiologist, Physicist, and Technologist) prior to their 281 participation in the Profile. It includes training, qualification or performance assessments that are 282 necessary to reliably meet the Profile Claim. 283
3.2.1 Discussion 284 These requirements, as with any QIBA Profile requirements, are focused on achieving the Profile Claim. 285 Evaluating the medical or professional qualifications of participating actors is beyond the scope of this 286 profile. 287
In clinical practice, it is expected that the Radiologist interpreting the examination often will be the Image 288 Analyst. In some clinical practice situations, and in the clinical research setting, the image analyst may be a 289 non-radiologist professional. 290
Analyst Training should be at a level appropriate for the setting and the purpose of the measurements, and 291 may include instruction in topics such as the generation and components of volumetric CT images; 292 principles of image reconstruction and processing; technical factors influencing quantitative assessment; 293
QIBA Profile: Lung Nodule Assessment in CT Screening Profile – 2017
Page: 12
relevant CT anatomy; definition of a nodule; and image artifacts. 294
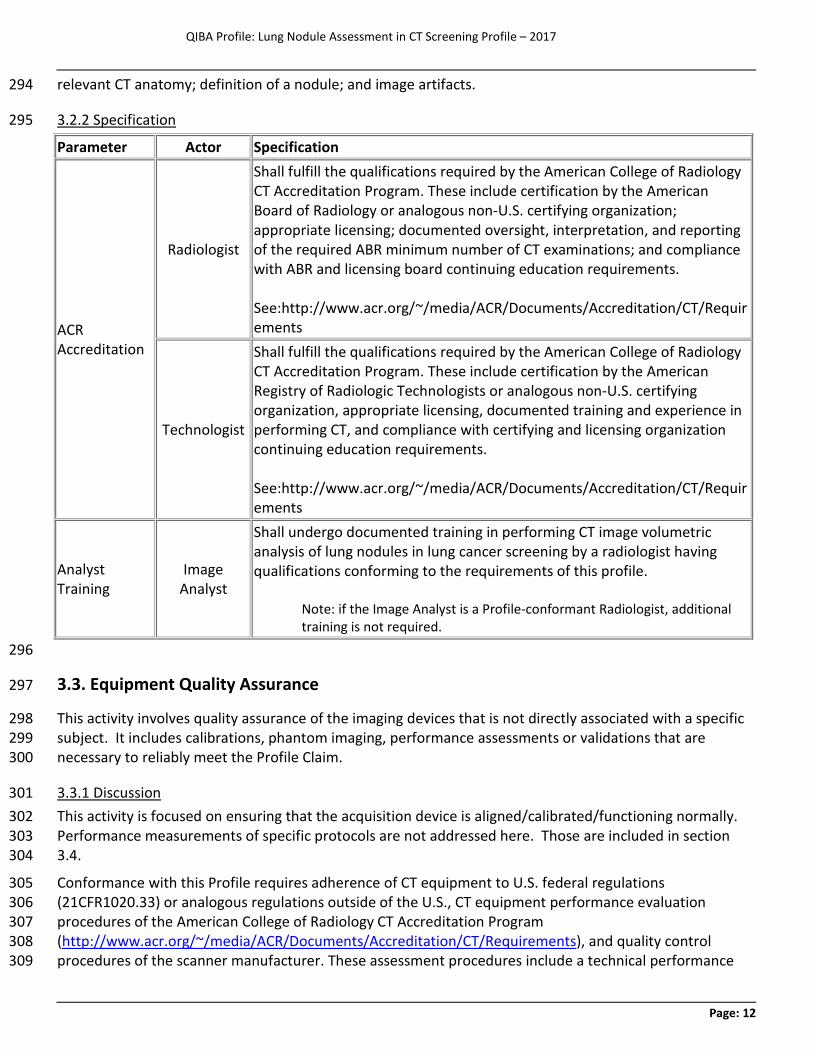
3.2.2 Specification 295
Parameter Actor Specification
ACR Accreditation
Radiologist
Shall fulfill the qualifications required by the American College of Radiology CT Accreditation Program. These include certification by the American Board of Radiology or analogous non-U.S. certifying organization; appropriate licensing; documented oversight, interpretation, and reporting of the required ABR minimum number of CT examinations; and compliance with ABR and licensing board continuing education requirements. See:http://www.acr.org/~/media/ACR/Documents/Accreditation/CT/Requirements
Technologist
Shall fulfill the qualifications required by the American College of Radiology CT Accreditation Program. These include certification by the American Registry of Radiologic Technologists or analogous non-U.S. certifying organization, appropriate licensing, documented training and experience in performing CT, and compliance with certifying and licensing organization continuing education requirements. See:http://www.acr.org/~/media/ACR/Documents/Accreditation/CT/Requirements
Analyst Training
Image Analyst
Shall undergo documented training in performing CT image volumetric analysis of lung nodules in lung cancer screening by a radiologist having qualifications conforming to the requirements of this profile.
Note: if the Image Analyst is a Profile-conformant Radiologist, additional training is not required.
296
3.3. Equipment Quality Assurance 297
This activity involves quality assurance of the imaging devices that is not directly associated with a specific 298 subject. It includes calibrations, phantom imaging, performance assessments or validations that are 299 necessary to reliably meet the Profile Claim. 300
3.3.1 Discussion 301 This activity is focused on ensuring that the acquisition device is aligned/calibrated/functioning normally. 302 Performance measurements of specific protocols are not addressed here. Those are included in section 303 3.4. 304
Conformance with this Profile requires adherence of CT equipment to U.S. federal regulations 305 (21CFR1020.33) or analogous regulations outside of the U.S., CT equipment performance evaluation 306 procedures of the American College of Radiology CT Accreditation Program 307 (http://www.acr.org/~/media/ACR/Documents/Accreditation/CT/Requirements), and quality control 308 procedures of the scanner manufacturer. These assessment procedures include a technical performance 309
QIBA Profile: Lung Nodule Assessment in CT Screening Profile - 2017
Page: 13
evaluation of the CT scanner by a qualified medical physicist at least annually. Parameters evaluated 310 include those critical for quantitative volumetric assessment of small nodules, such as spatial resolution, 311 section thickness, and table travel accuracy, as well as dosimetry. Daily quality control must include 312 monitoring of water CT number and standard deviation and artifacts. In addition, preventive maintenance 313 at appropriate regular intervals must be conducted and documented by a qualified service engineer. 314
These specifications reflect the clinical and clinical trial settings which produced the data used to support 315 the Claims of this Profile. Data were obtained from a broad range of CT scanner models having a range of 316 performance capabilities that is reflected in the size of the confidence bounds of the Claims. Ongoing 317 research is identifying the key technical parameters determining performance in the lung cancer screening 318 setting, and establishing metrics that may allow Claims with narrower confidence bounds than are found in 319 this Profile to be met for certain CT scanners through more specific technical specifications and associated 320 assessment procedures. Such metrics and assessment procedures more specific to CT volumetry in lung 321 cancer screening will be addressed in subsequent versions of this Profile. 322
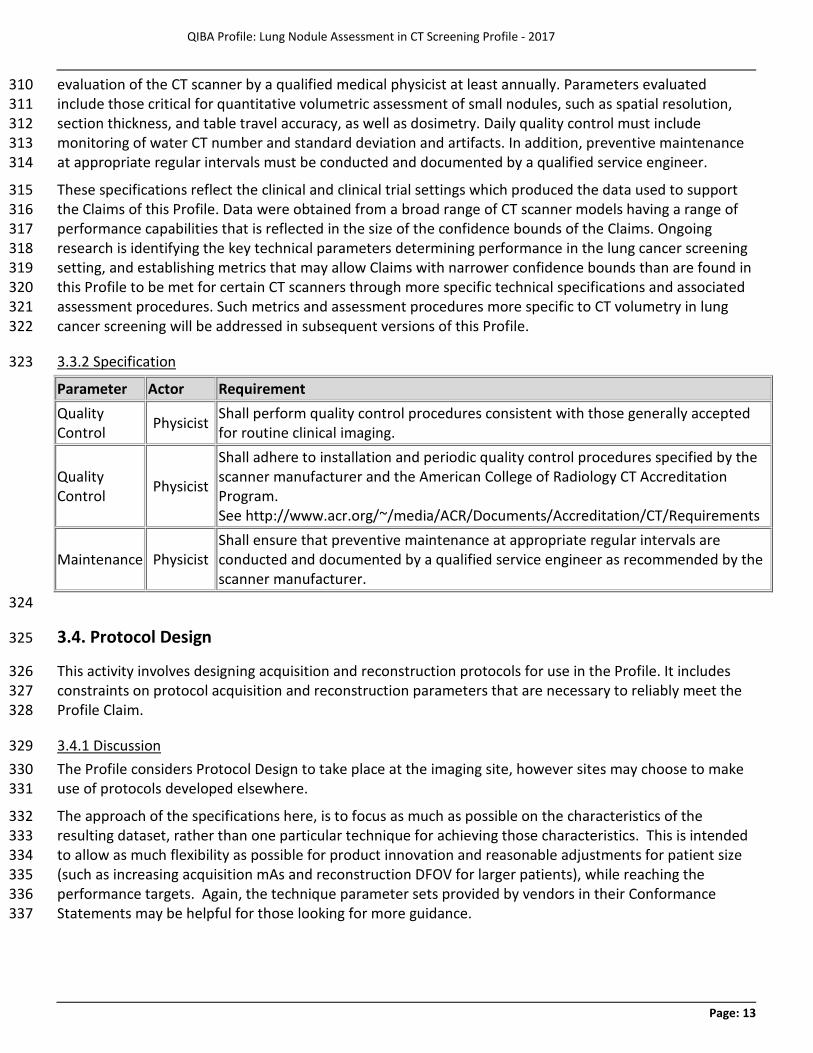
3.3.2 Specification 323
Parameter Actor Requirement Quality Control Physicist Shall perform quality control procedures consistent with those generally accepted
for routine clinical imaging.
Quality Control Physicist
Shall adhere to installation and periodic quality control procedures specified by the scanner manufacturer and the American College of Radiology CT Accreditation Program. See http://www.acr.org/~/media/ACR/Documents/Accreditation/CT/Requirements
Maintenance Physicist Shall ensure that preventive maintenance at appropriate regular intervals are conducted and documented by a qualified service engineer as recommended by the scanner manufacturer.
324
3.4. Protocol Design 325
This activity involves designing acquisition and reconstruction protocols for use in the Profile. It includes 326 constraints on protocol acquisition and reconstruction parameters that are necessary to reliably meet the 327 Profile Claim. 328
3.4.1 Discussion 329 The Profile considers Protocol Design to take place at the imaging site, however sites may choose to make 330 use of protocols developed elsewhere. 331
The approach of the specifications here, is to focus as much as possible on the characteristics of the 332 resulting dataset, rather than one particular technique for achieving those characteristics. This is intended 333 to allow as much flexibility as possible for product innovation and reasonable adjustments for patient size 334 (such as increasing acquisition mAs and reconstruction DFOV for larger patients), while reaching the 335 performance targets. Again, the technique parameter sets provided by vendors in their Conformance 336 Statements may be helpful for those looking for more guidance. 337
QIBA Profile: Lung Nodule Assessment in CT Screening Profile – 2017
Page: 14
Automatic Exposure Control aims to achieve consistent noise levels throughout the lungs by varying the 338 tube current during scan acquisition. Use of automatic exposure control is expected to have little effect on 339 Profile Claims and is considered optional, though as with other acquisition parameters its use should be 340 consistent with baseline. This scanner feature may be a useful tool for reducing unnecessary radiation 341 exposure in certain patients, but it also can increase radiation exposure depending on the target noise 342 level, patient size and anatomy, and the method employed by the vendor. These factors should be kept in 343 mind when deciding whether to use automatic exposure control in an individual patient. 344
Rotation Time may vary as needed to achieve other settings. Generally, it will be less than or equal to 0.5 345 seconds. 346
In CT screening for lung cancer, the choice of scan acquisition parameters is strongly influenced by the 347 desire to minimize radiation dose. The radiation dose delivered by volumetric CT scanning is indicated by 348 the volume CT Dose Index (CTDIvol). The CTDIvol should be chosen to provide the lowest radiation dose 349 that maintains acceptable image quality for detecting pulmonary nodules. Variability in CT nodule 350 volumetry using low dose techniques is comparable to that of standard dose techniques (14, 16-18, 29). As 351 a general guideline, CTDIvol ≤3 mGy should provide sufficient image quality for a person of standard size, 352 defined by the International Commission on Radiation Protection (ICRP) as 5’7”/170 cm and 154 lbs/70 kg. 353 The CTDIvol should be reduced for smaller individuals and may need to be increased for larger individuals, 354 but should be kept constant for the same person at all time points. CTDIvol is determined by the interaction 355 of multiple parameters, including the Tube Potential (kV), Tube Current (mA), tube Rotation Time, and 356 Pitch. Settings for kV, mA, rotation time, and pitch may be varied as needed to achieve the desired CTDIvol. 357 Pitch is chosen so as to allow completion of the scan in a single breath hold with adequate spatial 358 resolution along the subject z-axis. 359
Nominal Tomographic Section Thickness (T), the term preferred by the International Electrotechnical 360 Commission (IEC), is sometimes also called the Single Collimation Width. Choices depend on the detector 361 geometry inherent in the particular scanner model. The Nominal Tomographic Section Thickness affects the 362 spatial resolution along the subject z-axis and the available options for reconstructed section thickness. 363 Thinner sections that allow reconstruction of smaller voxels are preferable, to reduce partial volume effects 364 and provide higher accuracy due to greater spatial resolution. 365
Reconstruction Kernel is recommended to be a medium smooth to medium sharp kernel that provides the 366 highest resolution available without edge enhancement. 367
X-ray CT uses ionizing radiation. Exposure to radiation can pose risks; however as the radiation dose is 368 reduced, image quality can be degraded. It is expected that health care professionals will balance the need 369 for good image quality with the risks of radiation exposure on a case-by-case basis. It is not within the 370 scope of this document to describe how these trade-offs should be resolved. 371
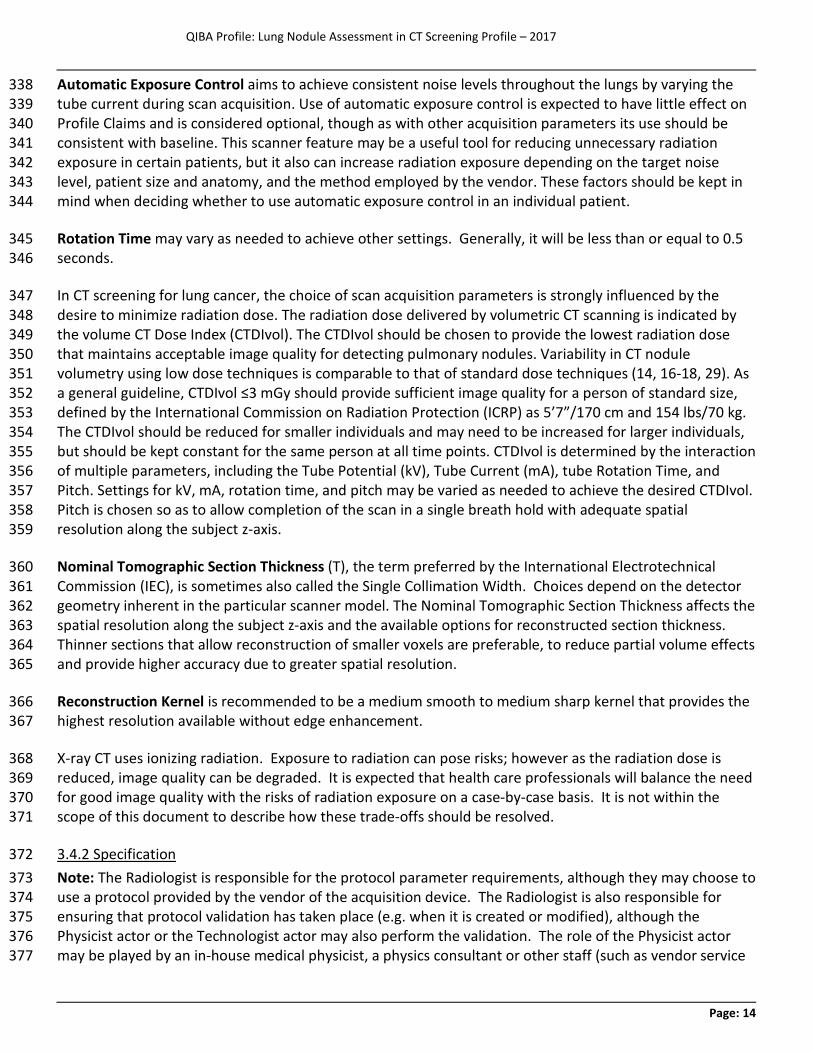
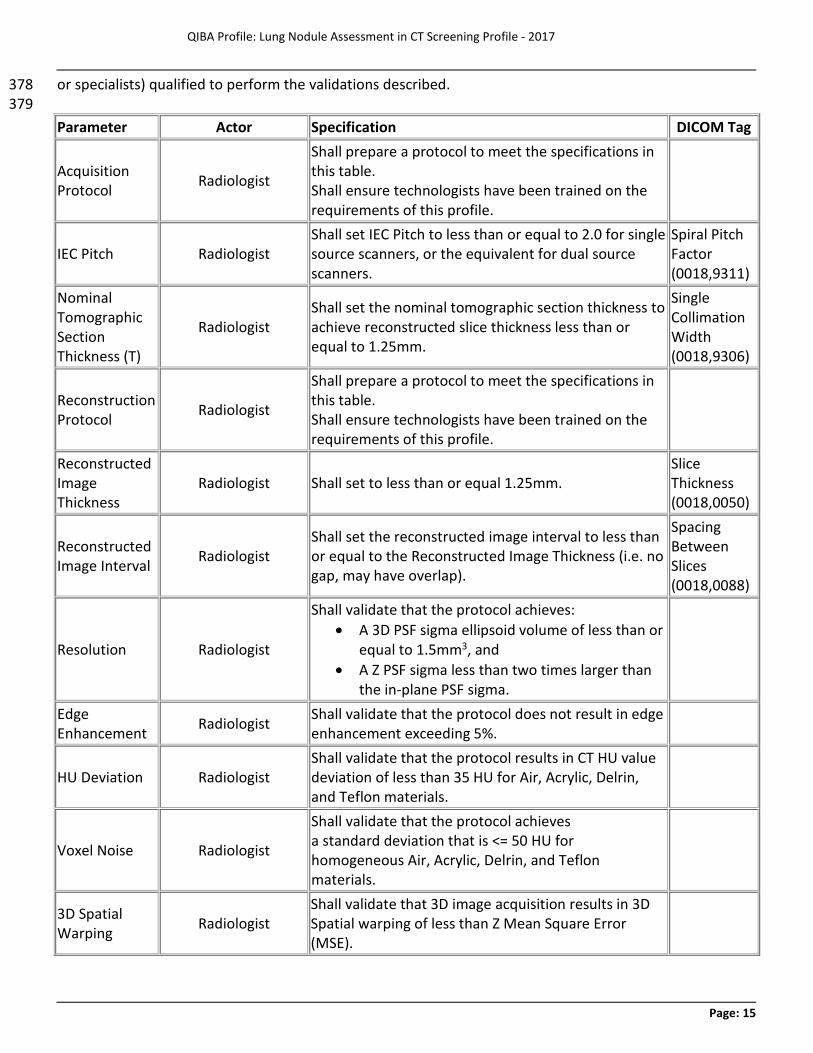
3.4.2 Specification 372 Note: The Radiologist is responsible for the protocol parameter requirements, although they may choose to 373 use a protocol provided by the vendor of the acquisition device. The Radiologist is also responsible for 374 ensuring that protocol validation has taken place (e.g. when it is created or modified), although the 375 Physicist actor or the Technologist actor may also perform the validation. The role of the Physicist actor 376 may be played by an in-house medical physicist, a physics consultant or other staff (such as vendor service 377
QIBA Profile: Lung Nodule Assessment in CT Screening Profile - 2017
Page: 15
or specialists) qualified to perform the validations described. 378 379 Parameter Actor Specification DICOM Tag
Acquisition Protocol Radiologist
Shall prepare a protocol to meet the specifications in this table. Shall ensure technologists have been trained on the requirements of this profile.
IEC Pitch Radiologist Shall set IEC Pitch to less than or equal to 2.0 for single source scanners, or the equivalent for dual source scanners.
Spiral Pitch Factor (0018,9311)
Nominal Tomographic Section Thickness (T)
Radiologist Shall set the nominal tomographic section thickness to achieve reconstructed slice thickness less than or equal to 1.25mm.
Single Collimation Width (0018,9306)
Reconstruction Protocol Radiologist
Shall prepare a protocol to meet the specifications in this table. Shall ensure technologists have been trained on the requirements of this profile.
Reconstructed Image Thickness
Radiologist Shall set to less than or equal 1.25mm. Slice Thickness (0018,0050)
Reconstructed Image Interval Radiologist
Shall set the reconstructed image interval to less than or equal to the Reconstructed Image Thickness (i.e. no gap, may have overlap).
Spacing Between Slices (0018,0088)
Resolution Radiologist
Shall validate that the protocol achieves: · A 3D PSF sigma ellipsoid volume of less than or
equal to 1.5mm3, and · A Z PSF sigma less than two times larger than
the in-plane PSF sigma.
Edge Enhancement Radiologist Shall validate that the protocol does not result in edge
enhancement exceeding 5%.
HU Deviation Radiologist Shall validate that the protocol results in CT HU value deviation of less than 35 HU for Air, Acrylic, Delrin, and Teflon materials.
Voxel Noise Radiologist
Shall validate that the protocol achieves a standard deviation that is <= 50 HU for homogeneous Air, Acrylic, Delrin, and Teflon materials.
3D Spatial Warping Radiologist
Shall validate that 3D image acquisition results in 3D Spatial warping of less than Z Mean Square Error (MSE).
QIBA Profile: Lung Nodule Assessment in CT Screening Profile – 2017
Page: 16
Parameter Actor Specification DICOM Tag 380
3.5. Subject Selection 381
This activity describes criteria and procedures related to the selection of appropriate imaging subjects that 382 are necessary to reliably meet the Profile Claim. 383
3.5.1 Discussion 384
Pulmonary Symptoms may signify acute or subacute abnormalities in the lungs that could interfere with or 385 alter pulmonary nodule volume measurements, or prevent full cooperation with breath-holding 386 instructions for scanning. Therefore, subjects should be asymptomatic, or at baseline if symptomatic, with 387 respect to cardiac and pulmonary symptoms. If scanning is necessary to avoid an excessive delay in follow-388 up of a known nodule or to evaluate new symptoms, and these clinical status conditions cannot be met 389 then measurements may not be of sufficient quality to fulfill the Profile Claims. Chronic abnormalities such 390 as pulmonary fibrosis also may invalidate Profile Claims if they affect nodule volume measurement 391 accuracy. 392
Recent diagnostic or therapeutic Medical Procedures may result in parenchymal lung abnormalities that 393 increase lung attenuation around a nodule and invalidate the Claims of this Profile. Examples include 394 bronchoscopy, thoracic surgery, and radiation therapy. 395
Oral contrast administered for unrelated gastrointestinal imaging studies or abdominal CT that remains in 396 the esophagus, stomach, or bowel may cause artifacts in certain areas of the lungs that interfere with 397 quantitative nodule assessment. If artifacts due to oral contrast are present in the same transverse planes 398 as a quantifiable lung nodule, the Profile Claims may not be valid. 399
3.5.2 SPECIFICATION 400
Parameter Actor Requirement
Medical Procedures
Referring clinician Shall schedule scanning prior to or at an appropriate time following procedures that could alter the attenuation of the lung nodule or surrounding lung tissue. Radiologist
Pulmonary Symptoms
Referring clinician Shall delay scanning for a time period that allows resolution of potential reversible CT abnormalities if pulmonary symptoms are present.
Radiologist
401
3.6. Subject Handling 402
This activity involves handling each imaging subject at each time point. It includes subject handling details 403 that are necessary to reliably meet the Profile Claim. 404
QIBA Profile: Lung Nodule Assessment in CT Screening Profile - 2017
Page: 17
3.6.1 DISCUSSION 405 This Profile will refer primarily to “subjects”, keeping in mind that the requirements and recommendations 406 apply to patients in general, and subjects are often patients too. 407
Subject handling guidelines are intended to reduce the likelihood that lung nodules will be obscured by 408 surrounding disease or image artifacts, which could alter quantitative measurements, and to promote 409 consistency of image quality on serial scans. 410
Intravenous Contrast is not used for CT lung cancer screening (26). Because of the inherently high contrast 411 between lung nodules and the surrounding parenchyma, contrast is unnecessary for nodule detection and 412 quantification. Its use incurs additional cost, the potential for renal toxicity and adverse reactions, and may 413 affect volume quantification (21, 27, 28). If contrast must be used for a specific clinical indication (e.g. for 414 characterization of the nodule, hilar nodes, or another abnormality) the Profile Claims are invalidated. 415
After obtaining the localizer (scout) image, the technologist should evaluate the image for Artifact Sources 416 such as external metallic objects that may produce artifacts that may alter the attenuation of lung nodules, 417 and work with the subject to remove these devices. Internal metallic objects, such as pacemakers and 418 spinal instrumentation, also may produce artifacts. 419
Bismuth breast shields (used by some to reduce radiation exposure in the diagnostic CT setting) increase 420 image noise. The impact of this imaging artifact on lung nodule volume quantification is unknown, but is 421 likely to be magnified in the lung cancer screening setting due to the lower radiation dose used for 422 screening. The effects of breast shields on image quality may vary depending on the types of shields and 423 their positioning on the chest. The American Association of Physicists in Medicine currently does not 424 endorse the use of breast shields, recommending the use of other dose reduction methods instead 425 (https://www.aapm.org/publicgeneral/BismuthShielding.pdf). Thus, the use of breast shields is not 426 compatible with the Profile Claims and is not recommended for lung cancer screening. However, organ 427 dose modulation techniques that reduce dose in the anterior thorax may be used if implemented on all 428 studies being compared. 429
Consistent Subject Positioning is important, to reduce variation in x-ray beam hardening and scatter and in 430 nodule orientation and position within the gantry. Positioning the chest (excluding the breasts) in the 431 center of the gantry improves the consistency of relative attenuation values in different regions of the lung, 432 and should reduce scan-to-scan variation in the behavior of dose modulation algorithms. The subject 433 should be made comfortable, to reduce the potential for motion artifacts and to facilitate compliance with 434 breath holding instructions. 435
To achieve these goals, subjects should be positioned supine with arms overhead, in keeping with standard 436 clinical practice. The sternum should be positioned over the midline of the table. The Table Height and 437 Centering should be adjusted so that the midaxillary line is at the widest part of the gantry. The use of 438 positioning wedges under the knees and/or head may be needed for patient comfort, or may help to better 439 align the spine and shoulders on the table, and is optional. It is expected that local clinical practice and 440 patient physical capabilities and limitations will influence patient positioning; an approach that promotes 441 scan-to-scan consistency is essential. 442
Scans should be performed during Breath Holding at maximal inspiration, to reduce motion artifacts and 443 improve segmentation. Efforts should be made to obtain consistent, reproducible, maximal inspiratory lung 444
QIBA Profile: Lung Nodule Assessment in CT Screening Profile – 2017
Page: 18
volume on all scans. The use of live breathing instructions given at a pace easily tolerated by the patient is 445 strongly recommended. However, depending on local practice preference and expertise, the use of 446 prerecorded breathing instructions may provide acceptable results. Compliance with breathing instructions 447 should be monitored by carefully observing the movement of the chest wall and abdomen to insure that 448 the breathing cycle stays in phase with the verbal instructions. The scan should not be initiated until 449 maximal inspiratory volume is reached and all movement has ceased. 450
To promote patient compliance, performing a practice round of the breathing instructions prior to moving 451 the patient into the scanner also is strongly recommended. This will make the subject familiar with the 452 procedure, make the technologist familiar with the subject’s breathing rate, and allow the technologist to 453 address any subject difficulties in following the instructions. 454
Sample breathing instructions: 455
1. “Take in a deep breath” (watch anterior chest rise) 456
2. “Breathe all the way out” (watch anterior chest fall) 457
3. “Now take a deep breath in…..in……in…..in all the way as far as you can” 458
4. When chest and abdomen stop rising, say “Now hold your breath”. 459
5. Initiate the scan when the chest and abdomen stop moving, allowing for the moment it takes for the 460 diaphragm to relax after the glottis is closed. 461
6. When scan is completed, say “You can breathe normally” 462
3.6.2 SPECIFICATION 463
Parameter Actor Requirement
Intravenous contrast
Analyst Shall not use images in which intravenous contrast was administered for quantitative nodule volumetry in lung cancer screening or follow-up of screen-detected nodules. Radiologist
Artifact sources Technologist
Shall remove or position potential sources of artifacts (specifically including breast shields, metal-containing clothing, EKG leads and other metal equipment) such that they will not degrade the reconstructed CT volumes.
Subject Positioning Technologist Shall position the subject consistent with baseline.
Table Height & Centering Technologist
Shall adjust the table height for the midaxillary plane to pass through the isocenter of the gantry. Shall be consistent with baseline.
Breath holding Technologist Shall instruct the subject in proper breath-hold and start image acquisition shortly after full inspiration, taking into account the lag
QIBA Profile: Lung Nodule Assessment in CT Screening Profile - 2017
Page: 19
Parameter Actor Requirement time between full inspiration and diaphragmatic relaxation. Shall ensure that for each tumor the breath hold state is consistent with baseline
464
3.7. Image Data Acquisition 465
This activity involves the acquisition of image data for a subject at either time point. It includes details of 466 data acquisition that are necessary to reliably meet the Profile Claim. 467
3.7.1 DISCUSSION 468
CT scans for nodule volumetric analysis can be performed on equipment that complies with the 469 Specifications set out in this Profile. However, performing all CT scans for an individual subject must be 470 done on the same platform (manufacturer, model and version) to reduce variation. 471
Note that the requirement to "select a protocol that has been prepared and validated for this purpose" is 472 not asking the tech to scan phantoms before every patient. Sites are required in section 3.4.2 to have 473 validated the protocols that the tech will be using and conformance with the protocol depends on the tech 474 selecting those protocols. 475
Many scan parameters can have direct or indirect effects on identifying, segmenting and measuring tumors. 476 To reduce this potential source of variance, all efforts should be made to have as many of the scan 477 parameters as possible consistent with the baseline. 478
Consistency with the baseline implies a need for a method to record and communicate the baseline 479 settings and make that information available at the time and place that subsequent scans are performed. 480 Although it is conceivable that the scanner could retrieve prior/baseline images and extract acquisition 481 parameters to encourage consistency, such interoperability mechanisms are not defined or mandated here 482 beyond requiring that certain fields be populated in the image header. Similarly, managing and forwarding 483 the data files when multiple sites are involved may exceed the practical capabilities of the participating 484 sites. Sites should be prepared to use manual methods instead. 485
Image Header recordings of the key parameter values facilitate meeting and confirming the requirements 486 to be consistent with the baseline scan. 487
The goal of parameter consistency is to achieve consistent performance. Parameter consistency when 488 using the same scanner make/model generally means using the same values. Parameter consistency when 489 the baseline was acquired on a different make/model may require some “interpretation” to achieve 490 consistent performance since the same values may produce different behavior on different models. See 491 Section 3.4 "Protocol Design". 492
Anatomic Coverage For screening purposes a baseline scan should include the entire volume of the lungs 493 (apex through base), minimizing the volume scanned above and below the lungs to avoid unnecessary 494
QIBA Profile: Lung Nodule Assessment in CT Screening Profile – 2017
Page: 20
radiation exposure. For nodule measurement, the scan should include the full nodule and typically 5 to 10 495 mm of lung region above and below the nodule. 496
The localizer (scout) image should be restricted as closely as possible to the anatomic limits of the thorax, 497 using the minimum kV and mA needed to identify relevant anatomic landmarks. Inspecting the image also 498 provides the opportunity to remove any external objects that may have been missed prior to positioning 499 the subject on the table. 500
In CT screening for lung cancer, the choice of scan acquisition parameters is strongly influenced by the 501 desire to minimize radiation dose. The radiation dose delivered by volumetric CT scanning is indicated by 502 the volume CT Dose Index (CTDIvol). The CTDIvol should be chosen to provide the lowest radiation dose 503 that maintains acceptable image quality for detecting pulmonary nodules. Variability in CT nodule 504 volumetry using low dose techniques is comparable to that of standard dose techniques (14, 16-18, 29). As 505 a general guideline, CTDIvol ≤3 mGy should provide sufficient image quality for a person of standard size, 506 defined by the International Commission on Radiation Protection (ICRP) as 5’7”/170 cm and 154 lbs/70 kg. 507 The CTDIvol should be reduced for smaller individuals and may need to be increased for larger individuals, 508 but should be kept constant for the same person at all time points. CTDIvol is determined by the interaction 509 of multiple parameters, including the Tube Potential (kV), Tube Current (mA), tube Rotation Time, and 510 Pitch. Settings for kV, mA, rotation time, and pitch may be varied as needed to achieve the desired CTDIvol. 511 Pitch is chosen so as to allow completion of the scan in a single breath hold with adequate spatial 512 resolution along the subject z-axis. It is recommended that pitch does not exceed 2.0 for CT acquisitions 513 obtained with a single x-ray tube, or the equivalent for acquisitions with dual-source technology. 514
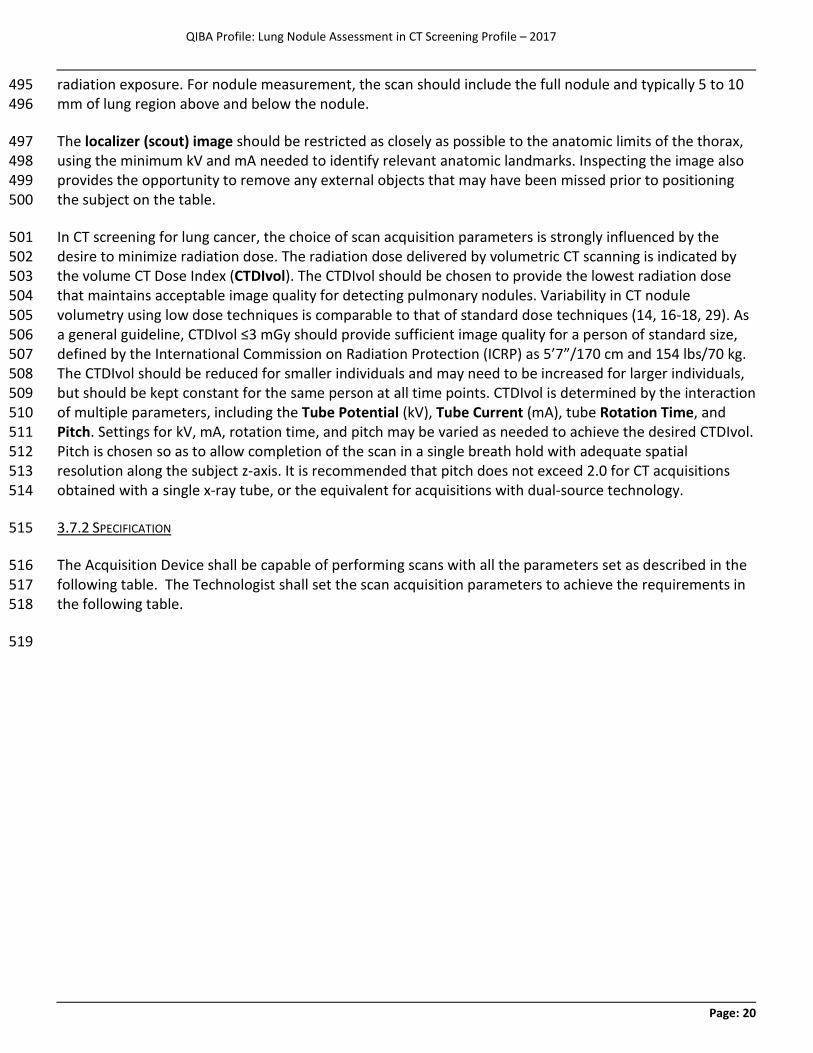
3.7.2 SPECIFICATION 515
The Acquisition Device shall be capable of performing scans with all the parameters set as described in the 516 following table. The Technologist shall set the scan acquisition parameters to achieve the requirements in 517 the following table. 518
519
QIBA Profile: Lung Nodule Assessment in CT Screening Profile - 2017
Page: 21
520
521 3.8. Image Data Reconstruction 522
This activity involves the reconstruction of image data for a subject at either time point. It includes criteria 523 and procedures related to producing images from the acquired data that are necessary to reliably meet the 524 Profile Claim. 525
3.8.1 DISCUSSION 526
Many reconstruction parameters can have direct or indirect effects on identifying, segmenting, and 527 measuring nodules. To reduce this source of variance, all efforts should be made to have as many of the 528 parameters as possible on follow-up scans consistent with the baseline scan. 529
Reconstruction Field of View interacts with image matrix size (512x512 for most reconstruction algorithms) 530 to determine the reconstructed pixel size. Pixel size directly affects voxel size in the x-y plane. Smaller 531 voxels are preferable to reduce partial volume effects that can blur the edges of nodules and reduce 532 measurement accuracy and precision. Pixel size in each dimension is not the same as spatial resolution in 533 each dimension, which depends on a number of additional factors including the section thickness and 534 reconstruction kernel. Targeted reconstructions with a small field of view minimize partial volume effects, 535 but have limited effect on the accuracy of nodule volumetry compared to a standard field of view that 536 encompasses all of the lungs (11, 12). A reconstructed field of view set to the widest diameter of the lungs, 537 and consistent with baseline, is sufficient to meet the Claims of this Profile. 538
The Reconstructed Slice Thickness should be small relative to the size of the smallest nodules detected and 539 followed by CT screening (11-13, 31). 540
The Reconstruction Interval should be either contiguous or overlapping (i.e. with an interval that is less 541 than the reconstructed slice thickness). Either method will be consistent with the Profile Claims, though 542 overlap of 50% may provide better accuracy and precision compared to contiguous slice reconstruction 543 (32). Reconstructing datasets with overlap will increase the number of images and may slow down 544 throughput, increase reading time, and increase storage requirements, but has NO effect on radiation 545 exposure. A reconstruction interval that results in gaps between slices is unacceptable as it may “truncate” 546
Parameter Actor Requirement DICOM Tag
Acquisition Protocol Technologist/Radiologist
Shall select a protocol that has been previously prepared and validated for this Profile (See section 3.4.2 "Protocol Design Specification").
Scan Duration Technologist Shall perform the scan in a single breath hold.
Consistency Technologist Shall ensure that follow-up scans use the same CT scanner model and acquisition protocol settings.
QIBA Profile: Lung Nodule Assessment in CT Screening Profile – 2017
Page: 22
the spatial extent of the nodule, degrade the identification of nodule boundaries, and confound the 547 precision of measurement for total nodule volumes. 548
The Reconstruction Algorithm Type most commonly used for CT has been filtered back projection. More 549 recently introduced methods of iterative reconstruction can provide reduced image noise and/or radiation 550 exposure (33). Studies have indicated that iterative methods are at least comparable to filtered back 551 projection for CT volumetry (16-18, 29, 34). Both algorithm types are acceptable for this Profile. 552
The Reconstruction Kernel influences the texture and the appearance of nodules in the reconstructed 553 images, including the sharpness of the nodule edges. In general, a softer, smoother kernel reduces noise at 554 the expense of spatial resolution, while a sharper, higher-frequency kernel gives the appearance of 555 improved resolution at the expense of increased noise. Kernel types may interact differently with different 556 software segmentation algorithms. Theoretically, the ideal kernel choice for any particular scanner is one 557 that provides the highest resolution without edge enhancement, which generally will be a kernel in the 558 medium-smooth to medium-sharp range of those available on clinical scanners. With increasing kernel 559 smoothness, underestimation of nodule volume becomes a potential concern, while with increasing kernel 560 sharpness, image noise and segmentation errors become potential concerns. Use of a reconstruction kernel 561 on follow-up scans consistent with baseline therefore is particularly important for relying on the Profile 562 Claims. 563
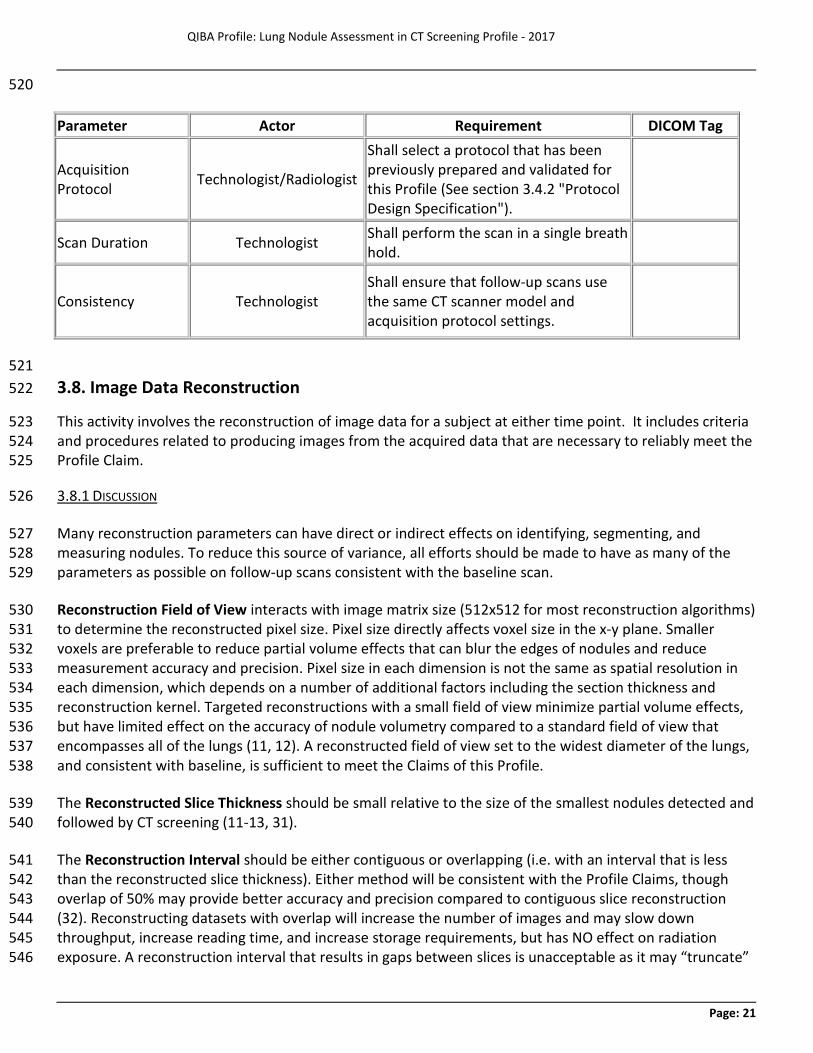
3.8.2 SPECIFICATION 564
Parameter Actor Specification DICOM Tag
Reconstruction Protocol Technologist
Shall select a protocol that has been previously prepared and validated for this purpose (See section 3.4.2 "Protocol Design Specification").
Reconstruction Field of View Technologist
Shall ensure the Field of View spans at least the full extent of the thoracic and abdominal cavity, but not substantially greater than that, and is consistent with baseline.
Reconstruction Field of View (0018,9317)
Reconstructed Image Thickness
Technologist Shall set reconstructed image thickness to less than or equal to 1.25 mm and the same as baseline.
Slice Thickness (0018,0050)
Reconstruction Interval Technologist
Shall set to less than or equal to the Reconstructed Image Thickness (i.e. no gap, may have overlap) and consistent with baseline.
Spacing Between Slices (0018,0088)
QIBA Profile: Lung Nodule Assessment in CT Screening Profile - 2017
Page: 23
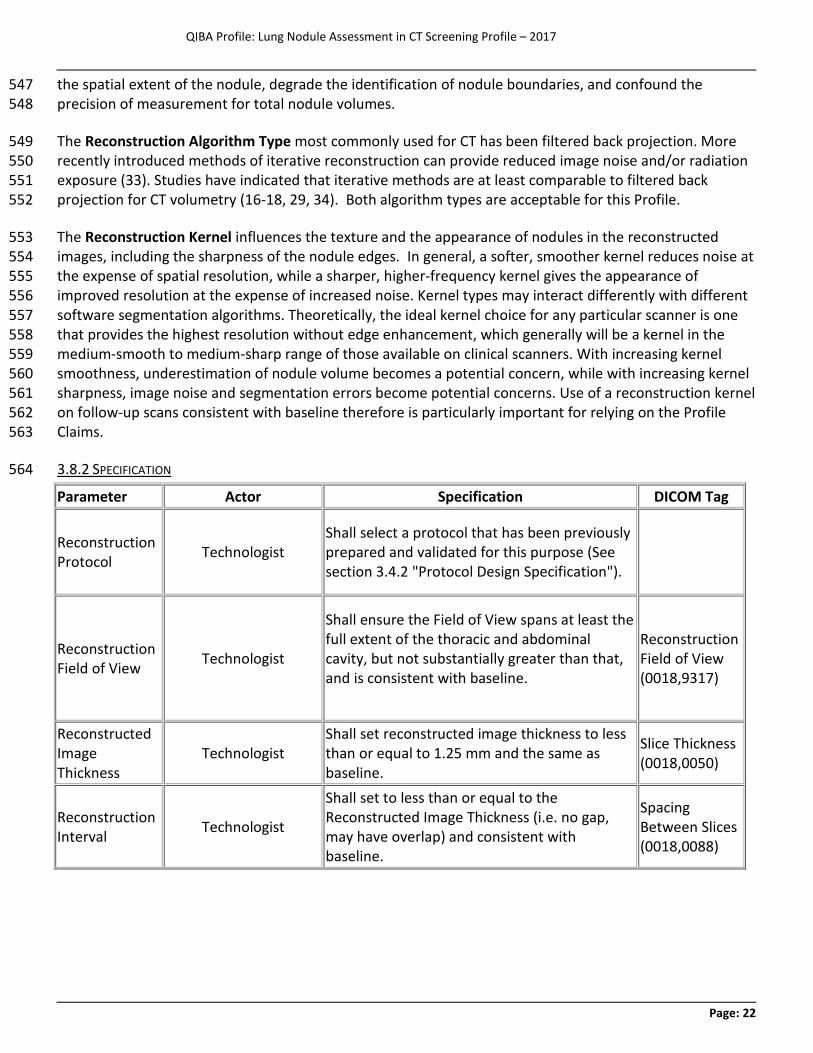
Parameter Actor Specification DICOM Tag
Reconstruction Kernel Technologist
Shall set the reconstruction kernel and parameters consistent with baseline (i.e. the same kernel and parameters if available, otherwise the kernel most closely matching the kernel response of the baseline).
Convolution Kernel (0018,1210), Convolution Kernel Group (0018,9316)
565
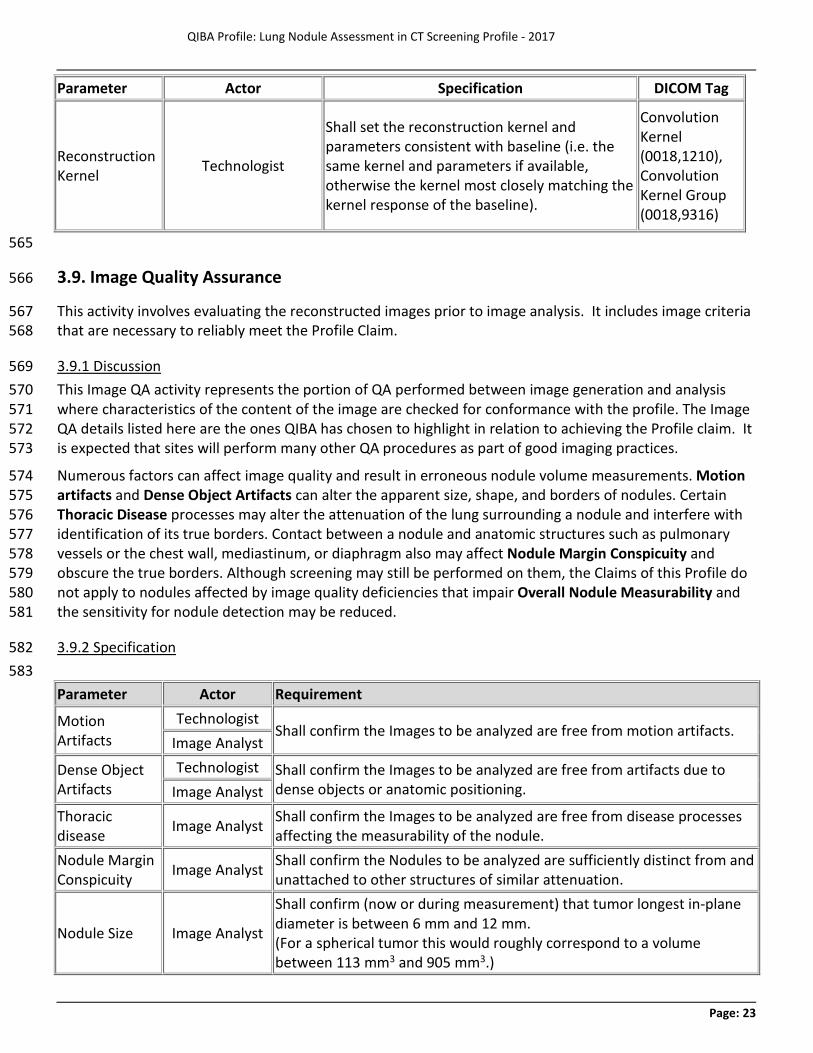
3.9. Image Quality Assurance 566
This activity involves evaluating the reconstructed images prior to image analysis. It includes image criteria 567 that are necessary to reliably meet the Profile Claim. 568
3.9.1 Discussion 569 This Image QA activity represents the portion of QA performed between image generation and analysis 570 where characteristics of the content of the image are checked for conformance with the profile. The Image 571 QA details listed here are the ones QIBA has chosen to highlight in relation to achieving the Profile claim. It 572 is expected that sites will perform many other QA procedures as part of good imaging practices. 573
Numerous factors can affect image quality and result in erroneous nodule volume measurements. Motion 574 artifacts and Dense Object Artifacts can alter the apparent size, shape, and borders of nodules. Certain 575 Thoracic Disease processes may alter the attenuation of the lung surrounding a nodule and interfere with 576 identification of its true borders. Contact between a nodule and anatomic structures such as pulmonary 577 vessels or the chest wall, mediastinum, or diaphragm also may affect Nodule Margin Conspicuity and 578 obscure the true borders. Although screening may still be performed on them, the Claims of this Profile do 579 not apply to nodules affected by image quality deficiencies that impair Overall Nodule Measurability and 580 the sensitivity for nodule detection may be reduced. 581
3.9.2 Specification 582 583 Parameter Actor Requirement
Motion Artifacts
Technologist Shall confirm the Images to be analyzed are free from motion artifacts.
Image Analyst
Dense Object Artifacts
Technologist Shall confirm the Images to be analyzed are free from artifacts due to dense objects or anatomic positioning. Image Analyst
Thoracic disease Image Analyst Shall confirm the Images to be analyzed are free from disease processes
affecting the measurability of the nodule. Nodule Margin Conspicuity Image Analyst Shall confirm the Nodules to be analyzed are sufficiently distinct from and
unattached to other structures of similar attenuation.
Nodule Size Image Analyst
Shall confirm (now or during measurement) that tumor longest in-plane diameter is between 6 mm and 12 mm. (For a spherical tumor this would roughly correspond to a volume between 113 mm3 and 905 mm3.)
QIBA Profile: Lung Nodule Assessment in CT Screening Profile – 2017
Page: 24
Parameter Actor Requirement Overall Nodule Measurability Image Analyst Shall disqualify any Nodules and images with features that might
reasonably be expected to degrade measurement reliability. 584
3.10. Image Analysis 585
This activity involves measuring the volume change for subjects over one or more timepoints. It includes 586 criteria and procedures related to producing quantitative measurements from the images that are 587 necessary to reliably meet the Profile Claim. 588
3.10.1 DISCUSSION 589
Image analysis should be performed using Image Analysis Tool programs that have received appropriate 590 scientific validation. Because different programs use different segmentation algorithms that may result in 591 different volumetric measurements even for ideal nodules, and different versions of the same program or 592 its components may change its performance, a nodule being evaluated for change must be analyzed at 593 both time points with the same software program (manufacturer, model, and version). 594
The volume of a lung nodule is typically determined by defining the nodule boundary (referred to as 595 segmentation) and computing the volume within the boundary. Segmentation typically is performed by an 596 automated algorithm after the user designates the location of the nodule to be measured with a starting 597 seed point, cursor stroke, or region of interest. A subjective Segmentation Analysis should be conducted to 598 closely inspect segmentation volumes in three dimensions for concordance with the visually-assessed 599 nodule margins. Assessment of this concordance can be affected by the Image Display Settings, so a 600 window and level appropriate for viewing the lung should be used and kept the same for all time points 601 being compared. 602
Nodules for which the segmentation tracks the margins most accurately, without manual editing, will most 603 closely meet the Claims of this Profile. If in the radiologist’s opinion the segmentation is unacceptable, 604 quantitative volumetry shall not be used and nodule size change should be assessed using standard clinical 605 methods. Nodule location and margin characteristics impact segmentation quality and variance in nodule 606 measurement, which are more favorable for nodules that are isolated, well-separated from adjacent 607 structures, and have smooth borders compared to nodules abutting pulmonary vessels or parietal pleura, 608 and also for smooth nodules compared to spiculated or irregularly shaped nodules (35-40). 609
When deriving the nodule volume difference between two time points, the Reading Paradigm involves 610 direct side-by-side comparison of the current and previous image data at the same time, to reduce 611 interobserver and intraobserver variation. Storing segmentations and measurement results for review at a 612 later date is certainly a useful practice as it can save time and cost. However, segmentation results at both 613 time points should be inspected visually in three dimensions to make sure that they are of sufficient and 614 comparable accuracy in order to meet the Claims of the Profile. If a previous segmentation is unavailable 615 for viewing, or the previous segmentation is not of comparable accuracy to the current segmentation, 616 segmentation at the comparison time point should be repeated. 617
QIBA Profile: Lung Nodule Assessment in CT Screening Profile - 2017
Page: 25
Methods that calculate volume changes directly without calculating volumes at individual time points are 618 acceptable so long as the results are compliant with the specifications set out by this Profile. Regardless of 619 method, the ability of software to calculate and record volume change relative to baseline for each nodule 620 is recommended. 621
These Image Analysis specifications are intended to apply to a typical user working in the clinical setting 622 (i.e. without extraordinary training or ability). This should be kept in mind by vendors measuring the 623 performance of their tools and sites validating the performance of their installation. Although the 624 performance of some methods may depend on the judgment and skill of the user, it is beyond this Profile 625 to specify the qualifications or experience of the operator. 626
3.10.2 SPECIFICATION 627
Parameter Actor Requirement
Image Analysis Tool Image Analyst Shall use the same Image Analysis Tool (manufacturer, model, version) for measurements at all time points.
Segmentation Analysis Image Analyst
Shall disqualify nodules with inadequate automated segmentations or nodules with non-comparable segmentations at both time points.
Image Display Settings Image Analyst
Shall set the Image display setting (window and level) for the segmentation initiation to the same lung appropriate settings for all time points.
Equipment Technologist/ Image Analyst
Shall use the same measurement system (scanner model, software, and operator) at the two time points.
628
QIBA Profile: Lung Nodule Assessment in CT Screening Profile – 2017
Page: 26
4. Conformance 629
To conform to this Profile, participating staff and equipment (“Actors”) shall support each activity assigned 630 to them in Table 3-1. To support an activity, the actor shall conform to the checklist of requirements 631 (indicated by “shall language”) listed in the specifications table of that activity subsection in Section 3. 632
Although some of the requirements described in Section 3 can be assessed for conformance by direct 633 observation, many of the most critical performance-oriented requirements cannot. Thus, the assessment 634 procedures in Section 4 are required. 635
This section begins with a description of the Technical Evaluation Methods (Section 4.1) that will be used 636 to verify the performance requirements of the image acquisition system and the software analysis system. 637 The Equipment Vendor Assessment Procedure (Section 4.2) specifies the conformance procedures that 638 equipment vendors must perform for a specific vendor equipment model to comply with the profile. The 639 Clinical Site Assessment Procedure (Section 4.3) describes the steps needed by a clinical site to achieve 640 conformance with this profile. 641
4.1. Technical Evaluation Methods 642
There are two types of equipment used to perform lung nodule measurements in this profile. The technical 643 methods to verify the quality of images produced by the CT scanner and acquisition protocol are outlined in 644 Section 4.1.1. The technical methods to verify the quality of measurements produced by the analysis 645 software is outlined in Section 4.1.2. These methods are then used by equipment vendors (Section 4.2) and 646 clinical sites (Section 4.3) to verify conformance with profile requirements. 647 648 To date for routine clinical imaging, technical criteria have been typically developed for assessing 649 performance in qualitative imaging applications. With this profile, we are evaluating the imaging relative to 650 assessing performance in quantitative imaging. To reliably measure small changes in the volume of 651 pulmonary nodules is a new and very demanding task requiring a significant upgrading of the conformance 652 process. QIBA describe this transition as moving from a periodic “passive” to an “active” conformance 653 process. This new active conformance process is required to allow the level of measurement accuracy 654 embedding in the Profile claim within a defined statistical confidence interval. The active conformance 655 process involves a prospective test of the CT scanner to be used for the screening evaluation with all of the 656 requisite measurement parameters of the CT set as outlined in this Profile document. Therefore, to validate 657 conformance with the Profile, images are acquired of a standard reference object. The resulting images are 658 sent to the QIBA Conformance evaluation site for review, and after an automated analysis, a 659 comprehensive report of the scanner performance relative to the conformance requirement of the Profile 660 is sent back to the site (typically within the ensuing hour). The overall goal of the process is to ensure that 661 the CT scanner is performing well enough when set to the specified acquisition parameters, so that it can 662 provide accurate and robust imaging information relative to the stated statistical boundaries of the Profile 663 claim. Note that while use of active conformance tools are the preferred method for clinical sites and 664 equipment vendors to achieve conformance, a site or a vendor may alternatively contact QIBA with a 665 technically equivalent approach for conformance along with supporting data. Any alternative conformance 666 approach that is shown to meet the goals of the profile will be permitted to be used. 667
4.1.1 CT Image Quality Characteristics 668 669
QIBA Profile: Lung Nodule Assessment in CT Screening Profile - 2017
Page: 27
These methods specify the quality characteristics of reconstructed images for a specific CT scanner and 670 acquisition protocol. Image quality is assessed with a collection of five metrics: 671
· Resolution is assessed in terms of the estimated response of the imaging system to a point source 672 (aka point spread function or PSF). The PSF, in turn, is characterized as a Gaussian with a standard 673 deviation of sigma expressed in mm. The PSF is measured both in-plane and along the Z dimension. 674 Note: decreasing values indicate improving resolution. 675
· HU Bias is assessed in terms of the HU difference of the mean value from the expected value for a 676 material with uniform density. 677
· Voxel Noise is assessed in terms of the standard deviation of pixel HU values when imaging a 678 material with uniform density. 679
· Edge Enhancement is assessed in terms of the maximum percent increase in HU contrast above 680 expected along the outer edge of an ideal cylinder surrounded by air. 681
· Spatial Warping is assessed in terms of the mean squared error of the outer cylindrical surface 682 compared to an ideal cylindrical reference object surface. 683
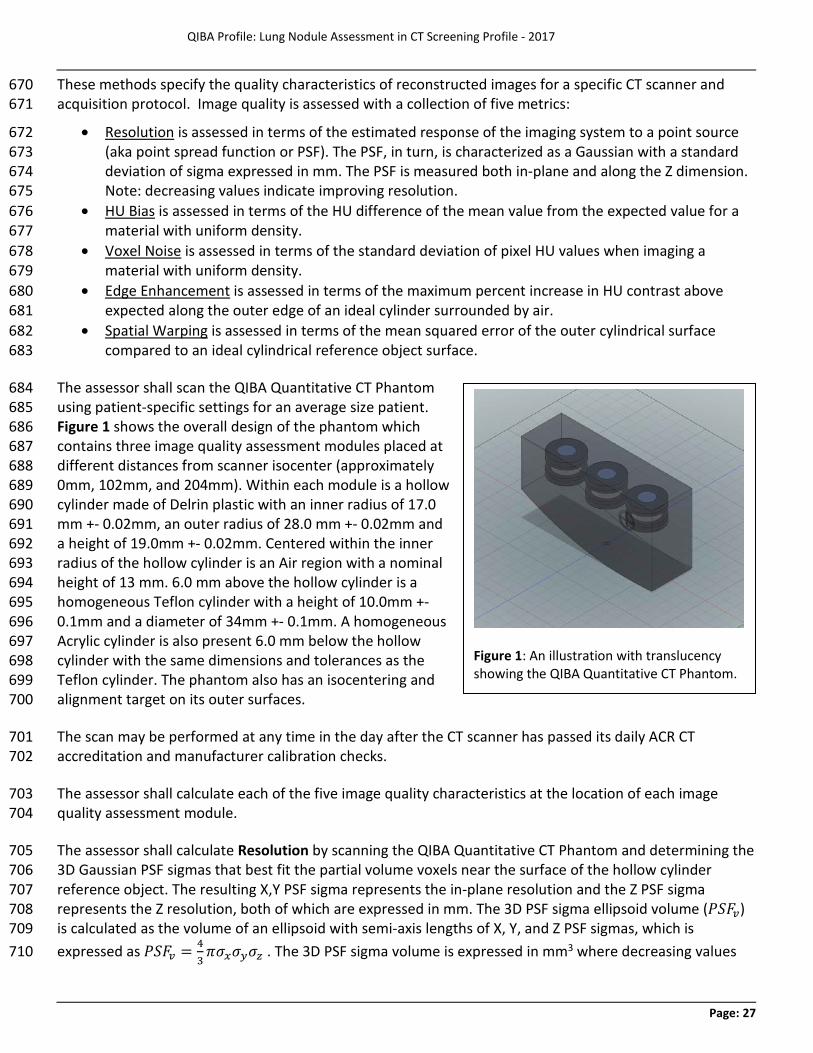
The assessor shall scan the QIBA Quantitative CT Phantom 684 using patient-specific settings for an average size patient. 685 Figure 1 shows the overall design of the phantom which 686 contains three image quality assessment modules placed at 687 different distances from scanner isocenter (approximately 688 0mm, 102mm, and 204mm). Within each module is a hollow 689 cylinder made of Delrin plastic with an inner radius of 17.0 690 mm +- 0.02mm, an outer radius of 28.0 mm +- 0.02mm and 691 a height of 19.0mm +- 0.02mm. Centered within the inner 692 radius of the hollow cylinder is an Air region with a nominal 693 height of 13 mm. 6.0 mm above the hollow cylinder is a 694 homogeneous Teflon cylinder with a height of 10.0mm +- 695 0.1mm and a diameter of 34mm +- 0.1mm. A homogeneous 696 Acrylic cylinder is also present 6.0 mm below the hollow 697 cylinder with the same dimensions and tolerances as the 698 Teflon cylinder. The phantom also has an isocentering and 699 alignment target on its outer surfaces. 700
The scan may be performed at any time in the day after the CT scanner has passed its daily ACR CT 701 accreditation and manufacturer calibration checks. 702
The assessor shall calculate each of the five image quality characteristics at the location of each image 703 quality assessment module. 704
The assessor shall calculate Resolution by scanning the QIBA Quantitative CT Phantom and determining the 705 3D Gaussian PSF sigmas that best fit the partial volume voxels near the surface of the hollow cylinder 706 reference object. The resulting X,Y PSF sigma represents the in-plane resolution and the Z PSF sigma 707 represents the Z resolution, both of which are expressed in mm. The 3D PSF sigma ellipsoid volume (𝑃𝑃𝑃𝑃𝑃𝑃𝑣𝑣) 708 is calculated as the volume of an ellipsoid with semi-axis lengths of X, Y, and Z PSF sigmas, which is 709 expressed as 𝑃𝑃𝑃𝑃𝑃𝑃𝑣𝑣 = 4
3𝜋𝜋𝜎𝜎𝑥𝑥𝜎𝜎𝑦𝑦𝜎𝜎𝑧𝑧 . The 3D PSF sigma volume is expressed in mm3 where decreasing values 710
Figure 1: An illustration with translucency showing the QIBA Quantitative CT Phantom.
QIBA Profile: Lung Nodule Assessment in CT Screening Profile – 2017
Page: 28
indicate improving resolution. The reference object is a concentric cylinder placed flat on an X-Z scanner 711 plane and the inner surface of concentric cylinder is used to determine both in-plane resolution and Z 712 resolution. A Modulation Transfer Function at a 50% cutoff frequency (MTF 50) value can be translated to 713 an In-plane Point Spread Function sigma using the following equation [53]: 714
𝜎𝜎𝑥𝑥𝑦𝑦 = �−2 ln𝑚𝑚02𝜋𝜋𝜇𝜇0
715
where 𝑚𝑚0 is the MTF frequency and 𝜇𝜇0 is the line pairs per millimeter. Thus, a conversion from PSF to MTF is: 716
𝑚𝑚0 = 𝑒𝑒−(𝜎𝜎𝑥𝑥𝑥𝑥𝜋𝜋𝜇𝜇0)2 717
The assessor shall calculate HU Bias for a particular material by first measuring the mean of HU density for 718 voxels that are within a reference object such that partial volume will NOT impact the measurement. Each 719 measured voxel must be > 2*sigma millimeters from the outer surface of the reference object to avoid bias 720 from partial volume artifact. The expected HU density of the material is then subtracted from the mean HU 721 value to arrive at the HU deviation. The materials measured are Teflon, Delrin, Acrylic, and air and the HU 722 deviation is expressed in HU. 723
The assessor shall calculate Voxel Noise by measuring the standard deviation of HU density for voxels that 724 are within a reference object such that partial volume will NOT impact the measurement. Each measured 725 voxel must be > 2*sigma millimeters from the outer surface of the concentric cylinder to avoid bias from 726 partial volume artifact. 727
The assessor shall calculate Edge Enhancement by measuring the mean HU density along a series of ± 10 728 degree circular arc shaped sampling paths with each path at varying radial distances from a hollow cylinder 729 center, centered on the X axis, and always inside the hollow cylinder reference object placed nominally flat 730 on an X-Z scanning plane. The maximum of the mean HU densities observed minus the measured mean HU 731 for Air represents the maximum observed contrast due to edge enhancement (EEm). The reference level of 732 edge enhancement (EEr) is calculated as the mean HU density for Delrin minus the measured mean HU for 733 Air. Once these are determined the final Edge Enhancement value is then calculated as 𝐸𝐸𝐸𝐸 = 𝐸𝐸𝐸𝐸𝑚𝑚
𝐸𝐸𝐸𝐸𝑟𝑟− 1. 734
The assessor shall calculate Spatial Warping by computing the mean square error (MSE) of the outer 735 cylindrical surface of the hollow Delrin cylinder with respect to the surface of an ideal geometric cylinder at 736 that location. The geometry of a perfect uncapped cylinder is used for the ideal reference object surface 737 and marching cubes with a threshold halfway between the measured mean Delrin HU density and the 738 measured mean Air HU density is used for the outer cylindrical surface. 739
4.1.2 Nodule Analysis Software Characteristics 740 These methods specify the minimum quality characteristics of a nodule measurement software application. 741 Measurement quality is assessed with two metrics: 742
· Measurement Bias is the deviation of the mean value from its true value for a set of volumetric 743 measurements. This metric is assessed by measuring the volume of repeat scans of geometric 744 objects, each with a manufactured and verified volume, where the objects have varying size and 745 shape. 746
QIBA Profile: Lung Nodule Assessment in CT Screening Profile - 2017
Page: 29
· Coefficient of Variation (CV) is a measure of variation for repeated volumetric measurements of an 747 object. It is calculated as the ratio of the standard deviation to the mean for a set of measurements. 748 This metric is assessed by measuring the volume of short-time interval repeat scans of nodules, 749 where the nodules have varying size, shape, and attachments as well as by measuring the volume of 750 geometric object scans. 751
752 The assessor shall obtain two sets of CT scans from the QIBA quality assurance site x.y.org. A “phantom 753 nodule dataset” contains 10 CT scans of a QIBA provided phantom with numerous geometric objects 754 embedded in foam. A “clinical nodule dataset” contains 5 repeat CT scans of 14 different lung nodules of 755 varying shape and size all acquired within a short time interval such that the amount of volumetric change 756 must be zero. 757 758 Two spreadsheet files are also provided at the x.y.org website. An “object location file” in *.xls format 759 contains the RAS coordinate locations of the geometric objects in the “phantom nodule dataset”. A 760 “measurement reporting file” in *.xls format is also provided with a volumetric measurement data entry 761 location for each object to be measured. 762 763 The assessor shall load each CT series in the “phantom nodule dataset” and the “clinical nodule dataset” 764 into the nodule measurement software and obtain a volumetric measurement. The assessor shall enter 765 each volumetric measurement into the “measurement reporting file” which will automatically verify that 766 the values reported are compliant. This will specifically verify that the bias for each volumetric 767 measurement of a geometric object is <= 5% of the object’s manufactured volume. The spreadsheet will 768 also verify that the coefficient of variation for both geometric objects and repeat lung nodules does not 769 exceed the values in Table 1. The assessor shall also enter the analysis software name and version number 770 into the “measurement reporting file” and upload the file to the QIBA quality assurance site x.y.org. The 771 specific version of the lung nodule analysis software will be considered compliant when at least two 772 independent clinical sites have successfully performed this procedure. 773 774 Sites can follow the vendor equipment procedure to verify conformance of software that is not on the list. 775
4.2. Equipment Vendor Conformance Procedures 776
Scanner and analysis software vendors will follow the assessment procedures in this section for a specific 777 model of equipment to achieve conformance with this profile. Although vendor assessment procedures will 778 use some of the same methods and tools as clinical sites, the assessment of vendor equipment is designed 779 to be more rigorous. The combination of thorough testing of equipment by vendors along with numerous 780 field test assessments by clinical sites is intended to help ensure that the claims of this profile will be met. 781
4.2.1 Scanner Vendor Assessment Procedure 782 Scanner vendors will first establish a set of preferred protocols (i.e. equipment settings) for clinical sites to 783 use on their equipment. Because slight modifications of a protocol setting (e.g. use of a different mA setting 784 for each patient) is permitted in this profile, scanner vendors are required to verify that the requirements 785 of this profile will still be met even when scanning with common protocol variations. A Design of 786 Experiments (DOE) approach will be used to evaluate the performance of a scanner under varying 787 conditions from each preferred protocol setting. 788 789
QIBA Profile: Lung Nodule Assessment in CT Screening Profile – 2017
Page: 30
The scanner vendor will perform the following steps to demonstrate that a specific scanner model is 790 conformant with this profile: 791 792
(1) Identify and use a single clinically operating CT scanner for the specific model being evaluated. 793 794
(2) Define one or more CT acquisition protocols that will be communicated to clinical sites as a 795 proposed vendor recommended acquisition protocol for this model scanner. Each proposed vendor 796 recommended acquisition protocol must meet the requirements of this profile and obtain a passing 797 automated image quality report according to the steps in section 4.3.1. 798 799
(3) For each vendor recommended acquisition protocol, a 24 full factorial DOE will be defined and 800 performed with variation on mAs, field of view, pitch, and iterative recon setting (if appropriate, 801 table height if not). The DOE will also have three repeat acquisitions for the recommended 802 acquisition protocol. For example, a recommended CT acquisition protocol with the following 803 settings: 804
805 mAs 40 806 kVp 100 807 Rotation Time (s) 0.50 808 Field of View (cm) 35.0 809 Pitch 1.50 810 Slice Thickness (mm) 1.00 811 Slice Spacing (mm) 0.75 812 Reconstruction Kernel I40-4 813 Table Height Centered 814 815
Table 2: Acquisition protocol example. 816 817 Will have a DOE with the following 19 experiments consisting of 3 repeat CT scans of the 818 recommended CT acquisition protocol (A,B,C) and 16 CT scans that systematically vary mAs, FOV, 819 Pitch, and an iterative reconstruction setting: 820 821 Experiment # mAs FOV Pitch Iterative Recon Setting Notes 822 A 40 30.0 1.50 I40-4 Repetition 1 823
01 30 30.0 1.25 I40-3 [ -, -. -, - ] 824 02 30 30.0 1.25 I40-5 [ -. -, -, + ] 825 03 30 30.0 1.75 I40-3 [ -. -, +, - ] 826 04 30 30.0 1.75 I40-5 [ -, -, +, + ] 827 05 30 40.0 1.25 I40-3 [ -, +, -, - ] 828 06 30 40.0 1.25 I40-5 [ -, +, -, + ] 829 07 30 40.0 1.75 I40-3 [ -, +, +, - ] 830 08 30 40.0 1.75 I40-5 [ -, +, +, + ] 831
B 40 35.0 1.50 I40-4 Repetition 2 832 09 50 30.0 1.25 I40-3 [ +, -. -, - ] 833
10 50 30.0 1.25 I40-5 [ +. -, -, + ] 834 11 50 30.0 1.75 I40-3 [ +. -, +, - ] 835
QIBA Profile: Lung Nodule Assessment in CT Screening Profile - 2017
Page: 31
12 50 30.0 1.75 I40-5 [ +, -, +, + ] 836 13 50 40.0 1.25 I40-3 [ +, +, -, - ] 837 14 50 40.0 1.25 I40-5 [ +, +, -, + ] 838 15 50 40.0 1.75 I40-3 [ +, +, +, - ] 839 16 50 40.0 1.75 I40-5 [ +, +, +, + ] 840 C 40 35.0 1.50 I40-4 Repetition 3 841 842 Table 3: Design of experiments example. 843 844
(4) For each experiment in the DOE the scanner vendor must meet the requirements of this profile and 845 obtain a passing automated image quality report according to the steps in section 4.3.1. Vendors 846 will be provided a facility to upload multiple scans for automated analysis. 847 848
(5) The scanner model and recommended acquisition protocol will be considered compliant with the 849 profile when all experiments in the full DOE have obtained a passing image quality report. The 850 variation tested in the DOE defines an operating envelope that the scanner model has been shown 851 to support. Vendors may wish to repeat DOE experiments to verify conformance with a wider 852 operating envelope and this may include the addition of DOE variables. 853
854 Each CT scanner model and recommended vendor acquisition protocol pair that completes these steps will 855 then each be listed by QIBA on x.y.org as a verified conformant CT scanner model and a recommended 856 acquisition protocol. 857
4.2.2 Analysis Software Vendor Assessment Procedure 858 Analysis software will be run against a set of testing datasets to assess that the volumetric measurement 859 software performs at a minimum level of performance. Datasets will include phantom scans containing 860 geometric objects of known volumes (i.e. phantom nodule dataset) as well as clinical zero change clinical 861 nodule datasets (i.e. clinical nodule dataset). The phantom nodule dataset and the clinical nodule dataset 862 will be available at x.y.org for download. In addition, a template analysis software measurement 863 spreadsheet for measurement findings will be available at x.y.org that provides the RAS location and data 864 placeholders for software calculated measurements. 865 866 Analysis software conformance testing is specific to the name and version number of an analysis software 867 system available to clinical sites for the measurement of CT lung nodules. 868 869 Analysis software testing of the phantom nodule dataset will consist of the following steps: 870 871
(1) Sequentially load each longitudinal CT series in the phantom nodule dataset into the analysis 872 software and perform automated or semi-automated segmentation of the nodule(s). 873 874
(2) Place each calculated volume measurement into the analysis software measurement spreadsheet. 875 As measurements are placed into the spreadsheet the bias and coefficient of variation of each 876 simulated nodule will be automatically calculated by the spreadsheet. 877 878
(3) After all measurements have been calculated all bias and coefficient of variation values must be 879 within acceptable limits for this profile. The phantom nodule dataset measurements must produce 880
QIBA Profile: Lung Nodule Assessment in CT Screening Profile – 2017
Page: 32
coefficients of variation no greater than those listed in Table 1. Volume bias may not exceed 5% of 881 the phantom nodule manufactured volume. 882
883 Analysis software testing of the clinical nodule dataset will consist of the following steps: 884 885
(1) Sequentially load each longitudinal CT series in the clinical nodule dataset into the analysis software 886 and perform automated or semi-automated segmentation of the nodule(s). 887 888
(2) Place each calculated volume measurement into the analysis software measurement spreadsheet. 889 As measurements are placed into the spreadsheet the coefficient of variation of each clinical nodule 890 will be automatically calculated by the spreadsheet. 891 892
(3) After all measurements have been calculated all coefficient of variation values must be within 893 acceptable limits for this profile. The clinical nodule dataset measurements must produce 894 coefficients of variation no greater than those listed in Table 1. 895
896 Analysis software (including version number) that completes these steps will then be listed by QIBA on 897 x.y.org as a verified conformant nodule analysis software. 898 899
QIBA Profile: Lung Nodule Assessment in CT Screening Profile - 2017
Page: 33
4.3. Clinical Site Conformance Procedure 900
Conformance to this profile is designed to be performed by a clinical site by following the steps below. 901 Detailed technical information on profile requirements is provided in Section 3. 902
Technical assessment at a clinical site is performed in two main steps. The Technical Assessment To 903 Prepare For Lung Nodule Measurement (Section 4.3.1) verifies that the vendor equipment to be used at 904 the clinical site, including the image acquisition protocol, complies with this profile. The Performing Lung 905 Nodule Measurement (Section 4.3.2) outlines the verification steps needed for lung nodule analysis. 906
4.3.1 Preparing For Lung Nodule Measurement 907 (1) CT Scanner and Lung Nodule Analysis Software Verification 908
For each analysis software application to be used for lung cancer screening nodule measurement: 909
(a) Verify that your CT scanner manufacturer and model name is on this QIBA verified list at x.y.org. 910 (b) Verify that your software name, including version number, is on this QIBA verified list at x.y.org. 911
(2) CT QA and Lung Screening Protocol Verification 912 For each CT scanner to be used for lung cancer screening nodule measurement: 913
(a) Verify that your CT scanner is consistently following ACR CT accreditation and manufacturer 914 installation and maintenance requirements. 915
(b) Establish a CT lung cancer screening protocol and save it on the CT scanner. You may use your 916 existing lung screening protocol or pick a protocol from a continuously updated list provided by 917 QIBA at x.y.org. 918
(c) CT scan the QIBA CT lung nodule phantom with the saved CT lung screening protocol. 919
(d) Submit the CT lung nodule phantom scan to x.y.org and obtain a passing automated image quality 920 report. If you do not receive a passing report, repeat steps 2(b) to 2(d) until a passing report is 921 obtained. 922
4.3.2 Performing Lung Nodule Measurement 923 (1) CT Data Acquisition, Lung Nodule, and Segmentation Verification 924
For each CT lung cancer screening and solid lung nodule follow-up CT scan: 925
(a) Verify that the patient did not receive IV contrast as part of the CT study. 926
(b) Visually verify that the nodule is solid, not attached to large vessels or other structures, has a 927 largest diameter between 6mm and 10mm, and that the saved CT lung nodule protocol was used 928 at all nodule scanning time points to be volume measured. 929
(c) Visually verify that significant artifacts (e.g. motion, streaking) are not present and that image 930 noise is not excessive at the location of the solid nodule to be measured. 931
(d) Visually verify that the measurement of the solid nodule is free of segmentation issues. 932
(2) Obtain Volumetric Nodule Measurement Guidance 933 For each series of CT lung nodule measurements consisting of one or more time points: 934
Use the QIBA lung nodule profile on-line calculator at x.y.org for guidance on levels of volumetric 935 measurement error for each lung nodule measurement and change measurement. 936
QIBA Profile: Lung Nodule Assessment in CT Screening Profile – 2017
Page: 34
References 937
1. Henschke CI, Yankelevitz DF, Libby DM, Pasmantier MW, Smith JP, Miettinen OS. Survival of patients with 938 stage I lung cancer detected on CT screening. N Engl J Med. 2006; 355(17):1763-71. 939 2. Aberle DR, Adams AM, Berg CD, et al. Reduced lung-cancer mortality with low-dose computed tomographic 940 screening. N Engl J Med. 2011; 365(5):395-409. 941 3. Yankelevitz DF, Reeves AP, Kostis WJ, Zhao B, Henschke CI. Small pulmonary nodules: volumetrically 942 determined growth rates based on CT evaluation. Radiology. 2000; 217(1):251-6. 943 4. Bolte H, Jahnke T, Schafer FK, et al. Interobserver-variability of lung nodule volumetry considering different 944 segmentation algorithms and observer training levels. Eur J Radiol. 2007; 64(2):285-95. 945 5. Gierada DS, Pilgram TK, Ford M, et al. Lung cancer: interobserver agreement on interpretation of pulmonary 946 findings at low-dose CT screening. Radiology. 2008; 246(1):265-72. 947 6. van Klaveren RJ, Oudkerk M, Prokop M, et al. Management of lung nodules detected by volume CT scanning. 948 N Engl J Med. 2009; 361(23):2221-9. 949 7. Singh S, Pinsky P, Fineberg NS, et al. Evaluation of reader variability in the interpretation of follow-up CT 950 scans at lung cancer screening. Radiology. 2011; 259(1):263-70. 951 8. Petrick N, Kim HJ, Clunie D, et al. Comparison of 1D, 2D, and 3D nodule sizing methods by radiologists for 952 spherical and complex nodules on thoracic CT phantom images. Acad Radiol. 2014; 21(1):30-40. 953 9. Mulshine JL, Gierada DS, Armato SG, 3rd, et al. Role of the Quantitative Imaging Biomarker Alliance in 954 optimizing CT for the evaluation of lung cancer screen-detected nodules. Journal of the American College of 955 Radiology : JACR. 2015; 12(4):390-5. 956 10. Das M, Muhlenbruch G, Katoh M, et al. Automated volumetry of solid pulmonary nodules in a phantom: 957 accuracy across different CT scanner technologies. Invest Radiol. 2007; 42(5):297-302. 958 11. Ravenel JG, Leue WM, Nietert PJ, Miller JV, Taylor KK, Silvestri GA. Pulmonary nodule volume: effects of 959 reconstruction parameters on automated measurements--a phantom study. Radiology. 2008; 247(2):400-8. 960 12. Goo JM, Tongdee T, Tongdee R, Yeo K, Hildebolt CF, Bae KT. Volumetric measurement of synthetic lung 961 nodules with multi-detector row CT: effect of various image reconstruction parameters and segmentation thresholds 962 on measurement accuracy. Radiology. 2005; 235(3):850-6. 963 13. Chen B, Barnhart H, Richard S, Colsher J, Amurao M, Samei E. Quantitative CT: technique dependence of 964 volume estimation on pulmonary nodules. Physics in medicine and biology. 2012; 57(5):1335-48. 965 14. Larici AR, Storto ML, Torge M, et al. Automated volumetry of pulmonary nodules on multidetector CT: 966 influence of slice thickness, reconstruction algorithm and tube current. Preliminary results. La Radiologia medica. 967 2008; 113(1):29-42. 968 15. Xie X, Willemink MJ, de Jong PA, et al. Small irregular pulmonary nodules in low-dose CT: observer detection 969 sensitivity and volumetry accuracy. AJR Am J Roentgenol. 2014; 202(3):W202-9. 970 16. Willemink MJ, Leiner T, Budde RP, et al. Systematic error in lung nodule volumetry: effect of iterative 971 reconstruction versus filtered back projection at different CT parameters. AJR Am J Roentgenol. 2012; 199(6):1241-6. 972 17. Wielputz MO, Lederlin M, Wroblewski J, et al. CT volumetry of artificial pulmonary nodules using an ex vivo 973 lung phantom: influence of exposure parameters and iterative reconstruction on reproducibility. Eur J Radiol. 2013; 974 82(9):1577-83. 975 18. Chen B, Barnhart H, Richard S, Robins M, Colsher J, Samei E. Volumetric quantification of lung nodules in CT 976 with iterative reconstruction (ASiR and MBIR). Med Phys. 2013; 40(11):111902. 977 19. Wormanns D, Kohl G, Klotz E, et al. Volumetric measurements of pulmonary nodules at multi-row detector 978 CT: in vivo reproducibility. Eur Radiol. 2004; 14(1):86-92. 979 20. Goodman LR, Gulsun M, Washington L, Nagy PG, Piacsek KL. Inherent variability of CT lung nodule 980 measurements in vivo using semiautomated volumetric measurements. AJR Am J Roentgenol. 2006; 186(4):989-94. 981 21. Gietema HA, Schaefer-Prokop CM, Mali WP, Groenewegen G, Prokop M. Pulmonary nodules: Interscan 982 variability of semiautomated volume measurements with multisection CT-- influence of inspiration level, nodule size, 983 and segmentation performance. Radiology. 2007; 245(3):888-94. 984 22. Rampinelli C, De Fiori E, Raimondi S, Veronesi G, Bellomi M. In vivo repeatability of automated volume 985
QIBA Profile: Lung Nodule Assessment in CT Screening Profile - 2017
Page: 35
calculations of small pulmonary nodules with CT. AJR Am J Roentgenol. 2009; 192(6):1657-61. 986 23. de Hoop B, Gietema H, van Ginneken B, Zanen P, Groenewegen G, Prokop M. A comparison of six software 987 packages for evaluation of solid lung nodules using semi-automated volumetry: what is the minimum increase in size 988 to detect growth in repeated CT examinations. Eur Radiol. 2009; 19(4):800-8. 989 24. Marchiano A, Calabro E, Civelli E, et al. Pulmonary nodules: volume repeatability at multidetector CT lung 990 cancer screening. Radiology. 2009; 251(3):919-25. 991 25. Ko JP, Berman EJ, Kaur M, et al. Pulmonary Nodules: growth rate assessment in patients by using serial CT 992 and three-dimensional volumetry. Radiology. 2012; 262(2):662-71. 993 26. ACR-STR. ACR-STR practice parameter for the performance and reporting of lung cancer screening thoracic 994 computed tomography (CT). 2014. 995 27. Goo JM, Kim KG, Gierada DS, Castro M, Bae KT. Volumetric measurements of lung nodules with multi-996 detector row CT: effect of changes in lung volume. Korean J Radiol. 2006; 7(4):243-8. 997 28. Petkovska I, Brown MS, Goldin JG, et al. The effect of lung volume on nodule size on CT. Acad Radiol. 2007; 998 14(4):476-85. 999 29. Coenen A, Honda O, van der Jagt EJ, Tomiyama N. Computer-assisted solid lung nodule 3D volumetry on CT: 1000 influence of scan mode and iterative reconstruction: a CT phantom study. Japanese journal of radiology. 2013; 1001 31(10):677-84. 1002 30. Lee CH, Goo JM, Ye HJ, et al. Radiation dose modulation techniques in the multidetector CT era: from basics 1003 to practice. Radiographics. 2008; 28(5):1451-9. 1004 31. Nietert PJ, Ravenel JG, Leue WM, et al. Imprecision in automated volume measurements of pulmonary 1005 nodules and its effect on the level of uncertainty in volume doubling time estimation. Chest. 2009; 135(6):1580-7. 1006 32. Gavrielides MA, Zeng R, Myers KJ, Sahiner B, Petrick N. Benefit of overlapping reconstruction for improving 1007 the quantitative assessment of CT lung nodule volume. Acad Radiol. 2013; 20(2):173-80. 1008 33. Willemink MJ, de Jong PA, Leiner T, et al. Iterative reconstruction techniques for computed tomography Part 1009 1: technical principles. Eur Radiol. 2013; 23(6):1623-31. 1010 34. Willemink MJ, Borstlap J, Takx RA, et al. The effects of computed tomography with iterative reconstruction 1011 on solid pulmonary nodule volume quantification. PloS one. 2013; 8(2):e58053. 1012 35. Revel MP, Lefort C, Bissery A, et al. Pulmonary nodules: preliminary experience with three-dimensional 1013 evaluation. Radiology. 2004; 231(2):459-66. 1014 36. Petrou M, Quint LE, Nan B, Baker LH. Pulmonary nodule volumetric measurement variability as a function of 1015 CT slice thickness and nodule morphology. AJR Am J Roentgenol. 2007; 188(2):306-12. 1016 37. Wang Y, van Klaveren RJ, van der Zaag-Loonen HJ, et al. Effect of nodule characteristics on variability of 1017 semiautomated volume measurements in pulmonary nodules detected in a lung cancer screening program. 1018 Radiology. 2008; 248(2):625-31. 1019 38. Hein PA, Romano VC, Rogalla P, et al. Linear and volume measurements of pulmonary nodules at different CT 1020 dose levels - intrascan and interscan analysis. RoFo : Fortschritte auf dem Gebiete der Rontgenstrahlen und der 1021 Nuklearmedizin. 2009; 181(1):24-31. 1022 39. Hein PA, Romano VC, Rogalla P, et al. Variability of semiautomated lung nodule volumetry on ultralow-dose 1023 CT: comparison with nodule volumetry on standard-dose CT. J Digit Imaging. 2010; 23(1):8-17. 1024 40. Gietema HA, Wang Y, Xu D, et al. Pulmonary nodules detected at lung cancer screening: interobserver 1025 variability of semiautomated volume measurements. Radiology. 2006; 241(1):251-7. 1026 41. QIBA-Performance-Working-Group. Review of Statistical Methods for Technical Performance Assessment. 1027 Submitted to SMMR. 2014. 1028 42. Bland JM, Altman DG. Statistical methods for assessing agreement between two methods of clinical 1029 measurement. Lancet. 1986; 1(8476):307-10. 1030 43. Bland JM, Altman DG. Measuring agreement in method comparison studies. Statistical methods in medical 1031 research. 1999; 8(2):135-60. 1032 44. Barnhart HX, Barboriak DP. Applications of the repeatability of quantitative imaging biomarkers: A review of 1033 statistical analysis of repeat data sets. Translational Oncology. 2009; 2(4):231-5. 1034 45. Lin LI. A concordance correlation coefficient to evaluate reproducibility. Biometrics. 1989; 45(1):255-68. 1035
QIBA Profile: Lung Nodule Assessment in CT Screening Profile – 2017
Page: 36
46. CT-Volumetry-Technical-Committee. QIBA Profile: CT Tumor Volume Change v2.2 Reviewed Draft (Publicly 1036 Reviewed Version) Available at: http://rsna.org/uploadedFiles/RSNA/Content/Science_and_Education/QIBA/QIBA-1037 CT%20Vol-TumorVolumeChangeProfile_v2.2_ReviewedDraft_08AUG2012.pdf. 1038 47. Warfield SK, Zou KH, Wells WM. Simultaneous truth and performance level estimation (STAPLE): an algorithm 1039 for the validation of image segmentation. IEEE Trans Med Imaging. 2004; 23(7):903-21. 1040 48. Rohlfing T, Russakoff DB, Maurer CR, Jr. Performance-based classifier combination in atlas-based image 1041 segmentation using expectation-maximization parameter estimation. IEEE Trans Med Imaging. 2004; 23(8):983-94. 1042 49. Jaccard P. The distribution of the flora in the alpine zone. New Phytologist. 1912; 11:37-50. 1043 50. Sorensen R. A method of establishing groups of equal amplitude in plant sociology based on similarity of 1044 species and its application to analyses of the vegetation on Danish commons. Nordisk medicin. 1948; 40(51):2389. 1045 51. Dice L. Measures of the Amount of Ecologic Association Between Species. Ecology. 1945; 26(3):297-302. 1046 52. Henschke C, Yankelevitz D, Yip, R, Archer V, Zahlmann G, Krishnan K, Helba B, Avila R. Tumor volume 1047 measurement error using computed tomography imaging in a phase II clinical trial in lung cancer. J. Med. Imag. 3(3), 1048 035505 (Sep 20, 2016). 1049 53. Wang G, Cheng PC, Vannier MW. Spiral CT refines temporal bone imaging. Diagnostic Imag., vol 15, pp 116-1050 121, 1993. 1051 1052 Additional References: 1053 1054 52. Gavrielides MA, Li Q, Zeng R, Myers KJ, Sahiner B, Petrick N. Minimum detectable change in lung nodule 1055 volume in a phantom CT study. Acad Radiol. 2013; 20(11):1364-70. 1056 53. Bolte H, Riedel C, Jahnke T, et al. Reproducibility of computer-aided volumetry of artificial small pulmonary 1057 nodules in ex vivo porcine lungs. Invest Radiol. 2006; 41(1):28-35. 1058 54. Bolte H, Riedel C, Muller-Hulsbeck S, et al. Precision of computer-aided volumetry of artificial small solid 1059 pulmonary nodules in ex vivo porcine lungs. Br J Radiol. 2007; 80(954):414-21. 1060 55. Wang Y, de Bock GH, van Klaveren RJ, et al. Volumetric measurement of pulmonary nodules at low-dose 1061 chest CT: effect of reconstruction setting on measurement variability. Eur Radiol. 2010; 20(5):1180-7. 1062 56. Bolte H, Riedel C, Knoss N, et al. Computed tomography-based lung nodule volumetry--do optimized 1063 reconstructions of routine protocols achieve similar accuracy, reproducibility and interobserver variability to that of 1064 special volumetry protocols? RoFo : Fortschritte auf dem Gebiete der Rontgenstrahlen und der Nuklearmedizin. 1065 2007; 179(3):276-81. 1066 57. de Jong PA, Leiner T, Lammers JW, Gietema HA. Can low-dose unenhanced chest CT be used for follow-up of 1067 lung nodules? AJR Am J Roentgenol. 2012; 199(4):777-80. 1068 58. Christe A, Torrente JC, Lin M, et al. CT screening and follow-up of lung nodules: effects of tube current-time 1069 setting and nodule size and density on detectability and of tube current-time setting on apparent size. AJR Am J 1070 Roentgenol. 2011; 197(3):623-30. 1071 59. Honda O, Sumikawa H, Johkoh T, et al. Computer-assisted lung nodule volumetry from multi-detector row 1072 CT: influence of image reconstruction parameters. Eur J Radiol. 2007; 62(1):106-13. 1073 60. Young S, Kim HJ, Ko MM, Ko WW, Flores C, McNitt-Gray MF. Variability in CT lung-nodule volumetry: Effects 1074 of dose reduction and reconstruction methods. Med Phys. 2015; 42(5):2679-89. 1075 61. Ashraf H, de Hoop B, Shaker SB, et al. Lung nodule volumetry: segmentation algorithms within the same 1076 software package cannot be used interchangeably. Eur Radiol. 2010; 20(8):1878-85. 1077 62. Christe A, Bronnimann A, Vock P. Volumetric analysis of lung nodules in computed tomography (CT): 1078 comparison of two different segmentation algorithm softwares and two different reconstruction filters on automated 1079 volume calculation. Acta Radiol. 2014; 55(1):54-61. 1080 63. Zhao YR, Ooijen PM, Dorrius MD, et al. Comparison of three software systems for semi-automatic volumetry 1081 of pulmonary nodules on baseline and follow-up CT examinations. Acta Radiol. 2013; 55(6):691-8. 1082 64. Gavrielides MA, Kinnard LM, Myers KJ, Petrick N. Noncalcified lung nodules: volumetric assessment with 1083 thoracic CT. Radiology. 2009; 251(1):26-37. 1084 65. Marten K, Engelke C. Computer-aided detection and automated CT volumetry of pulmonary nodules. Eur 1085
QIBA Profile: Lung Nodule Assessment in CT Screening Profile - 2017
Page: 37
Radiol. 2007; 17(4):888-901. 1086 66. Boll DT, Gilkeson RC, Fleiter TR, Blackham KA, Duerk JL, Lewin JS. Volumetric assessment of pulmonary 1087 nodules with ECG-gated MDCT. AJR Am J Roentgenol. 2004; 183(5):1217-23. 1088
(52-66) 1089
Appendices 1090
Appendix A: Acknowledgements and Attributions 1091
This document is proffered by the Radiological Society of North America (RSNA) Lung Nodule Volume 1092 Assessment and Monitoring in Low Dose CT Screening Working Group of the Volumetric Computed 1093 Tomography (v-CT) Technical Committee. The group is composed of scientists representing academia, the 1094 imaging device manufacturers, image analysis tool software developers, image analysis laboratories, 1095 biopharmaceutical industry, government research organizations, professional societies, and regulatory 1096 agencies, among others. All work is classified as pre-competitive. 1097
A more detailed description of the v-CT committee and its work can be found at the following web link: 1098 http://qibawiki.rsna.org/index.php?title=Quantitative-CT. 1099
The Lung Nodule Volume Assessment and Monitoring in Low Dose CT Screening Working Group (in 1100 alphabetical order): 1101
Denise Aberle, MD University of California, Los Angeles (UCLA) 1102 Samuel G. Armato III, PhD University of Chicago 1103 Ricardo Avila, MS Accumetra, LLC 1104 Roshni Bhagalia, PhD GE Global Research 1105 Matthew Blum, MD, FACS University of Colorado Health 1106 Kirsten L. Boedeker, PhD Toshiba Medical Research Institute-USA, Inc. 1107 Andrew J. Buckler, MS Elucid Bioimaging Inc. 1108 Paul L. Carson, PhD University of Michigan Medical Center 1109 Dominic Crotty, PhD GE Healthcare 1110 Harry de Koning, MD, PhD Erasmus University Medical Center 1111 Ekta N. Dharaiya, MS Philips Healthcare 1112 Les Folio, DO, MPH National Institutes of Health (NIH) 1113 Matthew Fuld, PhD Siemens AG Healthcare 1114 Kavita Garg, MD University of Colorado, Denver 1115 David S. Gierada, MD Washington University, Mallinckrodt Institute of Radiology 1116 Fergus Gleeson, MBBS Churchill Hospital--Headington, (Oxford, UK) / British Society of 1117
Thoracic Imaging 1118 Gregory V. Goldmacher, MD, PhD, MBA Merck 1119 Jin Mo Goo, MD, PhD Seoul National University Hospital (South Korea) 1120 Tomasz Grodzki, MD, FETCS Regional Hospital for Lung Diseases/European Society of 1121
Thoracic Surgeons (Poland) 1122 Bernice E. Hoppel, PhD Toshiba Medical Research Institute USA, Inc. 1123 Edward F. Jackson, PhD University of Wisconsin, School of Medicine & Public Health 1124
QIBA Profile: Lung Nodule Assessment in CT Screening Profile – 2017
Page: 38
Philip F. Judy, PhD Harvard-Brigham and Women's Hospital 1125 Ella A. Kazerooni, MD University of Michigan 1126 David A. Lynch, MD National Jewish Health 1127 Ashkan A. Malayeri, MD NIH/CC/DRD 1128 Theresa C. McLoud, MD Massachusetts General Hospital/Society for Thoracic Radiology 1129 Michael McNitt-Gray, PhD University of California, Los Angeles (UCLA) 1130 Steve Metz, PhD Philips 1131 James L. Mulshine, MD Rush University Medical Center 1132 Reginald Munden, MD, DMD, MBA Houston Methodist Hospital-Physician Organization 1133 Nancy Obuchowski, PhD Cleveland Clinic Foundation 1134 Michael O’Connor, MBA, PhD PAREXEL International 1135 Matthijs Oudkerk, MD, PhD University Medical Center Groningen (the Netherlands) 1136 Eric S. Perlman, MD Perlman Advisory Group, LLC 1137 Mathias Prokop, MD, PhD Radboud University Medical Center (Nijmegen, the Netherlands) 1138 James G. Ravenel, MD Medical University of South Carolina 1139 Anthony P. Reeves, PhD Cornell University 1140 Marthony Robins, PhD Duke University 1141 Ehsan Samei, PhD Duke University 1142 Lawrence H. Schwartz, MD New York Presbyterian Hospital/Columbia University Medical Center 1143 Jenifer Siegelman, MD, MPH Harvard Medical School Brigham and Women's Hospital 1144 Mario Silva, MD University of Parma (Italy) 1145 Gary Smith, MD Vanderbilt University 1146 Daniel C. Sullivan, MD Duke University 1147 Rozemarijn Vliegenthart, MD, PhD University Medical Center Groningen (the Netherlands) 1148 David F. Yankelevitz, MD Mount Sinai Hospital 1149 Lifeng Yu, PhD Mayo Clinic 1150
The Lung Nodule Volume Assessment and Monitoring in Low Dose CT Screening Working Group is deeply 1151 grateful for the support and technical assistance provided by the staff of the Radiological Society of North 1152 America: 1153
Fiona Miller, Director Department of Research 1154 Joseph Koudelik, Assistant Director Scientific Affairs, Department of Research 1155 Julie Lisiecki, Manager Scientific Affairs, Department of Research 1156 Susan Weinmann, Senior Administrative Assistant Department of Research 1157 1158
QIBA Profile: Lung Nodule Assessment in CT Screening Profile - 2017
Page: 39
Appendix B: Background Information 1159
1160
B.1 Summary of selected references on nodule volumetry accuracy 1161
http://qibawiki.rsna.org/index.php/Work_Product_for_Review 1162 1163
B.2 Summary of selected references on nodule volumetry precision 1164
http://qibawiki.rsna.org/index.php/Work_Product_for_Review 1165 1166
QIBA Profile: Lung Nodule Assessment in CT Screening Profile – 2017
Page: 40
Appendix C: Metrology Methods 1167
Obuchowski NA, Buckler A, Kinahan PE, Chen-Mayer H, Petrick N, Barboriak DP, Bullen J, Barnhart H, 1168 Sullivan DC. Statistical Issues in Testing Conformance with the Quantitative Imaging Biomarker Alliance 1169 (QIBA) Profile Claims. Academic Radiology in press. 1170
Kessler LG, Barnhart HX, Buckler AJ, et al. The emerging science of quantitative imaging biomarkers: 1171 terminology and definitions for scientific studies and for regulatory submissions. SMMR 2015; 24: 9-26. 1172 1173 Raunig D, McShane LM, Pennello G, et al. Quantitative imaging biomarkers: a 235 review of statistical 1174 methods for technical performance assessment. SMMR 2015; 24: 27- 67. 1175 1176 Obuchowski NA, Reeves AP, Huang EP, et al. Quantitative Imaging Biomarkers: A Review of Statistical 1177 Methods for Computer Algorithm Comparisons. SMMR 2015; 24: 240 68-106. 1178
Recommended