RENEWED FOR THE FUTURE.
Report on business operations of Sava d.d. and the Sava Group
in the period January–September 2015
I Business operations of Sava d.d. and the Sava Group, Januay – September 2015 I
2
TABLE OF CONTENT
INTRODUCTORY EXPLANATION ........................................................................................................................................ 3
SUMMARY OF BUSINESS OPERATIONS IN THE PERIOD JANUARY–SEPTEMBER 2015 ...................................................... 4
THE COURSE OF COMPULSORY SETTLEMENT PROCEEDINGS AGAINST SAVA D.D. .......................................................... 5
1. BUSINESS REPORT FOR SAVA d.d. AND THE SAVA GROUP AS AT 30 SEPTEMBER 2015............................................ 6
1.1. Major data about Sava d.d. ....................................................................................................................................... 6
1.2. Composition of the Sava Group ................................................................................................................................. 7
1.3. The Sava share and ownership structure .................................................................................................................. 7
1.4. Business operations of Sava d.d. ............................................................................................................................. 11
1.5. Business operations of the Sava Group ................................................................................................................... 16
2. FINANCIAL STATEMENTS AS AT 30 SEPTEMBER 2015 ............................................................................................. 20
2.1. Financial statements of Sava d.d. as at 30 September 2015 ................................................................................... 20
2.2. Consolidated financial statements of the Sava Group as at 30 September 2015 ................................................... 27
I Business operations of Sava d.d. and the Sava Group, Januay – Septemer 2015 I
3
INTRODUCTORY EXPLANATION
Based on the provisions of the Rules of the Ljubljana Stock Exchange d.d. and the applicable legislation, Sava d.d.,
Dunajska cesta 152, 1000 Ljubljana, informs its shareholders and a broader public about business operations of the
Sava Group and Sava d.d. in the period January–September 2015.
On 10 June 2015, the District Court in Ljubljana issued an order on initiating the compulsory settlement proceedings
against the debtor Sava d.d. Based on the appeal against the order on initiating the compulsory settlement
proceedings lodged by Družba za upravljanje terjatev bank, d.d, Ljubljana (hereinafter: BAMC). The Higher Court in
Ljubljana granted the appeal on 23 July 201; the Higher Court made an order that annulled the contested order and
returned the matter to the court of first instance into further procedure.
As proposed by all the applicants (8 creditors), the District Court in Ljubljana issued a new order on initiating the
compulsory settlement proceedings against the debtor Sava d.d. on 16 September 2015 and called upon the
applicants to cooperate constructively. On 16 September 2015, the District Court announced the beginning of the
compulsory settlement proceedings against the debtor Sava d.d. On 28 October 2015, the District Court in Ljubljana
issued an order on dismissal of Matjaž Nanut from the administrator’s function and appointed a new administrator,
Leon Benigar Tošič, who will carry out the administrator’s tasks and competencies through the Law Firm Benigar Tošič
d.o.o.
In accordance with the provisions of the ZFPPIPP Act, a proposal for initiating the compulsory settlement proceedings
is being prepared whose constituent will be the audited Report on financial position and business operations of the
debtor as per cut-off date, 31 March 2015.
The drafted effects of assets appraisal have influenced the financial statements as per cut-off date, 31 March 2015,
and thus the financial statements of Sava d.d. and the Sava Group as per 30 September 2015.
The financial statements of the Sava Group have been compiled in accordance with International Financial Reporting
Standards as adopted by the EU and have not been audited. The financial statements of Sava d.d. have been compiled
in accordance with Slovene Accounting Standards and have not been audited.
The Management Board of Sava d.d. briefed the Supervisory Board of the company about the business operations of
the Sava Group and the parent company Sava d.d. in the period January–September 2015.
Significant changes in the data included in the Stock Exchange prospectus are announced in the Ljubljana Stock
Exchange electronic information system SEOnet on an on-going basis. The announcement can be accessed also on the
official company website at www.sava.si as of the announcement date, i.e. 19 November 2015. The announcement
will remain posted on the company website for at least 5 years.
I Business operations of Sava d.d. and the Sava Group, Januay – September 2015 I
4
SUMMARY OF BUSINESS OPERATIONS IN THE PERIOD JANUARY–SEPTEMBER 2015
As at 30 September 2015, the Sava Group included nine companies: the parent company Sava d.d. and eight
subsidised companies – daughter companies and sub-subsidiaries. The core businesses of the Sava Group are
managing financial investments of Sava d.d., with its major investment in the banking sector, and tourism.
The Group’s parent company, Sava d.d., is undergoing compulsory settlement proceedings. In the period January–
September 2015, Sava d.d. operated with a loss of €23.3 million. The balance sheet total amounted to €193.1 million.
The assets and liabilities structure did not change significantly with regard to the end of 2014.
Pursuant to the provisions of the ZFPPIPP Act in connection with the compulsory settlement proceedings, the
evaluation of the assets owned by the debtor Sava d.d. is in its final phase. The drafted effects of assets appraisal were
included in the financial statements as at 31 March 2015, which influenced the submitted financial statements of the
Sava Group.
By means of a decision issued on 17 September 2015, the Bank of Slovenia withdrew from Sava d.d. the authorization
for acquisition of a qualifying stake in Gorenjska banka, d.d., namely the total share of voting rights and the share in
the bank’s capital, and ordered the shares of Gorenjska banka d.d. be disposed within 6 months. Sava d.d. began the
procedure of judicial protection.
In nine months of 2015, sales revenues of the companies of the Sava Group, which were mainly generated in
Tourism companies, amounted to €50.8 million and were 5% up year-on-year and outperformed the plan by 2%. A net
loss of €13.6 million was generated. The Tourism companies generated a net profit of €5.1 million, whereas Sava d.d.
made a net loss, which is part of consolidated financial statements, to the amount of €18.6 million. The companies of
other operations made a loss of €0.1 million.
The Tourism Group surpassed expectations for this year’s nine months; it made an operating income of €51.6 million,
which was up 6% year-on-year and 3% better than planned for the period. The hotels and apartments realised
644,665 overnights, or up 4% year-on-year. The campsites improved their last year’s result by 6%. In accordance with
the adopted strategy, the Health business showed positive trends with a 28% increase in provided health services
compared to last year.
The Tourism Group efficiently rationalised its costs, too. Operating expenses in Tourism companies amounted to €44.8
million; in spite of higher sales revenues, these equalled the level of the same period last year. Tourism companies
generated an operating profit of €6.8 million, EBITDA of €11.2 million and the EBITDA margin of 22.4%. Year-on-year
EBITDA was up by €2.5 million, and the EBITDA margin by 3.9 percentage points. Both indicators outperformed the
planned values.
The companies of the Sava Group made investments totalling €4.8 million, which were entirely realised in Tourism
companies.
I Business operations of Sava d.d. and the Sava Group, Januay – Septemer 2015 I
5
THE COURSE OF COMPULSORY SETTLEMENT PROCEEDINGS AGAINST SAVA D.D.
On 1 June 2015, the District Court in Ljubljana made an order on existence of the reasons for discontinuing the
preventive restructuring proceedings against the debtor Sava d.d. (public announcement on the Ajpes website on 2
June 2015).
On 2 June 2015, the creditors – Gorenjska banka, d.d., Kranj, Zavarovalnica Triglav, d.d., Ljubljana, Unicredit banka
Slovenija, Ljubljana, Pokojninska družba A, Ljubljana, Skupna pokojninska družba d.d., Ljubljana (two funds) and
Skupna d.d., Ljubljana – lodged an application before the District Court in Ljubljana on initiating the compulsory
settlement proceedings against the debtor Sava d.d. (public announcement on the Ajpes website on 6 June 2015).
On 4 June 2015, the District Court in Ljubljana made an order on appointing the administrator of compulsory
settlement proceedings. As proposed by the group of creditors on 2 June 2015, Matjaž Nanut was appointed the
administrator and will carry out administrator’s tasks and competencies through the Law firm Nanut Nanut, d.o.o.
(public announcement on the Ajpes website on 4 June 2015).
On 10 June2015, the creditor, BAMC, Ljubljana, lodged an application for initiating the compulsory settlement
proceedings against the debtor Sava d.d. (public announcement on the Ajpes website on 23 June 2015).
On 10 June 2015, the District Court in Ljubljana made an order on initiating the compulsory settlement proceedings
against the debtor Sava d.d. (public announcement on the Ajpes website on 10 June 2015).
On 10 June 2015, the District Court in Ljubljana announced the initiation of compulsory settlement proceedings
against the debtor Sava d.d. (public announcement on the Ajpes website on 10 June 2015).
On 22 June 2015, the District Court in Ljubljana made an order, based on which the procedures with the applicants’
proposals for initiating the compulsory settlement proceedings were combined in further dealing with the matter St
2868/2015 (public announcement on the Ajpes website on 23 June 2015).
On 23 July 2015, the Higher Court in Ljubljana made an order, based on which it granted the appeal lodged by the
debtor and seven creditors applicants. By doing this, the Higher Court annulled the order by the court of first instance
on combining the two creditors’ applications for initiating the compulsory settlement proceedings (public
announcement on the Ajpes website on 30 July 2015).
On 23 July 2015, the Higher Court in Ljubljana made an order to grant the appeal by BAMC with regard to
acknowledging Gorenjska banka d.d. the applicant’s position of the compulsory settlement proceedings and returned
the matter to the court of first instance into further procedure (public announcement on the Ajpes website on 30 July
2015).
As proposed by all the applicants (8 creditors), the District Court in Ljubljana issued a new order on initiating the
compulsory settlement proceedings against the debtor Sava d.d. on 16 September 2015 and called upon the
applicants to cooperate constructively (public announcement on the Ajpes website on 16 September 2015).
On 16 September 2015, the District Court announced the beginning of the compulsory settlement proceedings against
the debtor Sava d.d. (public announcement on the Ajpes website on 16 September 2015).
On 28 October 2015, the District Court in Ljubljana issued an order on dismissal of Matjaž Nanut from the
administrator’s function and appointed a new administrator, Leon Benigar Tošič, who will carry out the
administrator’s tasks and competencies through the Law Firm Benigar Tošič d.o.o. (public announcement on the
Ajpes website on 28 October 2015).
I Business operations of Sava d.d. and the Sava Group, Januay – September 2015 I
6
1. BUSINESS REPORT FOR SAVA d.d. AND THE SAVA GROUP AS AT 30 SEPTEMBER 2015
1.1. Major data about Sava d.d.
Company name: Sava, družba za upravljanje in financiranje, d.d.
Abbreviated name: Sava, d.d.
Head office: Dunajska cesta 152, 1000 Ljubljana, Slovenia
Telephone: +386 4 206 5510
Telefax: +386 4 206 6446
E-mail: [email protected]
Website: www.sava.si
Management
President of the Management Board: Matej Narat
Member of the Management Board: Aleš Aberšek
Chairman of the Supervisory Board: Miran Kraševec
Registration No.: 5111358
VAT-ID No.: SI75105284
Main activity: activity of holding companies
Court registry: 26 April 1996 at Kranj District Court, Srg No. 96/00267
Share capital as at 30 September 2015: €14,060,594.51
Number of shares: 2,006,987 ordinary personal no-par value shares with share designation
SAVA
Share listing: Ljubljana Stock Exchange d.d., stock exchange listing
I Business operations of Sava d.d. and the Sava Group, Januay – Septemer 2015 I
7
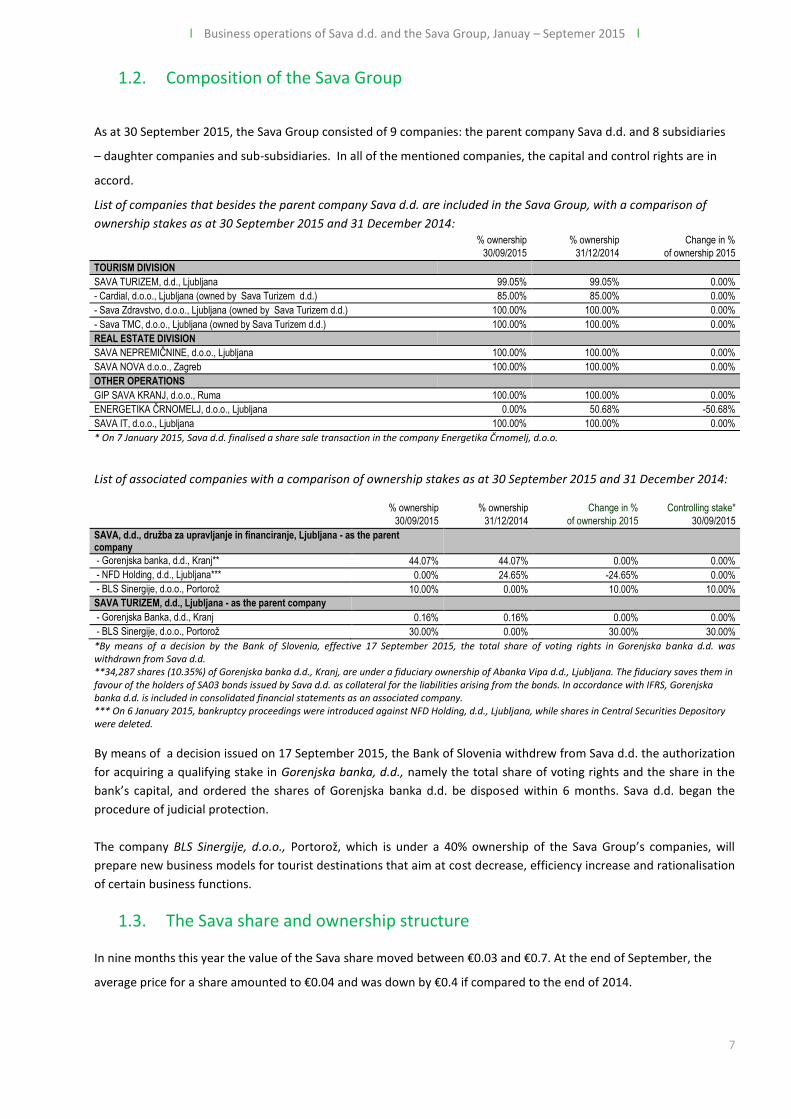
1.2. Composition of the Sava Group
As at 30 September 2015, the Sava Group consisted of 9 companies: the parent company Sava d.d. and 8 subsidiaries
– daughter companies and sub-subsidiaries. In all of the mentioned companies, the capital and control rights are in
accord.
List of companies that besides the parent company Sava d.d. are included in the Sava Group, with a comparison of
ownership stakes as at 30 September 2015 and 31 December 2014: % ownership % ownership Change in %
30/09/2015 31/12/2014 of ownership 2015
TOURISM DIVISION
SAVA TURIZEM, d.d., Ljubljana 99.05% 99.05% 0.00%
- Cardial, d.o.o., Ljubljana (owned by Sava Turizem d.d.) 85.00% 85.00% 0.00%
- Sava Zdravstvo, d.o.o., Ljubljana (owned by Sava Turizem d.d.) 100.00% 100.00% 0.00%
- Sava TMC, d.o.o., Ljubljana (owned by Sava Turizem d.d.) 100.00% 100.00% 0.00%
REAL ESTATE DIVISION
SAVA NEPREMIČNINE, d.o.o., Ljubljana 100.00% 100.00% 0.00%
SAVA NOVA d.o.o., Zagreb 100.00% 100.00% 0.00%
OTHER OPERATIONS
GIP SAVA KRANJ, d.o.o., Ruma 100.00% 100.00% 0.00%
ENERGETIKA ČRNOMELJ, d.o.o., Ljubljana 0.00% 50.68% -50.68%
SAVA IT, d.o.o., Ljubljana 100.00% 100.00% 0.00%
* On 7 January 2015, Sava d.d. finalised a share sale transaction in the company Energetika Črnomelj, d.o.o.
List of associated companies with a comparison of ownership stakes as at 30 September 2015 and 31 December 2014:
% ownership % ownership Change in % Controlling stake*
30/09/2015 31/12/2014 of ownership 2015 30/09/2015
SAVA, d.d., družba za upravljanje in financiranje, Ljubljana - as the parent company
- Gorenjska banka, d.d., Kranj** 44.07% 44.07% 0.00% 0.00%
- NFD Holding, d.d., Ljubljana*** 0.00% 24.65% -24.65% 0.00%
- BLS Sinergije, d.o.o., Portorož 10.00% 0.00% 10.00% 10.00%
SAVA TURIZEM, d.d., Ljubljana - as the parent company
- Gorenjska Banka, d.d., Kranj 0.16% 0.16% 0.00% 0.00%
- BLS Sinergije, d.o.o., Portorož 30.00% 0.00% 30.00% 30.00%
*By means of a decision by the Bank of Slovenia, effective 17 September 2015, the total share of voting rights in Gorenjska banka d.d. was withdrawn from Sava d.d. **34,287 shares (10.35%) of Gorenjska banka d.d., Kranj, are under a fiduciary ownership of Abanka Vipa d.d., Ljubljana. The fiduciary saves them in favour of the holders of SA03 bonds issued by Sava d.d. as collateral for the liabilities arising from the bonds. In accordance with IFRS, Gorenjska banka d.d. is included in consolidated financial statements as an associated company. *** On 6 January 2015, bankruptcy proceedings were introduced against NFD Holding, d.d., Ljubljana, while shares in Central Securities Depository were deleted.
By means of a decision issued on 17 September 2015, the Bank of Slovenia withdrew from Sava d.d. the authorization
for acquiring a qualifying stake in Gorenjska banka, d.d., namely the total share of voting rights and the share in the
bank’s capital, and ordered the shares of Gorenjska banka d.d. be disposed within 6 months. Sava d.d. began the
procedure of judicial protection.
The company BLS Sinergije, d.o.o., Portorož, which is under a 40% ownership of the Sava Group’s companies, will
prepare new business models for tourist destinations that aim at cost decrease, efficiency increase and rationalisation
of certain business functions.
1.3. The Sava share and ownership structure In nine months this year the value of the Sava share moved between €0.03 and €0.7. At the end of September, the
average price for a share amounted to €0.04 and was down by €0.4 if compared to the end of 2014.
I Business operations of Sava d.d. and the Sava Group, Januay – September 2015 I
8
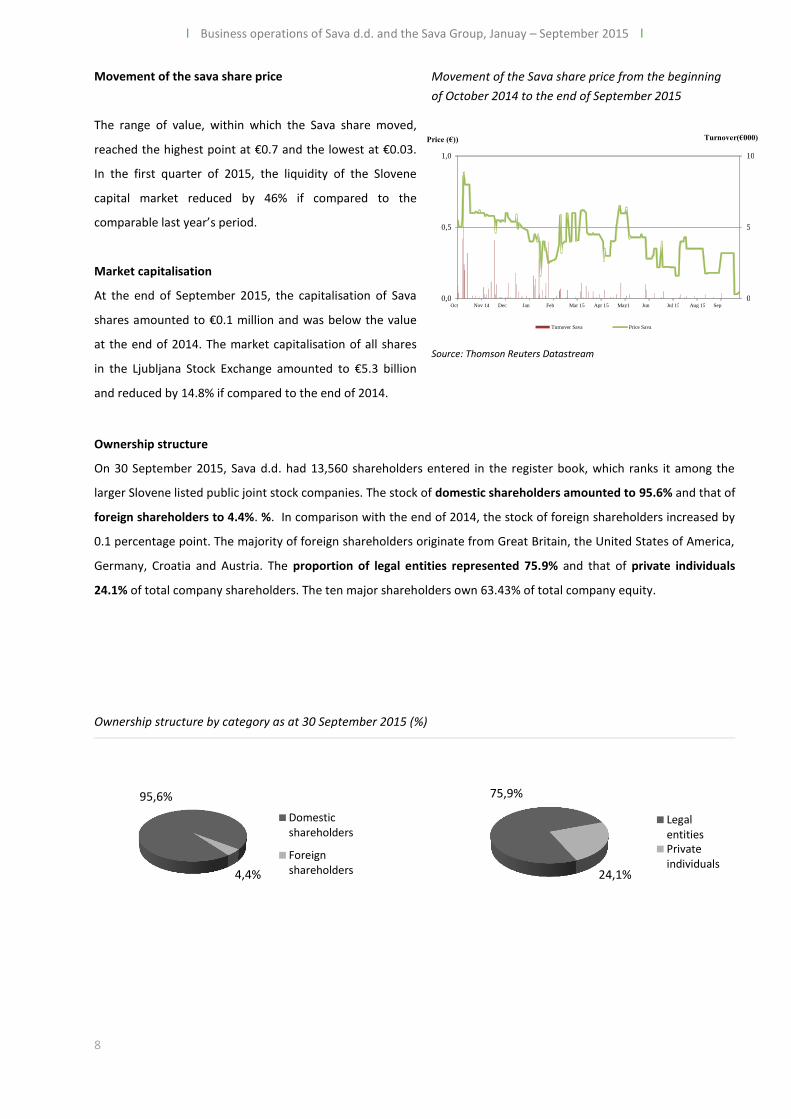
Movement of the sava share price
The range of value, within which the Sava share moved,
reached the highest point at €0.7 and the lowest at €0.03.
In the first quarter of 2015, the liquidity of the Slovene
capital market reduced by 46% if compared to the
comparable last year’s period.
Market capitalisation
At the end of September 2015, the capitalisation of Sava
shares amounted to €0.1 million and was below the value
at the end of 2014. The market capitalisation of all shares
in the Ljubljana Stock Exchange amounted to €5.3 billion
and reduced by 14.8% if compared to the end of 2014.
Movement of the Sava share price from the beginning
of October 2014 to the end of September 2015
Source: Thomson Reuters Datastream
Ownership structure
On 30 September 2015, Sava d.d. had 13,560 shareholders entered in the register book, which ranks it among the
larger Slovene listed public joint stock companies. The stock of domestic shareholders amounted to 95.6% and that of
foreign shareholders to 4.4%. %. In comparison with the end of 2014, the stock of foreign shareholders increased by
0.1 percentage point. The majority of foreign shareholders originate from Great Britain, the United States of America,
Germany, Croatia and Austria. The proportion of legal entities represented 75.9% and that of private individuals
24.1% of total company shareholders. The ten major shareholders own 63.43% of total company equity.
Ownership structure by category as at 30 September 2015 (%)
95,6%
4,4%
Domesticshareholders
Foreignshareholders
75,9%
24,1%
LegalentitiesPrivateindividuals
0
5
10
0,0
0,5
1,0
Oct
14 Nov 14 Dec
14 Jan
15 Feb
15 Mar 15 Apr 15 May1
5 Jun
15 Jul 15 Aug 15 Sep
15
Turnover(€000) Price (€))
Turnover Sava Price Sava
I Business operations of Sava d.d. and the Sava Group, Januay – Septemer 2015 I
9
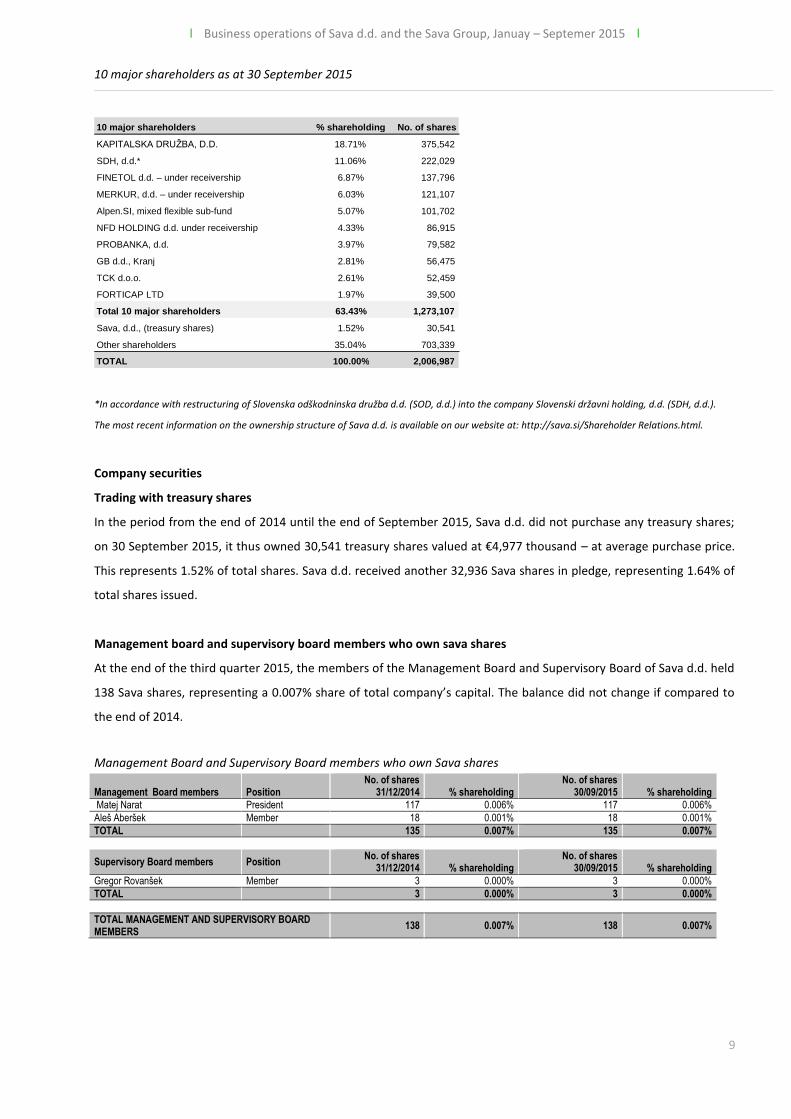
10 major shareholders as at 30 September 2015
*In accordance with restructuring of Slovenska odškodninska družba d.d. (SOD, d.d.) into the company Slovenski državni holding, d.d. (SDH, d.d.).
The most recent information on the ownership structure of Sava d.d. is available on our website at: http://sava.si/Shareholder Relations.html.
Company securities
Trading with treasury shares
In the period from the end of 2014 until the end of September 2015, Sava d.d. did not purchase any treasury shares;
on 30 September 2015, it thus owned 30,541 treasury shares valued at €4,977 thousand – at average purchase price.
This represents 1.52% of total shares. Sava d.d. received another 32,936 Sava shares in pledge, representing 1.64% of
total shares issued.
Management board and supervisory board members who own sava shares
At the end of the third quarter 2015, the members of the Management Board and Supervisory Board of Sava d.d. held
138 Sava shares, representing a 0.007% share of total company’s capital. The balance did not change if compared to
the end of 2014.
Management Board and Supervisory Board members who own Sava shares
Management Board members Position No. of shares
31/12/2014 % shareholding No. of shares
30/09/2015 % shareholding
Matej Narat President 117 0.006% 117 0.006%
Aleš Aberšek Member 18 0.001% 18 0.001%
TOTAL 135 0.007% 135 0.007%
Supervisory Board members Position No. of shares
31/12/2014 % shareholding No. of shares
30/09/2015 % shareholding
Gregor Rovanšek Member 3 0.000% 3 0.000%
TOTAL 3 0.000% 3 0.000%
TOTAL MANAGEMENT AND SUPERVISORY BOARD MEMBERS
138 0.007% 138 0.007%
10 major shareholders % shareholding No. of shares KAPITALSKA DRUŽBA, D.D. 18.71% 375,542 SDH, d.d.* 11.06% 222,029 FINETOL d.d. – under receivership 6.87% 137,796 MERKUR, d.d. – under receivership 6.03% 121,107 Alpen.SI, mixed flexible sub-fund 5.07% 101,702 NFD HOLDING d.d. under receivership 4.33% 86,915 PROBANKA, d.d. 3.97% 79,582 GB d.d., Kranj 2.81% 56,475 TCK d.o.o. 2.61% 52,459 FORTICAP LTD 1.97% 39,500 Total 10 major shareholders 63.43% 1,273,107 Sava, d.d., (treasury shares) 1.52% 30,541 Other shareholders 35.04% 703,339 TOTAL 100.00% 2,006,987
I Business operations of Sava d.d. and the Sava Group, Januay – September 2015 I
10
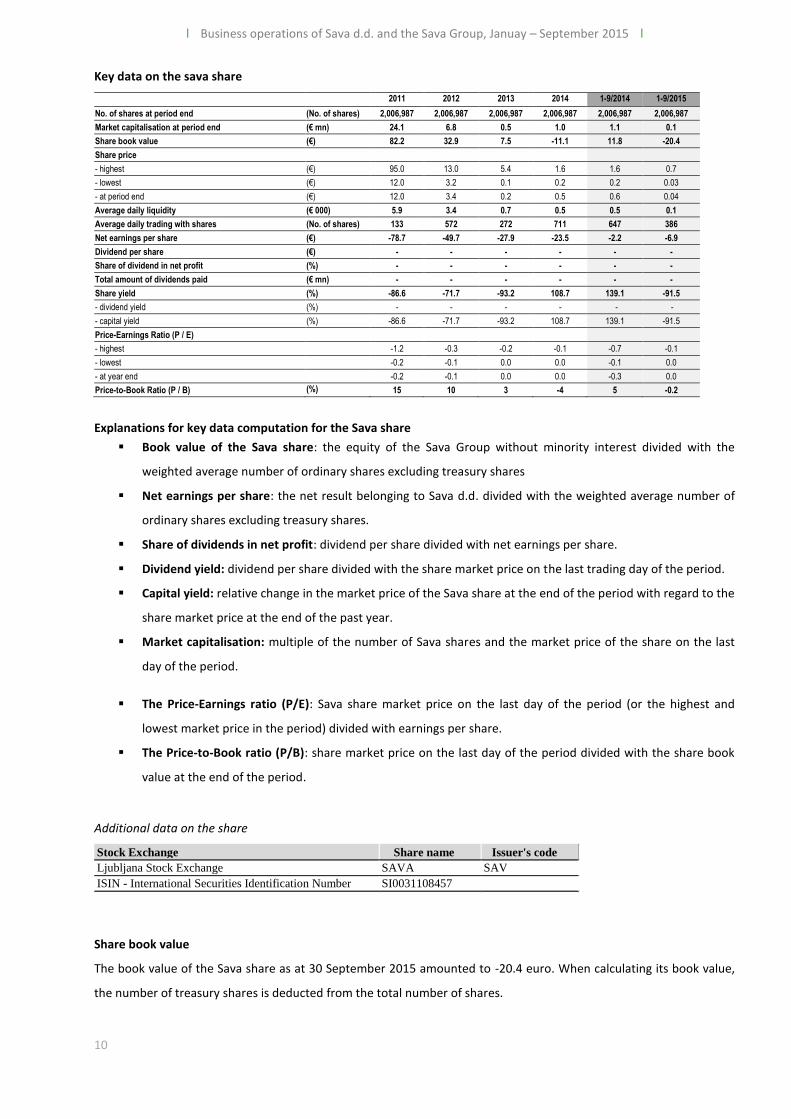
Key data on the sava share
2011 2012 2013 2014 1-9/2014 1-9/2015
No. of shares at period end (No. of shares) 2,006,987 2,006,987 2,006,987 2,006,987 2,006,987 2,006,987
Market capitalisation at period end (€ mn) 24.1 6.8 0.5 1.0 1.1 0.1
Share book value (€) 82.2 32.9 7.5 -11.1 11.8 -20.4
Share price
- highest (€) 95.0 13.0 5.4 1.6 1.6 0.7
- lowest (€) 12.0 3.2 0.1 0.2 0.2 0.03
- at period end (€) 12.0 3.4 0.2 0.5 0.6 0.04
Average daily liquidity (€ 000) 5.9 3.4 0.7 0.5 0.5 0.1
Average daily trading with shares (No. of shares) 133 572 272 711 647 386
Net earnings per share (€) -78.7 -49.7 -27.9 -23.5 -2.2 -6.9
Dividend per share (€) - - - - - -
Share of dividend in net profit (%) - - - - - -
Total amount of dividends paid (€ mn) - - - - - -
Share yield (%) -86.6 -71.7 -93.2 108.7 139.1 -91.5
- dividend yield (%) - - - - - -
- capital yield (%) -86.6 -71.7 -93.2 108.7 139.1 -91.5
Price-Earnings Ratio (P / E)
- highest -1.2 -0.3 -0.2 -0.1 -0.7 -0.1
- lowest -0.2 -0.1 0.0 0.0 -0.1 0.0
- at year end -0.2 -0.1 0.0 0.0 -0.3 0.0
Price-to-Book Ratio (P / B) (%) 15 10 3 -4 5 -0.2
Explanations for key data computation for the Sava share
Book value of the Sava share: the equity of the Sava Group without minority interest divided with the
weighted average number of ordinary shares excluding treasury shares
Net earnings per share: the net result belonging to Sava d.d. divided with the weighted average number of
ordinary shares excluding treasury shares.
Share of dividends in net profit: dividend per share divided with net earnings per share.
Dividend yield: dividend per share divided with the share market price on the last trading day of the period.
Capital yield: relative change in the market price of the Sava share at the end of the period with regard to the
share market price at the end of the past year.
Market capitalisation: multiple of the number of Sava shares and the market price of the share on the last
day of the period.
The Price-Earnings ratio (P/E): Sava share market price on the last day of the period (or the highest and
lowest market price in the period) divided with earnings per share.
The Price-to-Book ratio (P/B): share market price on the last day of the period divided with the share book
value at the end of the period.
Additional data on the share
Share book value
The book value of the Sava share as at 30 September 2015 amounted to -20.4 euro. When calculating its book value,
the number of treasury shares is deducted from the total number of shares.
Stock Exchange Share name Issuer's code Ljubljana Stock Exchange SAVA SAV ISIN - International Securities Identification Number SI0031108457
I Business operations of Sava d.d. and the Sava Group, Januay – Septemer 2015 I
11
Risks associated with the investment in the sava share
Such risks are due to:
Factors of systematic risk-taking characteristic of all securities listed on the Ljubljana Stock Exchange, such as
changed conditions in the issuer’s business, changes in tax legislation and regulations relating to the
securities market, and force majeure.
Factors of non-systematic risk-taking connected with the operation of each individual company (investment,
interest, solvency and foreign exchange risk).
Cross links with other companies
Under the criteria defined in the Corporate Governance Code for Public Joint-Stock Companies, Sava d.d. was cross-
linked at the end of the third quarter as follows:
In Gorenjska banka d.d. it had a 44.07% shareholding, whereas Gorenjska banka had a 2.81% shareholding in
Sava d.d.
Approved capital and conditional increase in share capital
The Articles of Association of Sava d.d. do not include any provisions in this regard.
1.4. Business operations of Sava d.d.
The data for the period January–March 2015 (the cut-off date) and the period April–June 2015 (public announcement
on operations January–March of 22 May 2015 and public announcement on operations January–June 2015 of 28
August 2015) were changed as already forecast in the previous report.
The draft appraisal of assets owned by the debtor Sava d.d. as at 31 March 2015, interests computation to the default
interests level until 30 September 2015 and short-term provisions as at 31 March 2015 referring to the external
services provided in the compulsory settlement proceedings, were additionally included in financial statements.
Consequently, all financial statements as per the aforementioned reporting dates were modified, which is why the
disclosures of individual subject matters in the financial statements of Sava d.d. are presented by quarter, too. The
financial statements as per 31 March 2015 have not yet been audited; the auditing procedure is in progress.
In the period January–September 2015, Sava d.d. operated with a loss of €23,328 thousand. Changes with respect to
the previous reporting refer to additional impairments of financial investments totalling €10,896 thousand, carried out
on the basis of the draft assets appraisal, as well as to the additionally charged interests to the default interest level
totalling €5,856 thousand and additionally imputed short-term provisions for consulting services provided in the
compulsory settlement proceedings totalling €381 thousand. The balance sheet total amounted to €193,123 thousand
as at 30 September 2015, while the company’s capital was negative to the amount of €51,638 thousand.
I Business operations of Sava d.d. and the Sava Group, Januay – September 2015 I
12
Explanations about the income statement of Sava d.d.
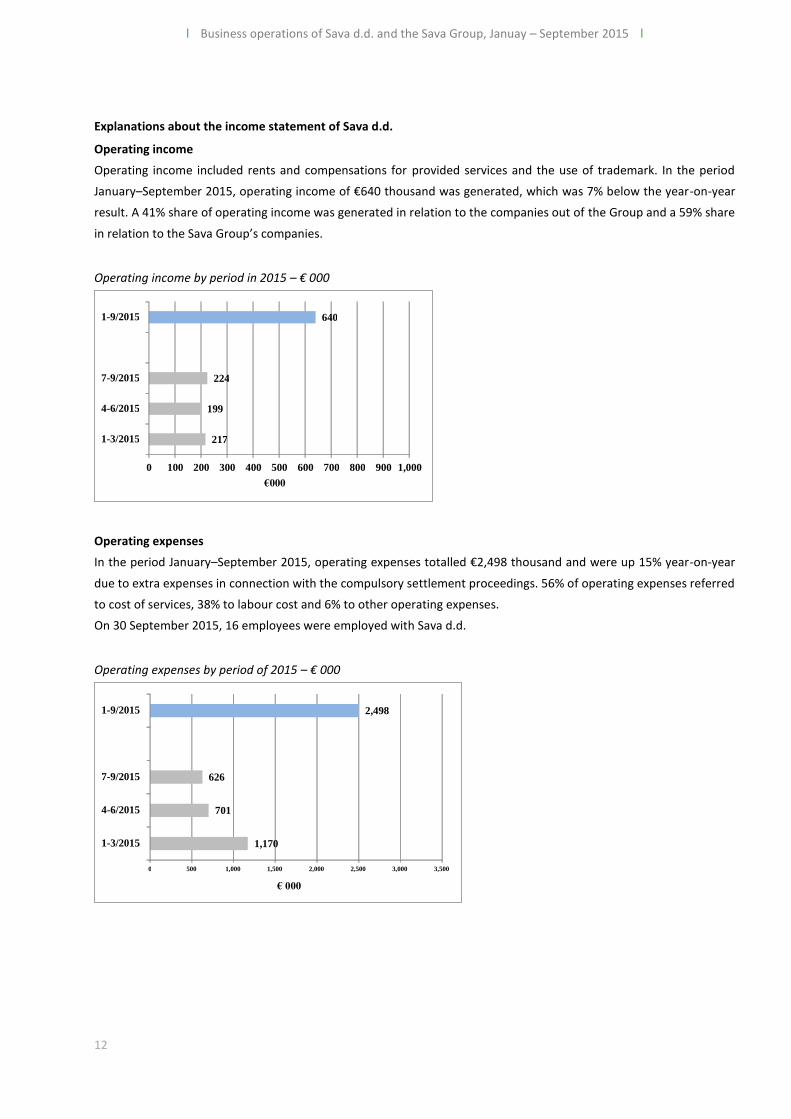
Operating income
Operating income included rents and compensations for provided services and the use of trademark. In the period
January–September 2015, operating income of €640 thousand was generated, which was 7% below the year-on-year
result. A 41% share of operating income was generated in relation to the companies out of the Group and a 59% share
in relation to the Sava Group’s companies.
Operating income by period in 2015 – € 000
Operating expenses
In the period January–September 2015, operating expenses totalled €2,498 thousand and were up 15% year-on-year
due to extra expenses in connection with the compulsory settlement proceedings. 56% of operating expenses referred
to cost of services, 38% to labour cost and 6% to other operating expenses.
On 30 September 2015, 16 employees were employed with Sava d.d.
Operating expenses by period of 2015 – € 000
217
199
224
640
0 100 200 300 400 500 600 700 800 900 1,000
1-3/2015
4-6/2015
7-9/2015
1-9/2015
€000
1,170
701
626
2,498
0 500 1,000 1,500 2,000 2,500 3,000 3,500
1-3/2015
4-6/2015
7-9/2015
1-9/2015
€ 000
I Business operations of Sava d.d. and the Sava Group, Januay – Septemer 2015 I
13
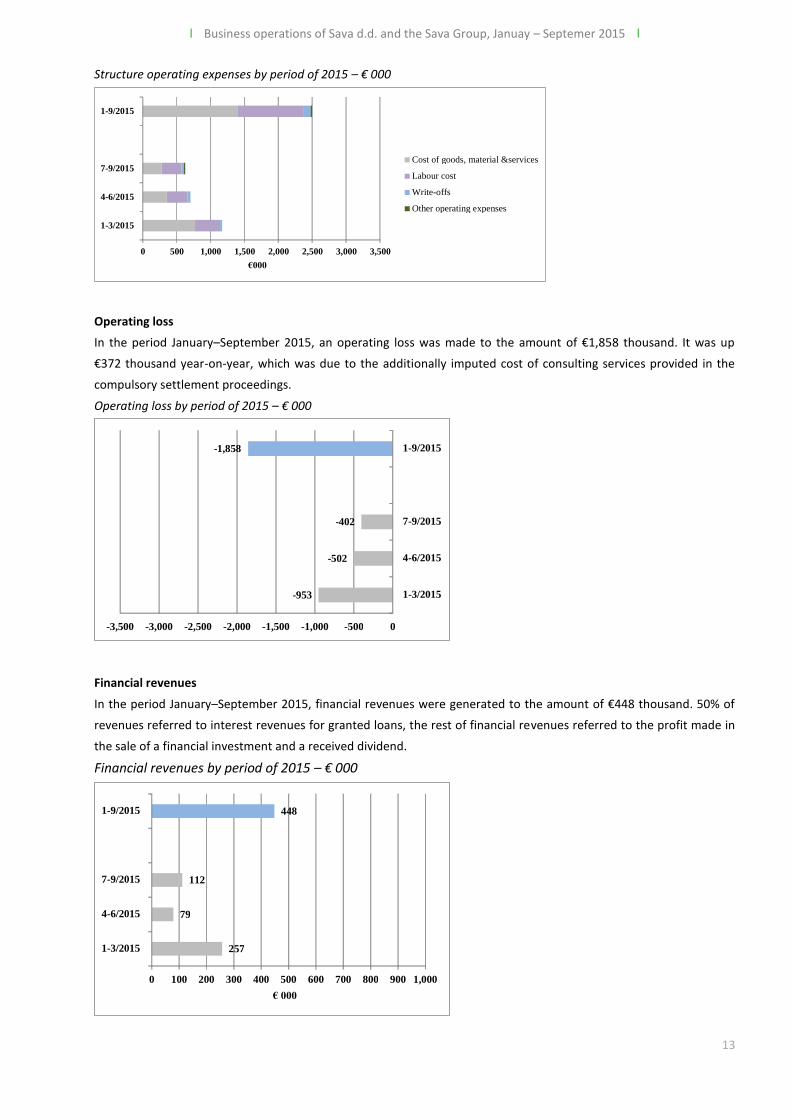
Structure operating expenses by period of 2015 – € 000
Operating loss
In the period January–September 2015, an operating loss was made to the amount of €1,858 thousand. It was up
€372 thousand year-on-year, which was due to the additionally imputed cost of consulting services provided in the
compulsory settlement proceedings.
Operating loss by period of 2015 – € 000
Financial revenues
In the period January–September 2015, financial revenues were generated to the amount of €448 thousand. 50% of
revenues referred to interest revenues for granted loans, the rest of financial revenues referred to the profit made in
the sale of a financial investment and a received dividend.
Financial revenues by period of 2015 – € 000
0 500 1,000 1,500 2,000 2,500 3,000 3,500
1-3/2015
4-6/2015
7-9/2015
1-9/2015
€000
Cost of goods, material &services Labour cost Write-offs Other operating expenses
- 953
- 502
- 402
- 1,858
-3,500 -3,000 -2,500 -2,000 -1,500 -1,000 -500 0
1-3/2015
4-6/2015
7-9/2015
1-9/2015
257
79
112
448
0 100 200 300 400 500 600 700 800 900 1,000
1-3/2015
4-6/2015
7-9/2015
1-9/2015
€ 000
I Business operations of Sava d.d. and the Sava Group, Januay – September 2015 I
14
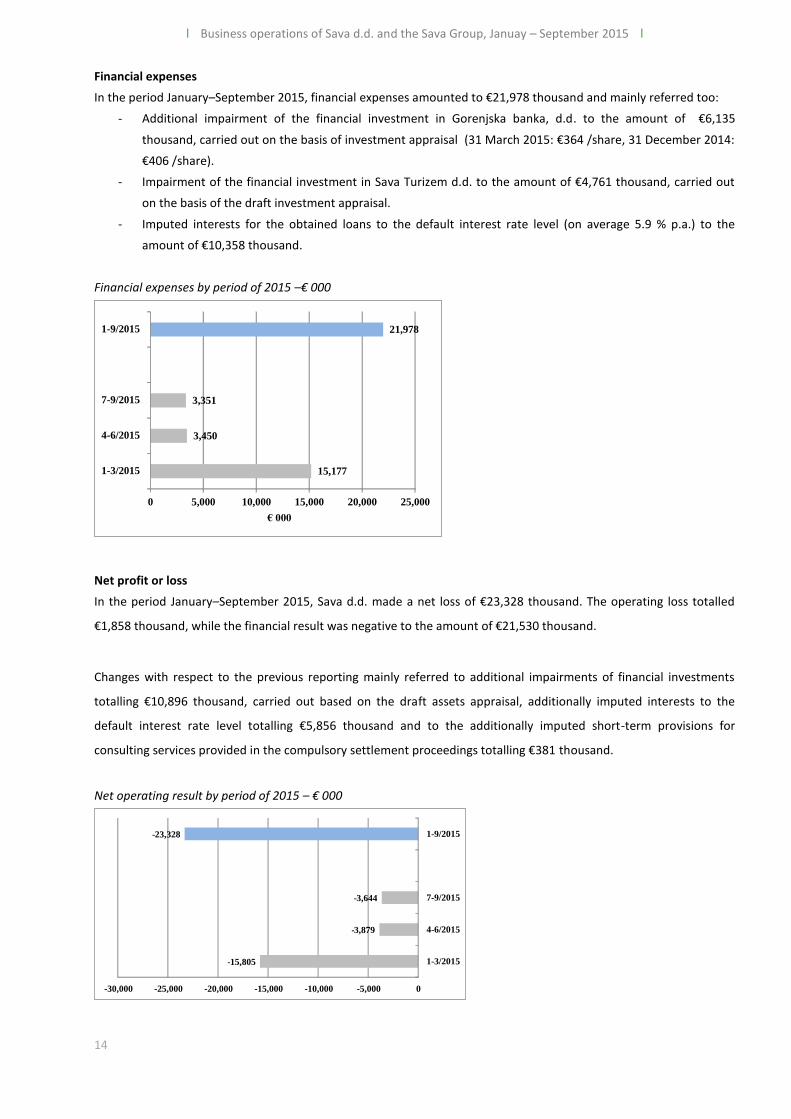
Financial expenses
In the period January–September 2015, financial expenses amounted to €21,978 thousand and mainly referred too:
- Additional impairment of the financial investment in Gorenjska banka, d.d. to the amount of €6,135
thousand, carried out on the basis of investment appraisal (31 March 2015: €364 /share, 31 December 2014:
€406 /share).
- Impairment of the financial investment in Sava Turizem d.d. to the amount of €4,761 thousand, carried out
on the basis of the draft investment appraisal.
- Imputed interests for the obtained loans to the default interest rate level (on average 5.9 % p.a.) to the
amount of €10,358 thousand.
Financial expenses by period of 2015 –€ 000
Net profit or loss
In the period January–September 2015, Sava d.d. made a net loss of €23,328 thousand. The operating loss totalled
€1,858 thousand, while the financial result was negative to the amount of €21,530 thousand.
Changes with respect to the previous reporting mainly referred to additional impairments of financial investments
totalling €10,896 thousand, carried out based on the draft assets appraisal, additionally imputed interests to the
default interest rate level totalling €5,856 thousand and to the additionally imputed short-term provisions for
consulting services provided in the compulsory settlement proceedings totalling €381 thousand.
Net operating result by period of 2015 – € 000
15,177
3,450
3,351
21,978
0 5,000 10,000 15,000 20,000 25,000
1-3/2015
4-6/2015
7-9/2015
1-9/2015
€ 000
- 15,805
- 3,879
- 3,644
- 23,328
-30,000 -25,000 -20,000 -15,000 -10,000 -5,000 0
1-3/2015
4-6/2015
7-9/2015
1-9/2015
I Business operations of Sava d.d. and the Sava Group, Januay – Septemer 2015 I
15
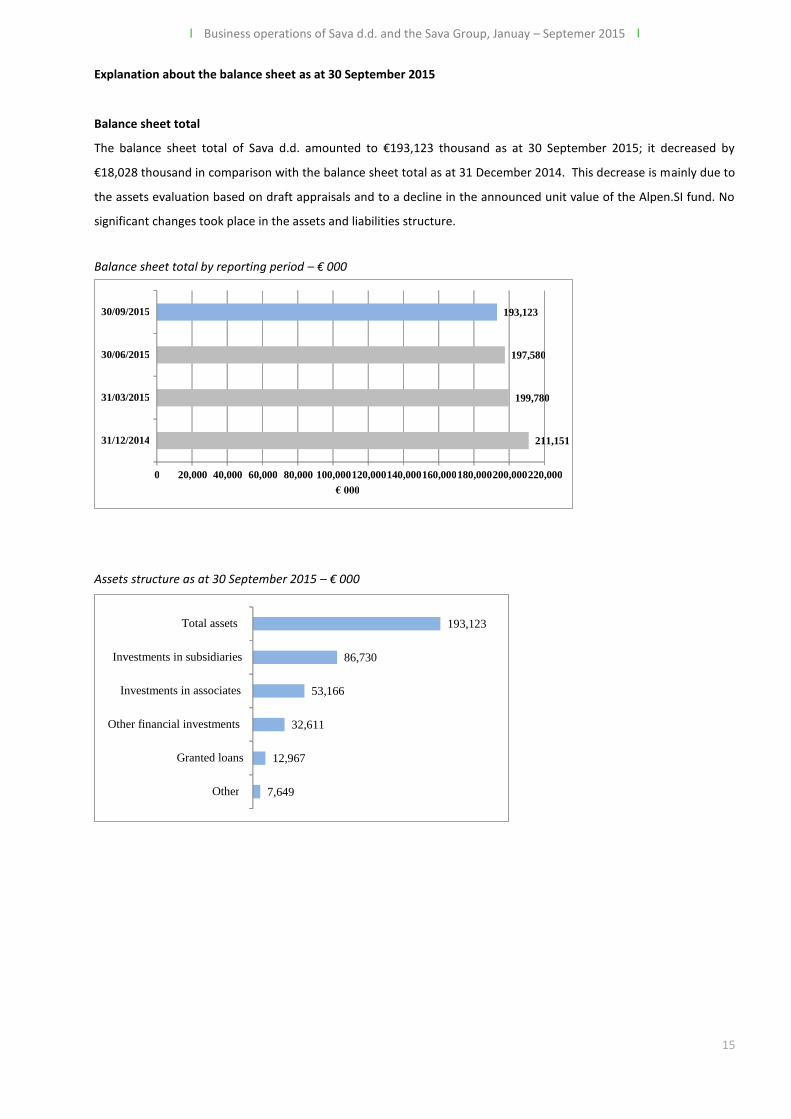
Explanation about the balance sheet as at 30 September 2015
Balance sheet total
The balance sheet total of Sava d.d. amounted to €193,123 thousand as at 30 September 2015; it decreased by
€18,028 thousand in comparison with the balance sheet total as at 31 December 2014. This decrease is mainly due to
the assets evaluation based on draft appraisals and to a decline in the announced unit value of the Alpen.SI fund. No
significant changes took place in the assets and liabilities structure.
Balance sheet total by reporting period – € 000
Assets structure as at 30 September 2015 – € 000
211,151
199,780
197,580
193,123
0 20,000 40,000 60,000 80,000 100,000 120,000 140,000 160,000 180,000 200,000 220,000
31/12/2014
31/03/2015
30/06/2015
30/09/2015
€ 000
7,649
12,967
32,611
53,166
86,730
193,123
Other
Granted loans
Other financial investments
Investments in associates
Investments in subsidiaries
Total assets
I Business operations of Sava d.d. and the Sava Group, Januay – September 2015 I
16
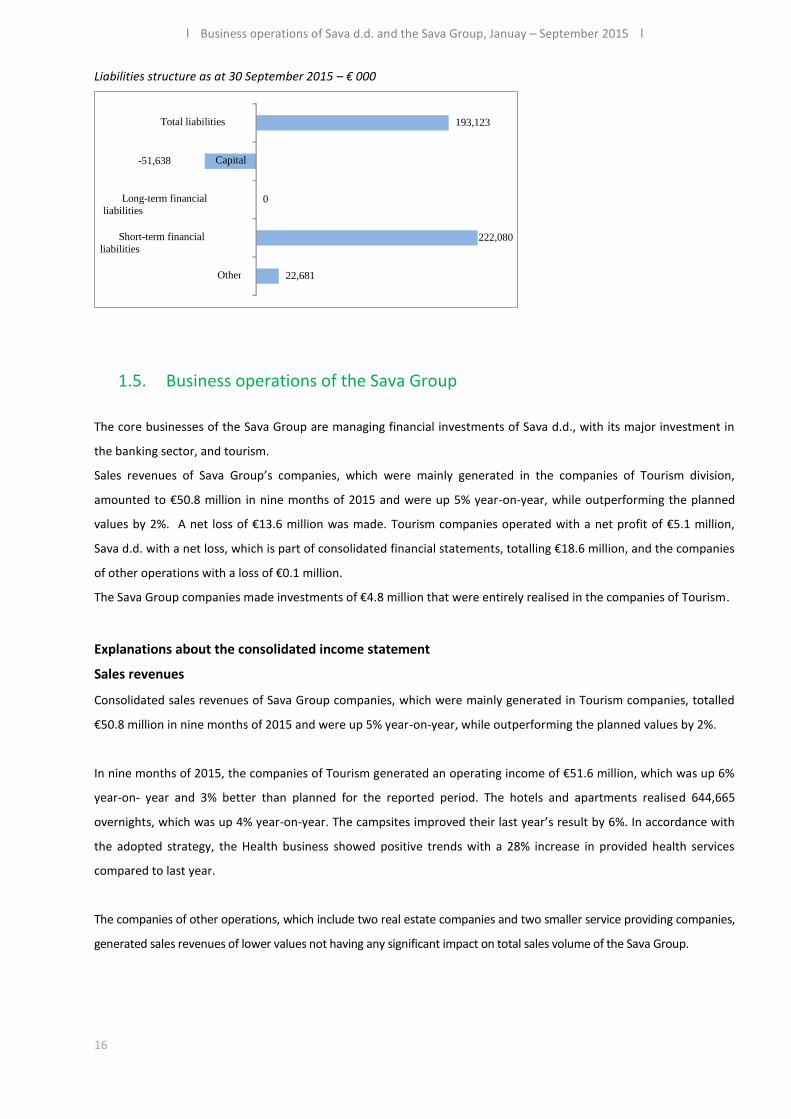
Liabilities structure as at 30 September 2015 – € 000
1.5. Business operations of the Sava Group
The core businesses of the Sava Group are managing financial investments of Sava d.d., with its major investment in
the banking sector, and tourism.
Sales revenues of Sava Group’s companies, which were mainly generated in the companies of Tourism division,
amounted to €50.8 million in nine months of 2015 and were up 5% year-on-year, while outperforming the planned
values by 2%. A net loss of €13.6 million was made. Tourism companies operated with a net profit of €5.1 million,
Sava d.d. with a net loss, which is part of consolidated financial statements, totalling €18.6 million, and the companies
of other operations with a loss of €0.1 million.
The Sava Group companies made investments of €4.8 million that were entirely realised in the companies of Tourism.
Explanations about the consolidated income statement
Sales revenues
Consolidated sales revenues of Sava Group companies, which were mainly generated in Tourism companies, totalled
€50.8 million in nine months of 2015 and were up 5% year-on-year, while outperforming the planned values by 2%.
In nine months of 2015, the companies of Tourism generated an operating income of €51.6 million, which was up 6%
year-on- year and 3% better than planned for the reported period. The hotels and apartments realised 644,665
overnights, which was up 4% year-on-year. The campsites improved their last year’s result by 6%. In accordance with
the adopted strategy, the Health business showed positive trends with a 28% increase in provided health services
compared to last year.
The companies of other operations, which include two real estate companies and two smaller service providing companies,
generated sales revenues of lower values not having any significant impact on total sales volume of the Sava Group.
22,681
222,080
0
- 51,638
193,123
Other
Short-term financial
liabilities
Long-term financial
liabilities
Capital
Total liabilities
I Business operations of Sava d.d. and the Sava Group, Januay – Septemer 2015 I
17
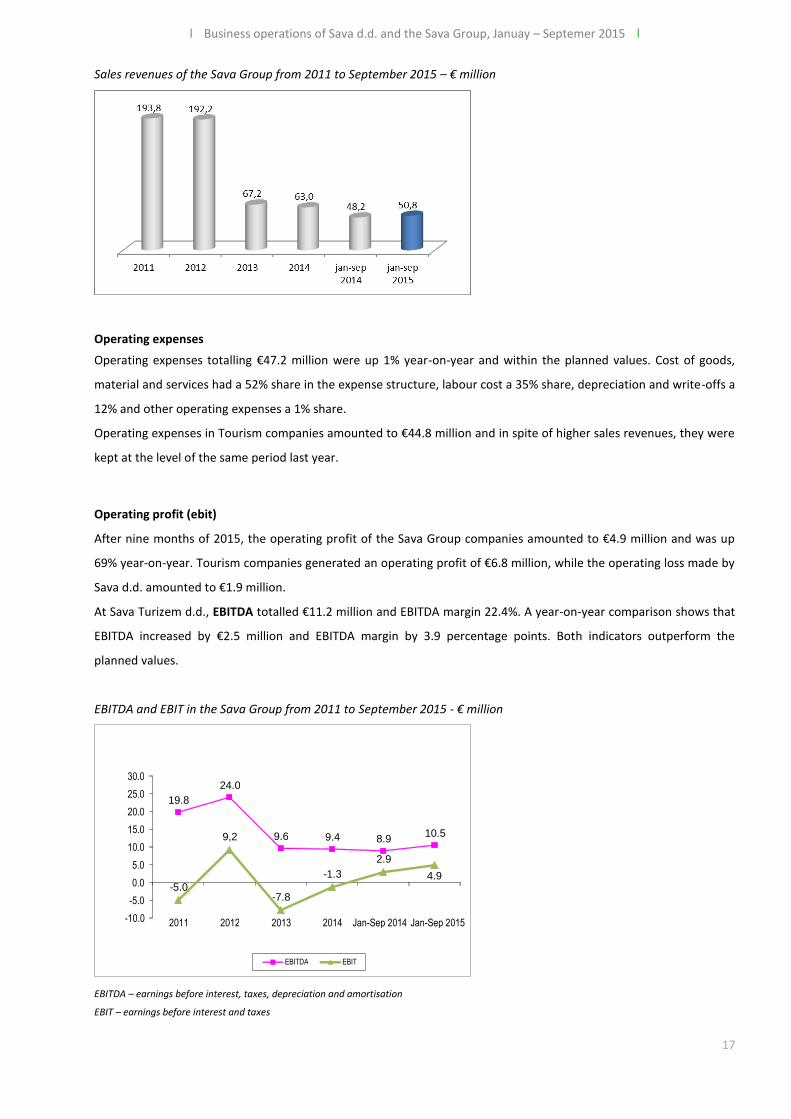
Sales revenues of the Sava Group from 2011 to September 2015 – € million
Operating expenses
Operating expenses totalling €47.2 million were up 1% year-on-year and within the planned values. Cost of goods,
material and services had a 52% share in the expense structure, labour cost a 35% share, depreciation and write-offs a
12% and other operating expenses a 1% share.
Operating expenses in Tourism companies amounted to €44.8 million and in spite of higher sales revenues, they were
kept at the level of the same period last year.
Operating profit (ebit)
After nine months of 2015, the operating profit of the Sava Group companies amounted to €4.9 million and was up
69% year-on-year. Tourism companies generated an operating profit of €6.8 million, while the operating loss made by
Sava d.d. amounted to €1.9 million.
At Sava Turizem d.d., EBITDA totalled €11.2 million and EBITDA margin 22.4%. A year-on-year comparison shows that
EBITDA increased by €2.5 million and EBITDA margin by 3.9 percentage points. Both indicators outperform the
planned values.
EBITDA and EBIT in the Sava Group from 2011 to September 2015 - € million
EBITDA – earnings before interest, taxes, depreciation and amortisation
EBIT – earnings before interest and taxes
19.8 24.0
9.6 9.4 8.9 10.5
- 5.0
9,2
- 7.8
- 1.3 2.9
4.9
-10.0 -5.0 0.0 5.0
10.0 15.0 20.0 25.0 30.0
2011 2012 2013 2014 Jan-Sep 2014 Jan-Sep 2015
EBITDA EBIT
I Business operations of Sava d.d. and the Sava Group, Januay – September 2015 I
18
Net financial expenses
Net financial expenses to the amount of € 12.4 million were made and mainly referred to interest expenses.
Net expenses of the associated companies
Net financial expenses of the associated companies totalled €6.2 million and entirely referred to the impairment of
the financial investment in Gorenjska banka, d.d. (from €406/share to €364/share), which was carried out on the cut-
off date of compulsory settlement proceedings, namely 31 March 2015.
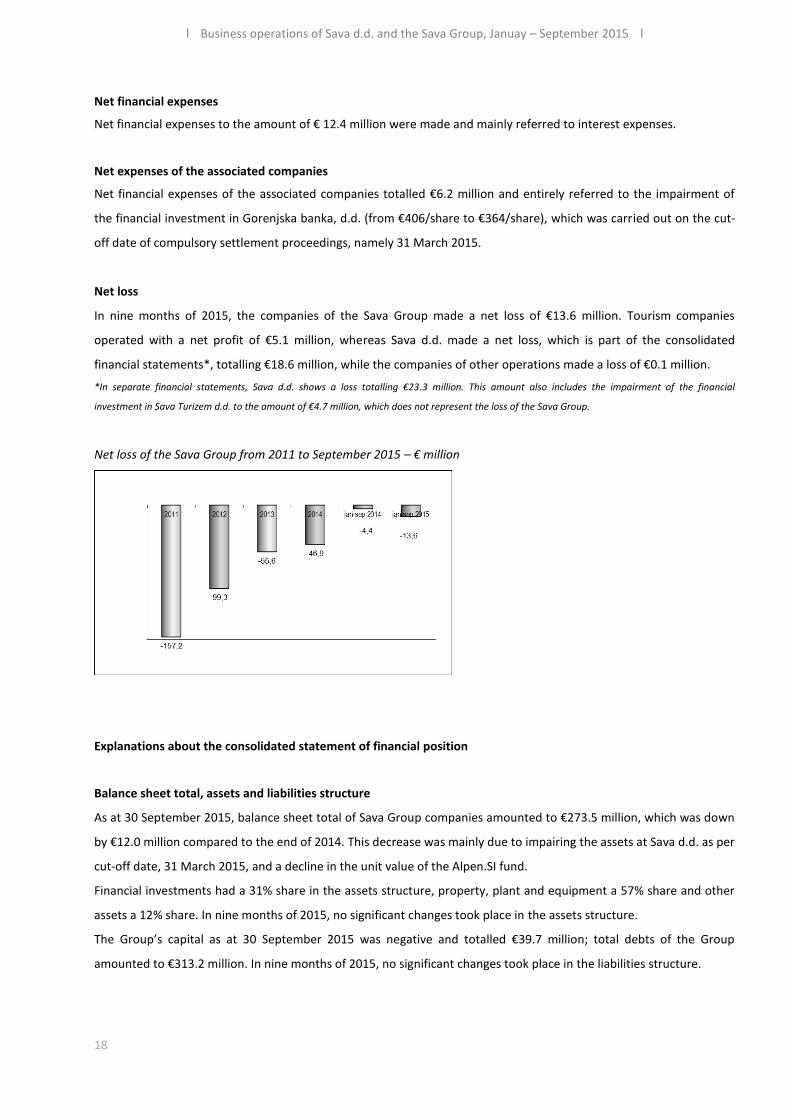
Net loss
In nine months of 2015, the companies of the Sava Group made a net loss of €13.6 million. Tourism companies
operated with a net profit of €5.1 million, whereas Sava d.d. made a net loss, which is part of the consolidated
financial statements*, totalling €18.6 million, while the companies of other operations made a loss of €0.1 million.
*In separate financial statements, Sava d.d. shows a loss totalling €23.3 million. This amount also includes the impairment of the financial
investment in Sava Turizem d.d. to the amount of €4.7 million, which does not represent the loss of the Sava Group.
Net loss of the Sava Group from 2011 to September 2015 – € million
Explanations about the consolidated statement of financial position
Balance sheet total, assets and liabilities structure
As at 30 September 2015, balance sheet total of Sava Group companies amounted to €273.5 million, which was down
by €12.0 million compared to the end of 2014. This decrease was mainly due to impairing the assets at Sava d.d. as per
cut-off date, 31 March 2015, and a decline in the unit value of the Alpen.SI fund.
Financial investments had a 31% share in the assets structure, property, plant and equipment a 57% share and other
assets a 12% share. In nine months of 2015, no significant changes took place in the assets structure.
The Group’s capital as at 30 September 2015 was negative and totalled €39.7 million; total debts of the Group
amounted to €313.2 million. In nine months of 2015, no significant changes took place in the liabilities structure.
I Business operations of Sava d.d. and the Sava Group, Januay – Septemer 2015 I
19
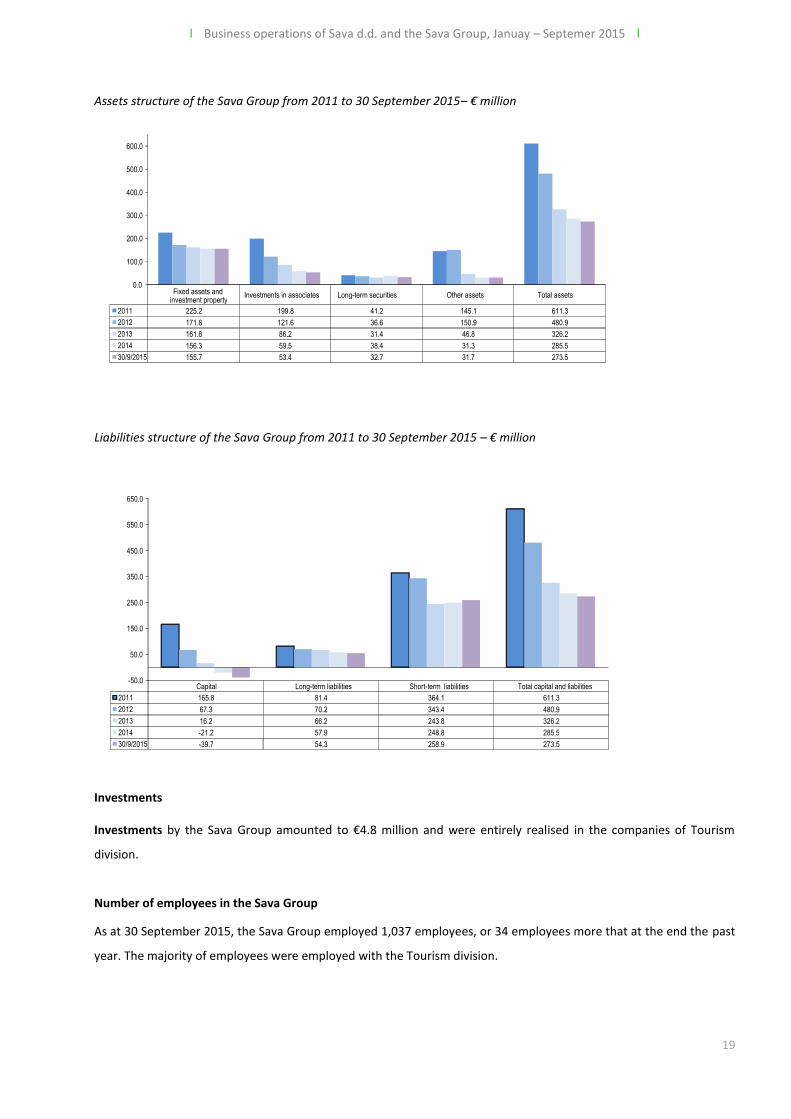
Assets structure of the Sava Group from 2011 to 30 September 2015– € million
Liabilities structure of the Sava Group from 2011 to 30 September 2015 – € million
Investments
Investments by the Sava Group amounted to €4.8 million and were entirely realised in the companies of Tourism
division.
Number of employees in the Sava Group
As at 30 September 2015, the Sava Group employed 1,037 employees, or 34 employees more that at the end the past
year. The majority of employees were employed with the Tourism division.
Fixed assets and investment property Investments in associates Long-term securities Other assets Total assets
2011 225.2 199.8 41.2 145.1 611.3 2012 171.8 121.6 36.6 150.9 480.9 2013 161.8 86.2 31.4 46.8 326.2 2014 156.3 59.5 38.4 31.3 285.5 30/9/2015 155.7 53.4 32.7 31.7 273.5
0.0
100.0
200.0
300.0
400.0
500.0
600.0
Capital Long-term liabilities Short-term liabilities Total capital and liabilities 2011 165.8 81.4 364.1 611.3 2012 67.3 70.2 343.4 480.9 2013 16.2 66.2 243.8 326.2 2014 -21.2 57.9 248.8 285.5 30/9/2015 -39.7 54.3 258.9 273.5
-50.0
50.0
150.0
250.0
350.0
450.0
550.0
650.0
I Business operations of Sava d.d. and the Sava Group, Januay – September 2015 I
20
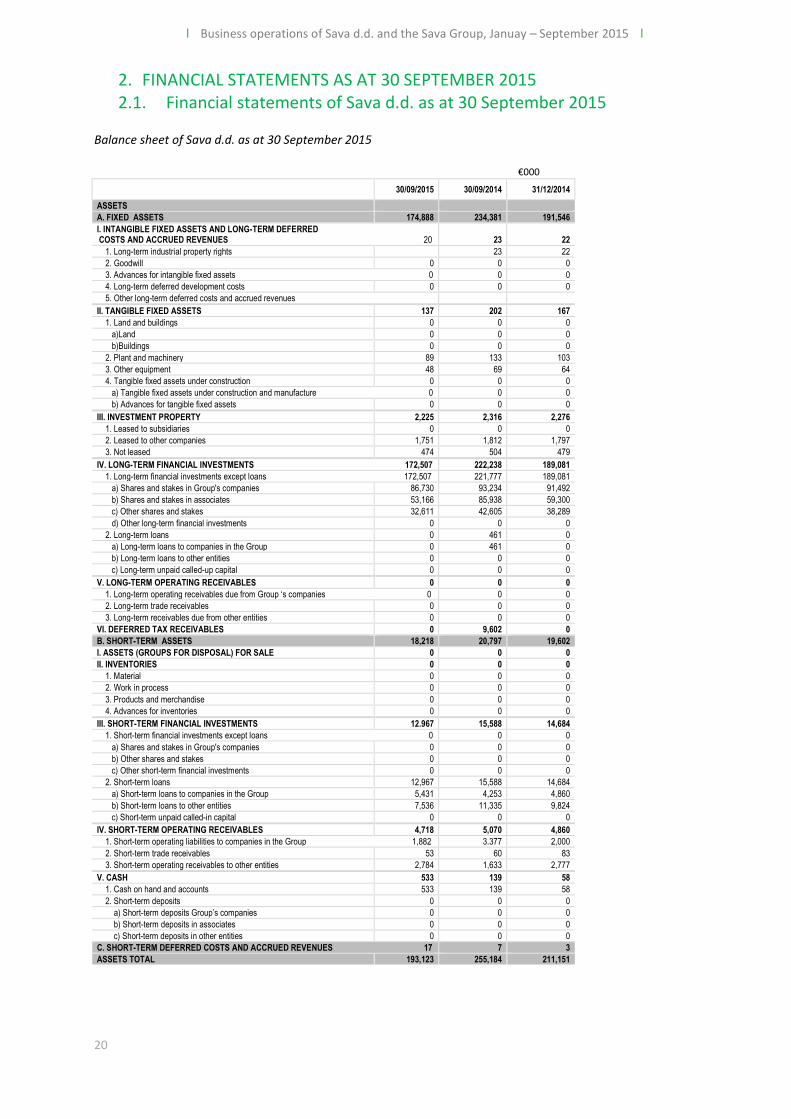
2. FINANCIAL STATEMENTS AS AT 30 SEPTEMBER 2015 2.1. Financial statements of Sava d.d. as at 30 September 2015
Balance sheet of Sava d.d. as at 30 September 2015
€000
30/09/2015 30/09/2014 31/12/2014
ASSETS
A. FIXED ASSETS 174,888 234,381 191,546
I. INTANGIBLE FIXED ASSETS AND LONG-TERM DEFERRED COSTS AND ACCRUED REVENUES 20
23
22
1. Long-term industrial property rights 23 22
2. Goodwill 0 0 0
3. Advances for intangible fixed assets 0 0 0
4. Long-term deferred development costs 0 0 0
5. Other long-term deferred costs and accrued revenues
II. TANGIBLE FIXED ASSETS 137 202 167
1. Land and buildings 0 0 0
a)Land 0 0 0
b)Buildings 0 0 0
2. Plant and machinery 89 133 103
3. Other equipment 48 69 64
4. Tangible fixed assets under construction 0 0 0
a) Tangible fixed assets under construction and manufacture 0 0 0
b) Advances for tangible fixed assets 0 0 0
III. INVESTMENT PROPERTY 2,225 2,316 2,276
1. Leased to subsidiaries 0 0 0
2. Leased to other companies 1,751 1,812 1,797
3. Not leased 474 504 479
IV. LONG-TERM FINANCIAL INVESTMENTS 172,507 222,238 189,081
1. Long-term financial investments except loans 172,507 221,777 189,081
a) Shares and stakes in Group's companies 86,730 93,234 91,492
b) Shares and stakes in associates 53,166 85,938 59,300
c) Other shares and stakes 32,611 42,605 38,289
d) Other long-term financial investments 0 0 0
2. Long-term loans 0 461 0
a) Long-term loans to companies in the Group 0 461 0
b) Long-term loans to other entities 0 0 0
c) Long-term unpaid called-up capital 0 0 0
V. LONG-TERM OPERATING RECEIVABLES 0 0 0
1. Long-term operating receivables due from Group ‘s companies 0 0 0
2. Long-term trade receivables 0 0 0
3. Long-term receivables due from other entities 0 0 0
VI. DEFERRED TAX RECEIVABLES 0 9,602 0
B. SHORT-TERM ASSETS 18,218 20,797 19,602
I. ASSETS (GROUPS FOR DISPOSAL) FOR SALE 0 0 0
II. INVENTORIES 0 0 0
1. Material 0 0 0
2. Work in process 0 0 0
3. Products and merchandise 0 0 0
4. Advances for inventories 0 0 0
III. SHORT-TERM FINANCIAL INVESTMENTS 12.967 15,588 14,684
1. Short-term financial investments except loans 0 0 0
a) Shares and stakes in Group's companies 0 0 0
b) Other shares and stakes 0 0 0
c) Other short-term financial investments 0 0 0
2. Short-term loans 12,967 15,588 14,684
a) Short-term loans to companies in the Group 5,431 4,253 4,860
b) Short-term loans to other entities 7,536 11,335 9,824
c) Short-term unpaid called-in capital 0 0 0
IV. SHORT-TERM OPERATING RECEIVABLES 4,718 5,070 4,860
1. Short-term operating liabilities to companies in the Group 1,882 3.377 2,000
2. Short-term trade receivables 53 60 83
3. Short-term operating receivables to other entities 2,784 1,633 2,777
V. CASH 533 139 58
1. Cash on hand and accounts 533 139 58
2. Short-term deposits 0 0 0
a) Short-term deposits Group’s companies 0 0 0
b) Short-term deposits in associates 0 0 0
c) Short-term deposits in other entities 0 0 0
C. SHORT-TERM DEFERRED COSTS AND ACCRUED REVENUES 17 7 3
ASSETS TOTAL 193,123 255,184 211,151
I Business operations of Sava d.d. and the Sava Group, Januay – Septemer 2015 I
21
€000
30/09/2015 30/09/2014 31/12/2014
LIABILITIES
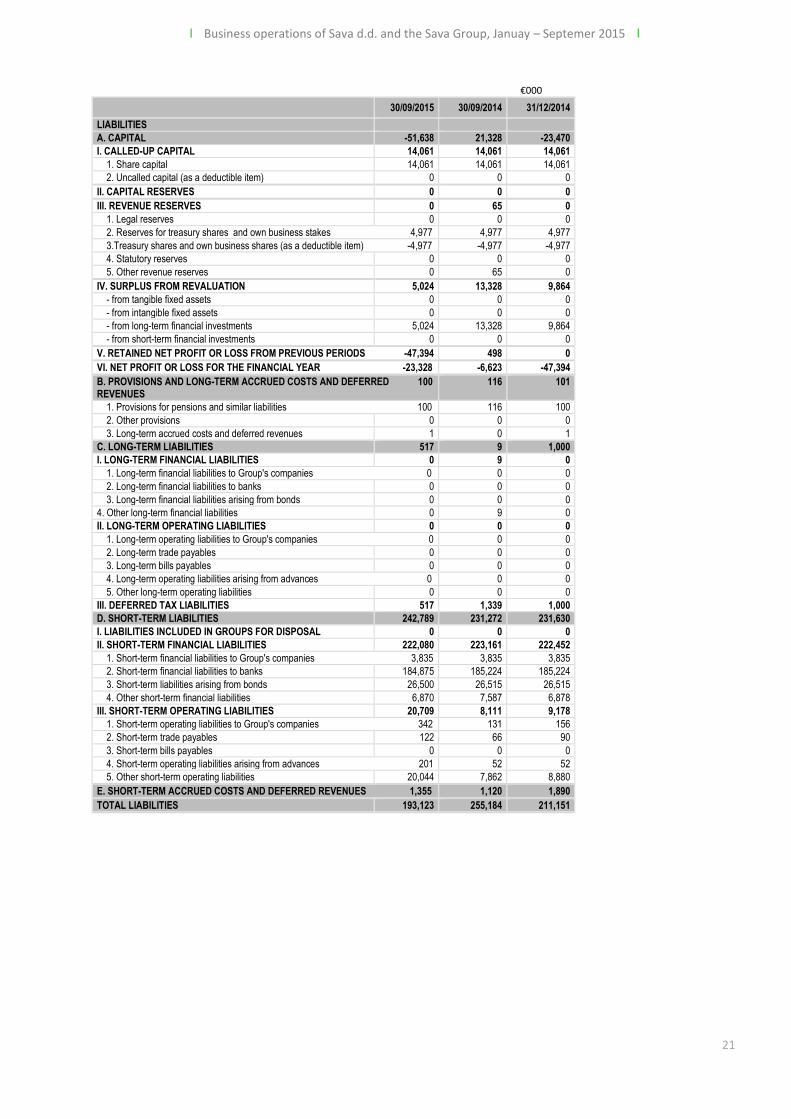
A. CAPITAL -51,638 21,328 -23,470
I. CALLED-UP CAPITAL 14,061 14,061 14,061
1. Share capital 14,061 14,061 14,061
2. Uncalled capital (as a deductible item) 0 0 0
II. CAPITAL RESERVES 0 0 0
III. REVENUE RESERVES 0 65 0
1. Legal reserves 0 0 0
2. Reserves for treasury shares and own business stakes 4,977 4,977 4,977
3.Treasury shares and own business shares (as a deductible item) -4,977 -4,977 -4,977
4. Statutory reserves 0 0 0
5. Other revenue reserves 0 65 0
IV. SURPLUS FROM REVALUATION 5,024 13,328 9,864
- from tangible fixed assets 0 0 0
- from intangible fixed assets 0 0 0
- from long-term financial investments 5,024 13,328 9,864
- from short-term financial investments 0 0 0
V. RETAINED NET PROFIT OR LOSS FROM PREVIOUS PERIODS -47,394 498 0
VI. NET PROFIT OR LOSS FOR THE FINANCIAL YEAR -23,328 -6,623 -47,394
B. PROVISIONS AND LONG-TERM ACCRUED COSTS AND DEFERRED 100 REVENUES
116 101
1. Provisions for pensions and similar liabilities 100 116 100
2. Other provisions 0 0 0
3. Long-term accrued costs and deferred revenues 1 0 1
C. LONG-TERM LIABILITIES 517 9 1,000
I. LONG-TERM FINANCIAL LIABILITIES 0 9 0
1. Long-term financial liabilities to Group's companies 0 0 0
2. Long-term financial liabilities to banks 0 0 0
3. Long-term financial liabilities arising from bonds 0 0 0
4. Other long-term financial liabilities 0 9 0
II. LONG-TERM OPERATING LIABILITIES 0 0 0
1. Long-term operating liabilities to Group's companies 0 0 0
2. Long-term trade payables 0 0 0
3. Long-term bills payables 0 0 0
4. Long-term operating liabilities arising from advances 0 0 0
5. Other long-term operating liabilities 0 0 0
III. DEFERRED TAX LIABILITIES 517 1,339 1,000
D. SHORT-TERM LIABILITIES 242,789 231,272 231,630
I. LIABILITIES INCLUDED IN GROUPS FOR DISPOSAL 0 0 0
II. SHORT-TERM FINANCIAL LIABILITIES 222,080 223,161 222,452
1. Short-term financial liabilities to Group's companies 3,835 3,835 3,835
2. Short-term financial liabilities to banks 184,875 185,224 185,224
3. Short-term liabilities arising from bonds 26,500 26,515 26,515
4. Other short-term financial liabilities 6,870 7,587 6,878
III. SHORT-TERM OPERATING LIABILITIES 20,709 8,111 9,178
1. Short-term operating liabilities to Group's companies 342 131 156
2. Short-term trade payables 122 66 90
3. Short-term bills payables 0 0 0
4. Short-term operating liabilities arising from advances 201 52 52
5. Other short-term operating liabilities 20,044 7,862 8,880
E. SHORT-TERM ACCRUED COSTS AND DEFERRED REVENUES 1,355 1,120 1,890
TOTAL LIABILITIES 193,123 255,184 211,151
I Business operations of Sava d.d. and the Sava Group, Januay – September 2015 I
22
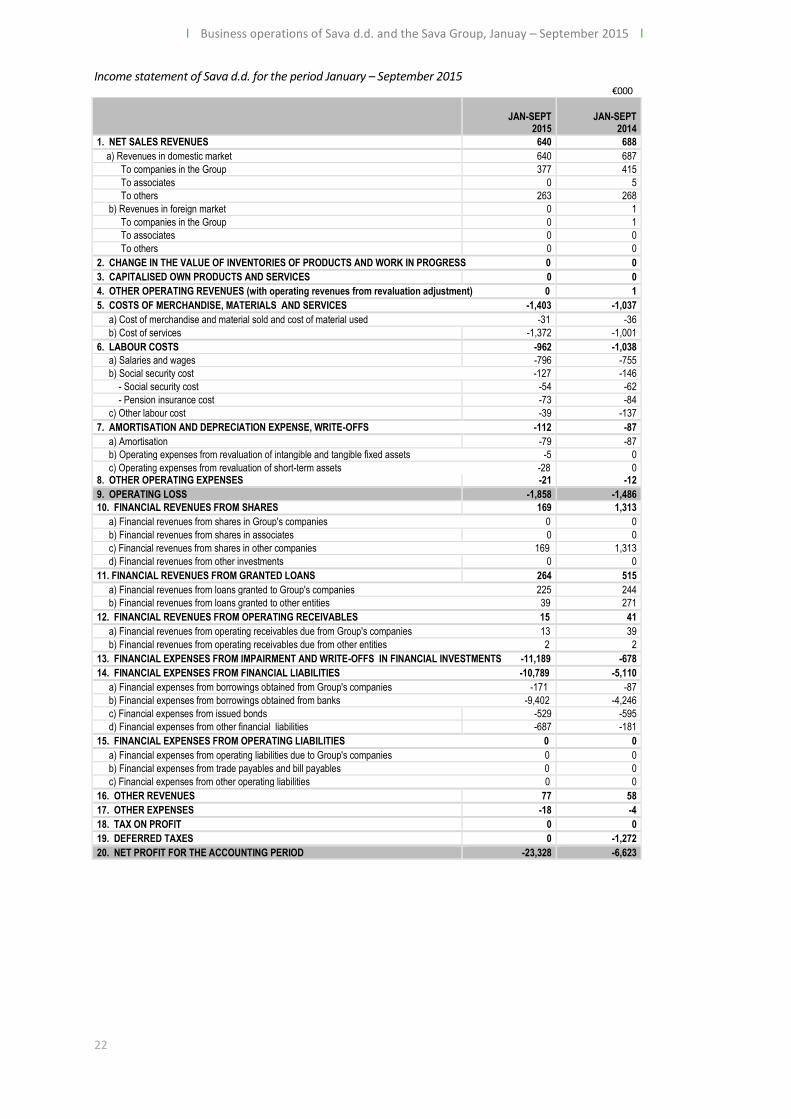
Income statement of Sava d.d. for the period January – September 2015 €000
JAN-SEPT
2015
JAN-SEPT
2014
1. NET SALES REVENUES 640 688
a) Revenues in domestic market 640 687
To companies in the Group 377 415
To associates 0 5
To others 263 268
b) Revenues in foreign market 0 1
To companies in the Group 0 1
To associates 0 0
To others 0 0
2. CHANGE IN THE VALUE OF INVENTORIES OF PRODUCTS AND WORK IN PROGRESS 0 0
3. CAPITALISED OWN PRODUCTS AND SERVICES 0 0
4. OTHER OPERATING REVENUES (with operating revenues from revaluation adjustment) 0 1
5. COSTS OF MERCHANDISE, MATERIALS AND SERVICES -1,403 -1,037
a) Cost of merchandise and material sold and cost of material used -31 -36
b) Cost of services -1,372 -1,001
6. LABOUR COSTS -962 -1,038
a) Salaries and wages -796 -755
b) Social security cost -127 -146
- Social security cost -54 -62
- Pension insurance cost -73 -84
c) Other labour cost -39 -137
7. AMORTISATION AND DEPRECIATION EXPENSE, WRITE-OFFS -112 -87
a) Amortisation -79 -87
b) Operating expenses from revaluation of intangible and tangible fixed assets -5 0
c) Operating expenses from revaluation of short-term assets -28 0 8. OTHER OPERATING EXPENSES -21 -12
9. OPERATING LOSS -1,858 -1,486
10. FINANCIAL REVENUES FROM SHARES 169 1,313
a) Financial revenues from shares in Group's companies 0 0
b) Financial revenues from shares in associates 0 0
c) Financial revenues from shares in other companies 169 1,313
d) Financial revenues from other investments 0 0
11. FINANCIAL REVENUES FROM GRANTED LOANS 264 515
a) Financial revenues from loans granted to Group's companies 225 244
b) Financial revenues from loans granted to other entities 39 271
12. FINANCIAL REVENUES FROM OPERATING RECEIVABLES 15 41
a) Financial revenues from operating receivables due from Group's companies 13 39
b) Financial revenues from operating receivables due from other entities 2 2
13. FINANCIAL EXPENSES FROM IMPAIRMENT AND WRITE-OFFS IN FINANCIAL INVESTMENTS -11,189 -678
14. FINANCIAL EXPENSES FROM FINANCIAL LIABILITIES -10,789 -5,110
a) Financial expenses from borrowings obtained from Group's companies -171 -87
b) Financial expenses from borrowings obtained from banks -9,402 -4,246
c) Financial expenses from issued bonds -529 -595
d) Financial expenses from other financial liabilities -687 -181
15. FINANCIAL EXPENSES FROM OPERATING LIABILITIES 0 0
a) Financial expenses from operating liabilities due to Group's companies 0 0
b) Financial expenses from trade payables and bill payables 0 0
c) Financial expenses from other operating liabilities 0 0
16. OTHER REVENUES 77 58
17. OTHER EXPENSES -18 -4
18. TAX ON PROFIT 0 0
19. DEFERRED TAXES 0 -1,272
20. NET PROFIT FOR THE ACCOUNTING PERIOD -23,328 -6,623
I Business operations of Sava d.d. and the Sava Group, Januay – Septemer 2015 I
23
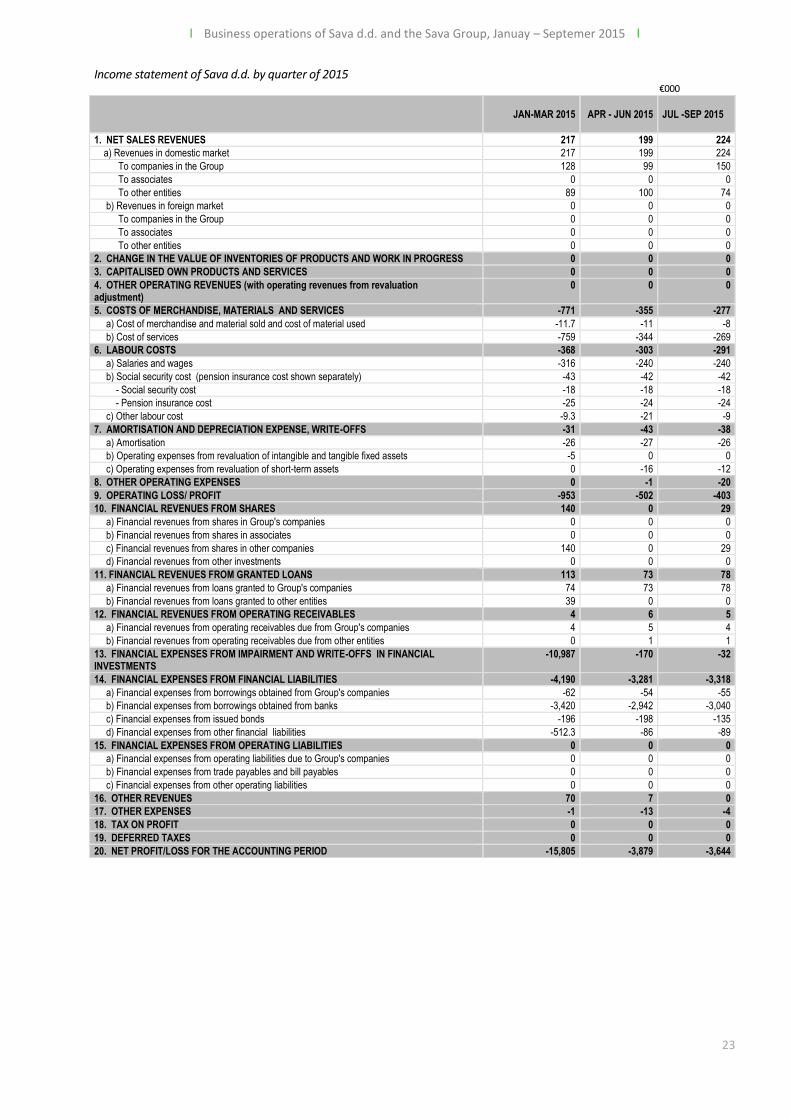
Income statement of Sava d.d. by quarter of 2015 €000
JAN-MAR 2015 APR - JUN 2015 JUL -SEP 2015
1. NET SALES REVENUES 217 199 224
a) Revenues in domestic market 217 199 224
To companies in the Group 128 99 150
To associates 0 0 0
To other entities 89 100 74
b) Revenues in foreign market 0 0 0
To companies in the Group 0 0 0
To associates 0 0 0
To other entities 0 0 0
2. CHANGE IN THE VALUE OF INVENTORIES OF PRODUCTS AND WORK IN PROGRESS 0 0 0
3. CAPITALISED OWN PRODUCTS AND SERVICES 0 0 0
4. OTHER OPERATING REVENUES (with operating revenues from revaluation adjustment)
0 0 0
5. COSTS OF MERCHANDISE, MATERIALS AND SERVICES -771 -355 -277
a) Cost of merchandise and material sold and cost of material used -11.7 -11 -8
b) Cost of services -759 -344 -269
6. LABOUR COSTS -368 -303 -291
a) Salaries and wages -316 -240 -240
b) Social security cost (pension insurance cost shown separately) -43 -42 -42
- Social security cost -18 -18 -18
- Pension insurance cost -25 -24 -24
c) Other labour cost -9.3 -21 -9
7. AMORTISATION AND DEPRECIATION EXPENSE, WRITE-OFFS -31 -43 -38
a) Amortisation -26 -27 -26
b) Operating expenses from revaluation of intangible and tangible fixed assets -5 0 0
c) Operating expenses from revaluation of short-term assets 0 -16 -12
8. OTHER OPERATING EXPENSES 0 -1 -20
9. OPERATING LOSS/ PROFIT -953 -502 -403
10. FINANCIAL REVENUES FROM SHARES 140 0 29
a) Financial revenues from shares in Group's companies 0 0 0
b) Financial revenues from shares in associates 0 0 0
c) Financial revenues from shares in other companies 140 0 29
d) Financial revenues from other investments 0 0 0
11. FINANCIAL REVENUES FROM GRANTED LOANS 113 73 78
a) Financial revenues from loans granted to Group's companies 74 73 78
b) Financial revenues from loans granted to other entities 39 0 0
12. FINANCIAL REVENUES FROM OPERATING RECEIVABLES 4 6 5
a) Financial revenues from operating receivables due from Group's companies 4 5 4
b) Financial revenues from operating receivables due from other entities 0 1 1
13. FINANCIAL EXPENSES FROM IMPAIRMENT AND WRITE-OFFS IN FINANCIAL INVESTMENTS
-10,987 -170 -32
14. FINANCIAL EXPENSES FROM FINANCIAL LIABILITIES -4,190 -3,281 -3,318
a) Financial expenses from borrowings obtained from Group's companies -62 -54 -55
b) Financial expenses from borrowings obtained from banks -3,420 -2,942 -3,040
c) Financial expenses from issued bonds -196 -198 -135
d) Financial expenses from other financial liabilities -512.3 -86 -89
15. FINANCIAL EXPENSES FROM OPERATING LIABILITIES 0 0 0
a) Financial expenses from operating liabilities due to Group's companies 0 0 0
b) Financial expenses from trade payables and bill payables 0 0 0
c) Financial expenses from other operating liabilities 0 0 0
16. OTHER REVENUES 70 7 0
17. OTHER EXPENSES -1 -13 -4
18. TAX ON PROFIT 0 0 0
19. DEFERRED TAXES 0 0 0
20. NET PROFIT/LOSS FOR THE ACCOUNTING PERIOD -15,805 -3,879 -3,644
I Business operations of Sava d.d. and the Sava Group, Januay – September 2015 I
24
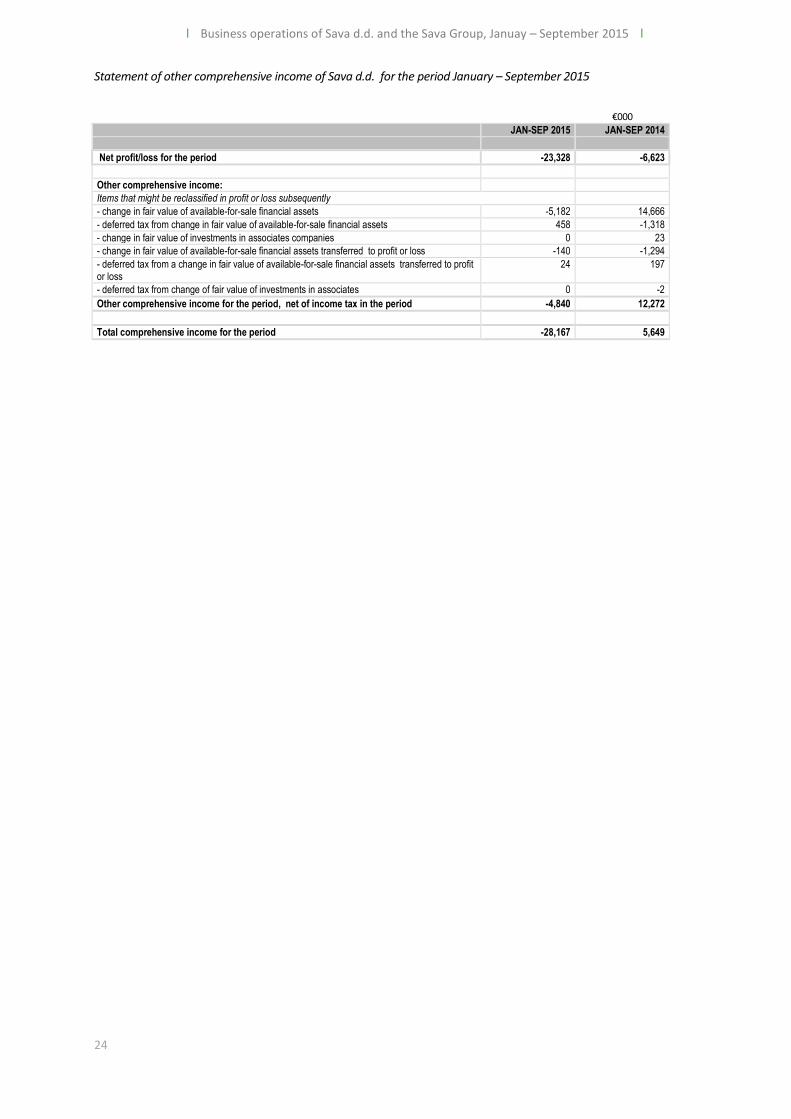
Statement of other comprehensive income of Sava d.d. for the period January – September 2015
€000
JAN-SEP 2015 JAN-SEP 2014
Net profit/loss for the period -23,328 -6,623
Other comprehensive income:
Items that might be reclassified in profit or loss subsequently
- change in fair value of available-for-sale financial assets -5,182 14,666
- deferred tax from change in fair value of available-for-sale financial assets 458 -1,318
- change in fair value of investments in associates companies 0 23
- change in fair value of available-for-sale financial assets transferred to profit or loss -140 -1,294
- deferred tax from a change in fair value of available-for-sale financial assets transferred to profit or loss
24 197
- deferred tax from change of fair value of investments in associates 0 -2
Other comprehensive income for the period, net of income tax in the period -4,840 12,272
Total comprehensive income for the period -28,167 5,649
I Business operations of Sava d.d. and the Sava Group, Januay – Septemer 2015 I
25
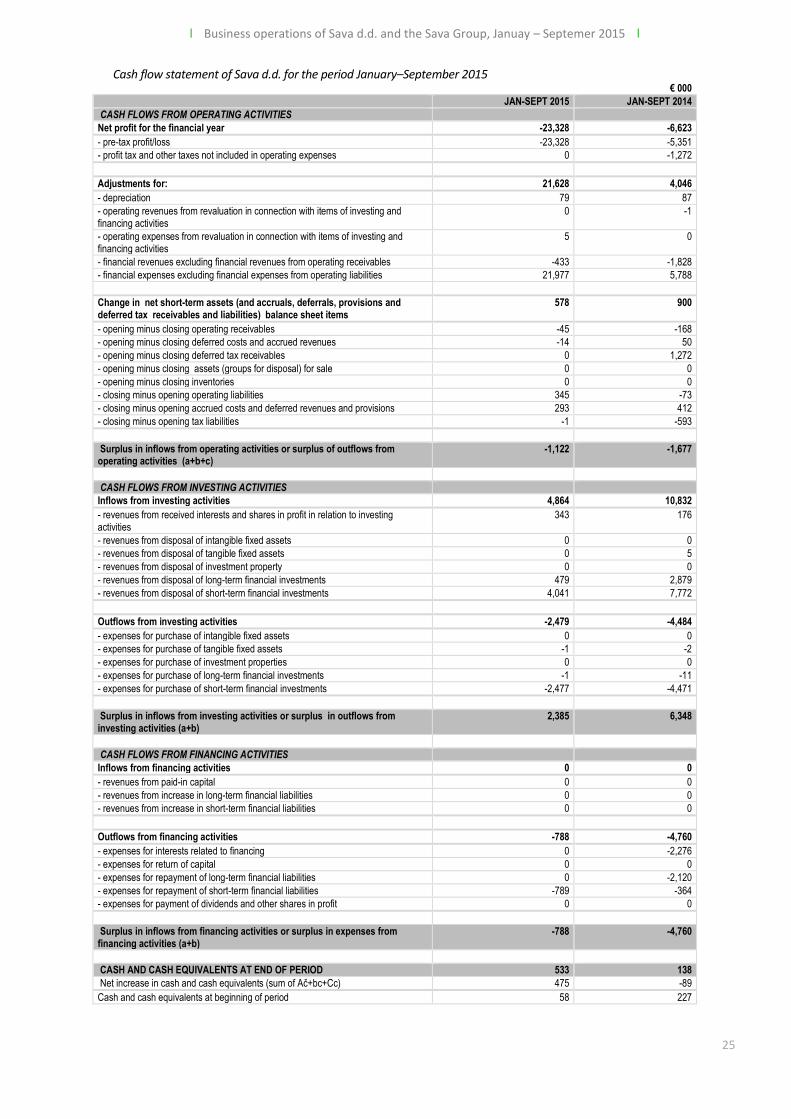
Cash flow statement of Sava d.d. for the period January–September 2015 € 000
JAN-SEPT 2015 JAN-SEPT 2014
CASH FLOWS FROM OPERATING ACTIVITIES
Net profit for the financial year -23,328 -6,623
- pre-tax profit/loss -23,328 -5,351
- profit tax and other taxes not included in operating expenses 0 -1,272
Adjustments for: 21,628 4,046
- depreciation 79 87
- operating revenues from revaluation in connection with items of investing and financing activities
0 -1
- operating expenses from revaluation in connection with items of investing and financing activities
5 0
- financial revenues excluding financial revenues from operating receivables -433 -1,828
- financial expenses excluding financial expenses from operating liabilities 21,977 5,788
Change in net short-term assets (and accruals, deferrals, provisions and deferred tax receivables and liabilities) balance sheet items
578 900
- opening minus closing operating receivables -45 -168
- opening minus closing deferred costs and accrued revenues -14 50
- opening minus closing deferred tax receivables 0 1,272
- opening minus closing assets (groups for disposal) for sale 0 0
- opening minus closing inventories 0 0
- closing minus opening operating liabilities 345 -73
- closing minus opening accrued costs and deferred revenues and provisions 293 412
- closing minus opening tax liabilities -1 -593
Surplus in inflows from operating activities or surplus of outflows from operating activities (a+b+c)
-1,122 -1,677
CASH FLOWS FROM INVESTING ACTIVITIES
Inflows from investing activities 4,864 10,832
- revenues from received interests and shares in profit in relation to investing activities
343 176
- revenues from disposal of intangible fixed assets 0 0
- revenues from disposal of tangible fixed assets 0 5
- revenues from disposal of investment property 0 0
- revenues from disposal of long-term financial investments 479 2,879
- revenues from disposal of short-term financial investments 4,041 7,772
Outflows from investing activities -2,479 -4,484
- expenses for purchase of intangible fixed assets 0 0
- expenses for purchase of tangible fixed assets -1 -2
- expenses for purchase of investment properties 0 0
- expenses for purchase of long-term financial investments -1 -11
- expenses for purchase of short-term financial investments -2,477 -4,471
Surplus in inflows from investing activities or surplus in outflows from investing activities (a+b)
2,385 6,348
CASH FLOWS FROM FINANCING ACTIVITIES
Inflows from financing activities 0 0
- revenues from paid-in capital 0 0
- revenues from increase in long-term financial liabilities 0 0
- revenues from increase in short-term financial liabilities 0 0
Outflows from financing activities -788 -4,760
- expenses for interests related to financing 0 -2,276
- expenses for return of capital 0 0
- expenses for repayment of long-term financial liabilities 0 -2,120
- expenses for repayment of short-term financial liabilities -789 -364
- expenses for payment of dividends and other shares in profit 0 0
Surplus in inflows from financing activities or surplus in expenses from financing activities (a+b)
-788 -4,760
CASH AND CASH EQUIVALENTS AT END OF PERIOD 533 138
Net increase in cash and cash equivalents (sum of Ač+bc+Cc) 475 -89
Cash and cash equivalents at beginning of period 58 227
I Business operations of Sava d.d. and the Sava Group, Januay – September 2015 I
26
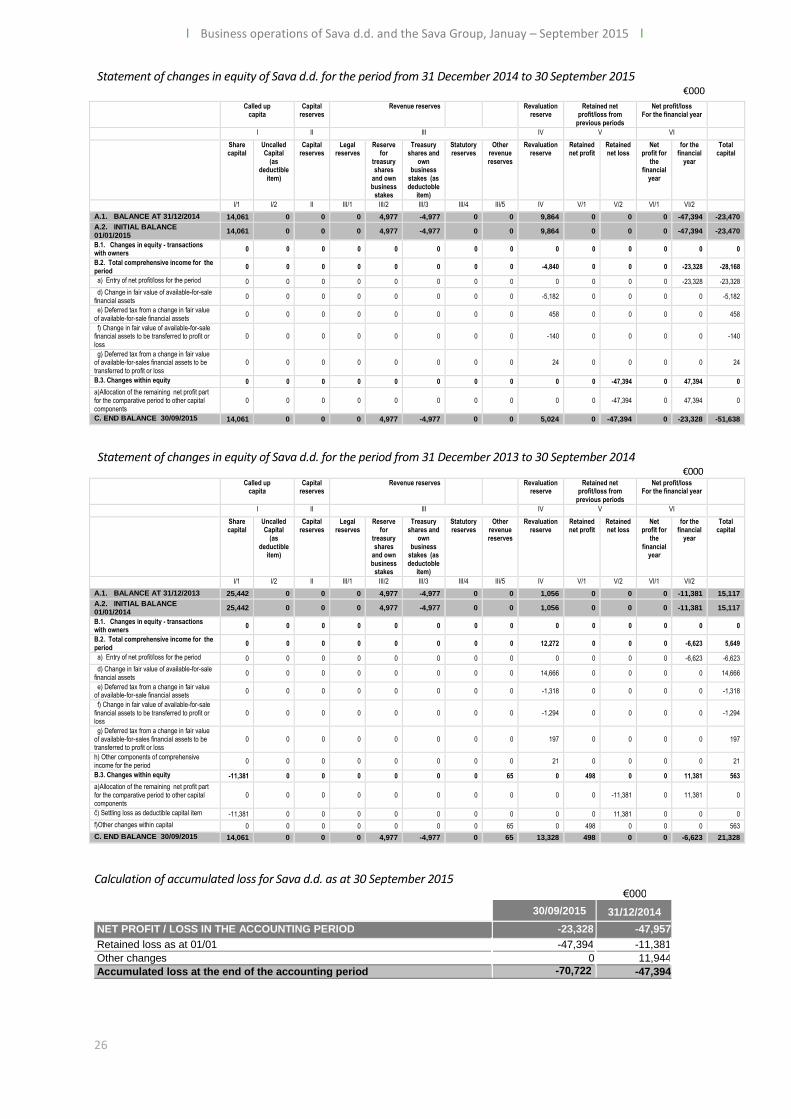
Statement of changes in equity of Sava d.d. for the period from 31 December 2014 to 30 September 2015 €000
Called up capita
Capital reserves
Revenue reserves Revaluation reserve
Retained net profit/loss from
previous periods
Net profit/loss For the financial year
I II III IV V VI
Share capital
Uncalled Capital
(as deductible
item)
Capital reserves
Legal reserves
Reserve for
treasury shares
and own business
stakes
Treasury shares and
own business
stakes (as deductoble
item)
Statutory reserves
Other revenue reserves
Revaluation reserve
Retained net profit
Retained net loss
Net profit for
the financial
year
for the financial
year
Total capital
I/1 I/2 II III/1 III/2 III/3 III/4 III/5 IV V/1 V/2 VI/1 VI/2
A.1. BALANCE AT 31/12/2014 14,061 0 0 0 4,977 -4,977 0 0 9,864 0 0 0 -47,394 -23,470
A.2. INITIAL BALANCE 01/01/2015
14,061 0 0 0 4,977 -4,977 0 0 9,864 0 0 0 -47,394 -23,470
B.1. Changes in equity - transactions with owners
0 0 0 0 0 0 0 0 0 0 0 0 0 0
B.2. Total comprehensive income for the period
0 0 0 0 0 0 0 0 -4,840 0 0 0 -23,328 -28,168
a) Entry of net profit/loss for the period 0 0 0 0 0 0 0 0 0 0 0 0 -23,328 -23,328
d) Change in fair value of available-for-sale financial assets
0 0 0 0 0 0 0 0 -5,182 0 0 0 0 -5,182
e) Deferred tax from a change in fair value of available-for-sale financial assets
0 0 0 0 0 0 0 0 458 0 0 0 0 458
f) Change in fair value of available-for-sale financial assets to be transferred to profit or loss
0 0 0 0 0 0 0 0 -140 0 0 0 0 -140
g) Deferred tax from a change in fair value of available-for-sales financial assets to be transferred to profit or loss
0 0 0 0 0 0 0 0 24 0 0 0 0 24
B.3. Changes within equity 0 0 0 0 0 0 0 0 0 0 -47,394 0 47,394 0
a)Allocation of the remaining net profit part for the comparative period to other capital components
0 0 0 0 0 0 0 0 0 0 -47,394 0 47,394 0
C. END BALANCE 30/09/2015 14,061 0 0 0 4,977 -4,977 0 0 5,024 0 -47,394 0 -23,328 -51,638
Statement of changes in equity of Sava d.d. for the period from 31 December 2013 to 30 September 2014 €000
Called up capita
Capital reserves
Revenue reserves Revaluation reserve
Retained net profit/loss from
previous periods
Net profit/loss For the financial year
I II III IV V VI
Share capital
Uncalled Capital
(as deductible
item)
Capital reserves
Legal reserves
Reserve for
treasury shares
and own business
stakes
Treasury shares and
own business
stakes (as deductoble
item)
Statutory reserves
Other revenue reserves
Revaluation reserve
Retained net profit
Retained net loss
Net profit for
the financial
year
for the financial
year
Total capital
I/1 I/2 II III/1 III/2 III/3 III/4 III/5 IV V/1 V/2 VI/1 VI/2
A.1. BALANCE AT 31/12/2013 25,442 0 0 0 4,977 -4,977 0 0 1,056 0 0 0 -11,381 15,117
A.2. INITIAL BALANCE 01/01/2014
25,442 0 0 0 4,977 -4,977 0 0 1,056 0 0 0 -11,381 15,117
B.1. Changes in equity - transactions with owners
0 0 0 0 0 0 0 0 0 0 0 0 0 0
B.2. Total comprehensive income for the period
0 0 0 0 0 0 0 0 12,272 0 0 0 -6,623 5,649
a) Entry of net profit/loss for the period 0 0 0 0 0 0 0 0 0 0 0 0 -6,623 -6,623
d) Change in fair value of available-for-sale financial assets
0 0 0 0 0 0 0 0 14,666 0 0 0 0 14,666
e) Deferred tax from a change in fair value of available-for-sale financial assets
0 0 0 0 0 0 0 0 -1,318 0 0 0 0 -1,318
f) Change in fair value of available-for-sale financial assets to be transferred to profit or loss
0 0 0 0 0 0 0 0 -1,294 0 0 0 0 -1,294
g) Deferred tax from a change in fair value of available-for-sales financial assets to be transferred to profit or loss
0 0 0 0 0 0 0 0 197 0 0 0 0 197
h) Other components of comprehensive income for the period
0 0 0 0 0 0 0 0 21 0 0 0 0 21
B.3. Changes within equity -11,381 0 0 0 0 0 0 65 0 498 0 0 11,381 563
a)Allocation of the remaining net profit part for the comparative period to other capital components
0 0 0 0 0 0 0 0 0 0 -11,381 0 11,381 0
č) Settling loss as deductible capital item -11,381 0 0 0 0 0 0 0 0 0 11,381 0 0 0
f)Other changes within capital 0 0 0 0 0 0 0 65 0 498 0 0 0 563
C. END BALANCE 30/09/2015 14,061 0 0 0 4,977 -4,977 0 65 13,328 498 0 0 -6,623 21,328
Calculation of accumulated loss for Sava d.d. as at 30 September 2015
€000 30/09/2015 31/12/2014
NET PROFIT / LOSS IN THE ACCOUNTING PERIOD -23,328 -47,957 Retained loss as at 01/01 -47,394 -11,381 Other changes 0 11,944 Accumulated loss at the end of the accounting period -70,722 -47,394
I Business operations of Sava d.d. and the Sava Group, Januay – Septemer 2015 I
27
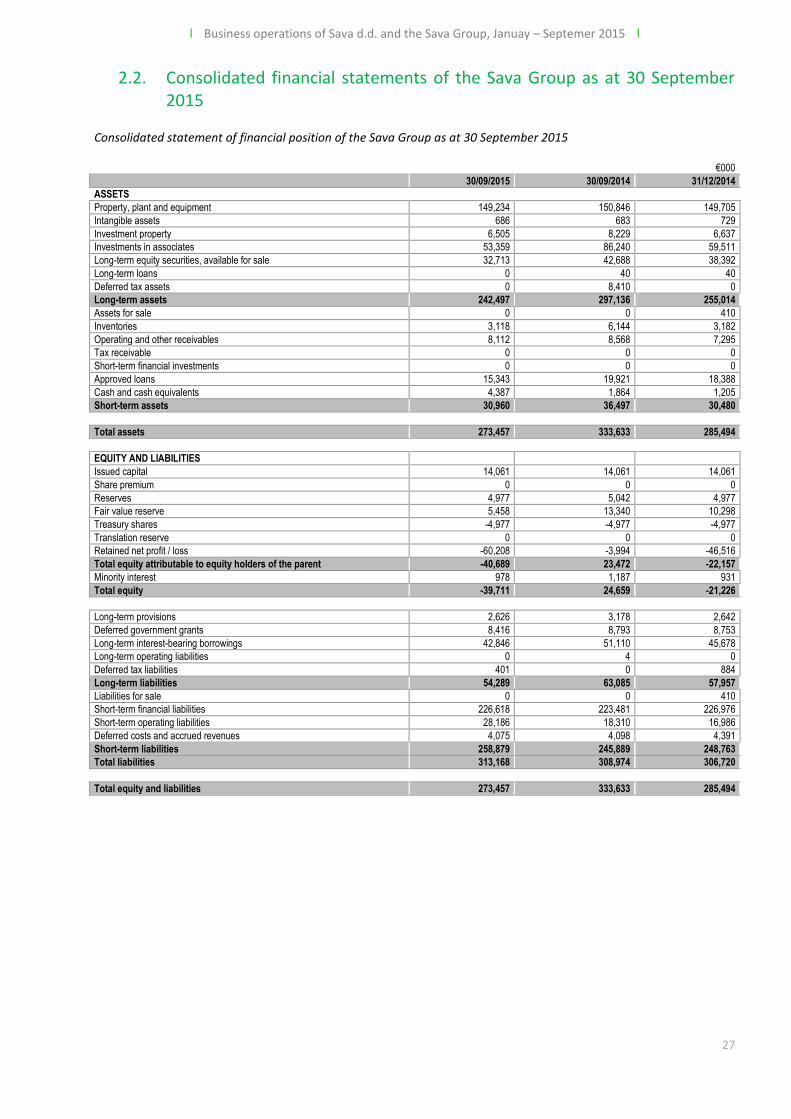
2.2. Consolidated financial statements of the Sava Group as at 30 September 2015
Consolidated statement of financial position of the Sava Group as at 30 September 2015
€000
30/09/2015 30/09/2014 31/12/2014
ASSETS
Property, plant and equipment 149,234 150,846 149,705
Intangible assets 686 683 729
Investment property 6,505 8,229 6,637
Investments in associates 53,359 86,240 59,511
Long-term equity securities, available for sale 32,713 42,688 38,392
Long-term loans 0 40 40
Deferred tax assets 0 8,410 0
Long-term assets 242,497 297,136 255,014
Assets for sale 0 0 410
Inventories 3,118 6,144 3,182
Operating and other receivables 8,112 8,568 7,295
Tax receivable 0 0 0
Short-term financial investments 0 0 0
Approved loans 15,343 19,921 18,388
Cash and cash equivalents 4,387 1,864 1,205
Short-term assets 30,960 36,497 30,480
Total assets 273,457 333,633 285,494
EQUITY AND LIABILITIES
Issued capital 14,061 14,061 14,061
Share premium 0 0 0
Reserves 4,977 5,042 4,977
Fair value reserve 5,458 13,340 10,298
Treasury shares -4,977 -4,977 -4,977
Translation reserve 0 0 0
Retained net profit / loss -60,208 -3,994 -46,516
Total equity attributable to equity holders of the parent -40,689 23,472 -22,157
Minority interest 978 1,187 931
Total equity -39,711 24,659 -21,226
Long-term provisions 2,626 3,178 2,642
Deferred government grants 8,416 8,793 8,753
Long-term interest-bearing borrowings 42,846 51,110 45,678
Long-term operating liabilities 0 4 0
Deferred tax liabilities 401 0 884
Long-term liabilities 54,289 63,085 57,957
Liabilities for sale 0 0 410
Short-term financial liabilities 226,618 223,481 226,976
Short-term operating liabilities 28,186 18,310 16,986
Deferred costs and accrued revenues 4,075 4,098 4,391
Short-term liabilities 258,879 245,889 248,763
Total liabilities 313,168 308,974 306,720
Total equity and liabilities 273,457 333,633 285,494
I Business operations of Sava d.d. and the Sava Group, Januay – September 2015 I
28
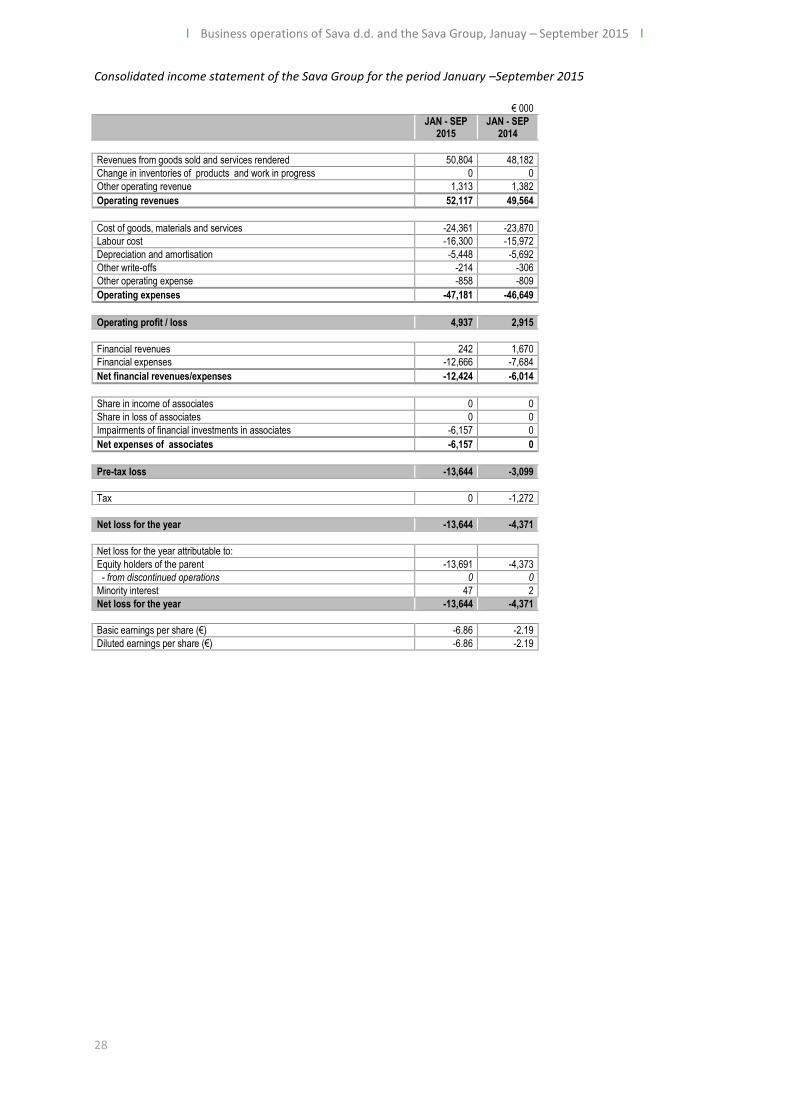
Consolidated income statement of the Sava Group for the period January –September 2015
€ 000
JAN - SEP 2015
JAN - SEP 2014
Revenues from goods sold and services rendered 50,804 48,182
Change in inventories of products and work in progress 0 0
Other operating revenue 1,313 1,382
Operating revenues 52,117 49,564
Cost of goods, materials and services -24,361 -23,870
Labour cost -16,300 -15,972
Depreciation and amortisation -5,448 -5,692
Other write-offs -214 -306
Other operating expense -858 -809
Operating expenses -47,181 -46,649
Operating profit / loss 4,937 2,915
Financial revenues 242 1,670
Financial expenses -12,666 -7,684
Net financial revenues/expenses -12,424 -6,014
Share in income of associates 0 0
Share in loss of associates 0 0
Impairments of financial investments in associates -6,157 0
Net expenses of associates -6,157 0
Pre-tax loss -13,644 -3,099
Tax 0 -1,272
Net loss for the year -13,644 -4,371
Net loss for the year attributable to:
Equity holders of the parent -13,691 -4,373
- from discontinued operations 0 0
Minority interest 47 2
Net loss for the year -13,644 -4,371
Basic earnings per share (€) -6.86 -2.19
Diluted earnings per share (€) -6.86 -2.19
I Business operations of Sava d.d. and the Sava Group, Januay – Septemer 2015 I
29
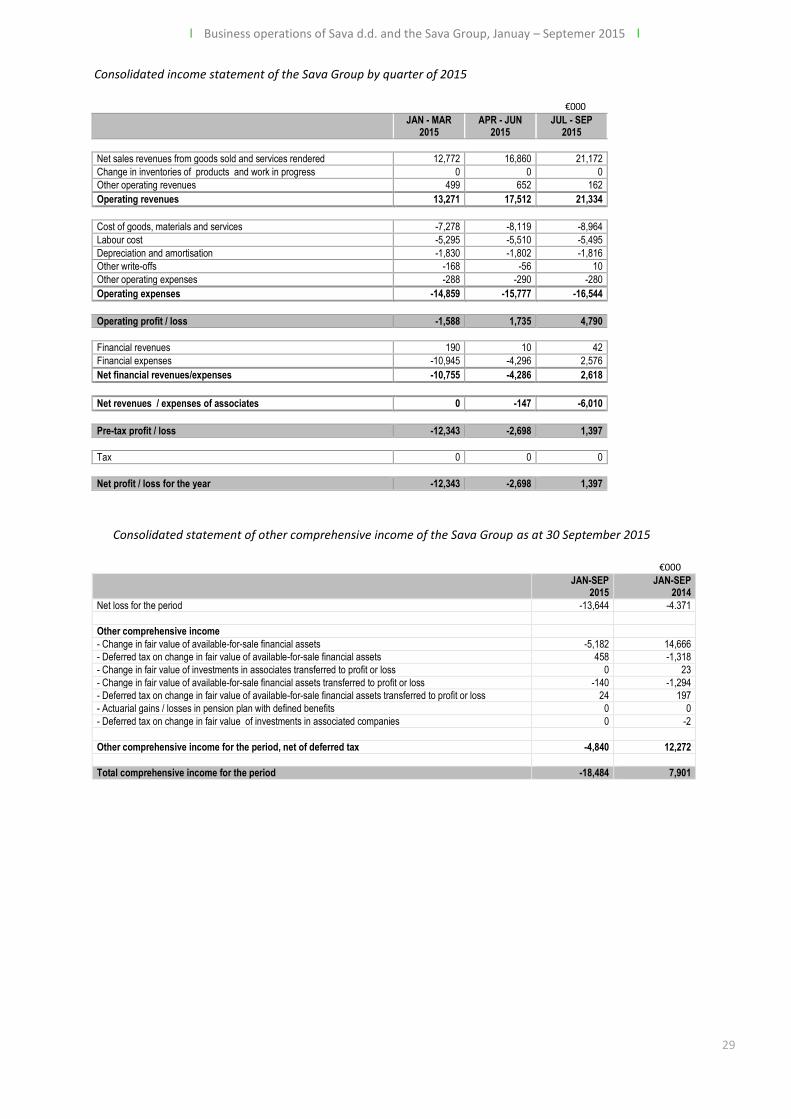
Consolidated income statement of the Sava Group by quarter of 2015
€000
JAN - MAR 2015
APR - JUN 2015
JUL - SEP 2015
Net sales revenues from goods sold and services rendered 12,772 16,860 21,172
Change in inventories of products and work in progress 0 0 0
Other operating revenues 499 652 162
Operating revenues 13,271 17,512 21,334
Cost of goods, materials and services -7,278 -8,119 -8,964
Labour cost -5,295 -5,510 -5,495
Depreciation and amortisation -1,830 -1,802 -1,816
Other write-offs -168 -56 10
Other operating expenses -288 -290 -280
Operating expenses -14,859 -15,777 -16,544
Operating profit / loss -1,588 1,735 4,790
Financial revenues 190 10 42
Financial expenses -10,945 -4,296 2,576
Net financial revenues/expenses -10,755 -4,286 2,618
Net revenues / expenses of associates 0 -147 -6,010
Pre-tax profit / loss -12,343 -2,698 1,397
Tax 0 0 0
Net profit / loss for the year -12,343 -2,698 1,397
Consolidated statement of other comprehensive income of the Sava Group as at 30 September 2015
€000
JAN-SEP 2015
JAN-SEP 2014
Net loss for the period -13,644 -4.371
Other comprehensive income
- Change in fair value of available-for-sale financial assets -5,182 14,666
- Deferred tax on change in fair value of available-for-sale financial assets 458 -1,318
- Change in fair value of investments in associates transferred to profit or loss 0 23
- Change in fair value of available-for-sale financial assets transferred to profit or loss -140 -1,294
- Deferred tax on change in fair value of available-for-sale financial assets transferred to profit or loss 24 197
- Actuarial gains / losses in pension plan with defined benefits 0 0
- Deferred tax on change in fair value of investments in associated companies 0 -2
Other comprehensive income for the period, net of deferred tax -4,840 12,272
Total comprehensive income for the period -18,484 7,901
I Business operations of Sava d.d. and the Sava Group, Januay – September 2015 I
30
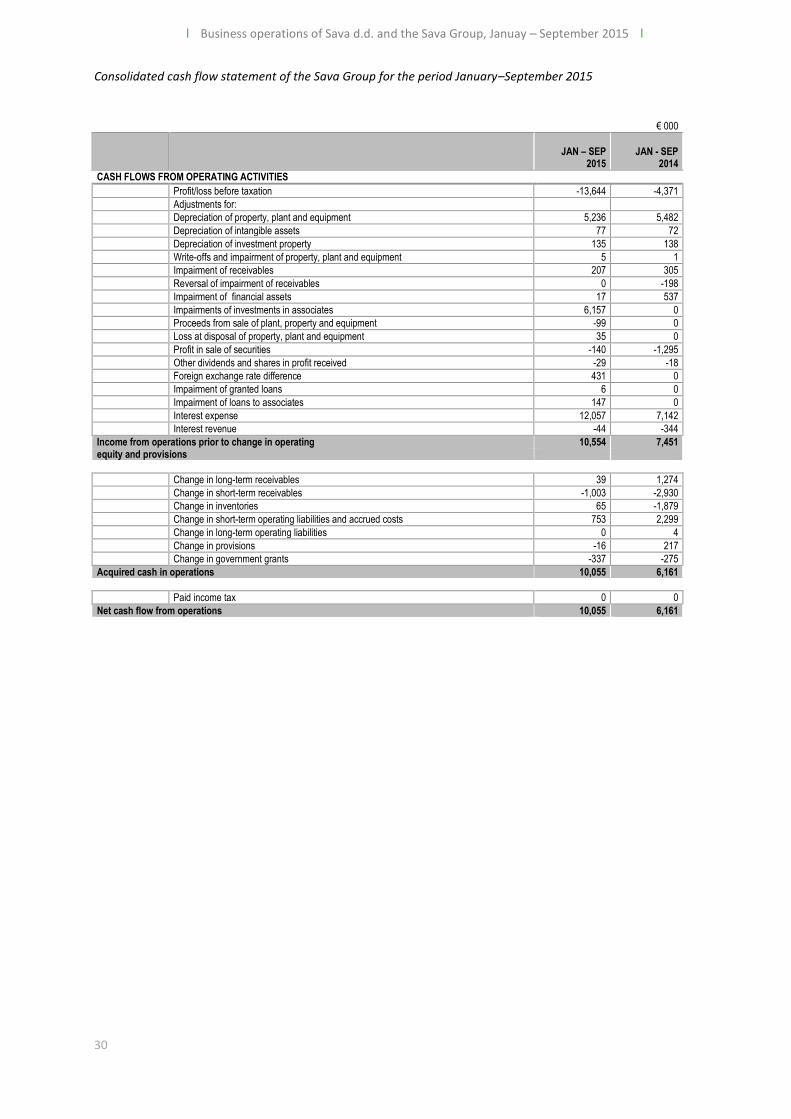
Consolidated cash flow statement of the Sava Group for the period January–September 2015
€ 000
JAN – SEP
2015
JAN - SEP
2014
CASH FLOWS FROM OPERATING ACTIVITIES
Profit/loss before taxation -13,644 -4,371
Adjustments for:
Depreciation of property, plant and equipment 5,236 5,482
Depreciation of intangible assets 77 72
Depreciation of investment property 135 138
Write-offs and impairment of property, plant and equipment 5 1
Impairment of receivables 207 305
Reversal of impairment of receivables 0 -198
Impairment of financial assets 17 537
Impairments of investments in associates 6,157 0
Proceeds from sale of plant, property and equipment -99 0
Loss at disposal of property, plant and equipment 35 0
Profit in sale of securities -140 -1,295
Other dividends and shares in profit received -29 -18
Foreign exchange rate difference 431 0
Impairment of granted loans 6 0
Impairment of loans to associates 147 0
Interest expense 12,057 7,142
Interest revenue -44 -344
Income from operations prior to change in operating 10,554 7,451 equity and provisions
Change in long-term receivables 39 1,274
Change in short-term receivables -1,003 -2,930
Change in inventories 65 -1,879
Change in short-term operating liabilities and accrued costs 753 2,299
Change in long-term operating liabilities 0 4
Change in provisions -16 217
Change in government grants -337 -275
Acquired cash in operations 10,055 6,161
Paid income tax 0 0
Net cash flow from operations 10,055 6,161
I Business operations of Sava d.d. and the Sava Group, Januay – Septemer 2015 I
31
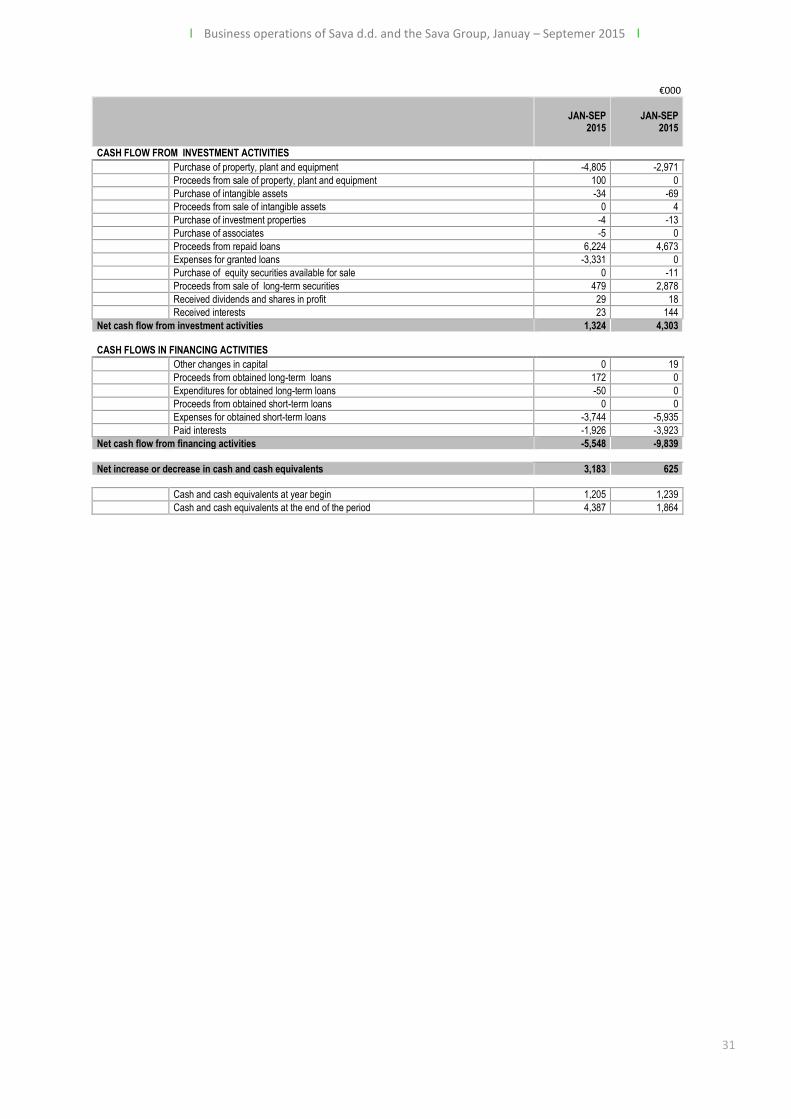
€000
JAN-SEP
2015
JAN-SEP
2015
CASH FLOW FROM INVESTMENT ACTIVITIES
Purchase of property, plant and equipment -4,805 -2,971
Proceeds from sale of property, plant and equipment 100 0
Purchase of intangible assets -34 -69
Proceeds from sale of intangible assets 0 4
Purchase of investment properties -4 -13
Purchase of associates -5 0
Proceeds from repaid loans 6,224 4,673
Expenses for granted loans -3,331 0
Purchase of equity securities available for sale 0 -11
Proceeds from sale of long-term securities 479 2,878
Received dividends and shares in profit 29 18
Received interests 23 144
Net cash flow from investment activities 1,324 4,303
CASH FLOWS IN FINANCING ACTIVITIES
Other changes in capital 0 19
Proceeds from obtained long-term loans 172 0
Expenditures for obtained long-term loans -50 0
Proceeds from obtained short-term loans 0 0
Expenses for obtained short-term loans -3,744 -5,935
Paid interests -1,926 -3,923
Net cash flow from financing activities -5,548 -9,839
Net increase or decrease in cash and cash equivalents 3,183 625
Cash and cash equivalents at year begin 1,205 1,239
Cash and cash equivalents at the end of the period 4,387 1,864
I Business operations of Sava d.d. and the Sava Group, Januay – September 2015 I
32
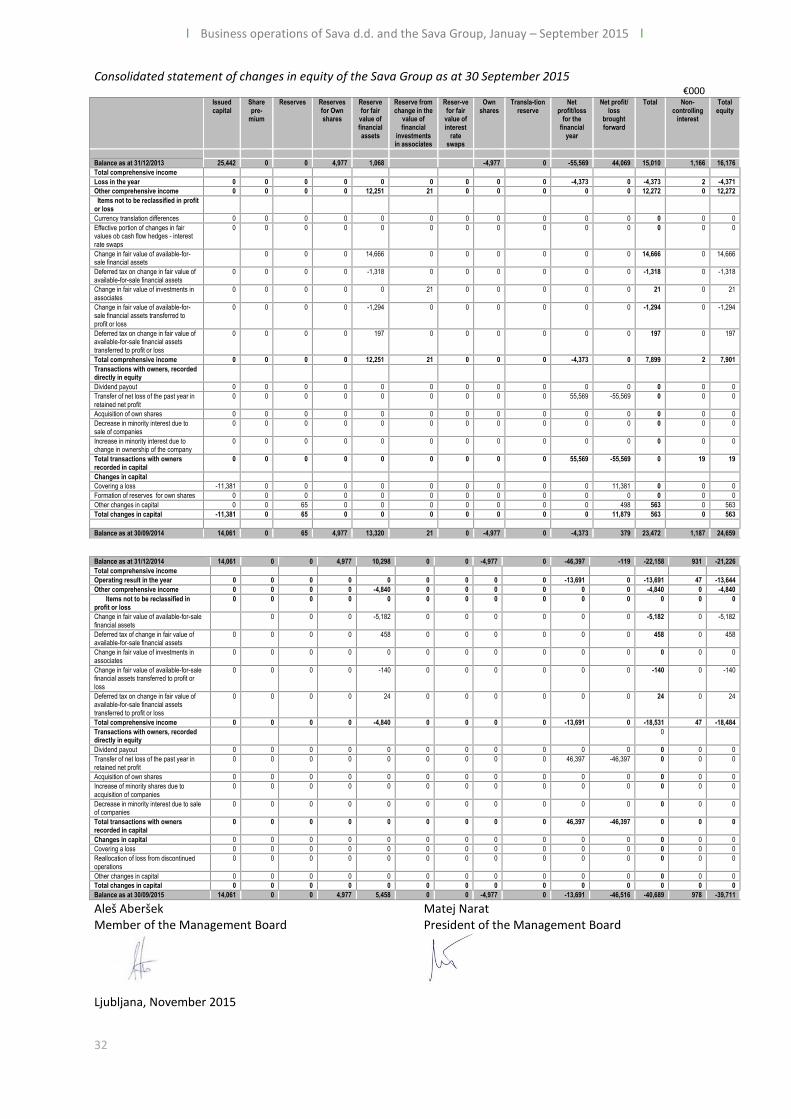
Consolidated statement of changes in equity of the Sava Group as at 30 September 2015 €000
Issued capital
Share pre-
mium
Reserves Reserves for Own shares
Reserve for fair
value of financial assets
Reserve from change in the
value of financial
investments in associates
Reser-ve for fair
value of interest
rate swaps
Own shares
Transla-tion reserve
Net profit/loss
for the financial
year
Net profit/ loss
brought forward
Total Non-controlling
interest
Total equity
Balance as at 31/12/2013 25,442 0 0 4,977 1,068 -4,977 0 -55,569 44,069 15,010 1,166 16,176
Total comprehensive income
Loss in the year 0 0 0 0 0 0 0 0 0 -4,373 0 -4,373 2 -4,371
Other comprehensive income 0 0 0 0 12,251 21 0 0 0 0 0 12,272 0 12,272
Items not to be reclassified in profit or loss
Currency translation differences 0 0 0 0 0 0 0 0 0 0 0 0 0 0
Effective portion of changes in fair values ob cash flow hedges - interest rate swaps
0 0 0 0 0 0 0 0 0 0 0 0 0 0
Change in fair value of available-for-sale financial assets
0 0 0 14,666 0 0 0 0 0 0 14,666 0 14,666
Deferred tax on change in fair value of available-for-sale financial assets
0 0 0 0 -1,318 0 0 0 0 0 0 -1,318 0 -1,318
Change in fair value of investments in associates
0 0 0 0 0 21 0 0 0 0 0 21 0 21
Change in fair value of available-for-sale financial assets transferred to profit or loss
0 0 0 0 -1,294 0 0 0 0 0 0 -1,294 0 -1,294
Deferred tax on change in fair value of available-for-sale financial assets transferred to profit or loss
0 0 0 0 197 0 0 0 0 0 0 197 0 197
Total comprehensive income 0 0 0 0 12,251 21 0 0 0 -4,373 0 7,899 2 7,901
Transactions with owners, recorded directly in equity
Dividend payout 0 0 0 0 0 0 0 0 0 0 0 0 0 0
Transfer of net loss of the past year in retained net profit
0 0 0 0 0 0 0 0 0 55,569 -55,569 0 0 0
Acquisition of own shares 0 0 0 0 0 0 0 0 0 0 0 0 0 0
Decrease in minority interest due to sale of companies
0 0 0 0 0 0 0 0 0 0 0 0 0 0
Increase in minority interest due to change in ownership of the company
0 0 0 0 0 0 0 0 0 0 0 0 0 0
Total transactions with owners recorded in capital
0 0 0 0 0 0 0 0 0 55,569 -55,569 0 19 19
Changes in capital
Covering a loss -11,381 0 0 0 0 0 0 0 0 0 11,381 0 0 0
Formation of reserves for own shares 0 0 0 0 0 0 0 0 0 0 0 0 0 0
Other changes in capital 0 0 65 0 0 0 0 0 0 0 498 563 0 563
Total changes in capital -11,381 0 65 0 0 0 0 0 0 0 11,879 563 0 563
Balance as at 30/09/2014 14,061 0 65 4,977 13,320 21 0 -4,977 0 -4,373 379 23,472 1,187 24,659
Balance as at 31/12/2014 14,061 0 0 4,977 10,298 0 0 -4,977 0 -46,397 -119 -22,158 931 -21,226
Total comprehensive income
Operating result in the year 0 0 0 0 0 0 0 0 0 -13,691 0 -13,691 47 -13,644
Other comprehensive income 0 0 0 0 -4,840 0 0 0 0 0 0 -4,840 0 -4,840
Items not to be reclassified in profit or loss
0 0 0 0 0 0 0 0 0 0 0 0 0 0
Change in fair value of available-for-sale financial assets
0 0 0 -5,182 0 0 0 0 0 0 -5,182 0 -5,182
Deferred tax of change in fair value of available-for-sale financial assets
0 0 0 0 458 0 0 0 0 0 0 458 0 458
Change in fair value of investments in associates
0 0 0 0 0 0 0 0 0 0 0 0 0 0
Change in fair value of available-for-sale financial assets transferred to profit or loss
0 0 0 0 -140 0 0 0 0 0 0 -140 0 -140
Deferred tax on change in fair value of available-for-sale financial assets transferred to profit or loss
0 0 0 0 24 0 0 0 0 0 0 24 0 24
Total comprehensive income 0 0 0 0 -4,840 0 0 0 0 -13,691 0 -18,531 47 -18,484
Transactions with owners, recorded directly in equity
0
Dividend payout 0 0 0 0 0 0 0 0 0 0 0 0 0 0
Transfer of net loss of the past year in retained net profit
0 0 0 0 0 0 0 0 0 46,397 -46,397 0 0 0
Acquisition of own shares 0 0 0 0 0 0 0 0 0 0 0 0 0 0
Increase of minority shares due to acquisition of companies
0 0 0 0 0 0 0 0 0 0 0 0 0 0
Decrease in minority interest due to sale of companies
0 0 0 0 0 0 0 0 0 0 0 0 0 0
Total transactions with owners recorded in capital
0 0 0 0 0 0 0 0 0 46,397 -46,397 0 0 0
Changes in capital 0 0 0 0 0 0 0 0 0 0 0 0 0 0
Covering a loss 0 0 0 0 0 0 0 0 0 0 0 0 0 0
Reallocation of loss from discontinued operations
0 0 0 0 0 0 0 0 0 0 0 0 0 0
Other changes in capital 0 0 0 0 0 0 0 0 0 0 0 0 0 0
Total changes in capital 0 0 0 0 0 0 0 0 0 0 0 0 0 0
Balance as at 30/09/2015 14,061 0 0 4,977 5,458 0 0 -4,977 0 -13,691 -46,516 -40,689 978 -39,711
Aleš Aberšek Matej Narat Member of the Management Board President of the Management Board
Ljubljana, November 2015
Business operations of Sava d.d.
and the Sava Group,
January - September 2015
Sava d.d.
Dunajska cesta 152
1000 Ljubljana
tel.: +386 4 206 55 10
faks: +386 4 206 64 46
www.sava.si
Recommended