econstorMake Your Publications Visible.
A Service of
zbwLeibniz-InformationszentrumWirtschaftLeibniz Information Centrefor Economics
Specht, Jule; Egloff, Boris; Schmukle, Stefan C.
Working Paper
Everything under control? The effects of age, gender,and education on trajectories of perceived control ina nationally representative German sample
SOEPpapers on Multidisciplinary Panel Data Research, No. 445
Provided in Cooperation with:German Institute for Economic Research (DIW Berlin)
Suggested Citation: Specht, Jule; Egloff, Boris; Schmukle, Stefan C. (2012) : Everythingunder control? The effects of age, gender, and education on trajectories of perceived controlin a nationally representative German sample, SOEPpapers on Multidisciplinary Panel DataResearch, No. 445, Deutsches Institut für Wirtschaftsforschung (DIW), Berlin
This Version is available at:http://hdl.handle.net/10419/59020
Standard-Nutzungsbedingungen:
Die Dokumente auf EconStor dürfen zu eigenen wissenschaftlichenZwecken und zum Privatgebrauch gespeichert und kopiert werden.
Sie dürfen die Dokumente nicht für öffentliche oder kommerzielleZwecke vervielfältigen, öffentlich ausstellen, öffentlich zugänglichmachen, vertreiben oder anderweitig nutzen.
Sofern die Verfasser die Dokumente unter Open-Content-Lizenzen(insbesondere CC-Lizenzen) zur Verfügung gestellt haben sollten,gelten abweichend von diesen Nutzungsbedingungen die in der dortgenannten Lizenz gewährten Nutzungsrechte.
Terms of use:
Documents in EconStor may be saved and copied for yourpersonal and scholarly purposes.
You are not to copy documents for public or commercialpurposes, to exhibit the documents publicly, to make thempublicly available on the internet, or to distribute or otherwiseuse the documents in public.
If the documents have been made available under an OpenContent Licence (especially Creative Commons Licences), youmay exercise further usage rights as specified in the indicatedlicence.
www.econstor.eu

SOEPpaperson Multidisciplinary Panel Data Research
Everything Under Control? The Effects of Age, Gender, and Education on Trajectories of Perceived Control in a Nationally Representative German Sample
Jule Specht, Boris Egloff, Stefan C. Schmukle
445 201
2SOEP — The German Socio-Economic Panel Study at DIW Berlin 445-2012

SOEPpapers on Multidisciplinary Panel Data Research at DIW Berlin This series presents research findings based either directly on data from the German Socio-Economic Panel Study (SOEP) or using SOEP data as part of an internationally comparable data set (e.g. CNEF, ECHP, LIS, LWS, CHER/PACO). SOEP is a truly multidisciplinary household panel study covering a wide range of social and behavioral sciences: economics, sociology, psychology, survey methodology, econometrics and applied statistics, educational science, political science, public health, behavioral genetics, demography, geography, and sport science. The decision to publish a submission in SOEPpapers is made by a board of editors chosen by the DIW Berlin to represent the wide range of disciplines covered by SOEP. There is no external referee process and papers are either accepted or rejected without revision. Papers appear in this series as works in progress and may also appear elsewhere. They often represent preliminary studies and are circulated to encourage discussion. Citation of such a paper should account for its provisional character. A revised version may be requested from the author directly. Any opinions expressed in this series are those of the author(s) and not those of DIW Berlin. Research disseminated by DIW Berlin may include views on public policy issues, but the institute itself takes no institutional policy positions. The SOEPpapers are available at http://www.diw.de/soeppapers Editors: Jürgen Schupp (Sociology, Vice Dean DIW Graduate Center) Gert G. Wagner (Social Sciences) Conchita D’Ambrosio (Public Economics) Denis Gerstorf (Psychology, DIW Research Professor) Elke Holst (Gender Studies) Frauke Kreuter (Survey Methodology, DIW Research Professor) Martin Kroh (Political Science and Survey Methodology) Frieder R. Lang (Psychology, DIW Research Professor) Henning Lohmann (Sociology, DIW Research Professor) Jörg-Peter Schräpler (Survey Methodology, DIW Research Professor) Thomas Siedler (Empirical Economics) C. Katharina Spieß (Empirical Economics and Educational Science)
ISSN: 1864-6689 (online)
German Socio-Economic Panel Study (SOEP) DIW Berlin Mohrenstrasse 58 10117 Berlin, Germany Contact: Uta Rahmann | [email protected]

1
IN PRESS (DEVELOPMENTAL PSYCHOLOGY)
COPYRIGHT @ American Psychological Association
http://www.apa.org/pubs/journals/dev/index.aspx
This article may not exactly replicate the final version published in the APA journal.
It is not the copy of record.
Everything Under Control?
The Effects of Age, Gender, and Education on Trajectories of Perceived Control in a
Nationally Representative German Sample
Jule Specht
University of Münster
Boris Egloff
Johannes Gutenberg University of Mainz
Stefan C. Schmukle
University of Leipzig

EVERYTHING UNDER CONTROL? 2
Author Note
Jule Specht, Department of Psychology, University of Münster; Boris Egloff,
Department of Psychology, Johannes Gutenberg University of Mainz; Stefan C. Schmukle,
Department of Psychology, University of Leipzig.
Jule Specht is now at the Department of Psychology, University of Leipzig, Leipzig,
Germany.
This study was supported by a scholarship of the German National Academic
Foundation to Jule Specht.
The data used in this publication were made available by the German Socio-
Economic Panel (SOEP, Data for years 1984-2009, Version 26, 2010) at the German
Institute for Economic Research (DIW Berlin), Berlin.
Correspondence concerning this article should be addressed to Jule Specht,
Department of Psychology, University of Leipzig, Seeburgstr. 14-20, 04103 Leipzig,
Germany. Email: [email protected]

EVERYTHING UNDER CONTROL? 3
Abstract
Perceived control is an important variable for various demands involved in successful
aging. However, perceived control is not set in stone, but rather changes throughout the life
course. The aim of this study was to identify cross-sectional age differences and
longitudinal mean-level changes as well as rank-order changes in perceived control with
respect to sex and education. Furthermore, changes in income and health were analyzed to
explain trajectories of perceived control. In a large and representative sample of Germans
across all of adulthood, 9,484 individuals gave information about their perceived control
twice over a period of 6 years. Using LOESS curves and latent structural equation
modeling, four main findings were revealed: (a) Perceived control increased until ages 30
to 40, then decreased until about age 60, and increased slightly afterwards; (b) The rank
order of individuals in perceived control was relatively unstable, especially in young
adulthood, and reached a plateau at about age 40; (c) Men perceived that they had more
control than women did, but there were no sex differences in the development of perceived
control; (d) Individuals with more education perceived that they had more control than
those with less education, and there were slight differences in the development of perceived
control dependent on education. Taken together, these findings offer important insights into
the development of perceived control across the life span.
Keywords: perceived control, personality development, longitudinal, representative
sample

EVERYTHING UNDER CONTROL? 4
Everything Under Control?
The Effects of Age, Gender, and Education on Trajectories of Perceived Control in a
Nationally Representative German Sample
Successful aging requires various forms of adaptations to respond to the changing
demands across the life course (Roberts, Wood, & Smith, 2005). Perceived control is one
central trait that helps people to effectually meet challenges and has been consequently
linked to several aging-related indicators (Infurna, Gerstorf, Ram, Schupp, & Wagner,
2011; Infurna, Gerstorf, Robertson, Berg, & Zarit, 2010; Infurna, Gerstorf, & Zarit, 2011;
Lachman, 2006; Moffitt et al., 2011). However, systematic analyses of dynamic changes in
perceived control across the entire lifespan in a generalizable sample remain acutely rare. In
this study, we wanted to fill this gap by analyzing stability and change in perceived control
with respect to age, gender, and education in a large and longitudinal nationally
representative sample.
Defining Perceived Control
Perceived control is a learned and generalized trait describing the extent to which a
person believes he or she has influence over his or her own life (Folkman, 1984; Rotter,
1966; Skinner, 1996). Individuals with a high sense of control believe they have a strong
impact on the things that happen in their lives. By contrast, individuals who perceive
themselves to have less control attribute incidents to sources outside of their influence, such
as luck, chance, fate, or powerful others.
In defining perceived control, two important distinctions should be clarified: (a)
Generalized perceived control (also termed general sense of control or beliefs about
control) needs to be distinguished from domain-specific control beliefs such as health locus

EVERYTHING UNDER CONTROL? 5
of control (e.g., Multidimensional Health Locus of Control, Wallston & Wallston, 1981) or
intellectual control (Lachman, Baltes, Nesselroade, & Willis, 1982), which allow for a
more precise prediction of behavior in the according domain (Lachman, 1986). In contrast
to domain-specific control beliefs, generalized perceived control intends to capture a more
situation-independent trait-like personality characteristic that is able to predict behavior in a
broad range of situations. (b) Generalized perceived control needs to be conceptually
separated from concrete control strategies such as primary control (attempts to achieve
effects in the external environment) and secondary control (attempts to achieve changes
within the individual; Heckhausen & Schulz, 1995). In contrast to these concrete behavioral
control strategies, generalized perceived control is conceptualized as a broad personality
construct. By integrating all of the various control concepts mentioned above, one can
summarize that the utilization of a concrete control strategy will vary as a function of the
generalized control beliefs and the domain-specific control beliefs held by an individual as
well as by characteristics of the specific situation.
The Impact of Perceived Control
Most studies have found that ―a high sense of control is associated with being
happy, healthy, wealthy, and wise‖ (Lachman, 2006, p. 283). For example, DeNeve and
Cooper (1998) conducted a comprehensive meta-analysis on 148 studies to identify
personality constructs that are related to subjective well-being. Among the 137 personality
traits under analysis, one of the most important traits influencing subjective well-being was
belief in chance (one aspect of low perceived control) with low belief in chance resulting in
higher subjective well-being.

EVERYTHING UNDER CONTROL? 6
There is also a long tradition of perceived control in health research: In a meta-
analysis, Benassi, Sweeney, and Dufour (1988) estimated the relation between perceived
control and depression. Their consideration of 97 studies resulted in the finding that less
perceived control was consistently related to greater depression. In several studies, Taylor
and colleagues found that high perceived control is also beneficial when individuals are
confronted with physical diseases (Taylor, Kemeny, Reed, Bower, & Gruenewald, 2000).
For example, gay HIV-positive men who had high perceived control of disease progression
were less likely to develop AIDS symptoms in subsequent years, even after controlling for
several other predictive variables. Furthermore, Infurna, Gerstorf, Ram et al. (2011) found
perceived control to be predictive of lower disability and mortality rates in a general
sample. However, in uncontrollable situations (e.g., when coping with the death of a
spouse), it may be beneficial to perceive less control (Specht, Egloff, & Schmukle, 2011b).
In conclusion, whereas there is strong evidence that control is beneficial in most situations,
the effects of perceived control in a given situation certainly depend on the current
developmental task (Kunzmann, Little, & Smith, 2002).
Perceived Control across the Life Course
Personality develops throughout the entire life course due to changing
developmental tasks (Roberts, et al., 2005; Specht, Egloff, & Schmukle, 2011a). In the case
of perceived control, several biological and situational factors enhance and restrict the
controllability of the environment across the life course, following an inverted U-shaped
function (Heckhausen, Wrosch, & Schulz, 2010): First, controllability rapidly increases in
childhood until middle age, and then declines in old age. Based on the actual development
of controllability, perceived control should change accordingly across the life course: It

EVERYTHING UNDER CONTROL? 7
should first increase, reaching a peak in middle adulthood, and afterwards decrease until
old age.
Prior Studies on Age and Perceived Control
In a study by Lewis, Ross, and Mirowsky (1999; based on data from the year 1979),
cross-sectional differences in perceived control were investigated in a large and
representative sample of adolescents aged 14 to 22 from the US population. Indeed, Lewis
and colleagues found that with increasing age, individuals reported higher levels of
perceived control.
Studies on North Americans have found that perceived control then continuously
declines from about age 30 or 40 until old age: Mirowsky (1995) found in cross-sectional
representative data of US Americans between the ages of 18 and 90 years, that perceived
control was highest in individuals under age 30, followed by an accelerating decline. In two
other studies by Mirowsky and Ross (Mirowsky & Ross, 2007; Ross & Mirowsky, 2002)
using similar US data, older individuals again reported less perceived control, although this
downward trend did not begin until age 40 in this sample. Here, additional longitudinal
information on perceived control 3 and 6 years later largely confirmed the results found
cross-sectionally. However, because of the rather small sample sizes relative to the huge
age range, age groups of the oldest old were very small, which may have distorted results.
The strong decline in perceived control for older ages has often been attributed to
lessened controllability of life as a result of emerging health problems. Interestingly,
physical impairment can explain only a small amount of those age-group differences, and
the impact of cohort differences in education seems to be much more important (Mirowsky,
1995).

EVERYTHING UNDER CONTROL? 8
Contrary to the findings of Mirowsky and Ross (2007), Lachman and Leff (1989)
found in their sample of elderly adults no changes in generalized control beliefs over a
period of 5 years. Similarly, Heckhausen and Schulz (1995) summarized that generalized
control remains stable in old age. Lachman (2006) suggests that the maintenance of control
beliefs in old age is due to changing standards, even though individuals do perceive an
increasing number of uncontrollable factors. In sum, although several studies acknowledge
an influence of age on perceived control, there is no study that comprehensively and
longitudinally explores the effects of demographic variables on perceived control in a
generalizable sample of adequate size.
Sex Differences and Perceived Control
It is commonly found that women believe they have less control over their lives
than men believe themselves to have (e.g., Gatz & Karel, 1993). There is evidence that this
effect emerged in the 1970s, presumably due to the heightened awareness of failing gender
justice in the labor market and other settings (Doherty & Baldwin, 1985). In accordance
with that, Ross and Mirowsky (2002) found in cross-sectional comparisons of US
Americans that a large amount of this sex difference can be explained by differences in
education, work, and economic conditions.
Educational Differences and Perceived Control
Education and perceived control are highly associated in several ways. First,
individuals with higher perceived control set more challenging goals for themselves
(Bandura & Wood, 1989) and therefore aim at higher educational degrees and are more
successful in their academic performances (Prociuk & Breen, 1975). Second, receiving
more education heightens perceived control (Lewis et al., 1999). And third, a higher level

EVERYTHING UNDER CONTROL? 9
of education facilitates a person’s ability to cope with the many challenges that occur
during life and produces more success in the labor market, higher socio-economic status,
and fewer financial problems, which, in turn, should advance perceived control or at least
guard against losing it (Mirowsky & Ross, 2007).
Types of Change Measures
The development of personality can be described in several ways, each with
different implications. Here, we will examine the two most common population indices of
change: mean-level changes and rank-order changes. The studies cited above have focused
mainly on mean-level changes, which can be investigated cross-sectionally and
longitudinally and result in values indicating absolute deviations in perceived control at
different ages or in different subgroups.
Analyses of rank-order stability in perceived control across the life span have been
sparse. Rank-order stability indicates whether groups of individuals change over time in
their relative placement to each other. This takes into account the fact that, for example,
although a group of people may be completely stable in their mean perceived control (i.e.,
there are no mean-level changes), they may change in relation to each other (i.e., there are
strong rank-order changes) if individuals change in different directions. Or, the other way
around, it may be that a group of people changes strongly over time (i.e., there are mean-
level changes), but the individuals retain their relative order to each other (i.e., there are no
rank-order changes) if all of them change in the same direction.
To the best of our knowledge, differences in rank-order changes in perceived
control at different ages have not been under investigation yet; however, there have been a
few findings regarding the stability of personality trait development in general: Regarding

EVERYTHING UNDER CONTROL? 10
the so-called Big Five, rank-order stability was found to follow primarily an inverted U-
shaped function, reflecting high stability in middle adulthood and less stability in younger
and older individuals (Ardelt, 2000; Lucas & Donnellan, 2011; Specht et al., 2011a).
However, Roberts and DelVecchio (2000) reported increases in rank-order stability until
the age group 50 to 59, where it reached a plateau.
The Present Study
Cross-sectional mean-level differences, longitudinal mean-level changes, and rank-
order changes in perceived control were examined in individuals across all of adulthood
with respect to age, sex, and education. We used a representative adult sample of about
9,500 Germans, which (a) enabled us to infer the results to a wide population due to its
representativeness and (b) allowed us to detect even small interaction effects due to the
large sample size. Because of the longitudinal design of the study, we were furthermore
able to (c) compare cross-sectional and longitudinal results to account for period effects and
(d) provide the first evidence for the changing stability of perceived control in individuals
relative to each other.
Our hypotheses can be summarized as follows: (1) We expected to find differences
in the mean levels of perceived control over the life course using both cross-sectional and
longitudinal analyses. Because we are not aware of comparable analyses in Europe, our
assumptions are based on (a) the theoretical consideration that trajectories of perceived
control should be comparable to trajectories of objective controllability (i.e., increases until
middle age and decreases afterwards, Heckhausen et al., 2010) and (b) findings in non-
European samples that have suggested increases in perceived control until about age 40 and
decreases afterwards (Mirowsky, 1995; Mirowsky & Ross, 2007; Ross & Mirowsky, 2002).

EVERYTHING UNDER CONTROL? 11
(2) Borrowing from research on the Big Five personality dimensions, rank-order stability in
perceived control was expected to either (a) increase with age and reach a plateau at age 50
(Roberts & DelVecchio, 2000) or (b) follow a quadratic (inverted U-shaped) function with
a peak at about age 50 (Ardelt, 2000; Lucas & Donnellan, 2011; Specht et al., 2011a). (3)
We assumed we would find effects of sex and education on perceived control such that men
and more highly educated individuals would perceive more control than women and less
educated individuals, respectively (Lachman, 2006). Furthermore, we wanted to analyze
whether trajectories in perceived control differed for men and women and for more and less
educated individuals, respectively.
Method
Participants
The data used in this study were provided by the German Socio-Economic Panel
(SOEP v26), which has offered longitudinal information on a large and representative
sample of private households in Germany since 1984 (see Wagner, Frick, & Schupp, 2007,
for details).1 All members of chosen households aged 16 years and older were asked yearly
to answer several questions concerning their living conditions. Individuals with no more
than one missing item on the questionnaire of perceived control for each assessment year
were used for our analyses. Because the sample size decreased in very old age (Ns < 40 per
year), we restricted our analyses to participants not older than age 76 (cf. Donnellan &
Lucas, 2008; Lucas & Donnellan, 2009; Specht et al., 2011a). Thus, the final sample
consisted of 9,484 individuals (4,960 women) who all gave information about perceived
control in both assessment years. Their mean age was 43.38 years in the first year of
measurement (SD = 15.04).

EVERYTHING UNDER CONTROL? 12
To test for attrition effects, we compared participants in the final sample
(continuers) to those who answered only in the first year (drop-outs). Continuers were older
(d = .09, p < .001), more likely to be female, χ²(1) = 19.54, p < .001, and reported higher
perceived control (d = .10, p < .001), although all of those selectivity effects were rather
small.
Measures
Perceived control. Perceived control was surveyed in the years 1999 and 2005 with
seven items each: "How my life goes depends on myself"; "Compared to others, I haven't
achieved what I deserved"; "What one achieves in life is mainly a question of luck or fate";
"I often have the experience that others make decisions regarding my life"; "When I
encounter difficulties, I have doubts about my abilities"; "The opportunities I have in life
are determined by social conditions"; "I have little control over the things that happen in
my life."
Participants were asked to indicate their agreement on a scale ranging from 1
(strongly agree) to 4 (strongly disagree) in 1999 and on a scale ranging from 1 (strongly
disagree) to 7 (strongly agree) in 2005. All items were recoded so that higher values
indicated greater feelings of control and the scale from 1999 was projected to the scale
from 2005 to enable comparison of the two years (values 1, 2, 3, and 4 in 1999 were
recoded into 1, 3, 5, and 7, respectively)². Values were then standardized for the LOESS
curves or within the structural equation models, respectively, to allow for comparability
across studies. As expected, we found a clear one-factorial solution with only the first
eigenvalue larger than 1 (2.49 in 1999 and 2.52 in 2005). The measure was reasonably

EVERYTHING UNDER CONTROL? 13
reliable with a mean internal consistency of Cronbach’s alpha = .69 in 1999 and .70 in
2005.
Education. Level of education was coded as 1 (completed basic education; the
equivalent of high school; this includes individuals who have the German Abitur,
Fachhochschulreife, or finished apprenticeship) or 0 (did not complete basic education; this
includes individuals with no educational degree or solely the German Haupt- or
Realschulabschluss). Because young participants might not have yet completed their
education, we restricted the analyses to individuals aged 25 and older, which reduced the
sample size in analyses involving education to 8,399 (4,360 women) individuals. About
21% of our sample had less than a high school degree in 1999.
Statistical Models
We used locally weighted smoothing curves (LOESS curves) to analyze differences
in the manifest values of perceived control for different ages, separately for each sex and
each educational level, respectively. This enabled us to look at the raw data more directly
as compared to models derived from specific theoretical assumptions, which could have led
to an oversight of important characteristics of the data. Afterwards we analyzed changes in
perceived control with two different types of longitudinal structural equation models (SEM;
see below), which both used latent factors to distinguish structural relations and random
measurement error (Bollen, 1989). To ensure that changes on a latent level were not caused
by changes in the relation between the latent variables and the manifest indicators (Bollen
& Curran, 2006), we first tested for strict factorial invariance.
The models were estimated with Mplus Version 6 (Muthén & Muthén, 1998-2010).
Evaluation of model fit was based on the full information maximum likelihood (FIML)

EVERYTHING UNDER CONTROL? 14
estimator that is able to handle missing data by computing casewise likelihood functions,
which are aggregated across all cases and then maximized. The FIML estimator assumes
multivariate normality and randomly missing data; however, simulation studies have
suggested that the FIML estimator is superior to listwise or pairwise deletion or response
pattern imputation even if those assumptions are not met (Enders & Bandalos, 2001).3
The interpretation of model fit was based on multiple fit indices: A comparative fit
index (CFI) above .90 and a root mean square error of approximation (RMSEA) below .08
reflect an acceptable fit (Marsh, Hau, & Grayson, 2005), just as a standardized root mean
square residual (SRMR) below .08 reflects good model fit (Hu & Bentler, 1998).
Measurement invariance models. The basis of the two change models is the
measurement invariance model. Each measurement point (1999 and 2005) was included as
a latent factor with seven indicators (resulting from the seven items), and the latent factors
were allowed to correlate. The model was built to conform to strict factorial invariance,
which means that factor loadings, measurement intercepts, and error variances were
constrained to be equal across time points (Meredith, 1993). Furthermore, the residuals of
the indicators were allowed to correlate over time to account for effects not due to the
factors of interest (Bollen & Curran, 2006; Marsh & Hau, 1996).
To test whether strict factorial invariance held also across the different subgroups
(i.e., for each sex and educational degree), we created two multiple-group models. There,
factor loadings, measurement intercepts, error variances, and error covariances were
constrained to be equal across measurement occasions and groups (men and women and
more and less educated individuals, respectively).

EVERYTHING UNDER CONTROL? 15
Latent change models. Mean-level changes were analyzed using a latent change
model (Duncan, Duncan, & Strycker, 2006) as depicted in Figure 1. The paths from the
latent intercept factor (i) to the latent perceived control variables at Time 1 and Time 2
were fixed to 1, such that i reflects cross-sectional mean-level differences in perceived
control at the first measurement point. The paths from the latent slope factor (s) to the latent
perceived control variables were fixed to 0 at Time 1 and fixed to 1 at Time 2, such that s
reflects longitudinal differences in mean-level changes in perceived control from Time 1 to
Time 2 (i.e., 6 years later).
First, we tested for general mean-level age differences in perceived control. We
therefore included sex, age, age², and age³ as covariates.4 Higher order terms for age were
excluded stepwise when failing to reach significance.
To analyze age differences in perceived control for men and women, we included
interaction terms using sex and the remaining age terms in the model. To test for
significance, we compared a model in which the interaction terms were set to 0 with a
model in which the respective interaction terms were freely estimated using a χ²-difference
test. The same was done to analyze differences in education where we included the main
effect of education in the model as well.
Latent moderated regression models. Rank-order changes were analyzed using a
latent moderated structural equation model (LMS; Klein & Moosbrugger, 2000) as depicted
in Figure 2. The model was estimated using a maximum likelihood estimator with robust
standard errors (MLR) and a numerical integration algorithm. The standardized effect of
perceived control at t1 (the first measurement point) on perceived control at t2 (the second
measurement point) equates to the rank-order stability.

EVERYTHING UNDER CONTROL? 16
Effects of age on the rank-order consistency of perceived control were tested by
including sex, age, age², and age³ as moderators (by incorporating those variables as well as
their interactions with t1 as predictors of t2). Again, higher order terms of age were
excluded stepwise when failing to reach significance.
To analyze effects of sex and education on the rank-order consistency at different
ages, we included the respective interaction terms as moderators as well. To test for
significance, we compared a model in which the relevant three-way interaction terms (e.g.,
T1 · Sex · Age) were set to 0 with a model in which the respective interaction terms were
freely estimated using a Satorra-Bentler scaled χ²-difference test (Satorra & Bentler, 1999)
based on the log likelihood values and scaling correction factors obtained with the MLR
estimator.
Unfortunately, and to the best of our knowledge, it is not yet possible to estimate an
overall model fit for an LMS model (Klein & Moosbrugger, 2000; Marsh, Wen, & Hau,
2004). In accordance with prior research (Specht et al., 2011a), we reran the model without
the latent interactions, which was expected to result in models with comparable fit, and
tested the model fit using the FIML estimator.
Results
LOESS Curves
Figure 3 shows the plotted age differences in perceived control and changes in
perceived control separately for each sex (Figures 3A–C) and each educational level
(Figures 3D–F).
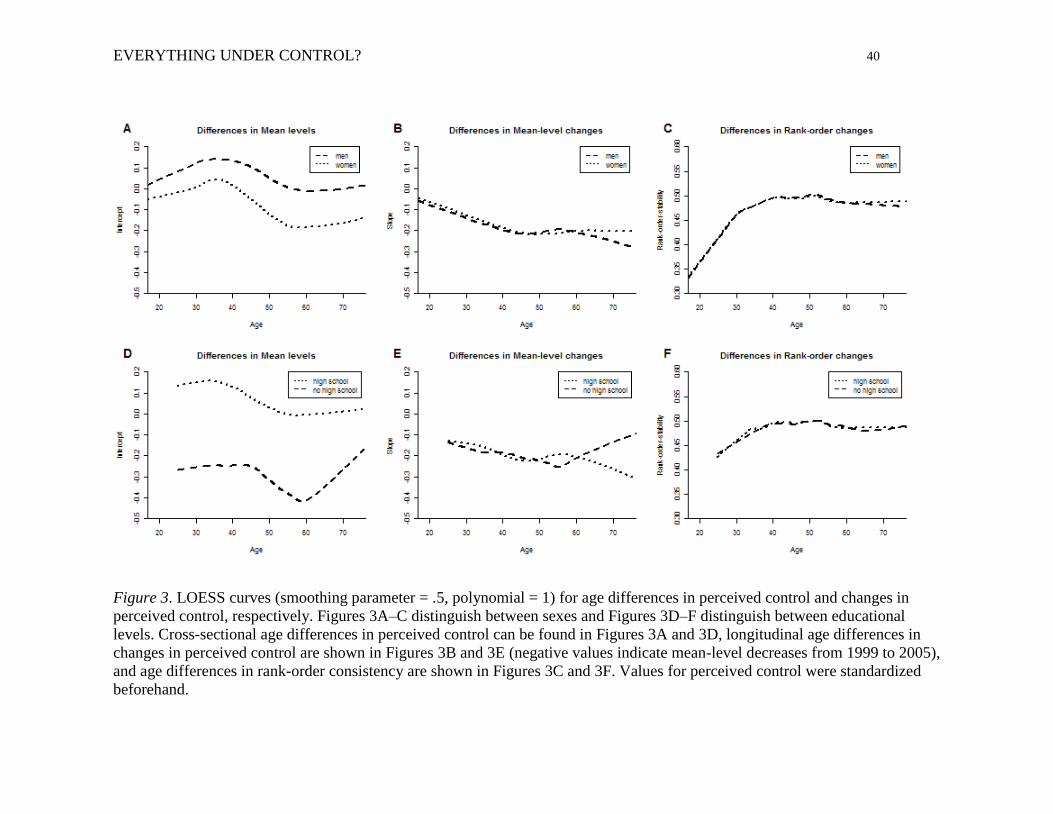
As can be seen in the cross-sectional results given in Figures 3A and 3D, perceived
control increased until approximately ages 30 to 40, then decreased until approximately age

EVERYTHING UNDER CONTROL? 17
60, and increased more or less slightly afterwards. Apart from a main effect of sex (men
perceived more control than women in general), the age curves were comparable for the
sexes. Educational level showed a very strong effect on perceived control, with more highly
educated individuals perceiving more control than less educated individuals. Furthermore,
the cross-sectional results suggested that less educated individuals showed a stronger rise in
perceived control after age 60.
Age differences in mean-level changes for the 6-year period under investigation are
shown in Figures 3B (separately for men and women) and 3E (separately for more and less
educated individuals). For all ages, perceived control decreased, and this decrease became
stronger with increasing age. Besides this difficult-to-interpret main effect, longitudinal
results mostly matched the results found cross-sectionally. Whereas changes in men and
women were approximately the same, less educated individuals reported more positive
changes in old age (after age 60) in perceived control than did more educated individuals.
Figures 3C and 3F show age differences in rank-order consistency separately for
each sex and educational level, respectively. Stability increased until approximately age 40
and remained comparatively constant afterwards. Men and women, as well as more and less
educated individuals, showed similar stabilities and similar developments of stability.
Measurement Invariance Models
As can be seen in Table 1, the measurement invariance models fit the data well,
indicating that strict measurement invariance held between the two measurement occasions
and additionally across sex and educational degree. Overall, there was a decrease in
perceived control (d = -.21, p < .001), as calculated by the difference of the overall means

EVERYTHING UNDER CONTROL? 18
of 1999 and 2005 divided by their pooled standard deviation. The mean rank-order
consistency of the whole sample was r = .58, p < .001.
Latent Change Models
The statistics of the models estimating the impact of age on differences in mean
levels and mean-level changes in perceived control can be found in Table 2. All model
parameters (β) were standardized relative to the year 1999 (i.e., the mean of the intercept
was set to 0 and its variance was set to 1). The models fit the data well.
The impact of age on cross-sectional differences in perceived control is shown in
Figure 4A. Age had a cubic influence on perceived control. Sex had a significant main
effect, but no effect on age differences in perceived control, χ²diff (3) = 5.509, p = .14,
which was statistically modeled as interactions between the three age variables and sex on
perceived control. Educational level had a strong significant main effect and there was also
a significant effect of educational level on the age curve, χ²diff (3) = 8.229, p = .04 (results
are given in Table 2). Figure 4D shows the modeled cross-sectional age differences in
perceived control separately for more and less educated individuals. As for the LOESS
curve (Fig. 3D), age differences in the groups were very similar, but more pronounced in
less educated individuals, who perceived more control in old age (older than 60 years) than
before, an effect that was far less pronounced in more educated individuals.
Age differences in longitudinal mean-level changes in perceived control are shown
in Figure 4B. Age had a quadratic influence on perceived control. Sex had neither a
significant main effect nor a significant effect on age differences, χ²diff (2) = 1.234, p = .54.
Educational level had no main effect, but did have a significant effect on age differences,
χ²diff (2) = 7.364, p = .03. Figure 4E shows the modeled age differences separately for more

EVERYTHING UNDER CONTROL? 19
and less educated individuals. Mean-level changes showed a curvilinear pattern in less
educated individuals, but only a linear pattern in more educated individuals, although both
trajectories were nevertheless relatively similar.
Latent Moderated Regression Models
The statistics of the models estimating the impact of age on the rank-order stability
of perceived control can be found in Table 3. All model parameters (β) were standardized
with respect to the first and second measurements (i.e., the variances of both t1 and t2 were
set to 1). The underlying models fit the data well as estimated using analogous models that
allowed for computing model fit statistics.
The impact of age on the rank-order consistency of perceived control is shown in
Figure 4C. Age had a cubic influence on the rank-order consistency. As already shown in
the LOESS curve (Fig. 3C), stability increased until age 40 and remained rather constant
from then on. Sex had neither a main effect nor an effect on age differences, χ²diff (3) =
.569, p = .90. Educational level, as well, had neither a main effect nor an effect on age
differences, χ²diff (3) = 5.320, p = .15.
Discussion
The aim of this study was to analyze differences in perceived control and in changes
in perceived control in individuals across all of adulthood while taking into consideration
the effects of sex and education. This study is the first to use a nationally representative
adult sample with an adequate sample size and the first to analyze longitudinal data with
three methodological approaches (cross-sectional as well as longitudinal mean-level
differences and rank-order consistency) to account for changes in perceived control.

EVERYTHING UNDER CONTROL? 20
Therefore, this study was able to reveal several important and generalizable findings
regarding the trajectories of perceived control.
Cross-Sectional Age Differences in Perceived Control
Cross-sectionally, perceived control increased during young adulthood and reached
a peak at about ages 30 to 40. At this age, education has already been completed and the
first or even major career steps have been taken, which have been shown to heighten
perceived control (Lewis et al., 1999). Afterwards, the belief in having a strong influence
on surroundings diminished until about age 60, when it reached its minimum. This may be
attributable to having fewer opportunities in the job market (e.g., an increase in the
probability of becoming and staying unemployed; Haan & Myck, 2009) as well as in other
life domains. Reaching the typical age of retirement ends this downward trend, even
resulting in a slight increase in perceived control afterwards, which is in line with Lachman
and Leff (1989) who found generalized control to be relatively stable in their sample of
elderly individuals.
This trajectory of perceived control we found is very similar to the one described by
Mirowsky and Ross (Mirowsky, 1995; Mirowsky & Ross, 2007; Ross & Mirowsky, 2002)
in US American samples, but with one major difference: Whereas Mirowsky and Ross
reported an overall inverted U-shaped function with extremely low perceived control in the
oldest old, we found a stable or even slightly increasing development in perceived control
in this age group among Germans.
Changes in income. One possible explanation for this discrepancy might be
attributable to differences in retirement funding.5 Whereas individuals in Germany usually
experience a relief from hard work when passing into retirement, retirees in the US

EVERYTHING UNDER CONTROL? 21
frequently have to face poverty. Indeed, we found in an additional analysis of our sample6
that decreases in income (controlled for income at the baseline level) result in decreases in
perceived control. A relation between income and perceived control was also found in three
cross-sectional samples that were representative of the US population (Lachman & Weaver,
1998). Given those results, differences in retirement funding might indeed be a plausible
explanation of differences in age curves in US and German samples.
Changes in health. Health is another important variable that is associated with
perceived control. We analyzed whether changes in self-rated health (controlled for self-
rated health at the baseline level) predicted changes in perceived control.6 Actually, this
was the case in our sample, which is a bit puzzling given that perceived control even
increased slightly in old age when illness becomes more common. Interestingly, we found
that the effect of health on perceived control is less pronounced and even no longer
significant in older individuals (aged 60 years and older). This is in accordance with our
finding that perceived control does not decrease in old age and is also in accordance with
Mirowsky (1995), who concluded that physical impairment is not among the most
important factors that influence perceived control in old age. As Lachman (2006) generally
suggested, the different influence of health on perceived control for different ages might be
attributable to changing standards in older individuals who, among other things, expect
health problems and who note the problems of others of the same age as well. Contrary to
that, younger individuals are more strongly affected by health problems because health
problems are rather uncommon at younger ages.
Additionally, because of the strong relation between perceived control and mortality
(Infurna, Gerstorf, Ram et al., 2011), our finding may also be the result of survival effects:

EVERYTHING UNDER CONTROL? 22
Those high in perceived control selectively reach old age, which cross-sectionally results in
higher values in perceived control in old individuals.
Longitudinal Stability in Perceived Control
Longitudinally, mean levels of perceived control generally decreased from 1999 to
2005 for all ages, although the decrease was considerably weaker for younger persons. As
already noted above, the general change in perceived control needs to be interpreted with
caution because we cannot rule out the possibility that the decrease is due to changes in
response format between the two measurement occasions rather than to true changes in
perceived control (e.g., due to period or cohort effects). Besides the general longitudinal
decrease, the cross-sectional and longitudinal results match nicely: The comparatively
smaller longitudinal decrease in perceived control for younger persons corresponds with the
cross-sectional increase, and the strong longitudinal decrease for middle ages corresponds
with the strong cross-sectional decrease, whereas the cross-sectional increase in older ages
is only slightly mirrored by the longitudinal results.
Rank-order was very unstable in young adults. It seems that this time of life, which
comes along with several major life decisions (Hopwood et al., 2011; Lüdtke, Roberts,
Trautwein, & Nagy, 2011), accompanied by resulting situational changes, goes hand in
hand with large changes in the relative placement of individuals to each other, an effect also
commonly found for other personality traits (e.g., the Big Five; Lucas & Donnellan, 2011;
Specht et al., 2011a). When reaching middle adulthood at about age 40, rank-order stability
peaks and stays at about this level from then on. However, even the peak of stability is far
below the stability of other personality traits (Lucas & Donnellan, 2011; Specht et al.,
2011a) and leaves a lot of room for changes in ordering. This indicates that the

EVERYTHING UNDER CONTROL? 23
development has not been completed by this time but is still susceptible for differential
changes. Compared to other personality traits, rank-order stability of perceived control
showed neither the common inverted U-shaped function nor the steadily increasing course
(Ardelt, 2000; Roberts & DelVecchio, 2000; Specht et al., 2011a), but rather a cubic
progress, which furthermore distinguishes it from the Big Five personality traits.
Sex Differences and Perceived Control
Men and women differ in the extent to which they believe they have influence in
their lives, with men believing they have more influence. This is in line with the findings of
Gatz and Karel (1993) and may be due to the fact that women indeed still have less control
over their lives (Doherty & Baldwin, 1985). However, Ross and Mirowsky (2002) found in
their US sample that this perceived inequality was larger in older than in younger cohorts,
with the tendency of young women to perceive even more control than their male
counterparts.
In this representative sample of Germans, we did not find a significant effect of sex
on age differences in perceived control. This is especially noteworthy given the large
sample size where even small effects are easily able to reach significance, which is why this
lack of significance cannot be attributed to problems in statistical power. In fact, this
provides even clearer evidence that the gender difference is of a similar magnitude for all
ages, which provides meaningful information for more complex models of perceived
control such as Lachman’s conceptual model (2006). It remains an exciting mission of
future research to track further developments to see whether the apparently diminishing sex
effect in the USA continues (or whether it actually only occurs in younger ages) or to see
whether (or when) this gender equality in perceived control will begin in Europe as well.

EVERYTHING UNDER CONTROL? 24
Educational Differences and Perceived Control
Individuals reaching an educational degree comparable to high school perceived
considerably more control than those with less education. This may be due to self-selection
(Bandura & Wood, 1989; Prociuk & Breen, 1975), the beneficial influence of schooling on
perceived control (Lewis et al., 1999), and to education as a protective factor for several
developmental challenges (Murrell, Salsman, & Meeks, 2003). Individuals with higher
education reported a slightly less pronounced developmental course of perceived control
than individuals with less education, although the overall shapes of the trajectories were
rather similar for the two groups. The strongest differences occurred after the typical age of
retirement (60-65 years), when individuals without a high school degree increased in their
perceived control more than their more educated counterparts. This effect may be explained
by different demands in retirement in comparison to the demands of working life: Whereas
more highly educated individuals may have jobs with more influence, which strengthens
their perceived control, it may be quite the opposite for individuals with less education.
After leaving the job market, education plays a less prominent role, which is why perceived
control should converge between more and less educated individuals by then.
Conclusions
Perceived control changes across the entire lifespan with times of higher perceived
control (ages 20 to 40) and times of lower perceived control (ages 50 to 70). Sex shows a
meaningful and steady effect on perceived control, with men perceiving to have more
control than women perceive to have. The effect of education on perceived control is even
larger, with higher perceived control in individuals with higher education. This emphasizes
the importance of demographic variables on perceived control as a personality trait.

EVERYTHING UNDER CONTROL? 25
Interestingly, trajectories of perceived control are similar in all subgroups, indicating that
differences between individuals remain comparatively stable across the life course. Rank-
order stability is especially low for young ages (up to age 40) and remains rather unstable
even afterwards. This leaves room for several differential changes, for example due to
changes in income and health. Taken together, perceived control is not only an important
construct across the life course, but also a very dynamic one.

EVERYTHING UNDER CONTROL? 26
References
Ardelt, M. (2000). Still stable after all these years? Personality stability theory revisited.
Social Psychology Quarterly, 63, 391-405.
Bandura, A., & Wood, R. (1989). Effect of perceived controllability and performance
standards on self-regulation of complex decision making. Journal of Personality
and Social Psychology, 56, 805-814.
Benassi, V. A., Sweeney, P. D., & Dufour, C. L. (1988). Is there a relationship between
locus of control orientation and depression? Journal of Abnormal Psychology, 97,
357-367.
Bollen, K. A. (1989). Structural equations with latent variables. New York: Wiley.
Bollen, K. A., & Curran, P. J. (2006). Latent curve models: A structural equation
perspective. Hoboken, NJ: Wiley.
DeNeve, K. M., & Cooper, H. (1998). The happy personality: A meta-analysis of 137
personality traits and subjective well-being. Psychological Bulletin, 124, 197-229.
Doherty, W. J., & Baldwin, C. (1985). Shifts and stability in locus of control during the
1970s: Divergence of the sexes. Journal of Personality and Social Psychology, 48,
1048-1053.
Donnellan, M. B., & Lucas, R. E. (2008). Age differences in the Big Five across the life
span: Evidence from two national samples. Psychology and Aging, 23, 558-566.
Duncan, T. E., Duncan, S. C., & Strycker, L. A. (2006). An introduction to latent variable
growth curve modeling: Concepts, issues, and applications. Mahwah, NJ: Erlbaum.

EVERYTHING UNDER CONTROL? 27
Enders, C. K., & Bandalos, D. L. (2001). The relative performance of full information
maximum likelihood estimation for missing data in structural equation models.
Structural Equation Modeling, 8, 430-457.
Folkman, S. (1984). Personal control and stress and coping processes: A theoretical
analysis. Journal of Personality and Social Psychology, 46, 839-852.
Gatz, M., & Karel, M. J. (1993). Individual change in perceived control over 20 years.
International Journal of Behavioral Development, 16, 305-322.
Haan, P., & Myck, M. (2009). Dynamics of health and labor market risks. Journal of
Health Economics, 28, 1116-1125.
Heckhausen, J., & Schulz, R. (1995). A life-span theory of control. Psychological Review,
102, 284-304.
Heckhausen, J., Wrosch, C., & Schulz, R. (2010). A motivational theory of life-span
development. Psychological Review, 117, 32-60.
Hopwood, C. J., Donnellan, M. B., Blonigen, D. M., Krueger, R. F., McGue, M., Iacono,
W. G., & Burt, S. A. (2011). Genetic and environmental influences on personality
trait stability and growth during the transition to adulthood: A three-wave
longitudinal study. Journal of Personality and Social Psychology, 100, 545-556.
Hu, L.-T., & Bentler, P. M. (1998). Fit indices in covariance structure modeling: Sensitivity
to underparameterized model misspecification. Psychological Methods, 3, 424-453.
Infurna, F. J., Gerstorf, D., Ram, N., Schupp, J., & Wagner, G. G. (2011). Long-term
antecedents and outcomes of perceived control. Psychology and Aging, 26, 559-575.

EVERYTHING UNDER CONTROL? 28
Infurna, F. J., Gerstorf, D., Robertson, S., Berg, S., & Zarit, S. H. (2010). The nature and
cross-domain correlates of subjective age in the oldest old: Evidence from the
OCTO study. Psychology and Aging, 25, 470-476.
Infurna, F. J., Gerstorf, D., & Zarit, S. H. (2011). Examining dynamic links between
perceived control and health: Longitudinal evidence for differential effects in
midlife and old age. Developmental Psychology, 47, 9-18.
Klein, A., & Moosbrugger, H. (2000). Maximum likelihood estimation of latent interaction
effects with the LMS method. Psychometrika, 65, 457-474.
Kunzmann, U., Little, T. D., & Smith, J. (2002). Perceiving control: A double-edged sword
in old age. Journals of Gerontology: Psychological Sciences, 57, 484-491.
Lachman, M. E. (1986). Locus of control in aging research: A case for multidimensional
and domain-specific assessment. Psychology and Aging, 1, 34-40.
Lachman, M. E. (2006). Perceived control over aging-related declines: Adaptive beliefs and
behaviors. Current Directions in Psychological Science, 15, 282-286.
Lachman, M.E., Baltes, P. B., Nesselroade, J. R., & Willis, S. L. (1982). Examination of
personality-ability relationships in the elderly: The role of the contextual (interface)
assessment mode. Journal of Research in Personality, 16, 485-501.
Lachman, M. E., & Leff, R. (1989). Perceived control and intellectual functioning in the
elderly: A 5-year longitudinal study. Developmental Psychology, 25, 722-728.
Lachman, M. E., & Weaver, S. L. (1998). The sense of control as a moderator of social
class differences in health and well-being. Journal of Personality and Social
Psychology, 74, 763-773.

EVERYTHING UNDER CONTROL? 29
Lewis, S. K., Ross, C. E., & Mirowsky, J. (1999). Establishing a sense of personal control
in the transition of adulthood. Social Forces, 77, 1573-1599.
Lucas, R. E., & Donnellan, M. B. (2009). Age differences in personality: Evidence from a
nationally representative Australian sample. Developmental Psychology, 45, 1353-
1363.
Lucas, R. E., & Donnellan, M. B. (2011). Personality development across the life span:
Longitudinal analyses with a national sample from Germany. Journal of Personality
and Social Psychology, 101, 847-861.
Lüdtke, O., Roberts, B. W., Trautwein, U., & Nagy, G. (2011). A random walk down
university avenue: Life paths, life events, and personality trait change at the
transition to university life. Journal of Personality and Social Psychology, 101, 620-
637.
Marsh, H. W., & Hau, K.-T. (1996). Assessing goodness of fit: Is parsimony always
desirable? Journal of Experimental Education, 64, 364-390.
Marsh, H. W., Hau, K.-T., & Grayson, D. (2005). Goodness of fit evaluation in structural
equation modeling. In A. Maydeu-Olivares & J. McCardle (Eds.), Contemporary
psychometrics: A Festschrift to Roderick P. McDonald (pp. 275-340). Mahwah, NJ:
Erlbaum.
Marsh, H. W., Wen, Z., & Hau, K.-T. (2004). Structural equation models of latent
interactions: Evaluation of alternative estimation strategies and indicator
construction. Psychological Methods, 9, 275-300.
Meredith, W. (1993). Measurement invariance, factor analysis and factorial invariance.
Psychometrika, 58, 525-543.

EVERYTHING UNDER CONTROL? 30
Mirowsky, J. (1995). Age and the sense of control. Social Psychology Quarterly, 58, 31-43.
Mirowsky, J., & Ross, C. E. (2007). Life course trajectories of perceived control and their
relationship to education. American Journal of Sociology, 112, 1339-1382.
Moffitt, T. E., Arseneault, L., Belsky, D., Dickson, N., Hancox, R. J., Harrington, H. et al.
(2011). A gradient of childhood self-control predicts health, wealth, and public
safety. Proceedings of the National Academy of Sciences of the United States of
America (PNAS), 108, 2693-2698.
Murrell, S. A., Salsman, N. L., & Meeks, S. (2003). Educational attainment, positive
psychological mediators, and resources for health and vitality in older adults.
Journal of Aging and Health, 15, 591-615.
Muthén, L. K., & Muthén, B. O. (1998 – 2010). Mplus user’s guide (6th ed.). Los Angeles,
CA: Muthén & Muthén.
Muthén, B. O., & Satorra, A. (1995). Complex sample data in structural equation modeling.
Sociological Methodology, 25, 267-316.
Prociuk, T. J., & Breen, L. J. (1975). Defensive externality and its relation to academic
performance. Journal of Personality and Social Psychology, 31, 549-556.
Roberts, B. W., & DelVecchio, W. F. (2000). The rank-order consistency of personality
traits from childhood to old age: A quantitative review of longitudinal studies.
Psychological Bulletin, 126, 3-25.
Roberts, B. W., Wood, D., & Smith, J. L. (2005). Evaluating five factor theory and social
investment perspectives on personality trait development. Journal of Research in
Personality, 39, 166-184.

EVERYTHING UNDER CONTROL? 31
Ross, C. E., & Mirowsky, J. (2002). Age and the gender gap in the sense of personal
control. Social Psychology Quarterly, 65, 125-145.
Rotter, J. B. (1966). Generalized expectancies for internal versus external control of
reinforcement. Psychological Monographs: General and Applied, 80, 1-28.
Satorra, A., & Bentler, P. M. (1999). A scaled difference chi-square test statistic for
moment structure analysis. Psychometrika, 66, 507-514.
Skinner, E. A. (1996). A guide to constructs of control. Journal of Personality and Social
Psychology, 71, 549-570.
Specht, J., Egloff, B., & Schmukle, S. C. (2011a). Stability and change of personality
across the life course: The impact of age and major life events on mean-level and
rank-order stability of the Big Five. Journal of Personality and Social Psychology,
101, 862-882.
Specht, J., Egloff, B., & Schmukle, S. C. (2011b). The benefits of believing in chance or
fate: External locus of control as a protective factor for coping with the death of a
spouse. Social Psychological and Personality Science, 2, 132-137.
Taylor, S. E., Kemeny, M. E., Reed, G. M., Bower, J. E., & Gruenewald, T. L. (2000).
Psychological resources, positive illusions, and health. American Psychologist, 55,
99–109.
Wagner, G. G., Frick, J. R., & Schupp, J. (2007). The German Socio-Economic Panel
Study (SOEP) - Scope, evolution and enhancements. Journal of Applied Social
Science Studies, 127, 139-169.

EVERYTHING UNDER CONTROL? 32
Wallston, K. A., & Wallston, B. S. (1981). Health locus of control scales. In H. M. Lefcourt
(Ed.). Research with the locus of control construct: Vol. 1. Assessment methods
(pp.189-243). New York: Academic Press.

EVERYTHING UNDER CONTROL? 33
Footnotes
1 Due to the household design of the sample, there might be some dependencies in
the data. However, this would not affect any parameter estimates, but might have slight
influences on significance levels and goodness of fit indices. In consideration of parsimony
and because we focus on the overall run of perceived control rather than on the significance
of any particular parameter, we decided not to incorporate multiple levels in our already
rather complex latent models (cf. Lucas & Donnellan, 2009).
² Please note that due to the different coding of the original questionnaire, the
overall absolute mean-level change needs to be interpreted with caution. However, after
projecting the 1999 scale to the 2005 scale, standard deviations of the two years were
comparable, which argues for suitability. Furthermore, relative comparisons of mean-level
changes for individuals of different subgroups (i.e., individuals of different age, sex, or
education) would not be affected as long as there are no systematic interactions between
participants and specific response formats—which we assume to be very unlikely.
³ Please note that the same individuals were used in the LOESS and structural
equation approaches, but that these approaches differ in the ways in which they deal with
the remaining missing data. In the LOESS approach, the mean across all items for each
individual in each year was calculated even when some data for an individual were missing.
By contrast, the structural equation approach uses a maximum likelihood estimator to
account for missing data. However, because less than 3% of individuals had missing data,
this difference had only a negligible impact on the results.
4 Women were coded as 0 and men as 1. Sex and age were mean-centered before
higher order terms were calculated.

EVERYTHING UNDER CONTROL? 34
5 We would like to thank an anonymous reviewer for this suggestion.
6 Please see the Appendix for more information about the method and results of the
additional analyses.

EVERYTHING UNDER CONTROL? 35
Table 1
Measurement Models for Testing Strict Factorial Invariance
Model fit
Type of model χ² (df) CFI RMSEA SRMR
Overall measurement model 1066 (88) .96 .03 .03
Multiple-group model: sex 1726 (202) .93 .04 .05
Multiple-group model: education 1873 (202) .92 .04 .05
Note. The overall model tested strict factorial invariance by constraining factor loadings,
item intercepts, and error variances to be equal between the two measurement occasions. In
addition to these constraints between measurement occasions, the multiple-group models
restricted factor loadings, item intercepts, error variances, and error covariances to be equal
across groups (i.e., men and women or more and less educated individuals, respectively).
CFI = comparative fit index; RMSEA = root mean square error of approximation; SRMR =
standardized root mean square residual.

EVERYTHING UNDER CONTROL? 36
Table 2
Effects of Age, Sex, and Education on the Mean Level (Intercept) and Mean-Level Change
(Slope) of Perceived Control
Model Statistics Only Sex Sex & Education
Model Fit
χ² (df) 2235(137) 2263(186)
CFI .91 .91
RMSEA .04 .04
SRMR .04 .04
β z-values p β z-values p
Intercept
Sex .15 6.02 <.001 .12 4.70 <.001
Education - .41 7.81 <.001
Age -.011 -7.28 <.001 -.013 -3.67 <.001
Age² -.00020 -3.51 <.001 -.00035 -1.42 .16
Age³ .000016 5.61 <.001 .000031 3.13 .002
Age ·
Education - .0023 0.58 .56
Age² ·
Education - .00025 0.88 .38
Age³ ·
Education - -.000017 -1.51 .13
Slope
Mean -.25 -12.97 <.001 -.29 -6.61 <.001
Sex -.010 -.35 .73 .0078 -0.31 .76
Education - .060 1.24 .22
Age -.0043 -4.88 <.001 -.0035 -1.30 .20
Age² .00012 2.10 .04 .00027 1.65 .10
Age ·
Education - .00039 0.12 .91
Age² ·
Education - -.00027 -1.46 .15
Note. Model parameters were standardized relative to the first measurement. Age and sex
were centered. CFI = comparative fit index; RMSEA = root mean square error of
approximation; SRMR = standardized root mean square residual.

EVERYTHING UNDER CONTROL? 37
Table 3
Effects of Age, Sex, and Education on Rank-Order Stability of Perceived Control
Model Statistics Only Sex Sex and Education
Model Fita
χ² (df) 2233(136) 2499(153)
CFI .91 .89
RMSEA .04 .04
SRMR .04 .05
β z-values p β z-values p
Stability
Mean .61 32.38 <.001 .61 27.56 <.001
Sex .010 0.39 .70 .022 0.78 .44
Education - .043 1.26 .21
Age .00056 -0.32 .75 -.00094 -0.52 .60
Age² -.00025 -3.44 .001 -.00027 -2.10 .04
Age³ .0000065 2.01 .045 .0000094 1.73 .08
Note. Model parameters were standardized with respect to the first and the second
measurements. Age and sex were centered. CFI = comparative fit index; RMSEA = root
mean square error of approximation; SRMR = standardized root mean square residual.
aModel fit is based on the respective models without latent interactions.

EVERYTHING UNDER CONTROL? 38
Figure 1. Latent change model analyzing mean-level differences in perceived control.
Perceived control was measured in 1999 (t1) and 2005 (t2) with seven items whose
residuals were allowed to correlate over time. The latent intercept (i) reflected cross-
sectional mean-level differences and was fixed to 1 in both years (t1 and t2). The latent
slope (s) reflected longitudinal mean-level changes and was fixed to 0 in t1 and to 1 in t2.
Factor loadings (b – g), measurement intercepts, and error variances of the seven items
were constrained to be equal across time points. Sex and age (and higher order terms of
age) were included as covariates to test for general age-related mean-level differences. To
test for effects of sex and education on age differences in perceived control, the respective
interaction terms (and, when indicated, education itself) were included as covariates as
well. Model parameters were standardized relative to t1 by setting the mean of the intercept
to 0 and its variance to 1.

EVERYTHING UNDER CONTROL? 39
Figure 2. Latent moderated regression model analyzing rank-order differences in perceived
control. Perceived control was measured two times (t1 and t2) with seven items each, and
the residuals of those indicators were allowed to correlate over time. The rank-order
stability equates to the standardized effect of t1 (the predictor) on t2 (the dependent
variable). Factor loadings (b – g), measurement intercepts, and error variances of the seven
items were constrained to be equal across time points. Sex and age (and higher order terms
of age) were included as moderators to test for general rank-order differences. To test for
effects of sex and education on age differences in the rank-order of perceived control, the
respective interaction terms were included as moderators as well. Model parameters were
standardized with respect to the first and second measurements by setting the variances of
both t1 and t2 to 1.
EVERYTHING UNDER CONTROL? 40
Figure 3. LOESS curves (smoothing parameter = .5, polynomial = 1) for age differences in perceived control and changes in
perceived control, respectively. Figures 3A–C distinguish between sexes and Figures 3D–F distinguish between educational
levels. Cross-sectional age differences in perceived control can be found in Figures 3A and 3D, longitudinal age differences in
changes in perceived control are shown in Figures 3B and 3E (negative values indicate mean-level decreases from 1999 to 2005),
and age differences in rank-order consistency are shown in Figures 3C and 3F. Values for perceived control were standardized
beforehand.

EVERYTHING UNDER CONTROL? 41
Figure 4. Modeled age differences in perceived control and changes in perceived control, respectively. Figure 4A shows the
general standardized cross-sectional age differences in mean levels (intercept), and Figure 4D shows those differences separately
for more and less educated individuals. Figure 4B shows the general standardized age differences in mean-level changes (slope;
negative values indicate mean-level decreases from 1999 to 2005) and Figure 4E shows those differences again separately for
more and less educated individuals. In Figure 4C, general standardized differences from t1 to t2 in the rank-order consistency of
perceived control for different ages are shown. All analyses were controlled for sex.

EVERYTHING UNDER CONTROL? 42
Appendix
Explaining the Development of Perceived Control with Income and Health
The trajectory of perceived control in old age that we found in our representative
German sample differs from the results theoretically expected and found in former analyses
on US samples (Mirowsky, 1995; Mirowsky & Ross, 2007; Ross & Mirowsky, 2002). To
investigate whether and how changes in income and health can explain these age
trajectories, we computed two additional analyses.
Income
Monthly income in 1999 and 2005 was available for 4,993 households including
8,852 individuals. For comparability, we divided the household income by the number of
household members. To analyze the impact of changes in income on changes in perceived
control, we used the same latent change model as in the main analyses (see Figure 1) but
included only two covariates: income in 1999 and changes in income between 1999 and
2005. Because income was measured at the household level and perceived control at the
individual level, we statistically controlled for this complex sample structure (Muthén &
Satorra, 1995). The model parameters were standardized relative to the year 1999 in
perceived control and given in thousands of Euro with respect to income. The model fit the
data well, χ² (112) = 1,053, CFI = .94, RMSEA = .03, SRMR = .03.
Individuals high in perceived control had higher incomes, β = .359, p < .001, and
were more likely to show increases in their income in the 6 years under investigation, β =
.168, p < .001. Furthermore, changes in income predicted changes in perceived control, β =
.113, p < .001, meaning that decreases of 1,000 € in monthly income result in decreases of
.113 standard deviations in perceived control. Although the effect is rather small, it might

EVERYTHING UNDER CONTROL? 43
explain why perceived control decreases strongly in retired US Americans, who frequently
face poverty, whereas this is not the case in retired Germans, who benefit from a
comparatively secure retirement funding.
Health
Self-rated health was reported in both assessment years (1999 and 2005) by 9,453
individuals. Participants were asked to describe their current health status on a scale
ranging from 1 (very well) to 5 (bad). Answers were recoded so that higher values indicated
better health. The latent change model (see Figure 1) included only two covariates: health
in 1999 and changes in health between 1999 and 2005. Model parameters were
standardized relative to the year 1999 for both variables (perceived control and health). The
model fit the data well, χ² (112) = 1,276, CFI = .95, RMSEA = .03, SRMR = .03. As
theoretically expected (Heckhausen et al., 2010), decreases in health led to decreases in
perceived control, β = .050, p < .001.
Although theoretically plausible, this finding is not in accordance with our empirical
finding that perceived control does not decrease in old age when health problems are
common. That is why we reran analyses for individuals older than 60 (N = 1,710). Again,
the model fit the data well, χ² (112) = 424, CFI = .92, RMSEA = .04, SRMR = .04.
Interestingly, the effect of changes in health on changes in perceived control was now much
lower and no longer significant, β = .024, p = .07. In sum, health does not seem to play an
important role in the development of perceived control in old age. Please see the main text
for a more detailed discussion.
Recommended