Solar Wind ObservationsSolar Wind Observations during 2007 – 2009:
A U l S l Mi iAn Unusual Solar Minimum
Lan K. Jian1, C.T. Russell1, J.G. Luhmann2, A.B. Galvin3
1Inst. Geophysics & Planetary Physics, UC Los Angeles, CA, USA2Space Science Lab., UC Berkeley, CA, USA
3EOS Space Sciences Univ New Hampshire Durham NH USA3EOS Space Sciences, Univ. New Hampshire, Durham, NH, USA
STEREO SWG 21Dublin, Ireland March 22‐26, 2010
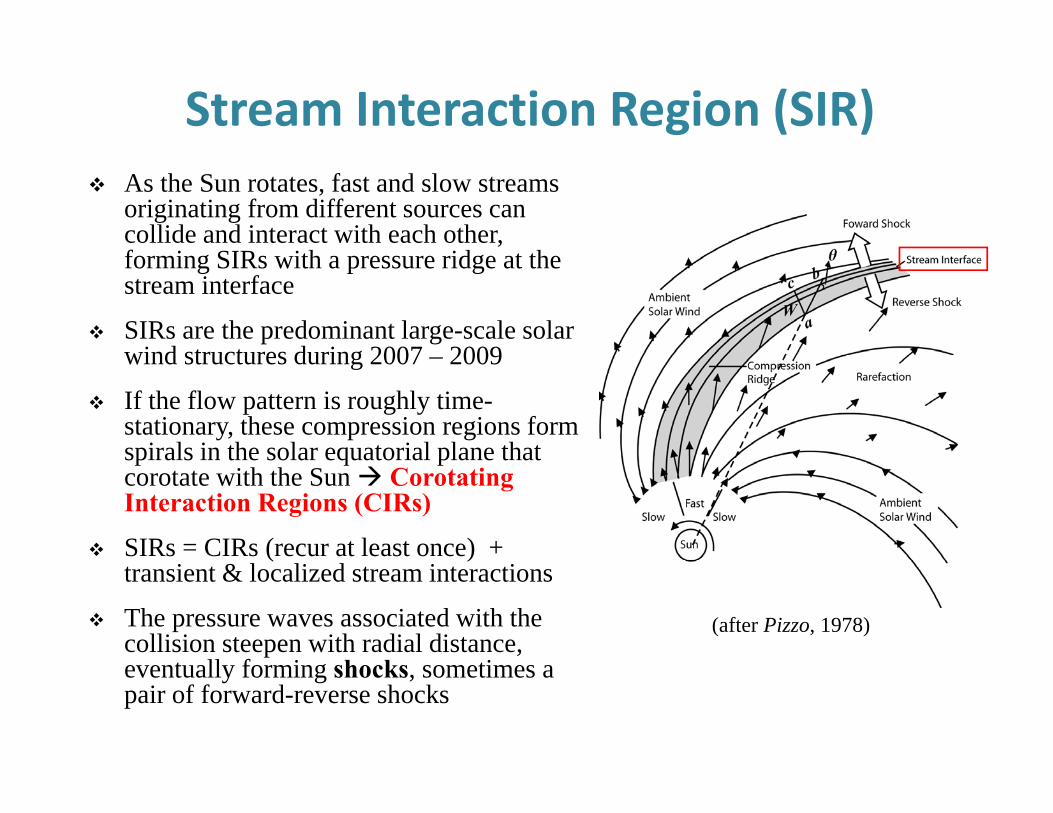
Stream Interaction Region (SIR)As the Sun rotates, fast and slow streams originating from different sources can collide and interact with each other, f i SIR ith id t thforming SIRs with a pressure ridge at the stream interface
SIRs are the predominant large-scale solar wind structures during 2007 2009wind structures during 2007 – 2009
If the flow pattern is roughly time-stationary, these compression regions form spirals in the solar equatorial plane thatspirals in the solar equatorial plane that corotate with the Sun Corotating Interaction Regions (CIRs)
SIRs = CIRs (recur at least once) + ( )transient & localized stream interactions
The pressure waves associated with the collision steepen with radial distance,
t ll f i h k ti
(after Pizzo, 1978)
eventually forming shocks, sometimes a pair of forward-reverse shocks
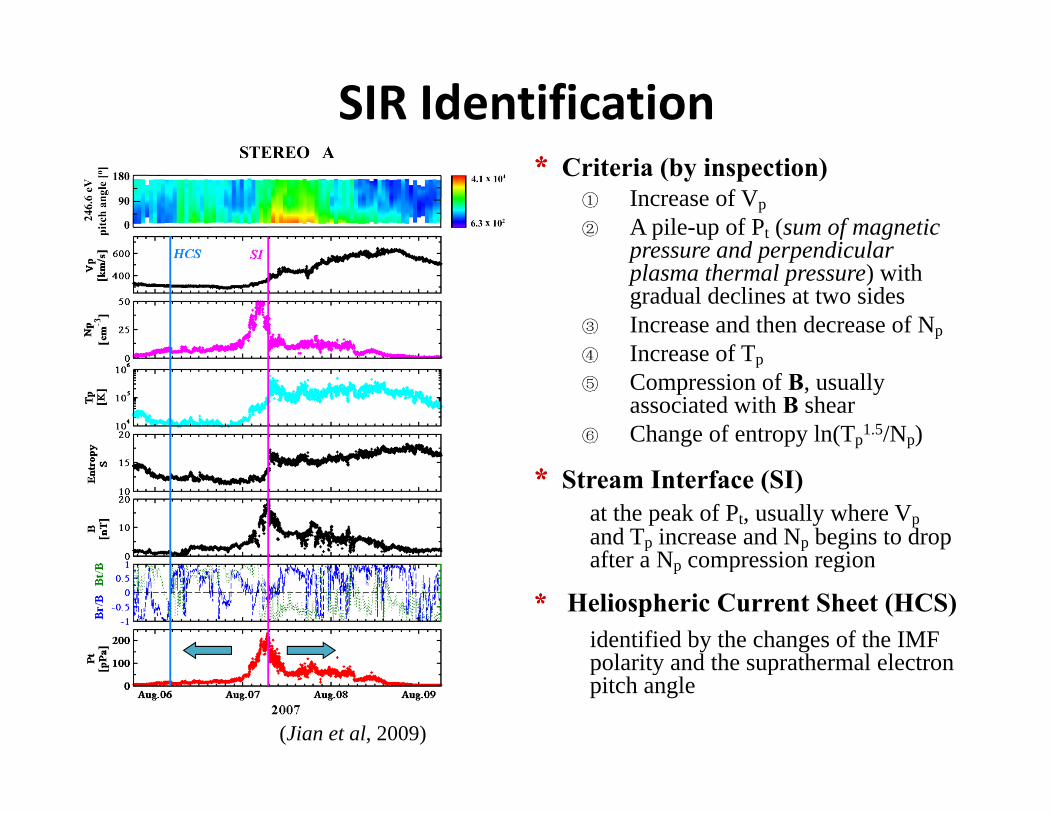
SIR Identification** Criteria (by inspection)
① Increase of Vp② A pile-up of Pt (sum of magnetic
pressure and perpendicularpressure and perpendicular plasma thermal pressure) with gradual declines at two sides
③ Increase and then decrease of Np④ Increase of T④ Increase of Tp⑤ Compression of B, usually
associated with B shear⑥ Change of entropy ln(Tp1.5/Np)
** Stream Interface (SI)at the peak of Pt, usually where Vpand Tp increase and Np begins to drop after a N compression regionafter a Np compression region
* * Heliospheric Current Sheet (HCS)identified by the changes of the IMF polarity and the suprathermal electronpolarity and the suprathermal electron pitch angle
(Jian et al, 2009)
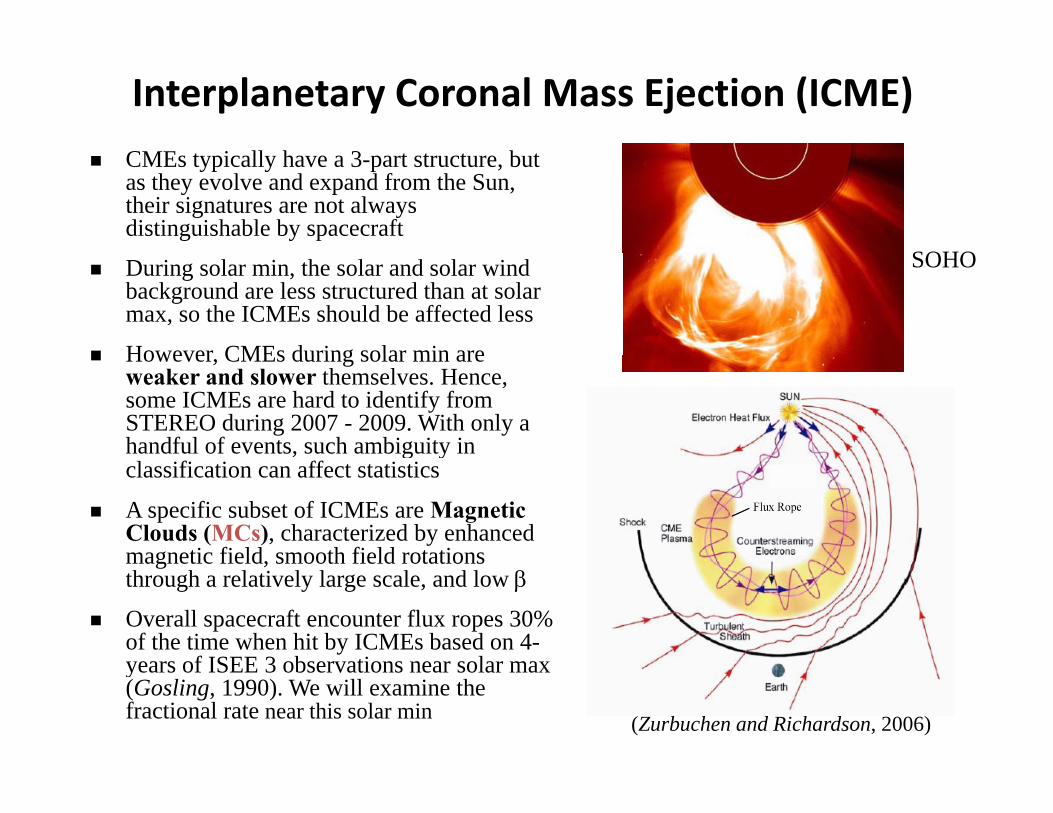
Interplanetary Coronal Mass Ejection (ICME)i ll h bCMEs typically have a 3-part structure, but
as they evolve and expand from the Sun, their signatures are not always distinguishable by spacecraft
SOHODuring solar min, the solar and solar wind background are less structured than at solar max, so the ICMEs should be affected less
However CMEs during solar min are
SOHO
However, CMEs during solar min are weaker and slower themselves. Hence, some ICMEs are hard to identify from STEREO during 2007 - 2009. With only a handful of events, such ambiguity in g yclassification can affect statistics
A specific subset of ICMEs are Magnetic Clouds (MCs), characterized by enhanced magnetic field smooth field rotationsmagnetic field, smooth field rotations through a relatively large scale, and low β
Overall spacecraft encounter flux ropes 30% of the time when hit by ICMEs based on 4-years of ISEE 3 observations near solar maxyears of ISEE 3 observations near solar max (Gosling, 1990). We will examine the fractional rate near this solar min (Zurbuchen and Richardson, 2006)
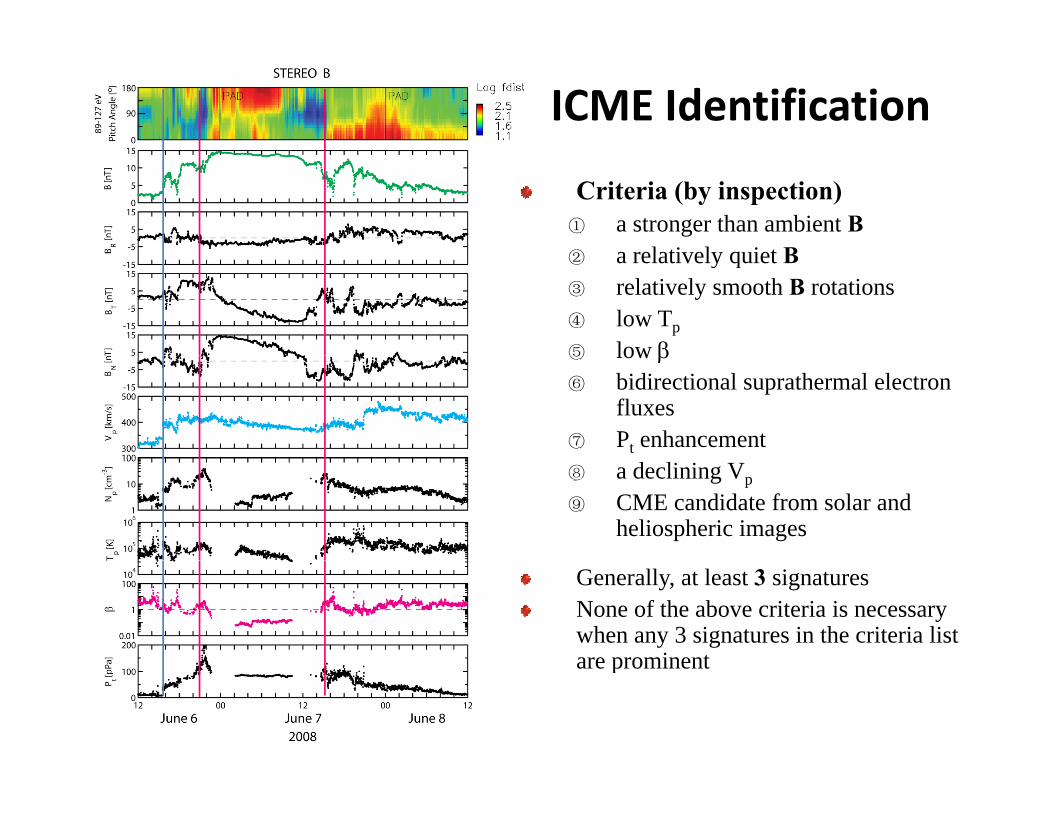
ICME Identification
Criteria (by inspection)① a stronger than ambient B② a relatively quiet B② a relatively quiet B③ relatively smooth B rotations④ low Tp⑤ low β⑤ low β⑥ bidirectional suprathermal electron
fluxes⑦ Pt enhancement⑧ a declining Vp⑨ CME candidate from solar and
heliospheric images
Generally, at least 3 signaturesNone of the above criteria is necessary when any 3 signatures in the criteria list are prominentare prominent
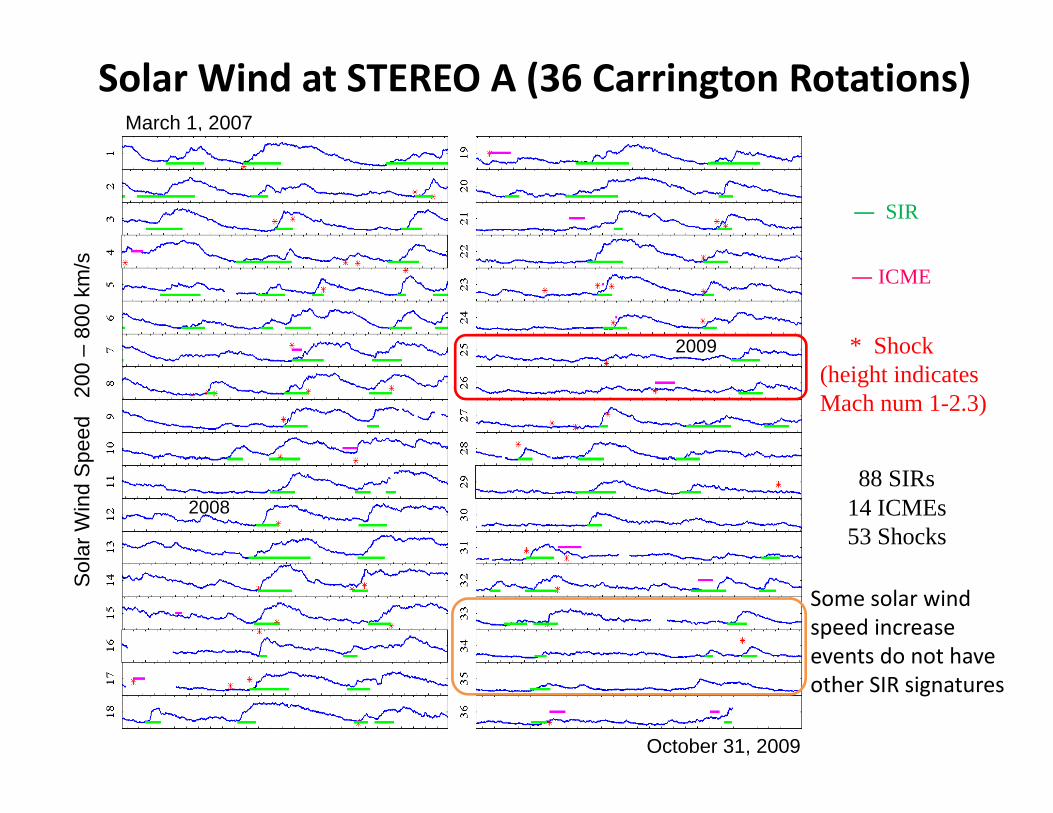
Solar Wind at STEREO A (36 Carrington Rotations)March 1, 2007
― SIR
* Shock
― ICME
–80
0 km
/s
2009(height indicatesMach num 1-2.3)
peed
20
0 –
88 SIRs14 ICMEs53 Shocks
lar W
ind
Sp
2008
So
Some solar windspeed increaseevents do not have
October 31, 2009
events do not have other SIR signatures
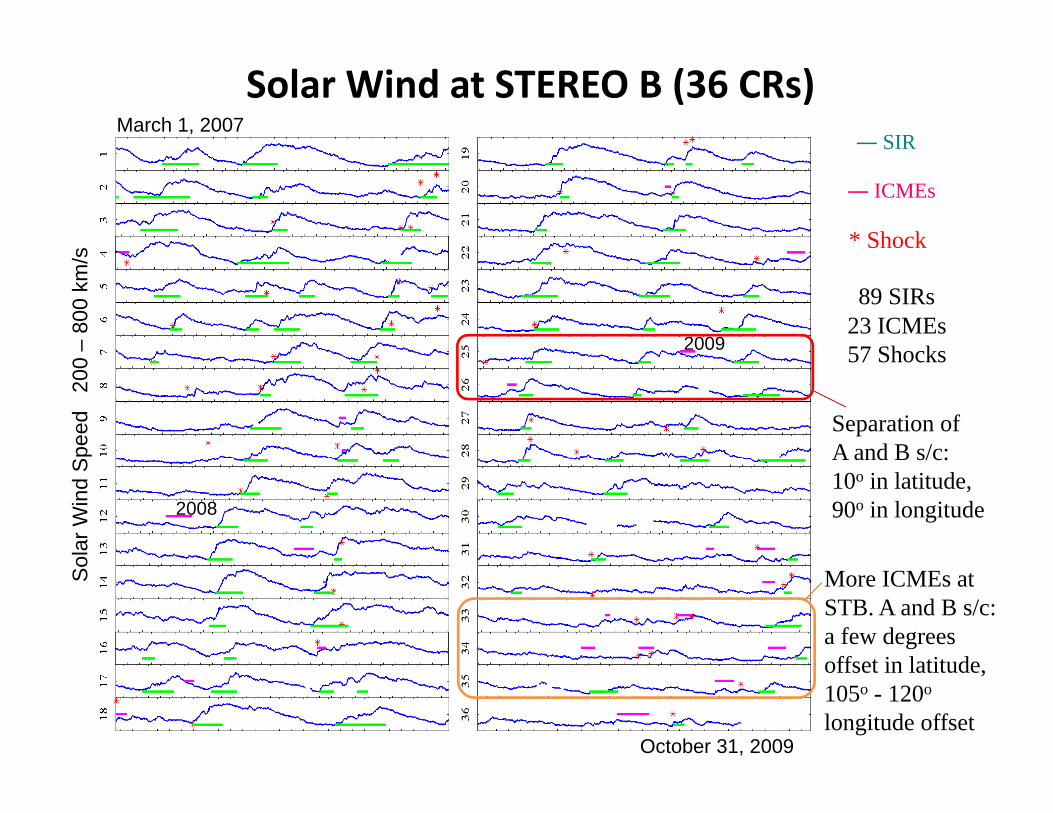
Solar Wind at STEREO B (36 CRs)― SIR
March 1, 2007
* Shock
― ICMEs
s
89 SIRs23 ICMEs57 Shocks–
800
km/s
2009 57 Shocks
peed
20
0
Separation of A and B s/c:
olar
Win
d S
2008
A and B s/c:10o in latitude,90o in longitude
So
More ICMEs at STB. A and B s/c: a few degrees offset in latitude
October 31, 2009
offset in latitude, 105o - 120o
longitude offset
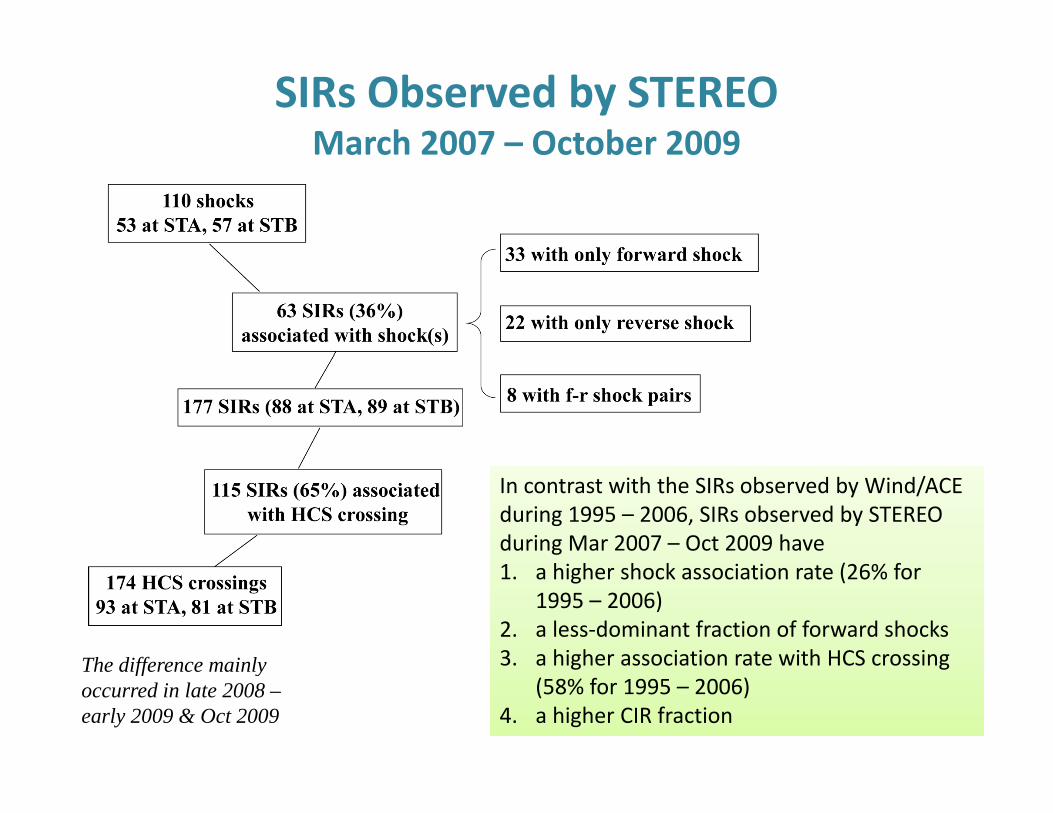
SIRs Observed by STEREO March 2007 – October 2009March 2007 October 2009
In contrast with the SIRs observed by Wind/ACE during 1995 – 2006, SIRs observed by STEREO during Mar 2007 – Oct 2009 have
In contrast with the SIRs observed by Wind/ACE during 1995 – 2006, SIRs observed by STEREO during Mar 2007 – Oct 2009 have
The difference mainly
1. a higher shock association rate (26% for 1995 – 2006)
2. a less‐dominant fraction of forward shocks3. a higher association rate with HCS crossing
1. a higher shock association rate (26% for 1995 – 2006)
2. a less‐dominant fraction of forward shocks3. a higher association rate with HCS crossingThe difference mainly
occurred in late 2008 –early 2009 & Oct 2009
3. a higher association rate with HCS crossing (58% for 1995 – 2006)
4. a higher CIR fraction
3. a higher association rate with HCS crossing (58% for 1995 – 2006)
4. a higher CIR fraction
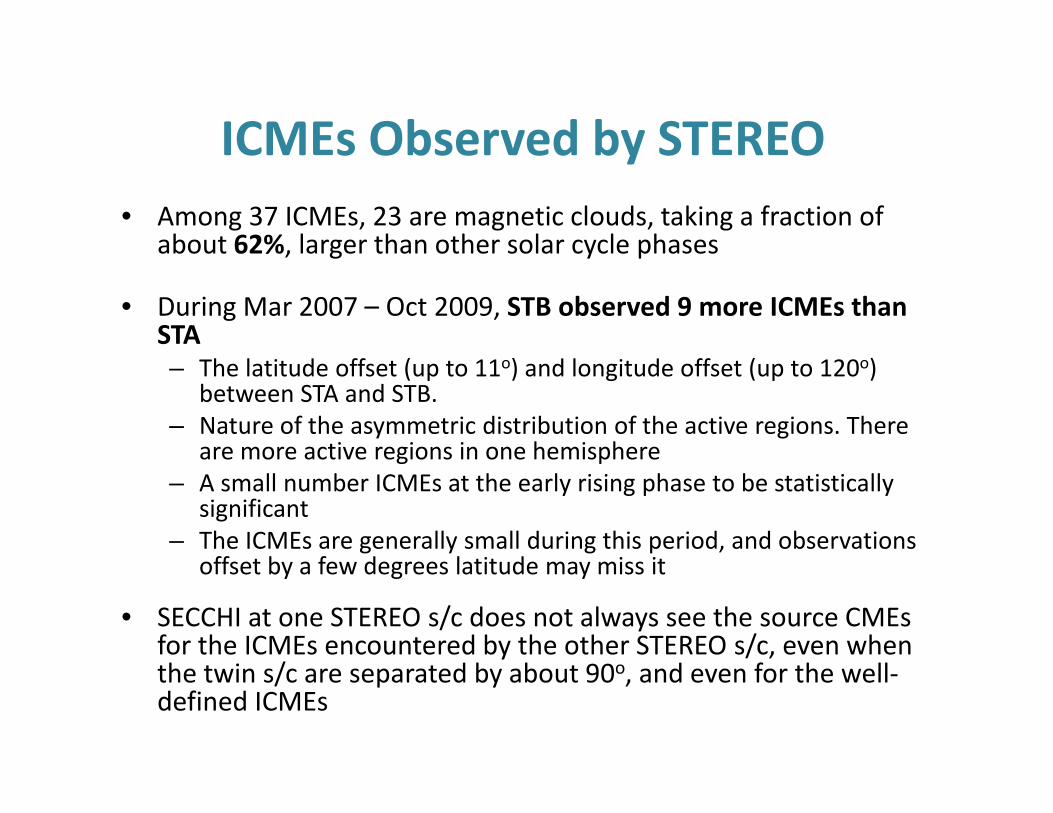
ICMEs Observed by STEREOICMEs Observed by STEREO• Among 37 ICMEs, 23 are magnetic clouds, taking a fraction of
about 62%, larger than other solar cycle phasesabout 62%, larger than other solar cycle phases
• During Mar 2007 – Oct 2009, STB observed 9 more ICMEs than STA– The latitude offset (up to 11o) and longitude offset (up to 120o)
between STA and STB.– Nature of the asymmetric distribution of the active regions. There
are more active regions in one hemisphereare more active regions in one hemisphere– A small number ICMEs at the early rising phase to be statistically
significant– The ICMEs are generally small during this period, and observations
ff t b f d l tit d i itoffset by a few degrees latitude may miss it
• SECCHI at one STEREO s/c does not always see the source CMEs for the ICMEs encountered by the other STEREO s/c, even when h / d b b d f h llthe twin s/c are separated by about 90o, and even for the well‐defined ICMEs
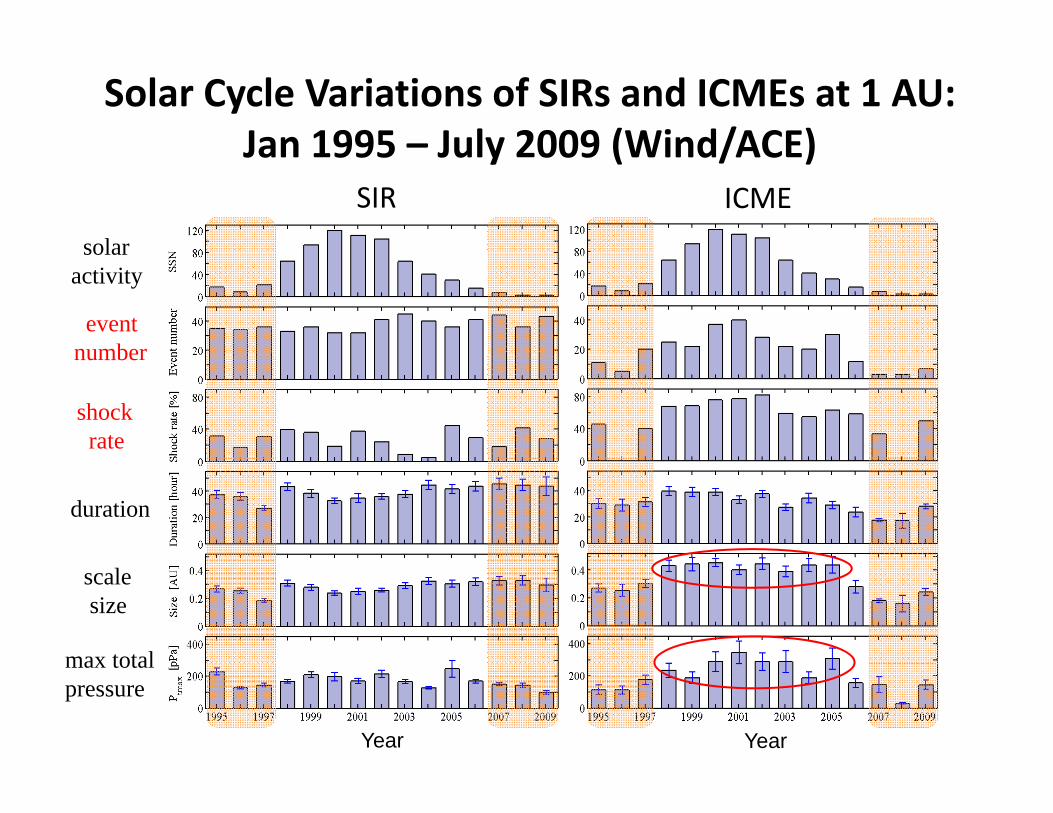
Solar Cycle Variations of SIRs and ICMEs at 1 AU: Jan 1995 – July 2009 (Wind/ACE)Jan 1995 July 2009 (Wind/ACE)
solar
SIR ICME
solar activity
event numbernumber
shock rate
duration
scale size
max totalmax totalpressure
Year Year
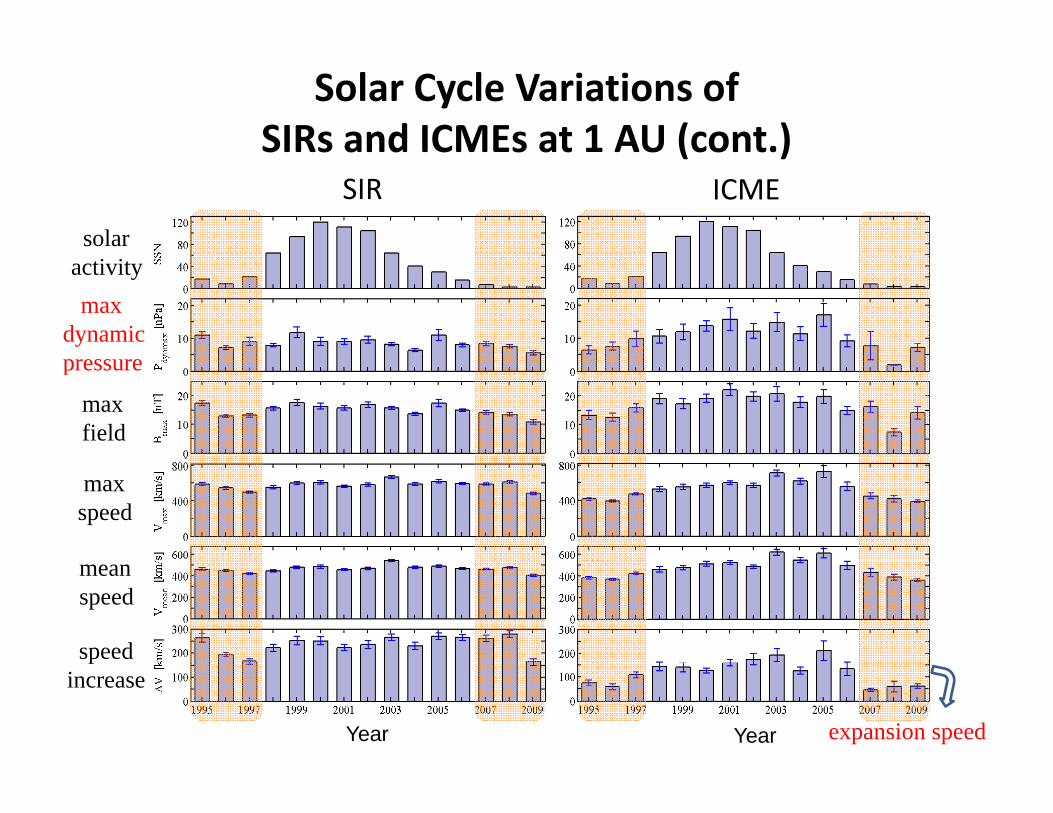
Solar Cycle Variations of SIRs and ICMEs at 1 AU (cont.)SIRs and ICMEs at 1 AU (cont.)
SIR ICME
solar activitymax
dynamicpressure
max field
maxspeed
mean speed
speed pincrease
expansion speedYear Year
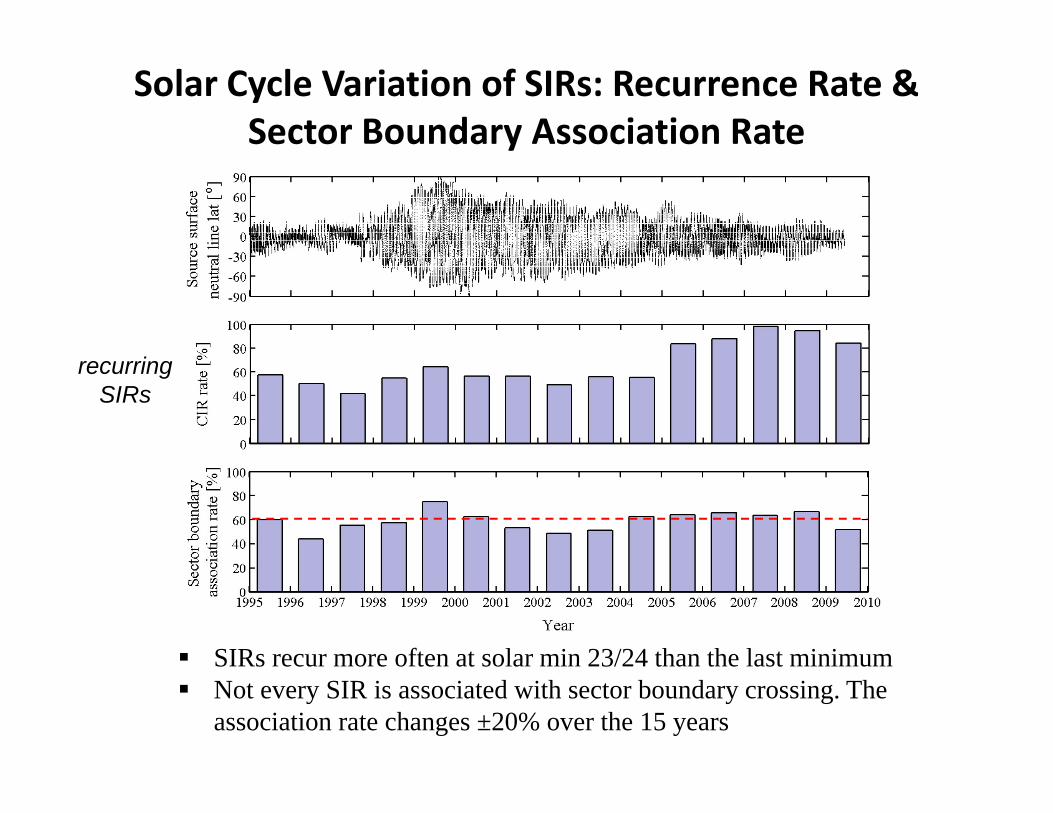
Solar Cycle Variation of SIRs: Recurrence Rate & Sector Boundary Association Ratey
recurring SIRs
SIRs recur more often at solar min 23/24 than the last minimumSIRs recur more often at solar min 23/24 than the last minimum Not every SIR is associated with sector boundary crossing. The association rate changes ±20% over the 15 years
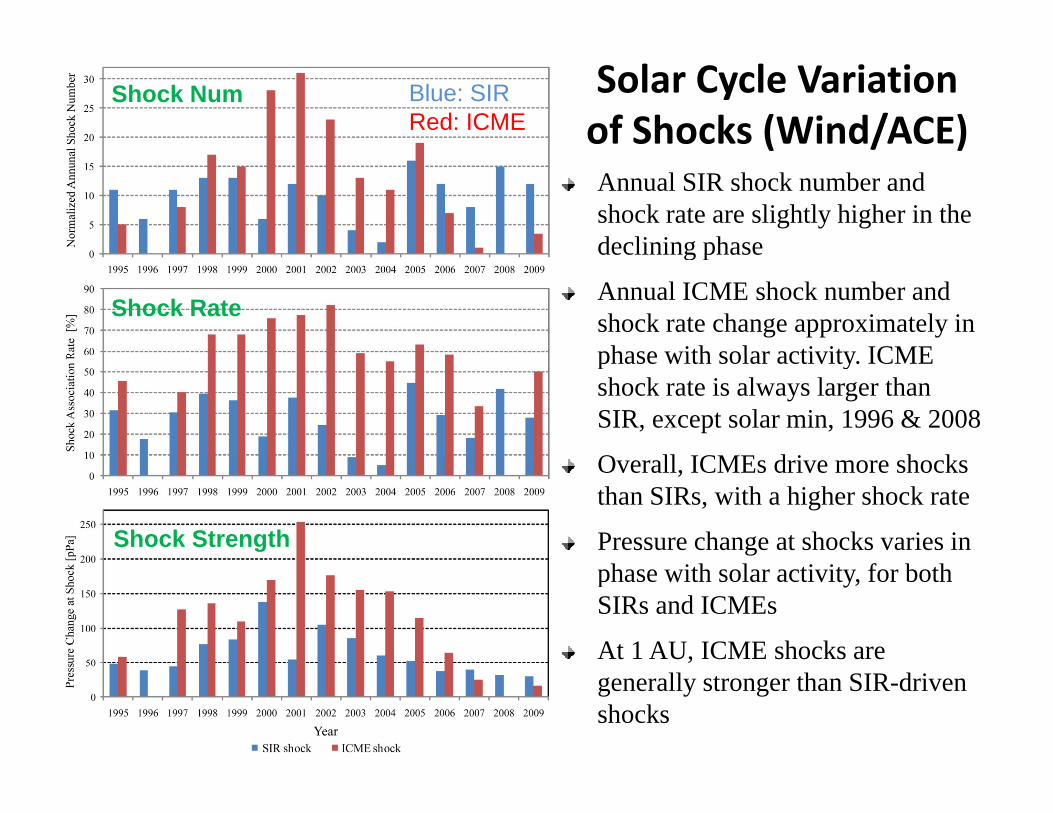
Solar Cycle Variation of Shocks (Wind/ACE)
Shock Num Blue: SIRRed: ICME ( )
Annual SIR shock number and shock rate are slightly higher in the declining phasedeclining phase
Annual ICME shock number and shock rate change approximately in phase with solar activity ICME
Shock Rate
phase with solar activity. ICME shock rate is always larger than SIR, except solar min, 1996 & 2008
O ll ICME d i h kOverall, ICMEs drive more shocks than SIRs, with a higher shock rate
Pressure change at shocks varies in Shock Strengthphase with solar activity, for both SIRs and ICMEs
At 1 AU, ICME shocks are ,generally stronger than SIR-driven shocks
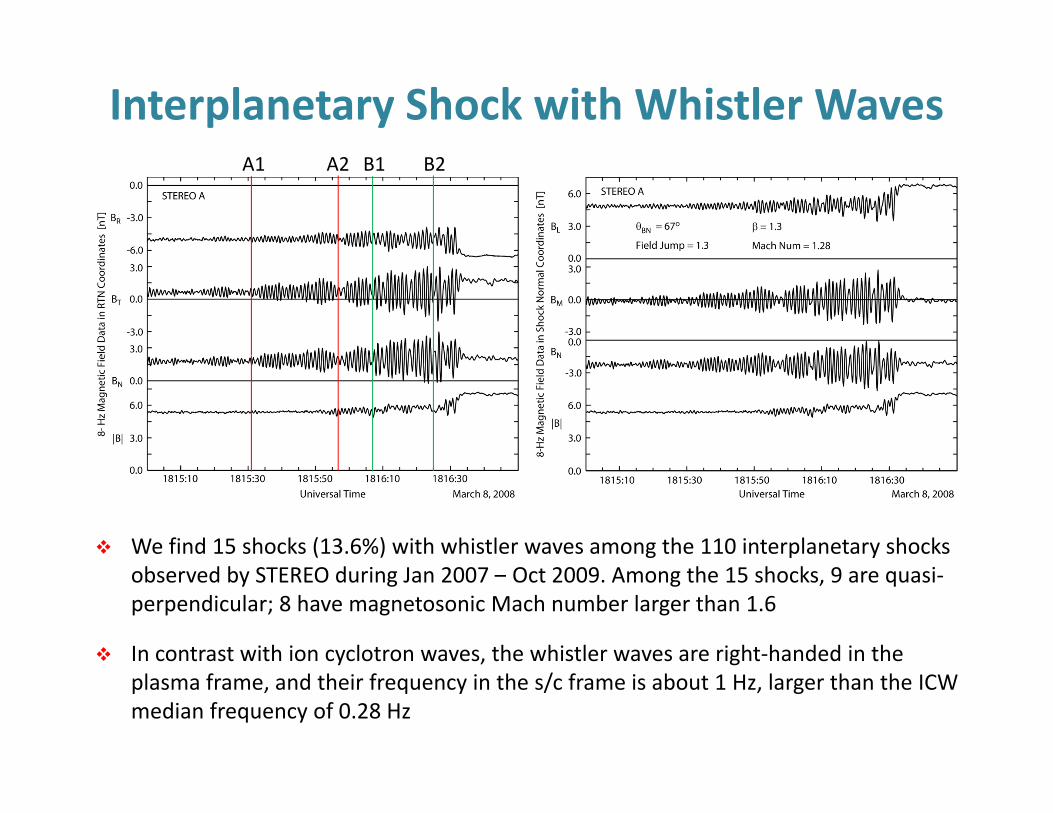
Interplanetary Shock with Whistler WavesA1 A2 B1 B2
We find 15 shocks (13.6%) with whistler waves among the 110 interplanetary shocks observed by STEREO during Jan 2007 – Oct 2009. Among the 15 shocks, 9 are quasi‐perpendicular; 8 have magnetosonic Mach number larger than 1.6
In contrast with ion cyclotron waves, the whistler waves are right‐handed in the y , gplasma frame, and their frequency in the s/c frame is about 1 Hz, larger than the ICW median frequency of 0.28 Hz
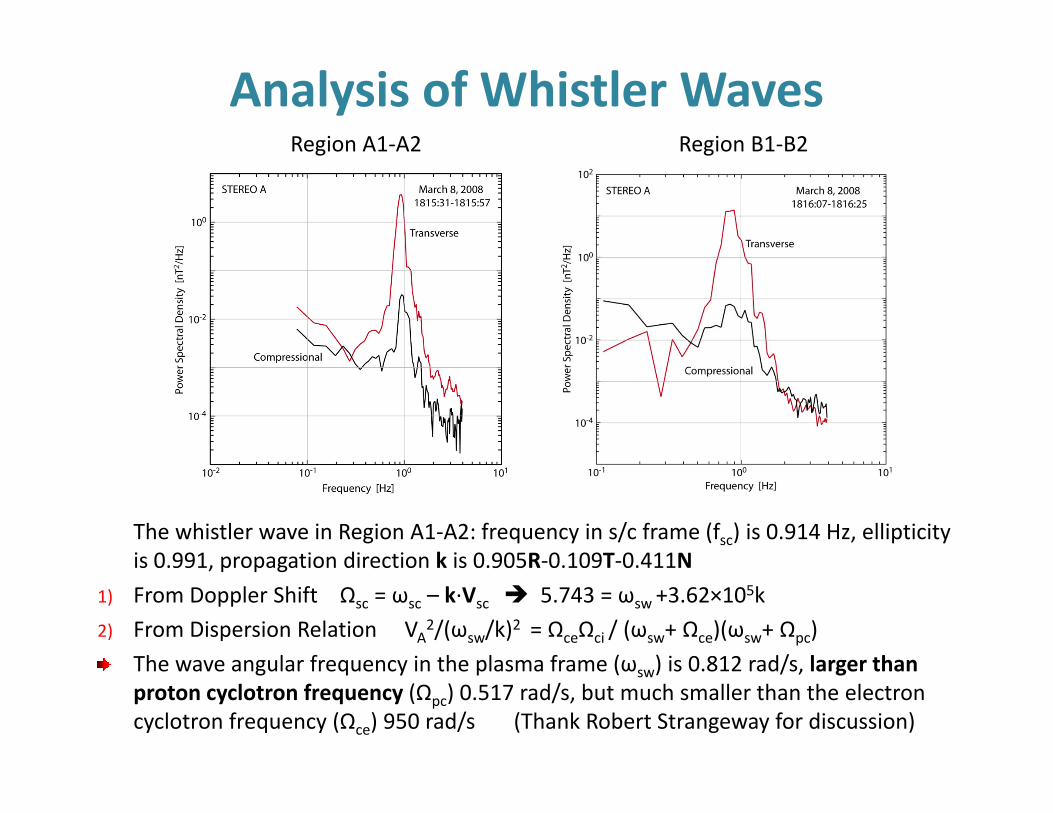
Analysis of Whistler WavesRegion A1‐A2 Region B1‐B2Region A1 A2 Region B1 B2
The whistler wave in Region A1‐A2: frequency in s/c frame (fsc) is 0.914 Hz, ellipticity is 0 991 propagation direction k is 0 905R 0 109T 0 411Nis 0.991, propagation direction k is 0.905R‐0.109T‐0.411N
1) From Doppler Shift Ωsc = ωsc – k∙Vsc 5.743 = ωsw +3.62×10⁵k
2) From Dispersion Relation VA2/(ωsw/k)2 = ΩceΩci / (ωsw+ Ωce)(ωsw+ Ωpc)
The wave angular frequency in the plasma frame (ω ) is 0 812 rad/s larger thanThe wave angular frequency in the plasma frame (ωsw) is 0.812 rad/s, larger than proton cyclotron frequency (Ωpc) 0.517 rad/s, but much smaller than the electron cyclotron frequency (Ωce) 950 rad/s (Thank Robert Strangeway for discussion)
Summary and DiscussionsWe have surveyed SIRs, ICMEs, and interplanetary shocks up to Oct 2009
2007 – 2009 covers the late declining phase, deep solar minimum, and the early rising phase. Comparing with other times, during this period, y g p p g , g p ,– Solar wind is much slower. No SIRs are observed for several CRs and even
when there are SIRs, the fast wind is typically only 400s km/s– SIRs recur more often, drive more shocks– ICMEs are weaker and smaller drive fewer shocks and are observed with fluxICMEs are weaker and smaller, drive fewer shocks, and are observed with flux
ropes more often. In 2009, the ICME occurrence rate and shock rate began to rise although the solar wind remains very slow
The association rate of SIR with HCS needs more detailed investigation. Some HCS crossings are ambiguous, as the changes of the IMF polarity and the suprathermal electron pitch angle sometime only last 3 or 4 days
W t th i ifi t diff f l i d d l i dWe note there are significant differences of solar wind and solar wind structures between STA and STB, as they are separated more and more. We will use the heliospheric models to further study it
Using high resolution magnetometer data we have studied interplanetaryUsing high resolution magnetometer data, we have studied interplanetary shocks more comprehensively. The various waves associated with the shocks provide a natural laboratory to study shocks
backupbackup
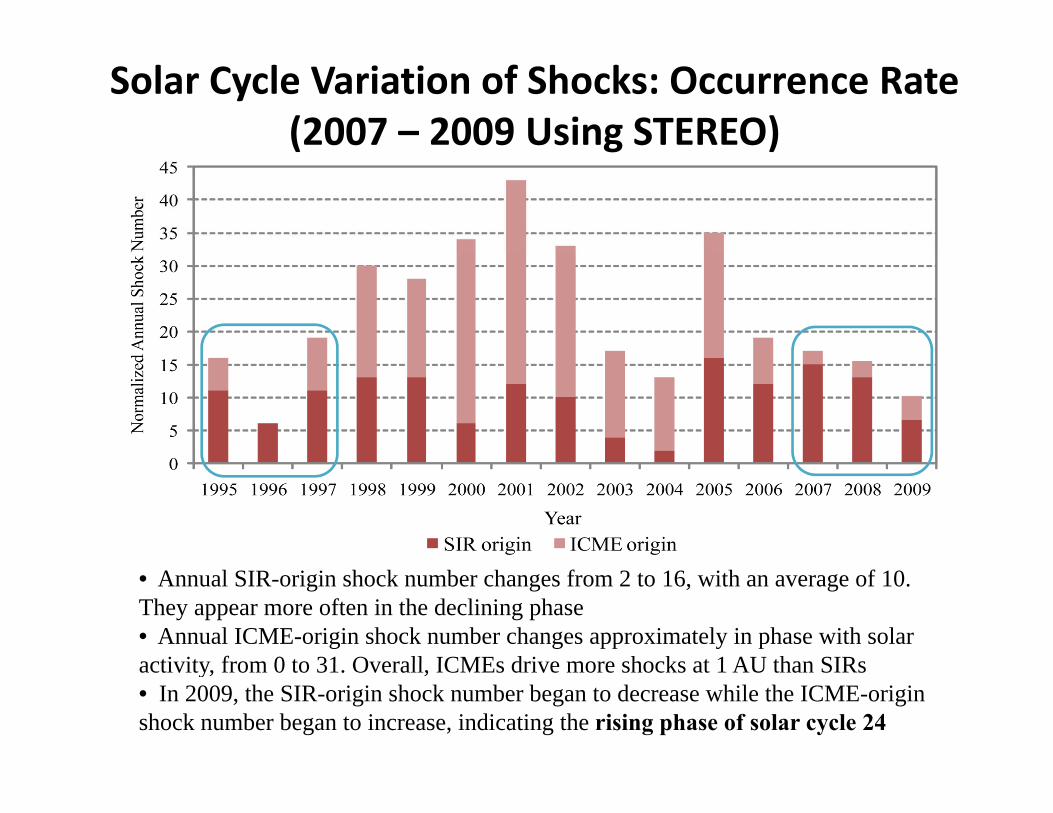
Solar Cycle Variation of Shocks: Occurrence Rate(2007 – 2009 Using STEREO)( g )
• Annual SIR-origin shock number changes from 2 to 16, with an average of 10. They appear more often in the declining phase• Annual ICME-origin shock number changes approximately in phase with solar activity from 0 to 31 Overall ICMEs drive more shocks at 1 AU than SIRsactivity, from 0 to 31. Overall, ICMEs drive more shocks at 1 AU than SIRs• In 2009, the SIR-origin shock number began to decrease while the ICME-origin shock number began to increase, indicating the rising phase of solar cycle 24
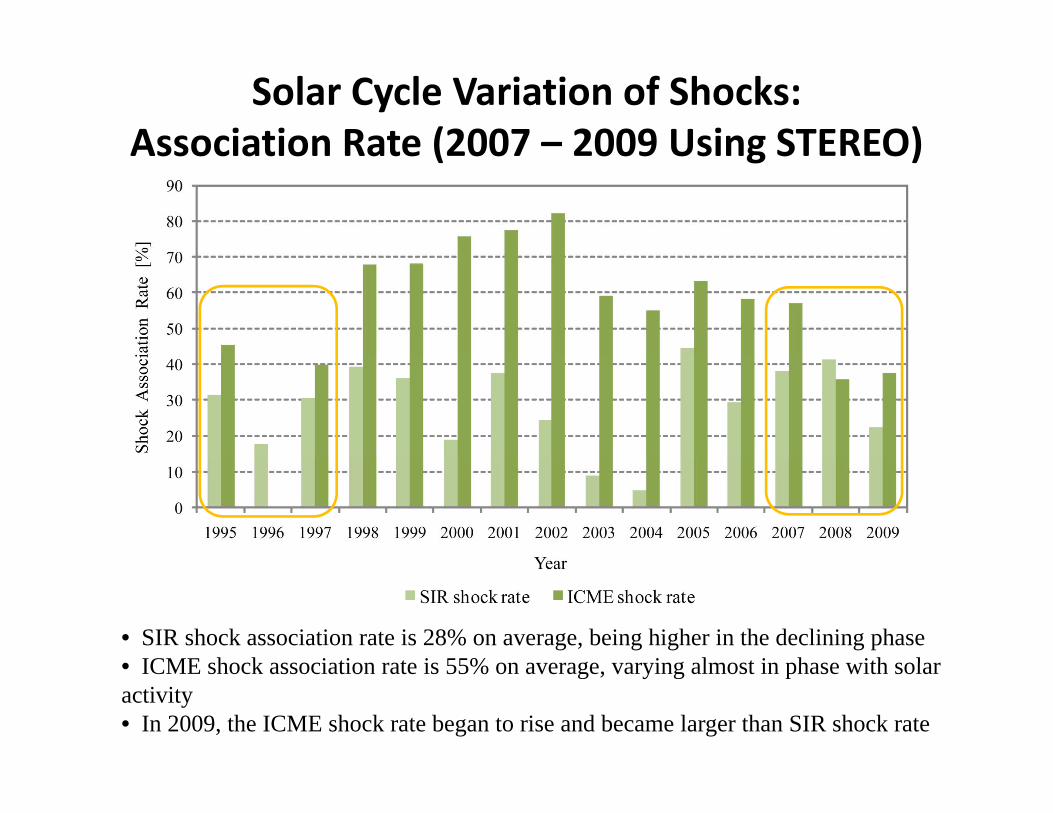
Solar Cycle Variation of Shocks: Association Rate (2007 – 2009 Using STEREO)Association Rate (2007 2009 Using STEREO)
• SIR shock association rate is 28% on average, being higher in the declining phase• ICME shock association rate is 55% on a erage ar ing almost in phase ith solar• ICME shock association rate is 55% on average, varying almost in phase with solar activity• In 2009, the ICME shock rate began to rise and became larger than SIR shock rate
Recommended