Spatial Patterns of Visitor Behavior: A Case Study of the North Carolina Zoological Park
Maurice L. McKenzie, Undergraduate Student
Keith G. Oebbage, Professor
Department of Geography University of North Carolina-Greensboro Greensboro, NC 27412-5001
100
This paper explains the spatial patterns of visitor behavior at the North Carolina Zoological Park (NCZP) . The NCZP is one of the top ten tourist attractions in the state, but it is unclear what factors influence each individual 's decision to visit the zoo. The research reported in this paper partially confirmed many of the theoretical expectations about visitor behavior. Based on the results of a visitor survey, the NCZP is a family attraction that caters to a largely well -educated and affluent audience. Most of those surveyed came from the nearby urban centers, while the rural counties immediately adjacent to the NCZP did not generate a large number of visitors, in part due to their smaller populations. Individuals may also require a threshold in distance travelled before a recreational day-trip becomes a meaningful experience . Visitors w ith above average income levels were more likely to travel greater distances to visit the NCZP, while education played a less significant role in explaining distance travelled. Although the NCZP is a statefunded institution, visitors from the extreme eastern and western parts of the state are not well -represented. The remoteness and largely rural nature of the economy in these parts of the state, and the lower income levels of individuals from these counties, may act to constrain individual mobility.
KEY WORDS : visitor behavior, North Carolina Zoological Park, socio-economic status, recreation, park, zoo
Geographers have traditionally studied spatial behavior and its relationship to individual characteristics and circumstances. Most researchers concerned with the spatial implications of human behavior have tended to concentrate on consumer shopping habits (Ghosh and McLafferty 1984, Spencer 1980), residential location decisions (Phipps and Laverty 1983, Talarchek 1982, Meyer 1980), and daily travel-activity patterns (Hanson 1982, Hensher and Stopher 1979), at the expense of research in other areas. As a result, only a limited amount of attention has been devoted to the spatial patterns of visitor behavior at major
tourist attractions (Bitgood and Benefield 1987, Cooper 1981, Murphy and Rosenblood 1974). Yet tourist attractions like the North Carolina Zoological Park (NCZP), provide an attractive medium for the study of consumer behavior because visitors encounter many relatively unfamiliar environments that must be assimilated in a short period of time. It also offers an opportunity to examine consumer behavior under less stringent timegeographic constraints, particularly in comparison to spatial decision-making processes associated with the tightly organized, and highly repetitive, intra-urban movement patterns between the home, workplace, and various ancillary services. Furthermore, the way in which a visitor explores a tourist attraction is of vital interest to authorities who need to create maximum exposure and use for the attraction during a brief tourist season.
BACKGROUND AND PURPOSE
The purpose of this paper is to explain the spatial patterns of consumer behavior for visitors to the NCZP, located in Asheboro . Over 110 million tourists visited zoological parks nationwide in 1988, almost the equivalent of 50 percent of the U.S. population (Personal Communication 1989a). The NCZP is located to the southeast of the city of Asheboro near the geographic and demographic center of the State of North Carolina (Fig. 1). The zoo consists of 1,450 acres, which makes it one of the world's largest natural habitat zoological parks. The NCZP is one of only two state-supported zoos in the country and is a major part of the state's growing tourist industry. It is based on a zoogeographic concept whereby animals are grouped into clusters that are similar to the geographic regions from which the animals come (Figs. 2 and 3). There will be seven zoogeographic clusters within the Park: 1) North America, 2) South America, 3) Europe, 4) Asia, 5) Africa, 6) Australia, and 7) World of Seas. The 300-acre African continent is complete and the 200-acre North American continent is currently under construction, while all other
clusters have yet to be developed. Although the zoo is in a predominantly rural location, it is only 30 miles from an interstate (1-85). and two miles from a major U.S. highway (220). Furthermore, despite the rural setting of the zoo, it is also less than 70 miles from three Metropolitan Statistical Areas (MSA's)-the Greensboro, Winston-Salem, High Point MSA, the Charlotte MSA, and the Raleigh-Durham MSA. The size and location of the zoo suggest there will be no inhibiting limitations upon growth such as that experienced by other zoos in more urban settings.
The NCZP is the third most visited zoo in the southeast region, and it ranks fifth in the region in terms of species and specimen collections, making it one of the most significant zoological attractions in the south (American Association of Zoological Parks and Aquariums 1985). In 1988, the zoo attracted over ' /2 million visitors, and in 1994, it is expected that close to one million persons will visit the zoo (Personal Communication 1989b). The economic impact on the surrounding area of the NCZP is considerable. In 1988, according to some sources, zoogoers spent $10.3 million principally on zoo attractions and at area facilities like restaurants, motels, and service stations. Based on visitor levels, the NCZP has emerged as one of the top ten tourist attractions in the state of North Carolina. However, although the NCZP serves over 600,000 visitors annually, zoo officials are unclear who the visitors are and where they come from. Therefore, a study of visitor behavior at this facility seems particularly relevant and timely.
The specific purpose of this paper is to establish the socio-economic characteristics of visitors to the NCZP; determine the spatial distribution of tourist demand for the facility; and examine some of the factors that influence each individual 's decision to visit the zoo. By extending into a relatively new and under-researched environment, the theoretical debate over which variables best explain spatial behavior and spatial choice, it will be possible to test whether generalizations made in retailing, travel behavior, and residential mobility stud-
101
o N
Virginia
Tennessee
Georgia
south Carolina ,,;'Of,
~,,~
~'"
o miles
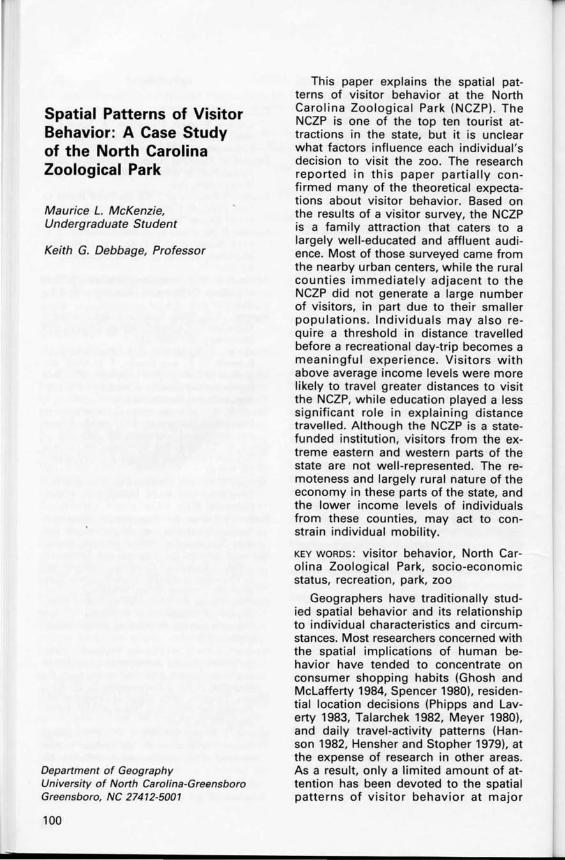
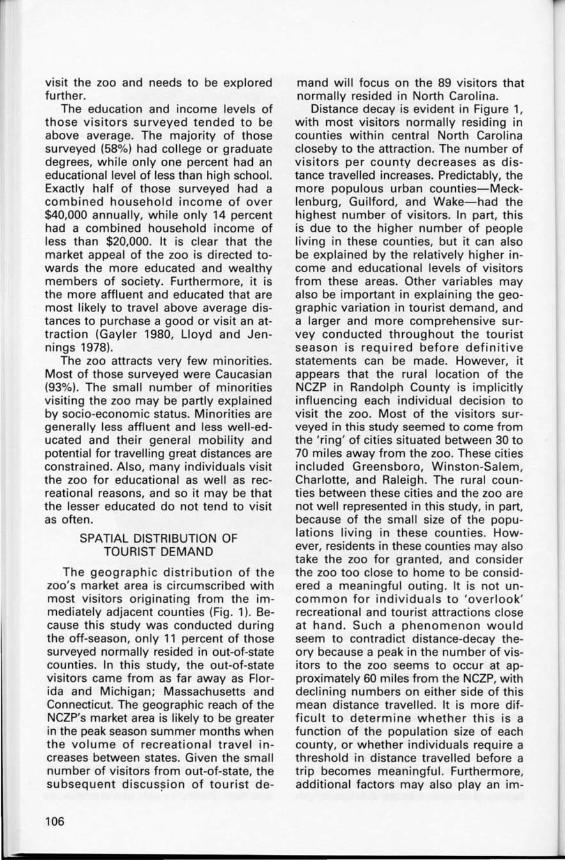
Figure 1. Spatial distribution of visitor demand by county origin for the North Carolina Zoological Park.
~ Of,e"
70

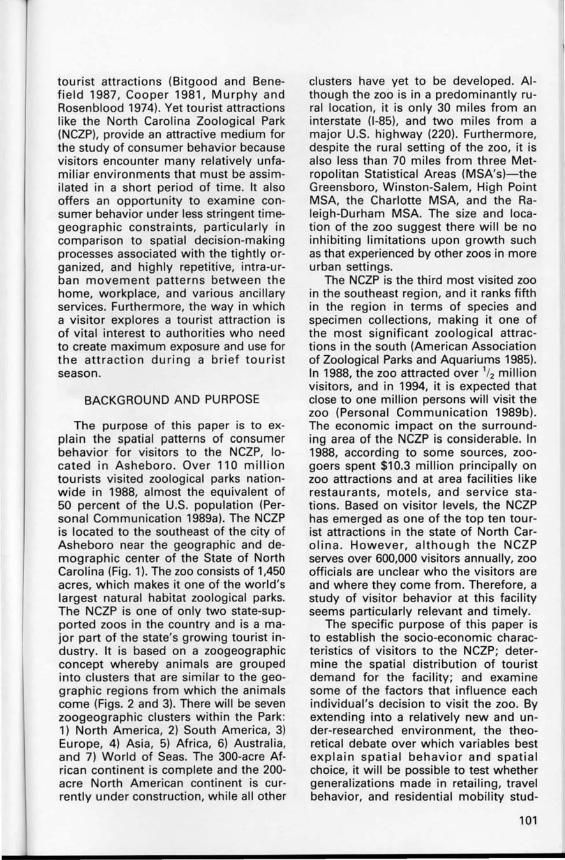
Figure 2. Lowland gorillas in Forest Glade exhibit at the North Carolina Zoological Park (Courtesy of North Carolina Zoological Park).
ies are valid in other research fields. On a cautionary note, the research reported in this paper is part of a larger, on-going study of visitor behavior and the research findings should therefore be viewed as tentative and preliminary in nature.
METHODOLOGY
The data for this pilot study were gathered by use of the survey method. A short questionnaire was developed which was approved by zoo officials. Visitors were interviewed at the zoo's main entry/exit point upon departure from the zoo. A systematic sampling approach was used by selecting every fifth tourist upon completion of the previous survey. Exactly 100 visitors were interviewed during the early spring of 1989. During this time period, the NCZP attracts visitors almost exclusively on weekends and therefore all sampling was conducted on a Saturday and/or Sun-
day. On a more cautionary note, because visitor attendance at the zoo varies over time, it is clear that this study is not representative of the entire year with respect to seasonal trends.
VISITOR CHARACTERISTICS
Based on the survey data, slightly over half of those surveyed were repeat visitors, with slightly over half of the repeat visitors last visiting the zoo in 1988 (Table 1). Furthermore, 11 of the repeat visitors last visited the zoo in 1987, indicating that a substantial proportion of visitors to the NCZP are highly familiar with the product.
The survey also indicated that the zoo has a strong family appeal. Exactly 75 percent of those surveyed were travelling in groups of family and relatives, indicating that the decision to visit the zoo may be a collective decision made by more than one individual. None of those surveyed were travelling with larger or-
103

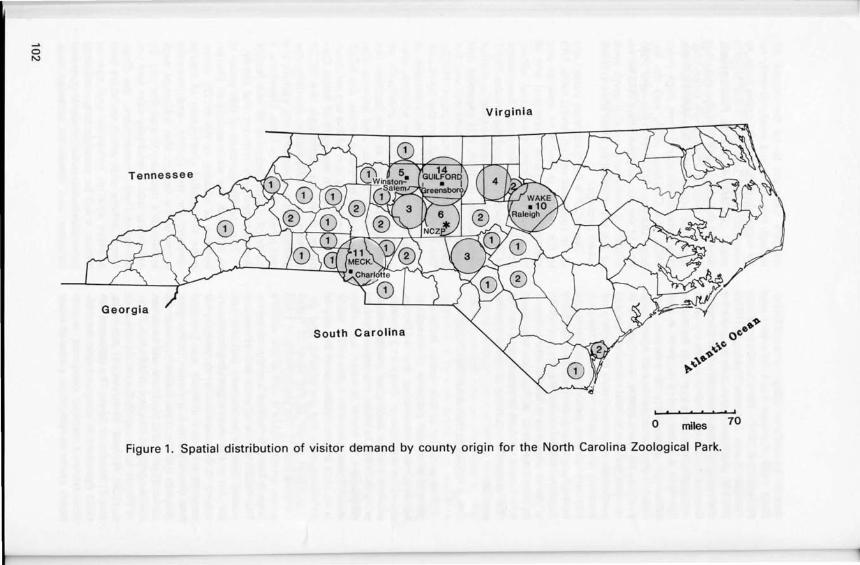
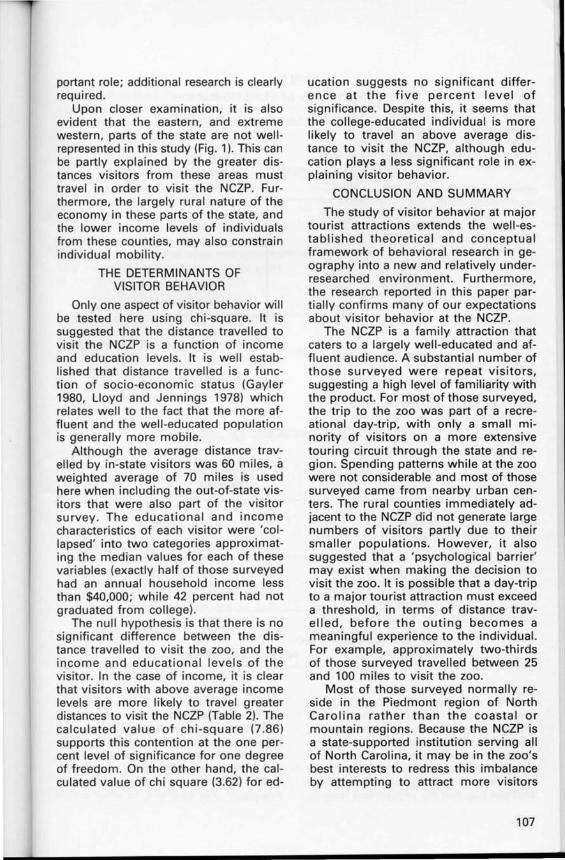
Figure 3. Nyala on African Plains at the North Carolina Zoological Park (Courtesy of North Carolina Zoological Park).
ganized groups, mainly due to the time period the study was conducted. No mass-market appeal is evident in the winter or early spring season. Typically, bus tours and school groups do not begin arriving until April (NCZP 1989).
Only 10 percent of those su rveyed were on a touring circuit, which is defined as a multiple purpose trip, and not a day trip from home solely for the purpose of visiting the zoo. Only one per-
104
son from North Carolina was on a touring circuit, with all others coming from out of state and staying with relatives and friends from the general area. The assumption here is that the spatial distribution of touring circuits will become a more critical factor in understanding visitor behavior during the summer tourist season when the volume of recreational travel increases between states.
Total visitor expenditures while at the
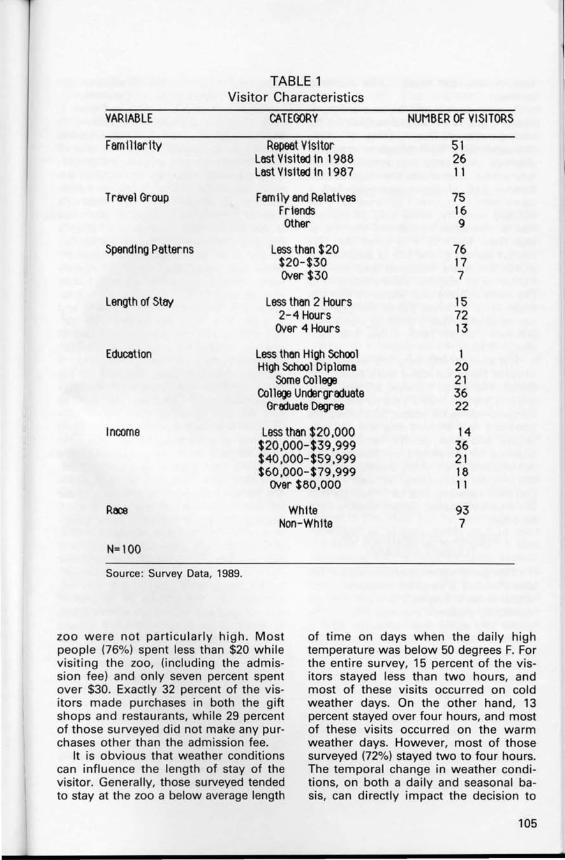
TABLE 1 Visitor Characteristics
VARIABLE CATEGORY NUMBER OF VISITORS
Fam11 larlty Repeat Vlsltor 51 Lest V1slted 1n 1988 26 Lest V1s1ted 1n 1987 11
Tr8Vel Group Fomlly and Relat1ves 75 Fr1ends 16 other 9
Spend1ng Patterns Less than $20 76 $20-$30 17 Over $30 7
Length of Stay Less than 2 Hours 15 2-4 Hours 72
Over 4 Hours 13
Edu~tion Less thon High School 1 High School Diploma 20
Some College 21 College Undergraduate 36
Graduote Degree 22
Income Less than $20,000 14 $20,000-$39,999 36 $40,000-$59,999 21 $60,000-$79,999 18
Over $80,000 11
R~ White 93 Non-White 7
N=100
Source : Survey Data, 1989.
zoo were not particularly high. Most people (76%) spent less than $20 while visiting the zoo, (including the admission fee) and only seven percent spent over $30. Exactly 32 percent of the visitors made purchases in both the gift shops and restaurants, while 29 percent of those surveyed did not make any purchases other than the admission fee.
It is obvious that weather conditions can influence the length of stay of the visitor. Generally, those surveyed tended to stay at the zoo a below average length
of time on days when the daily high temperature was below 50 degrees F. For the entire survey, 15 percent of the visitors stayed less than two hours, and most of these visits occurred on cold weather days. On the other hand, 13 percent stayed over four hours, and most of these visits occurred on the warm weather days. However, most of those surveyed (72%) stayed two to four hours. The temporal change in weather conditions, on both a daily and seasonal basis, can directly impact the decision to
105
visit the zoo and needs to be explored further.
The education and income levels of those visitors surveyed tended to be above average. The majority of those surveyed (58%) had college or graduate degrees, while only one percent had an educational level of less than high school. Exactly half of those surveyed had a combined household income of over $40,000 annually, while only 14 percent had a combined household income of less than $20,000. It is clear that the market appeal of the zoo is directed towards the more educated and wealthy members of society. Furthermore, it is the more affluent and educated that are most likely to travel above average distances to purchase a good or visit an attraction (Gayler 1980, Lloyd and Jennings 1978).
The zoo attracts very few minorities. Most of those surveyed were Caucasian (93%). The small number of minorities visiting the zoo may be partly explained by socio-economic status. Minorities are generally less affluent and less well -educated and their general mobility and potential for travelling great distances are constrained. Also, many individuals visit the zoo for educational as well as recreational reasons, and so it may be that the lesser educated do not tend to visit as often.
SPATIAL DISTRIBUTION OF TOURIST DEMAND
The geographic distribution of the zoo's market area is circumscribed with most visitors orig inating from the immediately adjacent counties (Fig . 1). Because this study was conducted during the off-season, only 11 percent of those surveyed normally resided in out-of-state counties. In this study, the out-of-state visitors came from as far away as Florida and Michigan; Massachusetts and Connecticut. The geographic reach of the NCZP's market area is likely to be greater in the peak season summer months when the volume of recreational travel increases between states. Given the small number of visitors from out-of-state, the subsequent discusl>ion of tourist de-
106
mand will focus on the 89 visitors that normally resided in North Carolina.
Distance decay is evident in Figure 1, with most visitors normally residing in counties within central North Carolina closeby to the attraction. The number of visitors per county decreases as distance travelled increases. Predictably, the more populous urban counties-Mecklenburg, Guilford, and Wake-had the highest number of visitors. In part, this is due to the higher number of people living in these counties, but it can also be explained by the relatively higher income and educational levels of visitors from these areas. Other variables may also be important in explaining the geographic variation in tourist demand, and a larger and more comprehensive survey conducted throughout the tourist season is required before definitive statements can be made. However, it appears that the rural location of the NCZP in Randolph County is implicitly influencing each individual decision to visit the zoo. Most of the visitors surveyed in this study seemed to come from the ' ring' of cities situated between 30 to 70 miles away from the zoo. These cities included Greensboro, Winston-Salem, Charlotte, and Raleigh . The rural counties between these cities and the zoo are not well represented in this study, in part, because of the small size of the populations living in these counties. However, residents in these counties may also take the zoo for granted, and consider the zoo too close to home to be considered a meaningful outing . It is not uncommon for individuals to ' overlook' recreational and tourist attractions close at hand. Such a phenomenon would seem to contradict distance-decay theory because a peak in the number of visitors to the zoo seems to occur at approximately 60 miles from the NCZP, w ith declining numbers on either side of this mean distance travelled . It is more difficult to determine whether this is a function of the population size of each county, or whether individuals require a threshold in distance travelled before a trip becomes meaningful. Furthermore, additional factors may also play an im-
portant role; additional research is clearly required.
Upon closer examination, it is also evident that the eastern, and extreme western, parts of the state are not well represented in th is study (Fig. 1). This can be partly explained by the greater distances visitors from these areas must travel in order to visit the NCZP. Furthermore, the largely rural natlJre of the economy in these parts of the state, and the lower income levels of individuals from these counties, may also constrain individual mobility.
THE DETERMINANTS OF VISITOR BEHAVIOR
Only one aspect of visitor behavior w ill be tested here using chi-square. It is suggested that the distance travelled to visit the NCZP is a function of income and education levels. It is well established that distance travelled is a function of socio-economic status (Gayler 1980, Lloyd and Jennings 1978) which relates well to the fact that the more affluent and the well -educated population is generally more mobile.
Although the average distance travelled by in-state visitors was 60 miles, a weighted average of 70 miles is used here when including the out-of-state visito rs that were also part of the visitor survey. The educational and income characteristics of each visitor were 'col lapsed' into two categories approximating the median values for each of these variables (exactly half of those surveyed had an annual household income less than $40,000; while 42 percent had not graduated from college).
The null hypothesis is that there is no significant difference between the distance t ravelled to visit the zoo, and the income and educational levels of the visito r. In the case of income, it is clea r that visitors w ith above average income levels are more likely to travel greater distances to visit the NCZP (Table 2). The calculated value of chi -square (7.86) supports this contention at the one percent level of significance for one degree of freedom. On the other hand, the cal culated value of chi square (3.62) for ed-
ucation suggests no significant difference at the five percent level of significance. Despite this, it seems that the college-educated individual is more likely to travel an above average distance to visit the NCZP, although education plays a less significant role in explaining visitor behavior.
CONCLUSION AND SUMMARY
The study of visitor behavior at major tourist attractions extends the well -established theoretical and conceptual framework of behavioral research in geography into a new and relatively underresearched environment. Furthermore, the research reported in this paper partially confirms many of our expectations about visitor behavior at the NCZP.
The NCZP is a family attraction that caters to a largely well -educated and affluent audience. A substantial number of those surveyed were repeat visitors, suggesting a high level of familiarity with the product. For most of those surveyed, the trip to the zoo was part of a recreational day-trip, with only a small minority of visitors on a more extensive touring circuit through the state and region. Spending patterns while at the zoo were not considerable and most of those surveyed came from nearby urban centers. The rural counties immediately adjacent to the NCZP did not generate large numbers of visitors partly due to their smaller populations. However, it also suggested that a 'psychological barrier' may exist when making the decision to visit the zoo. It is possible that a day-trip to a major tourist attraction must exceed a threshold, in terms of distance travelled, before the outing becomes a meaningful experience to the individual. For example, approximately two-thirds of those surveyed travelled between 25 and 100 miles to visit the zoo.
Most of those surveyed normally reside in the Piedmont region of North Carolina ratl'ler than the coastal or mountain regions. Because the NCZP is a state-supported institution serving all of North Carolina, it may be in the zoo's best interests to redress this imbalance by attempting to attract more visitors
107

TABLE 2 The Determinants of Visitor Behavior
A. Distance Troyelled os a Function of Income
< 70 mIles dlst80C8 trwelled
> 70 mIles dlst80C8 trwelled
< $40,000 Annu81 Household Income
.
30
20
observed fr~uencles, n = 100
> $40,000 Annu81 Household Income
16
34
chl-SQu8re = 7.86 1 ~ level of slgnlflC8nce
B. DIstance Jrwelled lIS 8 FunctIon of EduC8t1on
< 70 ml1es dlst8llC8 trwelled
> 70 miles dlst80C8 trwelled
some co liege or less
24
18
observed frequencies, n = 100
college gr8dU8te 8nd obove
22
36
chl-SQU8re = 3.62 no slgnlfjC8nt dIfference
from the outer reaches of the state. This may prove difficult because it seems that income levels, and to a lesser extent, education, partially explain how far individuals are willing to travel to visit the zoo. The well -educated and affluent are more likely to travel greater distances to visit the zoo, but the prosperous regions
108
of the state are situated in the Piedmont, not the coastal or mountain regions.
Further research is clearly required before more definitive statements can be made about visitor behavior. Many factors that can explain spatial choice and visitor behavior were not considered in this paper. For example, to what extent

does visitor behavior differ between repeat and first-time visitors? What are the perceived obstacles to visit the zoo? What is the effect of publicity and information levels on attendance at the zoo? Does visitor behavior at zoos or related attractions in different locations conform to the findings at the NCZP? Furthermore, seasonal changes in visitor behavior remain unexplained. T.his study has suggested many future avenues of research. The growing economic significance of the tourist industry ensures that the study of visitor behavior will emerge as a major research initiative in the years to come.
ACKNOWLEDGEMENTS
Keith Debbage wishes to thank the University of North Carolina at Greensboro Research Council (Project #294749) for partially funding the empirical research presented in this paper. The statements, findings and conclusions are those of the authors and do not reflect the views of the university. Cartographic assistance courtesy of Chris Struzik. The authors also wish to thank Elise Light, Marketing Officer at the NCZP and Harol Hoffman, Research Coordinator of the NCZPj UNCG Research Committee without whom this paper would not have been possible.
REFERENCES
American Association of Zoological Parks and Aquariums, 1985. Zoological Parks and Aquariums in the Americas 1984- 1985, Wheeling , WV.
Bitgood, S., and Benefield, A. 1987. Visitor Behavior: A Comparison Across Zoos, Technical Report 86-20, Jacksonville, FI : Psychology Institute.
Cooper, C. P. 1981 . Spatial and Temporal Patterns of Tourist Behavior. Regional Studies, 15: 359-371 .
Gayler, H. J. 1980. Social Class and Consumer Spatial Behavior : Some Aspects of Variation in Shopping Patterns in Metropolitan Vancouver, Canada. Transactions of the Institute of British Geographers, 5: 427-445.
Ghosh, A., and McLafferty, S. 1984. A Model of Consumer Propensity for Multipurpose Shopping. Geographical Analysis, 16: 244-249.
Hanson, S. 1982. The Determinants of Da ily Travel Activity Patterns : Relative Location and Sociodemographic Factors. Urban Geography, 3: 179- 203.
Hensher, D. and Stopher, P. 1979. Behavioural Travel Demand Modelling. London : Croom Helm.
Lloyd, R. and Jennings, D. 1978. Shopping Behavior and Income: Comparisons in an Urban Env i ronment. Econom ic Geography, 54: 157-162.
Meyer, R. 1980. A Descriptive Model of Constrained Residential Search. Geographical Analysis, 12: 21-32.
Murphy, P. E. and Rosenblood, L. 1974. Tourism : An Exercise in Spatial Search. Canadian Geographer, 18: 201 - 210.
Personal Communication. November, 1989a. Director of American Association of Zoological Parks and Aquariums, Wheeling, WV.
Personal Communication, March, 1989b. Marketing Director of the North Carolina Zoolog ical Park, Asheboro, NC.
Phipps, A., and Laverty, W. 1983. Optimal Stopping and Residential Search Behavior. Geographical Analysis, 15: 187- 204.
Spencer, A. H. 1980. Cognition and Shopping Choice : A Multidimensional Scaling Approach. Environment and Planning A 12: 1235- 1251 .
Talarchek, T. 1982. Sequential Aspects of Residential Search and Selection. Urban Geography, 3: 34-57.
109
Recommended