Inter-noise 2014 Page 1 of 10
Infrasound sensors and their calibration at low frequency
Franck LARSONNER1, Hans-Gunter USZAKIEWICZ2, Michael MENDE2
1 CEA, DAM, DIF, F-91297 Arpajon, France 2 SPEKTRA, Schwingungstechnik und Akustik GmbH Dresden, Germany
ABSTRACT Considering acoustic metrology in the infrasound field, sensors design and their calibration at low frequency is a challenge. The CEA designs for several years infrasound sensors named microbarometers MB2000, MB2005 and now the new one MB3, uses them in international networks like for the Comprehensive Nuclear Test Ban Treaty Organization (CTBTO) and maintains them in operational condition. Their response is calibrated during their operational life to ensure that they fulfill their metrological requirements using an infrasound calibrator designed by CEA. Furthermore thanks to the CS18 SPL-VLF infrasound calibration system developed by SPEKTRA, a measurement comparison has been performed in the frequency bandwidth [1 Hz; 20 Hz] with a new MB3 and a MB2005 microbarometer. The authors present the infrasound microbarometer sensors, the two calibration devices and the associated measurement results. Keywords: Infrasound, metrology, calibration I-INCE Classification of Subjects Number(s): 72.1
1. INTRODUCTION The existing acoustic pressure level calibration reference methods applied in the National
Metrology Institutes (NMIs), acoustic calibration providers and sensor manufacturers are the primary reciprocity method [1], the comparison method [2] and the “known input” method based on periodic pressure generators [3]. All these methods are standardized and dedicated to the laboratory standard microphones and the working standard microphones. The Calibration Measurement Capabilities in the acoustic field [4] satisfy measurement traceability to the SI units in the low frequency down to 63 Hz, 31.5 Hz or 20 Hz depending on the National Metrology Institutes. An acoustic international key comparison [5] was conducted with two laboratory standard microphones Bruel & Kjear 4160 which were calibrated by nine NMIs in the frequency range from 2 Hz to 250 Hz with the current primary reciprocity method. During the comparison, a 1 Hz calibration was carried out by means of another method using a laser pistonphone [6]. The results show that the pressure sensitivity measurement uncertainty grows in a significant way from 0.02 dB at 100 Hz to 0.15 dB at 2 Hz. Some improvements in calibration devices like laser pistonphone [7] and in the frequency response calibration method have been investigated either to reach lower frequency or uncertainty measurement [8]. Considering the infrasound domain, from 20 Hz down to 0.01 Hz, measurement needs increase in many artificial and natural fields like health and safety, transportation, building construction, energy
Page 2 of 10 Inter-noise 2014
Page 2 of 10 Inter-noise 2014
with the air turbines, atmospheric and geophysical studies [9]. The constrains associated with the current existing calibration methods and reference standards are the lack of traceability at low frequency, the high measurement uncertainty, the size, the shape, and the technology differences with the sensors to be calibrated. They can be seen as some technical barriers to the confidence in the measurement results and impact the conformity decision in the measuring infrasound systems. Some of these points are considered in the current European metrology research project in the human perception of non-audible sound field [10]. Among all the infrasound fields of interest, we also have that of explosion domain, in particular the nuclear explosion in the atmosphere. The DASE (Département Analyse, Surveillance, Environnement) of the CEA’s (The French Atomic Energy Commission), is involved in the fight against nuclear proliferation and terrorism which includes contribution to the Comprehensive Nuclear Test-Ban Treaty Organization – CTBTO. The CTBTO’s monitoring network uses infrasound sensors in 60 stations all over the world. In order to address the technical requirements and performances associated with the users specifications of this treaty and other geophysical studies, the CEA develops, uses and maintains in operational conditions many dynamic infrasound pressure sensors named microbarometer type MB2000, MB2005 and the new one MB3. In parallel, an infrasound metrology laboratory and a verification measurement process was developed in compliance with the international standard ISO 10012:2003 - Measurement management system – Requirements for measurement processes and measuring equipment.
2. THE CEA INFRASOUND MICROBAROMETER SENSORS
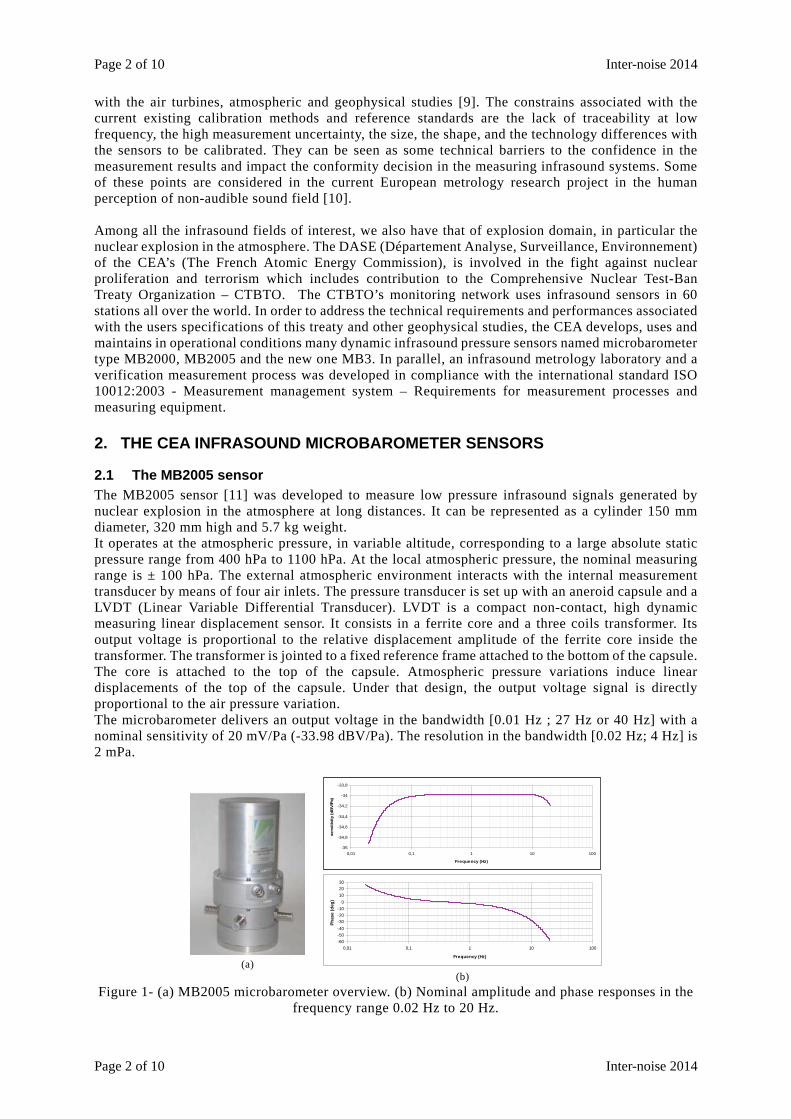
2.1 The MB2005 sensor The MB2005 sensor [11] was developed to measure low pressure infrasound signals generated by nuclear explosion in the atmosphere at long distances. It can be represented as a cylinder 150 mm diameter, 320 mm high and 5.7 kg weight. It operates at the atmospheric pressure, in variable altitude, corresponding to a large absolute static pressure range from 400 hPa to 1100 hPa. At the local atmospheric pressure, the nominal measuring range is ± 100 hPa. The external atmospheric environment interacts with the internal measurement transducer by means of four air inlets. The pressure transducer is set up with an aneroid capsule and a LVDT (Linear Variable Differential Transducer). LVDT is a compact non-contact, high dynamic measuring linear displacement sensor. It consists in a ferrite core and a three coils transformer. Its output voltage is proportional to the relative displacement amplitude of the ferrite core inside the transformer. The transformer is jointed to a fixed reference frame attached to the bottom of the capsule. The core is attached to the top of the capsule. Atmospheric pressure variations induce linear displacements of the top of the capsule. Under that design, the output voltage signal is directly proportional to the air pressure variation. The microbarometer delivers an output voltage in the bandwidth [0.01 Hz ; 27 Hz or 40 Hz] with a nominal sensitivity of 20 mV/Pa (-33.98 dBV/Pa). The resolution in the bandwidth [0.02 Hz; 4 Hz] is 2 mPa.
-35
-34,8
-34,6
-34,4
-34,2
-34
-33,8
0,01 0,1 1 10 100
Frequency (Hz)
sens
itivi
ty (d
BV/
Pa)
(a)
-60-50-40-30-20-10
0102030
0,01 0,1 1 10 100
Frequency (Hz)
Phas
e (d
eg)
(b)
Figure 1- (a) MB2005 microbarometer overview. (b) Nominal amplitude and phase responses in the frequency range 0.02 Hz to 20 Hz.
Inter-noise 2014 Page 3 of 10
Inter-noise 2014 Page 3 of 10
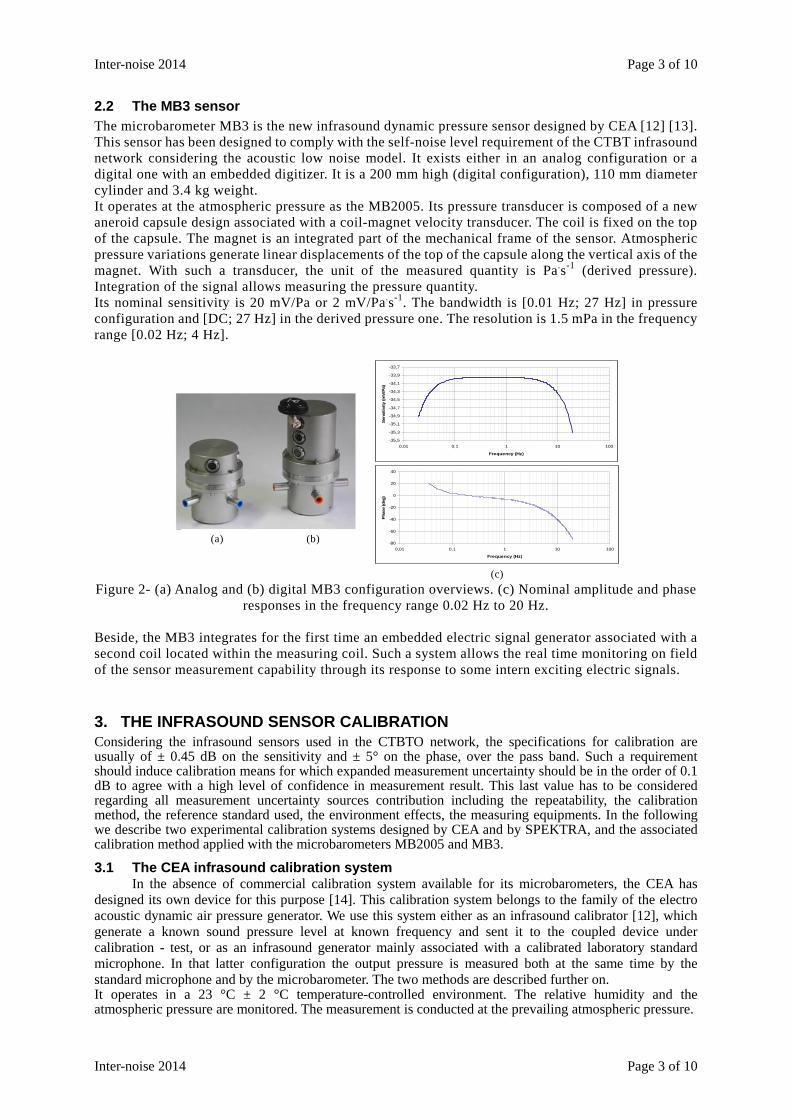
2.2 The MB3 sensor The microbarometer MB3 is the new infrasound dynamic pressure sensor designed by CEA [12] [13]. This sensor has been designed to comply with the self-noise level requirement of the CTBT infrasound network considering the acoustic low noise model. It exists either in an analog configuration or a digital one with an embedded digitizer. It is a 200 mm high (digital configuration), 110 mm diameter cylinder and 3.4 kg weight. It operates at the atmospheric pressure as the MB2005. Its pressure transducer is composed of a new aneroid capsule design associated with a coil-magnet velocity transducer. The coil is fixed on the top of the capsule. The magnet is an integrated part of the mechanical frame of the sensor. Atmospheric pressure variations generate linear displacements of the top of the capsule along the vertical axis of the magnet. With such a transducer, the unit of the measured quantity is Pa.s-1 (derived pressure). Integration of the signal allows measuring the pressure quantity. Its nominal sensitivity is 20 mV/Pa or 2 mV/Pa.s-1. The bandwidth is [0.01 Hz; 27 Hz] in pressure configuration and [DC; 27 Hz] in the derived pressure one. The resolution is 1.5 mPa in the frequency range [0.02 Hz; 4 Hz].
-35,5
-35,3
-35,1
-34,9
-34,7
-34,5
-34,3
-34,1
-33,9
-33,7
0,01 0,1 1 10 100
Frequency (Hz)
Sens
itivi
ty (m
V/Pa
)
(a) (b) -80
-60
-40
-20
0
20
40
0,01 0,1 1 10 100
Frequency (Hz)
Phas
e (d
eg)
(c)
Figure 2- (a) Analog and (b) digital MB3 configuration overviews. (c) Nominal amplitude and phase responses in the frequency range 0.02 Hz to 20 Hz.
Beside, the MB3 integrates for the first time an embedded electric signal generator associated with a second coil located within the measuring coil. Such a system allows the real time monitoring on field of the sensor measurement capability through its response to some intern exciting electric signals.
3. THE INFRASOUND SENSOR CALIBRATION Considering the infrasound sensors used in the CTBTO network, the specifications for calibration are usually of ± 0.45 dB on the sensitivity and ± 5° on the phase, over the pass band. Such a requirement should induce calibration means for which expanded measurement uncertainty should be in the order of 0.1 dB to agree with a high level of confidence in measurement result. This last value has to be considered regarding all measurement uncertainty sources contribution including the repeatability, the calibration method, the reference standard used, the environment effects, the measuring equipments. In the following we describe two experimental calibration systems designed by CEA and by SPEKTRA, and the associated calibration method applied with the microbarometers MB2005 and MB3.
3.1 The CEA infrasound calibration system In the absence of commercial calibration system available for its microbarometers, the CEA has
designed its own device for this purpose [14]. This calibration system belongs to the family of the electro acoustic dynamic air pressure generator. We use this system either as an infrasound calibrator [12], which generate a known sound pressure level at known frequency and sent it to the coupled device under calibration - test, or as an infrasound generator mainly associated with a calibrated laboratory standard microphone. In that latter configuration the output pressure is measured both at the same time by the standard microphone and by the microbarometer. The two methods are described further on. It operates in a 23 °C ± 2 °C temperature-controlled environment. The relative humidity and the atmospheric pressure are monitored. The measurement is conducted at the prevailing atmospheric pressure.
Page 4 of 10 Inter-noise 2014
Page 4 of 10 Inter-noise 2014
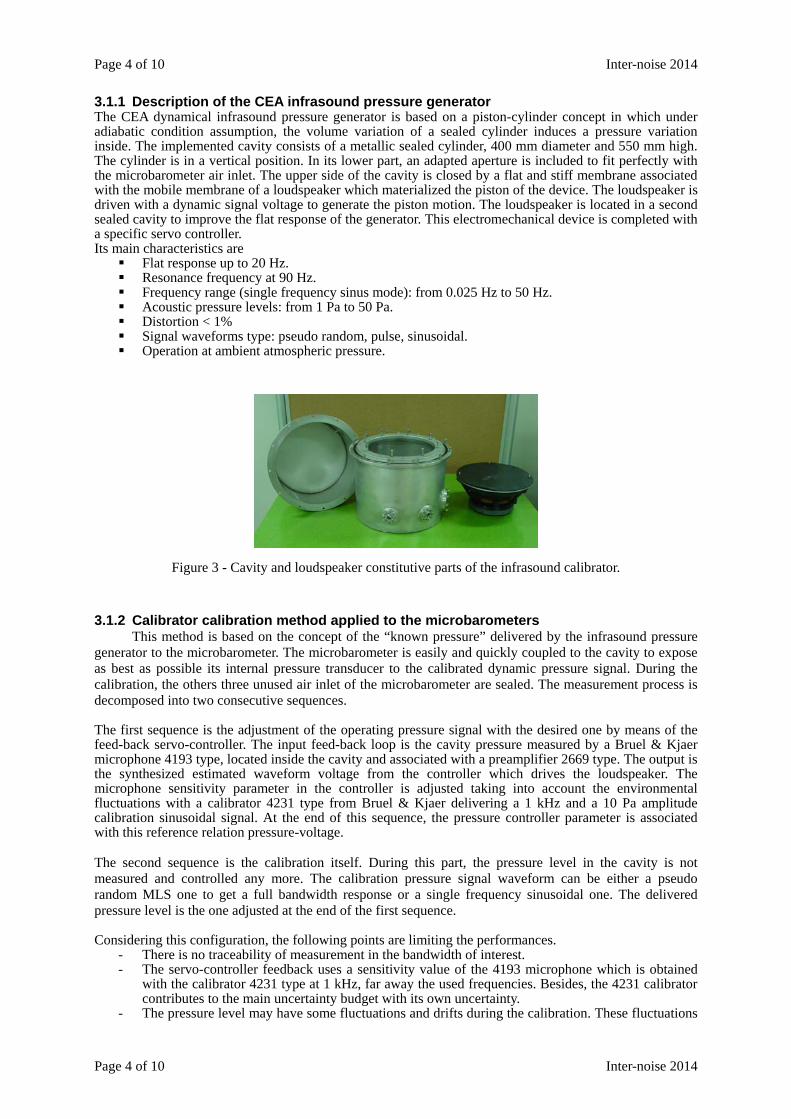
3.1.1 Description of the CEA infrasound pressure generator The CEA dynamical infrasound pressure generator is based on a piston-cylinder concept in which under adiabatic condition assumption, the volume variation of a sealed cylinder induces a pressure variation inside. The implemented cavity consists of a metallic sealed cylinder, 400 mm diameter and 550 mm high. The cylinder is in a vertical position. In its lower part, an adapted aperture is included to fit perfectly with the microbarometer air inlet. The upper side of the cavity is closed by a flat and stiff membrane associated with the mobile membrane of a loudspeaker which materialized the piston of the device. The loudspeaker is driven with a dynamic signal voltage to generate the piston motion. The loudspeaker is located in a second sealed cavity to improve the flat response of the generator. This electromechanical device is completed with a specific servo controller. Its main characteristics are
Flat response up to 20 Hz. Resonance frequency at 90 Hz. Frequency range (single frequency sinus mode): from 0.025 Hz to 50 Hz. Acoustic pressure levels: from 1 Pa to 50 Pa. Distortion < 1% Signal waveforms type: pseudo random, pulse, sinusoidal. Operation at ambient atmospheric pressure.
Figure 3 - Cavity and loudspeaker constitutive parts of the infrasound calibrator. 3.1.2 Calibrator calibration method applied to the microbarometers
This method is based on the concept of the “known pressure” delivered by the infrasound pressure generator to the microbarometer. The microbarometer is easily and quickly coupled to the cavity to expose as best as possible its internal pressure transducer to the calibrated dynamic pressure signal. During the calibration, the others three unused air inlet of the microbarometer are sealed. The measurement process is decomposed into two consecutive sequences. The first sequence is the adjustment of the operating pressure signal with the desired one by means of the feed-back servo-controller. The input feed-back loop is the cavity pressure measured by a Bruel & Kjaer microphone 4193 type, located inside the cavity and associated with a preamplifier 2669 type. The output is the synthesized estimated waveform voltage from the controller which drives the loudspeaker. The microphone sensitivity parameter in the controller is adjusted taking into account the environmental fluctuations with a calibrator 4231 type from Bruel & Kjaer delivering a 1 kHz and a 10 Pa amplitude calibration sinusoidal signal. At the end of this sequence, the pressure controller parameter is associated with this reference relation pressure-voltage. The second sequence is the calibration itself. During this part, the pressure level in the cavity is not measured and controlled any more. The calibration pressure signal waveform can be either a pseudo random MLS one to get a full bandwidth response or a single frequency sinusoidal one. The delivered pressure level is the one adjusted at the end of the first sequence. Considering this configuration, the following points are limiting the performances.
- There is no traceability of measurement in the bandwidth of interest. - The servo-controller feedback uses a sensitivity value of the 4193 microphone which is obtained
with the calibrator 4231 type at 1 kHz, far away the used frequencies. Besides, the 4231 calibrator contributes to the main uncertainty budget with its own uncertainty.
- The pressure level may have some fluctuations and drifts during the calibration. These fluctuations
Inter-noise 2014 Page 5 of 10
Inter-noise 2014 Page 5 of 10
are not measured by the feed-back controller. - The calibrator and the microphone are sensitive to both the thermal and the static pressure
variations. An internal setup function exists to minimise the influence but it needs some tricky operations on the feed-back microphone.
The expanded uncertainty of the sensitivity measurement is 0.4 dB below 20 Hz close to the specification limits. In order to get smaller uncertainty measurement and traceable measurements at lower frequency, we have implemented a comparison method. 3.1.3 Comparison calibration method applied to the microbarometers
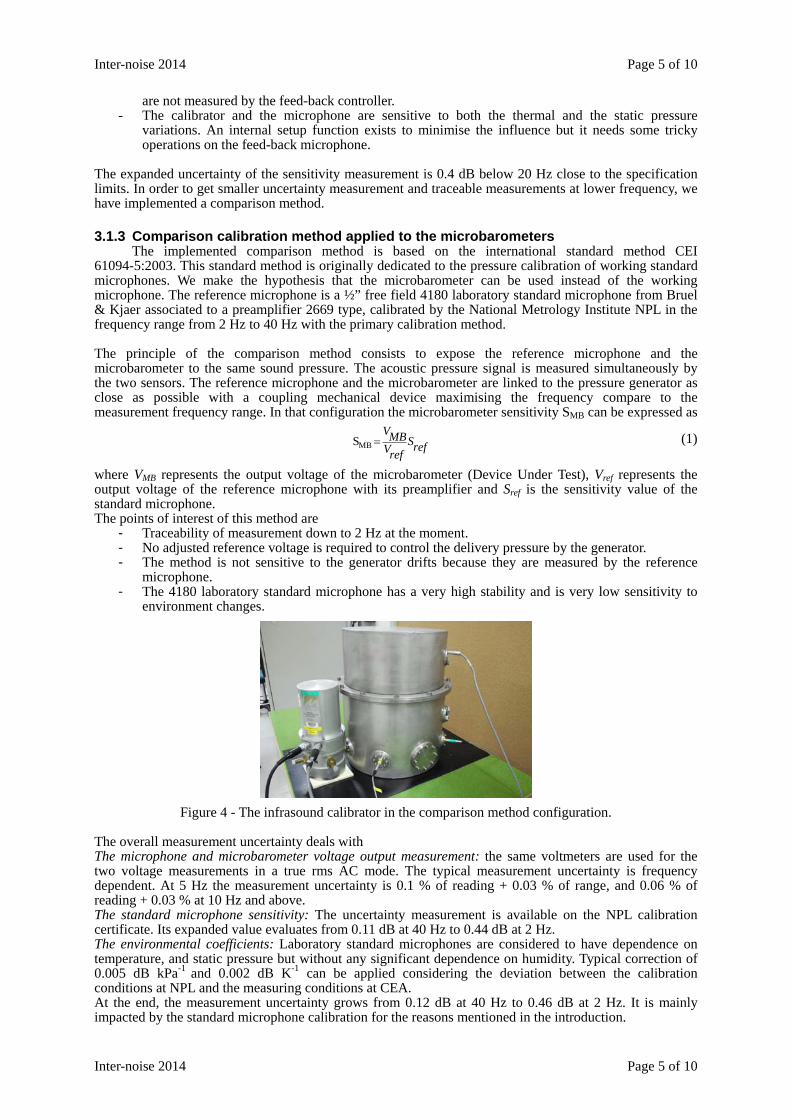
The implemented comparison method is based on the international standard method CEI 61094-5:2003. This standard method is originally dedicated to the pressure calibration of working standard microphones. We make the hypothesis that the microbarometer can be used instead of the working microphone. The reference microphone is a ½” free field 4180 laboratory standard microphone from Bruel & Kjaer associated to a preamplifier 2669 type, calibrated by the National Metrology Institute NPL in the frequency range from 2 Hz to 40 Hz with the primary calibration method.
The principle of the comparison method consists to expose the reference microphone and the microbarometer to the same sound pressure. The acoustic pressure signal is measured simultaneously by the two sensors. The reference microphone and the microbarometer are linked to the pressure generator as close as possible with a coupling mechanical device maximising the frequency compare to the measurement frequency range. In that configuration the microbarometer sensitivity SMB can be expressed as
refSrefVMBV
=MBS (1)
where VMB represents the output voltage of the microbarometer (Device Under Test), Vref represents the output voltage of the reference microphone with its preamplifier and Sref is the sensitivity value of the standard microphone. The points of interest of this method are
- Traceability of measurement down to 2 Hz at the moment. - No adjusted reference voltage is required to control the delivery pressure by the generator. - The method is not sensitive to the generator drifts because they are measured by the reference
microphone. - The 4180 laboratory standard microphone has a very high stability and is very low sensitivity to
environment changes.
Figure 4 - The infrasound calibrator in the comparison method configuration.
The overall measurement uncertainty deals with The microphone and microbarometer voltage output measurement: the same voltmeters are used for the two voltage measurements in a true rms AC mode. The typical measurement uncertainty is frequency dependent. At 5 Hz the measurement uncertainty is 0.1 % of reading + 0.03 % of range, and 0.06 % of reading + 0.03 % at 10 Hz and above. The standard microphone sensitivity: The uncertainty measurement is available on the NPL calibration certificate. Its expanded value evaluates from 0.11 dB at 40 Hz to 0.44 dB at 2 Hz. The environmental coefficients: Laboratory standard microphones are considered to have dependence on temperature, and static pressure but without any significant dependence on humidity. Typical correction of 0.005 dB kPa-1 and 0.002 dB K-1 can be applied considering the deviation between the calibration conditions at NPL and the measuring conditions at CEA. At the end, the measurement uncertainty grows from 0.12 dB at 40 Hz to 0.46 dB at 2 Hz. It is mainly impacted by the standard microphone calibration for the reasons mentioned in the introduction.
Page 6 of 10 Inter-noise 2014
Page 6 of 10 Inter-noise 2014
3.2 SPEKTRA infrasound calibration system In 2009 SPEKTRA started the development of an infrasound calibration system with the following
goals: - Capable to calibrate device of any shape and size (within certain limits). - Frequency range 0.1 Hz to 31.5 Hz. - Sound pressure level up to 120 dB
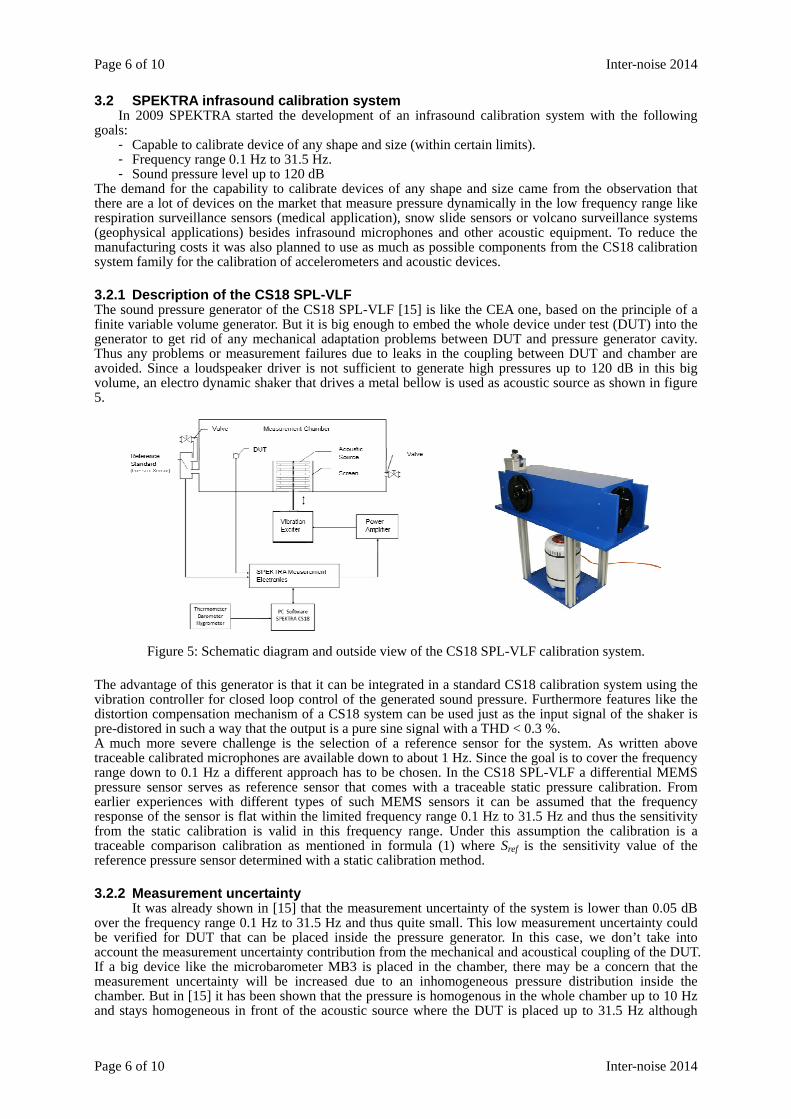
The demand for the capability to calibrate devices of any shape and size came from the observation that there are a lot of devices on the market that measure pressure dynamically in the low frequency range like respiration surveillance sensors (medical application), snow slide sensors or volcano surveillance systems (geophysical applications) besides infrasound microphones and other acoustic equipment. To reduce the manufacturing costs it was also planned to use as much as possible components from the CS18 calibration system family for the calibration of accelerometers and acoustic devices. 3.2.1 Description of the CS18 SPL-VLF The sound pressure generator of the CS18 SPL-VLF [15] is like the CEA one, based on the principle of a finite variable volume generator. But it is big enough to embed the whole device under test (DUT) into the generator to get rid of any mechanical adaptation problems between DUT and pressure generator cavity. Thus any problems or measurement failures due to leaks in the coupling between DUT and chamber are avoided. Since a loudspeaker driver is not sufficient to generate high pressures up to 120 dB in this big volume, an electro dynamic shaker that drives a metal bellow is used as acoustic source as shown in figure 5.
Figure 5: Schematic diagram and outside view of the CS18 SPL-VLF calibration system.
The advantage of this generator is that it can be integrated in a standard CS18 calibration system using the vibration controller for closed loop control of the generated sound pressure. Furthermore features like the distortion compensation mechanism of a CS18 system can be used just as the input signal of the shaker is pre-distored in such a way that the output is a pure sine signal with a THD < 0.3 %. A much more severe challenge is the selection of a reference sensor for the system. As written above traceable calibrated microphones are available down to about 1 Hz. Since the goal is to cover the frequency range down to 0.1 Hz a different approach has to be chosen. In the CS18 SPL-VLF a differential MEMS pressure sensor serves as reference sensor that comes with a traceable static pressure calibration. From earlier experiences with different types of such MEMS sensors it can be assumed that the frequency response of the sensor is flat within the limited frequency range 0.1 Hz to 31.5 Hz and thus the sensitivity from the static calibration is valid in this frequency range. Under this assumption the calibration is a traceable comparison calibration as mentioned in formula (1) where Sref is the sensitivity value of the reference pressure sensor determined with a static calibration method. 3.2.2 Measurement uncertainty
It was already shown in [15] that the measurement uncertainty of the system is lower than 0.05 dB over the frequency range 0.1 Hz to 31.5 Hz and thus quite small. This low measurement uncertainty could be verified for DUT that can be placed inside the pressure generator. In this case, we don’t take into account the measurement uncertainty contribution from the mechanical and acoustical coupling of the DUT. If a big device like the microbarometer MB3 is placed in the chamber, there may be a concern that the measurement uncertainty will be increased due to an inhomogeneous pressure distribution inside the chamber. But in [15] it has been shown that the pressure is homogenous in the whole chamber up to 10 Hz and stays homogeneous in front of the acoustic source where the DUT is placed up to 31.5 Hz although
Inter-noise 2014 Page 7 of 10
Inter-noise 2014 Page 7 of 10
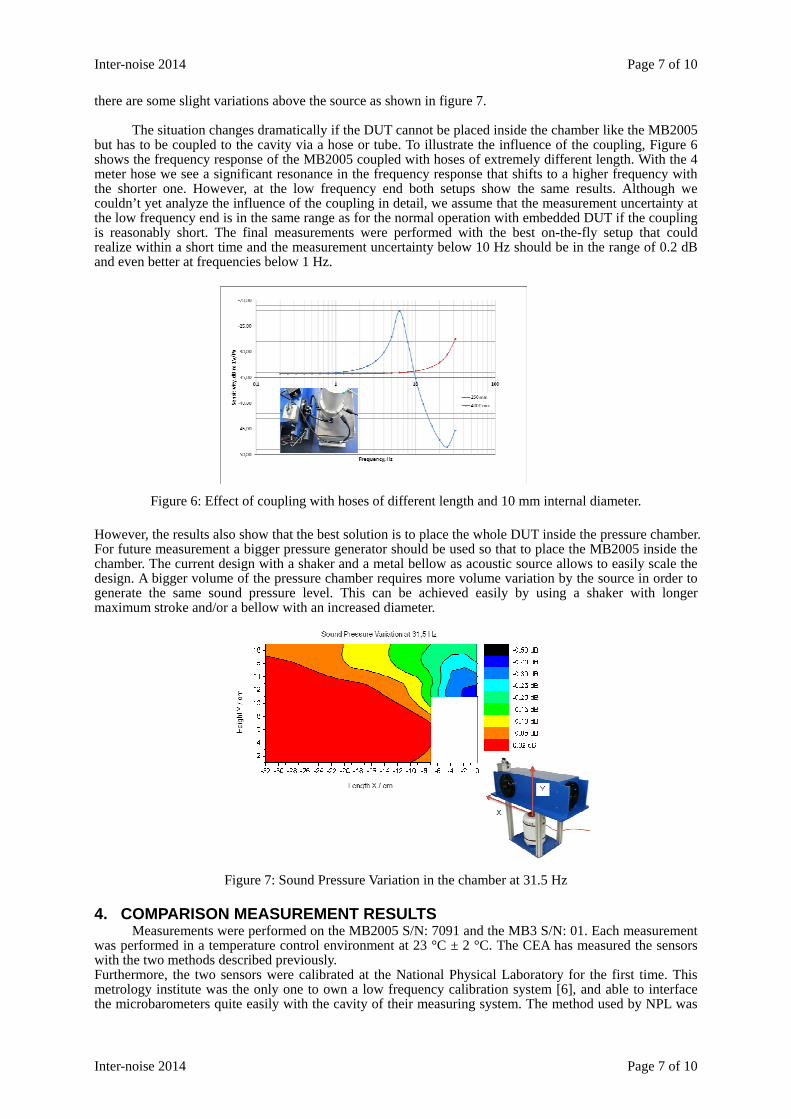
there are some slight variations above the source as shown in figure 7. The situation changes dramatically if the DUT cannot be placed inside the chamber like the MB2005
but has to be coupled to the cavity via a hose or tube. To illustrate the influence of the coupling, Figure 6 shows the frequency response of the MB2005 coupled with hoses of extremely different length. With the 4 meter hose we see a significant resonance in the frequency response that shifts to a higher frequency with the shorter one. However, at the low frequency end both setups show the same results. Although we couldn’t yet analyze the influence of the coupling in detail, we assume that the measurement uncertainty at the low frequency end is in the same range as for the normal operation with embedded DUT if the coupling is reasonably short. The final measurements were performed with the best on-the-fly setup that could realize within a short time and the measurement uncertainty below 10 Hz should be in the range of 0.2 dB and even better at frequencies below 1 Hz.
Figure 6: Effect of coupling with hoses of different length and 10 mm internal diameter. However, the results also show that the best solution is to place the whole DUT inside the pressure chamber. For future measurement a bigger pressure generator should be used so that to place the MB2005 inside the chamber. The current design with a shaker and a metal bellow as acoustic source allows to easily scale the design. A bigger volume of the pressure chamber requires more volume variation by the source in order to generate the same sound pressure level. This can be achieved easily by using a shaker with longer maximum stroke and/or a bellow with an increased diameter.
Figure 7: Sound Pressure Variation in the chamber at 31.5 Hz
4. COMPARISON MEASUREMENT RESULTS Measurements were performed on the MB2005 S/N: 7091 and the MB3 S/N: 01. Each measurement
was performed in a temperature control environment at 23 °C ± 2 °C. The CEA has measured the sensors with the two methods described previously. Furthermore, the two sensors were calibrated at the National Physical Laboratory for the first time. This metrology institute was the only one to own a low frequency calibration system [6], and able to interface the microbarometers quite easily with the cavity of their measuring system. The method used by NPL was
Page 8 of 10 Inter-noise 2014
Page 8 of 10 Inter-noise 2014
the comparison method with their laboratory standard microphone. The sound pressure was carried out by the close cavity and the driven piston of their laser pistonphone calibration bench.
4.1 MB2005 measurement description Because of the external size of the MB2005, the sensor was not able to be put inside the SC18 SPL-VLF. Consequently, the measurement was carried out with the MB2005 located outside, as close as possible. The connection between the sensor and the pressure chambers was realized with a 250 mm length and a 10 mm internal diameter flexible tube. At the NPL, the MB2005 internal chamber was coupled to the cavity using a short adaptor. Both Sensor – Pressure chamber coupling configurations at CEA and NPL are similar.
(a)
(b)
(c)
Figure 8 – MB2005 connected to the CEA calibrator (a), the SPEKTRA CS18 SPL-VLF (b) and the NPL laser pistonphone (c).
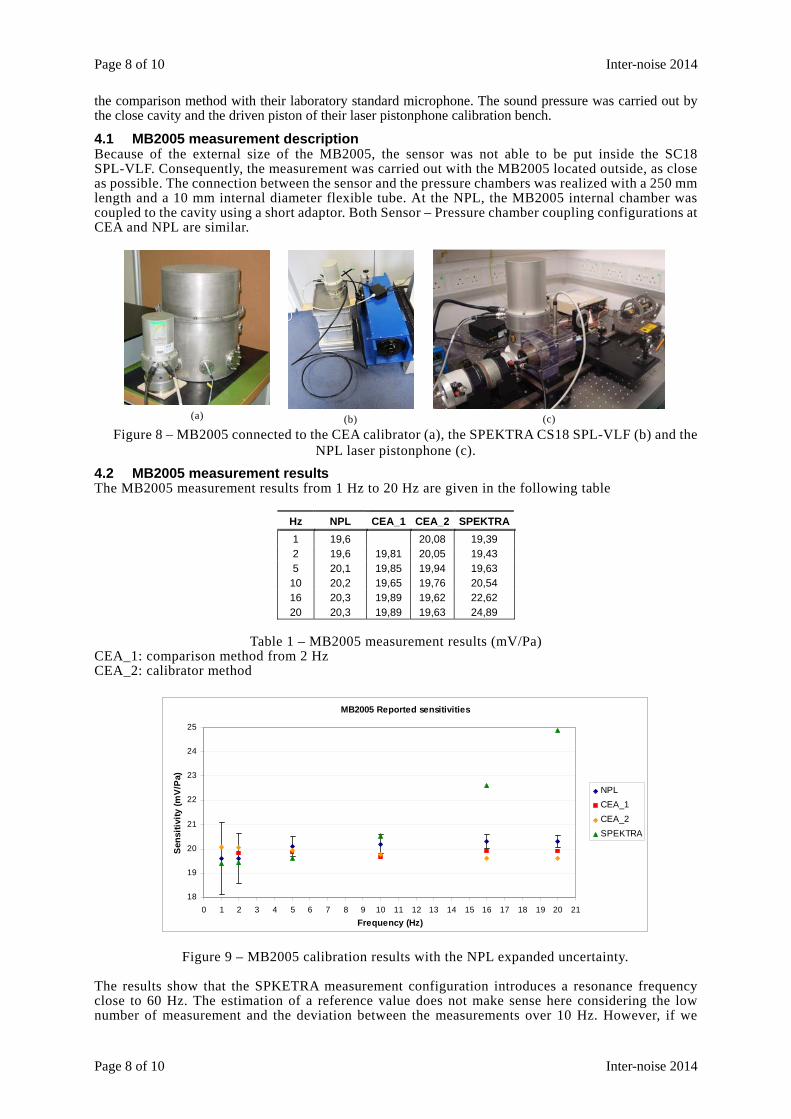
4.2 MB2005 measurement results The MB2005 measurement results from 1 Hz to 20 Hz are given in the following table
Hz NPL CEA_1 CEA_2 SPEKTRA1 19,6 20,08 19,39 2 19,6 19,81 20,05 19,43 5 20,1 19,85 19,94 19,63
10 20,2 19,65 19,76 20,54 16 20,3 19,89 19,62 22,62 20 20,3 19,89 19,63 24,89
Table 1 – MB2005 measurement results (mV/Pa)
CEA_1: comparison method from 2 Hz CEA_2: calibrator method
MB2005 Reported sensitivities
18
19
20
21
22
23
24
25
0 1 2 3 4 5 6 7 8 9 10 11 12 13 14 15 16 17 18 19 20 21Frequency (Hz)
Sens
itivi
ty (m
V/Pa
)
NPLCEA_1CEA_2SPEKTRA
Figure 9 – MB2005 calibration results with the NPL expanded uncertainty. The results show that the SPKETRA measurement configuration introduces a resonance frequency close to 60 Hz. The estimation of a reference value does not make sense here considering the low number of measurement and the deviation between the measurements over 10 Hz. However, if we
Inter-noise 2014 Page 9 of 10
Inter-noise 2014 Page 9 of 10
consider the 5 Hz measurements, the deviation between the extreme is 0.47 mV/Pa or 2.35 % (0.2 dB) of the mean value. It is consistent with the uncertainty value of 0.42 mV/Pa estimated at the NPL, and those of SPEKTRA and the CEA.
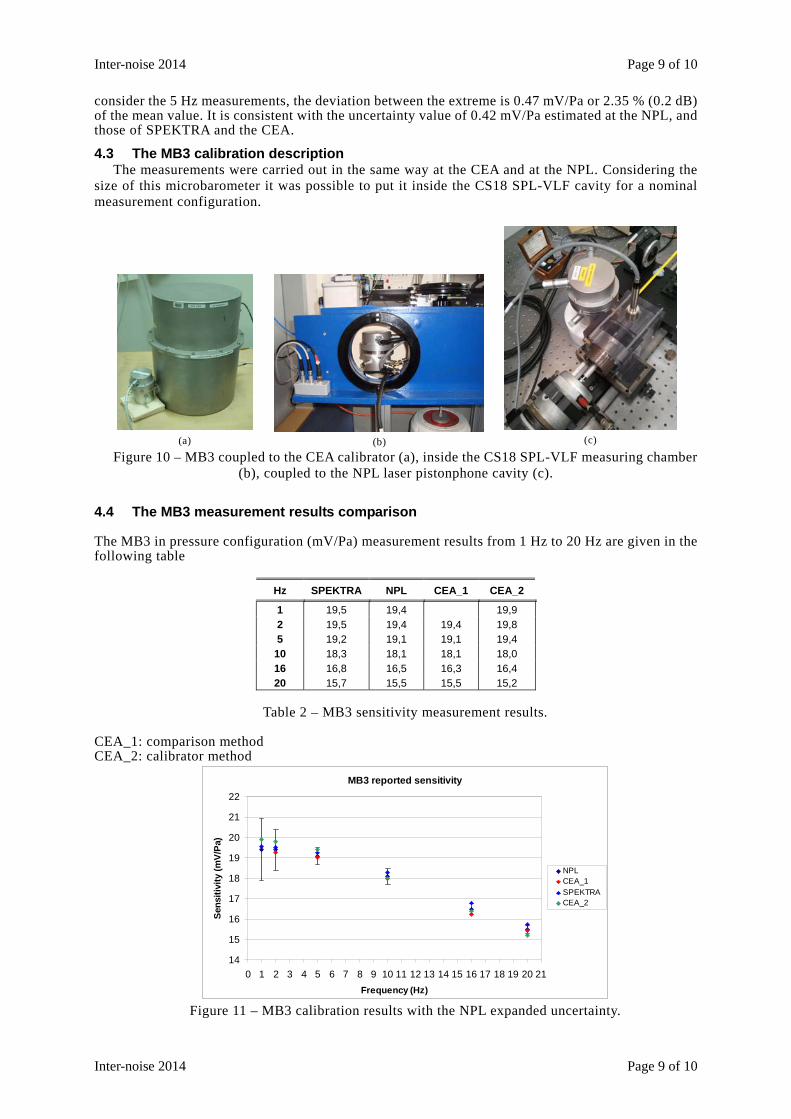
4.3 The MB3 calibration description The measurements were carried out in the same way at the CEA and at the NPL. Considering the
size of this microbarometer it was possible to put it inside the CS18 SPL-VLF cavity for a nominal measurement configuration.
(a)
(b)
(c)
Figure 10 – MB3 coupled to the CEA calibrator (a), inside the CS18 SPL-VLF measuring chamber (b), coupled to the NPL laser pistonphone cavity (c).
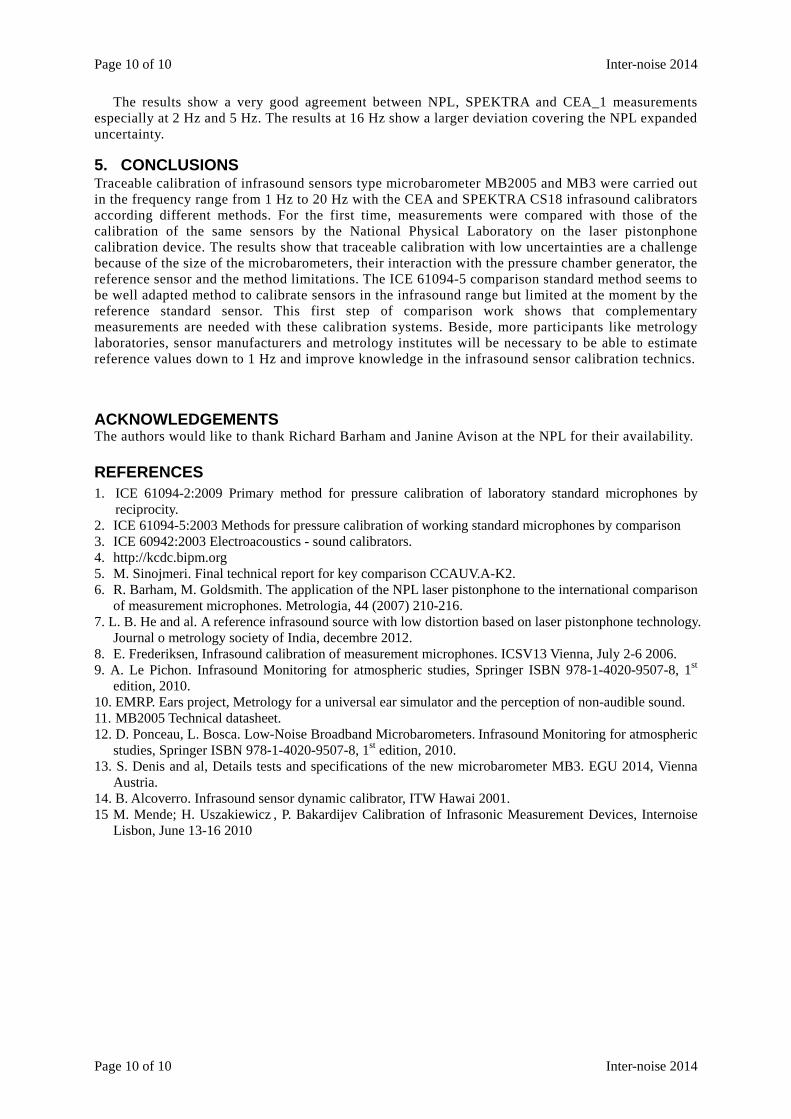
4.4 The MB3 measurement results comparison The MB3 in pressure configuration (mV/Pa) measurement results from 1 Hz to 20 Hz are given in the following table
Hz SPEKTRA NPL CEA_1 CEA_2
1 19,5 19,4 19,9 2 19,5 19,4 19,4 19,8 5 19,2 19,1 19,1 19,4
10 18,3 18,1 18,1 18,0 16 16,8 16,5 16,3 16,4 20 15,7 15,5 15,5 15,2
Table 2 – MB3 sensitivity measurement results.
CEA_1: comparison method CEA_2: calibrator method
MB3 reported sensitivity
14
15
16
17
18
19
20
21
22
0 1 2 3 4 5 6 7 8 9 10 11 12 13 14 15 16 17 18 19 20 21Frequency (Hz)
Sens
itivi
ty (m
V/Pa
)
NPLCEA_1SPEKTRACEA_2
Figure 11 – MB3 calibration results with the NPL expanded uncertainty.
Page 10 of 10 Inter-noise 2014
Page 10 of 10 Inter-noise 2014
The results show a very good agreement between NPL, SPEKTRA and CEA_1 measurements especially at 2 Hz and 5 Hz. The results at 16 Hz show a larger deviation covering the NPL expanded uncertainty.
5. CONCLUSIONS Traceable calibration of infrasound sensors type microbarometer MB2005 and MB3 were carried out in the frequency range from 1 Hz to 20 Hz with the CEA and SPEKTRA CS18 infrasound calibrators according different methods. For the first time, measurements were compared with those of the calibration of the same sensors by the National Physical Laboratory on the laser pistonphone calibration device. The results show that traceable calibration with low uncertainties are a challenge because of the size of the microbarometers, their interaction with the pressure chamber generator, the reference sensor and the method limitations. The ICE 61094-5 comparison standard method seems to be well adapted method to calibrate sensors in the infrasound range but limited at the moment by the reference standard sensor. This first step of comparison work shows that complementary measurements are needed with these calibration systems. Beside, more participants like metrology laboratories, sensor manufacturers and metrology institutes will be necessary to be able to estimate reference values down to 1 Hz and improve knowledge in the infrasound sensor calibration technics.
ACKNOWLEDGEMENTS The authors would like to thank Richard Barham and Janine Avison at the NPL for their availability.
REFERENCES 1. ICE 61094-2:2009 Primary method for pressure calibration of laboratory standard microphones by
reciprocity. 2. ICE 61094-5:2003 Methods for pressure calibration of working standard microphones by comparison 3. ICE 60942:2003 Electroacoustics - sound calibrators. 4. http://kcdc.bipm.org 5. M. Sinojmeri. Final technical report for key comparison CCAUV.A-K2. 6. R. Barham, M. Goldsmith. The application of the NPL laser pistonphone to the international comparison
of measurement microphones. Metrologia, 44 (2007) 210-216. 7. L. B. He and al. A reference infrasound source with low distortion based on laser pistonphone technology.
Journal o metrology society of India, decembre 2012. 8. E. Frederiksen, Infrasound calibration of measurement microphones. ICSV13 Vienna, July 2-6 2006. 9. A. Le Pichon. Infrasound Monitoring for atmospheric studies, Springer ISBN 978-1-4020-9507-8, 1st
edition, 2010. 10. EMRP. Ears project, Metrology for a universal ear simulator and the perception of non-audible sound. 11. MB2005 Technical datasheet. 12. D. Ponceau, L. Bosca. Low-Noise Broadband Microbarometers. Infrasound Monitoring for atmospheric
studies, Springer ISBN 978-1-4020-9507-8, 1st edition, 2010. 13. S. Denis and al, Details tests and specifications of the new microbarometer MB3. EGU 2014, Vienna
Austria. 14. B. Alcoverro. Infrasound sensor dynamic calibrator, ITW Hawai 2001. 15 M. Mende; H. Uszakiewicz , P. Bakardijev Calibration of Infrasonic Measurement Devices, Internoise
Lisbon, June 13-16 2010
Recommended