Proceedings of the International Conference on Tourism, Hospitality and Marketing
(IC16Mauritius Conference) ISBN - 978-1-943579-19-8
Ebene-Mauritius, 21-23 January, 2016. Paper ID: M624
1 www.globalbizresearch.org
The Banking Sector in Mauritius:
An Assessment of Service Quality from Customer Perspective
Jugurnath. B,
Department of Accounting and Finance,
Faculty of Law and Management,
University of Mauritius, Mauritius.
E-mail: [email protected]
Nowbutsing. J,
University of Mauritius, Mauritius.
Ramen. M,
Department of Accounting and Finance,
Faculty of Law and Management,
University of Mauritius, Mauritius.
__________________________________________________________________________________
Abstract In this paper, we study whether Mauritian banks are using service quality as a weapon to
compete on the market to satisfy customers. The goal set is to identify the interrelationships
between service quality, customer satisfaction and customer loyalty in the retail banking
sector in Mauritius. The study also aims to find out the most important attributes of service
quality in retail banks, which can be used to evaluate the characteristics of banking service
quality as perceived by customers. The study consists of a sample of 147 respondents. The
results indicate that the perceptions of the Mauritian banking customers far exceed their
expectations regarding the five dimensions of SERVQUAL model, which is a good indication.
At the same time, the findings show that responsiveness, assurance and empathy are the
important dimensions considered by the customers while assessing the quality of services
rendered by the Mauritian banks. The major contribution of the study is that it extends the
usage of SERVQUAL model. This study, fully focused on service quality issues, will help to
understand service dimensions issues for the banking sector in Mauritius.
__________________________________________________________________________
Key Words: SERVQUAL, Service Quality, Customer Satisfaction, Banking Sector in
Mauritius
Proceedings of the International Conference on Tourism, Hospitality and Marketing
(IC16Mauritius Conference) ISBN - 978-1-943579-19-8
Ebene-Mauritius, 21-23 January, 2016. Paper ID: M624
2 www.globalbizresearch.org
1. Introduction
The Banking sector has always been dynamic and resilient with high levels of
competition. Banks use various strategies to protect their existing portfolio of customers and
build upon new ones so as to ensure business growth. Quality and marketing tools are the
essential factors that can contribute to the bank’s inner corporate objectives. In Mauritius,
there has been a continual propagation of banks through time, where only a few commercial
banks existed prior to its independence. At present, there are 21 banks, out of which 7 are
local banks, 8 are foreign-owned subsidiaries, 1 is a joint-venture and 5 are branches of
foreign banks. These banks are allowed to conduct banking transactions both onshore and
offshore. The banks in Mauritius are licensed and regulated by the Bank of Mauritius (BOM),
mandated by law as Central Bank to administer a strong regulatory framework. In order to
create a harmonization in the Mauritian banking industry, BOM has issued guidelines under
the name of Bank of Mauritius Act (2004), Banking Act (2004) and a series of rules that
oversee the daily operations of banks. The banking sector has played a key function in the
development of the Mauritian economy as they are expected to play in any other modern free-
orientated economy. This industry employs more than 5,000 professionals, contributing to
around 6% of GDP. For this study, only five of the most popular banks have been selected for
this paper, namely the state bank of Mauritius (SBM) ltd, the Mauritius Commercial Bank
(MCB) LTD, Barclays Bank Mauritius Limited, hongkong&shanghai bank cooperation
(HSBC) ltd and bramer banking corporation ltd. Service Quality has become a substantial
component of the banking industry – at least as a competitive tool. It becomes useful to
measure the effectiveness of service quality correctly. Hence, this study assesses the service
quality offered by commercial banks in Mauritius - from a customer’s perspective with
emphasis on what customers expect on the level of quality presently offered and from their
past experience. This study also examines the relationship between demographic factors of
bank customers and service quality using the SERVQUAL model.
2. SERVQUAL
Derived from two words namely service and quality, SERVQUAL is among the most
popular instruments used to measure service quality from a customer’s perspective.
SERVQUAL is a multi-scale instrument developed by Parasuraman, Berry and Zeithmal in
1985 and refined in 1991. Also known as the gap model, SERVQUAL is said to be one of the
best ways to measure service quality by many researchers. According to Brown et al (1993),
this service evaluation method has been proven consistent and reliable. The model is made up
of five dimensions, namely:
Tangibility – relates to the physical aspect related to the service. For instance a
bank’s physical appearance and the quality of the pamphlets it provides.
Proceedings of the International Conference on Tourism, Hospitality and Marketing
(IC16Mauritius Conference) ISBN - 978-1-943579-19-8
Ebene-Mauritius, 21-23 January, 2016. Paper ID: M624
3 www.globalbizresearch.org
Reliability – refers to the potential of the providing efficiently and professionally the
promised service.
Responsiveness – concerns with the enthusiasm to assist customers and provide
prompt service.
Assurance – relate to the knowledge, competency, courtesy and ability of the
personnel delivering the service as well as the extent to which the system being used is
secured and credible
Empathy – refers to the extent to which the service provider cares for its customers
and its ability to provide for personalized service
Based on the above, it is crucial that banks assess the 5 dimensions in order to identify the
gaps in service quality by looking at the difference between customer expectations and
perceptions. Through these gaps bankers can recognize their shortfalls and consequently
address them in order to increase their competitive edge on the market.
3. Theoretical Framework
3.1 Service and Service Quality
A review of the existing literatures shows that there is quite a wide disparity in definitions
related to service. Proomprow (2003) came up with a very interesting play of words for
SERVICE which goes as S for Satisfaction, E for Expectation, R for Readiness , V for
Value, I for Interest, C for Courtesy and E for Efficiency. Many researches are of the view
that services cannot be counted nor tested prior to delivery thus businesses “find it difficult to
understand how customers perceive their services and evaluate them” (Parasuraman et al,
1985). The study pursue with the quality of service as a company’s business health is
reflected by the quality of service it provides. As underlined by (Parasuraman et al, 1992, p5)
“if the service quality is mediocre, the company is mediocre”. However, there is no single
definition for service quality. It varies from people to people and from situation to situation.
Service quality is a term used to express achievement obtained in a service. Parasuraman et al
(1985) viewed service quality as the degree and direction of discrepancy between customers’
service perception and expectations. They argued that service quality involves not only the
outcome but also the delivery process. Moreover, in a one of his researches conducted in
1988, these authors maintained that service quality is a function of the difference between
service expected and customers, perceptions of the actual service delivered. On his part,
Zeithaml (1987) described service quality as the consumer's judgment about an entity's
overall excellence or superiority. It is a form of attitude, and results from a comparison of
expectations to perceptions of performance received. Lewis (1989) defined service quality as
meeting customers’ needs, requirements and how well the service delivered meets customers’
expectations. Also, Lewis and Mitchell (1990) pointed out that service quality is linked to the
Proceedings of the International Conference on Tourism, Hospitality and Marketing
(IC16Mauritius Conference) ISBN - 978-1-943579-19-8
Ebene-Mauritius, 21-23 January, 2016. Paper ID: M624
4 www.globalbizresearch.org
concepts of perceptions and expectations and that it is a requisite for the durability and
development of any company. Through these elements, it can easily be recognized that
service quality is one of the key drivers for a business to grow. Banks’policy makers have to
understand that for an eventual increase in profits they will have to secure a better position on
the market and to ensure customer loyalty, they need to use service quality as a competitive
approach.
3.2 Customer Satisfaction
Customer satisfaction relates to the customer’s feeling of fulfilment or disappointment
resulting from comparing a product’s perceived performance in relation to his to her
expectations (Kotler, 2000).From this definition, it is evident that to be able to satisfy
customer needs, customer expectations have to be known. Service providers, in particular
banks, have to provide the required products and services to match with customer needs. In
today’s competitive market if banks fail to plan their marketing strategy with customers in the
matrix, it is simply an eventual plan for their own failure. Customers are therefore among the
main parameters for successful business. As mentioned by Mittal & Kamakura (2001)
customer satisfaction is a key factor in formation of customer’s desires for future purchase.
According to Zeithaml et al. (1990), customer satisfaction is the result of a customers’
perception of the service quality relative to the expectation. Moreover, Looy et al. (2003)
defines customer satisfaction as the customer’s feeling regarding the gap between his or her
expectations towards a company, product or service and the perceived performance of the
company, product or service. Later on, Zeithaml et al (2009) stressed on customer
expectations as beliefs about a service that serves as standards or reference points to which
the performance of the service is judged. It was further affirmed by the same researcher that
knowing what the customer expects is the first and possibly most critical factor in delivering
quality service. ForJohnson et al , (1996) customer satisfaction can be interpreted as an
overall evaluation of service quality attributes or service attribute performance.
In order to combine the important elements pertaining to customer satisfaction, it seemed
necessary to drawn up a chain of cyclic reactions.
Proceedings of the International Conference on Tourism, Hospitality and Marketing
(IC16Mauritius Conference) ISBN - 978-1-943579-19-8
Ebene-Mauritius, 21-23 January, 2016. Paper ID: M624
5 www.globalbizresearch.org
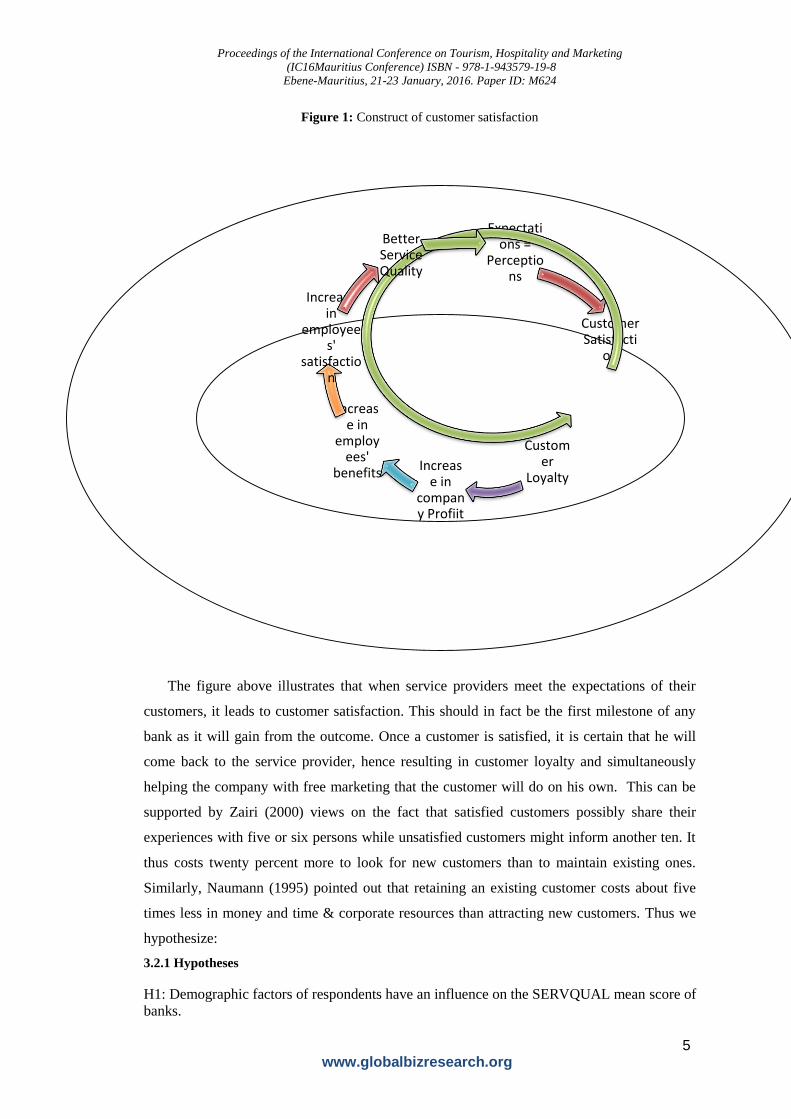
Figure 1: Construct of customer satisfaction
The figure above illustrates that when service providers meet the expectations of their
customers, it leads to customer satisfaction. This should in fact be the first milestone of any
bank as it will gain from the outcome. Once a customer is satisfied, it is certain that he will
come back to the service provider, hence resulting in customer loyalty and simultaneously
helping the company with free marketing that the customer will do on his own. This can be
supported by Zairi (2000) views on the fact that satisfied customers possibly share their
experiences with five or six persons while unsatisfied customers might inform another ten. It
thus costs twenty percent more to look for new customers than to maintain existing ones.
Similarly, Naumann (1995) pointed out that retaining an existing customer costs about five
times less in money and time & corporate resources than attracting new customers. Thus we
hypothesize:
3.2.1 Hypotheses
H1: Demographic factors of respondents have an influence on the SERVQUAL mean score of
banks.
Expectations =
Perceptions
Customer Satisfacti
on
Customer
LoyaltyIncreas
e in company Profiit
Increase in
employees'
benefits
Increase in
employees'
satisfaction
Better Service Quality
Proceedings of the International Conference on Tourism, Hospitality and Marketing
(IC16Mauritius Conference) ISBN - 978-1-943579-19-8
Ebene-Mauritius, 21-23 January, 2016. Paper ID: M624
6 www.globalbizresearch.org
3.3 Customer Perception and Expectation of Service Quality
The main objective of delivering high service quality is to satisfy customers and as seen
in Figure1 the ideal point resulting in customer satisfaction is where customer expectations
equal to customer perceptions. The major challenge of service providers is the constant and
ever changing expectations of their customers.According to Zeithamlet al (2009), customer
expectations are beliefs about a service that serves as standards or reference points to which
the performance of the service is judged. Knowing what the customer expects is the first and
possibly most critical factor in delivering quality service. Getting what customers want
wrong, can result in losing a customer to another company who meets the target, expending
money and resources in wrong places and not surviving in a fiercely competitive market.
Together with customer expectations come customer perceptions. It is another focal point of
service quality on which service providers have to ponder on. Customer perception refers to
the way in which customers feel about the services being provided. It is actually this element
that shapes customers’ expectations from the company. Parasuraman et al (1985) believed
that perception and expectation are strongly relative concepts. Berry et al.(1988) and
Parasuramanet al. (1985) viewed quality as the customers’ perception of service excellence.
This implies that customers shape their perception of the quality of service based on their past
experience, word of mouth and even their closed ones experience. Moreover, Schneider and
White (2004) stated that perceive service quality and service qualities are two concepts that
deal together in the concept of marketing. Zeithaml et al., (2006) considered perceived service
quality as a scale for firm to measure how much they were successful to cover their customer
purpose. In the publication of Parasuraman et al., (1985) service quality was conceptualized
as a gap between consumers’ expectations and perceptions.Thus service providers that are not
able to meet their customer’s expectation will most probably experience a decline in customer
retention and unfavourable corporate image. Thus we hypothesize:
3.3.1 Hypotheses
H2: There is a significant difference between customer perceptions and expectations
3.4 Impact of Service Quality and Customer Satisfaction on Banks
As documented by Wang et al., (2003) and cited by Ahmad (2010) quality service and
products to the customer, is essential for success and survival in today's global and highly
competitive banking environment. Bloemer et al. (1998) wrote that bank customer satisfaction
can be regarded as a bank fully meeting its customers’ expectations. To support this
statement, Jamal et al (2002) defined bank customer satisfaction as a feeling or attitude
formed by bank customers after service, which directly links to the various purchasing
behaviours. Moreover, providing a high level of service to customers is the marketing weapon
that banks can use to differentiate themselves on the market. It is a known fact that nearly all
Proceedings of the International Conference on Tourism, Hospitality and Marketing
(IC16Mauritius Conference) ISBN - 978-1-943579-19-8
Ebene-Mauritius, 21-23 January, 2016. Paper ID: M624
7 www.globalbizresearch.org
banks provide the same products to customers and that it takes only some days for new
products to be copied. However the only additional effort on which they can clearly
demarcate themselves is in providing an excellent service quality which would be impossible
for competitors to copy. According to Roth and Van Der Velde (1991) there is a positive
relationship between service quality level and financial performance implying that an
enhancement of the service quality provided by organisations will result in an improved the
financial status of the company. Bennet (1992) supported this by adding that the outcome of
developed service quality is positive financial performance. The quality of the service being
offered to a customer is actually a defining moment for the banks. As documented by Bitner
et al.(1990) delivering high service quality results in customer satisfaction and loyalty, greater
willingness to recommend to someone else, reduction in customer complaints, and improved
customer retention rates. Thus we hypothesize:
3.4.1 Hypotheses
H3: There is a relationship between service quality and customer satisfaction in the Mauritian
banking industry.
It can be concluded that in this era of high competition, it is a must for banks to provide a
high quality of service to satisfy their customers. Hence, for banks to know where they stand
on the market, they have to constantly measure the quality of service that they offer. But due
to the intangibility aspect of service, it is quite difficult to measure the quality of service being
delivered to customers. Thus, a number of instruments have been devised by prior researchers
and for the purpose of this study SERVQUAL will be used, one of the most famous and well
appreciated models in the service industry. In this review, the importance of this model has
been elaborated.
4. Methodology
For the purpose of this study, the quantitative approach has been used through self-
administered questionnaire. The questionnaire comprises of three sections. Section A and B
each comprises of a set of 22 questions. These questions are used to measure the five different
SERVQUAL dimensions of service quality namely five questions to measure Reliability and
Empathy and Four questions to measure Tangibility, Responsiveness and Assurance.
Secondary data has been extracted from available research papers, dissertations, journal, and
articles from Ebsco, Emerald, magazines and Internet. In order to determine the sample size, a
number of similar past studies done has been taken into consideration; whereby it has
concluded that a sample size of 200 is suffice for the purpose of this study. Moreover, the
banks considered were mainly the 5 banks whose services are perceived to be commonly
utilised by Mauritians. They are namely MCB SBM, HSBC, BBC and Barclays Bank.
Proceedings of the International Conference on Tourism, Hospitality and Marketing
(IC16Mauritius Conference) ISBN - 978-1-943579-19-8
Ebene-Mauritius, 21-23 January, 2016. Paper ID: M624
8 www.globalbizresearch.org
5. Results and Discussion The main analysis is concerned with the testing of hypotheses set as well as with the
identification of the gap between customer expectation and perception on the level of service
delivered by banks. SPSS 16.0 has been used to conduct three statistical analyses namely
reliability analysis, descriptive analysis and statistical inference analysis to provide a
complete picture of this study.
Before carrying any data analysis, the reliability of the data has been checked using
Cronbach Alpha and the reliability coefficient has turned out to be at least 0.7 for each of the
five service quality dimensions as shown below:
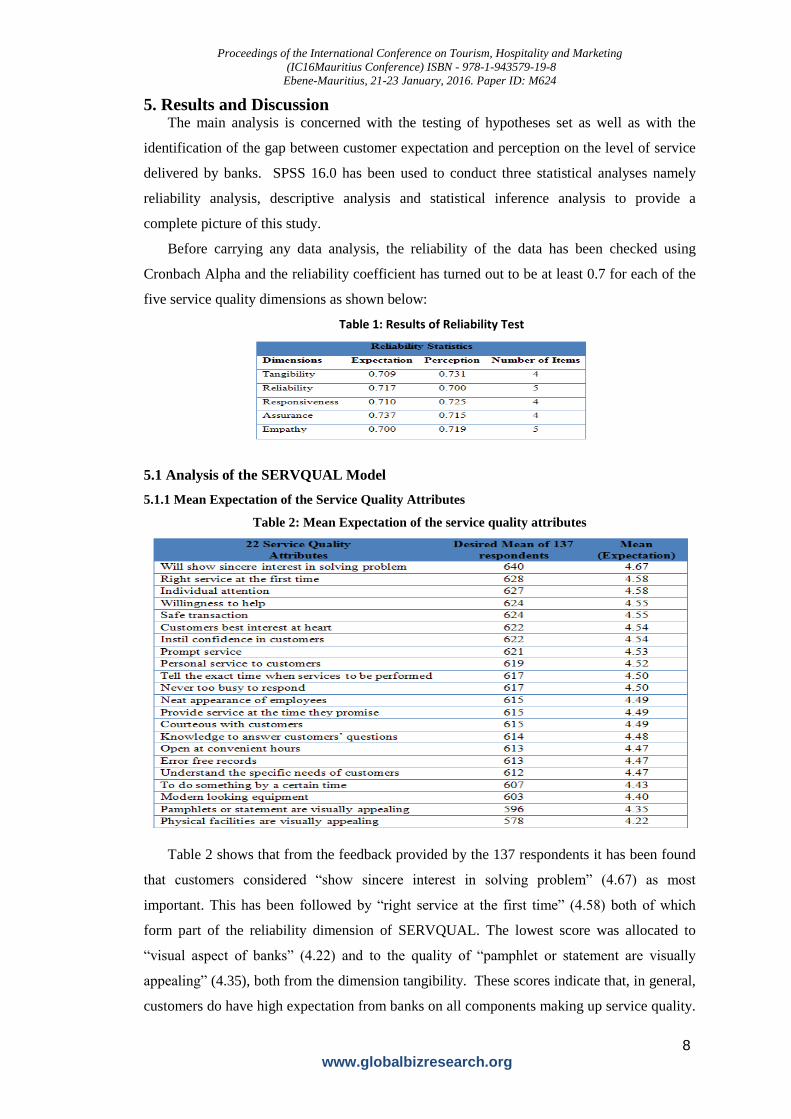
Table 1: Results of Reliability Test
5.1 Analysis of the SERVQUAL Model
5.1.1 Mean Expectation of the Service Quality Attributes
Table 2: Mean Expectation of the service quality attributes
Table 2 shows that from the feedback provided by the 137 respondents it has been found
that customers considered “show sincere interest in solving problem” (4.67) as most
important. This has been followed by “right service at the first time” (4.58) both of which
form part of the reliability dimension of SERVQUAL. The lowest score was allocated to
“visual aspect of banks” (4.22) and to the quality of “pamphlet or statement are visually
appealing” (4.35), both from the dimension tangibility. These scores indicate that, in general,
customers do have high expectation from banks on all components making up service quality.
Proceedings of the International Conference on Tourism, Hospitality and Marketing
(IC16Mauritius Conference) ISBN - 978-1-943579-19-8
Ebene-Mauritius, 21-23 January, 2016. Paper ID: M624
9 www.globalbizresearch.org
Thus, their expectations, though vary from attribute to attribute, are near to the maximum
score of 5 on the 5-likert scale used. In fact these findings are consistent with Parasuraman et
al (1988, 1990) findings. Berry and Parasuraman (1991) pointed out that the tangibility
dimension is of least importance to customers as compared to other attributes. However,
Gronroos (2007) believed that the tangibility aspects of banks help to ensure that customers
get a satisfactory quality of service. It is also worth noting that the mean value of all of the 22
attributes is above 4 over a maximum of 5 points, implying that even if an attribute is
perceived as less important customers do have a high level of expectation on same.
PERFORMANCE ALONG SERVQUAL DIMENSIONS
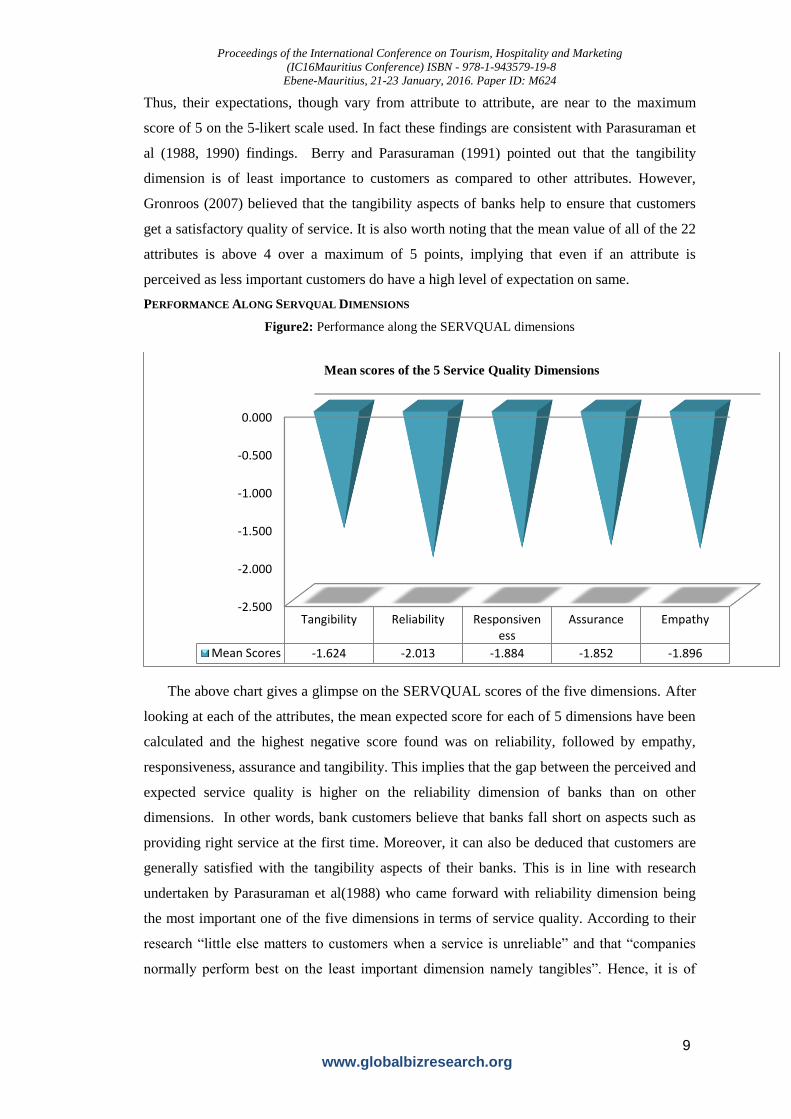
Figure2: Performance along the SERVQUAL dimensions
The above chart gives a glimpse on the SERVQUAL scores of the five dimensions. After
looking at each of the attributes, the mean expected score for each of 5 dimensions have been
calculated and the highest negative score found was on reliability, followed by empathy,
responsiveness, assurance and tangibility. This implies that the gap between the perceived and
expected service quality is higher on the reliability dimension of banks than on other
dimensions. In other words, bank customers believe that banks fall short on aspects such as
providing right service at the first time. Moreover, it can also be deduced that customers are
generally satisfied with the tangibility aspects of their banks. This is in line with research
undertaken by Parasuraman et al(1988) who came forward with reliability dimension being
the most important one of the five dimensions in terms of service quality. According to their
research “little else matters to customers when a service is unreliable” and that “companies
normally perform best on the least important dimension namely tangibles”. Hence, it is of
-2.500
-2.000
-1.500
-1.000
-0.500
0.000
Tangibility Reliability Responsiveness
Assurance Empathy
Mean Scores -1.624 -2.013 -1.884 -1.852 -1.896
Mean scores of the 5 Service Quality Dimensions
Proceedings of the International Conference on Tourism, Hospitality and Marketing
(IC16Mauritius Conference) ISBN - 978-1-943579-19-8
Ebene-Mauritius, 21-23 January, 2016. Paper ID: M624
10 www.globalbizresearch.org
high importance that bank management strives hard to improve all the dimensions of service
quality in order to increase customer satisfaction
COMPARING MEAN EXPECTATION AND PERCEPTION OF THE SERVICE QUALITY DIMENSIONS
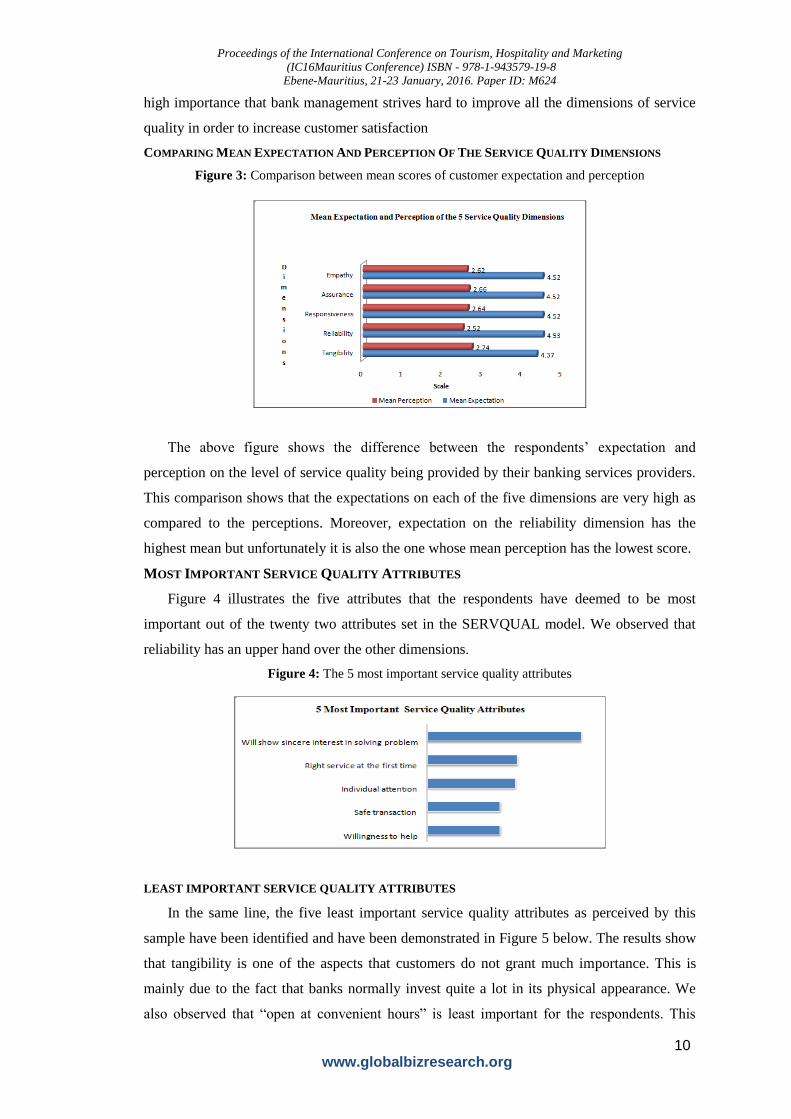
Figure 3: Comparison between mean scores of customer expectation and perception
The above figure shows the difference between the respondents’ expectation and
perception on the level of service quality being provided by their banking services providers.
This comparison shows that the expectations on each of the five dimensions are very high as
compared to the perceptions. Moreover, expectation on the reliability dimension has the
highest mean but unfortunately it is also the one whose mean perception has the lowest score.
MOST IMPORTANT SERVICE QUALITY ATTRIBUTES
Figure 4 illustrates the five attributes that the respondents have deemed to be most
important out of the twenty two attributes set in the SERVQUAL model. We observed that
reliability has an upper hand over the other dimensions.
Figure 4: The 5 most important service quality attributes
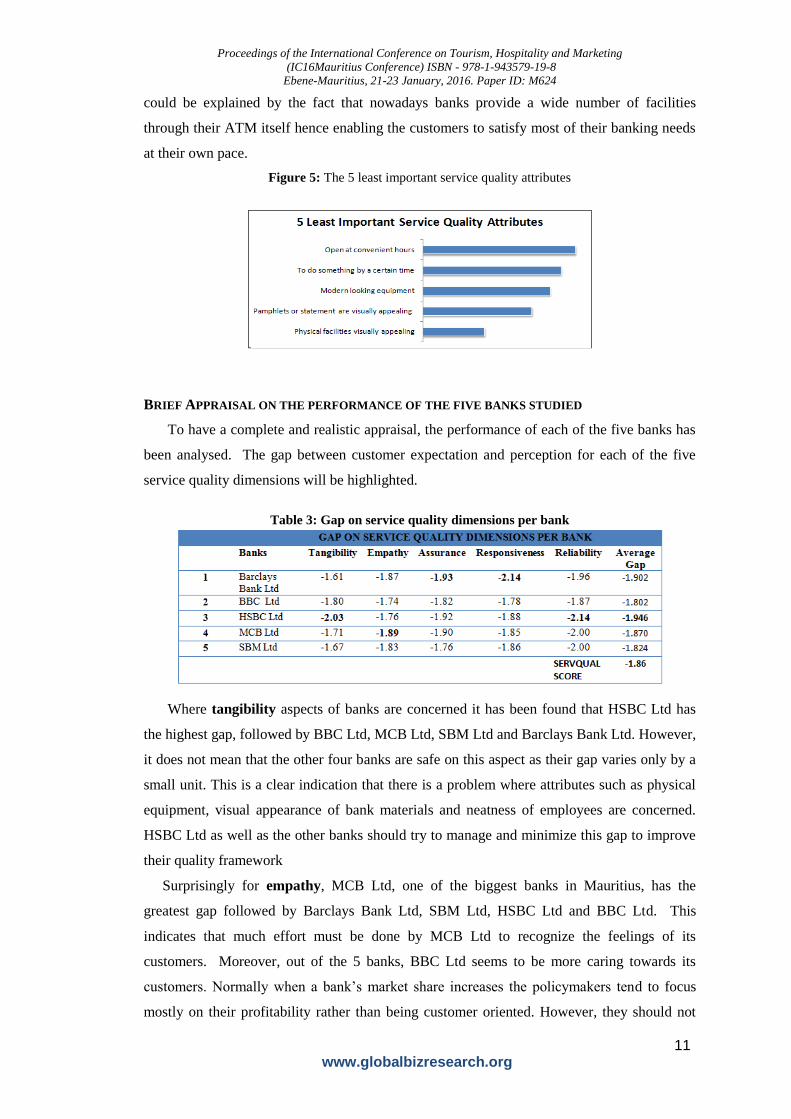
LEAST IMPORTANT SERVICE QUALITY ATTRIBUTES
In the same line, the five least important service quality attributes as perceived by this
sample have been identified and have been demonstrated in Figure 5 below. The results show
that tangibility is one of the aspects that customers do not grant much importance. This is
mainly due to the fact that banks normally invest quite a lot in its physical appearance. We
also observed that “open at convenient hours” is least important for the respondents. This
Proceedings of the International Conference on Tourism, Hospitality and Marketing
(IC16Mauritius Conference) ISBN - 978-1-943579-19-8
Ebene-Mauritius, 21-23 January, 2016. Paper ID: M624
11 www.globalbizresearch.org
could be explained by the fact that nowadays banks provide a wide number of facilities
through their ATM itself hence enabling the customers to satisfy most of their banking needs
at their own pace.
Figure 5: The 5 least important service quality attributes
BRIEF APPRAISAL ON THE PERFORMANCE OF THE FIVE BANKS STUDIED
To have a complete and realistic appraisal, the performance of each of the five banks has
been analysed. The gap between customer expectation and perception for each of the five
service quality dimensions will be highlighted.
Table 3: Gap on service quality dimensions per bank
Where tangibility aspects of banks are concerned it has been found that HSBC Ltd has
the highest gap, followed by BBC Ltd, MCB Ltd, SBM Ltd and Barclays Bank Ltd. However,
it does not mean that the other four banks are safe on this aspect as their gap varies only by a
small unit. This is a clear indication that there is a problem where attributes such as physical
equipment, visual appearance of bank materials and neatness of employees are concerned.
HSBC Ltd as well as the other banks should try to manage and minimize this gap to improve
their quality framework
Surprisingly for empathy, MCB Ltd, one of the biggest banks in Mauritius, has the
greatest gap followed by Barclays Bank Ltd, SBM Ltd, HSBC Ltd and BBC Ltd. This
indicates that much effort must be done by MCB Ltd to recognize the feelings of its
customers. Moreover, out of the 5 banks, BBC Ltd seems to be more caring towards its
customers. Normally when a bank’s market share increases the policymakers tend to focus
mostly on their profitability rather than being customer oriented. However, they should not
Proceedings of the International Conference on Tourism, Hospitality and Marketing
(IC16Mauritius Conference) ISBN - 978-1-943579-19-8
Ebene-Mauritius, 21-23 January, 2016. Paper ID: M624
12 www.globalbizresearch.org
forget that the business will not sustain without customers. Hence, necessary measures must
be taken by the banks, MCB Ltd in particular, to prove that they have the customers’ interest
at heart.
Barclays Bank Ltd has the greatest gap concerning the approachability and ease of contact,
followed by HSBC Ltd, MCB Ltd, BBC Ltd and SBM Ltd. The reason for it having the
greatest gap may be due to its employees not being courteous with customers and employees
having inadequate knowledge to answer customers’ questions. Unless actions are taken to
reduce this gap, there will be inconsistencies in its service quality. Table 3 shows that SBM
Ltd has an upper hand where the assurance aspect is concerned.
According to the responsiveness aspect of the five banks in the sample, Barclays Bank Ltd
is less responsive followed by HSBC Ltd, SBM Ltd , MCB Ltd , BBC Ltd. Barclays Bank Ltd
having the greatest gap shows clearly it is not focusing on important factors such as
willingness to help customers, providing prompt and efficient service, among others. Unless
these inefficiencies concerning the responsiveness of banks are taken care of, the gap will
continue to increase.
Based on the feedback of our respondents, HSBC Ltd is again on the top of the list as it
appears to be less reliable than the other 4 banks towards its customers. This is surely due to
the lack of commitment as well as due to its employees not showing sincere interest in
attending to customer needs. From the above table, we found the BBC Ltd is most reliable
among the 5 banks. Low level of reliability can prove to be costly to banks as customers can
easily switch to another bank thus proper actions have to be taken to remedy the situation
promptly.
On the overall, the SERVQUAL score is -1.86. This indicates that the perceived service is
much less than the expected service. In light of the above analysis, it has been found that the
respondents are of the view that among the five banks, HSBC Ltd has a lot to improve to be
able to meet its customer expectations.
5.2 Hypothesis Testing
5.2.1 Analysing Demographic Factor And Service Quality Dimensions
Hypothesis 1
H10: Demographic factors of respondents have no influence on SERVQUAL mean scores of
bank
H11: Demographic factors of respondents have no influence on SERVQUAL mean scores of
bank
Gender and Service Quality Dimensions
Given the number of possible answers for gender, Mann-Whitney test has been used to
conduct the test and the result is as displayed below.
Proceedings of the International Conference on Tourism, Hospitality and Marketing
(IC16Mauritius Conference) ISBN - 978-1-943579-19-8
Ebene-Mauritius, 21-23 January, 2016. Paper ID: M624
13 www.globalbizresearch.org
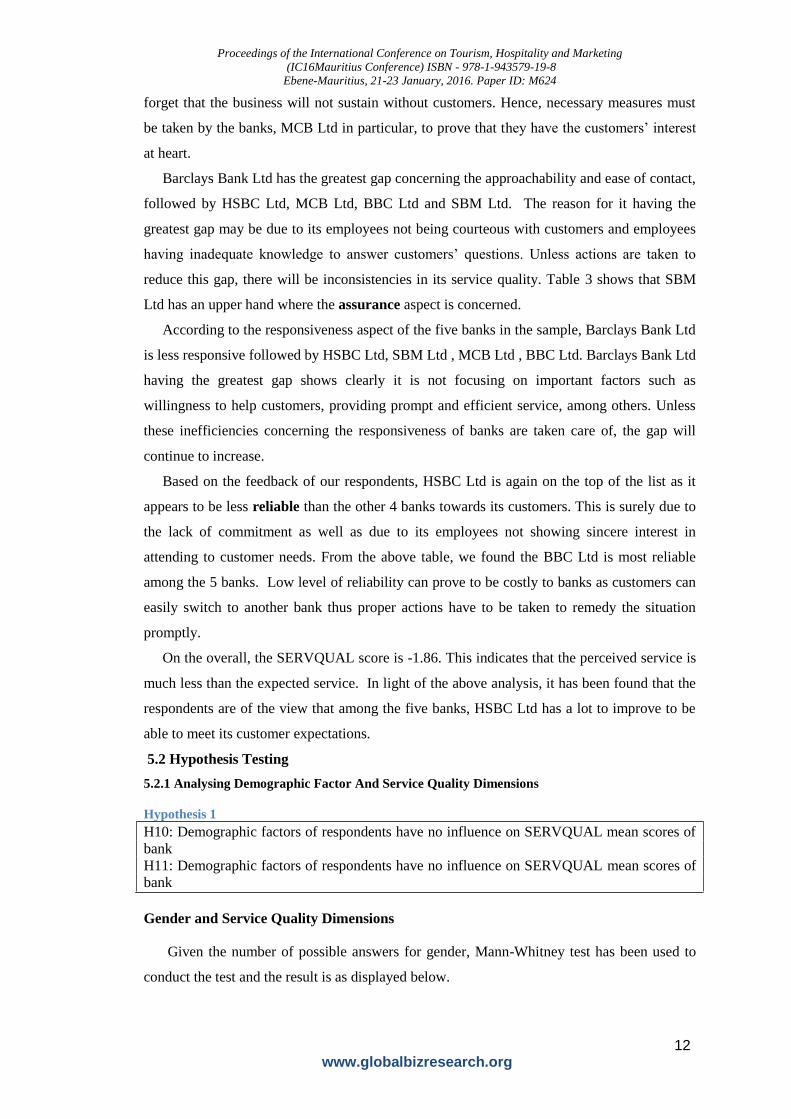
Table 4: Mann-Whitney test results on the impact of gender on service quality dimensions
On one hand Table 4 shows that the significant value for tangibility, assurance and
empathy is greater than 5%, hence there is no significant difference in term of male and
female perceptions. On the other hand, there is a significant difference in terms of
responsiveness and reliability of bank services being provided to male and female.
Residential Area and Service Quality Dimensions
Similar to the above, Mann-Whitney test has been used to analyse the effect of residential
area on the service quality dimensions. The idea is to find out whether there is a difference in
the service quality of banks on respondents of living in rural and urban areas.
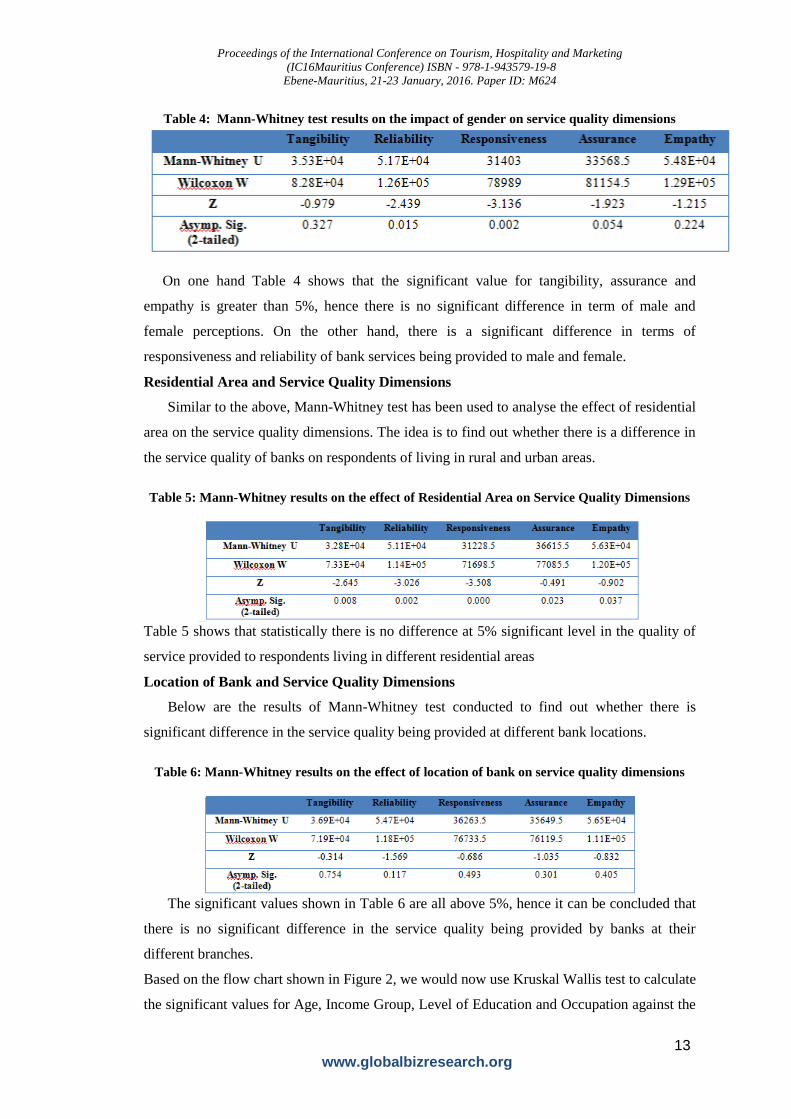
Table 5: Mann-Whitney results on the effect of Residential Area on Service Quality Dimensions
Table 5 shows that statistically there is no difference at 5% significant level in the quality of
service provided to respondents living in different residential areas
Location of Bank and Service Quality Dimensions
Below are the results of Mann-Whitney test conducted to find out whether there is
significant difference in the service quality being provided at different bank locations.
Table 6: Mann-Whitney results on the effect of location of bank on service quality dimensions
The significant values shown in Table 6 are all above 5%, hence it can be concluded that
there is no significant difference in the service quality being provided by banks at their
different branches.
Based on the flow chart shown in Figure 2, we would now use Kruskal Wallis test to calculate
the significant values for Age, Income Group, Level of Education and Occupation against the
Proceedings of the International Conference on Tourism, Hospitality and Marketing
(IC16Mauritius Conference) ISBN - 978-1-943579-19-8
Ebene-Mauritius, 21-23 January, 2016. Paper ID: M624
14 www.globalbizresearch.org
5 service quality dimensions. Kruskal Wallis test is a non-parametric test used to compare 3
or more groups of data. It is in fact an extension of the Mann-Whitney test.
Age and Service Quality Dimensions
The feedback of the 137 respondents based on their age range using Kruskal Wallis test
and the results are tabulated below.
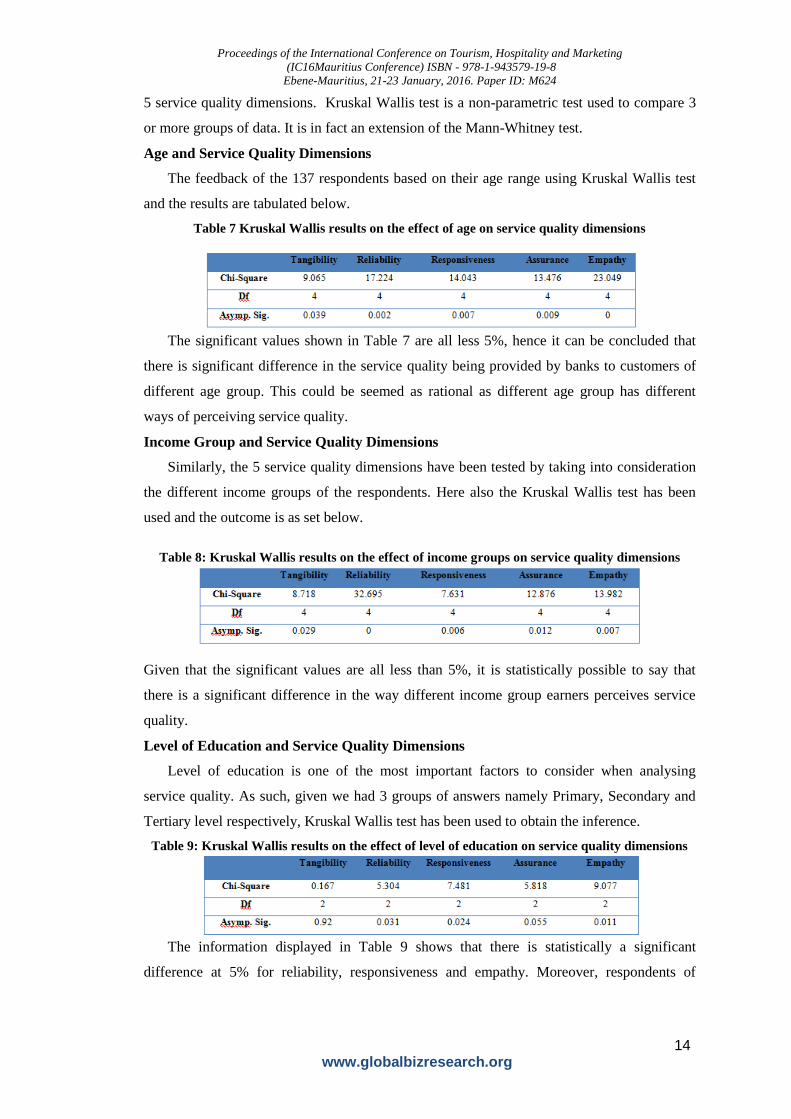
Table 7 Kruskal Wallis results on the effect of age on service quality dimensions
The significant values shown in Table 7 are all less 5%, hence it can be concluded that
there is significant difference in the service quality being provided by banks to customers of
different age group. This could be seemed as rational as different age group has different
ways of perceiving service quality.
Income Group and Service Quality Dimensions
Similarly, the 5 service quality dimensions have been tested by taking into consideration
the different income groups of the respondents. Here also the Kruskal Wallis test has been
used and the outcome is as set below.
Table 8: Kruskal Wallis results on the effect of income groups on service quality dimensions
Given that the significant values are all less than 5%, it is statistically possible to say that
there is a significant difference in the way different income group earners perceives service
quality.
Level of Education and Service Quality Dimensions
Level of education is one of the most important factors to consider when analysing
service quality. As such, given we had 3 groups of answers namely Primary, Secondary and
Tertiary level respectively, Kruskal Wallis test has been used to obtain the inference.
Table 9: Kruskal Wallis results on the effect of level of education on service quality dimensions
The information displayed in Table 9 shows that there is statistically a significant
difference at 5% for reliability, responsiveness and empathy. Moreover, respondents of
Proceedings of the International Conference on Tourism, Hospitality and Marketing
(IC16Mauritius Conference) ISBN - 978-1-943579-19-8
Ebene-Mauritius, 21-23 January, 2016. Paper ID: M624
15 www.globalbizresearch.org
different level of education have the same experience where tangibility and assurance are
concerned.
Occupation and Service Quality Dimensions
The last demographic factor to consider for this set of hypotheses is occupation of the
respondents. The researcher wanted to find out whether same level of service quality is
provided to respondents of different occupations.
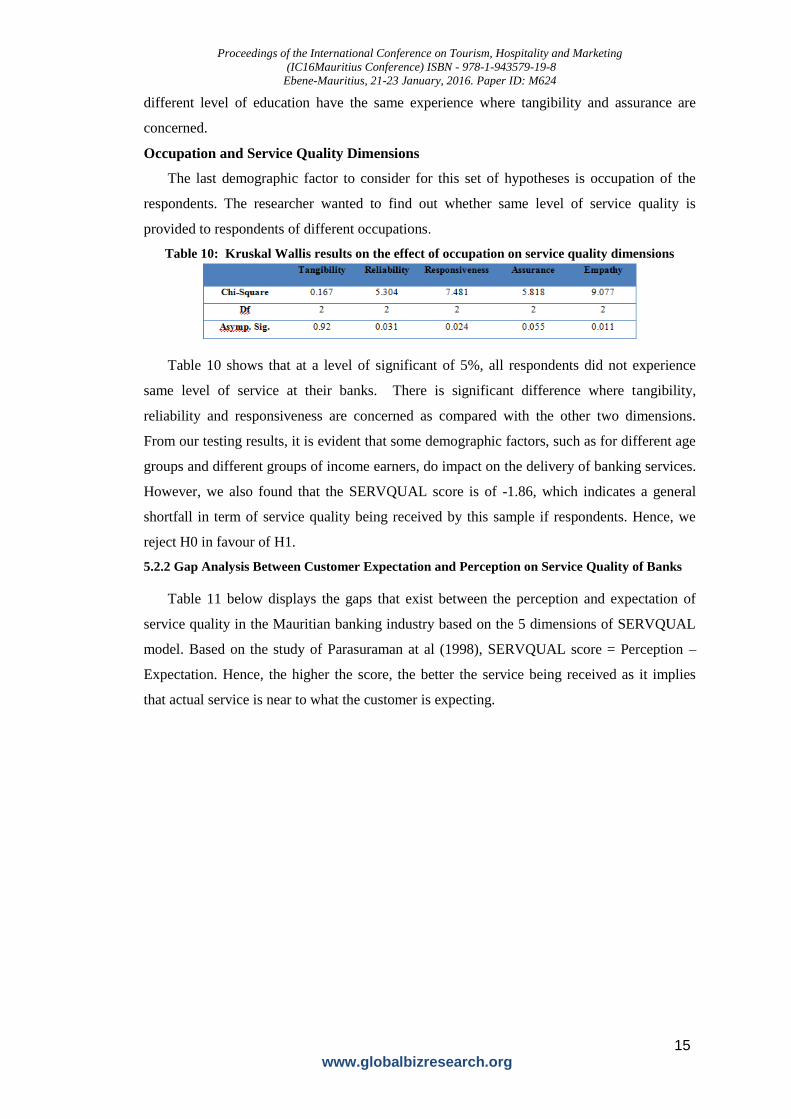
Table 10: Kruskal Wallis results on the effect of occupation on service quality dimensions
Table 10 shows that at a level of significant of 5%, all respondents did not experience
same level of service at their banks. There is significant difference where tangibility,
reliability and responsiveness are concerned as compared with the other two dimensions.
From our testing results, it is evident that some demographic factors, such as for different age
groups and different groups of income earners, do impact on the delivery of banking services.
However, we also found that the SERVQUAL score is of -1.86, which indicates a general
shortfall in term of service quality being received by this sample if respondents. Hence, we
reject H0 in favour of H1.
5.2.2 Gap Analysis Between Customer Expectation and Perception on Service Quality of Banks
Table 11 below displays the gaps that exist between the perception and expectation of
service quality in the Mauritian banking industry based on the 5 dimensions of SERVQUAL
model. Based on the study of Parasuraman at al (1998), SERVQUAL score = Perception –
Expectation. Hence, the higher the score, the better the service being received as it implies
that actual service is near to what the customer is expecting.
Proceedings of the International Conference on Tourism, Hospitality and Marketing
(IC16Mauritius Conference) ISBN - 978-1-943579-19-8
Ebene-Mauritius, 21-23 January, 2016. Paper ID: M624
16 www.globalbizresearch.org
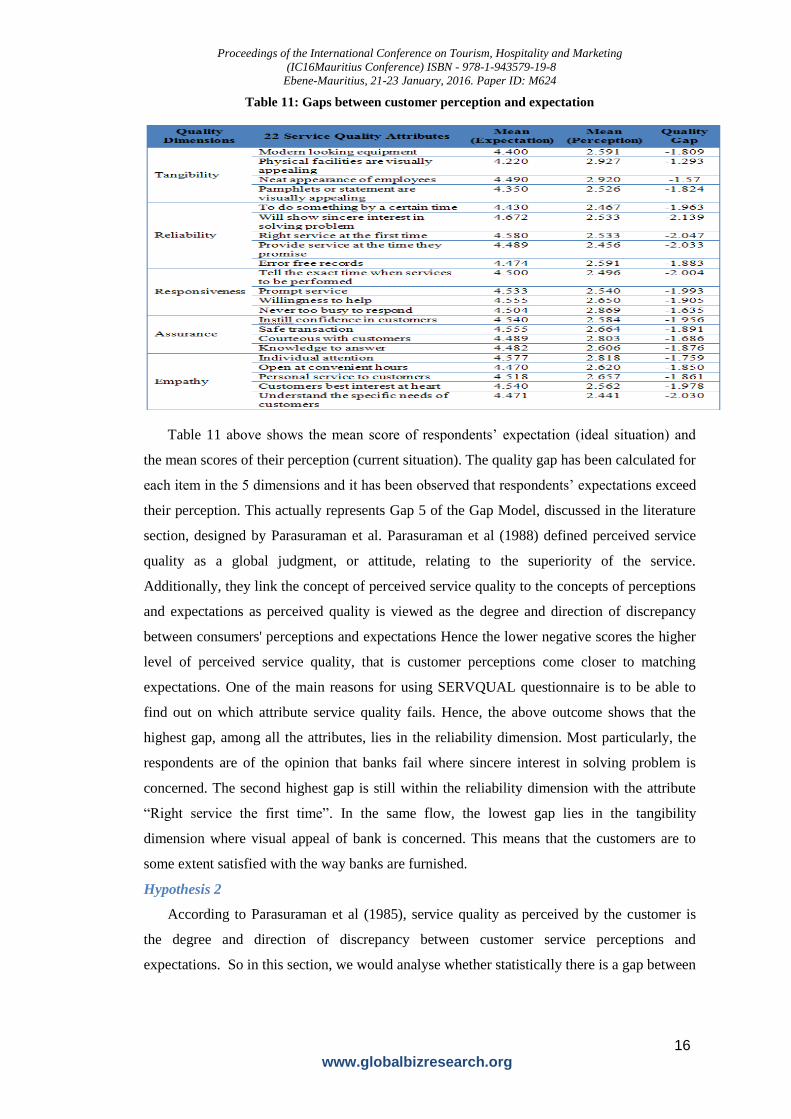
Table 11: Gaps between customer perception and expectation
Table 11 above shows the mean score of respondents’ expectation (ideal situation) and
the mean scores of their perception (current situation). The quality gap has been calculated for
each item in the 5 dimensions and it has been observed that respondents’ expectations exceed
their perception. This actually represents Gap 5 of the Gap Model, discussed in the literature
section, designed by Parasuraman et al. Parasuraman et al (1988) defined perceived service
quality as a global judgment, or attitude, relating to the superiority of the service.
Additionally, they link the concept of perceived service quality to the concepts of perceptions
and expectations as perceived quality is viewed as the degree and direction of discrepancy
between consumers' perceptions and expectations Hence the lower negative scores the higher
level of perceived service quality, that is customer perceptions come closer to matching
expectations. One of the main reasons for using SERVQUAL questionnaire is to be able to
find out on which attribute service quality fails. Hence, the above outcome shows that the
highest gap, among all the attributes, lies in the reliability dimension. Most particularly, the
respondents are of the opinion that banks fail where sincere interest in solving problem is
concerned. The second highest gap is still within the reliability dimension with the attribute
“Right service the first time”. In the same flow, the lowest gap lies in the tangibility
dimension where visual appeal of bank is concerned. This means that the customers are to
some extent satisfied with the way banks are furnished.
Hypothesis 2
According to Parasuraman et al (1985), service quality as perceived by the customer is
the degree and direction of discrepancy between customer service perceptions and
expectations. So in this section, we would analyse whether statistically there is a gap between
Proceedings of the International Conference on Tourism, Hospitality and Marketing
(IC16Mauritius Conference) ISBN - 978-1-943579-19-8
Ebene-Mauritius, 21-23 January, 2016. Paper ID: M624
17 www.globalbizresearch.org
customer perceptions and expectations in the quality of service being provided by banks in
the Mauritian banking industry. The hypothesis set for this analyse is as follows:
H2i0: There is no significant difference between customer perceptions and expectations
related to dimension i
H2i1: There is a significant difference between customer perceptions and expectations to
dimension i
(wherei = a, b, c, d, e for tangibility, reliability, responsiveness, assurance and empathy
respectively)
In the view of conducting this analysis, a very powerful statistical tool named Wilcoxon
signed rank test would be used to detect if statistically there is significant difference between
a paired set of data. Crichton (1997) supported that Wilcoxon Sign test is a statistical
comparison of the average of two dependent samples. Also, the differences are approximately
symmetric and that the data are measured on an ordinal, interval, or ratio scale. This is
therefore appropriate for this study as our model used likert scale to capture respondents’
opinion.
Moreover, according to Crichton et al (1997), paired data means that the values in the two
groups being compared are naturally linked, and usually arise from individuals being
measured more than once. This fits well for this part of our study as the difference between
the scores received for perception and those for expectation would be clearly seen. So here,
the respondents’ opinions on their perception and expectation would be considered as a set of
paired data. Thus, given there are five service quality dimensions, we would be having 5 sets
of paired data.
The results of the test conducted have been stated below.
Hypothesis 2a
H2a0: There is no significant difference between customer perception and expectation related
to tangibility aspect of banks
H2a1: There is significant difference between customer perception and expectation related to
tangibility aspect of banks
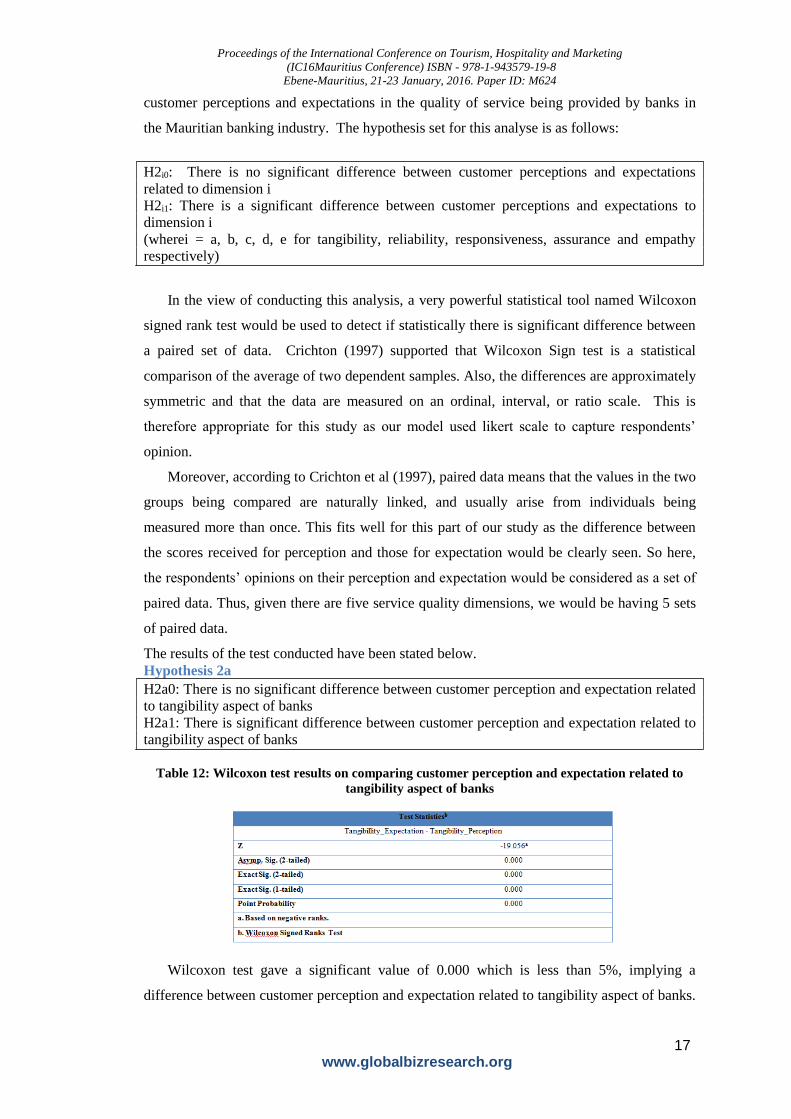
Table 12: Wilcoxon test results on comparing customer perception and expectation related to
tangibility aspect of banks
Wilcoxon test gave a significant value of 0.000 which is less than 5%, implying a
difference between customer perception and expectation related to tangibility aspect of banks.
Proceedings of the International Conference on Tourism, Hospitality and Marketing
(IC16Mauritius Conference) ISBN - 978-1-943579-19-8
Ebene-Mauritius, 21-23 January, 2016. Paper ID: M624
18 www.globalbizresearch.org
Moreover, this result is in line with Table 11 where we found that the mean expectation for
tangibility is 4.37 which is higher than the mean perception of 2.74 hence showing the gap
between customers’ expectation and perception on tangibility. As such, we can reject H2a0in
favour of H2a1.
Hypothesis 2b
H2b0: There is no significant difference between customer perception and expectation related
to reliability aspect of banks
H2b1: There is significant difference between customer perception and expectation related to
reliability aspect of banks
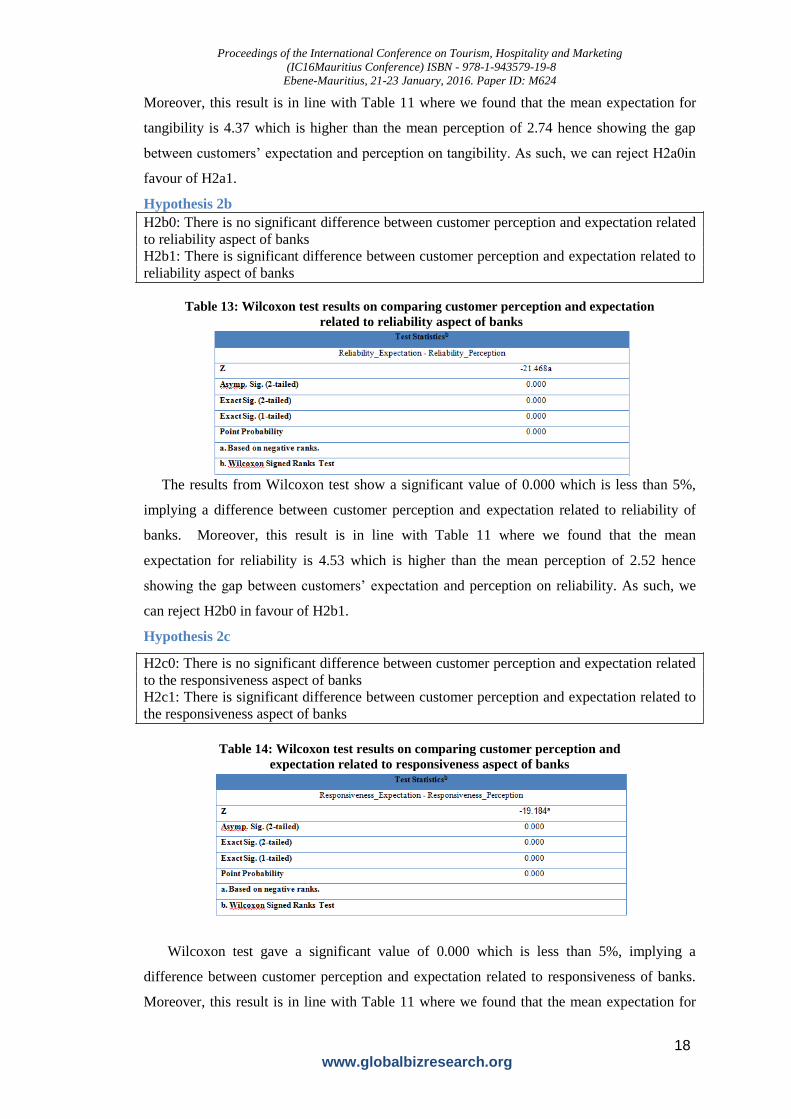
Table 13: Wilcoxon test results on comparing customer perception and expectation
related to reliability aspect of banks
The results from Wilcoxon test show a significant value of 0.000 which is less than 5%,
implying a difference between customer perception and expectation related to reliability of
banks. Moreover, this result is in line with Table 11 where we found that the mean
expectation for reliability is 4.53 which is higher than the mean perception of 2.52 hence
showing the gap between customers’ expectation and perception on reliability. As such, we
can reject H2b0 in favour of H2b1.
Hypothesis 2c
H2c0: There is no significant difference between customer perception and expectation related
to the responsiveness aspect of banks
H2c1: There is significant difference between customer perception and expectation related to
the responsiveness aspect of banks
Table 14: Wilcoxon test results on comparing customer perception and
expectation related to responsiveness aspect of banks
Wilcoxon test gave a significant value of 0.000 which is less than 5%, implying a
difference between customer perception and expectation related to responsiveness of banks.
Moreover, this result is in line with Table 11 where we found that the mean expectation for
Proceedings of the International Conference on Tourism, Hospitality and Marketing
(IC16Mauritius Conference) ISBN - 978-1-943579-19-8
Ebene-Mauritius, 21-23 January, 2016. Paper ID: M624
19 www.globalbizresearch.org
responsiveness is 4.52 which is higher than the mean perception of 2.64 hence showing the
gap between customers’ expectation and perception on responsiveness.
As such, we can reject H2c0in favour of H2c1.
Hypothesis 2d
H2d0: There is no significant difference between customer perception and expectation related
to the assurance aspect of banks
H2d1: There is significant difference between customer perception and expectation related to
the assurance aspect of banks
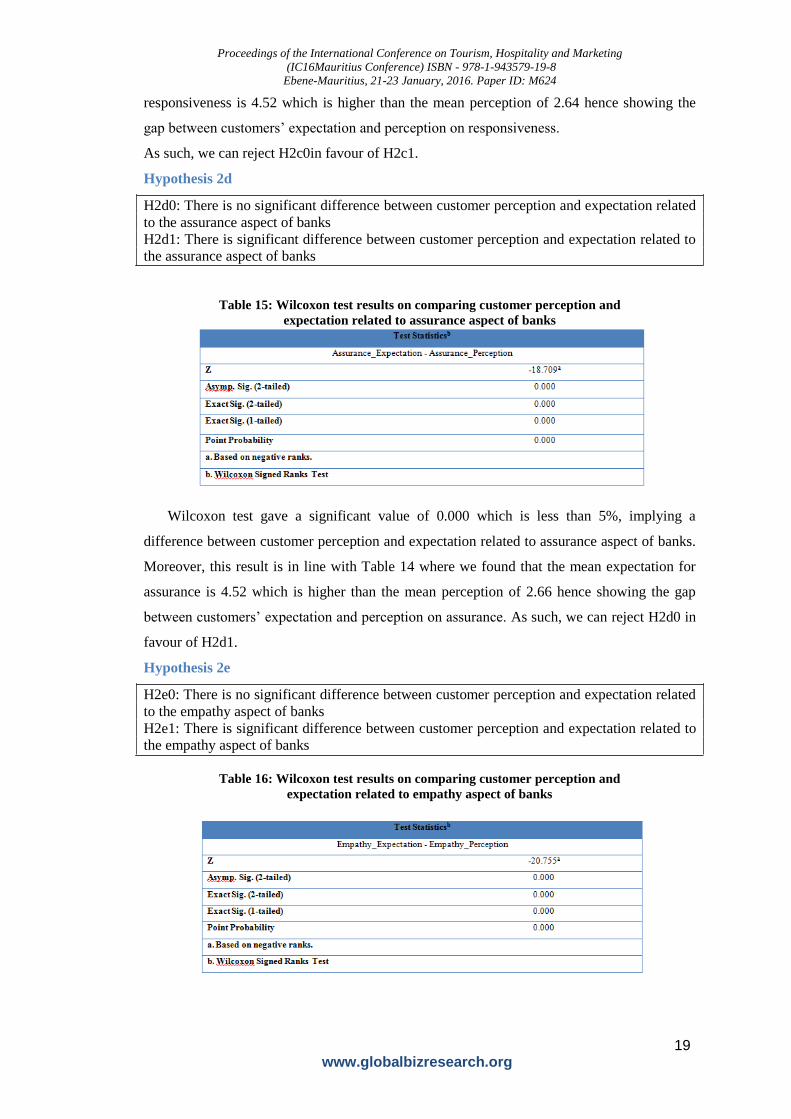
Table 15: Wilcoxon test results on comparing customer perception and
expectation related to assurance aspect of banks
Wilcoxon test gave a significant value of 0.000 which is less than 5%, implying a
difference between customer perception and expectation related to assurance aspect of banks.
Moreover, this result is in line with Table 14 where we found that the mean expectation for
assurance is 4.52 which is higher than the mean perception of 2.66 hence showing the gap
between customers’ expectation and perception on assurance. As such, we can reject H2d0 in
favour of H2d1.
Hypothesis 2e
H2e0: There is no significant difference between customer perception and expectation related
to the empathy aspect of banks
H2e1: There is significant difference between customer perception and expectation related to
the empathy aspect of banks
Table 16: Wilcoxon test results on comparing customer perception and
expectation related to empathy aspect of banks
Proceedings of the International Conference on Tourism, Hospitality and Marketing
(IC16Mauritius Conference) ISBN - 978-1-943579-19-8
Ebene-Mauritius, 21-23 January, 2016. Paper ID: M624
20 www.globalbizresearch.org
Wilcoxon test gave a significant value of 0.000 which is less than 5%, implying a
difference between customer perception and expectation related to the empathy aspect of
banks. Moreover, this result is in line with Table 11 where we found that the mean
expectation for empathy is 4.52 which is higher than the mean perception of 2.62 hence
showing the gap between customers’ expectation and perception on empathy. As such, we can
reject H2e0 in favour of H2e1.
5.2.3 Analysing Relationship between Service Quality and Customer Satisfaction
With reference to the idea presented by Grönroos’s (2000), delivering high quality
services is a prerequisite for achieving customer satisfaction and only through customer
satisfaction can the company gain loyal customers. Based on a combination of literature
review and empirical investigation, Oliver (1980) and Parasuraman et al (1988) suggested that
service quality and consumer satisfaction are related, but distinct constructs. Their
explanation of the difference between the two is that service quality is a long-term overall
evaluation, whereas consumer satisfaction is a transaction-specific measure.
Given the nature of the relationship between customer satisfaction and service quality, it
seems vital to test the data collected for this study also to find out if here also the conclusion
sustains. The hypothesis stipulated for this analysis is as follows:
Hypothesis 3
H30: There is no relationship between service quality and customer satisfaction in the
Mauritian banking industry.
H31: There is a relationship between service quality and customer satisfaction in the
Mauritian banking industry.
To undertake this investigation, correlation analysis has been used to assess the
association between service quality and customer satisfaction. The test has been conducted in
such a way that the questions related to Tangibility, Responsiveness and Reliability have been
grouped to represent the service quality element of the banks and customer satisfaction has
been represented by questions relative to assurance and empathy dimensions. The results of
the correlation analysis have been tabulated below.
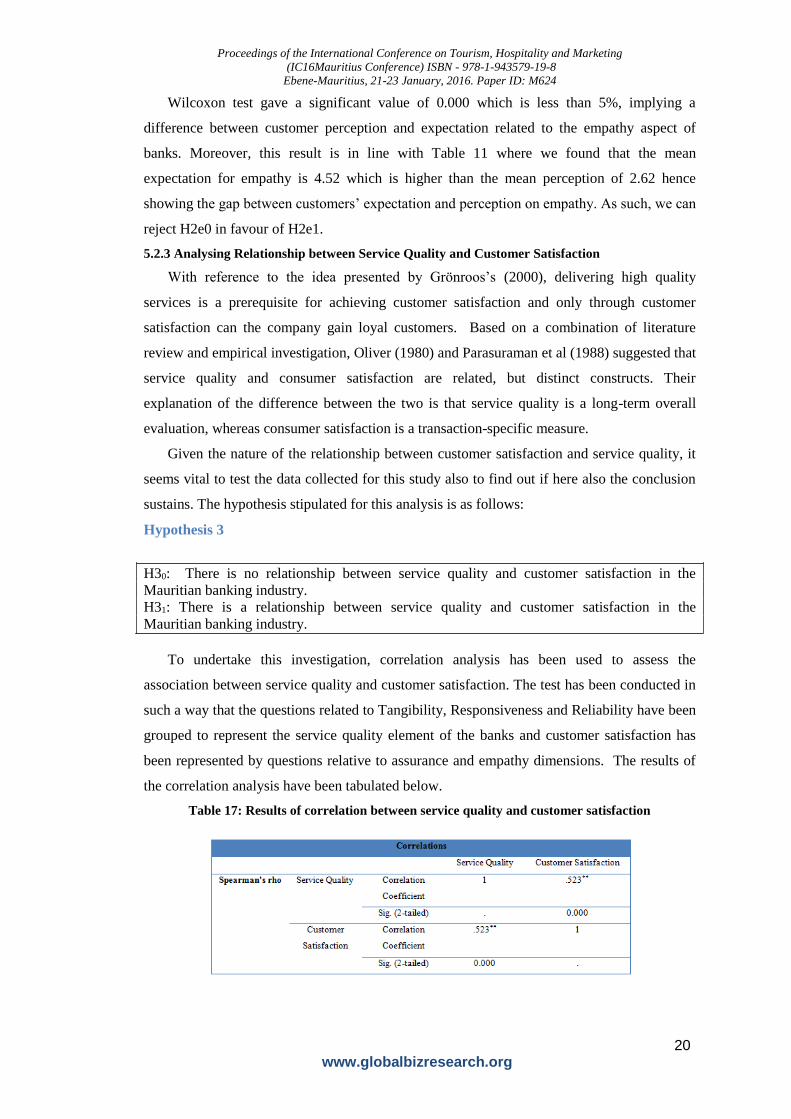
Table 17: Results of correlation between service quality and customer satisfaction
Proceedings of the International Conference on Tourism, Hospitality and Marketing
(IC16Mauritius Conference) ISBN - 978-1-943579-19-8
Ebene-Mauritius, 21-23 January, 2016. Paper ID: M624
21 www.globalbizresearch.org
The significant value is 0.000 which shows that there is a significant difference between
customer satisfaction and service quality at 5% significant level. Hence, rejecting the null
hypothesis. Moreover, there is a positive relationship between these two variables such that an
increase of 1% in reliability, responsiveness and tangibility will lead to an increase of 52.3%
in customer satisfaction.
6. Conclusion and Further Research
It is very important that bank managers understand that service quality is made up of
different dimensions and it being intangible makes it difficult to assess. All the service quality
dimensions have a positive relationship with the way bank employees behave. Therefore, the
staff needs to have ample knowledge, communication skills, and eagerness to help in giving
quick services efficiently. Bank managers should realize the fact that training to employees is
an investment, not an expense. Training of staffs with regards to service quality and
knowledge in service quality dimensions should be regularly conducted in order for the staffs
to feel more at ease, professional and confident while delivering the required service to
customers. Business drivers can use the five dimensions discussed in this study to evaluate the
level of service being delivered to their customers. Thus, enabling them to analyse their
current situation and convert weaknesses into strengths to have a sharper competitive edge on
the market. Bank staffs should keep in mind that customers evaluate service quality by
comparing the quality of service they expected to receive against the quality of service they
actually experience.
Further research can be carried out to solely appraise the reliability dimension of banks. It
would also certainly add value to the banking industry to find out about the financial impact
on banks when more emphasis is laid on service quality. Finally, it would be interesting to
assess service quality from the employees’ perspective as well.
References
Berry, L. L. (1995). Relationship marketing of services—growing interest, Emerging Perspectives.
Journal of the Academy of Marketing Science, 23(4), 236-245.
Bitner, M. J., Booms, B .H. & Tetreault, M .S. (1990). The service Encounter: Diagnosing Favorable
and Unfavorable Indents. Journal of Marketing, 54(1), 71-84.
Bloemer, J., de-Ruyter, K. & Wetzels, M. (1999). Linking perceived service quality and service
loyalty: A multi- dimensional perspective. European Journal of Marketing, 33(11/12), 1082–1106.
Carman, J.M. (1990), “Consumer perceptions of service quality: an assessment of the SERVQUAL
dimensions”, Journal of Retailing, Vol. 66, pp. 33-5.
Choudhury, K. (2008), “Service quality: insights from the Indian banking scenario”, Australasian
Marketing Journal, Vol. 16 No. 1, pp. 48-61.
Jamal, A. and Naser, K. (2002), “Customer satisfaction and retail banking: an assessment of some of
the key antecedents of customer satisfaction in retail banking”, International Journal of Bank
Marketing, Vol. 20 No. 4, pp. 146-60.
Jamal, A. and Naser, K. (2003), “Factors influencing customer satisfaction in the retail banking sector
in Pakistan”, International Journal of Commerce & Management, Vol. 13 No. 2, p. 29.
Proceedings of the International Conference on Tourism, Hospitality and Marketing
(IC16Mauritius Conference) ISBN - 978-1-943579-19-8
Ebene-Mauritius, 21-23 January, 2016. Paper ID: M624
22 www.globalbizresearch.org
Ladhari, R. (2008), “Alternative measure of service quality: a review”, Journal of Managing Service
Quality, Vol. 18 No. 1, pp. 65-86.
Oliver, R .L. (1980). A Cognitive Model of the Antecedents and Consequences of Satisfaction
decisions. Journal of marketing research, 17(4), 460-469.
Parasuraman, A. & Grewal, D. (2000). The Impact of Technology on the Quality Value Loyalty Chain.
A Research Agenda. Journal of Academy of Marketing science, 28(1), 168-174.
Parasuraman, A., Berry, L.L. and Zeithaml, V.A. (1988), “SERVQUAL: a multiple-item scale for
measuring consumer perceptions of service quality”, Journal of Retailing, Vol.64 No. 1, p. 12.
Parasuraman, A. (1991). Refinement and reassessment of the SERVQUAL scale. Journal of Retailing,
67(4), 420-450.
Parasuraman, A., Berry, L. L. & Zeithaml, V. A. (1991). Understanding Customer Expectations of
Service. Sloan Management Review, 32(3), 39-48.
Zeithaml, V.A. and Bitner, M.J. (1996), Services Marketing, International edition,McGraw-
Hill,London
http://www.google.com
https://www.bom.mu
www.sbmgroup.mu
www.mcb.mu/
Recommended