T h e ec onom i c i m p a c t of R ug b y W or l d Cup 2015Post ev en t study
1
E x ec uti ve sum m a r y
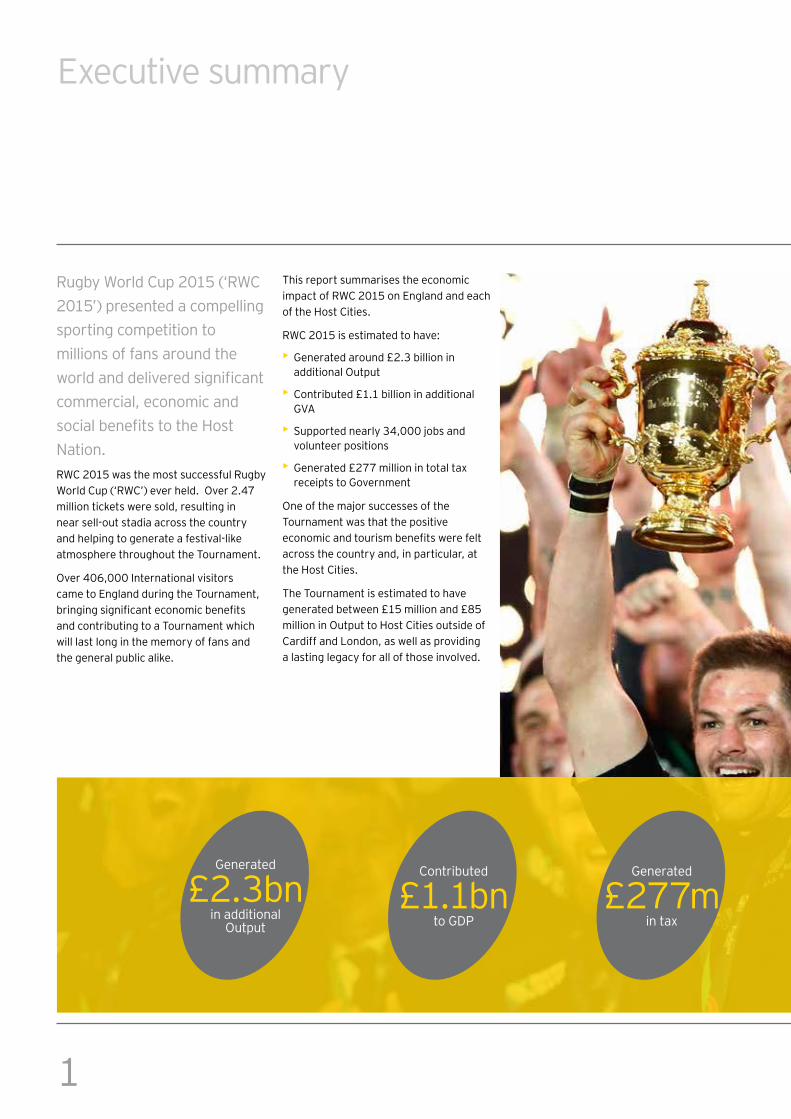
Rugby World Cup 2015 (‘RWC 2015’) presented a compelling sp or ti ng c om p eti ti on to m i l l i ons of f a ns a r ound th e world and delivered significant c om m er c i a l , ec onom i c a nd social benefits to the Host N a ti on.RWC 2015 was the most successful Rugby World Cup (‘RWC’) ever held. Over 2.47 m i l l i on ti c k ets w er e sol d, r esul ti ng i n nea r sel l - out sta di a a c r oss th e c ountr y a nd h el p i ng to g ener a te a f esti va l - l i k e a tm osp h er e th r oug h out th e T our na m ent.
Over 406,000 International visitors c a m e to E ng l a nd dur i ng th e T our na m ent, bringing significant economic benefits a nd c ontr i b uti ng to a T our na m ent w h i c h w i l l l a st l ong i n th e m em or y of f a ns a nd th e g ener a l p ub l i c a l i k e.
T h i s r ep or t sum m a r i ses th e ec onom i c impact of RWC 2015 on England and each of the Host Cities.
RWC 2015 is estimated to have:
• Generated around £2.3 billion in a ddi ti ona l O utp ut
• Contributed £1.1 billion in additional GVA
• Supported nearly 34,000 jobs and vol unteer p osi ti ons
• Generated £277 million in total tax receipts to Government
One of the major successes of the T our na m ent w a s th a t th e p osi ti ve economic and tourism benefits were felt a c r oss th e c ountr y a nd, i n p a r ti c ul a r , a t the Host Cities.
T h e T our na m ent i s esti m a ted to h a ve generated between £15 million and £85 million in Output to Host Cities outside of Cardiff and London, as well as providing a l a sti ng l eg a c y f or a l l of th ose i nvol ved.
C ontr i b uted
£1.1bn to GDP
Generated
£2.3bn i n a ddi ti ona l
O utp ut
Generated
£277m i n ta x
2The economic impact of Rugby World Cup 2015 | Post event study
A ttr a c ted
406,000 I nter na ti ona l
vi si tor s
Supported nearly
3 4 , 0 0 0 jobs and
vol unteer s
Sold over
2.47m ti c k ets
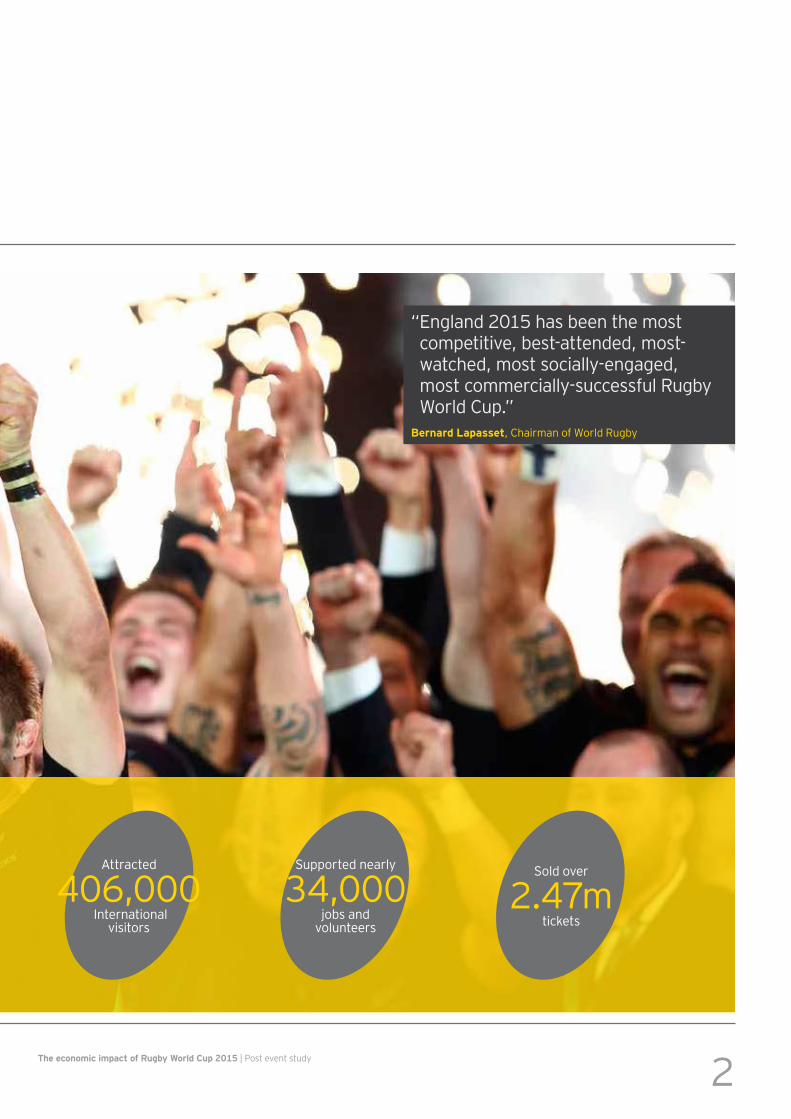
“ England 2015 has been the most c om p eti ti ve, b est- a ttended, m ost-w a tc h ed, m ost soc i a l l y- eng a g ed, m ost c om m er c i a l l y- suc c essf ul R ug b y W or l d C up . ”
B ernard L apas s et, C h a i r m a n of W or l d R ug b y
3
Contents
01 02
03
04
0605
4The economic impact of Rugby World Cup 2015
Contents
05
06
02
03
04
01Rugby World Cup 2015 delivered p05
Attracting visitors to RWC 2015 p13
Measuring the benefits to the Host Nation p17
The Economic impact of RWC 2015 p23
The legacy of the Tournament p29
Benefits of the Tournament to the Host Cities p33
5
Rugby World Cup 2015 delivered
RWC 2015 del i ver s on a l l f r onts
RWC 2015 was the most successful Rugby tour na m ent ever h el d. I t sol d m or e ti c k ets th a n i n a ny p r evi ous R W C , w i th ever y fixture at or near maximum capacity, a nd g ener a ted a w i desp r ea d, f esti va l - l i k e feeling across the Host Cities and the wider na ti on.
T h e T our na m ent del i ver ed b oth on a nd off the pitch, with significant commercial and economic benefits to the Host Nation, a s w el l a s b ei ng a c om p el l i ng sp or ti ng spectacle. Of the 20 teams competing, N ew Z ea l a nd r a n out a s vi c tor s f or th e sec ond T our na m ent i n a r ow , def ea ti ng Australia 34-17 in the final. Whilst New Z ea l a nd w er e r eg a r ded a t str ong f a vour i tes to ta k e th e c r ow n th er e w er e a num b er of memorable upsets and close finishes which l i f ted th e T our na m ent, a nd eng a g ed c or e a nd c a sua l f a ns a l i k e.
For the first time at a RWC, no Northern Hemisphere team made it through to the Semi-Final stage. Despite this, the final stages of the Tournament attracted sel l - out c r ow ds, w i th dom esti c f a ns a nd vi si tor s f r om a r ound th e w or l d c onti nui ng to sup p or t th e T our na m ent, r eg a r dl ess of th ei r ow n tea m ’ s p er f or m a nc e.
Within the Host Stadiums, total attendance for RWC 2015 was over 2.47 million; 220,000 more than the previous record set in France at RWC 2007. The official Fanzones also attracted over 1 m i l l i on vi si tor s, p r ovi di ng a c c ess to th e T our na m ent f or th ose w i th out ti c k ets a nd a f oc a l p oi nt f or l oc a l a nd vi si ti ng R ug b y f a ns.
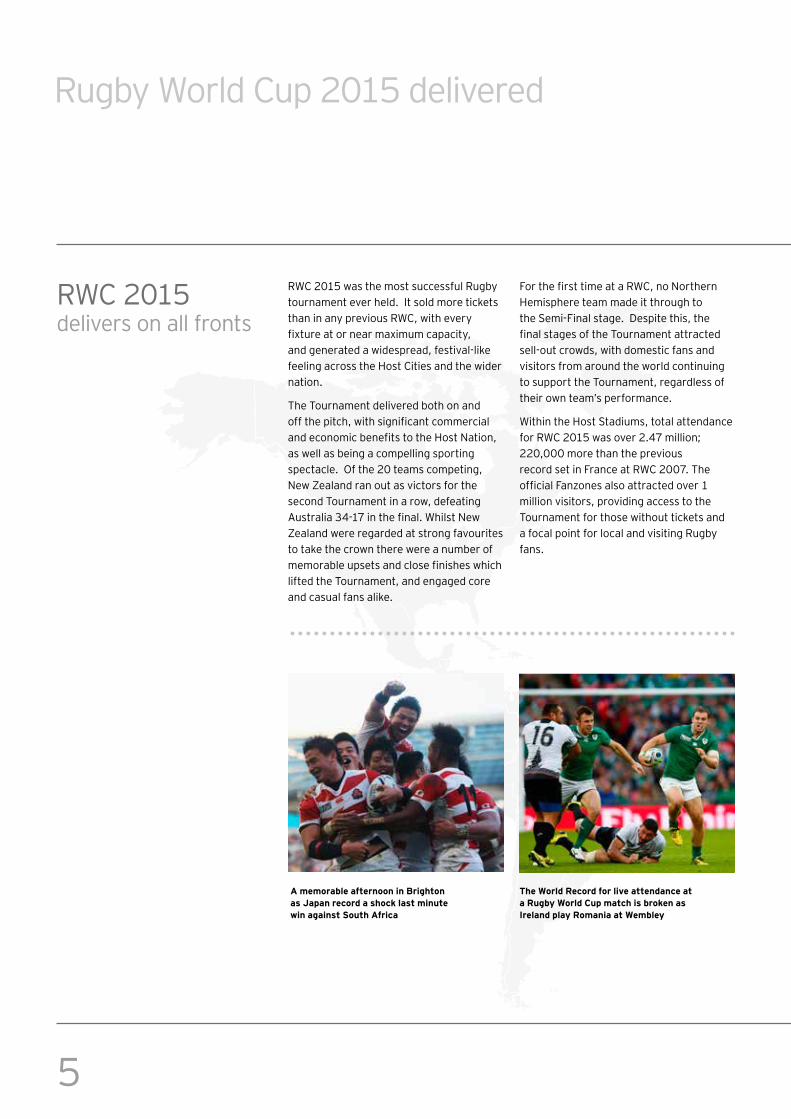
The World Record for liv e attendance at a Rugby World Cup match is brok en as I reland play Romania at Wembley
A memorable afternoon in B righton as J apan record a s hock las t minute w in agains t S outh A frica
6The economic impact of Rugby World Cup 2015 | Post event study
7
R ug b y W or l d C up h a s b ec om e one of th e m ost popular major sporting events in the world
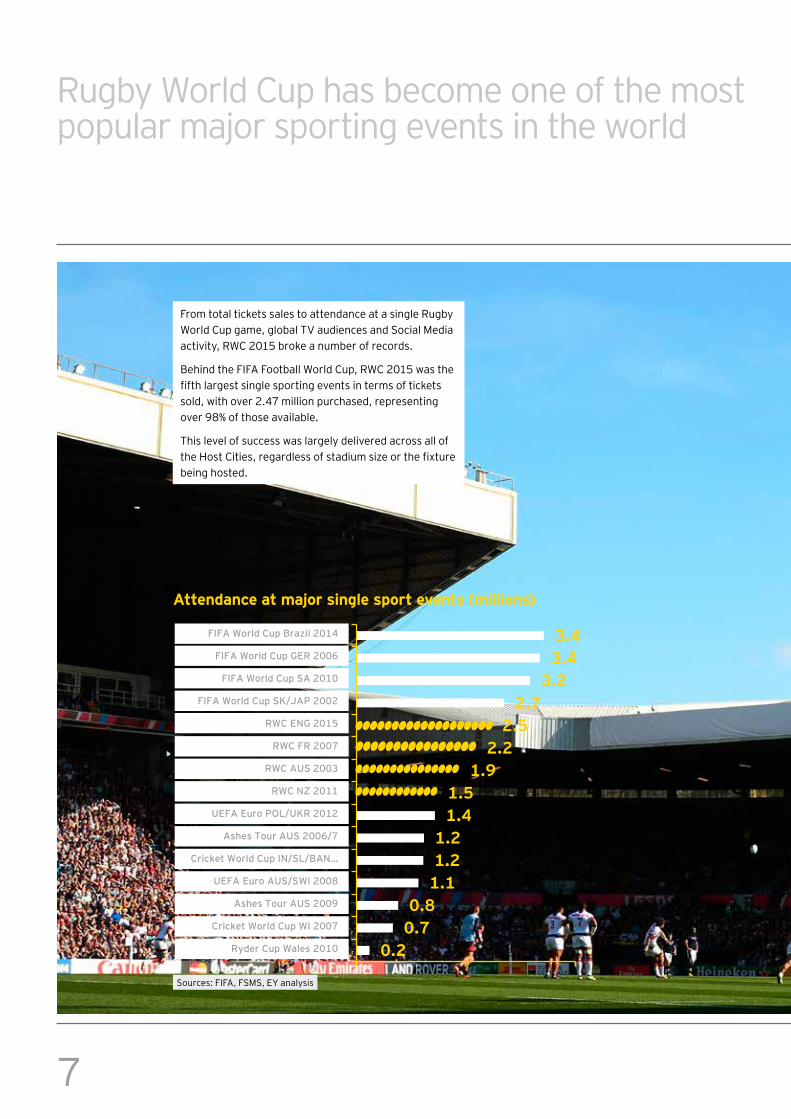
F r om tota l ti c k ets sa l es to a ttenda nc e a t a si ng l e R ug b y World Cup game, global TV audiences and Social Media activity, RWC 2015 broke a number of records.
Behind the FIFA Football World Cup, RWC 2015 was the fifth largest single sporting events in terms of tickets sold, with over 2.47 million purchased, representing over 98% of those available.
T h i s l evel of suc c ess w a s l a r g el y del i ver ed a c r oss a l l of the Host Cities, regardless of stadium size or the fixture b ei ng h osted.
0. 20. 70. 8
1. 11. 21. 2
1. 41. 5
1. 92. 2
2. 52. 7
3 . 23 . 43 . 4
0 2 4
Ryder Cup Wales 2010
Cricket World Cup WI 2007
Ashes Tour AUS 2009
UEFA Euro AUS/SWI 2008
Cricket World Cup IN/SL/BAN…
Ashes Tour AUS 2006/7
UEFA Euro POL/UKR 2012
RWC NZ 2011
RWC AUS 2003
RWC FR 2007
RWC ENG 2015
FIFA World Cup SK/JAP 2002
FIFA World Cup SA 2010
FIFA World Cup GER 2006
FIFA World Cup Brazil 2014
A ttendance at maj or s ingle s port ev ents ( millions )
Sources: FIFA, FSMS, EY analysis
8The economic impact of Rugby World Cup 2015 | Post event study
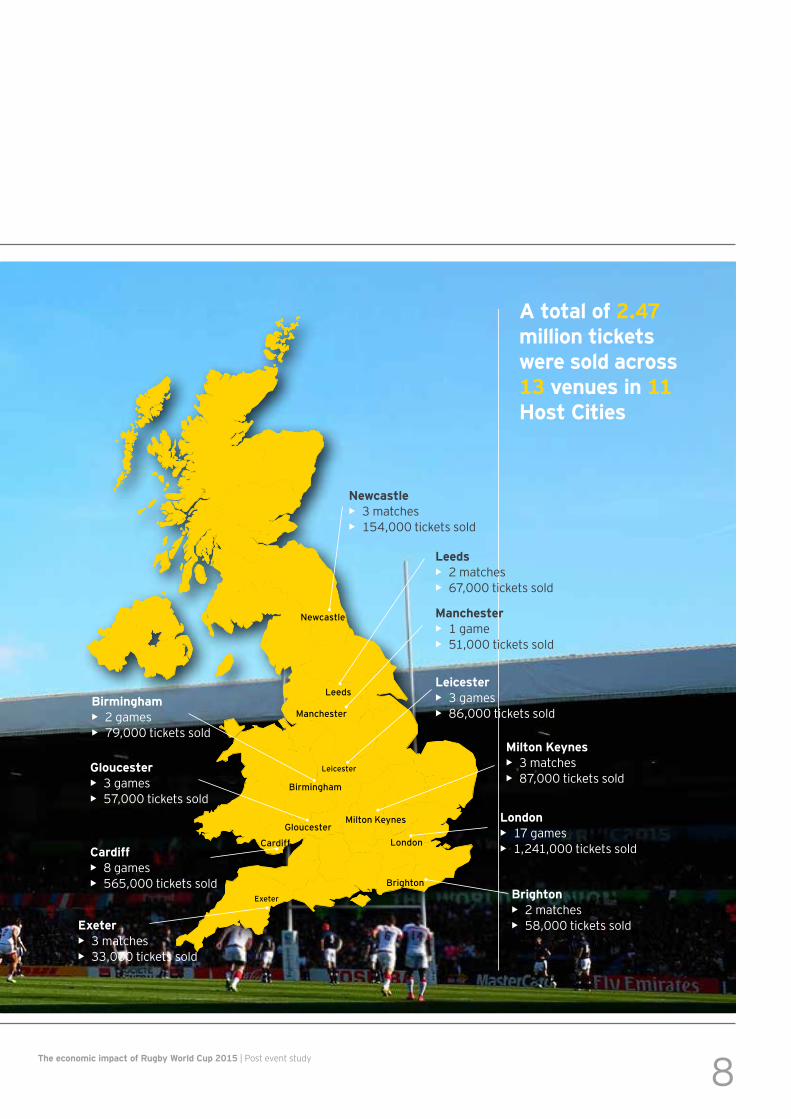
N ew cas tle • 3 m a tc h es• 154,000 tickets sold
New castle
Leeds
M an chester
Leicester
M ilton Keyn es
Lon don
Brig hton
Ex eter
Cardif f
Gloucester
Birm in g ham
B righton• 2 matches• 58,000 tickets soldE x eter
• 3 m a tc h es• 3 3 , 0 0 0 ti c k ets sol d
Cardiff• 8 games• 565,000 tickets sold
G louces ter• 3 g a m es• 57,000 tickets sold
B irmingham• 2 games• 79,000 tickets sold
M anches ter• 1 g a m e• 51,000 tickets sold
L eices ter• 3 g a m es• 86,000 tickets sold
M ilton K eynes• 3 m a tc h es• 87,000 tickets sold
L ondon• 17 games• 1,241,000 tickets sold
L eeds• 2 matches• 67,000 tickets sold
A total of 2. 4 7 million tick ets w ere s old acros s 13 v enues in 11 H os t Cities
9
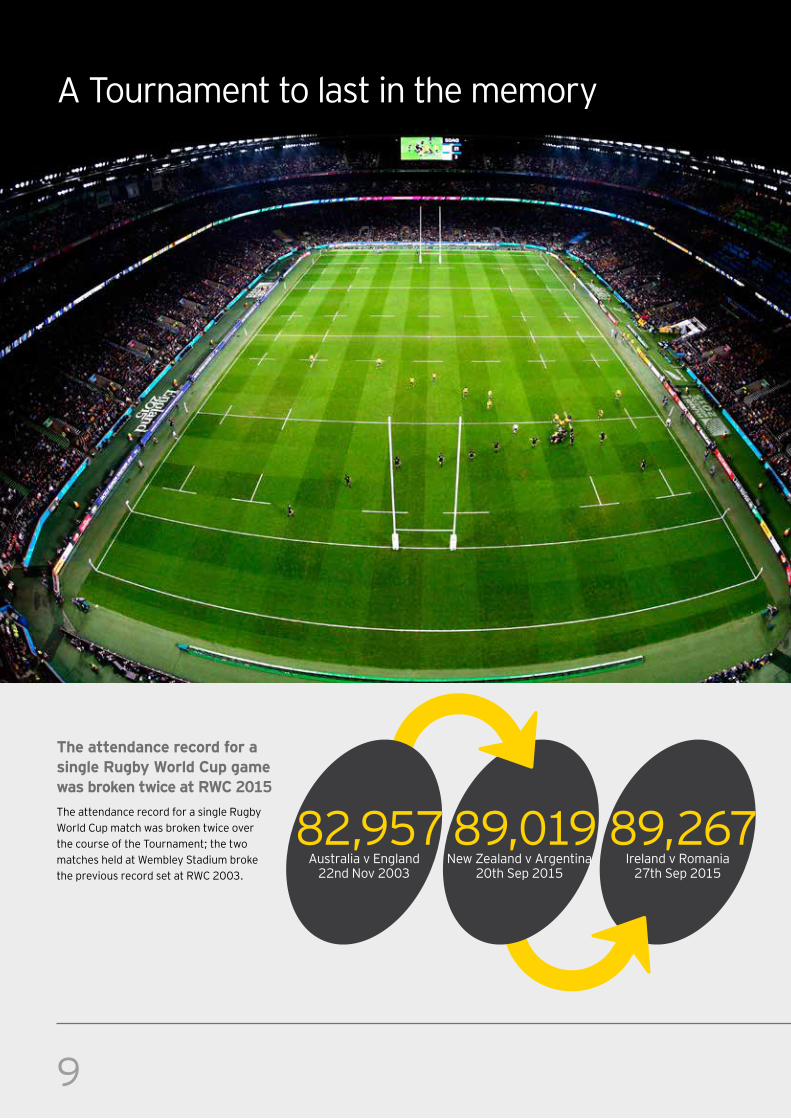
89,267I r el a nd v R om a ni a
27th Sep 2015
A T our na m ent to l a st i n th e m em or y
The attendance record for a s ingle Rugby World Cup game w as brok en tw ice at RWC 2015T h e a ttenda nc e r ec or d f or a si ng l e R ug b y W or l d C up m a tc h w a s b r ok en tw i c e over the course of the Tournament; the two matches held at Wembley Stadium broke the previous record set at RWC 2003.
89,019N ew Z ea l a nd v A r g enti na
20th Sep 2015
82,957A ustr a l i a v E ng l a nd
22nd Nov 2003
1 0The economic impact of Rugby World Cup 2015 | Post event study
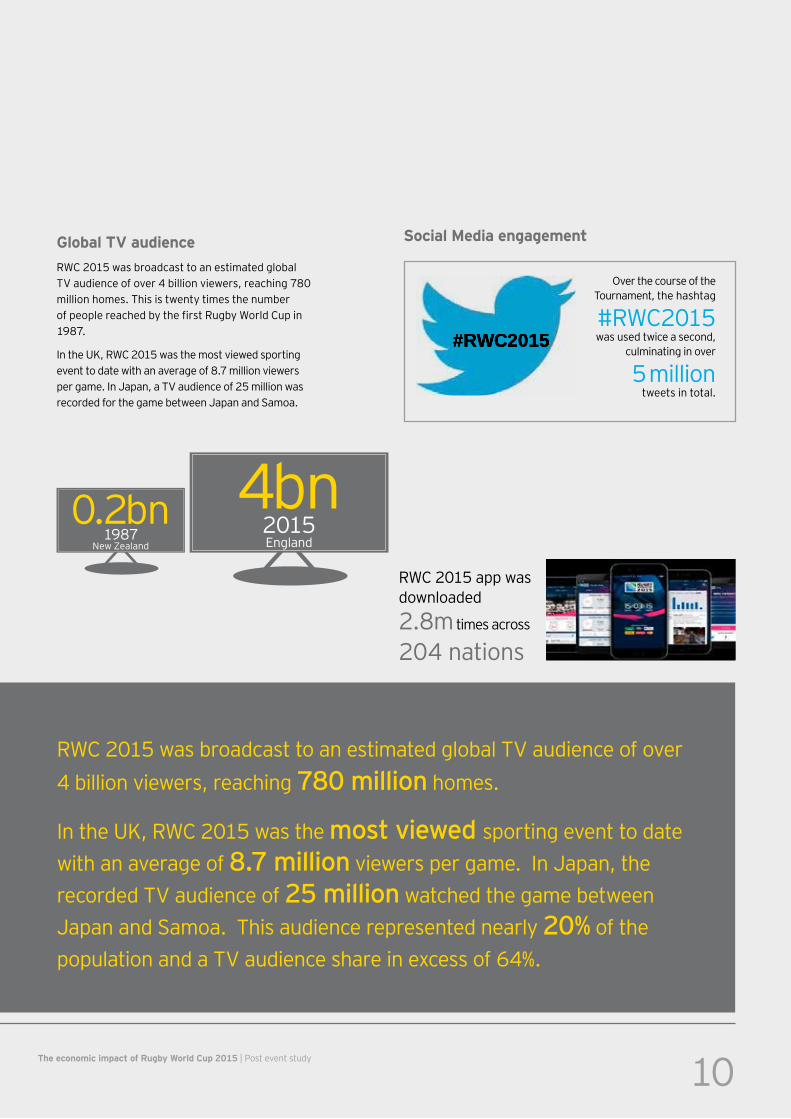
G lobal TV audienceRWC 2015 was broadcast to an estimated global TV audience of over 4 billion viewers, reaching 780 m i l l i on h om es. T h i s i s tw enty ti m es th e num b er of people reached by the first Rugby World Cup in 1987.
In the UK, RWC 2015 was the most viewed sporting event to date with an average of 8.7 million viewers per game. In Japan, a TV audience of 25 million was recorded for the game between Japan and Samoa.
S ocial M edia engagement
O ver th e c our se of th e T our na m ent, th e h a sh ta g
#RWC2015 w a s used tw i c e a sec ond,
c ul m i na ti ng i n over
5 m i l l i on tw eets i n tota l .
RWC 2015 app was dow nl oa ded
2.8m ti m es a c r oss
204 nations
RWC 2015 was broadcast to an estimated global TV audience of over 4 b i l l i on vi ew er s, r ea c h i ng 780 m illion h om es.
In the UK, RWC 2015 was the m ost v iew ed sp or ti ng event to da te w i th a n a ver a g e of 8. 7 m illion vi ew er s p er g a m e. I n J a p a n, th e recorded TV audience of 25 m illion w a tc h ed th e g a m e b etw een Japan and Samoa. This audience represented nearly 20% of th e population and a TV audience share in excess of 64%.
4 b n2015E ng l a nd
0.2bn1987
N ew Z ea l a nd
#RWC2015
1 1
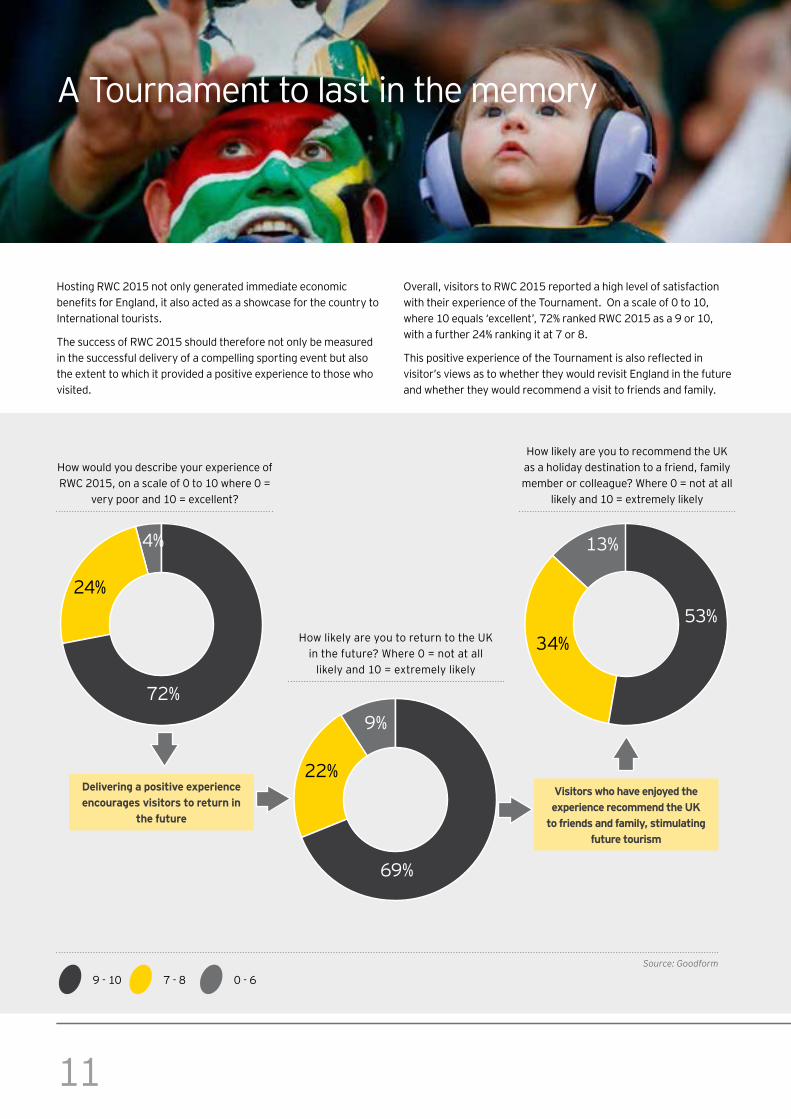
How likely are you to recommend the UK a s a h ol i da y desti na ti on to a f r i end, f a m i l y m em b er or c ol l ea g ue? W h er e 0 = not a t a l l
l i k el y a nd 1 0 = ex tr em el y l i k el y
Hosting RWC 2015 not only generated immediate economic benefits for England, it also acted as a showcase for the country to I nter na ti ona l tour i sts.
The success of RWC 2015 should therefore not only be measured i n th e suc c essf ul del i ver y of a c om p el l i ng sp or ti ng event b ut a l so th e ex tent to w h i c h i t p r ovi ded a p osi ti ve ex p er i enc e to th ose w h o vi si ted.
Overall, visitors to RWC 2015 reported a high level of satisfaction w i th th ei r ex p er i enc e of th e T our na m ent. O n a sc a l e of 0 to 1 0 , where 10 equals ‘excellent’, 72% ranked RWC 2015 as a 9 or 10, with a further 24% ranking it at 7 or 8.
This positive experience of the Tournament is also reflected in vi si tor ’ s vi ew s a s to w h eth er th ey w oul d r evi si t E ng l a nd i n th e f utur e a nd w h eth er th ey w oul d r ec om m end a vi si t to f r i ends a nd f a m i l y.
How would you describe your experience of RWC 2015, on a scale of 0 to 10 where 0 =
ver y p oor a nd 1 0 = ex c el l ent?
How likely are you to return to the UK i n th e f utur e? W h er e 0 = not a t a l l
l i k el y a nd 1 0 = ex tr em el y l i k el y
24%
72%
4%
22%
69%
9%
34% 53%
13%
9 - 10 7 - 8 0 - 6Source: Goodform
D eliv ering a pos itiv e ex perience encourages v is itors to return in
the future
V is itors w ho hav e enj oyed the ex perience recommend the U K
to friends and family, s timulating future touris m
A T our na m ent to l a st i n th e m em or y
The economic impact of Rugby World Cup 2015 12
Rugby World Cup 2015 in numbers
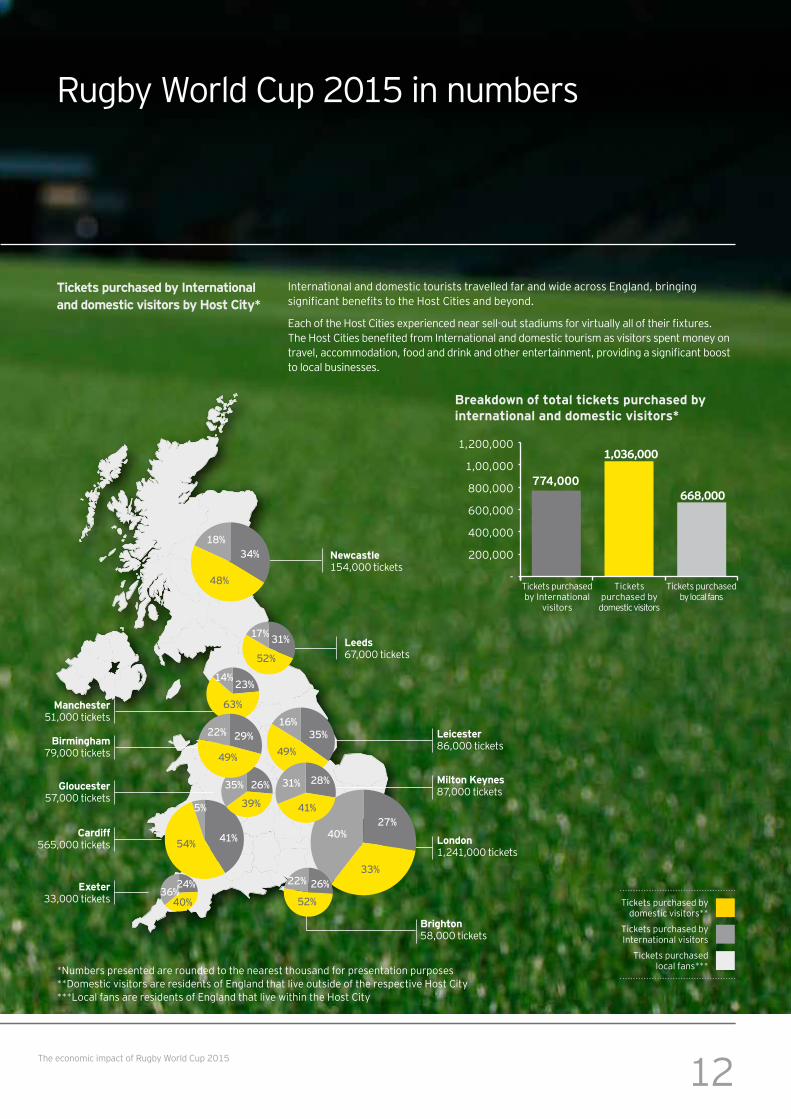
Tick ets purchas ed by I nternational and domes tic v is itors by H os t City*
B reak dow n of total tick ets purchas ed by international and domes tic v is itors *
I nter na ti ona l a nd dom esti c tour i sts tr a vel l ed f a r a nd w i de a c r oss E ng l a nd, b r i ng i ng significant benefits to the Host Cities and beyond.
Each of the Host Cities experienced near sell-out stadiums for virtually all of their fixtures. The Host Cities benefited from International and domestic tourism as visitors spent money on travel, accommodation, food and drink and other entertainment, providing a significant boost to l oc a l b usi nesses.
1,200,000
1 , 0 0 , 0 0 0
800,000
600,000
4 0 0 , 0 0 0
200,000
-T i c k ets p ur c h a sed b y I nter na ti ona l
vi si tor s
T i c k ets p ur c h a sed b y
dom esti c vi si tor s
T i c k ets p ur c h a sed b y l oc a l f a ns
7 7 4 , 000
1, 03 6 , 000
6 6 8 , 000
T i c k ets p ur c h a sed b y dom esti c vi si tor s* *
T i c k ets p ur c h a sed b y I nter na ti ona l vi si tor s
T i c k ets p ur c h a sed l oc a l f a ns* * *
N ew cas tle 154,000 tickets
L eices ter 86,000 tickets
M ilton K eynes 87,000 tickets
L ondon 1,241,000 tickets
E x eter 3 3 , 0 0 0 ti c k ets
Cardiff 565,000 tickets
G louces ter 57,000 tickets
B irmingham 79,000 tickets
M anches ter 51,000 tickets
B righton 58,000 tickets
18%
17%
23%
35%16%
31% 28%
14%
31%
52%
63%
49%
41%
33%
52%40%
22%36%
26%24%
34%
48%
L eeds 67,000 tickets
29%
26%35%
5%
41%27%
22%
49%
39%
54%40%
* N um b er s p r esented a r e r ounded to th e nea r est th ousa nd f or p r esenta ti on p ur p oses **Domestic visitors are residents of England that live outside of the respective Host City ***Local fans are residents of England that live within the Host City
O n a ver a g e, ea c h I nter na ti ona l vi si tor p ur c h a sed b etw een tw o a nd four ti c k ets
1 3
Attracting visitors to RWC 2015
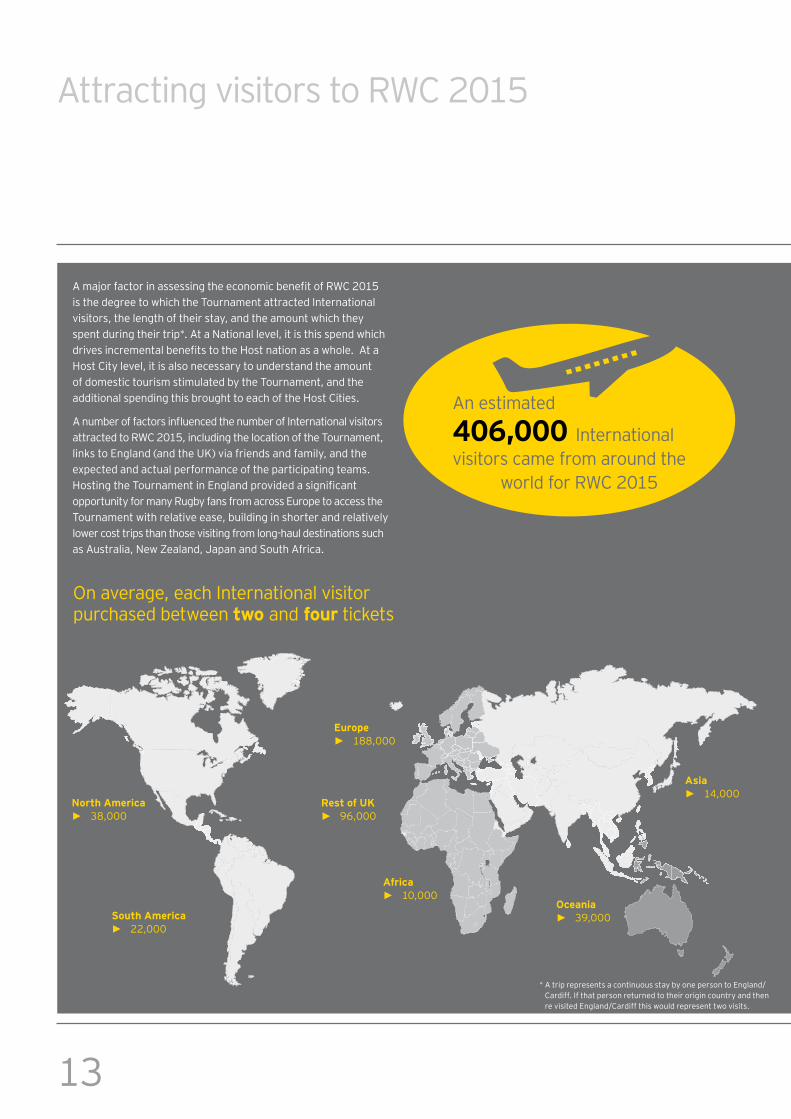
A major factor in assessing the economic benefit of RWC 2015 i s th e deg r ee to w h i c h th e T our na m ent a ttr a c ted I nter na ti ona l vi si tor s, th e l eng th of th ei r sta y, a nd th e a m ount w h i c h th ey sp ent dur i ng th ei r tr i p * . A t a N a ti ona l l evel , i t i s th i s sp end w h i c h drives incremental benefits to the Host nation as a whole. At a Host City level, it is also necessary to understand the amount of dom esti c tour i sm sti m ul a ted b y th e T our na m ent, a nd th e additional spending this brought to each of the Host Cities.
A number of factors influenced the number of International visitors attracted to RWC 2015, including the location of the Tournament, links to England (and the UK) via friends and family, and the ex p ec ted a nd a c tua l p er f or m a nc e of th e p a r ti c i p a ti ng tea m s. Hosting the Tournament in England provided a significant op p or tuni ty f or m a ny R ug b y f a ns f r om a c r oss E ur op e to a c c ess th e T our na m ent w i th r el a ti ve ea se, b ui l di ng i n sh or ter a nd r el a ti vel y l ow er c ost tr i p s th a n th ose vi si ti ng f r om l ong - h a ul desti na ti ons suc h as Australia, New Zealand, Japan and South Africa.
E urope ► 188,000
Res t of U K ► 96,000
A s ia ► 1 4 , 0 0 0
A frica ► 1 0 , 0 0 0
N orth A merica ► 38,000
S outh A merica ► 22,000
O ceania ► 39,000
* A trip represents a continuous stay by one person to England/C a r di f f . I f th a t p er son r etur ned to th ei r or i g i n c ountr y a nd th en re visited England/Cardiff this would represent two visits.
A n esti m a ted
4 06 , 000 I nter na ti ona l vi si tor s c a m e f r om a r ound th e world for RWC 2015
14The economic impact of Rugby World Cup 2015 | Post event study
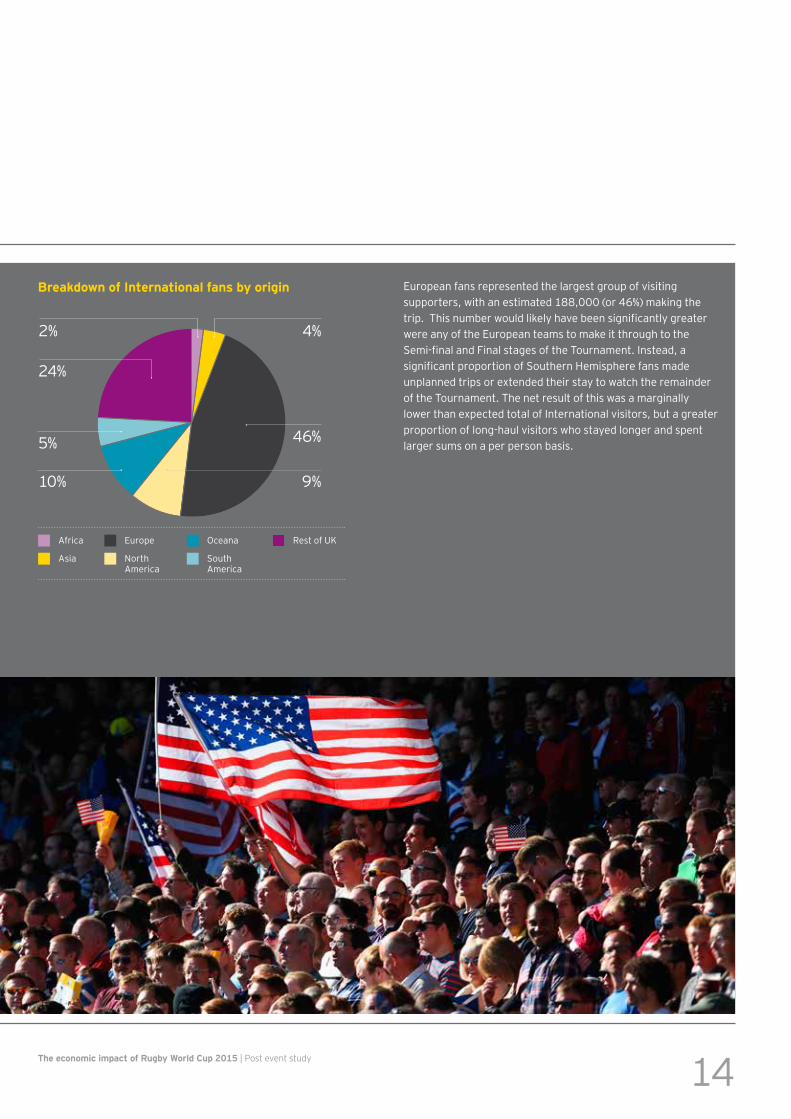
European fans represented the largest group of visiting supporters, with an estimated 188,000 (or 46%) making the trip. This number would likely have been significantly greater were any of the European teams to make it through to the Semi-final and Final stages of the Tournament. Instead, a significant proportion of Southern Hemisphere fans made unplanned trips or extended their stay to watch the remainder of the Tournament. The net result of this was a marginally lower than expected total of International visitors, but a greater proportion of long-haul visitors who stayed longer and spent larger sums on a per person basis.
4%2%
24%
5%
10%
46%
9%
Breakdown of International fans by origin
Africa Europe Oceana Rest of UK
Asia North America
South America
15
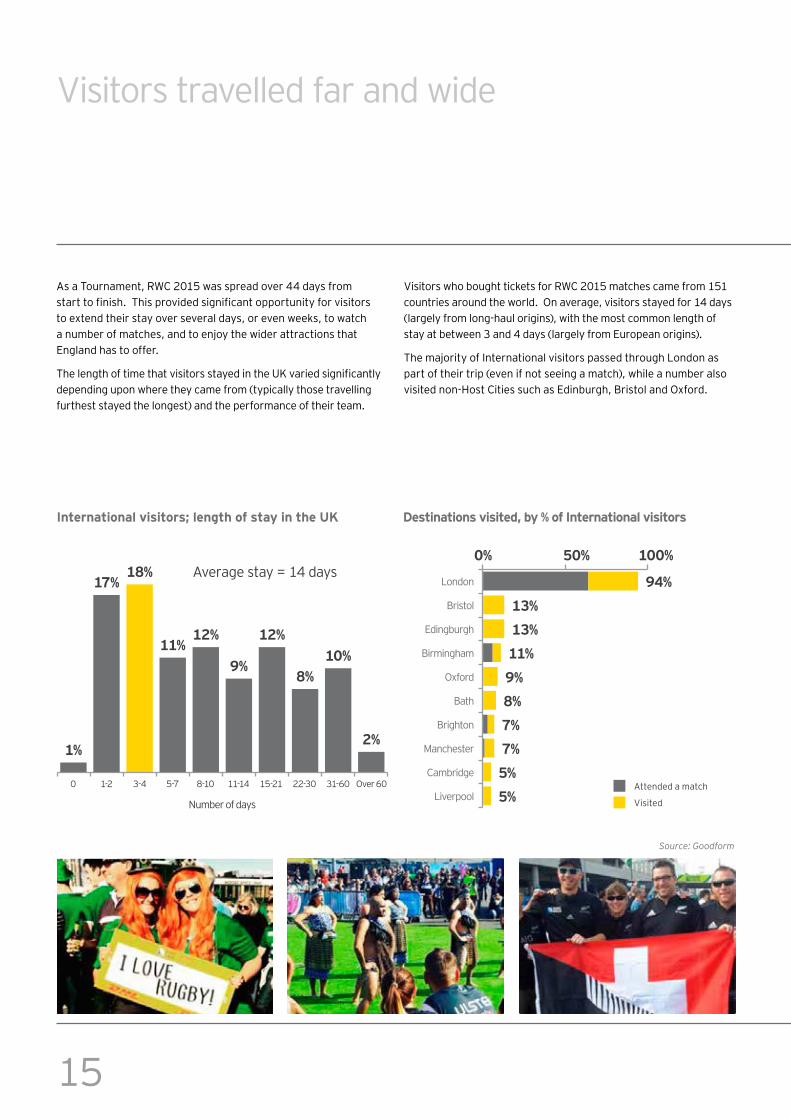
Visitors travelled far and wide
As a Tournament, RWC 2015 was spread over 44 days from start to finish. This provided significant opportunity for visitors to ex tend th ei r sta y over sever a l da ys, or even w eek s, to w a tc h a number of matches, and to enjoy the wider attractions that E ng l a nd h a s to of f er .
The length of time that visitors stayed in the UK varied significantly depending upon where they came from (typically those travelling furthest stayed the longest) and the performance of their team.
Visitors who bought tickets for RWC 2015 matches came from 151 c ountr i es a r ound th e w or l d. O n a ver a g e, vi si tor s sta yed f or 1 4 da ys (largely from long-haul origins), with the most common length of stay at between 3 and 4 days (largely from European origins).
The majority of International visitors passed through London as part of their trip (even if not seeing a match), while a number also visited non-Host Cities such as Edinburgh, Bristol and Oxford.
I nternational v is itors ; length of s tay in the U K D es tinations v is ited, by % of I nternational v is itors
A ttended a m a tc h
Visited
0 1-2 3 - 4 5-7 8-10 1 1 - 1 4
N um b er of da ys
London
B r i stol
E di ng b ur g h
B i r m i ng h a m
O x f or d
B a th
B r i g h ton
Manchester
C a m b r i dg e
Liverpool15-21 22-30 31-60 Over 60
18 %
2%
Source: Goodform
17 %
1%
11%12%
9 %
12%
8 %10%
0% 50%
9 4 %13 %13 %11%9 %8 %7 %7 %5%5%
100%A ver a g e sta y = 1 4 da ys
16The economic impact of Rugby World Cup 2015 | Post event study
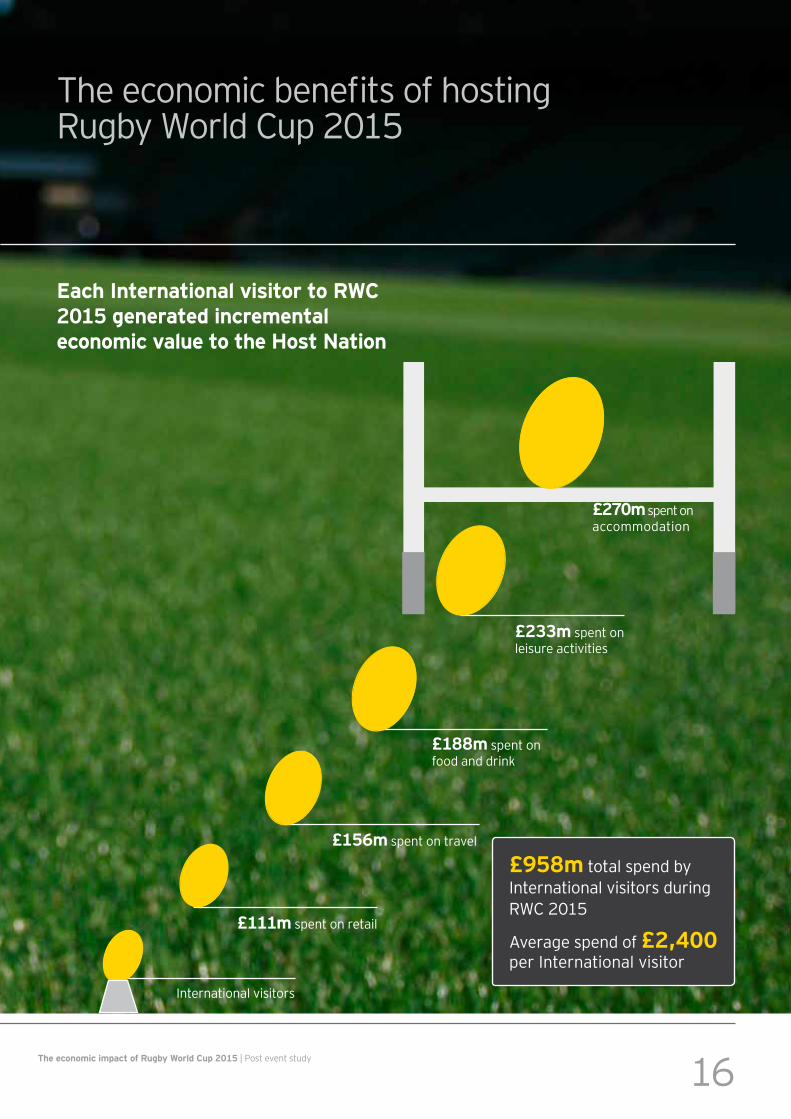
The economic benefits of hosting Rugby World Cup 2015
E ach I nternational v is itor to RWC 2015 generated incremental economic v alue to the H os t N ation
£ 9 58 m tota l sp end b y I nter na ti ona l vi si tor s dur i ng RWC 2015
A ver a g e sp end of £ 2, 4 00 p er I nter na ti ona l vi si tor
£ 27 0m sp ent on a c c om m oda ti on
£ 23 3 m sp ent on l ei sur e a c ti vi ti es
I nter na ti ona l vi si tor s
£ 111m sp ent on r eta i l
£ 156 m sp ent on tr a vel
£ 18 8 m sp ent on f ood a nd dr i nk
17
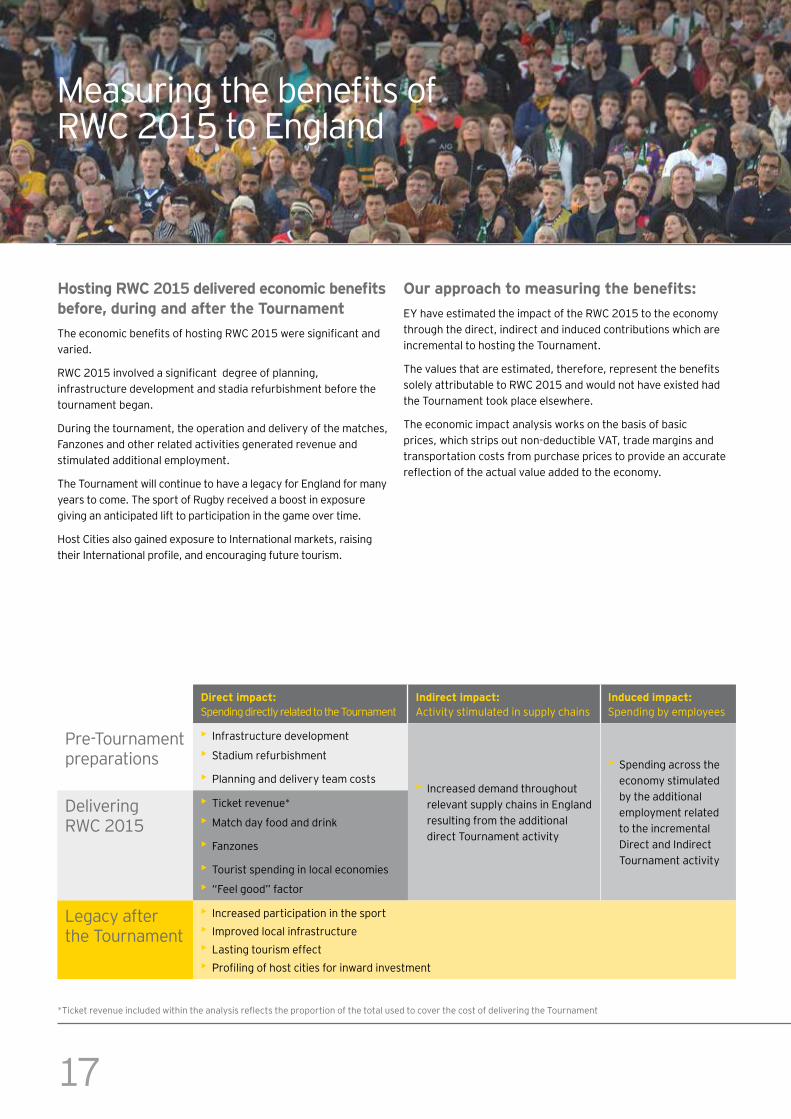
Measuring the benefits of RWC 2015 to England
Hosting RWC 2015 delivered economic benefits before, during and after the TournamentThe economic benefits of hosting RWC 2015 were significant and va r i ed.
RWC 2015 involved a significant degree of planning, i nf r a str uc tur e devel op m ent a nd sta di a r ef ur b i sh m ent b ef or e th e tour na m ent b eg a n.
D ur i ng th e tour na m ent, th e op er a ti on a nd del i ver y of th e m a tc h es, F a nz ones a nd oth er r el a ted a c ti vi ti es g ener a ted r evenue a nd sti m ul a ted a ddi ti ona l em p l oym ent.
T h e T our na m ent w i l l c onti nue to h a ve a l eg a c y f or E ng l a nd f or m a ny yea r s to c om e. T h e sp or t of R ug b y r ec ei ved a b oost i n ex p osur e g i vi ng a n a nti c i p a ted l i f t to p a r ti c i p a ti on i n th e g a m e over ti m e.
Host Cities also gained exposure to International markets, raising their International profile, and encouraging future tourism.
Our approach to measuring the benefits:EY have estimated the impact of the RWC 2015 to the economy th r oug h th e di r ec t, i ndi r ec t a nd i nduc ed c ontr i b uti ons w h i c h a r e i nc r em enta l to h osti ng th e T our na m ent.
The values that are estimated, therefore, represent the benefits solely attributable to RWC 2015 and would not have existed had th e T our na m ent took p l a c e el sew h er e.
T h e ec onom i c i m p a c t a na l ysi s w or k s on th e b a si s of b a si c prices, which strips out non-deductible VAT, trade margins and tr a nsp or ta ti on c osts f r om p ur c h a se p r i c es to p r ovi de a n a c c ur a te reflection of the actual value added to the economy.
Direct impact: Spending directly related to the Tournament
Indirect impact: A c ti vi ty sti m ul a ted i n sup p l y c h a i ns
Induced impact: Spending by employees
Pre-Tournament p r ep a r a ti ons
• I nf r a str uc tur e devel op m ent
• Stadium refurbishment
• Planning and delivery team c osts • I nc r ea sed dem a nd th r oug h out r el eva nt sup p l y c h a i ns i n E ng l a nd r esul ti ng f r om th e a ddi ti ona l di r ec t T our na m ent a c ti vi ty
• Spending across the ec onom y sti m ul a ted b y th e a ddi ti ona l em p l oym ent r el a ted to th e i nc r em enta l D i r ec t a nd I ndi r ec t T our na m ent a c ti vi ty
D el i ver i ng RWC 2015
• T i c k et r evenue*
• Match day food and drink
• F a nz ones
• T our i st sp endi ng i n l oc a l ec onom i es
• “ F eel g ood” f a c tor
Legacy after th e T our na m ent
• I nc r ea sed p a r ti c i p a ti on i n th e sp or t• I m p r oved l oc a l i nf r a str uc tur e• Lasting tourism effect• Profiling of host cities for inward investment
*Ticket revenue included within the analysis reflects the proportion of the total used to cover the cost of delivering the Tournament
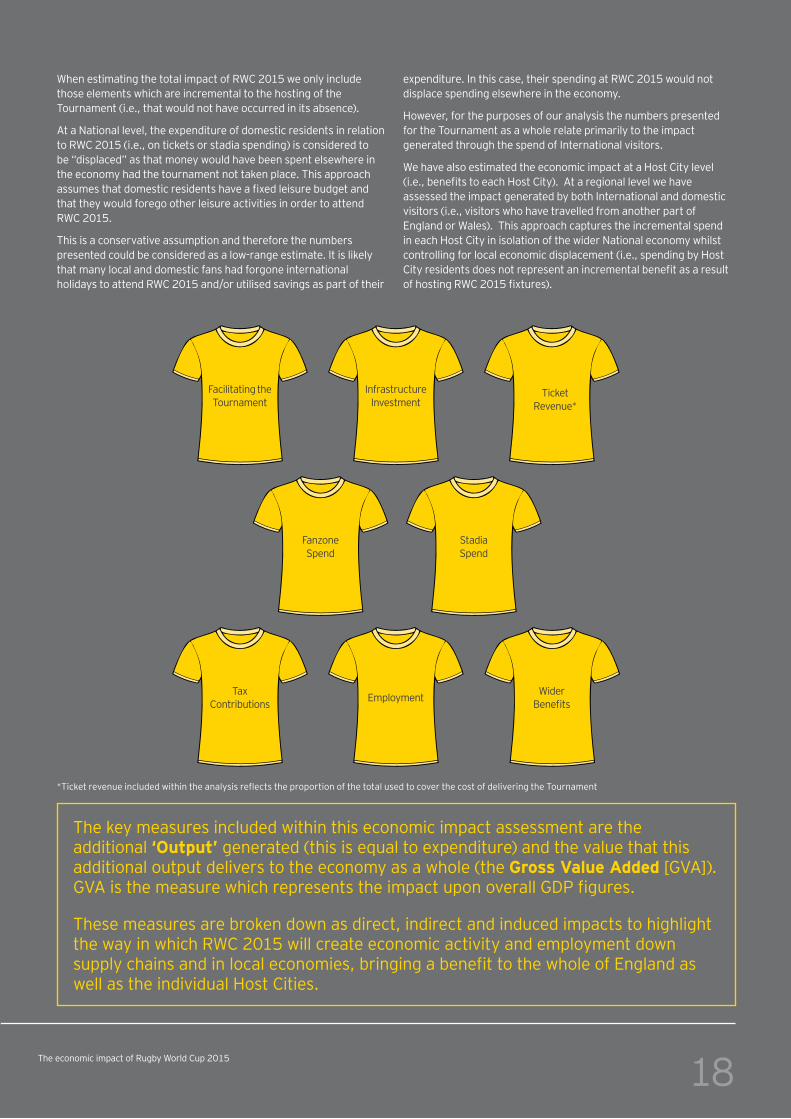
F a c i l i ta ti ng th e T our na m ent
I nf r a str uc tur e I nvestm ent
T i c k et R evenue*
F a nz one Spend
Stadia Spend
E m p l oym ent W i der Benefits
T a x C ontr i b uti ons
18The economic impact of Rugby World Cup 2015
When estimating the total impact of RWC 2015 we only include th ose el em ents w h i c h a r e i nc r em enta l to th e h osti ng of th e Tournament (i.e., that would not have occurred in its absence).
A t a N a ti ona l l evel , th e ex p endi tur e of dom esti c r esi dents i n r el a ti on to RWC 2015 (i.e., on tickets or stadia spending) is considered to b e “ di sp l a c ed” a s th a t m oney w oul d h a ve b een sp ent el sew h er e i n th e ec onom y h a d th e tour na m ent not ta k en p l a c e. T h i s a p p r oa c h assumes that domestic residents have a fixed leisure budget and th a t th ey w oul d f or eg o oth er l ei sur e a c ti vi ti es i n or der to a ttend RWC 2015.
T h i s i s a c onser va ti ve a ssum p ti on a nd th er ef or e th e num b er s p r esented c oul d b e c onsi der ed a s a l ow - r a ng e esti m a te. I t i s l i k el y th a t m a ny l oc a l a nd dom esti c f a ns h a d f or g one i nter na ti ona l holidays to attend RWC 2015 and/or utilised savings as part of their
expenditure. In this case, their spending at RWC 2015 would not di sp l a c e sp endi ng el sew h er e i n th e ec onom y.
However, for the purposes of our analysis the numbers presented f or th e T our na m ent a s a w h ol e r el a te p r i m a r i l y to th e i m p a c t g ener a ted th r oug h th e sp end of I nter na ti ona l vi si tor s.
We have also estimated the economic impact at a Host City level (i.e., benefits to each Host City). At a regional level we have a ssessed th e i m p a c t g ener a ted b y b oth I nter na ti ona l a nd dom esti c visitors (i.e., visitors who have travelled from another part of England or Wales). This approach captures the incremental spend in each Host City in isolation of the wider National economy whilst controlling for local economic displacement (i.e., spending by Host City residents does not represent an incremental benefit as a result of hosting RWC 2015 fixtures).
T h e k ey m ea sur es i nc l uded w i th i n th i s ec onom i c i m p a c t a ssessm ent a r e th e a ddi ti ona l ‘ O utput’ generated (this is equal to expenditure) and the value that this additional output delivers to the economy as a whole (the G ros s V alue A dded [GVA]). GVA is the measure which represents the impact upon overall GDP figures.
T h ese m ea sur es a r e b r ok en dow n a s di r ec t, i ndi r ec t a nd i nduc ed i m p a c ts to h i g h l i g h t the way in which RWC 2015 will create economic activity and employment down supply chains and in local economies, bringing a benefit to the whole of England as well as the individual Host Cities.
*Ticket revenue included within the analysis reflects the proportion of the total used to cover the cost of delivering the Tournament
19
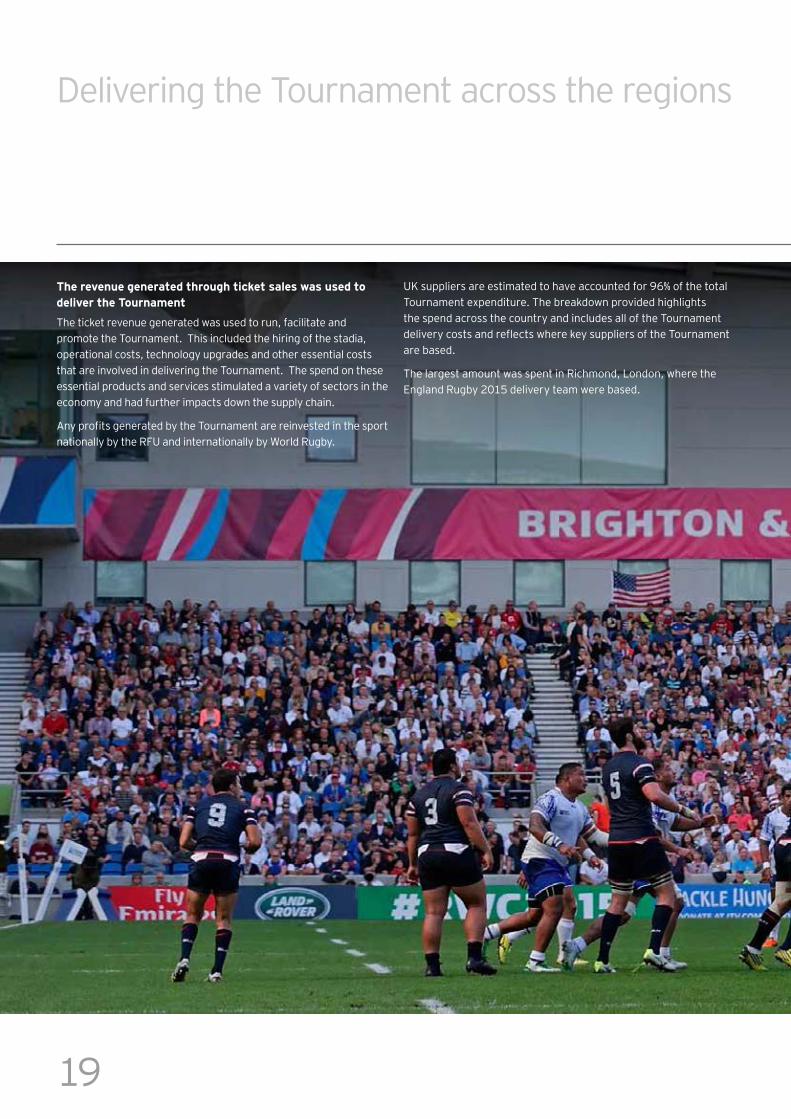
D el i ver i ng th e T our na m ent a c r oss th e r eg i ons
The rev enue generated through tick et s ales w as us ed to deliv er the Tournament
T h e ti c k et r evenue g ener a ted w a s used to r un, f a c i l i ta te a nd p r om ote th e T our na m ent. T h i s i nc l uded th e h i r i ng of th e sta di a , op er a ti ona l c osts, tec h nol og y up g r a des a nd oth er essenti a l c osts th a t a r e i nvol ved i n del i ver i ng th e T our na m ent. T h e sp end on th ese essenti a l p r oduc ts a nd ser vi c es sti m ul a ted a va r i ety of sec tor s i n th e ec onom y a nd h a d f ur th er i m p a c ts dow n th e sup p l y c h a i n.
Any profits generated by the Tournament are reinvested in the sport nationally by the RFU and internationally by World Rugby.
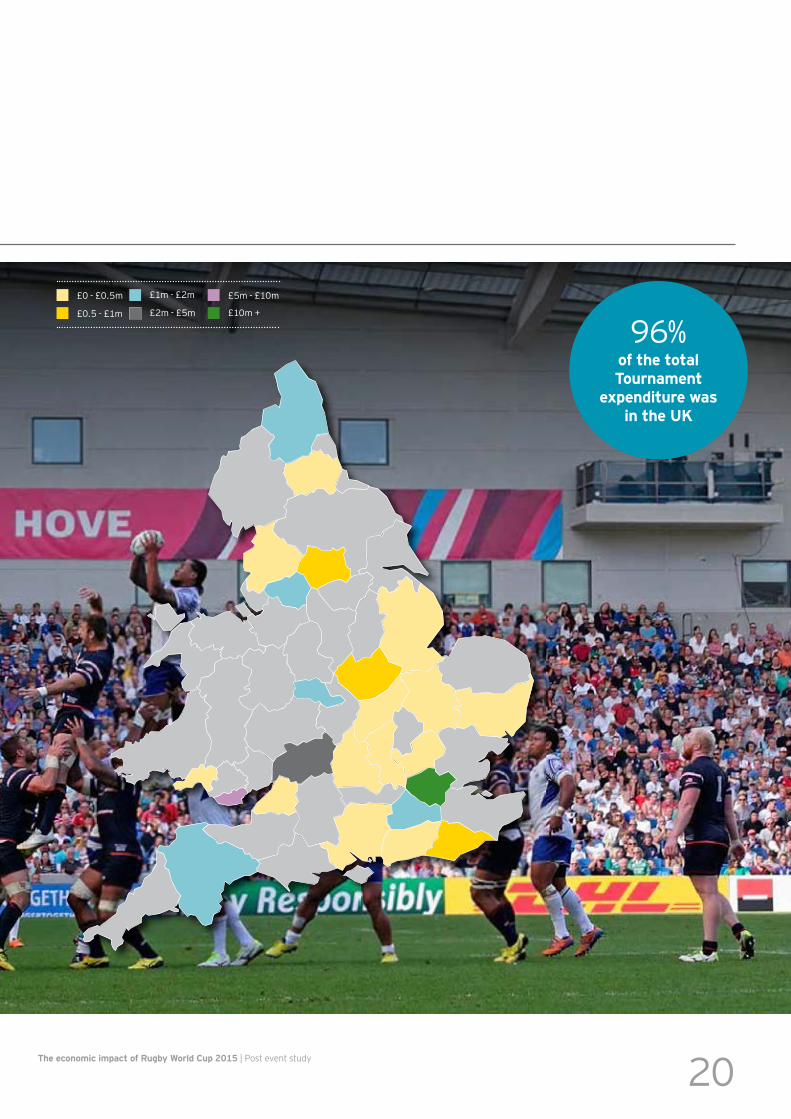
UK suppliers are estimated to have accounted for 96% of the total T our na m ent ex p endi tur e. T h e b r ea k dow n p r ovi ded h i g h l i g h ts th e sp end a c r oss th e c ountr y a nd i nc l udes a l l of th e T our na m ent delivery costs and reflects where key suppliers of the Tournament a r e b a sed.
The largest amount was spent in Richmond, London, where the England Rugby 2015 delivery team were based.
20The economic impact of Rugby World Cup 2015 | Post event study
96% of the total Tournament
ex penditure w as in the U K
£0 - £0.5m £1m - £2m £5m - £10m
£0.5 - £1m £2m - £5m £10m +
21
Fanzone and Host City spend
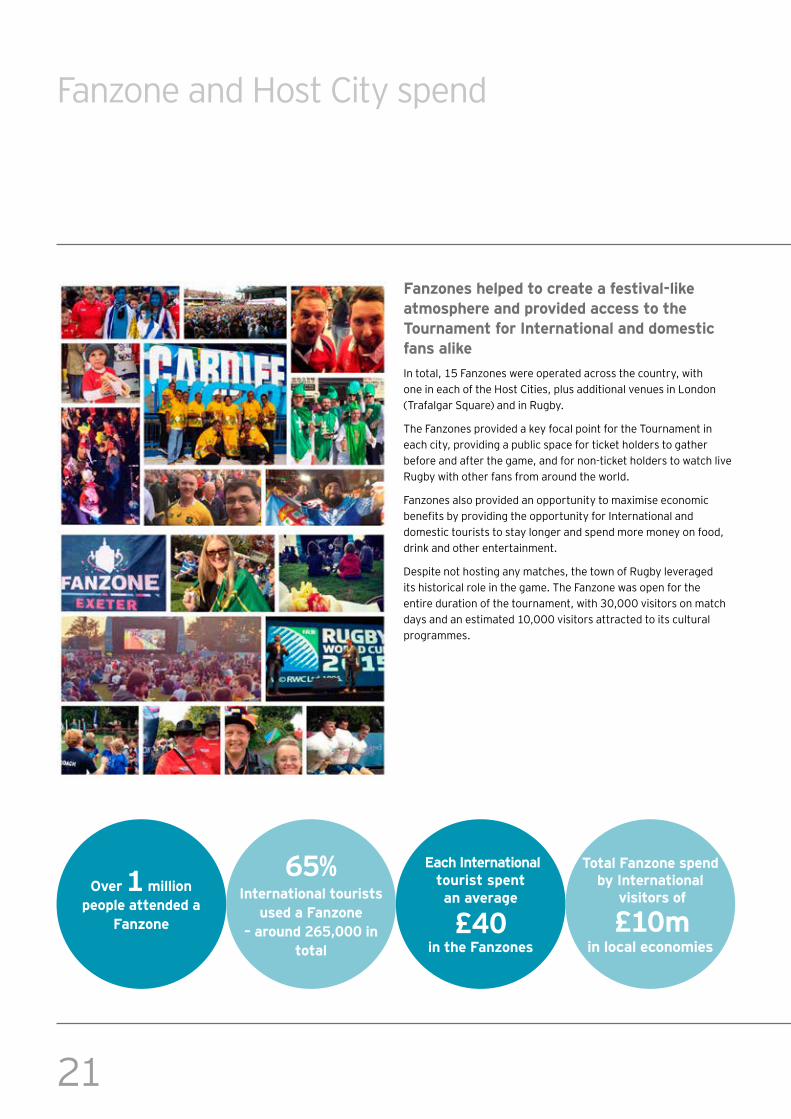
F anz ones helped to create a fes tiv al- lik e atmos phere and prov ided acces s to the Tournament for I nternational and domes tic fans alik eIn total, 15 Fanzones were operated across the country, with one in each of the Host Cities, plus additional venues in London (Trafalgar Square) and in Rugby.
T h e F a nz ones p r ovi ded a k ey f oc a l p oi nt f or th e T our na m ent i n ea c h c i ty, p r ovi di ng a p ub l i c sp a c e f or ti c k et h ol der s to g a th er b ef or e a nd a f ter th e g a m e, a nd f or non- ti c k et h ol der s to w a tc h l i ve R ug b y w i th oth er f a ns f r om a r ound th e w or l d.
F a nz ones a l so p r ovi ded a n op p or tuni ty to m a x i m i se ec onom i c benefits by providing the opportunity for International and dom esti c tour i sts to sta y l ong er a nd sp end m or e m oney on f ood, dr i nk a nd oth er enter ta i nm ent.
D esp i te not h osti ng a ny m a tc h es, th e tow n of R ug b y l ever a g ed i ts h i stor i c a l r ol e i n th e g a m e. T h e F a nz one w a s op en f or th e enti r e dur a ti on of th e tour na m ent, w i th 3 0 , 0 0 0 vi si tor s on m a tc h da ys a nd a n esti m a ted 1 0 , 0 0 0 vi si tor s a ttr a c ted to i ts c ul tur a l p r og r a m m es.
O v er 1 million people attended a
F anz one
6 5% I nternational touris ts
us ed a F anz one – around 26 5, 000 in
total
E ach I nternational touris t s pent an av erage
£ 4 0 in the F anz ones
Total F anz one s pend by I nternational
v is itors of
£ 10m in local economies

22The economic impact of Rugby World Cup 2015 | Post event study
--0
500
1,000
1,500
2,000
2,500
Direct Indirect Induced Total
millions
747
665
2,267
855
23
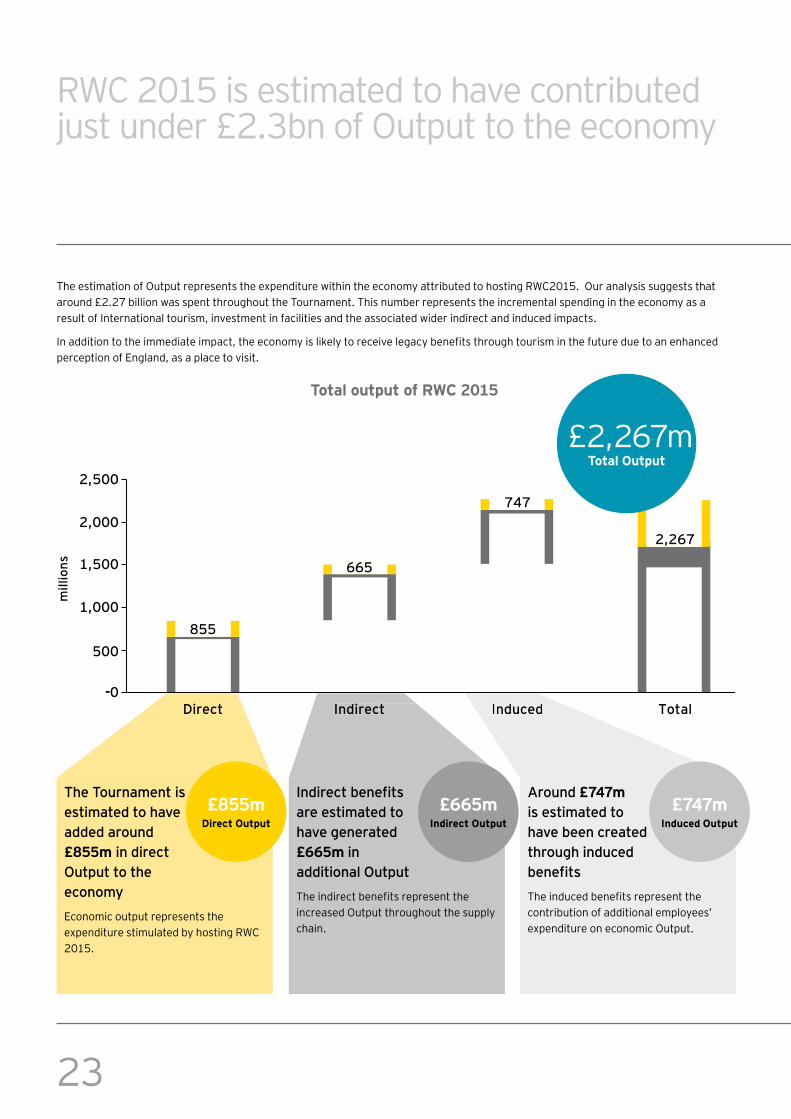
£2,267mTotal O utput
RWC 2015 is estimated to have contributed just under £2.3bn of Output to the economy
The estimation of Output represents the expenditure within the economy attributed to hosting RWC2015. Our analysis suggests that around £2.27 billion was spent throughout the Tournament. This number represents the incremental spending in the economy as a r esul t of I nter na ti ona l tour i sm , i nvestm ent i n f a c i l i ti es a nd th e a ssoc i a ted w i der i ndi r ec t a nd i nduc ed i m p a c ts.
In addition to the immediate impact, the economy is likely to receive legacy benefits through tourism in the future due to an enhanced p er c ep ti on of E ng l a nd, a s a p l a c e to vi si t.
Total output of RWC 2015
Direct
The Tourn am en t is estim ated to hav e added aroun d £ 8 55m in direct Output to the econ om yE c onom i c outp ut r ep r esents th e ex p endi tur e sti m ul a ted b y h osti ng R W C 2015.
£ 8 55mD irect O utput
t Induced
Aroun d £ 7 4 7 m is estim ated to hav e b een created throug h in duced benefitsThe induced benefits represent the c ontr i b uti on of a ddi ti ona l em p l oyees’ ex p endi tur e on ec onom i c O utp ut.
£ 7 4 7 mI nduced O utput
Indirect I
Indirect benefits are estim ated to hav e g en erated £ 6 6 5m in addition al OutputThe indirect benefits represent the i nc r ea sed O utp ut th r oug h out th e sup p l y c h a i n.
£ 6 6 5mI ndirect O utput
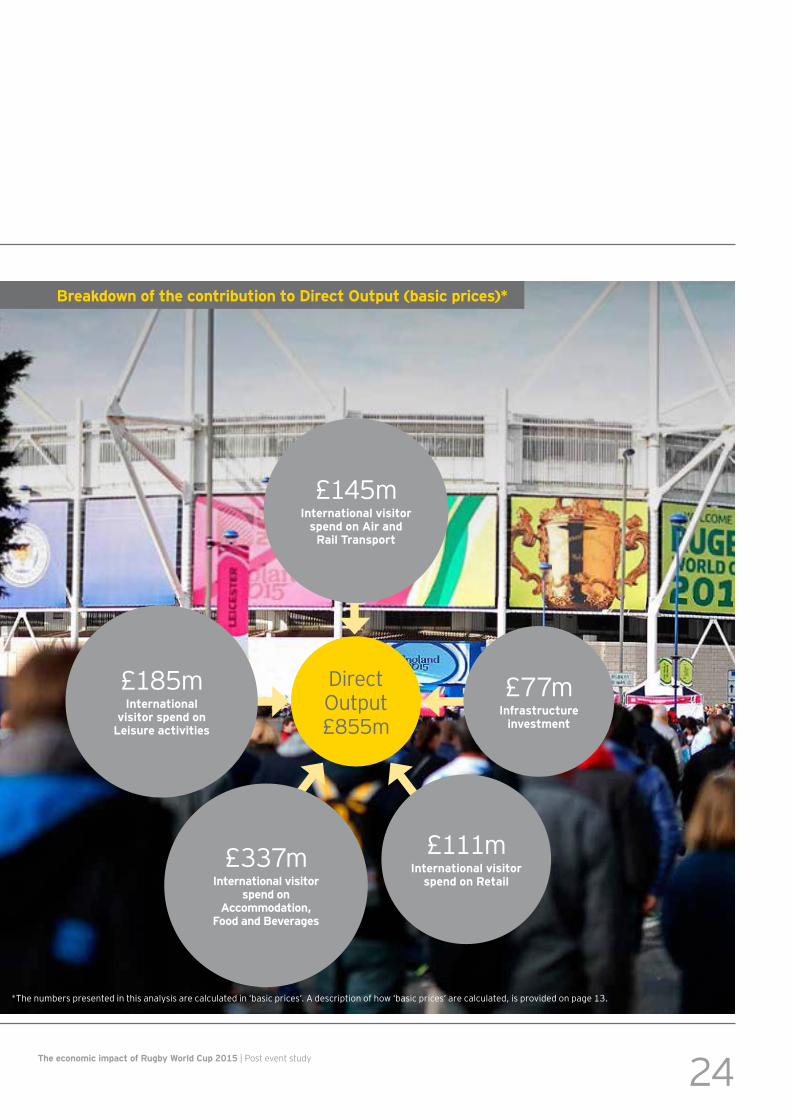
£111mI nternational v is itor
s pend on Retail£337m
I nternational v is itor s pend on
A ccommodation, F ood and B ev erages
D i r ec t O utp ut £855m
£145mI nternational v is itor
s pend on A ir and Rail Trans port
£185mI nternational
v is itor s pend on L eis ure activ ities
£77mI nfras tructure
inv es tment
24The economic impact of Rugby World Cup 2015 | Post event study
B reak dow n of the contribution to D irect O utput ( bas ic prices ) *
*The numbers presented in this analysis are calculated in ‘basic prices’. A description of how ‘basic prices’ are calculated, is provided on page 13.
*The numbers presented in this analysis are calculated in ‘basic prices’. A description of how ‘basic prices’ are calculated, is provided on page 13.
25
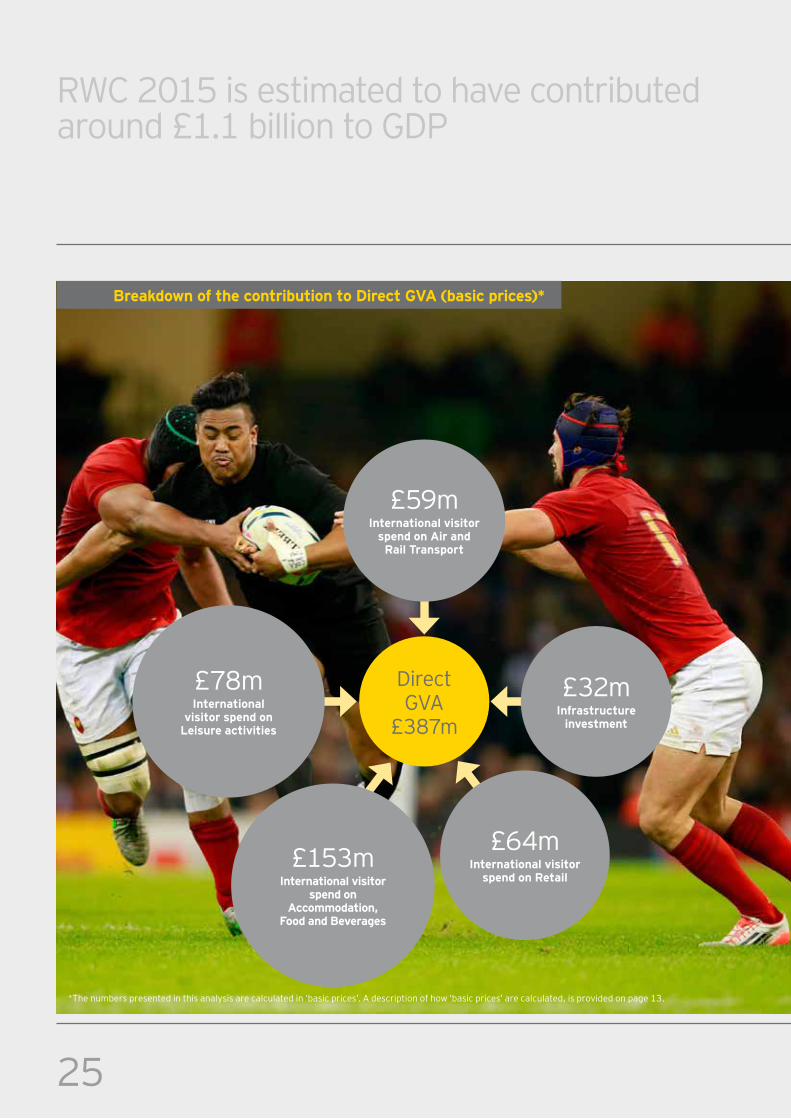
RWC 2015 is estimated to have contributed around £1.1 billion to GDP
Breakdown of the contribution to Direct GVA (basic prices)*
£153mInternational visitor
spend on Accommodation,
Food and Beverages
Direct GVA
£387m
£59mInternational visitor
spend on Air and Rail Transport
£78mInternational
visitor spend on Leisure activities
£32mInfrastructure
investment
£64mInternational visitor
spend on Retail
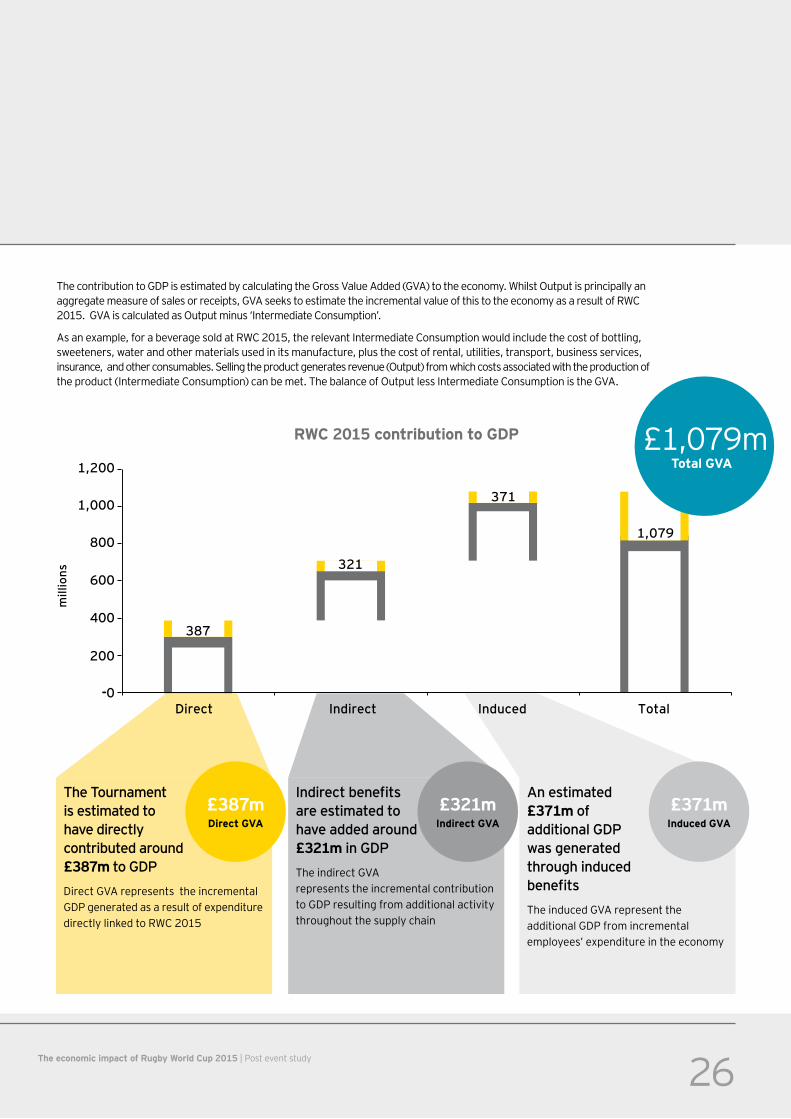
RWC 2015 contribution to G D P
The Tourn am en t is estim ated to hav e directly con trib uted aroun d £ 3 8 7 m to GD PDirect GVA represents the incremental GDP generated as a result of expenditure directly linked to RWC 2015
£ 3 8 7 mD irect G V A
An estim ated £ 3 7 1m of addition al GD P w as g en erated throug h in duced benefitsThe induced GVA represent the additional GDP from incremental em p l oyees’ ex p endi tur e i n th e ec onom y
£ 3 7 1mI nduced G V A
Indirect benefits are estim ated to hav e added aroun d £ 3 21m in GD PThe indirect GVA r ep r esents th e i nc r em enta l c ontr i b uti on to GDP resulting from additional activity th r oug h out th e sup p l y c h a i n
£ 3 21mI ndirect G V A
26The economic impact of Rugby World Cup 2015 | Post event study
The contribution to GDP is estimated by calculating the Gross Value Added (GVA) to the economy. Whilst Output is principally an aggregate measure of sales or receipts, GVA seeks to estimate the incremental value of this to the economy as a result of RWC 2015. GVA is calculated as Output minus ‘Intermediate Consumption’.
As an example, for a beverage sold at RWC 2015, the relevant Intermediate Consumption would include the cost of bottling, sw eetener s, w a ter a nd oth er m a ter i a l s used i n i ts m a nuf a c tur e, p l us th e c ost of r enta l , uti l i ti es, tr a nsp or t, b usi ness ser vi c es, insurance, and other consumables. Selling the product generates revenue (Output) from which costs associated with the production of the product (Intermediate Consumption) can be met. The balance of Output less Intermediate Consumption is the GVA.
--0
400
200
600
800
1,000
1,200
Direct Indirect Induced Total
millions
371
321
387
1,079
£1,079mTotal G V A
27
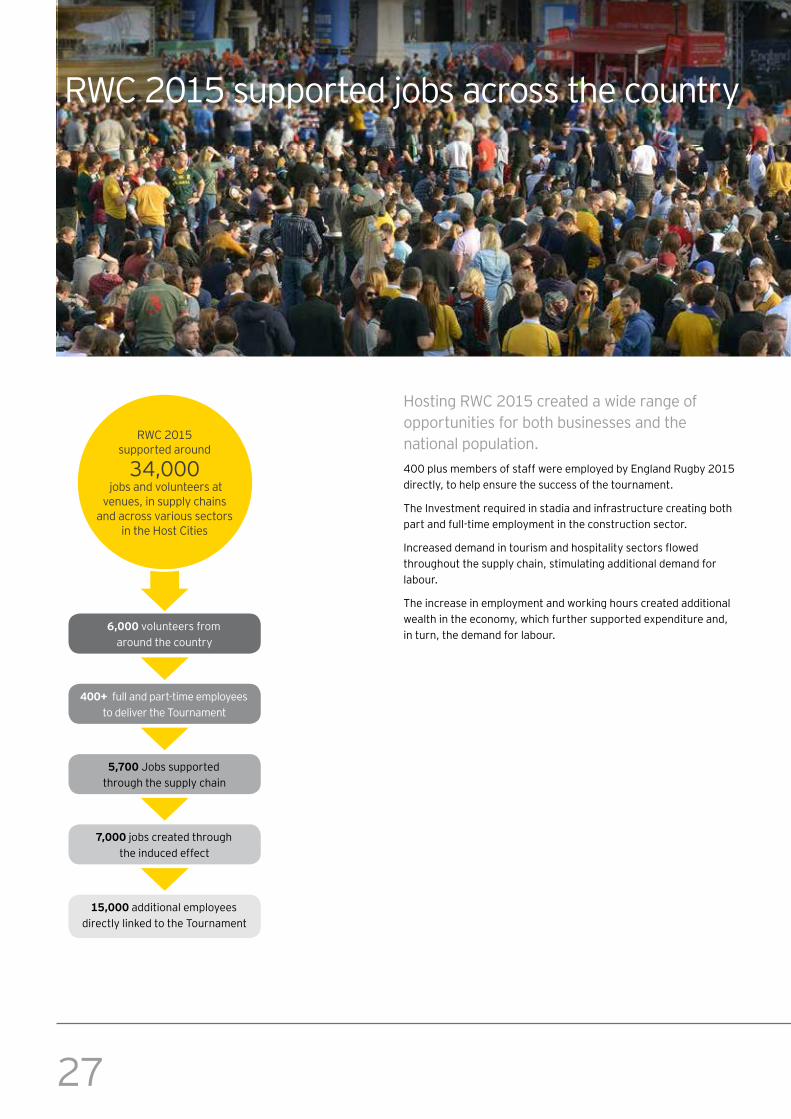
Hosting RWC 2015 created a wide range of op p or tuni ti es f or b oth b usi nesses a nd th e na ti ona l p op ul a ti on. 400 plus members of staff were employed by England Rugby 2015 di r ec tl y, to h el p ensur e th e suc c ess of th e tour na m ent.
T h e I nvestm ent r eq ui r ed i n sta di a a nd i nf r a str uc tur e c r ea ti ng b oth p a r t a nd f ul l - ti m e em p l oym ent i n th e c onstr uc ti on sec tor .
Increased demand in tourism and hospitality sectors flowed th r oug h out th e sup p l y c h a i n, sti m ul a ti ng a ddi ti ona l dem a nd f or l a b our .
T h e i nc r ea se i n em p l oym ent a nd w or k i ng h our s c r ea ted a ddi ti ona l w ea l th i n th e ec onom y, w h i c h f ur th er sup p or ted ex p endi tur e a nd, i n tur n, th e dem a nd f or l a b our .
RWC 2015 sup p or ted a r ound
3 4 , 0 0 0 jobs and volunteers at
venues, i n sup p l y c h a i ns a nd a c r oss va r i ous sec tor s
in the Host Cities
RWC 2015 supported jobs across the country
6 , 000 vol unteer s f r om a r ound th e c ountr y
4 00+ f ul l a nd p a r t- ti m e em p l oyees to del i ver th e T our na m ent
5, 7 00 J ob s sup p or ted th r oug h th e sup p l y c h a i n
7 , 000 jobs created through th e i nduc ed ef f ec t
15, 000 a ddi ti ona l em p l oyees di r ec tl y l i nk ed to th e T our na m ent
--0
100
50
150
200
250
300
Direct Indirect Induced Total
millions
93
82
102
277
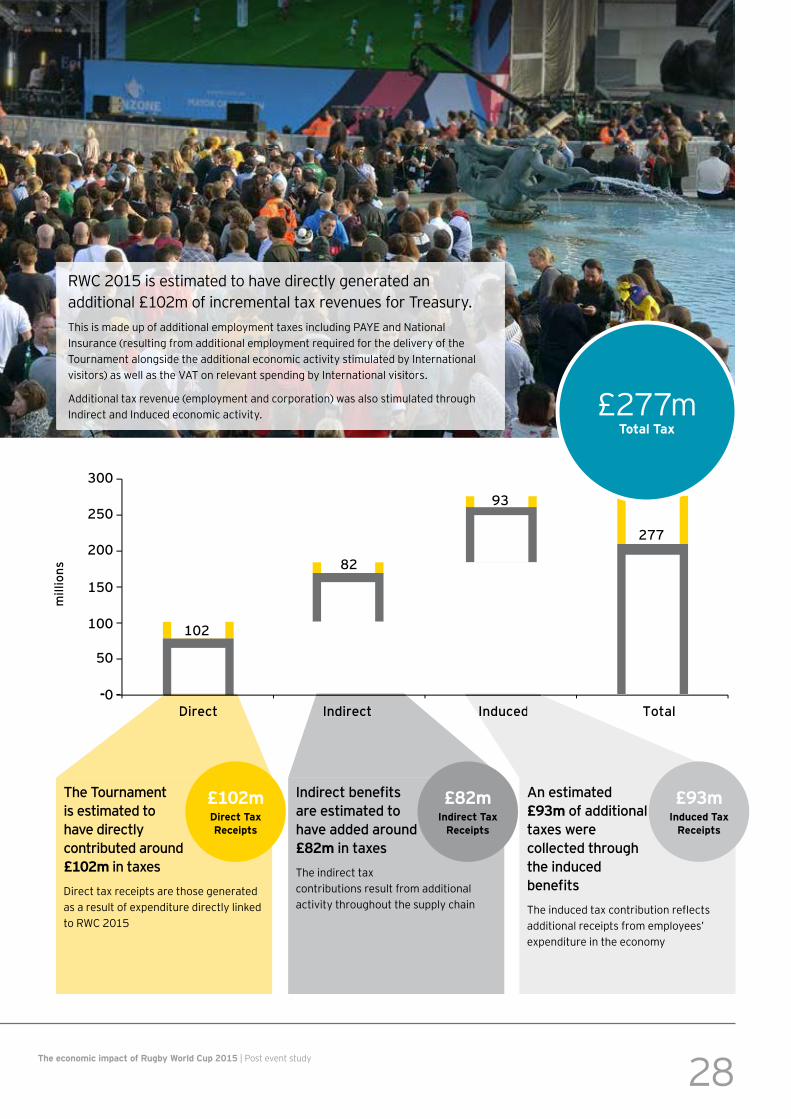
£277mTotal Tax
Direct
The Tourn am en t is estim ated to hav e directly con trib uted aroun d £ 102m in tax esD i r ec t ta x r ec ei p ts a r e th ose g ener a ted a s a r esul t of ex p endi tur e di r ec tl y l i nk ed to RWC 2015
£ 102mD irect Tax Receipts
Induced
An estim ated £ 9 3 m of addition al tax es w ere collected throug h the in duced benefitsThe induced tax contribution reflects a ddi ti ona l r ec ei p ts f r om em p l oyees’ ex p endi tur e i n th e ec onom y
£ 9 3 mI nduced Tax
Receipts
Indirect
Indirect benefits are estim ated to hav e added aroun d £ 8 2m in tax esT h e i ndi r ec t ta x c ontr i b uti ons r esul t f r om a ddi ti ona l a c ti vi ty th r oug h out th e sup p l y c h a i n
£ 8 2mI ndirect Tax
Receipts
28The economic impact of Rugby World Cup 2015 | Post event study
RWC 2015 is estimated to have directly generated an additional £102m of incremental tax revenues for Treasury. This is made up of additional employment taxes including PAYE and National Insurance (resulting from additional employment required for the delivery of the T our na m ent a l ong si de th e a ddi ti ona l ec onom i c a c ti vi ty sti m ul a ted b y I nter na ti ona l visitors) as well as the VAT on relevant spending by International visitors.
Additional tax revenue (employment and corporation) was also stimulated through I ndi r ec t a nd I nduc ed ec onom i c a c ti vi ty.
29
Legacy of Rugby World Cup 2015
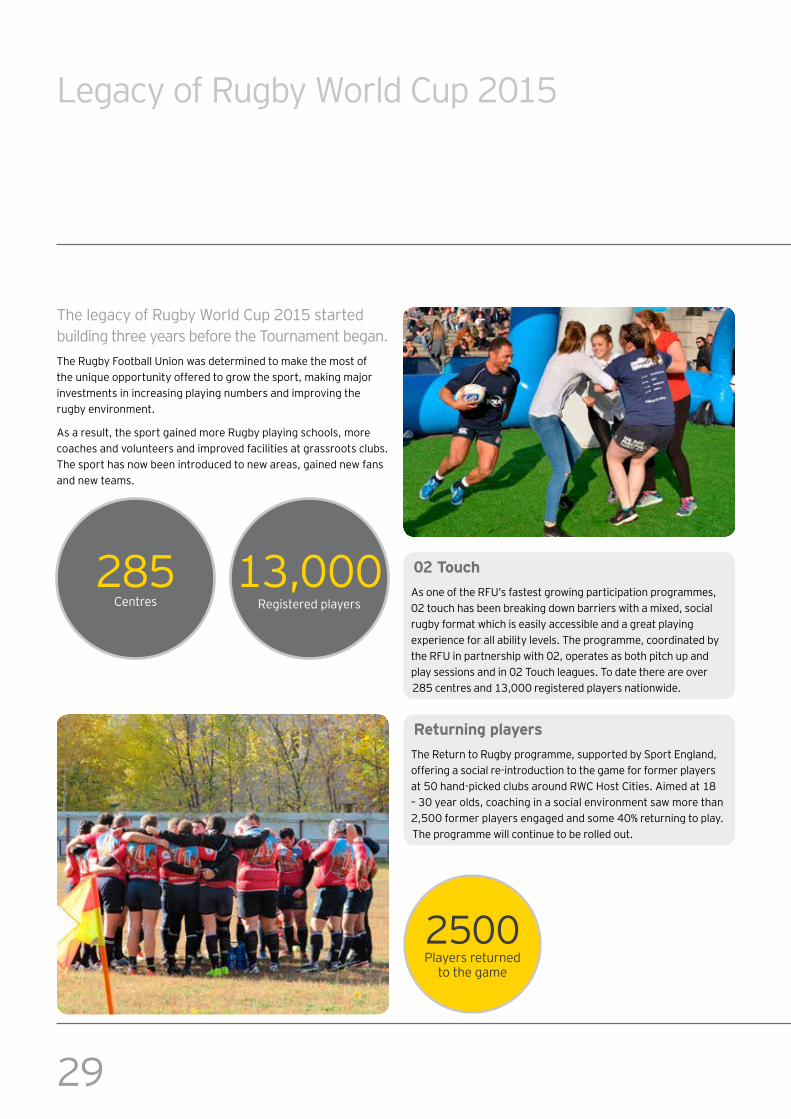
The legacy of Rugby World Cup 2015 started b ui l di ng th r ee yea r s b ef or e th e T our na m ent b eg a n. The Rugby Football Union was determined to make the most of the unique opportunity offered to grow the sport, making major i nvestm ents i n i nc r ea si ng p l a yi ng num b er s a nd i m p r ovi ng th e r ug b y envi r onm ent.
A s a r esul t, th e sp or t g a i ned m or e R ug b y p l a yi ng sc h ool s, m or e c oa c h es a nd vol unteer s a nd i m p r oved f a c i l i ti es a t g r a ssr oots c l ub s. T h e sp or t h a s now b een i ntr oduc ed to new a r ea s, g a i ned new f a ns a nd new tea m s.
Returning playersThe Return to Rugby programme, supported by Sport England, of f er i ng a soc i a l r e- i ntr oduc ti on to th e g a m e f or f or m er p l a yer s at 50 hand-picked clubs around RWC Host Cities. Aimed at 18 – 3 0 yea r ol ds, c oa c h i ng i n a soc i a l envi r onm ent sa w m or e th a n 2,500 former players engaged and some 40% returning to play. T h e p r og r a m m e w i l l c onti nue to b e r ol l ed out.
02 Touch As one of the RFU’s fastest growing participation programmes, 02 touch has been breaking down barriers with a mixed, social r ug b y f or m a t w h i c h i s ea si l y a c c essi b l e a nd a g r ea t p l a yi ng ex p er i enc e f or a l l a b i l i ty l evel s. T h e p r og r a m m e, c oor di na ted b y the RFU in partnership with 02, operates as both pitch up and play sessions and in 02 Touch leagues. To date there are over 285 centres and 13,000 registered players nationwide.
285 C entr es
1 3 , 0 0 0 R eg i ster ed p l a yer s
2500Players returned
to th e g a m e
3 0The economic impact of Rugby World Cup 2015 | Post event study
Getting involved
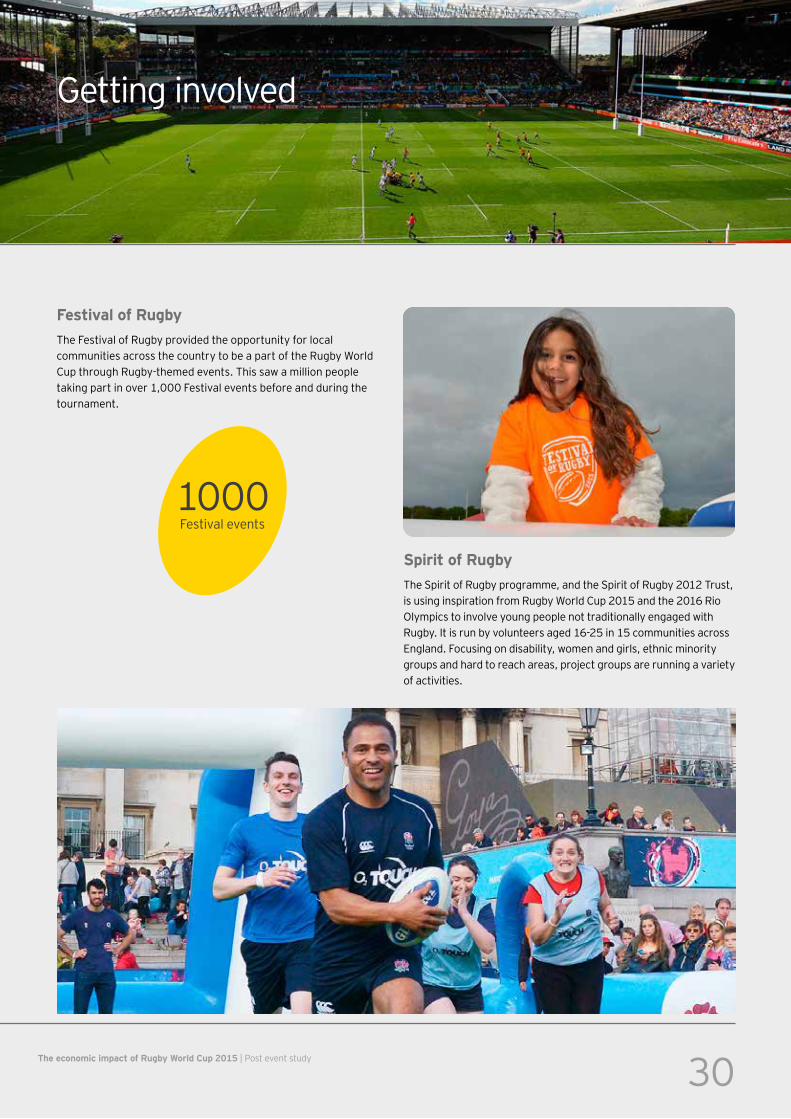
F es tiv al of RugbyT h e F esti va l of R ug b y p r ovi ded th e op p or tuni ty f or l oc a l c om m uni ti es a c r oss th e c ountr y to b e a p a r t of th e R ug b y W or l d C up th r oug h R ug b y- th em ed events. T h i s sa w a m i l l i on p eop l e ta k i ng p a r t i n over 1 , 0 0 0 F esti va l events b ef or e a nd dur i ng th e tour na m ent.
S pirit of RugbyThe Spirit of Rugby programme, and the Spirit of Rugby 2012 Trust, is using inspiration from Rugby World Cup 2015 and the 2016 Rio O l ym p i c s to i nvol ve young p eop l e not tr a di ti ona l l y eng a g ed w i th Rugby. It is run by volunteers aged 16-25 in 15 communities across E ng l a nd. F oc usi ng on di sa b i l i ty, w om en a nd g i r l s, eth ni c m i nor i ty groups and hard to reach areas, project groups are running a variety of a c ti vi ti es.
1 0 0 0F esti va l events
3 1
I nvesti ng i n th e g a m e
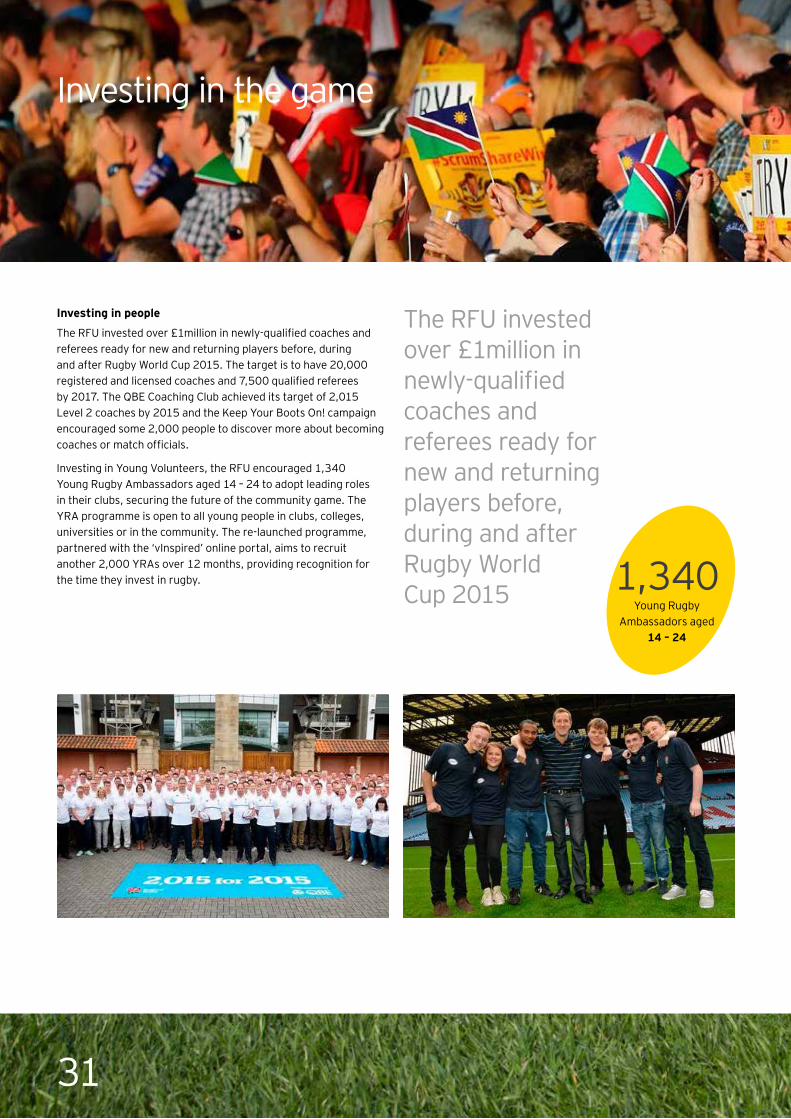
I nv es ting in people
The RFU invested over £1million in newly-qualified coaches and r ef er ees r ea dy f or new a nd r etur ni ng p l a yer s b ef or e, dur i ng and after Rugby World Cup 2015. The target is to have 20,000 registered and licensed coaches and 7,500 qualified referees by 2017. The QBE Coaching Club achieved its target of 2,015 Level 2 coaches by 2015 and the Keep Your Boots On! campaign encouraged some 2,000 people to discover more about becoming coaches or match officials.
Investing in Young Volunteers, the RFU encouraged 1,340 Young Rugby Ambassadors aged 14 – 24 to adopt leading roles i n th ei r c l ub s, sec ur i ng th e f utur e of th e c om m uni ty g a m e. T h e Y R A p r og r a m m e i s op en to a l l young p eop l e i n c l ub s, c ol l eg es, uni ver si ti es or i n th e c om m uni ty. T h e r e- l a unc h ed p r og r a m m e, partnered with the ‘vInspired’ online portal, aims to recruit another 2,000 YRAs over 12 months, providing recognition for th e ti m e th ey i nvest i n r ug b y.
The RFU invested over £1million in newly-qualified c oa c h es a nd r ef er ees r ea dy f or new a nd r etur ni ng p l a yer s b ef or e, dur i ng a nd a f ter R ug b y W or l d Cup 2015 1 , 3 4 0
Y oung R ug b y A m b a ssa dor s a g ed
14 – 24
32The economic impact of Rugby World Cup 2015
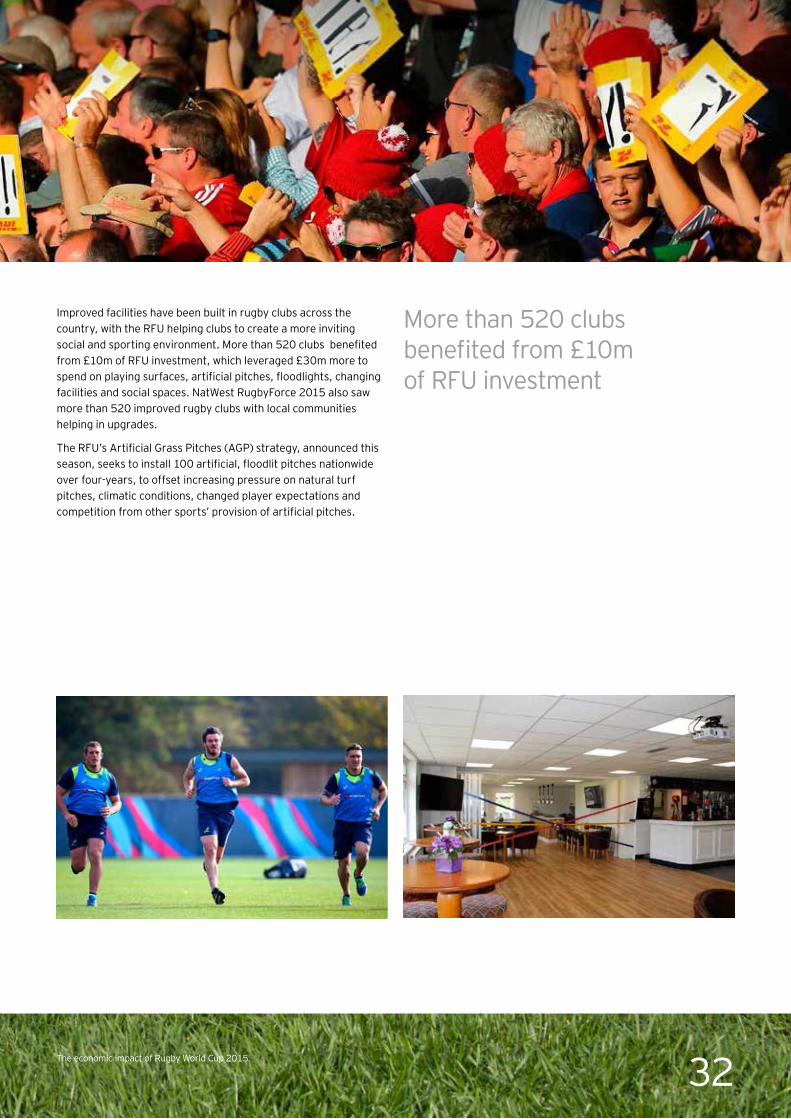
I m p r oved f a c i l i ti es h a ve b een b ui l t i n r ug b y c l ub s a c r oss th e country, with the RFU helping clubs to create a more inviting social and sporting environment. More than 520 clubs benefited from £10m of RFU investment, which leveraged £30m more to spend on playing surfaces, artificial pitches, floodlights, changing facilities and social spaces. NatWest RugbyForce 2015 also saw more than 520 improved rugby clubs with local communities h el p i ng i n up g r a des.
The RFU’s Artificial Grass Pitches (AGP) strategy, announced this season, seeks to install 100 artificial, floodlit pitches nationwide over f our - yea r s, to of f set i nc r ea si ng p r essur e on na tur a l tur f p i tc h es, c l i m a ti c c ondi ti ons, c h a ng ed p l a yer ex p ec ta ti ons a nd competition from other sports’ provision of artificial pitches.
More than 520 clubs benefited from £10m of RFU investment
3 3
Introducing the benefits to Host Cities
One of the major successes of the Tournament was that the positive economic and tourism benefits were felt across the country and, in particular, at the Host Cities. The rest of this report focusses on the contribution of RWC 2015 to those cities.
I t sh oul d b e noted th a t i t i s not p ossi b l e to di r ec tl y c om p a r e th e ec onom i c i m p a c ts esti m a ted a t th e N a ti ona l l evel w i th th ose estimated for Host Cities (i.e., the Host City totals will not sum to the National total). At a National level, total additional economic output was calculated at around £2.3 billion; the total benefit for the Host Cities is calculated at just under £2 billion.
T h i s di f f er enc e i s b ec a use th e l oc a l i sed a na l ysi s seek s to q ua nti f y only those benefits which remain within the area whereas the National level analysis incorporates the Host City benefits plus those that are realised elsewhere in the country (as a result of w h er e sup p l y c h a i ns a r e b a sed or b ec a use vi si tor s sp ent ti m e a nd money outside of those Host Cities).
Additionally, at the Host City level, we have included the contribution made by domestic tourism (i.e., English residents travelling to a Host City from another part of the country), which is c onsi der ed a s di sp l a c em ent a t th e N a ti ona l l evel .
H ow are the regional effects calculated?Tournament deliv ery s pend
Spending by RWC 2015 to deliver the Tournament at a local level.
Touris m s pend
In order to calculate the direct Host City impacts, we have to account for where tourists spent their time during RWC 2015. We do this by capturing both the time spent in the Host City on match day (for those with tickets) plus time spent during their wider stay in England. For example, 6% of international respondents chose to visit Manchester whilst in England, despite not having a ticket for the game that was played in Manchester (England vs Uruguay). Having estimated the total amount of time spent in the city, it is then possible to calculate spending on a c c om m oda ti on, f ood, enter ta i nm ent, r eta i l a nd tr a vel a c c or di ng l y.
F lightsOur analysis includes spend on international flights by visitors to England. The value of this spend was accounted for at the point of entry. Therefore Host Cities with major international airports such as London, Birmingham, Manchester and Newcastle will have benefitted from this additional activity.
D omes tic touris ts
For the Host City impacts, spend associated with trips made by domestic residents from outside the Host C i ty w er e i nc l uded a s p a r t of th e i nc r em enta l i m p a c t to th e C i ty. A t th e N a ti ona l l evel th i s w a s c onsi der ed a s di sp l a c ed a c ti vi ty a nd ex c l uded f r om our c a l c ul a ti on.
L ocal M ultipliers
The impact assessment methodology calculates the money that flows through the supply chain within a given region. Spend on suppliers that are located outside the region is considered as a leakage of economic value. For example, a stadium in Exeter may use suppliers who are based outside of the city; in this case any of these associated benefits would not be included within the Host City assessment.
T h i s ex p l a i ns w h y th e i ndi r ec t a nd i nduc ed ef f ec ts w i l l b e l ess p r onounc ed th a n a t th e N a ti ona l l evel , a s typ i c a l l y regional multipliers are lower than National multipliers (leakage is lower at a national level than at a regional level). We have calculated economic multipliers for the region that each Host City is based in, meaning that the effect of leakages will be specific to the actual local economy (and therefore may be higher or lower depending upon location).
3 4The economic impact of Rugby World Cup 2015 | Post event study
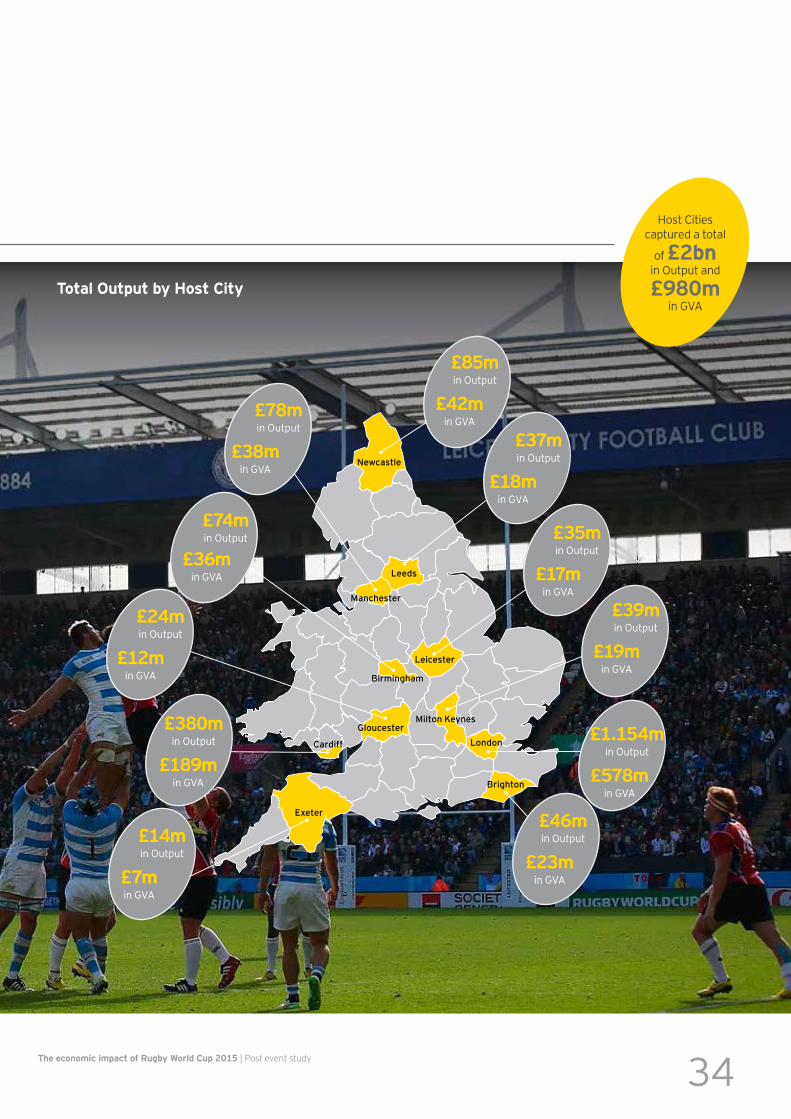
Total O utput by H os t City
New castle
Leeds
M an chester
Leicester
M ilton Keyn es
Lon don
Brig hton
Ex eter
Cardif f
Gloucester
Birm in g ham
£ 8 5mi n O utp ut
£ 3 9 mi n O utp ut
£ 1. 154 mi n O utp ut
£ 4 6 mi n O utp ut£ 14 m
i n O utp ut
£ 3 8 0mi n O utp ut
£ 24 mi n O utp ut
£ 7 4 mi n O utp ut
£ 7 8 mi n O utp ut
£ 3 5mi n O utp ut
£ 3 7 mi n O utp ut
Host Cities c a p tur ed a tota l
of £ 2bn i n O utp ut a nd
£ 9 8 0m in GVA
£ 4 2min GVA
£ 18 min GVA
£ 17 min GVA
£ 19 min GVA
£ 57 8 min GVA
£ 23 min GVA£ 7 m
in GVA
£ 18 9 min GVA
£ 3 6 min GVA
£ 3 8 min GVA
£ 12min GVA
35
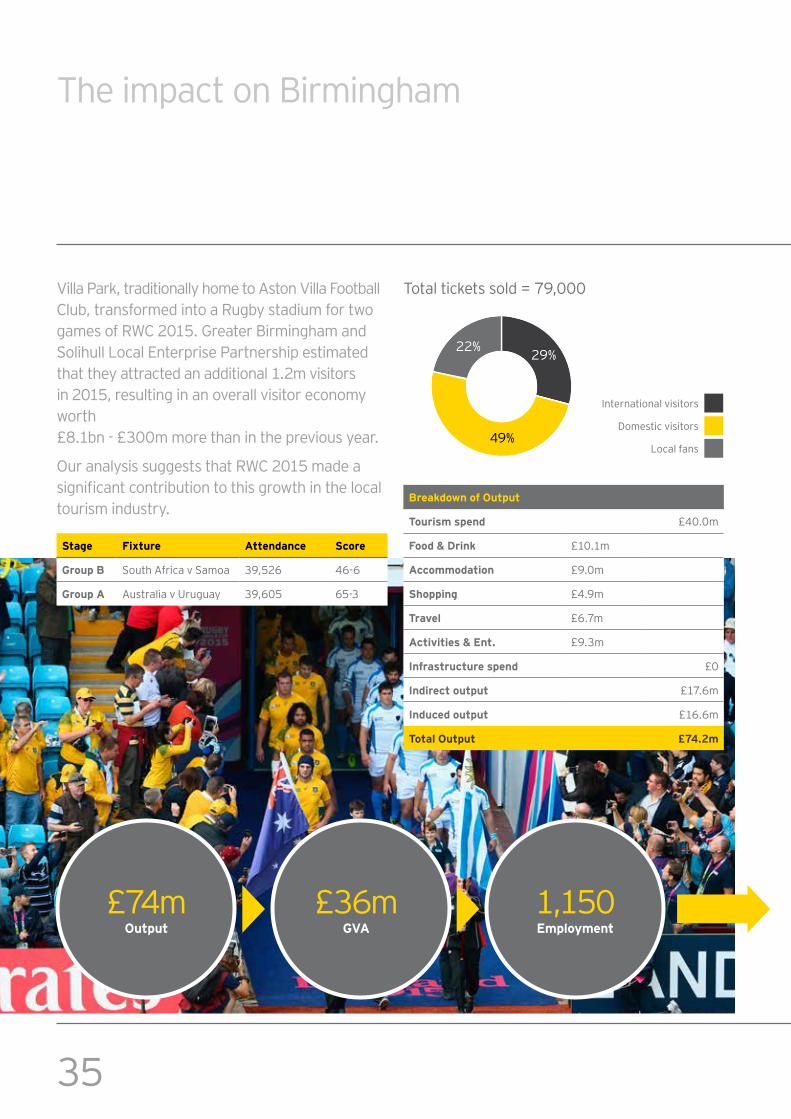
T h e i m p a c t on B i r m i ng h a m
Villa Park, traditionally home to Aston Villa Football C l ub , tr a nsf or m ed i nto a R ug b y sta di um f or tw o games of RWC 2015. Greater Birmingham and Solihull Local Enterprise Partnership estimated that they attracted an additional 1.2m visitors in 2015, resulting in an overall visitor economy w or th £8.1bn - £300m more than in the previous year.
Our analysis suggests that RWC 2015 made a significant contribution to this growth in the local tour i sm i ndustr y.
S tage F ix ture A ttendance S core
G roup B South Africa v Samoa 39,526 46-6
G roup A Australia v Uruguay 39,605 65-3
B reak dow n of O utput
Touris m s pend £40.0m
F ood & D rink £10.1m
A ccommodation £9.0m
S hopping £4.9m
Trav el £6.7m
A ctiv ities & E nt. £9.3m
I nfras tructure s pend £0
I ndirect output £17.6m
I nduced output £16.6m
Total O utput £ 7 4 . 2m
£74mO utput
£36mG V A
1,150E mployment
49%
22% 29%
Total tickets sold = 79,000
I nter na ti ona l vi si tor s
D om esti c vi si tor s
Local fans
36The economic impact of Rugby World Cup 2015 | Post event study
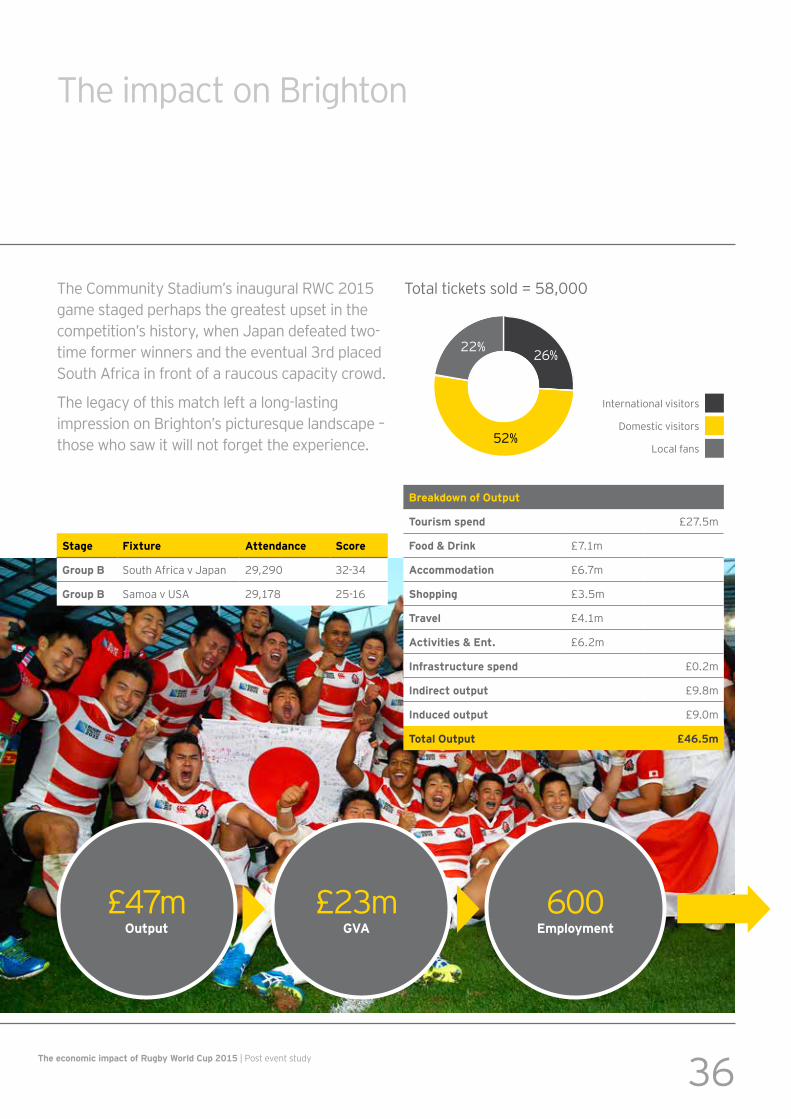
T h e i m p a c t on B r i g h ton
The Community Stadium’s inaugural RWC 2015 g a m e sta g ed p er h a p s th e g r ea test up set i n th e c om p eti ti on’ s h i stor y, w h en J a p a n def ea ted tw o-ti m e f or m er w i nner s a nd th e eventua l 3 r d p l a c ed South Africa in front of a raucous capacity crowd.
T h e l eg a c y of th i s m a tc h l ef t a l ong - l a sti ng i m p r essi on on B r i g h ton’ s p i c tur esq ue l a ndsc a p e – th ose w h o sa w i t w i l l not f or g et th e ex p er i enc e.
S tage F ix ture A ttendance S core
G roup B South Africa v Japan 29,290 32-34
G roup B Samoa v USA 29,178 25-16
B reak dow n of O utput
Touris m s pend £27.5m
F ood & D rink £7.1m
A ccommodation £6.7m
S hopping £3.5m
Trav el £4.1m
A ctiv ities & E nt. £6.2m
I nfras tructure s pend £0.2m
I ndirect output £9.8m
I nduced output £9.0m
Total O utput £ 4 6 . 5m
£47mO utput
£23mG V A
600E mployment
Total tickets sold = 58,000
52%
22% 26%
I nter na ti ona l vi si tor s
D om esti c vi si tor s
Local fans
37
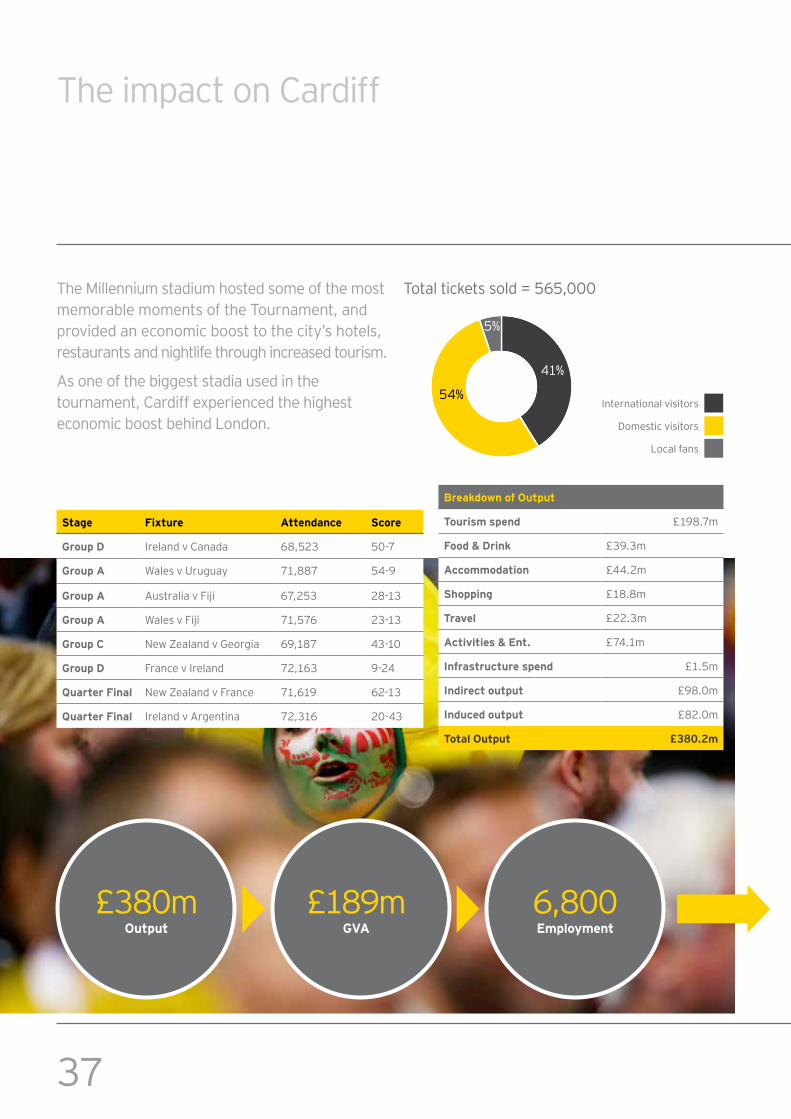
T h e i m p a c t on C a r di f f
The Millennium stadium hosted some of the most m em or a b l e m om ents of th e T our na m ent, a nd p r ovi ded a n ec onom i c b oost to th e c i ty’ s h otel s, r esta ur a nts a nd ni g h tl i f e th r oug h i nc r ea sed tour i sm .
A s one of th e b i g g est sta di a used i n th e tour na m ent, C a r di f f ex p er i enc ed th e h i g h est economic boost behind London.
S tage F ix ture A ttendance S core
G roup D I r el a nd v C a na da 68,523 50-7
G roup A Wales v Uruguay 71,887 54-9
G roup A Australia v Fiji 67,253 28-13
G roup A Wales v Fiji 71,576 23-13
G roup C New Zealand v Georgia 69,187 4 3 - 1 0
G roup D F r a nc e v I r el a nd 72,163 9-24
Q uarter F inal N ew Z ea l a nd v F r a nc e 71,619 62-13
Q uarter F inal I r el a nd v A r g enti na 72,316 20-43
£380mO utput
£189mG V A
6,800E mployment
B reak dow n of O utput
Touris m s pend £198.7m
F ood & D rink £39.3m
A ccommodation £44.2m
S hopping £18.8m
Trav el £22.3m
A ctiv ities & E nt. £74.1m
I nfras tructure s pend £1.5m
I ndirect output £98.0m
I nduced output £82.0m
Total O utput £ 3 8 0. 2m
Total tickets sold = 565,000
54%
5%
41%
I nter na ti ona l vi si tor s
D om esti c vi si tor s
Local fans
38The economic impact of Rugby World Cup 2015 | Post event study
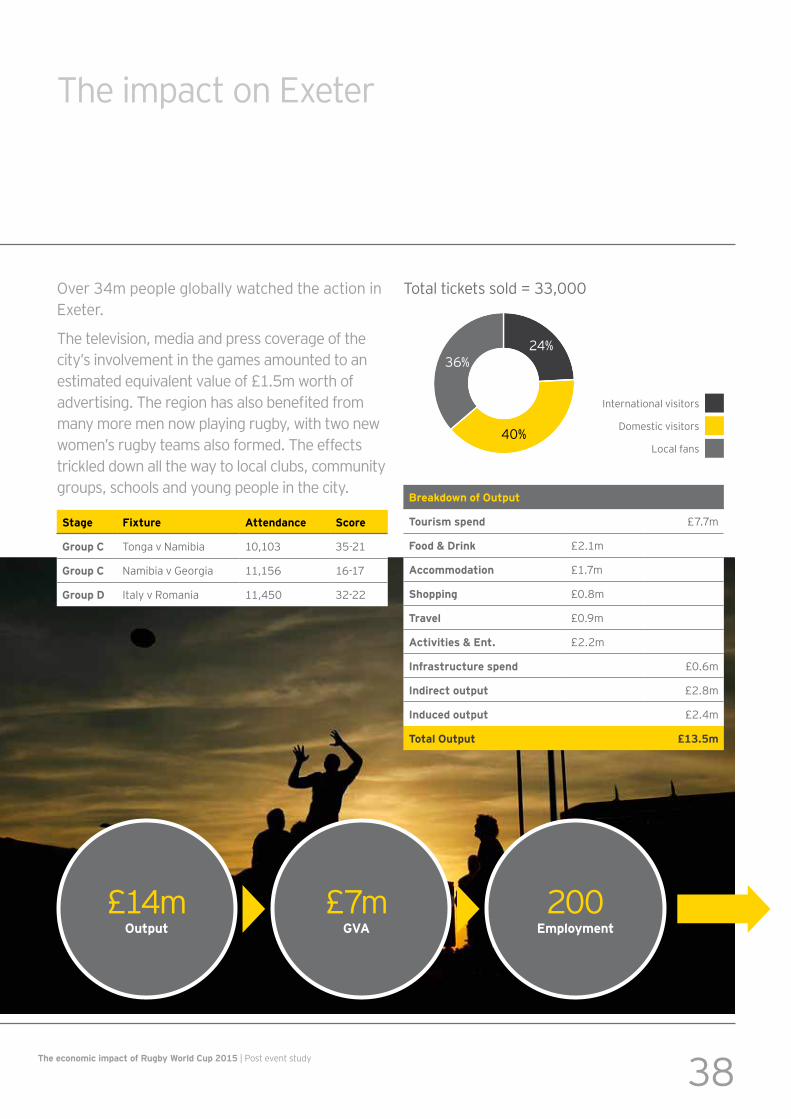
T h e i m p a c t on E x eter
O ver 3 4 m p eop l e g l ob a l l y w a tc h ed th e a c ti on i n E x eter .
T h e tel evi si on, m edi a a nd p r ess c over a g e of th e c i ty’ s i nvol vem ent i n th e g a m es a m ounted to a n estimated equivalent value of £1.5m worth of advertising. The region has also benefited from m a ny m or e m en now p l a yi ng r ug b y, w i th tw o new w om en’ s r ug b y tea m s a l so f or m ed. T h e ef f ec ts tr i c k l ed dow n a l l th e w a y to l oc a l c l ub s, c om m uni ty g r oup s, sc h ool s a nd young p eop l e i n th e c i ty.
S tage F ix ture A ttendance S core
G roup C T ong a v N a m i b i a 1 0 , 1 0 3 35-21
G roup C Namibia v Georgia 11,156 16-17
G roup D I ta l y v R om a ni a 11,450 32-22
£14mO utput
£7mG V A
200E mployment
B reak dow n of O utput
Touris m s pend £7.7m
F ood & D rink £2.1m
A ccommodation £1.7m
S hopping £0.8m
Trav el £0.9m
A ctiv ities & E nt. £2.2m
I nfras tructure s pend £0.6m
I ndirect output £2.8m
I nduced output £2.4m
Total O utput £ 13 . 5m
T ota l ti c k ets sol d = 3 3 , 0 0 0
24%
40%
36%
I nter na ti ona l vi si tor s
D om esti c vi si tor s
Local fans
39
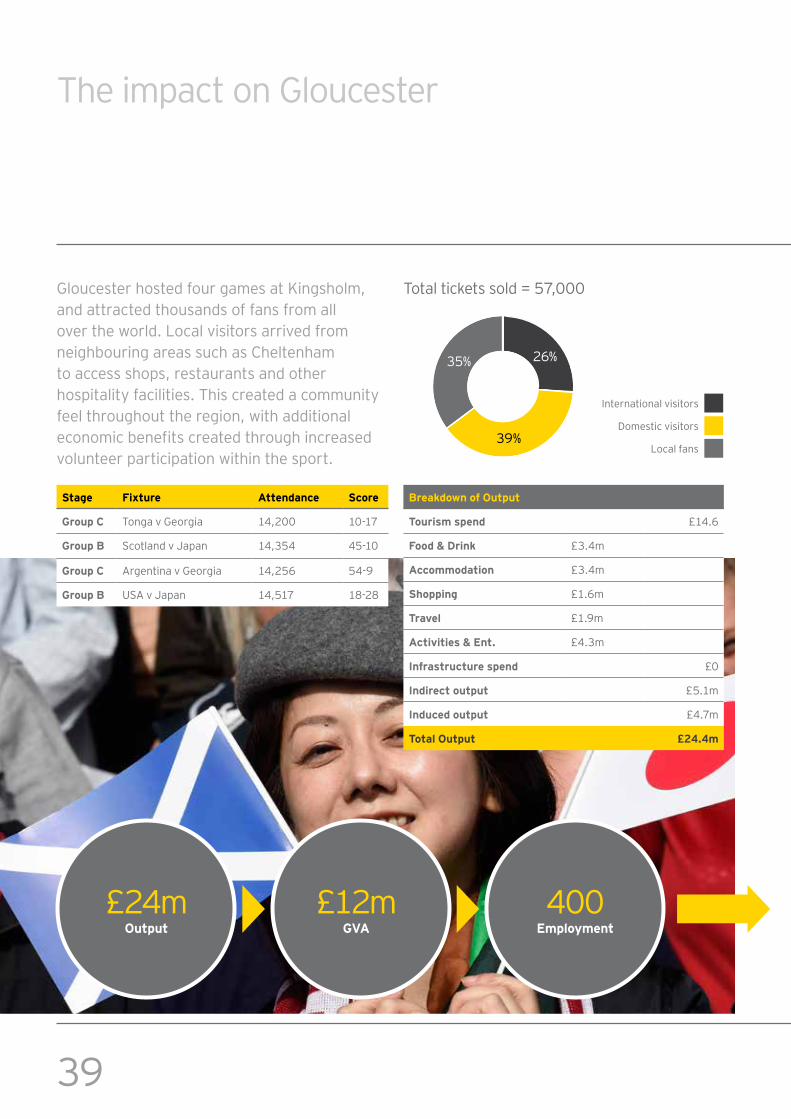
The impact on Gloucester
Gloucester hosted four games at Kingsholm, a nd a ttr a c ted th ousa nds of f a ns f r om a l l over the world. Local visitors arrived from nei g h b our i ng a r ea s suc h a s C h el tenh a m to a c c ess sh op s, r esta ur a nts a nd oth er h osp i ta l i ty f a c i l i ti es. T h i s c r ea ted a c om m uni ty f eel th r oug h out th e r eg i on, w i th a ddi ti ona l economic benefits created through increased vol unteer p a r ti c i p a ti on w i th i n th e sp or t.
S tage F ix ture A ttendance S core
G roup C Tonga v Georgia 14,200 10-17
G roup B Scotland v Japan 14,354 45-10
G roup C Argentina v Georgia 14,256 54-9
G roup B USA v Japan 14,517 18-28
£24mO utput
£12mG V A
4 0 0E mployment
B reak dow n of O utput
Touris m s pend £14.6
F ood & D rink £3.4m
A ccommodation £3.4m
S hopping £1.6m
Trav el £1.9m
A ctiv ities & E nt. £4.3m
I nfras tructure s pend £0
I ndirect output £5.1m
I nduced output £4.7m
Total O utput £ 24 . 4 m
Total tickets sold = 57,000
39%
35% 26%
I nter na ti ona l vi si tor s
D om esti c vi si tor s
Local fans
4 0The economic impact of Rugby World Cup 2015 | Post event study
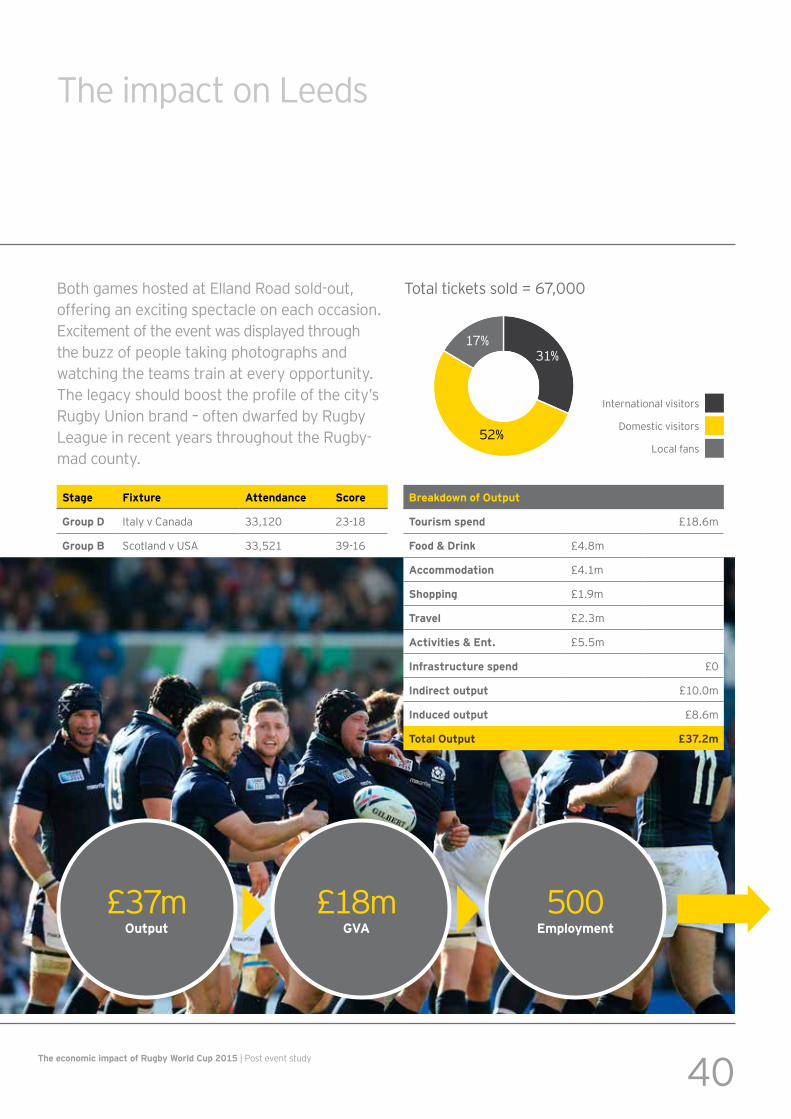
S tage F ix ture A ttendance S core
G roup D I ta l y v C a na da 33,120 23-18
G roup B Scotland v USA 33,521 39-16
The impact on Leeds
B oth g a m es h osted a t E l l a nd R oa d sol d- out, of f er i ng a n ex c i ti ng sp ec ta c l e on ea c h oc c a si on. E x c i tem ent of th e event w a s di sp l a yed th r oug h th e b uz z of p eop l e ta k i ng p h otog r a p h s a nd w a tc h i ng th e tea m s tr a i n a t ever y op p or tuni ty. The legacy should boost the profile of the city’s Rugby Union brand – often dwarfed by Rugby League in recent years throughout the Rugby-m a d c ounty.
£37mO utput
£18mG V A
500E mployment
B reak dow n of O utput
Touris m s pend £18.6m
F ood & D rink £4.8m
A ccommodation £4.1m
S hopping £1.9m
Trav el £2.3m
A ctiv ities & E nt. £5.5m
I nfras tructure s pend £0
I ndirect output £10.0m
I nduced output £8.6m
Total O utput £ 3 7 . 2m
Total tickets sold = 67,000
52%
17% 31%
I nter na ti ona l vi si tor s
D om esti c vi si tor s
Local fans
4 1
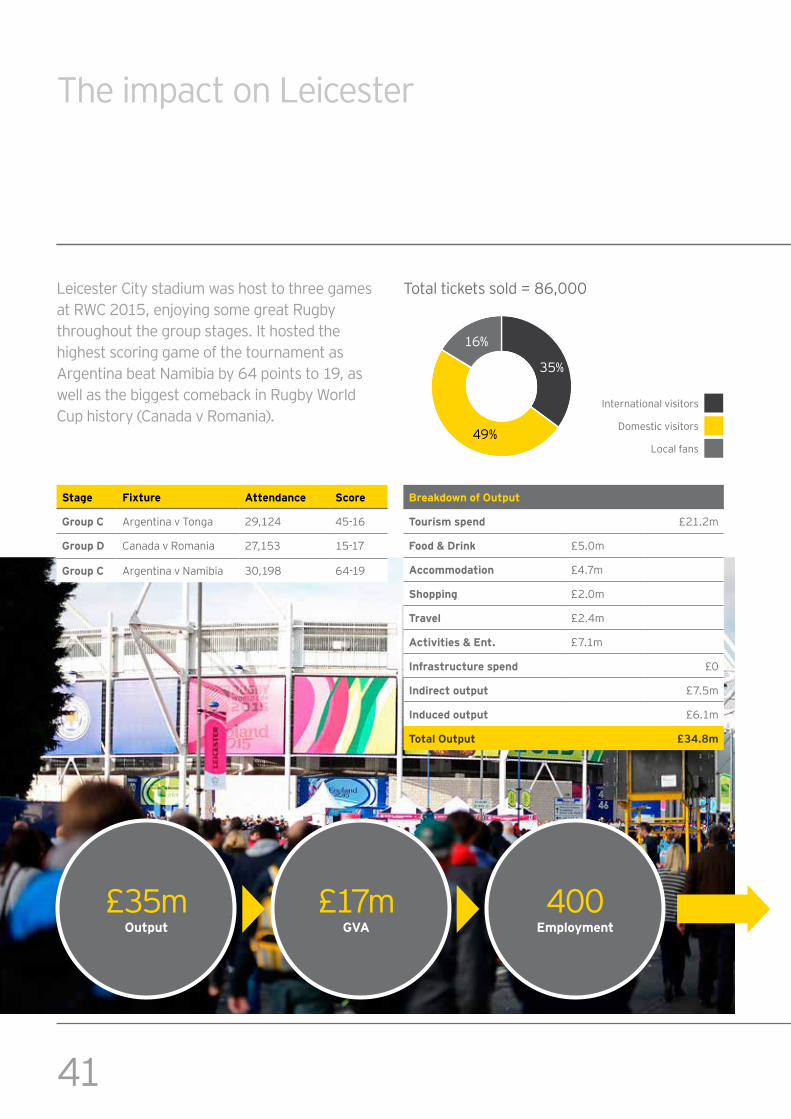
The impact on Leicester
Leicester City stadium was host to three games at RWC 2015, enjoying some great Rugby th r oug h out th e g r oup sta g es. I t h osted th e h i g h est sc or i ng g a m e of th e tour na m ent a s Argentina beat Namibia by 64 points to 19, as w el l a s th e b i g g est c om eb a c k i n R ug b y W or l d Cup history (Canada v Romania).
S tage F ix ture A ttendance S core
G roup C A r g enti na v T ong a 29,124 45-16
G roup D C a na da v R om a ni a 27,153 15-17
G roup C A r g enti na v N a m i b i a 30,198 64-19
£35mO utput
£17mG V A
4 0 0E mployment
B reak dow n of O utput
Touris m s pend £21.2m
F ood & D rink £5.0m
A ccommodation £4.7m
S hopping £2.0m
Trav el £2.4m
A ctiv ities & E nt. £7.1m
I nfras tructure s pend £0
I ndirect output £7.5m
I nduced output £6.1m
Total O utput £ 3 4 . 8 m
Total tickets sold = 86,000
49%
16%
35%
I nter na ti ona l vi si tor s
D om esti c vi si tor s
Local fans
42The economic impact of Rugby World Cup 2015 | Post event study
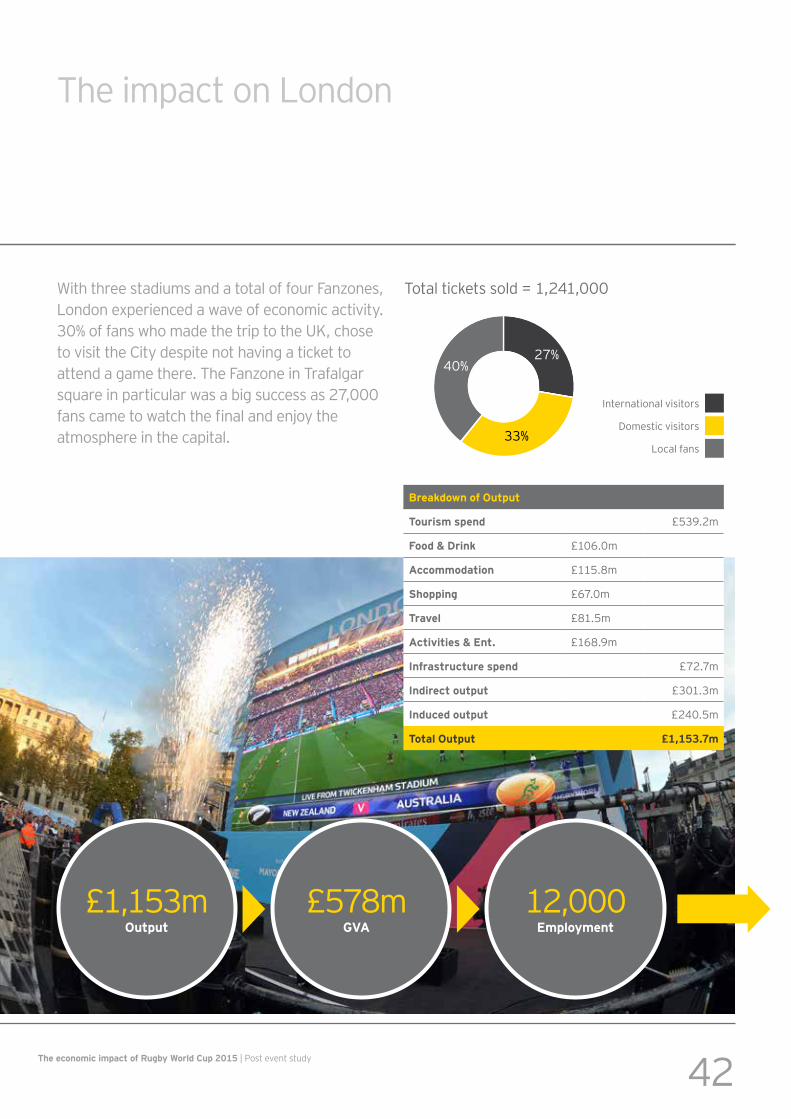
The impact on London
W i th th r ee sta di um s a nd a tota l of f our F a nz ones, London experienced a wave of economic activity. 30% of fans who made the trip to the UK, chose to vi si t th e C i ty desp i te not h a vi ng a ti c k et to a ttend a g a m e th er e. T h e F a nz one i n T r a f a l g a r square in particular was a big success as 27,000 fans came to watch the final and enjoy the a tm osp h er e i n th e c a p i ta l .
£1,153mO utput
£578mG V A
12,000E mployment
B reak dow n of O utput
Touris m s pend £539.2m
F ood & D rink £106.0m
A ccommodation £115.8m
S hopping £67.0m
Trav el £81.5m
A ctiv ities & E nt. £168.9m
I nfras tructure s pend £72.7m
I ndirect output £301.3m
I nduced output £240.5m
Total O utput £ 1, 153 . 7 m
Total tickets sold = 1,241,000
33%
40% 27%
I nter na ti ona l vi si tor s
D om esti c vi si tor s
Local fans
4 3
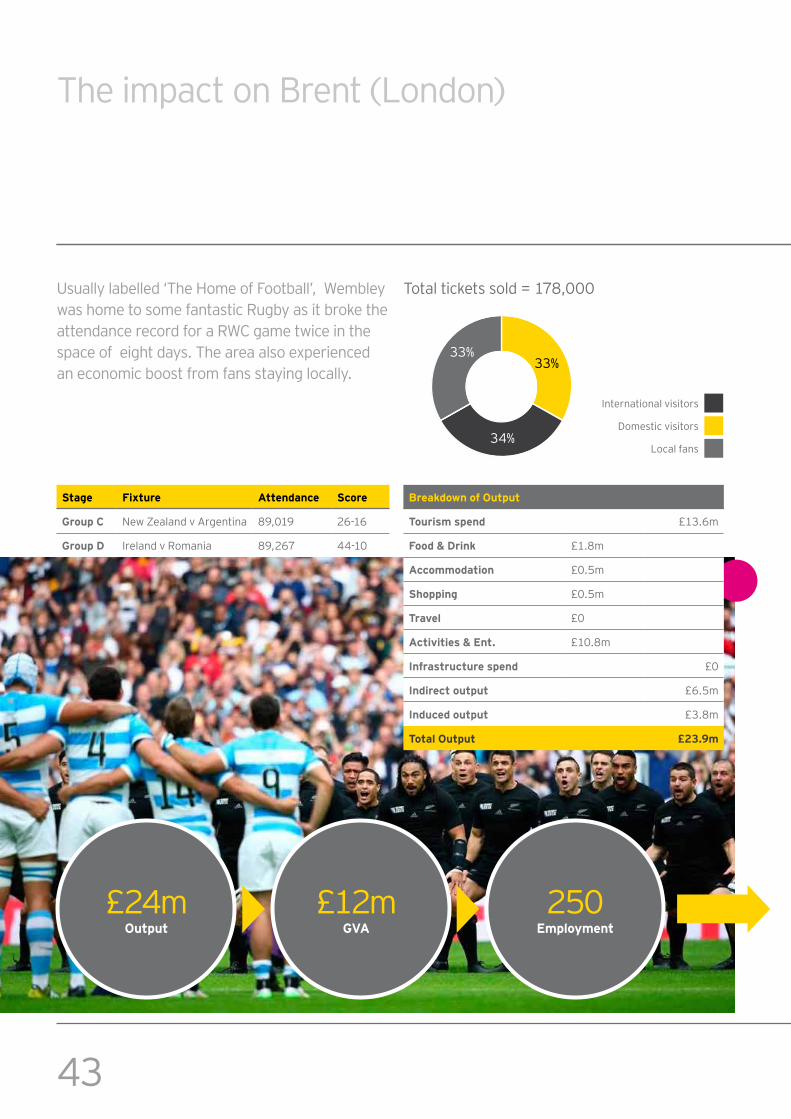
S tage F ix ture A ttendance S core
G roup C N ew Z ea l a nd v A r g enti na 89,019 26-16
G roup D I r el a nd v R om a ni a 89,267 4 4 - 1 0
The impact on Brent (London)
Usually labelled ‘The Home of Football’, Wembley w a s h om e to som e f a nta sti c R ug b y a s i t b r ok e th e a ttenda nc e r ec or d f or a R W C g a m e tw i c e i n th e sp a c e of ei g h t da ys. T h e a r ea a l so ex p er i enc ed a n ec onom i c b oost f r om f a ns sta yi ng l oc a l l y.
£24mO utput
£12mG V A
250E mployment
B reak dow n of O utput
Touris m s pend £13.6m
F ood & D rink £1.8m
A ccommodation £0.5m
S hopping £0.5m
Trav el £0
A ctiv ities & E nt. £10.8m
I nfras tructure s pend £0
I ndirect output £6.5m
I nduced output £3.8m
Total O utput £ 23 . 9 m
Total tickets sold = 178,000
34%
33% 33%
I nter na ti ona l vi si tor s
D om esti c vi si tor s
Local fans
4 4The economic impact of Rugby World Cup 2015 | Post event study
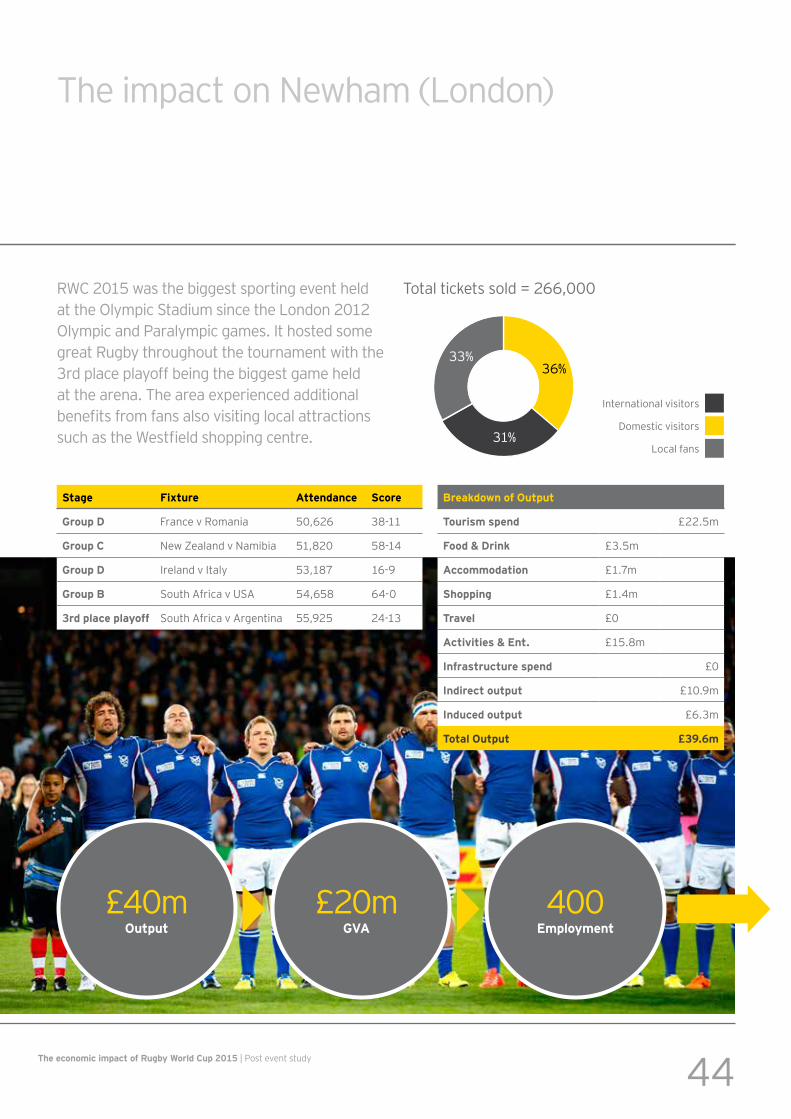
The impact on Newham (London)
RWC 2015 was the biggest sporting event held at the Olympic Stadium since the London 2012 Olympic and Paralympic games. It hosted some g r ea t R ug b y th r oug h out th e tour na m ent w i th th e 3 r d p l a c e p l a yof f b ei ng th e b i g g est g a m e h el d a t th e a r ena . T h e a r ea ex p er i enc ed a ddi ti ona l benefits from fans also visiting local attractions such as the Westfield shopping centre.
S tage F ix ture A ttendance S core
G roup D F r a nc e v R om a ni a 50,626 38-11
G roup C N ew Z ea l a nd v N a m i b i a 51,820 58-14
G roup D I r el a nd v I ta l y 53,187 16-9
G roup B South Africa v USA 54,658 64-0
3 rd place playoff South Africa v Argentina 55,925 24-13
£40mO utput
£20mG V A
4 0 0E mployment
B reak dow n of O utput
Touris m s pend £22.5m
F ood & D rink £3.5m
A ccommodation £1.7m
S hopping £1.4m
Trav el £0
A ctiv ities & E nt. £15.8m
I nfras tructure s pend £0
I ndirect output £10.9m
I nduced output £6.3m
Total O utput £ 3 9 . 6 m
Total tickets sold = 266,000
31%
33%36%
I nter na ti ona l vi si tor s
D om esti c vi si tor s
Local fans
45
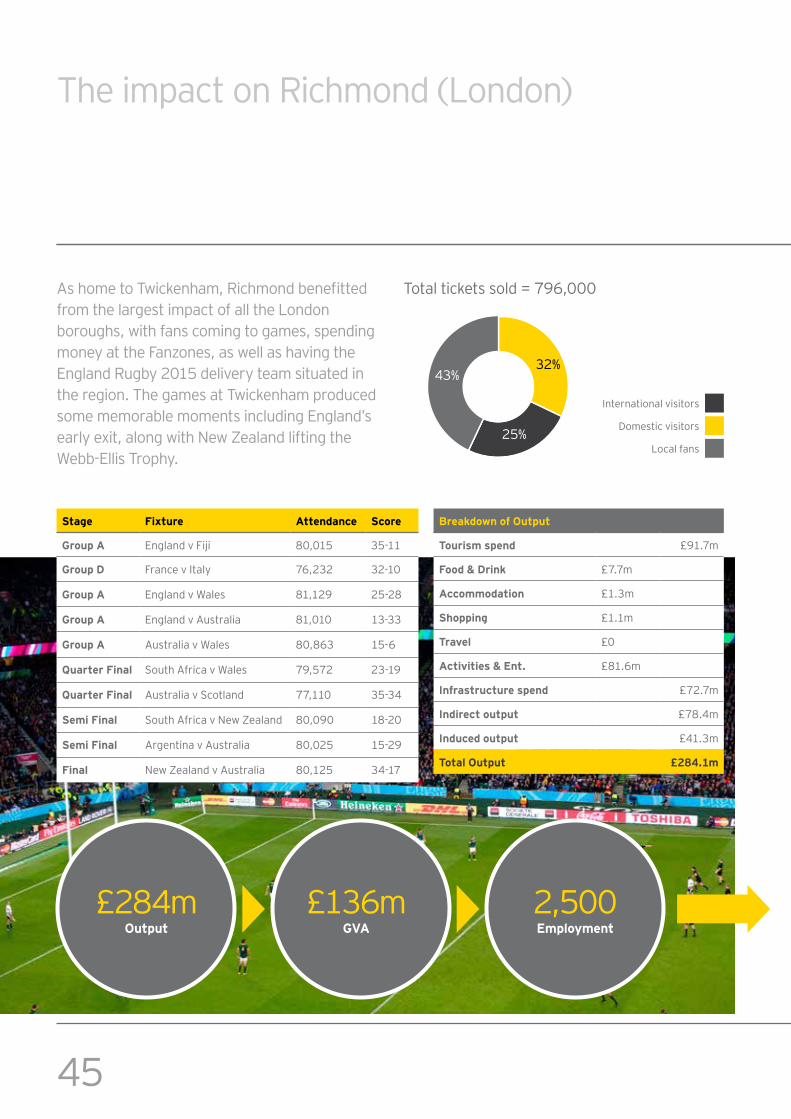
The impact on Richmond (London)
As home to Twickenham, Richmond benefitted from the largest impact of all the London b or oug h s, w i th f a ns c om i ng to g a m es, sp endi ng m oney a t th e F a nz ones, a s w el l a s h a vi ng th e England Rugby 2015 delivery team situated in th e r eg i on. T h e g a m es a t T w i c k enh a m p r oduc ed som e m em or a b l e m om ents i nc l udi ng E ng l a nd’ s ea r l y ex i t, a l ong w i th N ew Z ea l a nd l i f ti ng th e W eb b - E l l i s T r op h y.
£284mO utput
£136mG V A
2,500E mployment
S tage F ix ture A ttendance S core
G roup A England v Fiji 80,015 35-11
G roup D F r a nc e v I ta l y 76,232 32-10
G roup A E ng l a nd v W a l es 81,129 25-28
G roup A E ng l a nd v A ustr a l i a 81,010 1 3 - 3 3
G roup A A ustr a l i a v W a l es 80,863 15-6
Q uarter F inal South Africa v Wales 79,572 23-19
Q uarter F inal Australia v Scotland 77,110 35-34
S emi F inal South Africa v New Zealand 80,090 18-20
S emi F inal A r g enti na v A ustr a l i a 80,025 15-29
F inal N ew Z ea l a nd v A ustr a l i a 80,125 34-17
B reak dow n of O utput
Touris m s pend £91.7m
F ood & D rink £7.7m
A ccommodation £1.3m
S hopping £1.1m
Trav el £0
A ctiv ities & E nt. £81.6m
I nfras tructure s pend £72.7m
I ndirect output £78.4m
I nduced output £41.3m
Total O utput £ 28 4 . 1m
Total tickets sold = 796,000
25%
43%32%
I nter na ti ona l vi si tor s
D om esti c vi si tor s
Local fans
46The economic impact of Rugby World Cup 2015 | Post event study
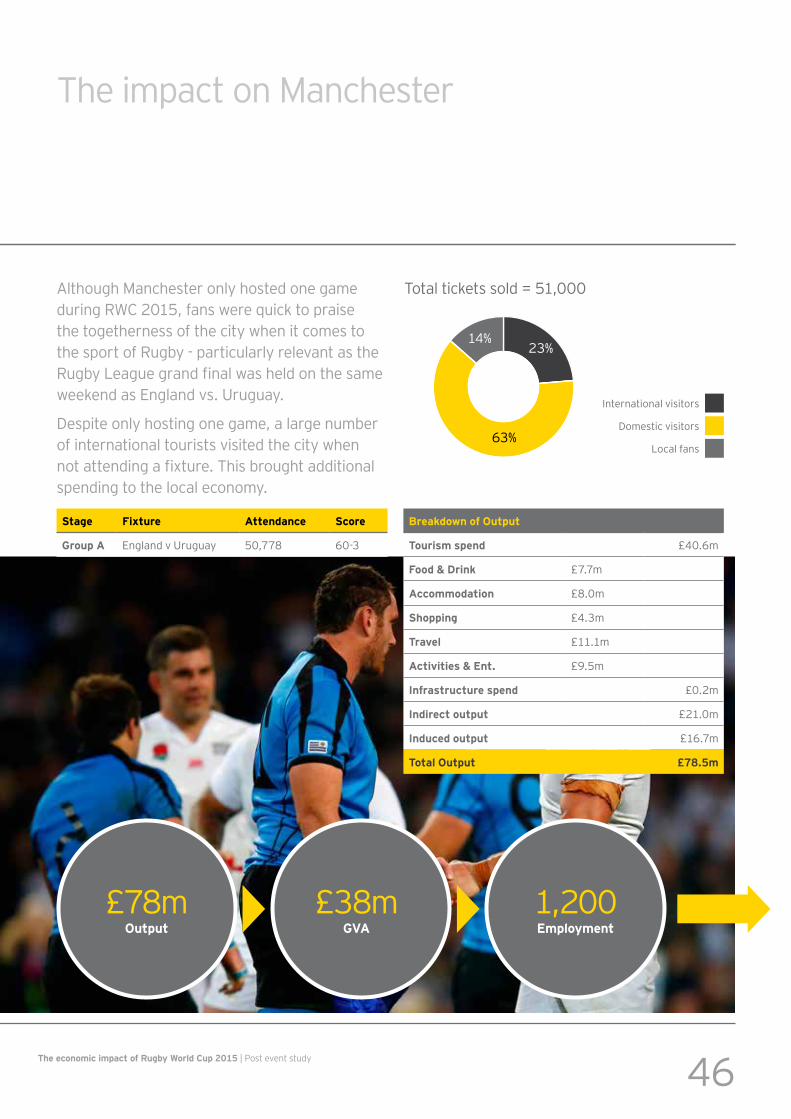
The impact on Manchester
Although Manchester only hosted one game during RWC 2015, fans were quick to praise th e tog eth er ness of th e c i ty w h en i t c om es to th e sp or t of R ug b y - p a r ti c ul a r l y r el eva nt a s th e Rugby League grand final was held on the same weekend as England vs. Uruguay.
D esp i te onl y h osti ng one g a m e, a l a r g e num b er of i nter na ti ona l tour i sts vi si ted th e c i ty w h en not attending a fixture. This brought additional sp endi ng to th e l oc a l ec onom y.
S tage F ix ture A ttendance S core
G roup A England v Uruguay 50,778 60-3
£78mO utput
£38mG V A
1,200E mployment
B reak dow n of O utput
Touris m s pend £40.6m
F ood & D rink £7.7m
A ccommodation £8.0m
S hopping £4.3m
Trav el £11.1m
A ctiv ities & E nt. £9.5m
I nfras tructure s pend £0.2m
I ndirect output £21.0m
I nduced output £16.7m
Total O utput £ 7 8 . 5m
Total tickets sold = 51,000
63%
14%23%
I nter na ti ona l vi si tor s
D om esti c vi si tor s
Local fans
47
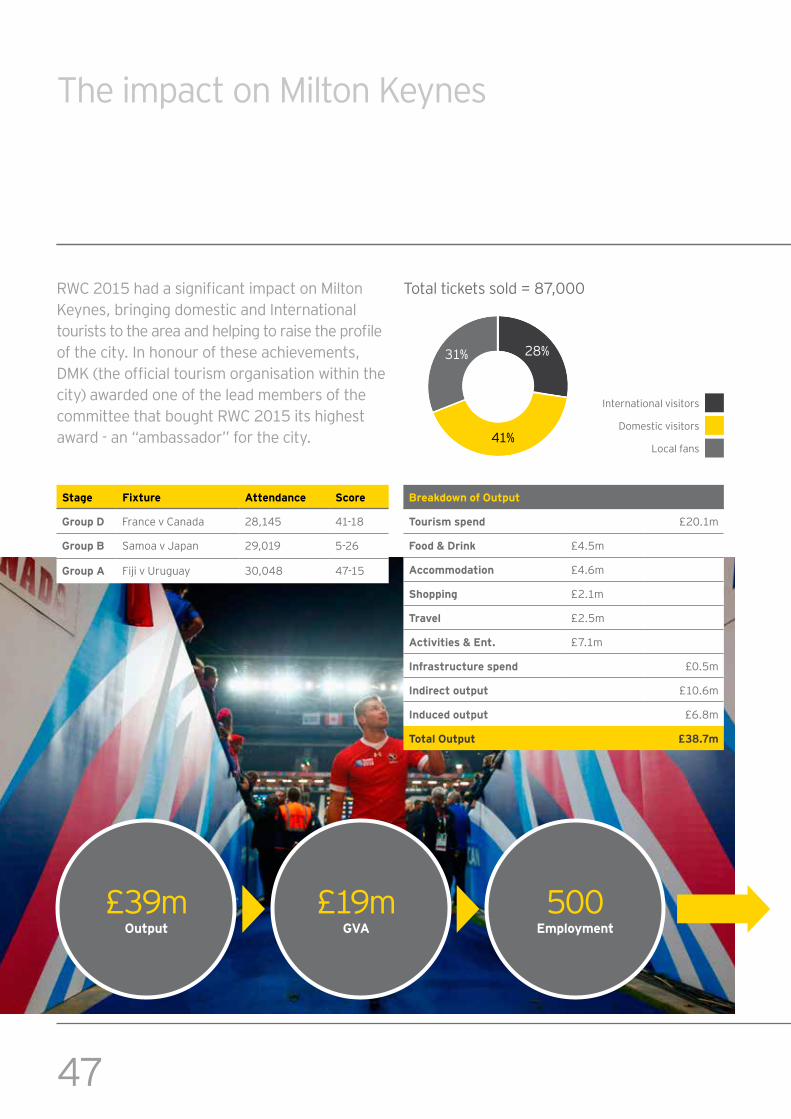
The impact on Milton Keynes
RWC 2015 had a significant impact on Milton Keynes, bringing domestic and International tourists to the area and helping to raise the profile of th e c i ty. I n h onour of th ese a c h i evem ents, DMK (the official tourism organisation within the city) awarded one of the lead members of the committee that bought RWC 2015 its highest a w a r d - a n “ a m b a ssa dor ” f or th e c i ty.
£39mO utput
£19mG V A
500E mployment
S tage F ix ture A ttendance S core
G roup D F r a nc e v C a na da 28,145 41-18
G roup B Samoa v Japan 29,019 5-26
G roup A Fiji v Uruguay 30,048 47-15
B reak dow n of O utput
Touris m s pend £20.1m
F ood & D rink £4.5m
A ccommodation £4.6m
S hopping £2.1m
Trav el £2.5m
A ctiv ities & E nt. £7.1m
I nfras tructure s pend £0.5m
I ndirect output £10.6m
I nduced output £6.8m
Total O utput £ 3 8 . 7 m
Total tickets sold = 87,000
41%
31% 28%
I nter na ti ona l vi si tor s
D om esti c vi si tor s
Local fans
48The economic impact of Rugby World Cup 2015 | Post event study
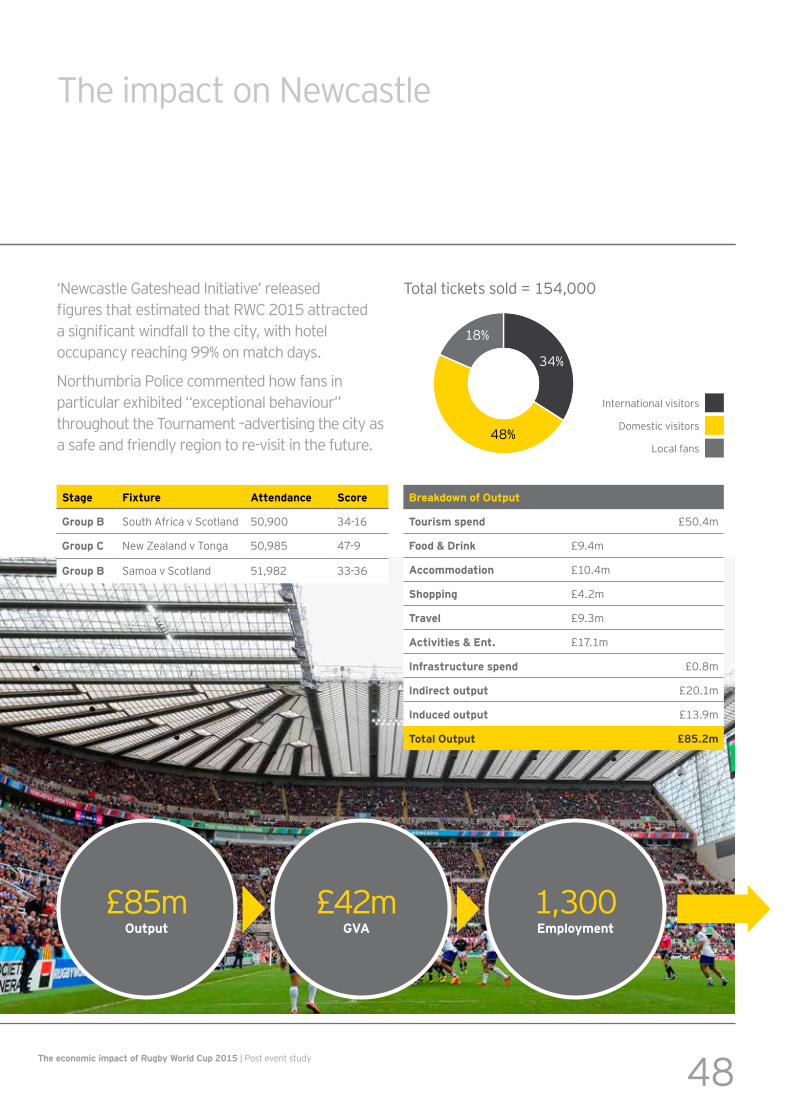
T h e i m p a c t on N ew c a stl e
‘Newcastle Gateshead Initiative’ released figures that estimated that RWC 2015 attracted a significant windfall to the city, with hotel occupancy reaching 99% on match days.
Northumbria Police commented how fans in p a r ti c ul a r ex h i b i ted “ ex c ep ti ona l b eh a vi our ” th r oug h out th e T our na m ent – a dver ti si ng th e c i ty a s a sa f e a nd f r i endl y r eg i on to r e- vi si t i n th e f utur e.
£85mO utput
£42mG V A
1 , 3 0 0E mployment
S tage F ix ture A ttendance S core
G roup B South Africa v Scotland 50,900 34-16
G roup C N ew Z ea l a nd v T ong a 50,985 47-9
G roup B Samoa v Scotland 51,982 33-36
B reak dow n of O utput
Touris m s pend £50.4m
F ood & D rink £9.4m
A ccommodation £10.4m
S hopping £4.2m
Trav el £9.3m
A ctiv ities & E nt. £17.1m
I nfras tructure s pend £0.8m
I ndirect output £20.1m
I nduced output £13.9m
Total O utput £ 8 5. 2m
Total tickets sold = 154,000
48%
18%
34%
I nter na ti ona l vi si tor s
D om esti c vi si tor s
Local fans
49
Contacts
Peter Arnold
Director Economic Advisory
+ 44 20 7951 5587 [email protected]
Mike GriceExecutive Director RFU Account Leader
+ 44 20 7951 0862 [email protected]
David Mullen Assistant Director Economic Advisory
+44 20 7951 7898 [email protected]
EY team

50The economic impact of Rugby World Cup 2015 | Post event study
EY | Assurance | Tax | Transactions | Advisory
About EYEY is a global leader in assurance, tax, transaction and advisory services. The insights and quality services we deliver help build trust and confidence in the capital markets and in economies the world over. We develop outstanding leaders who team to deliver on our promises to all of our stakeholders. In so doing, we play a critical role in building a better working world for our people, for our clients and for our communities.
EY refers to the global organization, and may refer to one or more, of the member firms of Ernst & Young Global Limited, each of which is a separate legal entity. Ernst & Young Global Limited, a UK company limited by guarantee, does not provide services to clients. For more information about our organization, please visit ey.com.
Ernst & Young LLPThe UK firm Ernst & Young LLP is a limited liability partnership registered in England and Wales with registered number OC300001 and is a member firm of Ernst & Young Global Limited. Ernst & Young LLP, 1 More London Place, London, SE1 2AF.
© 2016 Ernst & Young LLP. Published in the UK. All Rights Reserved.
ED None 1420524.indd (UK) 03/16. Artwork by Creative Services Group Design.
In line with EY’s commitment to minimise its impact on the environment, this document has been printed on paper with a high recycled content.
This material has been prepared for general informational purposes only and is not intended to be relied upon as accounting, tax, or other professional advice. Please refer to your advisors for specific advice. TM ©RWC Ltd. 1986
ey.com/uk
Recommended