1
UKRAINIAN AGROFOOD MARKET RESEARCH
Table of Contents
Page
1. General information …………………………………………………………………… 2
2. Crop production ………………………………………………………………………… 5
3. Animal production ……………………………………………………………………… 11
4. Fertilizers …………………………………………………………………………………... 17
5. Investments in agriculture …………………………………………………………. 19
6. Useful links and data sources …………………………………………………….. 22
2
1. GENERAL INFORMATION
The favorable geographical location of Ukraine, extremely fertile black soil, decent infrastructure
and relatively cheap labour force make the country’s agribusiness sector highly competitive. A
lot has been achieved in the country over the past 25 years to enable Ukraine to live up to its
status as the “breadbasket of Europe” and to help, at least partly, address the global challenge
of sustainable food supply and food security. Ukrainian agricultural sector is considered as
attractive for investment opportunities. The Ukrainian government encourages foreign investors
to invest into agricultural business in Ukraine.
Referring to the statistics of the previous years, Ukrainian agriculture has been securing
approximately 11-14% of national GDP within the last few years. Approximately 17% of working
population is employed in agriculture. The agricultural sector covers 70.8% of Ukraine’s total
landmass (42.7 million ha). Agricultural products accounted for 42.5% of Ukraine’s export in 2016
(by 4.5% more than in 2015). The government is making it easier for agribusinesses to operate,
and farms are more productive. As part of its deregulation efforts, the government canceled 14
previously required permits and eliminated six licensing requirements for agribusinesses. In
2017, the government continued deregulation, privatization and aligning safety and food
standards with those of the European Union.
Ukraine has 42.7 m hectares of agricultural land, which comprises 71% of the country's total area.
Among them: 76% - arable land (32.5 million hectares), 13% - pastures (5.4 million hectares), 6%
- grasslands (2.4 million hectares), 2% - perennial plants (0.9 million hectares). Agricultural land
in Ukraine includes cultivated land (grains, technical crops, forages, potatoes and vegetables, and
fallow), gardens, orchards, vineyards, and permanent meadows and pastures. Ukraine is richly
endowed with chernozem (also known as “black soil”), one of the most fertile soils worldwide.
28% of the world’s resources of chernozem are located on the territory of Ukraine. Chernozem,
a black-colored soil that contains a very high percentage of humus (3% to 15%) along with
phosphoric acids, phosphorus and ammonia, occupies 41% of Ukraine’s total area and even more
of its agricultural land (54%), and plow land (58%). Ukraine has favorable climate for large-scale
agriculture, rich agricultural soils and access to abundant land and water resources.
Currently, owners of land cannot sell it due to Moratorium on Sale of Agricultural Land. The
Verkhovna Rada (the Parliament of Ukraine) has extended the moratorium until January 1, 2019.
Agricultural production made up 11.6% of Ukraine’s GDP in 2016 (277 billion UAH). The basis of
agriculture is crop production – 72.8% of the total agricultural production, animal production
states 27.2%.
Ukraine has a strong position in practically all stages of the food supply chain, in particular, with
regard to raw material, production, processing, wholesale and retail trade, consumption, export.
The export process is supported by the strong infrastructure. In recent years, the Ukrainian
agribusinesses managed to reach an almost impossible result – they have completely redirected
foreign trade from the large market of the Russian Federation to the markets of Asia, EU, and
Africa.
3
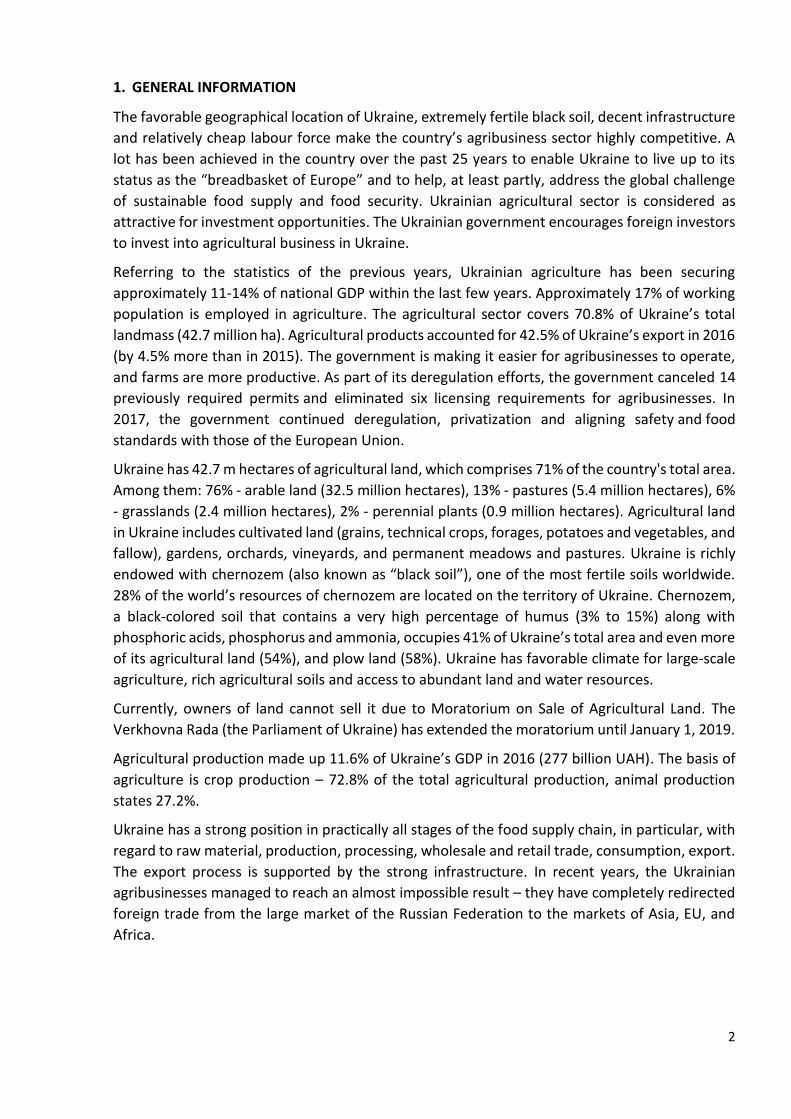
Figure 1. Ukraine’s place in the world food market1
Source: AEQUO, Baker Tilly, Crédit Agricole
Ukrainian farming business is looking for new business development locations, markets and
instruments. Obviously, value adding niches of fruits, veggies and organics foods are most
promising on the global food market. European Union, Middle East, Asia and Oceania are markets
to consider for trade development. Processed and dried products with customized service for
each local market is a high margin niche in mentioned regions for major number of Ukrainian
farming businesses, which may contribute impressive results through strategic investments and
steady quality improvement.
Exports of Ukrainian agricultural and food products reached 14.7 billion USD in the 10 months of
2017 and showed an increase of 22.7% or 2.7 billion USD compared to the corresponding period
of 2016. While imports increased by 8% and amounted to 3.6 billion USD. At the same time, the
share of agricultural products export level in terms of the general export structure of Ukraine has
not changed and remained at the level of 41.8% (42.8% in 2016). The main products exported
were sunflower, safflower and cotton oil – 24.8% of agricultural export value, corn – 16.5%,
wheat – 15.1%, rapeseeds – 5.1%. In addition, soybeans, sunflower meal, barley and poultry
meat. Imports - tobacco raw materials, frozen fish, sunflower seeds and citrus.
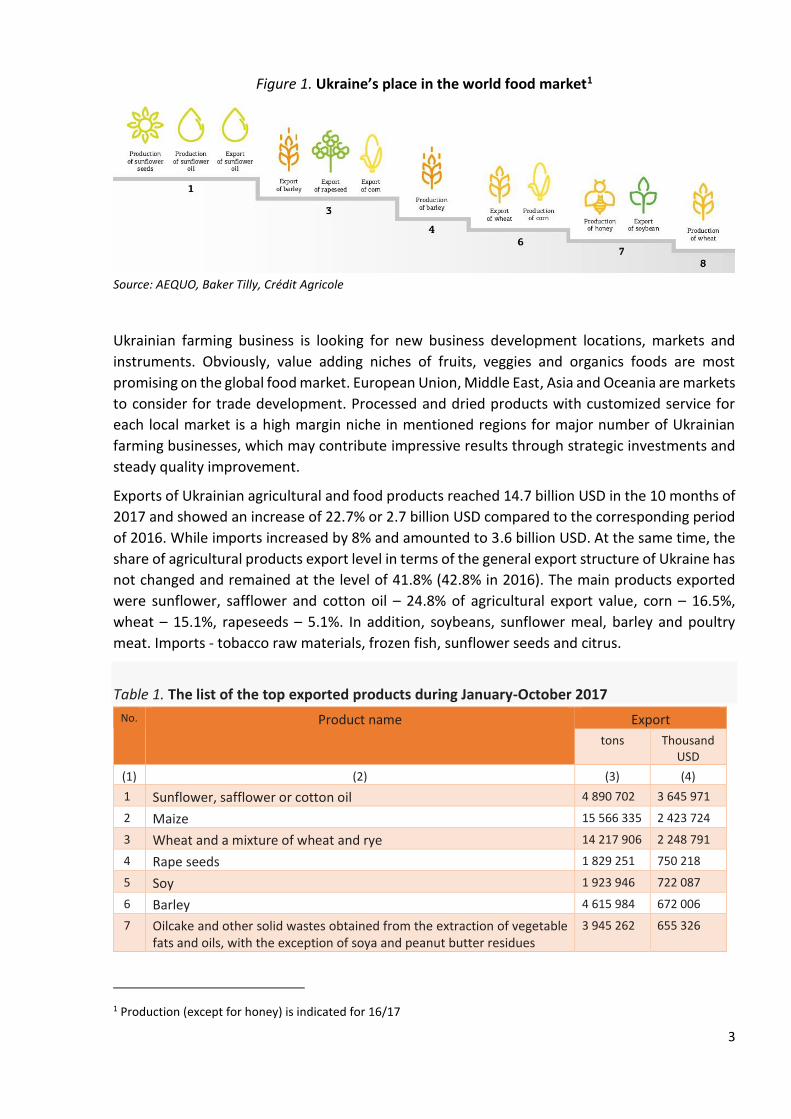
Table 1. The list of the top exported products during January-October 2017
No. Product name Export
tons Thousand USD
(1) (2) (3) (4)
1 Sunflower, safflower or cotton oil 4 890 702 3 645 971
2 Maize 15 566 335 2 423 724
3 Wheat and a mixture of wheat and rye 14 217 906 2 248 791
4 Rape seeds 1 829 251 750 218
5 Soy 1 923 946 722 087
6 Barley 4 615 984 672 006
7 Oilcake and other solid wastes obtained from the extraction of vegetable fats and oils, with the exception of soya and peanut butter residues
3 945 262 655 326
1 Production (except for honey) is indicated for 16/17
4
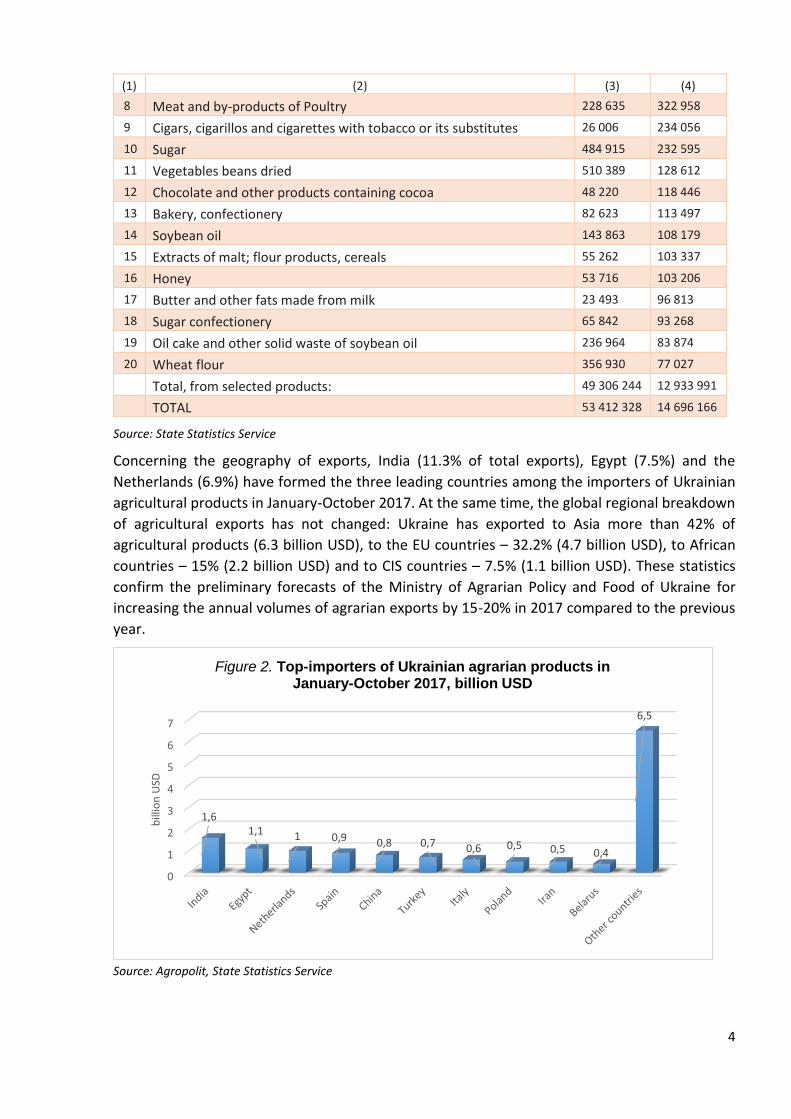
(1) (2) (3) (4)
8 Meat and by-products of Poultry 228 635 322 958
9 Cigars, cigarillos and cigarettes with tobacco or its substitutes 26 006 234 056
10 Sugar 484 915 232 595
11 Vegetables beans dried 510 389 128 612
12 Chocolate and other products containing cocoa 48 220 118 446
13 Bakery, confectionery 82 623 113 497
14 Soybean oil 143 863 108 179
15 Extracts of malt; flour products, cereals 55 262 103 337
16 Honey 53 716 103 206
17 Butter and other fats made from milk 23 493 96 813
18 Sugar confectionery 65 842 93 268
19 Oil cake and other solid waste of soybean oil 236 964 83 874
20 Wheat flour 356 930 77 027
Total, from selected products: 49 306 244 12 933 991
TOTAL 53 412 328 14 696 166
Source: State Statistics Service
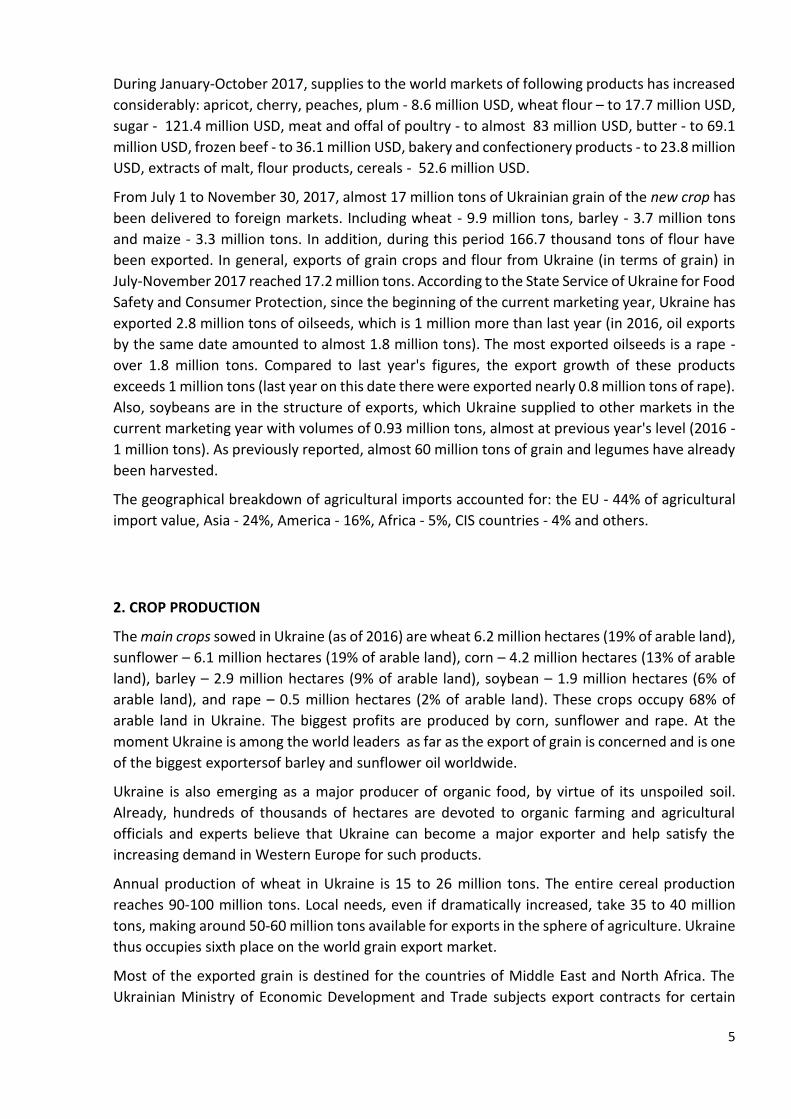
Concerning the geography of exports, India (11.3% of total exports), Egypt (7.5%) and the
Netherlands (6.9%) have formed the three leading countries among the importers of Ukrainian
agricultural products in January-October 2017. At the same time, the global regional breakdown
of agricultural exports has not changed: Ukraine has exported to Asia more than 42% of
agricultural products (6.3 billion USD), to the EU countries – 32.2% (4.7 billion USD), to African
countries – 15% (2.2 billion USD) and to CIS countries – 7.5% (1.1 billion USD). These statistics
confirm the preliminary forecasts of the Ministry of Agrarian Policy and Food of Ukraine for
increasing the annual volumes of agrarian exports by 15-20% in 2017 compared to the previous
year.
Source: Agropolit, State Statistics Service
0
1
2
3
4
5
6
7
1,61,1 1 0,9 0,8 0,7 0,6 0,5 0,5 0,4
6,5
bill
ion
USD
Figure 2. Top-importers of Ukrainian agrarian products in January-October 2017, billion USD
5
During January-October 2017, supplies to the world markets of following products has increased
considerably: apricot, cherry, peaches, plum - 8.6 million USD, wheat flour – to 17.7 million USD,
sugar - 121.4 million USD, meat and offal of poultry - to almost 83 million USD, butter - to 69.1
million USD, frozen beef - to 36.1 million USD, bakery and confectionery products - to 23.8 million
USD, extracts of malt, flour products, cereals - 52.6 million USD.
From July 1 to November 30, 2017, almost 17 million tons of Ukrainian grain of the new crop has
been delivered to foreign markets. Including wheat - 9.9 million tons, barley - 3.7 million tons
and maize - 3.3 million tons. In addition, during this period 166.7 thousand tons of flour have
been exported. In general, exports of grain crops and flour from Ukraine (in terms of grain) in
July-November 2017 reached 17.2 million tons. According to the State Service of Ukraine for Food
Safety and Consumer Protection, since the beginning of the current marketing year, Ukraine has
exported 2.8 million tons of oilseeds, which is 1 million more than last year (in 2016, oil exports
by the same date amounted to almost 1.8 million tons). The most exported oilseeds is a rape -
over 1.8 million tons. Compared to last year's figures, the export growth of these products
exceeds 1 million tons (last year on this date there were exported nearly 0.8 million tons of rape).
Also, soybeans are in the structure of exports, which Ukraine supplied to other markets in the
current marketing year with volumes of 0.93 million tons, almost at previous year's level (2016 -
1 million tons). As previously reported, almost 60 million tons of grain and legumes have already
been harvested.
The geographical breakdown of agricultural imports accounted for: the EU - 44% of agricultural
import value, Asia - 24%, America - 16%, Africa - 5%, CIS countries - 4% and others.
2. CROP PRODUCTION
The main crops sowed in Ukraine (as of 2016) are wheat 6.2 million hectares (19% of arable land),
sunflower – 6.1 million hectares (19% of arable land), corn – 4.2 million hectares (13% of arable
land), barley – 2.9 million hectares (9% of arable land), soybean – 1.9 million hectares (6% of
arable land), and rape – 0.5 million hectares (2% of arable land). These crops occupy 68% of
arable land in Ukraine. The biggest profits are produced by corn, sunflower and rape. At the
moment Ukraine is among the world leaders as far as the export of grain is concerned and is one
of the biggest exportersof barley and sunflower oil worldwide.
Ukraine is also emerging as a major producer of organic food, by virtue of its unspoiled soil.
Already, hundreds of thousands of hectares are devoted to organic farming and agricultural
officials and experts believe that Ukraine can become a major exporter and help satisfy the
increasing demand in Western Europe for such products.
Annual production of wheat in Ukraine is 15 to 26 million tons. The entire cereal production
reaches 90-100 million tons. Local needs, even if dramatically increased, take 35 to 40 million
tons, making around 50-60 million tons available for exports in the sphere of agriculture. Ukraine
thus occupies sixth place on the world grain export market.
Most of the exported grain is destined for the countries of Middle East and North Africa. The
Ukrainian Ministry of Economic Development and Trade subjects export contracts for certain
6
groups of agricultural products to registration. The key items exported from Ukraine are
subjected to licensing and/or quotas where applicable and must be registered prior the export.
In 2016, Ukraine established itself as an export leader in several categories (Figure 1): • 1st place in world export of sunflower oil, 4.8 billion USD (32% of total world export); • 3rd place in world export of barley, 653.4 million USD (8.5%); • 3rd place in world export of maize, 2.4 billion USD (8.4%); • 6th place in world export of wheat, 2.6 billion USD (7.2%); • 7th place in world export of soybean, 645.3 million USD (1.3%).
The production of cereal and industrial crops tends to be the focal point for agricultural
enterprises. Major cereal crops of grain markets in Ukraine incorporate winter wheat, spring
barley and fodder maize. Winter wheat is the core crop for both private farms and agricultural
enterprises.
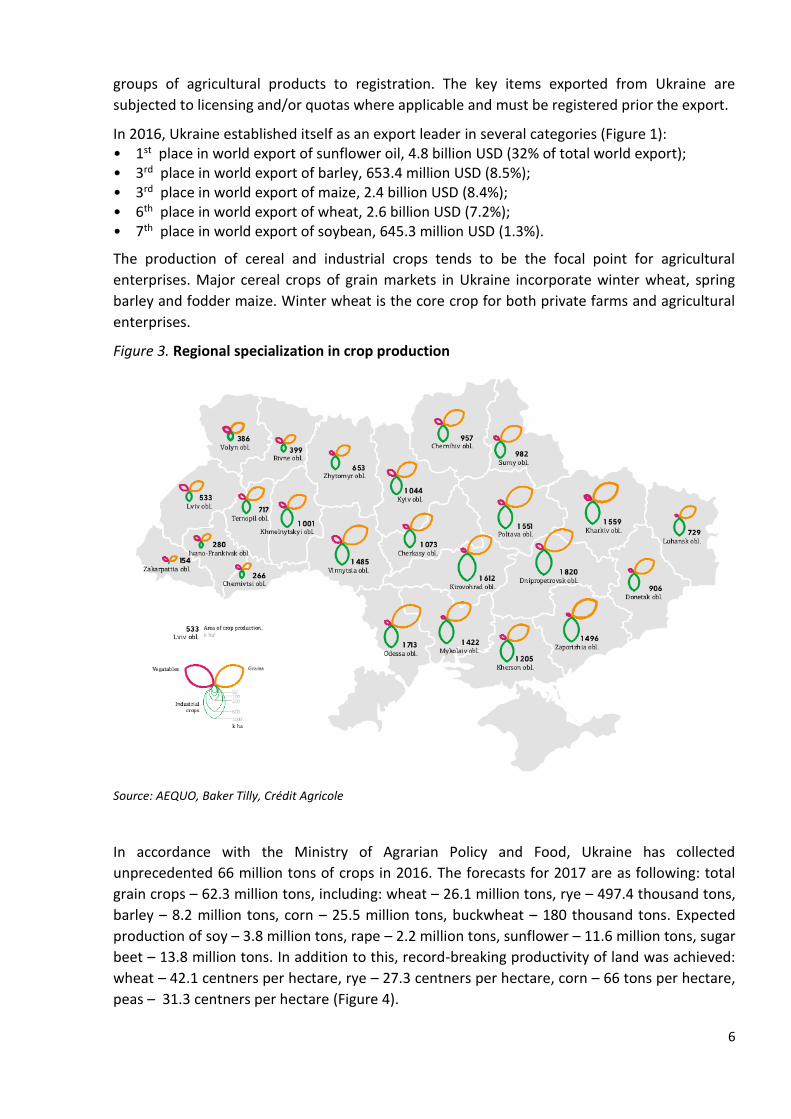
Figure 3. Regional specialization in crop production
Source: AEQUO, Baker Tilly, Crédit Agricole
In accordance with the Ministry of Agrarian Policy and Food, Ukraine has collected
unprecedented 66 million tons of crops in 2016. The forecasts for 2017 are as following: total
grain crops – 62.3 million tons, including: wheat – 26.1 million tons, rye – 497.4 thousand tons,
barley – 8.2 million tons, corn – 25.5 million tons, buckwheat – 180 thousand tons. Expected
production of soy – 3.8 million tons, rape – 2.2 million tons, sunflower – 11.6 million tons, sugar
beet – 13.8 million tons. In addition to this, record-breaking productivity of land was achieved:
wheat – 42.1 centners per hectare, rye – 27.3 centners per hectare, corn – 66 tons per hectare,
peas – 31.3 centners per hectare (Figure 4).
7
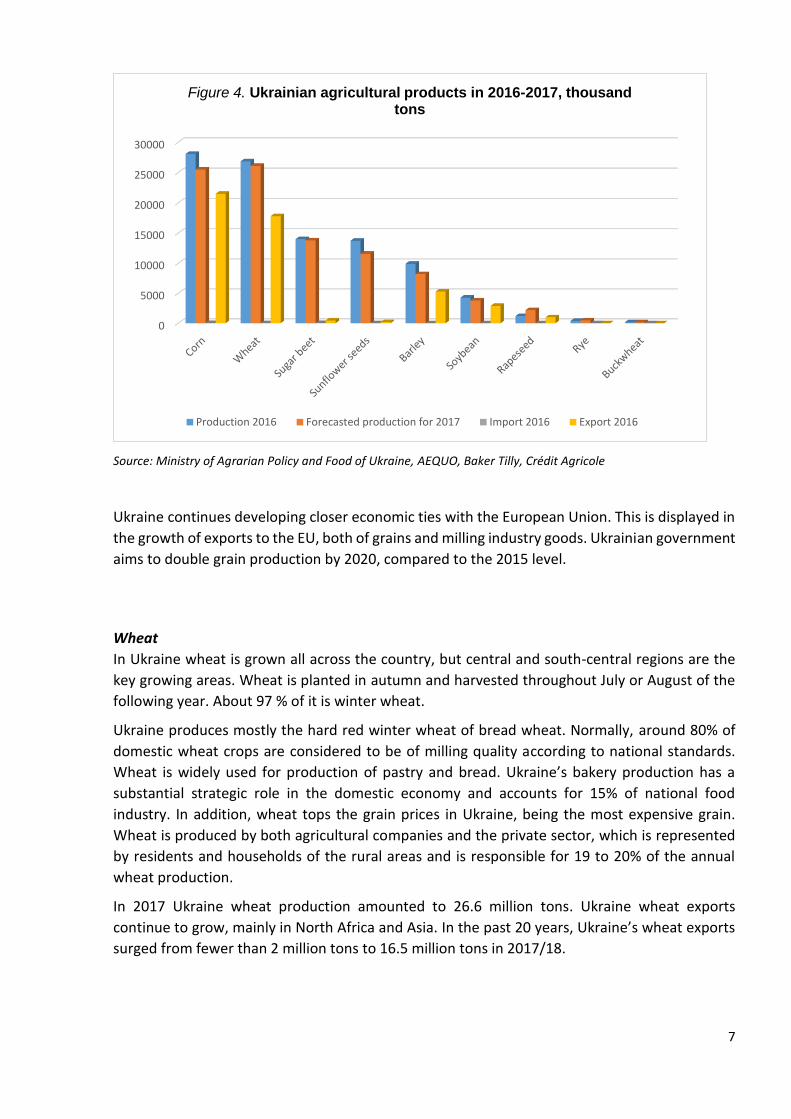
Source: Ministry of Agrarian Policy and Food of Ukraine, AEQUO, Baker Tilly, Crédit Agricole
Ukraine continues developing closer economic ties with the European Union. This is displayed in
the growth of exports to the EU, both of grains and milling industry goods. Ukrainian government
aims to double grain production by 2020, compared to the 2015 level.
Wheat
In Ukraine wheat is grown all across the country, but central and south-central regions are the
key growing areas. Wheat is planted in autumn and harvested throughout July or August of the
following year. About 97 % of it is winter wheat.
Ukraine produces mostly the hard red winter wheat of bread wheat. Normally, around 80% of
domestic wheat crops are considered to be of milling quality according to national standards.
Wheat is widely used for production of pastry and bread. Ukraine’s bakery production has a
substantial strategic role in the domestic economy and accounts for 15% of national food
industry. In addition, wheat tops the grain prices in Ukraine, being the most expensive grain.
Wheat is produced by both agricultural companies and the private sector, which is represented
by residents and households of the rural areas and is responsible for 19 to 20% of the annual
wheat production.
In 2017 Ukraine wheat production amounted to 26.6 million tons. Ukraine wheat exports
continue to grow, mainly in North Africa and Asia. In the past 20 years, Ukraine’s wheat exports
surged from fewer than 2 million tons to 16.5 million tons in 2017/18.
0
5000
10000
15000
20000
25000
30000
Figure 4. Ukrainian agricultural products in 2016-2017, thousand tons
Production 2016 Forecasted production for 2017 Import 2016 Export 2016
8
Corn
The planting zone of corn has increased despite a number of constraints, such as obsolete and
insufficient harvesting equipment, the high cost of production, especially post-harvest drying
costs, and pilferage. The main growing region is eastern and southern Ukraine, although rainfall
in some oblasts (regions) in the extreme south is too low to support growth of this crop. Corn is
usually planted in late April or early May. Harvest starts in mid-September and is completing by
early November. Only 25-50% of general corn area is harvested for grain, the remainder being
cut for silage, normally throughout August.
Spring frosts and adverse weather conditions, which developed throughout the most territory of Ukraine in the period of corn ripeness and harvesting, caused some reduction of grain yield and quality indices. According to “APK-Inform Agency” (leading agribusiness consulting agency in the CIS countries) analysts, despite increasing of the planted areas under the grain in 2017/18 MY by more than 5% – to 4.52 million ha, the harvested areas were estimated at 4.48 million ha. Therefore, in terms of the average yield at 5.97 t/ha, Ukrainian agrarians will manage to harvest 26.7 million tons of corn, a decrease of 4.8% compared with last year.
Taking into account the carry-over stocks, which in the current season almost halved compared with last year, and total nearly 715 thousand tons, in 2017/18 MY the export potential of corn from Ukraine is forecasted at 19.2 million tons, down nearly 10% compared with the previous season figures.
Industrial crops in Ukraine are sugar beet, sunflower and rapeseed. Numerous farms specialize
in production of the first two crops.
Sugar beet
Sugar beet is primarily grown in central and western regions. The beet is planted at the end April
– beginning of May and harvested from mid-September until the end of October. The Ukrainian
sugar industry contributes about 1.2% to GDP.
According to the National Association of Sugar producers of Ukraine “Ukrsugar”, during January-
November 2017, 551 thousand tons of sugar were exported, which is 64% more than in the same
period of the last year — 335.25 thousand tons. The geography of exports did not
change significantly. The main deliveries were carried out to Turkmenistan (14%), Sri Lanka
(14%), Switzerland (12%), Azerbaijan (11%) and Turkey (10%). Such an increase was conditioned
by the favorable price situation in the world market at the beginning of the year and a significant
increase in sugar production. As of December 2017, 1.75 million tons of sugar were produced and
12.27 million tons of sugar beet processed.
In total, 46 sugar refineries worked in the season, 24 of which have already completed the
production season.
Sunflower
Over recent years, the market of sunflower has experienced a simultaneous intensification and
extensification of production .
9
Source: APK inform
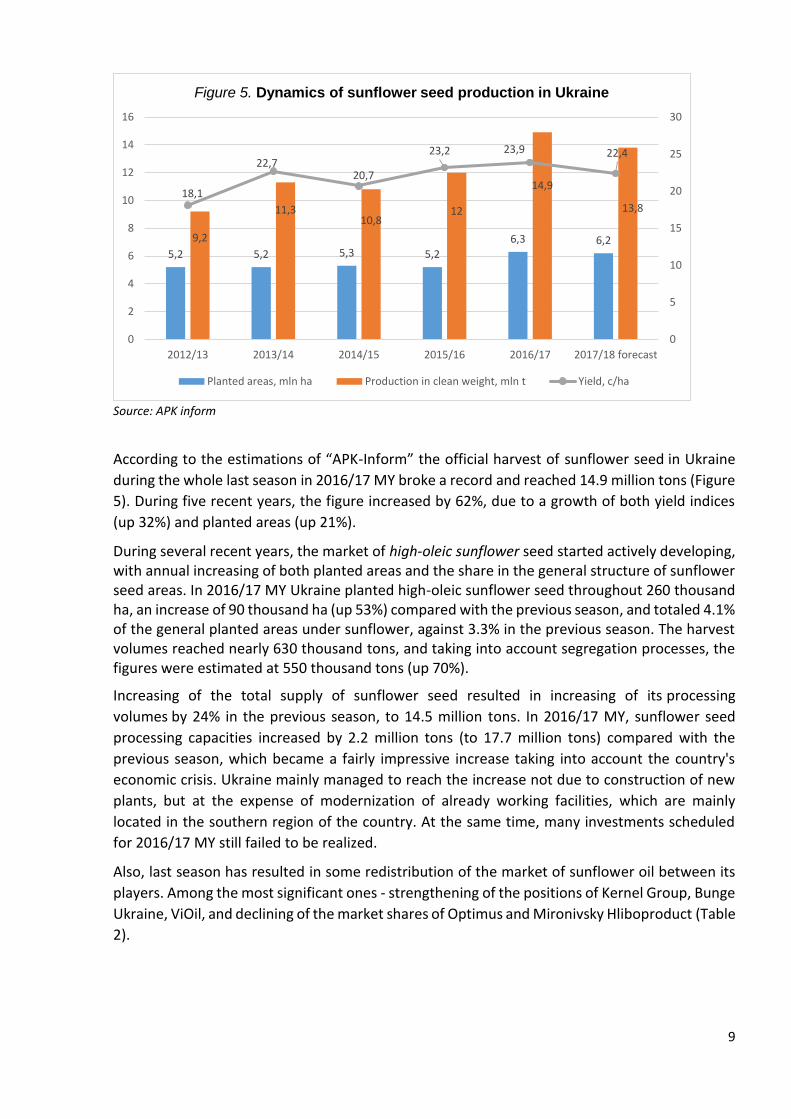
According to the estimations of “APK-Inform” the official harvest of sunflower seed in Ukraine
during the whole last season in 2016/17 MY broke a record and reached 14.9 million tons (Figure
5). During five recent years, the figure increased by 62%, due to a growth of both yield indices
(up 32%) and planted areas (up 21%).
During several recent years, the market of high-oleic sunflower seed started actively developing, with annual increasing of both planted areas and the share in the general structure of sunflower seed areas. In 2016/17 MY Ukraine planted high-oleic sunflower seed throughout 260 thousand ha, an increase of 90 thousand ha (up 53%) compared with the previous season, and totaled 4.1% of the general planted areas under sunflower, against 3.3% in the previous season. The harvest volumes reached nearly 630 thousand tons, and taking into account segregation processes, the figures were estimated at 550 thousand tons (up 70%).
Increasing of the total supply of sunflower seed resulted in increasing of its processing
volumes by 24% in the previous season, to 14.5 million tons. In 2016/17 MY, sunflower seed
processing capacities increased by 2.2 million tons (to 17.7 million tons) compared with the
previous season, which became a fairly impressive increase taking into account the country's
economic crisis. Ukraine mainly managed to reach the increase not due to construction of new
plants, but at the expense of modernization of already working facilities, which are mainly
located in the southern region of the country. At the same time, many investments scheduled
for 2016/17 MY still failed to be realized.
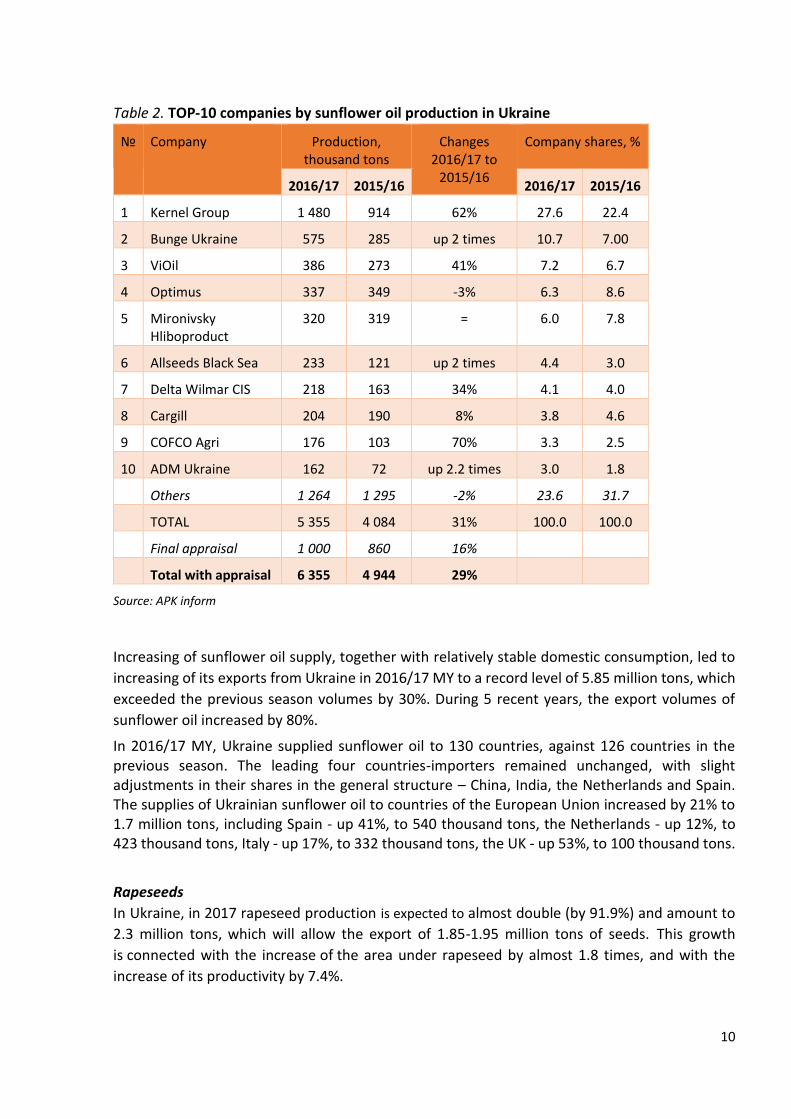
Also, last season has resulted in some redistribution of the market of sunflower oil between its
players. Among the most significant ones - strengthening of the positions of Kernel Group, Bunge
Ukraine, ViOil, and declining of the market shares of Optimus and Mironivsky Hliboproduct (Table
2).
5,2 5,2 5,3 5,2
6,3 6,29,2
11,310,8
12
14,9
13,818,1
22,720,7
23,2 23,9 22,4
0
5
10
15
20
25
30
0
2
4
6
8
10
12
14
16
2012/13 2013/14 2014/15 2015/16 2016/17 2017/18 forecast
Figure 5. Dynamics of sunflower seed production in Ukraine
Planted areas, mln ha Production in clean weight, mln t Yield, c/ha
10
Table 2. TOP-10 companies by sunflower oil production in Ukraine
№ Company Production, thousand tons
Changes 2016/17 to
2015/16
Company shares, %
2016/17 2015/16 2016/17 2015/16
1 Kernel Group 1 480 914 62% 27.6 22.4
2 Bunge Ukraine 575 285 up 2 times 10.7 7.00
3 ViOil 386 273 41% 7.2 6.7
4 Optimus 337 349 -3% 6.3 8.6
5 Mironivsky Hliboproduct
320 319 = 6.0 7.8
6 Allseeds Black Sea 233 121 up 2 times 4.4 3.0
7 Delta Wilmar CIS 218 163 34% 4.1 4.0
8 Cargill 204 190 8% 3.8 4.6
9 COFCO Agri 176 103 70% 3.3 2.5
10 ADM Ukraine 162 72 up 2.2 times 3.0 1.8
Others 1 264 1 295 -2% 23.6 31.7
TOTAL 5 355 4 084 31% 100.0 100.0
Final appraisal 1 000 860 16%
Total with appraisal 6 355 4 944 29%
Source: APK inform
Increasing of sunflower oil supply, together with relatively stable domestic consumption, led to
increasing of its exports from Ukraine in 2016/17 MY to a record level of 5.85 million tons, which
exceeded the previous season volumes by 30%. During 5 recent years, the export volumes of
sunflower oil increased by 80%.
In 2016/17 MY, Ukraine supplied sunflower oil to 130 countries, against 126 countries in the previous season. The leading four countries-importers remained unchanged, with slight adjustments in their shares in the general structure – China, India, the Netherlands and Spain. The supplies of Ukrainian sunflower oil to countries of the European Union increased by 21% to 1.7 million tons, including Spain - up 41%, to 540 thousand tons, the Netherlands - up 12%, to 423 thousand tons, Italy - up 17%, to 332 thousand tons, the UK - up 53%, to 100 thousand tons.
Rapeseeds
In Ukraine, in 2017 rapeseed production is expected to almost double (by 91.9%) and amount to
2.3 million tons, which will allow the export of 1.85-1.95 million tons of seeds. This growth
is connected with the increase of the area under rapeseed by almost 1.8 times, and with the
increase of its productivity by 7.4%.
11
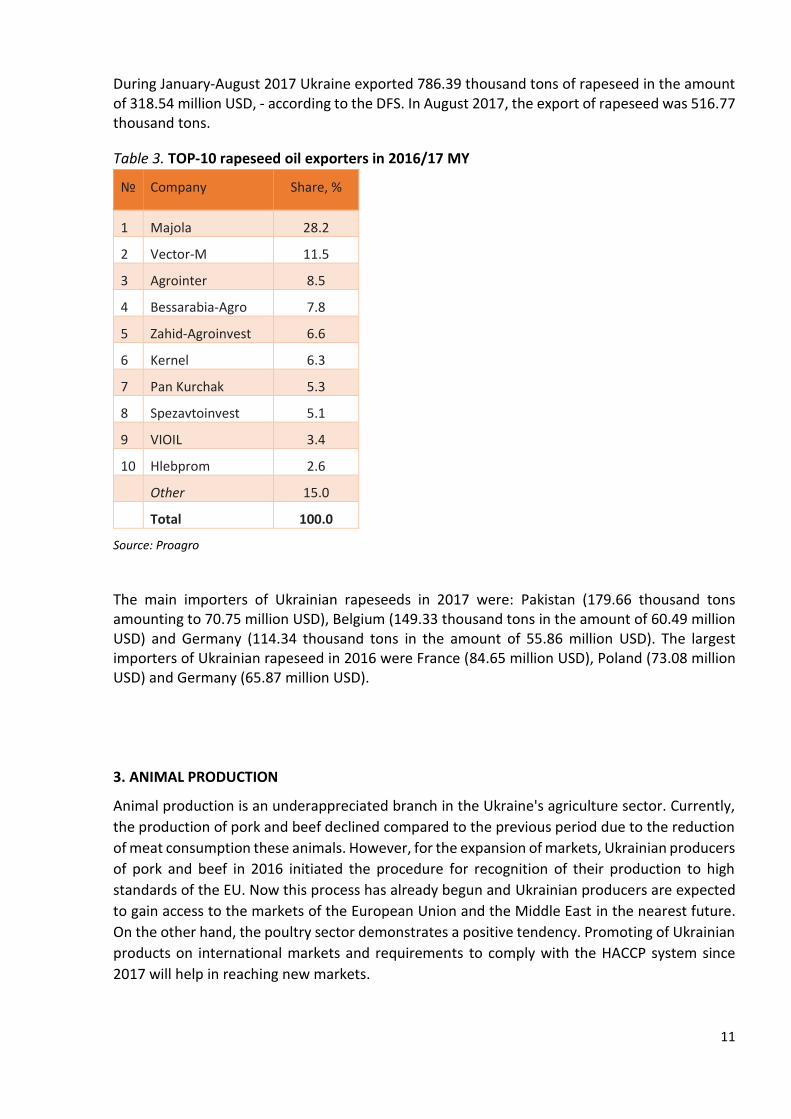
During January-August 2017 Ukraine exported 786.39 thousand tons of rapeseed in the amount of 318.54 million USD, - according to the DFS. In August 2017, the export of rapeseed was 516.77 thousand tons.
Table 3. TOP-10 rapeseed oil exporters in 2016/17 MY
№ Company Share, %
1 Majola 28.2
2 Vector-M 11.5
3 Agrointer 8.5
4 Bessarabia-Agro 7.8
5 Zahid-Agroinvest 6.6
6 Kernel 6.3
7 Pan Kurchak 5.3
8 Spezavtoinvest 5.1
9 VIOIL 3.4
10 Hlebprom 2.6
Other 15.0
Total 100.0
Source: Proagro
The main importers of Ukrainian rapeseeds in 2017 were: Pakistan (179.66 thousand tons amounting to 70.75 million USD), Belgium (149.33 thousand tons in the amount of 60.49 million USD) and Germany (114.34 thousand tons in the amount of 55.86 million USD). The largest importers of Ukrainian rapeseed in 2016 were France (84.65 million USD), Poland (73.08 million USD) and Germany (65.87 million USD).
3. ANIMAL PRODUCTION
Animal production is an underappreciated branch in the Ukraine's agriculture sector. Currently,
the production of pork and beef declined compared to the previous period due to the reduction
of meat consumption these animals. However, for the expansion of markets, Ukrainian producers
of pork and beef in 2016 initiated the procedure for recognition of their production to high
standards of the EU. Now this process has already begun and Ukrainian producers are expected
to gain access to the markets of the European Union and the Middle East in the nearest future.
On the other hand, the poultry sector demonstrates a positive tendency. Promoting of Ukrainian
products on international markets and requirements to comply with the HACCP system since
2017 will help in reaching new markets.
12
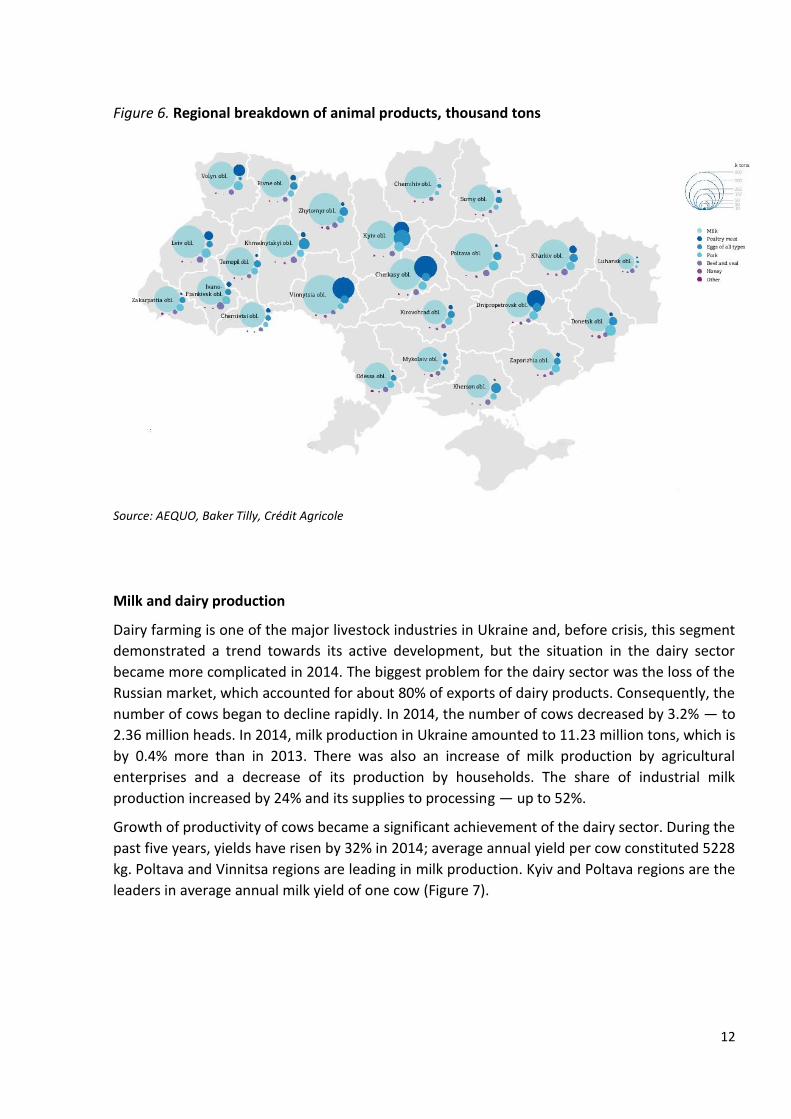
Figure 6. Regional breakdown of animal products, thousand tons
Source: AEQUO, Baker Tilly, Crédit Agricole
Milk and dairy production
Dairy farming is one of the major livestock industries in Ukraine and, before crisis, this segment
demonstrated a trend towards its active development, but the situation in the dairy sector
became more complicated in 2014. The biggest problem for the dairy sector was the loss of the
Russian market, which accounted for about 80% of exports of dairy products. Consequently, the
number of cows began to decline rapidly. In 2014, the number of cows decreased by 3.2% — to
2.36 million heads. In 2014, milk production in Ukraine amounted to 11.23 million tons, which is
by 0.4% more than in 2013. There was also an increase of milk production by agricultural
enterprises and a decrease of its production by households. The share of industrial milk
production increased by 24% and its supplies to processing — up to 52%.
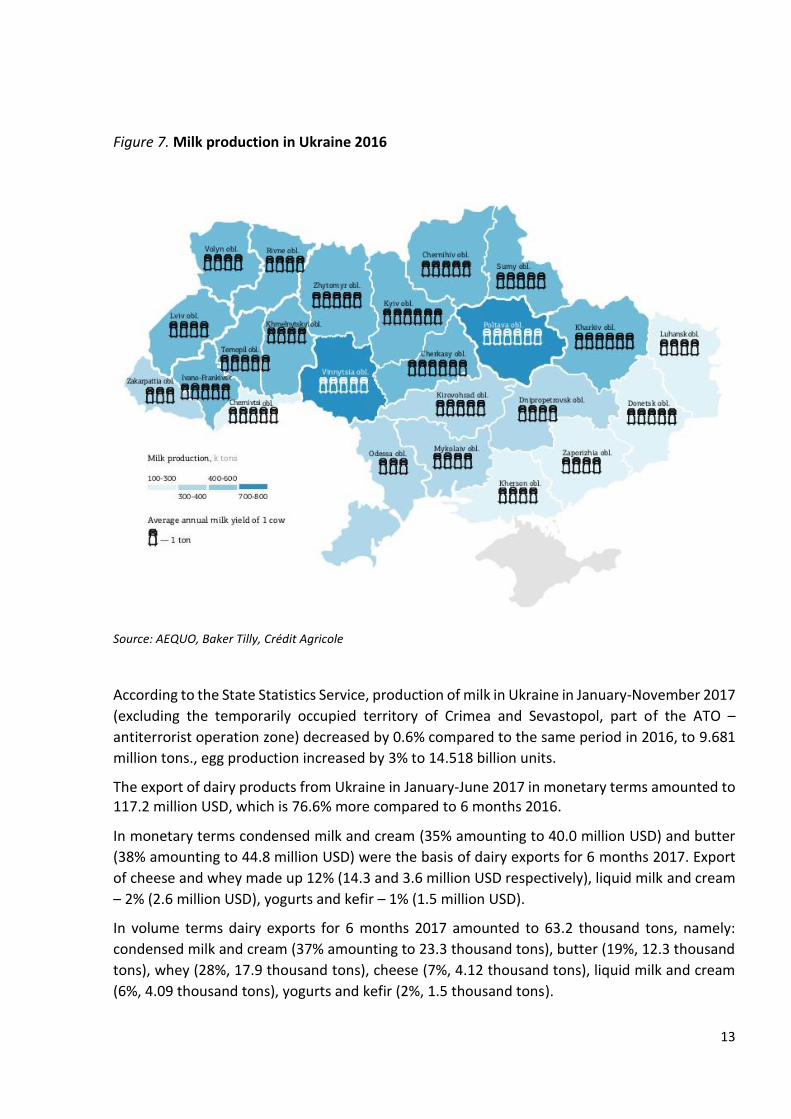
Growth of productivity of cows became a significant achievement of the dairy sector. During the
past five years, yields have risen by 32% in 2014; average annual yield per cow constituted 5228
kg. Poltava and Vinnitsa regions are leading in milk production. Kyiv and Poltava regions are the
leaders in average annual milk yield of one cow (Figure 7).
13
Figure 7. Milk production in Ukraine 2016
Source: AEQUO, Baker Tilly, Crédit Agricole
According to the State Statistics Service, production of milk in Ukraine in January-November 2017
(excluding the temporarily occupied territory of Crimea and Sevastopol, part of the ATO –
antiterrorist operation zone) decreased by 0.6% compared to the same period in 2016, to 9.681
million tons., egg production increased by 3% to 14.518 billion units.
The export of dairy products from Ukraine in January-June 2017 in monetary terms amounted to 117.2 million USD, which is 76.6% more compared to 6 months 2016.
In monetary terms condensed milk and cream (35% amounting to 40.0 million USD) and butter
(38% amounting to 44.8 million USD) were the basis of dairy exports for 6 months 2017. Export
of cheese and whey made up 12% (14.3 and 3.6 million USD respectively), liquid milk and cream
– 2% (2.6 million USD), yogurts and kefir – 1% (1.5 million USD).
In volume terms dairy exports for 6 months 2017 amounted to 63.2 thousand tons, namely:
condensed milk and cream (37% amounting to 23.3 thousand tons), butter (19%, 12.3 thousand
tons), whey (28%, 17.9 thousand tons), cheese (7%, 4.12 thousand tons), liquid milk and cream
(6%, 4.09 thousand tons), yogurts and kefir (2%, 1.5 thousand tons).
14
The leadership in the export of milk powder and cream belonged to Vinnytsia Dairy Plant “Roshen” (15%), Starokostiantynivsky Dairy Plant (8%), Belotserkivska Agro-Industrial Group (8%), Ruzhin-Moloko (4%) and Veselynivsky Skim Milk Plant (4%). Thus, the five largest exporters provided 39% of the supply of this product abroad in January-June 2017.
In the butter segment, the leading export companies in the period were Vinnytsia Dairy Plant Roshen (12%), Starokostiantynivsky Dairy Plant (7%), Yagotyn Dairy Plant (7%), Veselynivsky Skim Milk Plant (3%) and Ichnyan Plant of dry milk and butter (2%).These companies provided 32% of butter exports. Top importing countries of butter were Turkey, Morocco and the Netherlands.
Five major cheese exporters shipped nearly 72% of the total volume of supplies from Ukraine in 6 months 2017. In particular, Como-Export provided 21.4%, Cheese Club – 17%, Laktalis-Ukraine 15%, Bel Shostka Ukraine – 13% and Milkiland-Ukraine 7%. In 2016 Ukrainian companies sold abroad 8.1 thousand tons of cheese, which is 26% lower than in 2015 and 2.4 times less than the volume exported in 2014. The largest buyers of these products in the past year were Kazakhstan (13.1 million USD, or 54%), Moldova (6.5 million USD, or 27%) and Egypt (1.9 million USD, or 8%).
The main challenge for the dairy industry in Ukraine is finding new export markets and developing
the existing markets. To do this, it is important to develop a systemic state export policy that
requires work with each particular country of destination. One of the perspectives for Ukraine is
also an export-oriented organic milk production, as more and more people pay attention to
health and are willing to pay for quality products. The demand for dairy products for baby food
is also increasing around the world, especially in China.
On January 10th, 2016 the Ukrainian milk processing companies received the access to the EU
market from the European Commission. The first country to receive Ukrainian dairy products was
Bulgaria.
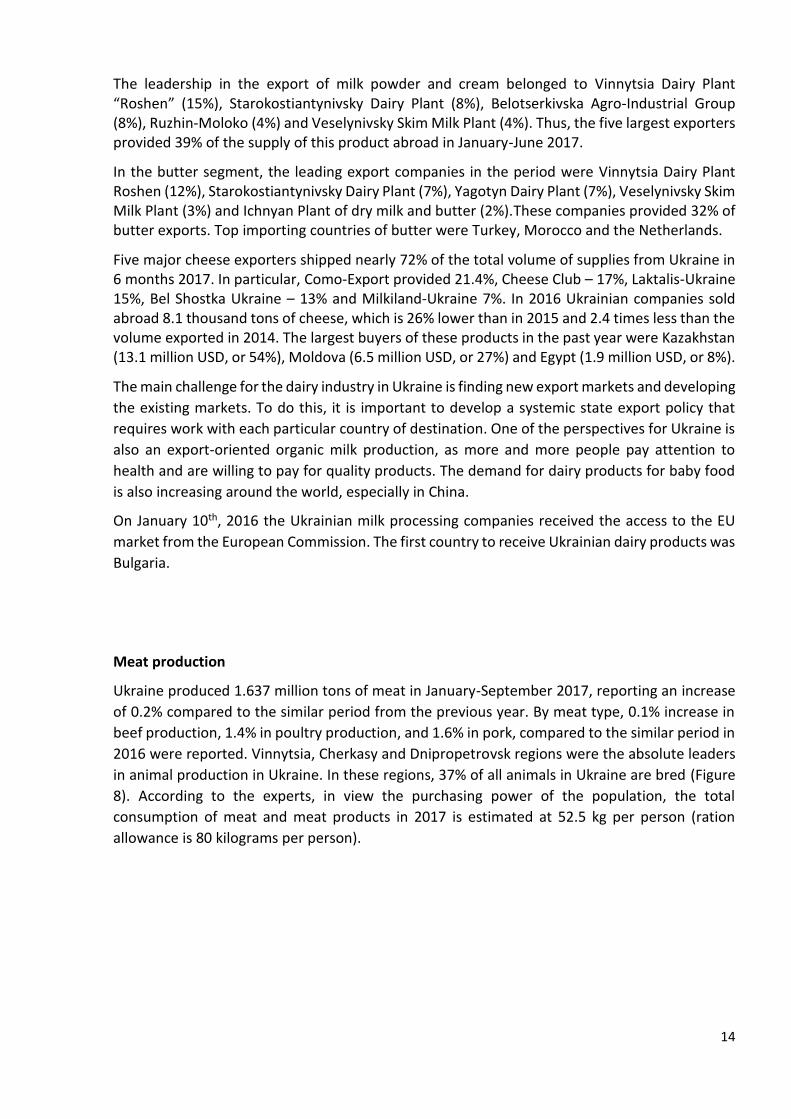
Meat production
Ukraine produced 1.637 million tons of meat in January-September 2017, reporting an increase
of 0.2% compared to the similar period from the previous year. By meat type, 0.1% increase in
beef production, 1.4% in poultry production, and 1.6% in pork, compared to the similar period in
2016 were reported. Vinnytsia, Cherkasy and Dnipropetrovsk regions were the absolute leaders
in animal production in Ukraine. In these regions, 37% of all animals in Ukraine are bred (Figure
8). According to the experts, in view the purchasing power of the population, the total
consumption of meat and meat products in 2017 is estimated at 52.5 kg per person (ration
allowance is 80 kilograms per person).
15
Figure 8. Meat and meat products in Ukraine in 2016
Source: AEQUO, Baker Tilly, Crédit Agricole
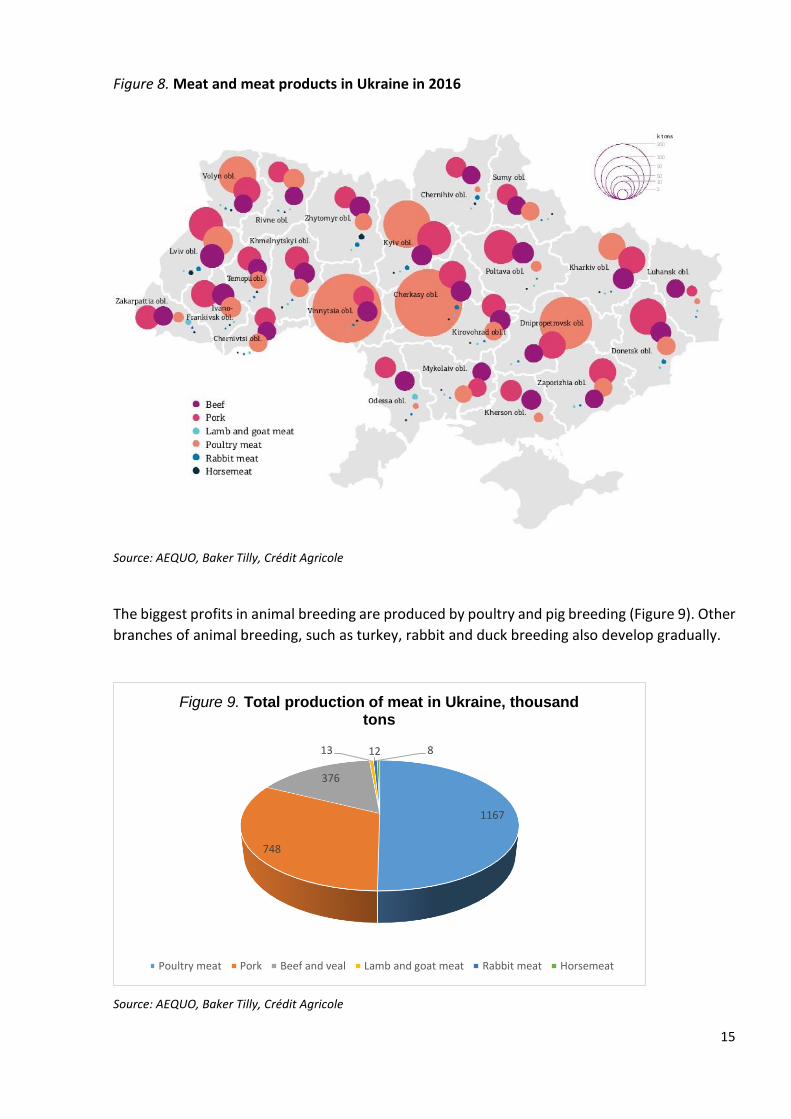
The biggest profits in animal breeding are produced by poultry and pig breeding (Figure 9). Other
branches of animal breeding, such as turkey, rabbit and duck breeding also develop gradually.
Source: AEQUO, Baker Tilly, Crédit Agricole
1167
748
376
13 12 8
Figure 9. Total production of meat in Ukraine, thousand tons
Poultry meat Pork Beef and veal Lamb and goat meat Rabbit meat Horsemeat
16
During January-September 2017, Ukraine's meat and meat products exports increased by 23%
compared to 9 months 2016, reaching 268 thousand tons. Whilst, the meat imports rose by 22%
in the same period, reaching 156 thousand tons.
The biggest growth in export sales was observed in poultry segment. Poultry meat shipments
from Ukraine accounted for 79% of the country's total meat exports, namely 212 thousand tons
were exported increasing by 19% compared to January-September 2016. In value terms the
growth made up 38.2% amounting to 294.9 million USD. Exports of poultry meat from Ukraine
by the end of 2017 is expected to make up about 240 thousand tons. Ukrainian poultry
producers exported to 63 countries in 2017, among them to a number of states in the Middle
East, Central and East Asia and Africa. The increase in poultry exports was based on the strong
demand reported in Egypt (buying 17.1% of total supplies), the Netherlands (14.3%), Iraq (8.8%),
Belarus (8.4%) and Azerbaijan (7.6%).
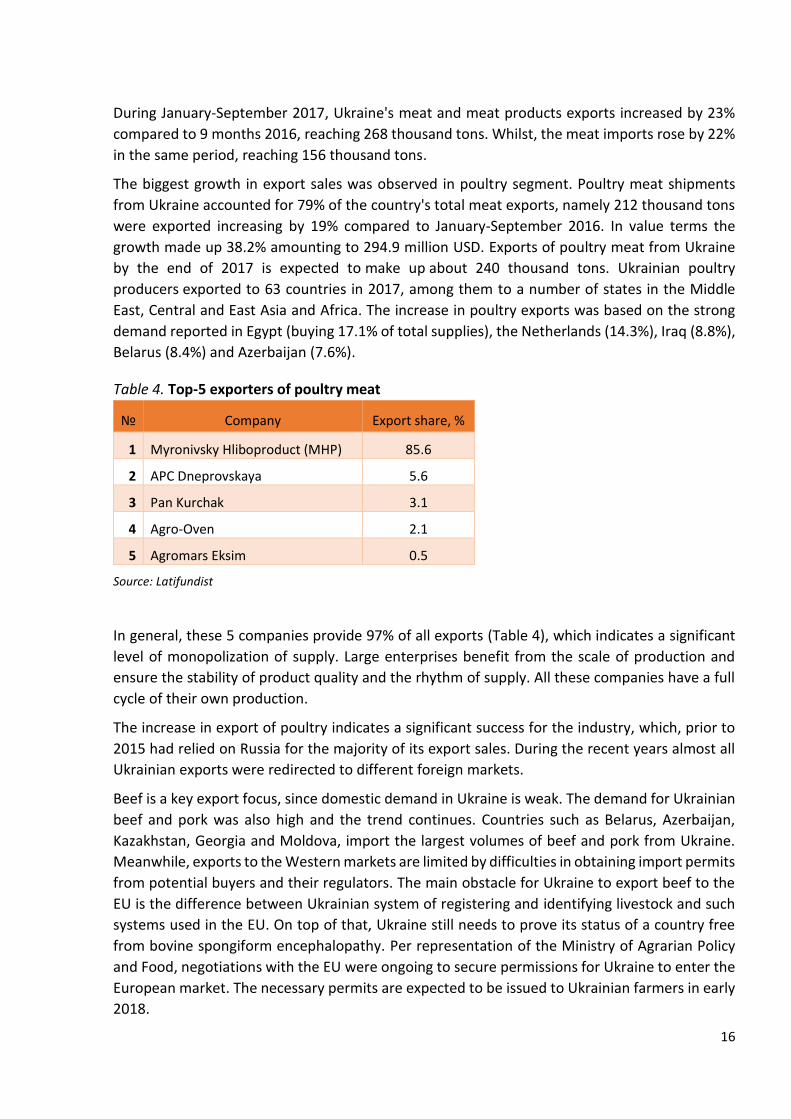
Table 4. Top-5 exporters of poultry meat
№ Company Export share, %
1 Myronivsky Hliboproduct (MHP) 85.6
2 APC Dneprovskaya 5.6
3 Pan Kurchak 3.1
4 Agro-Oven 2.1
5 Agromars Eksim 0.5
Source: Latifundist
In general, these 5 companies provide 97% of all exports (Table 4), which indicates a significant
level of monopolization of supply. Large enterprises benefit from the scale of production and
ensure the stability of product quality and the rhythm of supply. All these companies have a full
cycle of their own production.
The increase in export of poultry indicates a significant success for the industry, which, prior to
2015 had relied on Russia for the majority of its export sales. During the recent years almost all
Ukrainian exports were redirected to different foreign markets.
Beef is a key export focus, since domestic demand in Ukraine is weak. The demand for Ukrainian
beef and pork was also high and the trend continues. Countries such as Belarus, Azerbaijan,
Kazakhstan, Georgia and Moldova, import the largest volumes of beef and pork from Ukraine.
Meanwhile, exports to the Western markets are limited by difficulties in obtaining import permits
from potential buyers and their regulators. The main obstacle for Ukraine to export beef to the
EU is the difference between Ukrainian system of registering and identifying livestock and such
systems used in the EU. On top of that, Ukraine still needs to prove its status of a country free
from bovine spongiform encephalopathy. Per representation of the Ministry of Agrarian Policy
and Food, negotiations with the EU were ongoing to secure permissions for Ukraine to enter the
European market. The necessary permits are expected to be issued to Ukrainian farmers in early
2018.
17
During January-July 2017 the volume of export of fresh beef was 6.5 thousand tons (6.4 thousand
tons of which were exported to Belarus). Revenue from the export of this group of goods was
17.2 million USD in the reporting period. The list of the main exporters of this product is much
more differentiated. The first place in terms of sales volume in tons is held by the company
Antonovsky MK (16.1%), followed by Agro-Product (14.7%), Zeus LTD (7.6%), Konotopmyaso
(7.4%) and Svizhenka (6.9%). Frozen beef was purchased by foreign buyers in the amount of 16.9
thousand tons worth 47.3 million USD. Top-5 exporters: Agro-Product (9.1% of the volume of
supplies in physical terms), Rachinmyaso (7.5%), Lubnymyaso (6.7%), Zeus-LTD (4.5%),
Prodkompaniya (4.3%).
Sales of fresh, chilled and frozen pork amounted to 3.9 thousand tons (8.3 million USD). The most
significant volumes of supplies were made by the companies APK-Invest (47.7%), Exim Food
(9.5%), Kremenchuk Myaso (5.6%).
Regarding the Ukraine’s meat imports, which are mainly represented by pork and poultry meat,
most meat products in 2017 were imported from Poland and Germany. The share of imports in
domestic food consumption in January-September 2017 was 10%.
4. FERTILIZERS
Ukraine is one of the world leaders in fertilizers production, specializing in nitrogen fertilizers.
Ukraine’s share on the global mineral fertilizer market is 8%. There are 6 big mineral fertilizer
producers: “Odessa Port Plant”, “DneprAzot” (part of Privat Group), “Rivneazot” (Rivne), “Azot”
(Cherkasy), PJSC “Severodonetsk Azot” (Severodonetsk) , PJSC “Concern STIROL” (Horlivka),
which are part of the OSTCHEM (a holding company that consolidates the GROUP DF assets in
nitrogen fertilizer production, distribution and shipping). OSTCHEM is ranked 3rd in the world for
nitrate production, 4th for ammonia production and 12th for urea production. OSTCHEM
enterprises’ core products are: nitrogen fertilizers such as ammonia, urea, ammonium nitrate,
CAN (calcium ammonium nitrate), UAN (urea ammonium nitrate), and ammonium sulphate. In
addition to fertilizers, the Group`s enterprises produce organic chemicals and organic acids
(adipic acid, succinic acid, methanol, caprolactam, vinyl acetate, polystyrene). Two of the
abovementioned producers – “Severodonetsk Azot” and “Concern STIROL” do not work, because
they are located in the ATO (Antiterrorist Operation) zone in the East of Ukraine.
The largest share of the Ukrainian market of mineral fertilizers belongs to ammonium nitrate. In
total consumption of fertilizers its share amounted from 45 to 50%. A cheaper alternative to
ammonium nitrate is ammonium sulfate. The excess of acidity is compensated by the lowest
price among the other solid nitrogenous fertilizers and the availability of easily digestible form of
sulfur.
The second largest consumable fertilizer in Ukraine is NPK (a complex fertilizer of different
formulas, of which the most popular are the ammonium nitrate phosphate fertilizer (NPK
16:16:16), and diammofoska (NPK 10:26:26). Considering that the Sumykhimprom plant has
successfully introduced these brands, the growth of domestic consumption of NPK in Ukraine by
63% is natural.
18
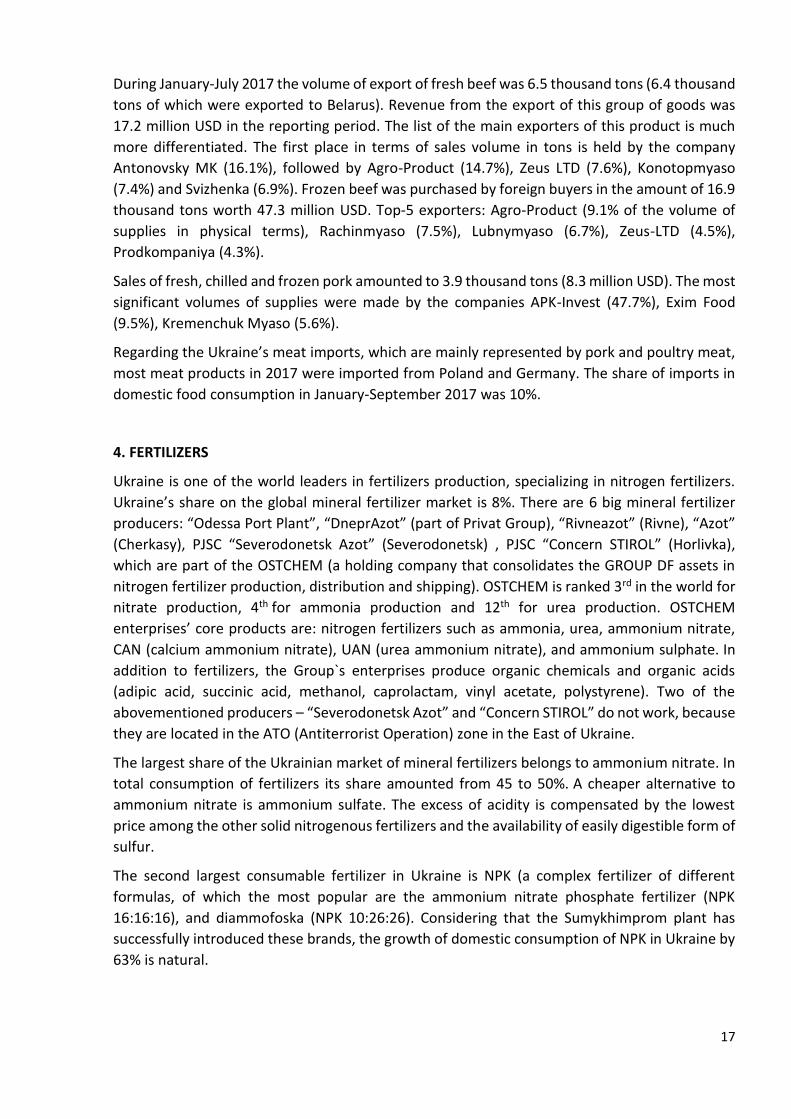
Figure 10. Fertilizers and plant protection products application
Source: AEQUO, Baker Tilly, Crédit Agricole
The diversification of CAM supply sources can lead to more substantial growth of the market.
Besides two traditional suppliers, OSTCHEM and Eurochem, CAM importers of Belarussian origin
and Ukrainian non-industrial producers of CAMp (products based on carbamide-ammonium
mixture) are going to play a prominent role in the market.
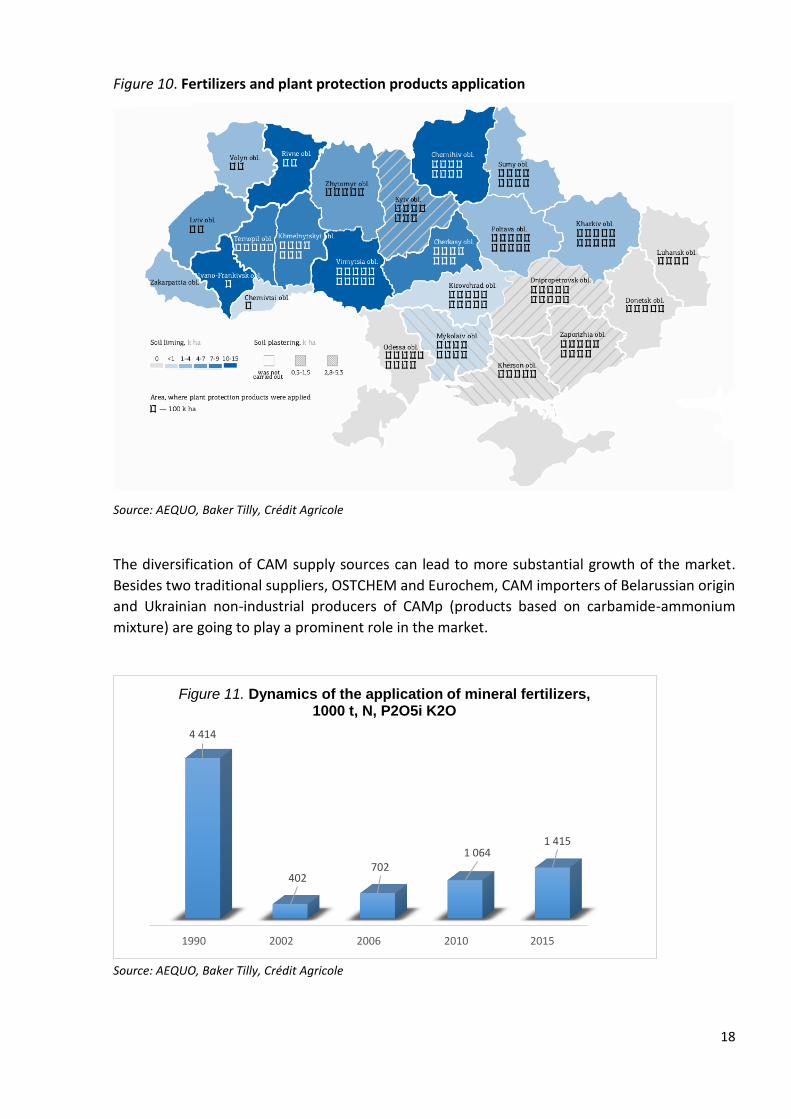
Source: AEQUO, Baker Tilly, Crédit Agricole
1990 2002 2006 2010 2015
4 414
402702
1 0641 415
Figure 11. Dynamics of the application of mineral fertilizers, 1000 t, N, P2O5i K2O
19
Total dependence of the Ukrainian agrochemical industry on the imported raw materials and the
high proportion of imported fertilizers on the market dictate the dependence of Ukrainian prices
on the world market prices. Since the inflation and devaluation rate is unpredictable, many
export-oriented agricultural enterprises forecast the prices for mineral fertilizers on the basis of
the US dollar equivalent.
On the world markets of fertilizers a reduction in prices was a dominant trend in 2015. High harvests in previous years, a decrease in the cultivation of “fuel" crops due to the oil prices decrease, reduction of production costs of fertilizers and surplus of the market will contribute to the low price level of fertilizers during the year.
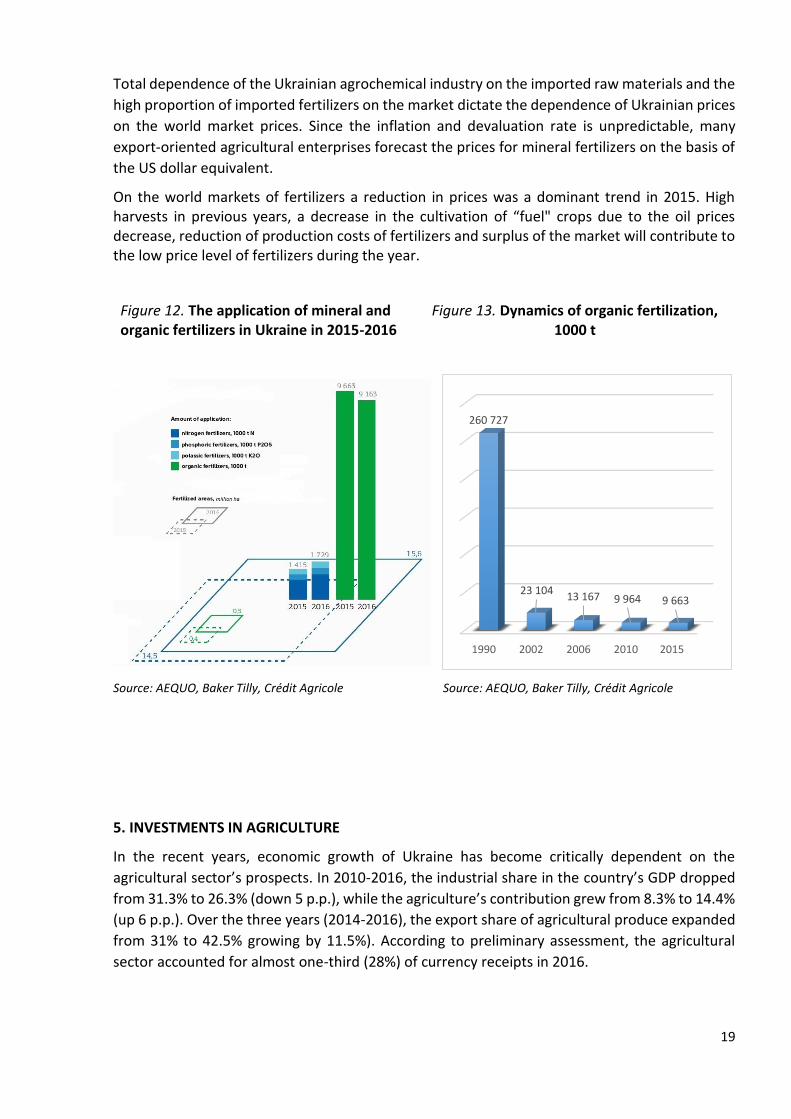
Figure 12. The application of mineral and organic fertilizers in Ukraine in 2015-2016
Figure 13. Dynamics of organic fertilization, 1000 t
Source: AEQUO, Baker Tilly, Crédit Agricole Source: AEQUO, Baker Tilly, Crédit Agricole
5. INVESTMENTS IN AGRICULTURE
In the recent years, economic growth of Ukraine has become critically dependent on the
agricultural sector’s prospects. In 2010-2016, the industrial share in the country’s GDP dropped
from 31.3% to 26.3% (down 5 p.p.), while the agriculture’s contribution grew from 8.3% to 14.4%
(up 6 p.p.). Over the three years (2014-2016), the export share of agricultural produce expanded
from 31% to 42.5% growing by 11.5%). According to preliminary assessment, the agricultural
sector accounted for almost one-third (28%) of currency receipts in 2016.
1990 2002 2006 2010 2015
260 727
23 10413 167 9 964 9 663
20
Further growth of the agricultural sector requires affordable and sizable financing. The financing
goals may include the following:
expanding the production volume and assortment of agricultural products;
improving their quality and increasing the added-value share;
major overhaul of production facilities and technologies;
optimization of the production-sale cycle.
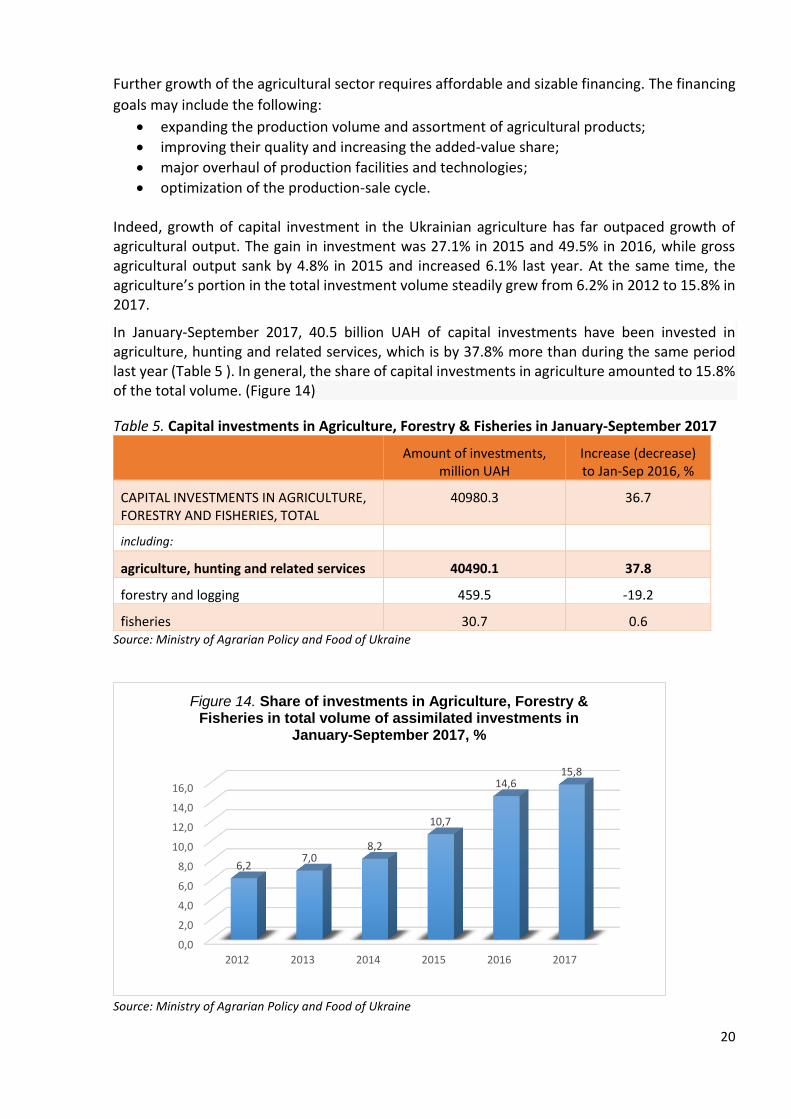
Indeed, growth of capital investment in the Ukrainian agriculture has far outpaced growth of agricultural output. The gain in investment was 27.1% in 2015 and 49.5% in 2016, while gross agricultural output sank by 4.8% in 2015 and increased 6.1% last year. At the same time, the agriculture’s portion in the total investment volume steadily grew from 6.2% in 2012 to 15.8% in 2017.
In January-September 2017, 40.5 billion UAH of capital investments have been invested in agriculture, hunting and related services, which is by 37.8% more than during the same period last year (Table 5 ). In general, the share of capital investments in agriculture amounted to 15.8% of the total volume. (Figure 14)
Table 5. Capital investments in Agriculture, Forestry & Fisheries in January-September 2017
Amount of investments, million UAH
Increase (decrease) to Jan-Sep 2016, %
CAPITAL INVESTMENTS IN AGRICULTURE, FORESTRY AND FISHERIES, TOTAL
40980.3 36.7
including:
agriculture, hunting and related services 40490.1 37.8
forestry and logging 459.5 -19.2
fisheries 30.7 0.6 Source: Ministry of Agrarian Policy and Food of Ukraine
Source: Ministry of Agrarian Policy and Food of Ukraine
0,0
2,0
4,0
6,0
8,0
10,0
12,0
14,0
16,0
2012 2013 2014 2015 2016 2017
6,27,0
8,2
10,7
14,615,8
Figure 14. Share of investments in Agriculture, Forestry & Fisheries in total volume of assimilated investments in
January-September 2017, %
21
Source: Ministry of Agrarian Policy and Food of Ukraine
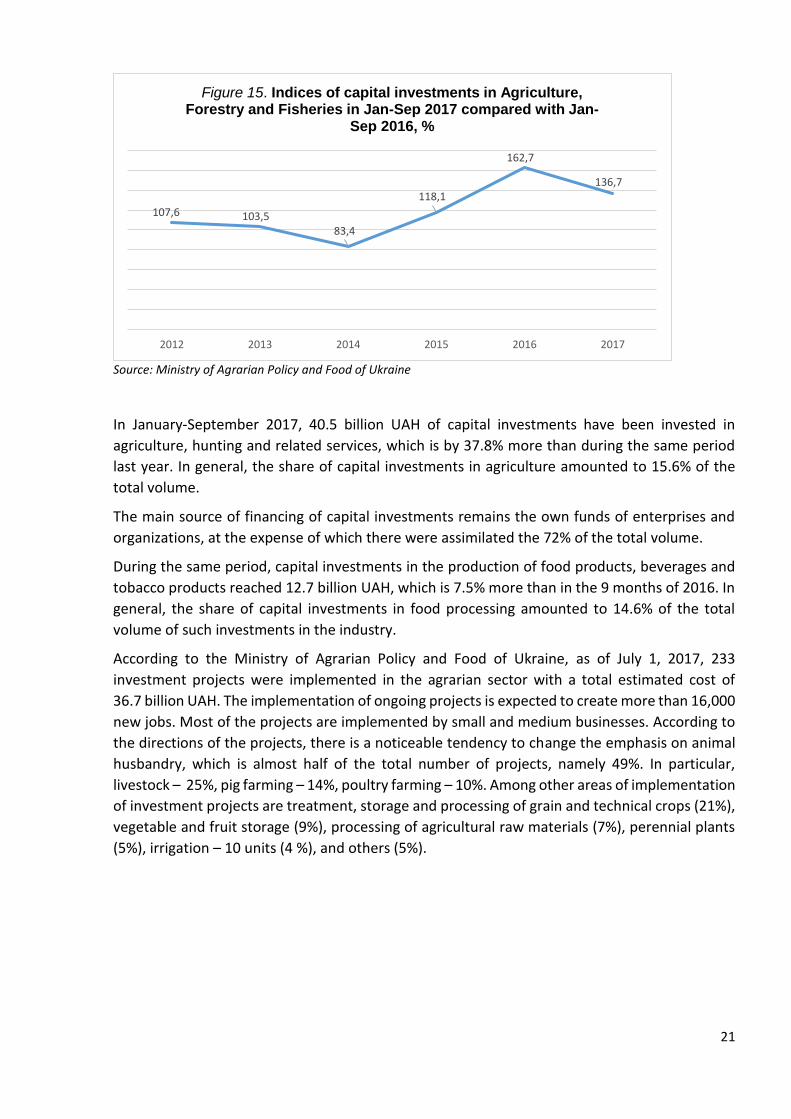
In January-September 2017, 40.5 billion UAH of capital investments have been invested in
agriculture, hunting and related services, which is by 37.8% more than during the same period
last year. In general, the share of capital investments in agriculture amounted to 15.6% of the
total volume.
The main source of financing of capital investments remains the own funds of enterprises and
organizations, at the expense of which there were assimilated the 72% of the total volume.
During the same period, capital investments in the production of food products, beverages and
tobacco products reached 12.7 billion UAH, which is 7.5% more than in the 9 months of 2016. In
general, the share of capital investments in food processing amounted to 14.6% of the total
volume of such investments in the industry.
According to the Ministry of Agrarian Policy and Food of Ukraine, as of July 1, 2017, 233
investment projects were implemented in the agrarian sector with a total estimated cost of
36.7 billion UAH. The implementation of ongoing projects is expected to create more than 16,000
new jobs. Most of the projects are implemented by small and medium businesses. According to
the directions of the projects, there is a noticeable tendency to change the emphasis on animal
husbandry, which is almost half of the total number of projects, namely 49%. In particular,
livestock – 25%, pig farming – 14%, poultry farming – 10%. Among other areas of implementation
of investment projects are treatment, storage and processing of grain and technical crops (21%),
vegetable and fruit storage (9%), processing of agricultural raw materials (7%), perennial plants
(5%), irrigation – 10 units (4 %), and others (5%).
107,6 103,583,4
118,1
162,7
136,7
2012 2013 2014 2015 2016 2017
Figure 15. Indices of capital investments in Agriculture, Forestry and Fisheries in Jan-Sep 2017 compared with Jan-
Sep 2016, %
22
6. USEFUL LINKS AND DATA SOURCES
State Statistics Service of Ukraine http://www.ukrstat.gov.ua/
Ministry of Agrarian Policy and Food of Ukraine http://www.minagro.gov.ua/
National Bank of Ukraine https://www.bank.gov.ua
State Fiscal Service of Ukraine http://sfs.gov.ua
State Service of Ukraine for Food Safety and Consumer Protection http://www.consumer.gov.ua/
Ukrainian Agribusiness Club (UCAB) http://ucab.ua
National Association of Sugar producers of Ukraine (Ukrsugar) http://www.ukrsugar.com
European Business Association (EBA) https://eba.com.ua/
American Chamber of Commerce http://www.chamber.ua/
Latifundist Media (Latifundist.com, Elevatorist.com, Agropolit.com) http://latifundistmedia.com/
APK Inform https://www.apk-inform.com
Proagro http://www.proagro.com.ua/
Ukragroconsult http://www.ukragroconsult.com/
Agravery http://agravery.com/
Ukrainian Food Export Board (UFEB) http://www.ukrainian-food.org
Ukrainian Agrarian Federation (UAC) http://agroconf.org
Agroportal http://agroportal.ua
Interfax http://interfax.com.ua/
Unian https://www.unian.net/
Ukrainian Food Expo http://ufexpo.com.ua
Recommended