Ultraboost:Investigations into the Limits of
Extreme Engine Downsizing
Dr J.W.G. Turner
Jaguar Land Rover Powertrain Research
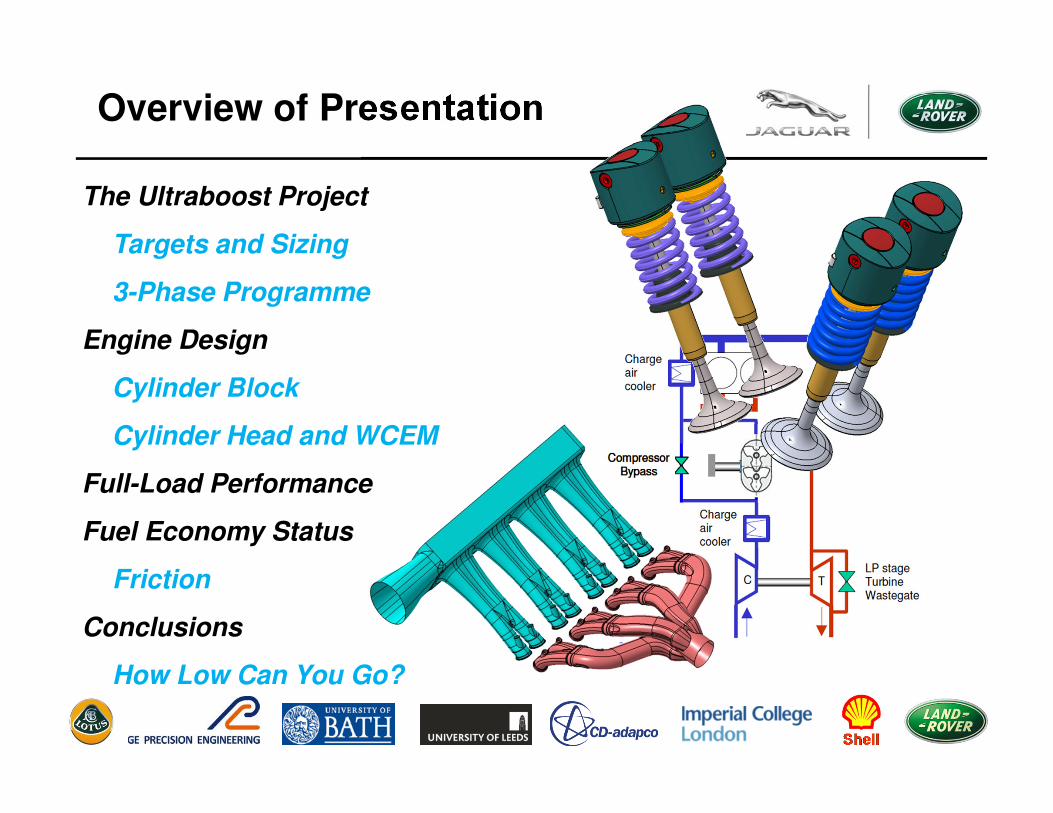
Overview of Presentation
The Ultraboost Project
Targets and Sizing
3-Phase Programme
Engine Design
Cylinder Block
Cylinder Head and WCEM
Full-Load Performance
Fuel Economy Status
Friction
Conclusions
How Low Can You Go?

THE ULTRABOOST PROJECT
The Ultraboost Project
• The ‘Ultraboost’ project aimed to create a highly-boosted, heavily-
downsized engine to provide the torque curve and power output of the
naturally-aspirated Jaguar Land Rover AJ133 5.0 litre V8 engine
• It was funded by the UK Technology Strategy Board as part of its Low-
Carbon Vehicles Programme
• Dyno-based multi-cylinder engine operation formed the core of the
project, with modelling used to demonstrate ~35% reduction in CO2
> From 296 to 192 g/km on the NEDC
> 23% of this had to come from the engine alone
• Operation on 95 RON pump gasoline was required
• The driveability of the original V8 engine was to be maintained
• Operation at very high BMEPs was necessary throughout the wide
speed range typical of a gasoline engine
0
50
100
150
200
250
300
0
100
200
300
400
500
600
0 1000 2000 3000 4000 5000 6000 7000
Po
we
r / [k
W]
To
rqu
e /
[N
m]
Engine Speed / [rpm]
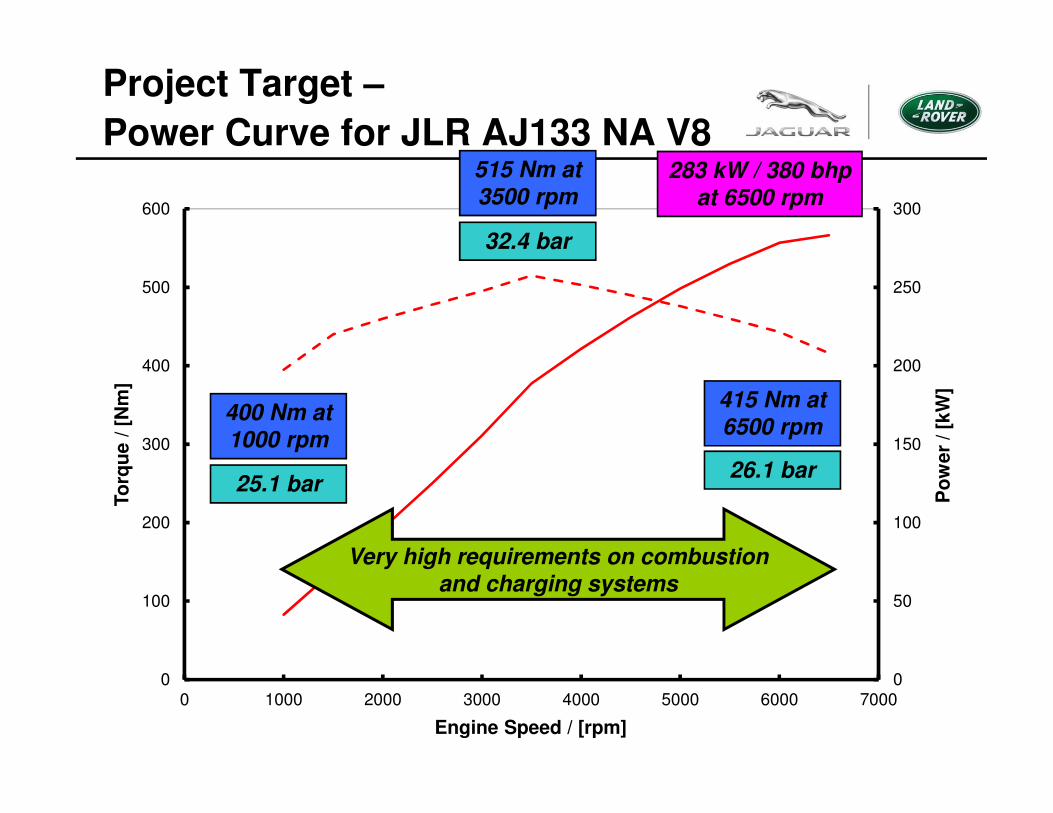
Project Target –
Power Curve for JLR AJ133 NA V8283 kW / 380 bhp
at 6500 rpm
515 Nm at 3500 rpm
400 Nm at 1000 rpm
415 Nm at 6500 rpm
Very high requirements on combustion and charging systems
32.4 bar
25.1 bar26.1 bar
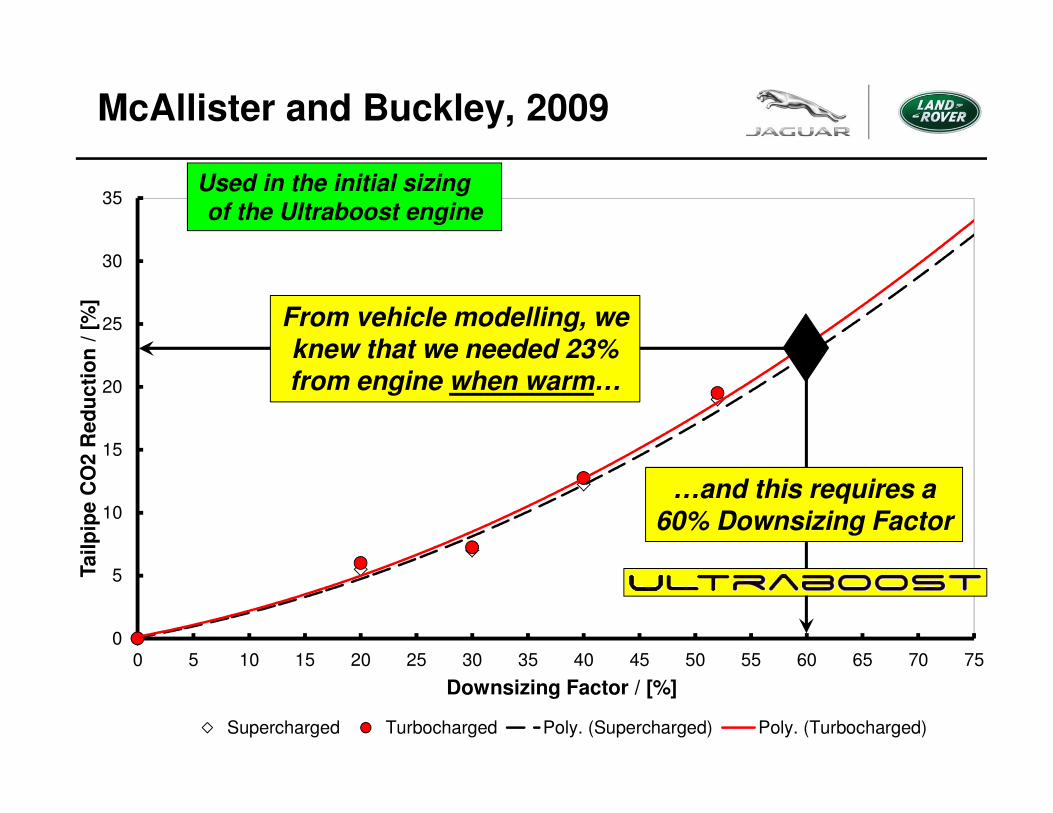
McAllister and Buckley, 2009
0
5
10
15
20
25
30
35
0 5 10 15 20 25 30 35 40 45 50 55 60 65 70 75
Tailp
ipe
CO
2 R
ed
uc
tio
n /
[%
]
Downsizing Factor / [%]
Supercharged Turbocharged Poly. (Supercharged) Poly. (Turbocharged)
…and this requires a 60% Downsizing Factor
Used in the initial sizingof the Ultraboost engine
From vehicle modelling, we knew that we needed 23% from engine when warm…
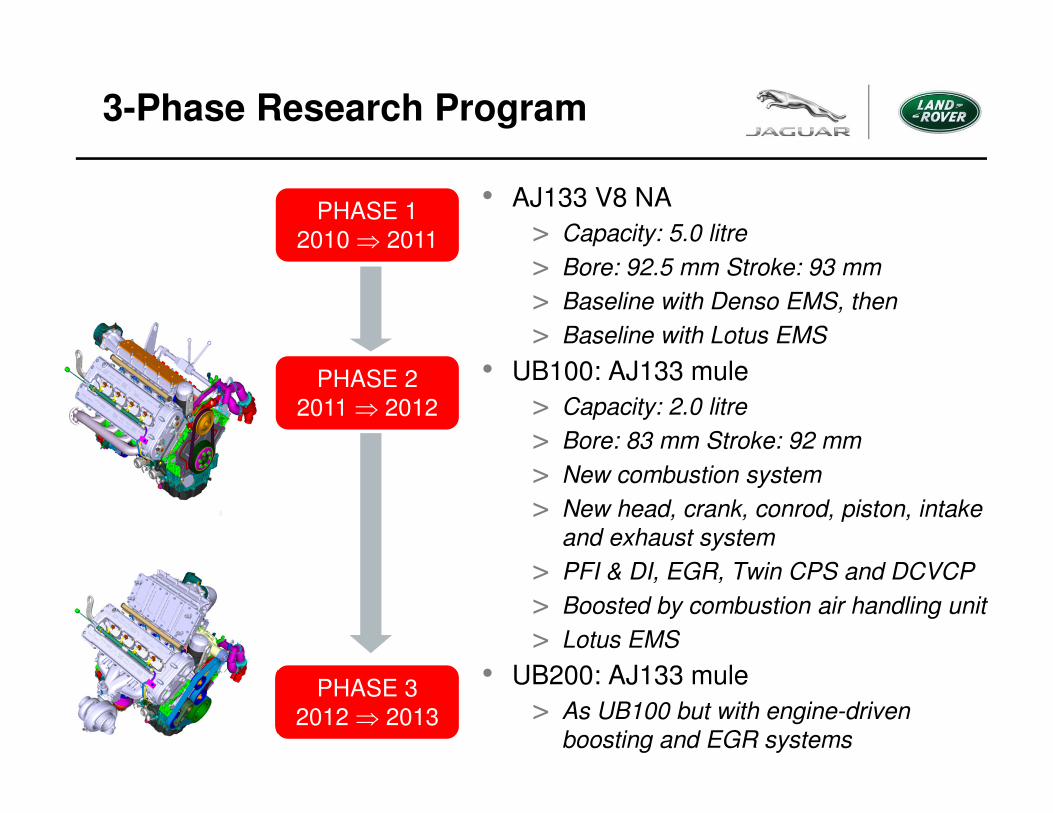
3-Phase Research Program
• AJ133 V8 NA
> Capacity: 5.0 litre
> Bore: 92.5 mm Stroke: 93 mm
> Baseline with Denso EMS, then
> Baseline with Lotus EMS
• UB100: AJ133 mule
> Capacity: 2.0 litre
> Bore: 83 mm Stroke: 92 mm
> New combustion system
> New head, crank, conrod, piston, intake
and exhaust system
> PFI & DI, EGR, Twin CPS and DCVCP
> Boosted by combustion air handling unit
> Lotus EMS
• UB200: AJ133 mule
> As UB100 but with engine-driven
boosting and EGR systems
PHASE 1
2010 ⇒ 2011
PHASE 2
2011 ⇒ 2012
PHASE 3
2012 ⇒ 2013
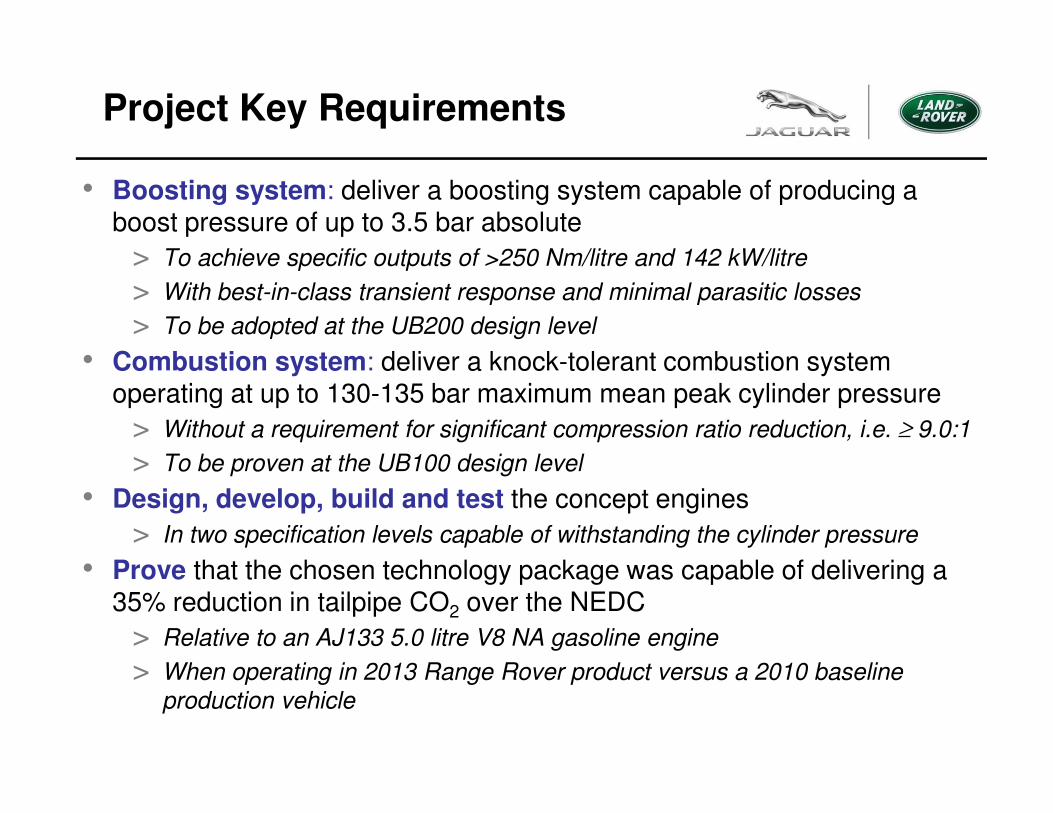
Project Key Requirements
• Boosting system: deliver a boosting system capable of producing a boost pressure of up to 3.5 bar absolute
> To achieve specific outputs of >250 Nm/litre and 142 kW/litre
> With best-in-class transient response and minimal parasitic losses
> To be adopted at the UB200 design level
• Combustion system: deliver a knock-tolerant combustion system operating at up to 130-135 bar maximum mean peak cylinder pressure
> Without a requirement for significant compression ratio reduction, i.e. ≥ 9.0:1
> To be proven at the UB100 design level
• Design, develop, build and test the concept engines
> In two specification levels capable of withstanding the cylinder pressure
• Prove that the chosen technology package was capable of delivering a 35% reduction in tailpipe CO2 over the NEDC
> Relative to an AJ133 5.0 litre V8 NA gasoline engine
> When operating in 2013 Range Rover product versus a 2010 baseline
production vehicle
CORE ENGINE DESIGN
Core Engine Design
• The core engine is common to both UB100 and UB200
> Effectively the UB100 engine was the basis of UB200
• The project was structured so that changes could be made between Phases 2 and 3 if necessary
> However, UB100 was extremely reliable, and met initial performance and
economy targets, so this was not done
• UB100 used a JLR AJ133 cylinder block and pumps as base, with a new head and measures to reduce the swept volume of the ‘half engine’
> Because the architecture would be suitable to accept the loadings that would
be applied to it
• As a consequence of this ‘design for reliability’ decision, its friction was high
> Will return to this later
Cylinder Block
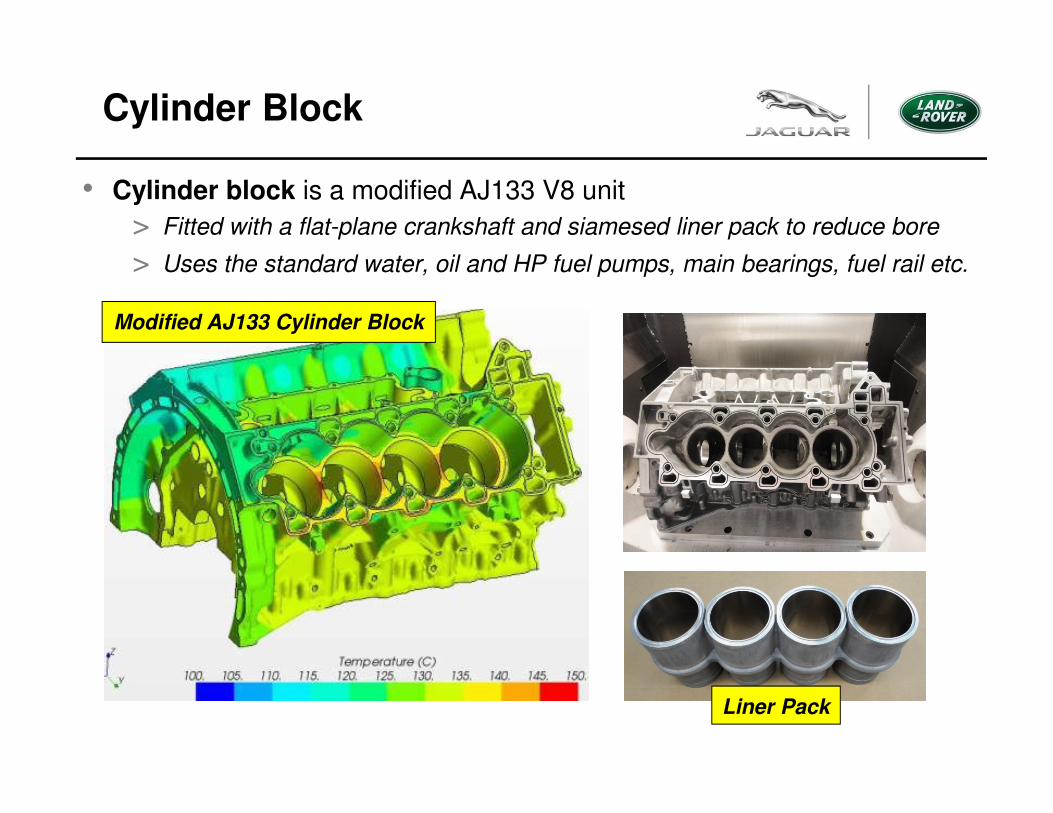
• Cylinder block is a modified AJ133 V8 unit
> Fitted with a flat-plane crankshaft and siamesed liner pack to reduce bore
> Uses the standard water, oil and HP fuel pumps, main bearings, fuel rail etc.
Modified AJ133 Cylinder Block
Liner Pack
Cylinder Head and WCEM
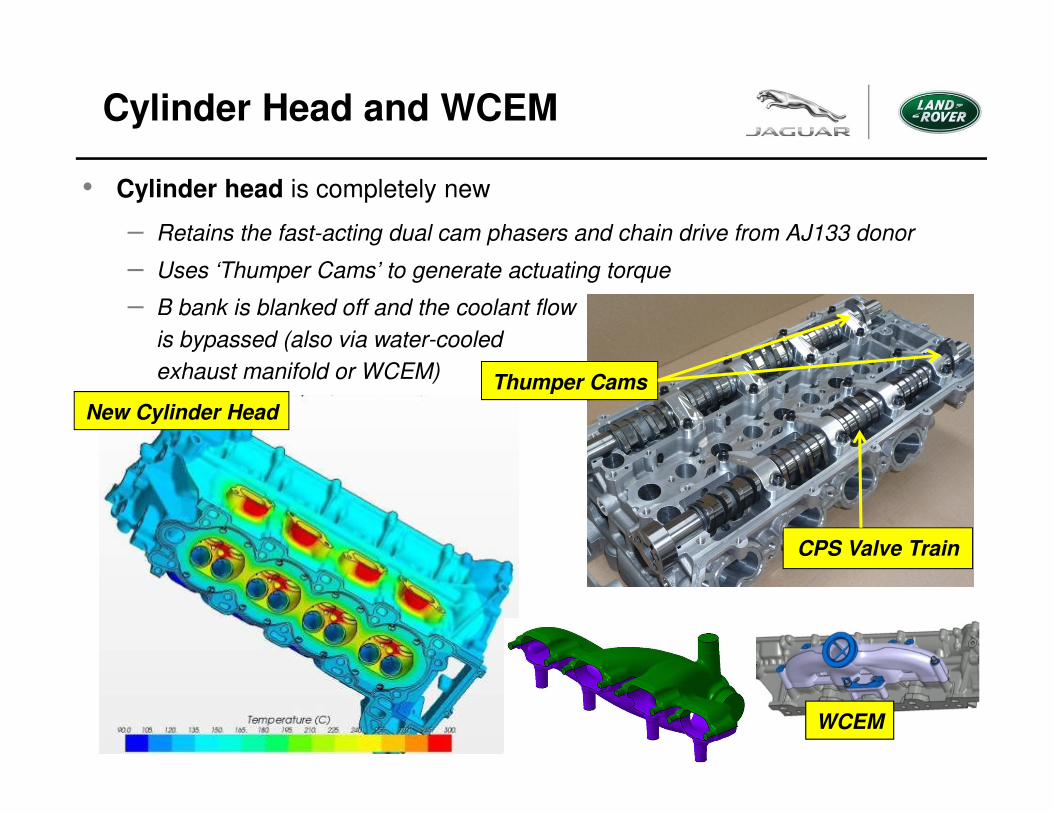
• Cylinder head is completely new
– Retains the fast-acting dual cam phasers and chain drive from AJ133 donor
– Uses ‘Thumper Cams’ to generate actuating torque
– B bank is blanked off and the coolant flow
is bypassed (also via water-cooled
exhaust manifold or WCEM)
New Cylinder Head
CPS Valve Train
Thumper Cams
WCEM
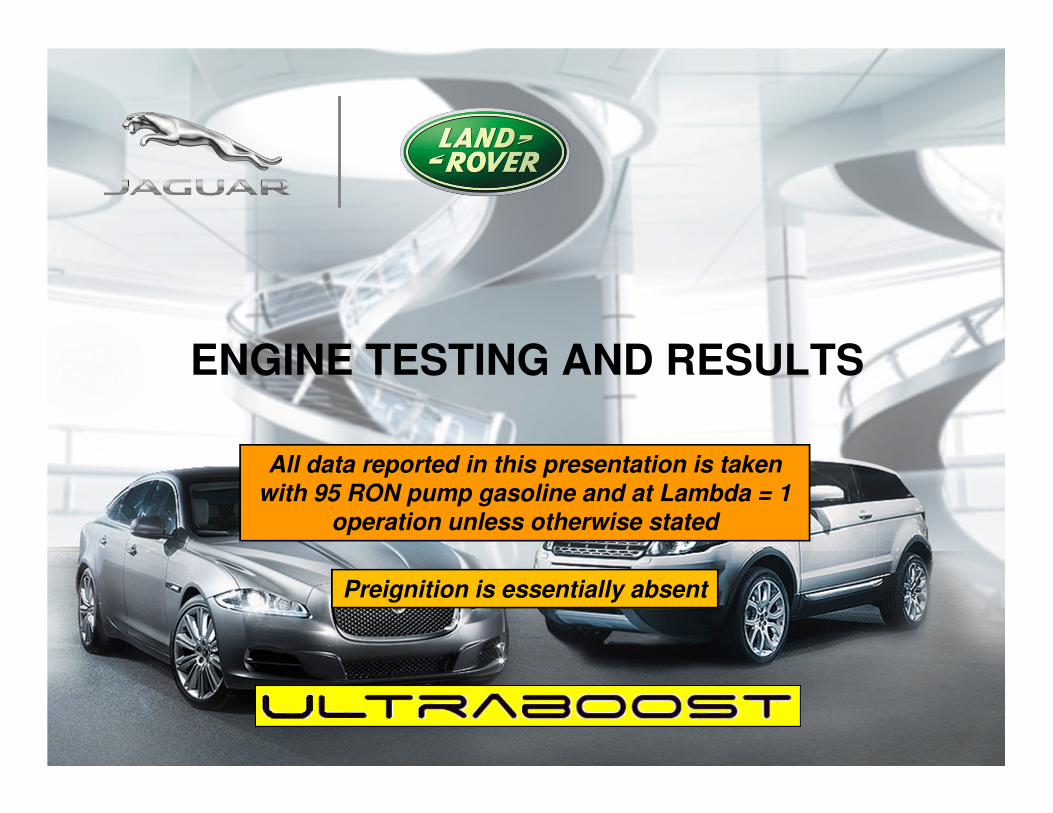
ENGINE TESTING AND RESULTS
All data reported in this presentation is taken with 95 RON pump gasoline and at Lambda = 1
operation unless otherwise stated
Preignition is essentially absent
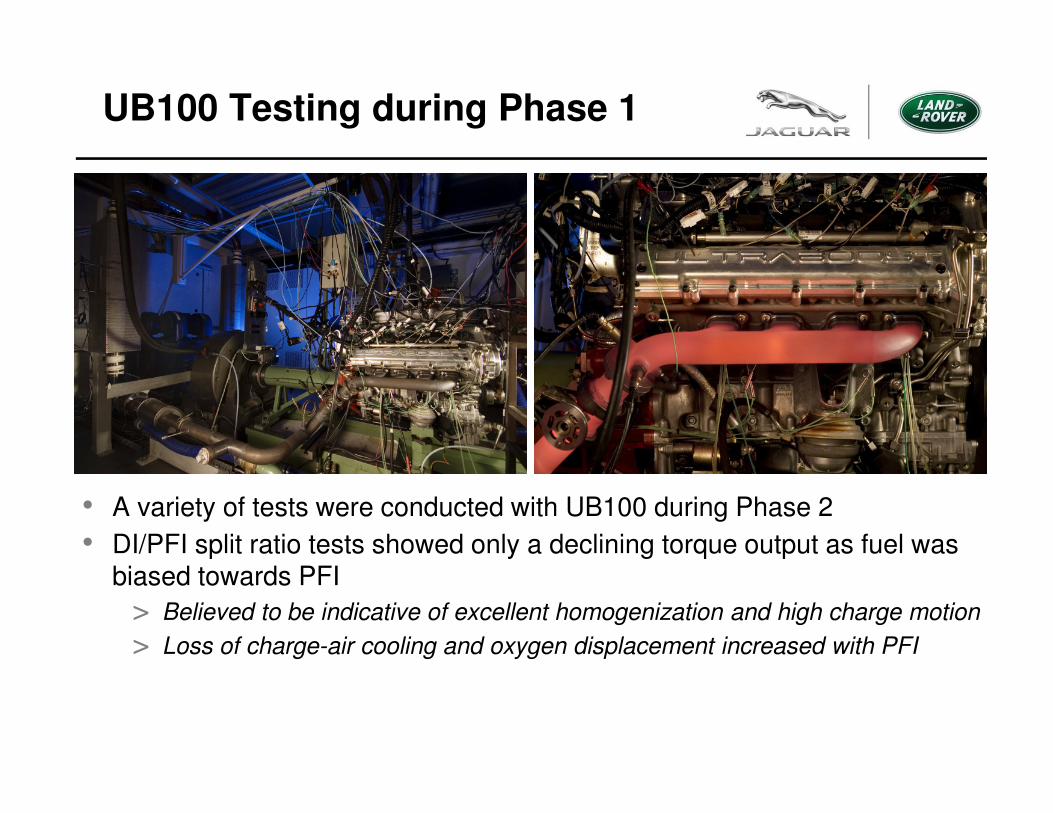
UB100 Testing during Phase 1
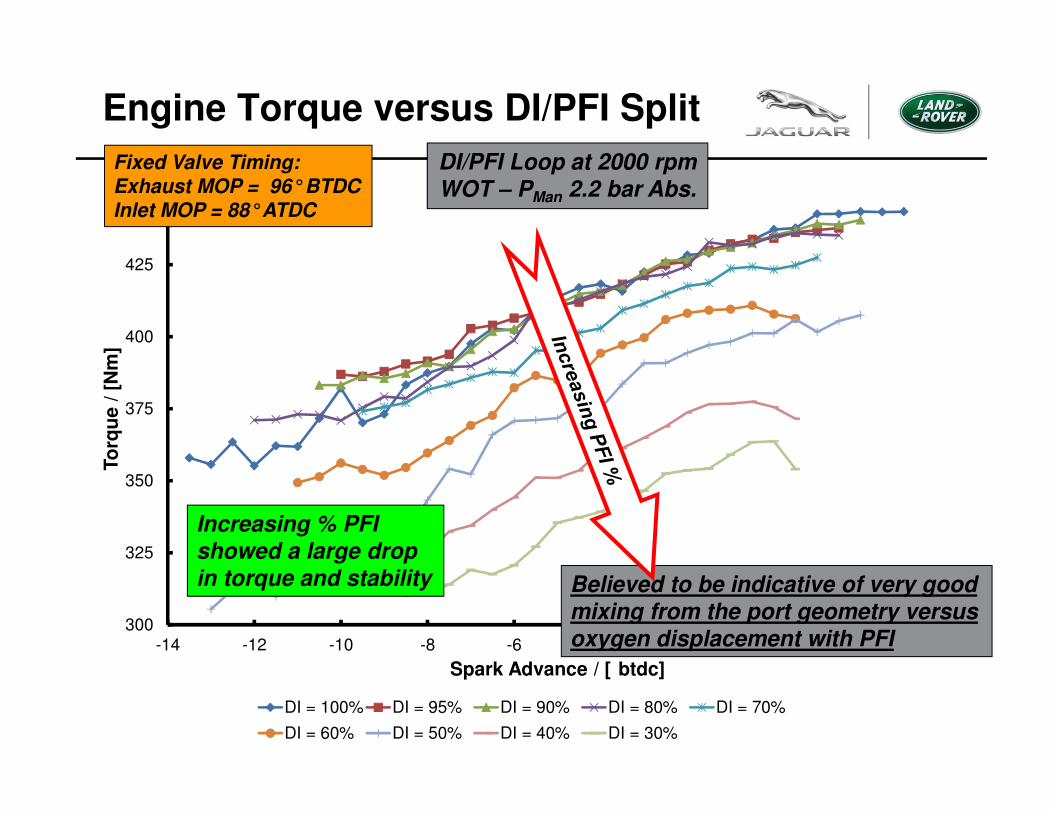
• A variety of tests were conducted with UB100 during Phase 2
• DI/PFI split ratio tests showed only a declining torque output as fuel was biased towards PFI
> Believed to be indicative of excellent homogenization and high charge motion
> Loss of charge-air cooling and oxygen displacement increased with PFI
300
325
350
375
400
425
450
-14 -12 -10 -8 -6 -4 -2 0 2 4
To
rqu
e /
[N
m]
Spark Advance / [ btdc]
DI = 100% DI = 95% DI = 90% DI = 80% DI = 70%
DI = 60% DI = 50% DI = 40% DI = 30%
Engine Torque versus DI/PFI Split
DI/PFI Loop at 2000 rpm WOT – PMan 2.2 bar Abs.
Fixed Valve Timing:Exhaust MOP = 96°BTDCInlet MOP = 88°ATDC
Increasing % PFI showed a large drop in torque and stability Believed to be indicative of very good
mixing from the port geometry versus oxygen displacement with PFI
UB100 Testing during Phase 2
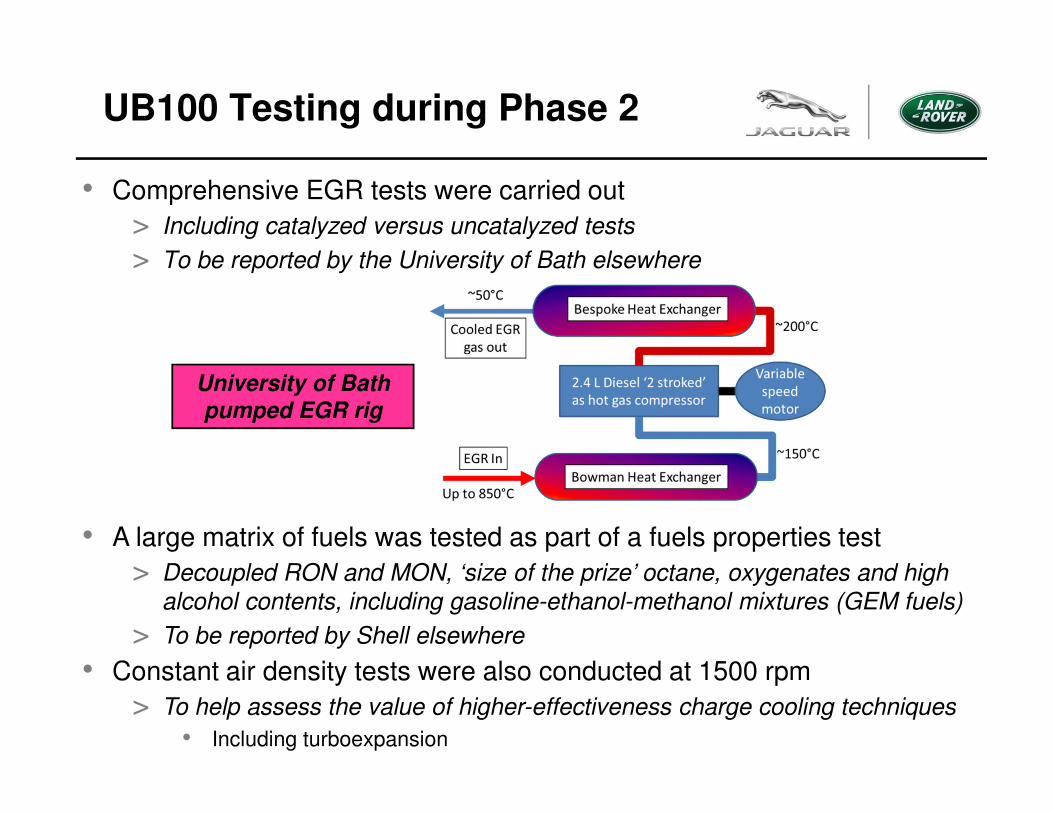
• Comprehensive EGR tests were carried out
> Including catalyzed versus uncatalyzed tests
> To be reported by the University of Bath elsewhere
University of Bath pumped EGR rig
• A large matrix of fuels was tested as part of a fuels properties test
> Decoupled RON and MON, ‘size of the prize’ octane, oxygenates and high
alcohol contents, including gasoline-ethanol-methanol mixtures (GEM fuels)
> To be reported by Shell elsewhere
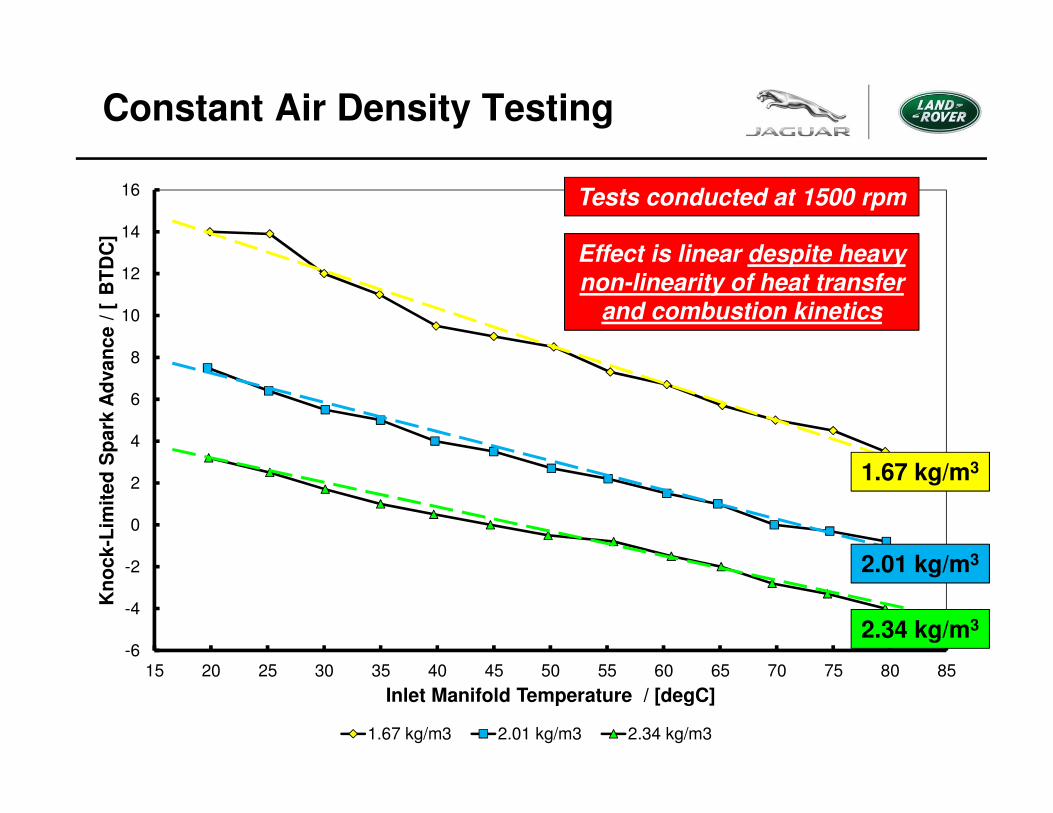
• Constant air density tests were also conducted at 1500 rpm
> To help assess the value of higher-effectiveness charge cooling techniques
• Including turboexpansion
-6
-4
-2
0
2
4
6
8
10
12
14
16
15 20 25 30 35 40 45 50 55 60 65 70 75 80 85
Kn
oc
k-L
imit
ed
Sp
ark
Ad
va
nc
e /
[B
TD
C]
Inlet Manifold Temperature / [degC]
1.67 kg/m3 2.01 kg/m3 2.34 kg/m3
Constant Air Density Testing
Tests conducted at 1500 rpm
Effect is linear despite heavy non-linearity of heat transfer
and combustion kinetics
1.67 kg/m3
2.01 kg/m3
2.34 kg/m3
UB100 with WCEM and GT30
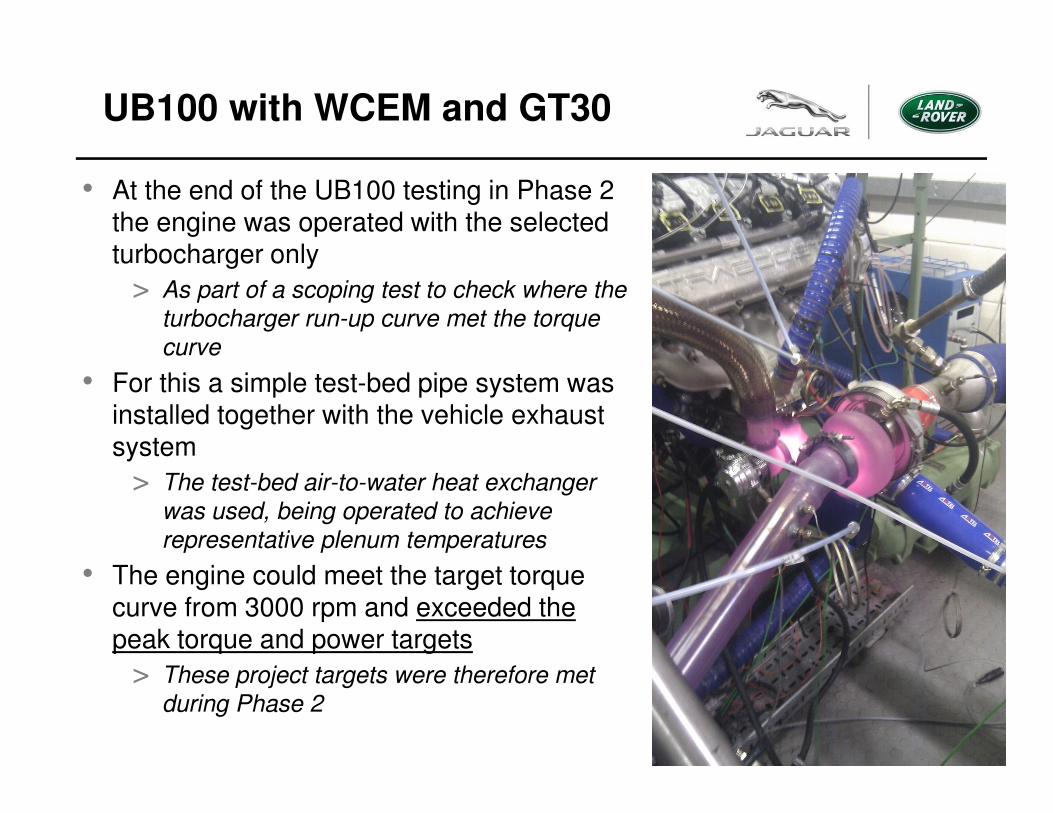
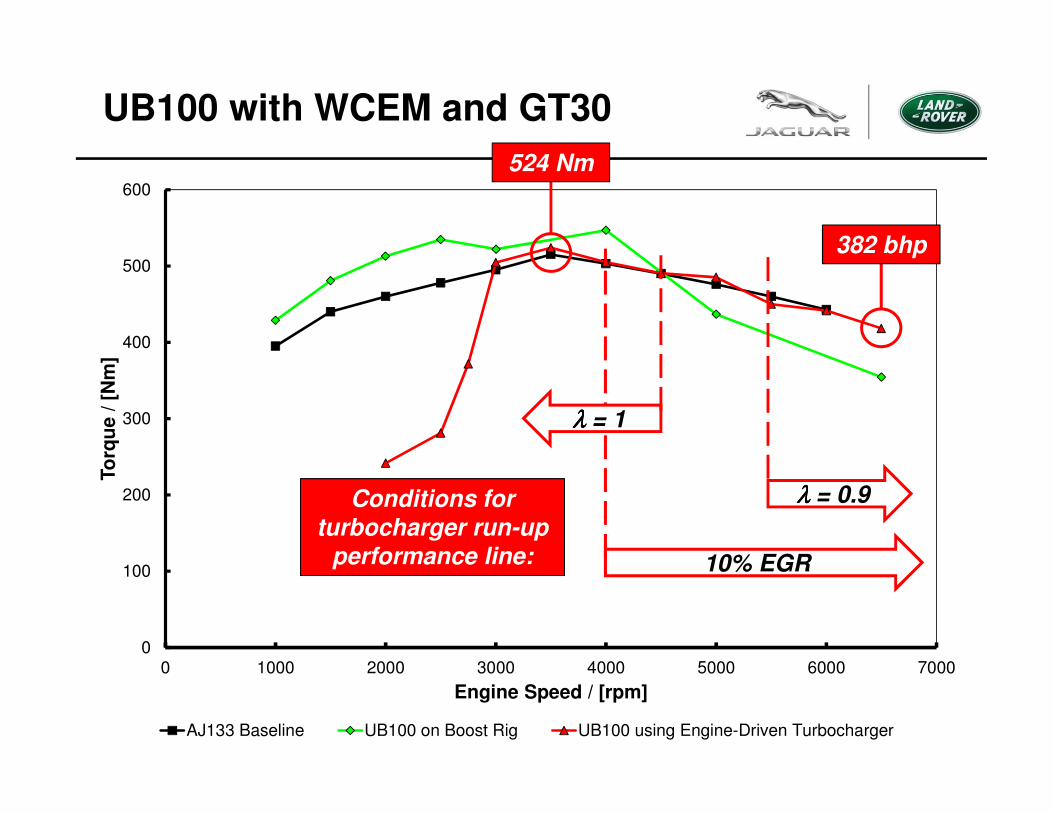
• At the end of the UB100 testing in Phase 2 the engine was operated with the selected turbocharger only
> As part of a scoping test to check where the
turbocharger run-up curve met the torque
curve
• For this a simple test-bed pipe system was installed together with the vehicle exhaust system
> The test-bed air-to-water heat exchanger
was used, being operated to achieve
representative plenum temperatures
• The engine could meet the target torque curve from 3000 rpm and exceeded the peak torque and power targets
> These project targets were therefore met
during Phase 2
0
100
200
300
400
500
600
0 1000 2000 3000 4000 5000 6000 7000
To
rqu
e /
[N
m]
Engine Speed / [rpm]
AJ133 Baseline UB100 on Boost Rig UB100 using Engine-Driven Turbocharger
UB100 with WCEM and GT30
Conditions for turbocharger run-up
performance line:
λλλλ = 0.9
10% EGR
382 bhp
λλλλ = 1
524 Nm
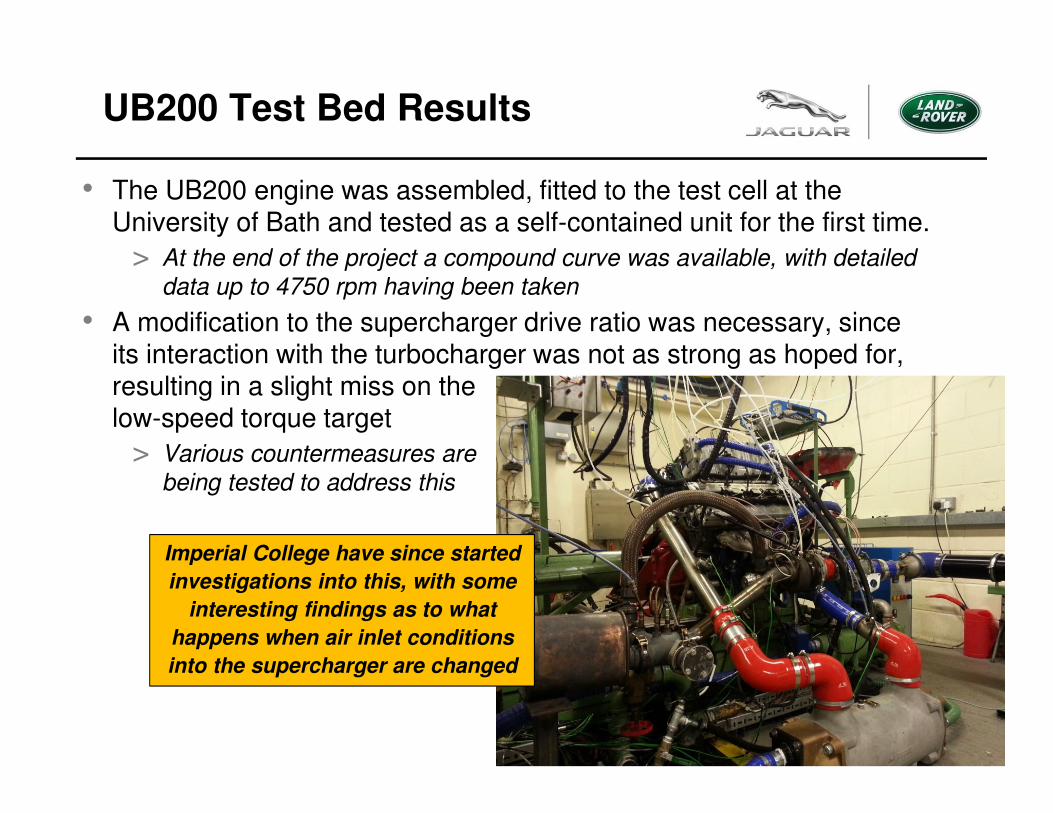
UB200 Test Bed Results
• The UB200 engine was assembled, fitted to the test cell at the University of Bath and tested as a self-contained unit for the first time.
> At the end of the project a compound curve was available, with detailed
data up to 4750 rpm having been taken
• A modification to the supercharger drive ratio was necessary, since its interaction with the turbocharger was not as strong as hoped for, resulting in a slight miss on the low-speed torque target
> Various countermeasures are
being tested to address this
Imperial College have since started
investigations into this, with some
interesting findings as to what
happens when air inlet conditions
into the supercharger are changed
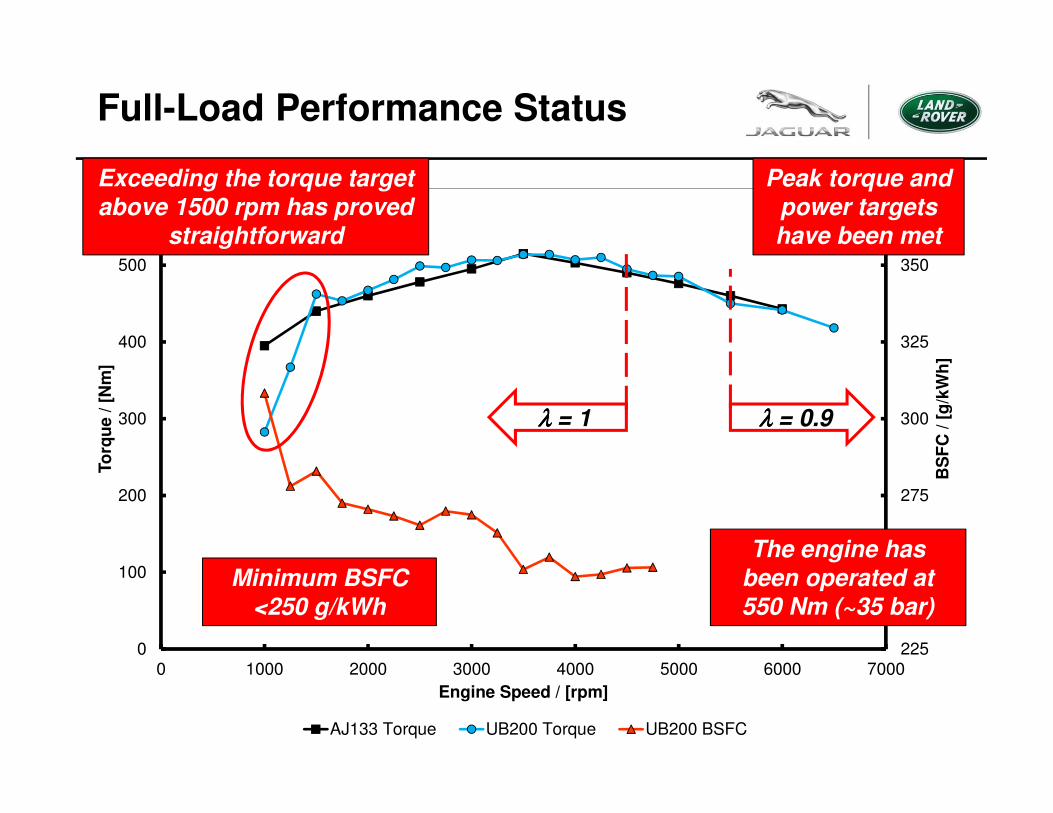
Full-Load Performance Status
225
250
275
300
325
350
375
0
100
200
300
400
500
600
0 1000 2000 3000 4000 5000 6000 7000
BS
FC
/ [
g/k
Wh
]
To
rqu
e /
[N
m]
Engine Speed / [rpm]
AJ133 Torque UB200 Torque UB200 BSFC
Exceeding the torque target above 1500 rpm has proved
straightforward
Peak torque and power targets have been met
Minimum BSFC <250 g/kWh
The engine has been operated at 550 Nm (~35 bar)
λλλλ = 0.9λλλλ = 1

FINAL UB200 FUEL ECONOMY STATUS
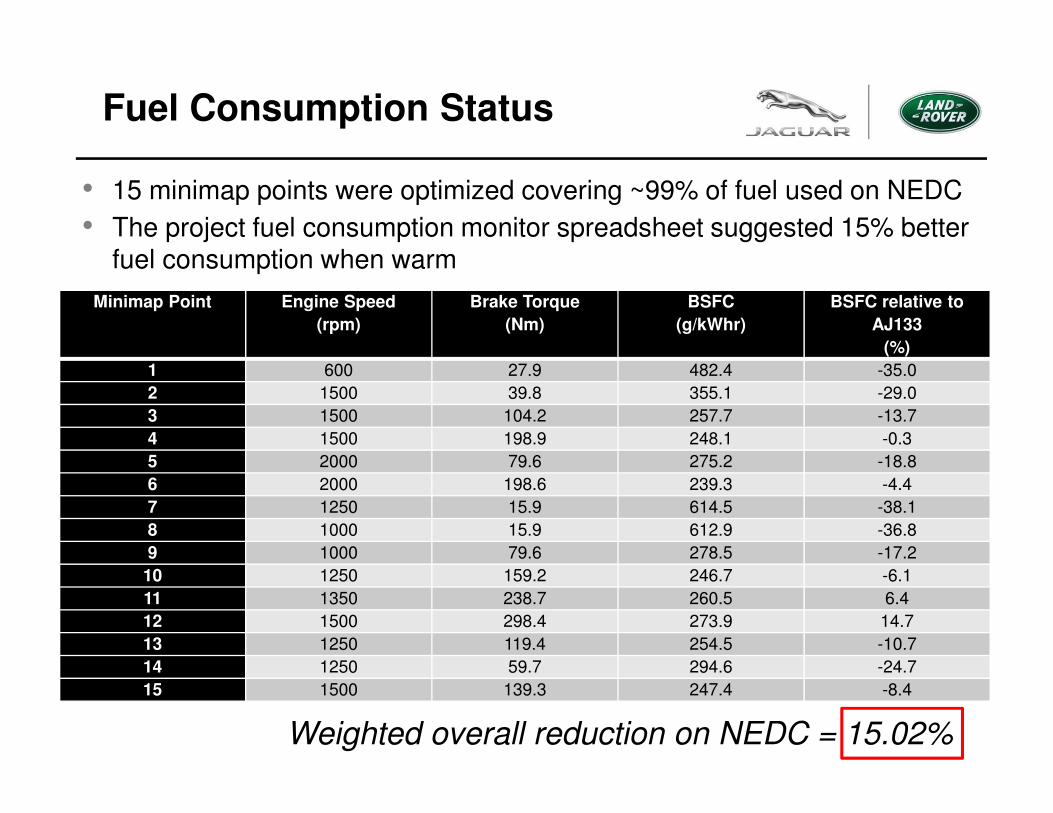
Fuel Consumption Status
• 15 minimap points were optimized covering ~99% of fuel used on NEDC
• The project fuel consumption monitor spreadsheet suggested 15% better fuel consumption when warm
Minimap Point Engine Speed
(rpm)
Brake Torque
(Nm)
BSFC
(g/kWhr)
BSFC relative to
AJ133
(%)
1 600 27.9 482.4 -35.0
2 1500 39.8 355.1 -29.0
3 1500 104.2 257.7 -13.7
4 1500 198.9 248.1 -0.3
5 2000 79.6 275.2 -18.8
6 2000 198.6 239.3 -4.4
7 1250 15.9 614.5 -38.1
8 1000 15.9 612.9 -36.8
9 1000 79.6 278.5 -17.2
10 1250 159.2 246.7 -6.1
11 1350 238.7 260.5 6.4
12 1500 298.4 273.9 14.7
13 1250 119.4 254.5 -10.7
14 1250 59.7 294.6 -24.7
15 1500 139.3 247.4 -8.4
Weighted overall reduction on NEDC = 15.02%
Fuel Consumption Status
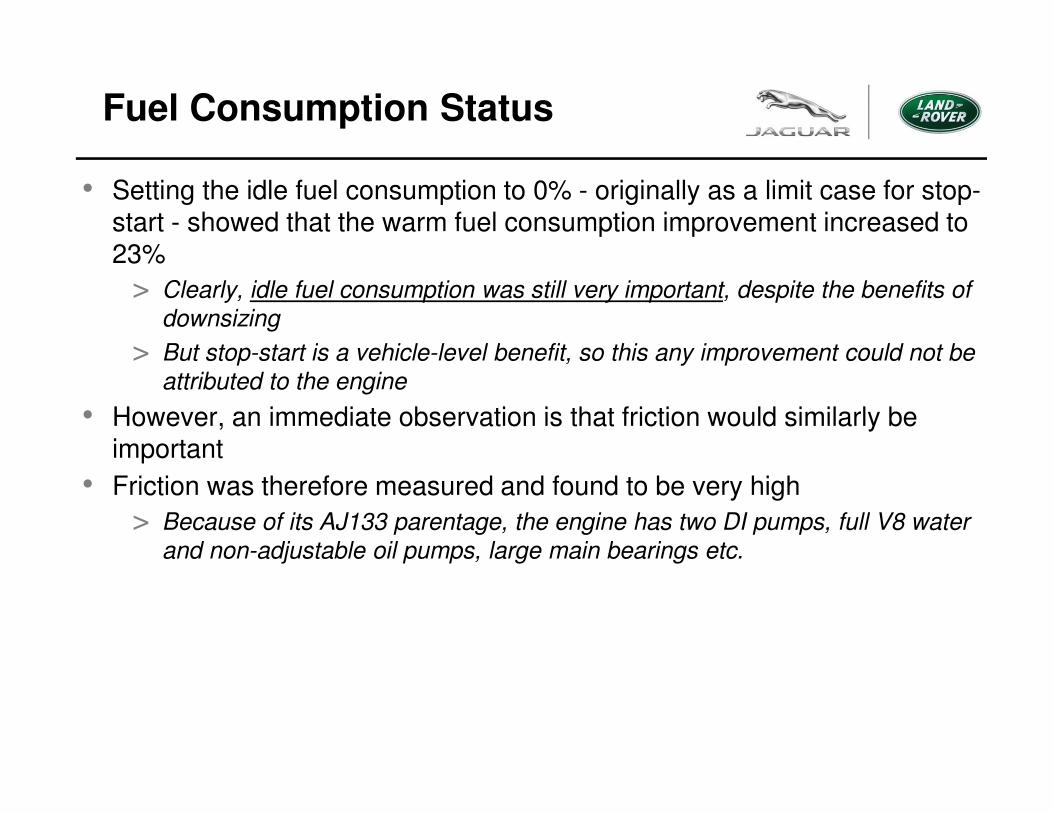
• Setting the idle fuel consumption to 0% - originally as a limit case for stop-start - showed that the warm fuel consumption improvement increased to 23%
> Clearly, idle fuel consumption was still very important, despite the benefits of
downsizing
> But stop-start is a vehicle-level benefit, so this any improvement could not be
attributed to the engine
• However, an immediate observation is that friction would similarly be important
• Friction was therefore measured and found to be very high
> Because of its AJ133 parentage, the engine has two DI pumps, full V8 water
and non-adjustable oil pumps, large main bearings etc.
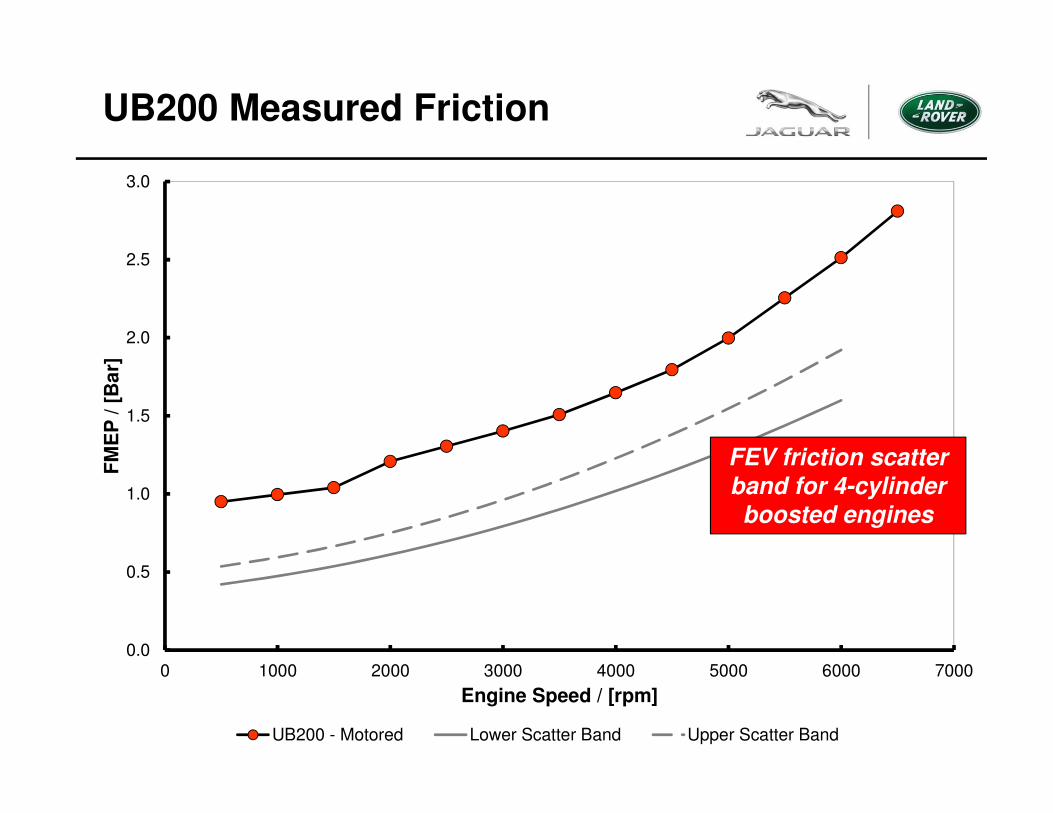
UB200 Measured Friction
0.0
0.5
1.0
1.5
2.0
2.5
3.0
0 1000 2000 3000 4000 5000 6000 7000
FM
EP
/ [
Ba
r]
Engine Speed / [rpm]
UB200 - Motored Lower Scatter Band Upper Scatter Band
FEV friction scatter band for 4-cylinder boosted engines
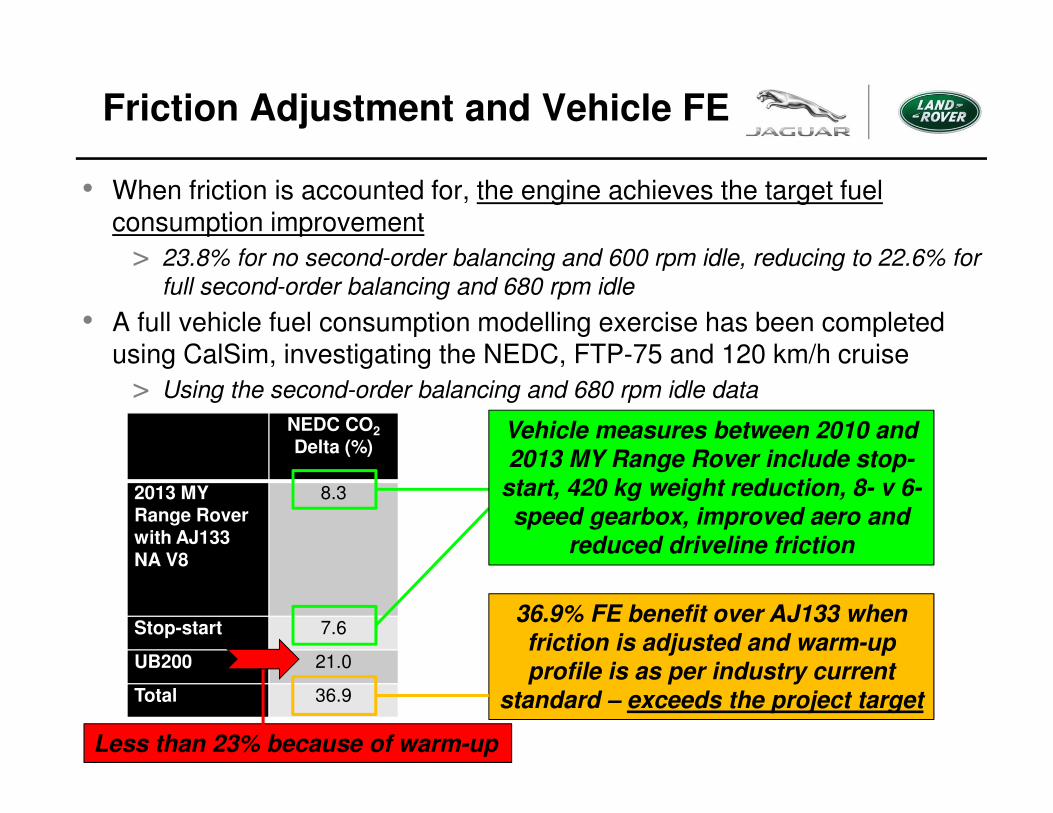
Friction Adjustment and Vehicle FE
• When friction is accounted for, the engine achieves the target fuel consumption improvement
> 23.8% for no second-order balancing and 600 rpm idle, reducing to 22.6% for
full second-order balancing and 680 rpm idle
• A full vehicle fuel consumption modelling exercise has been completed using CalSim, investigating the NEDC, FTP-75 and 120 km/h cruise
> Using the second-order balancing and 680 rpm idle data
NEDC CO2
Delta (%)
2013 MY Range Rover with AJ133 NA V8
8.3
Stop-start 7.6
UB200 21.0
Total 36.9
36.9% FE benefit over AJ133 when friction is adjusted and warm-up profile is as per industry current
standard – exceeds the project target
Vehicle measures between 2010 and 2013 MY Range Rover include stop-
start, 420 kg weight reduction, 8- v 6-speed gearbox, improved aero and
reduced driveline friction
Less than 23% because of warm-up
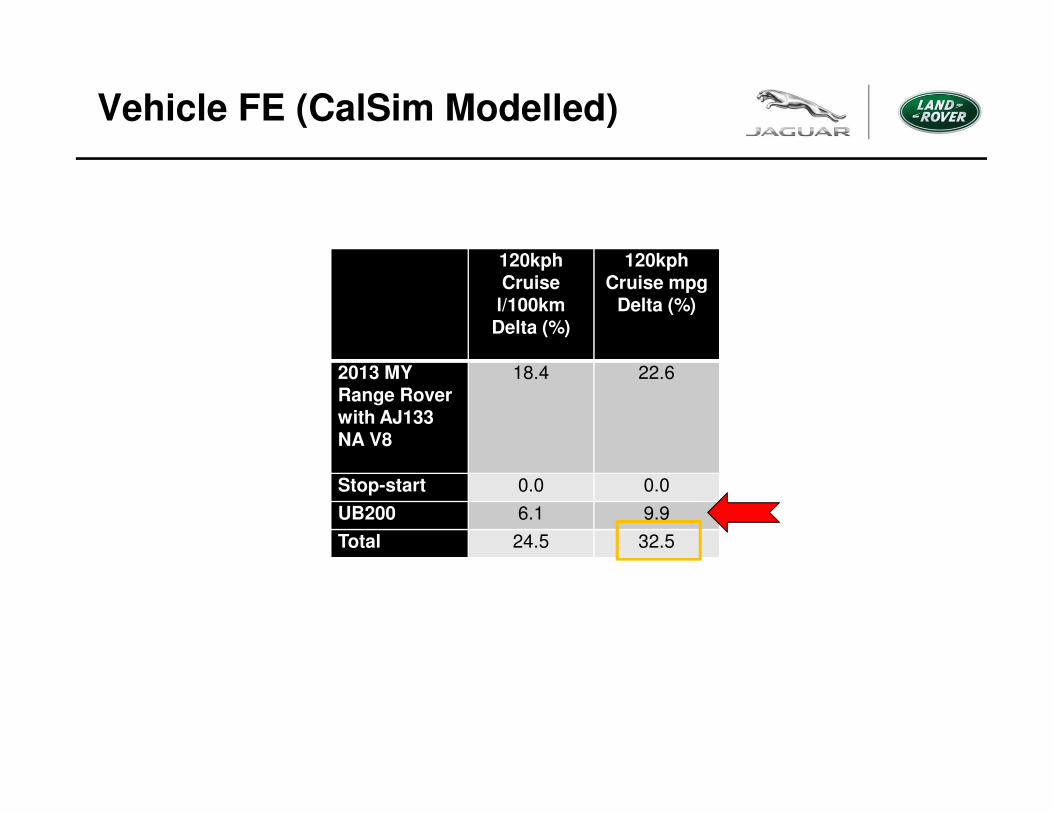
Vehicle FE (CalSim Modelled)
120kph Cruise
l/100km Delta (%)
120kph Cruise mpg
Delta (%)
2013 MY Range Rover with AJ133 NA V8
18.4 22.6
Stop-start 0.0 0.0
UB200 6.1 9.9
Total 24.5 32.5
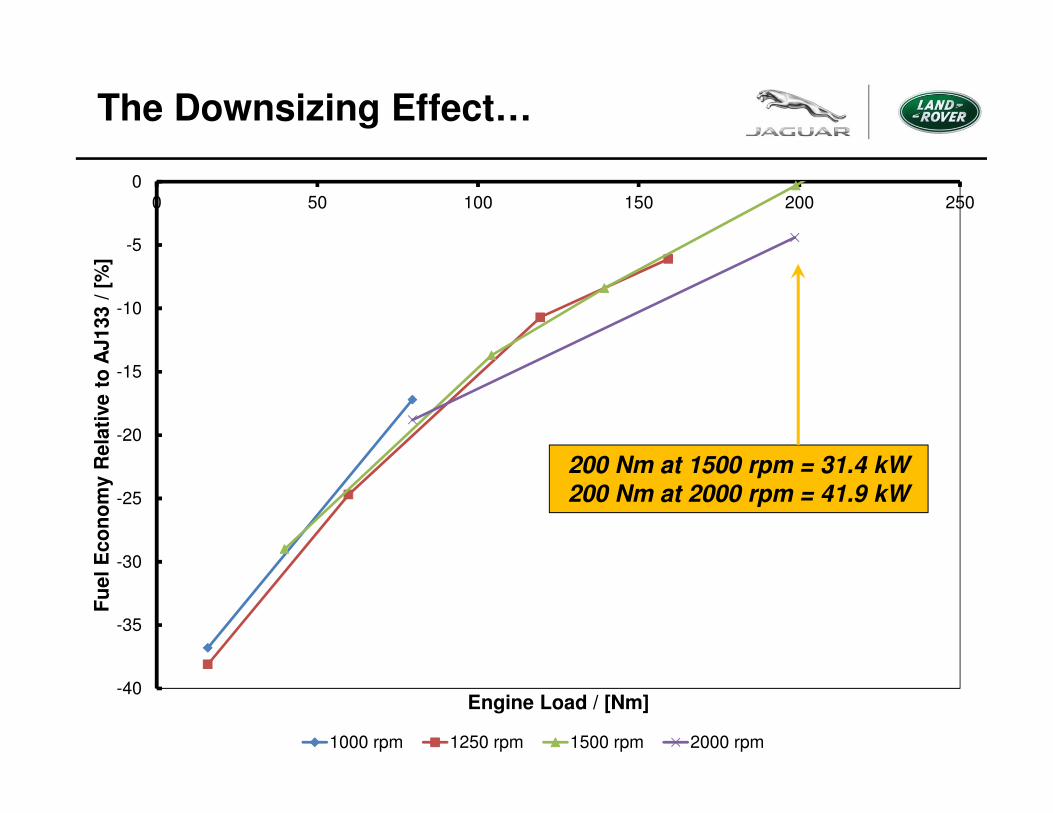
-40
-35
-30
-25
-20
-15
-10
-5
00 50 100 150 200 250
Fu
el
Eco
no
my R
ela
tive t
o A
J133
/ [
%]
Engine Load / [Nm]
1000 rpm 1250 rpm 1500 rpm 2000 rpm
The Downsizing Effect…
200 Nm at 1500 rpm = 31.4 kW 200 Nm at 2000 rpm = 41.9 kW
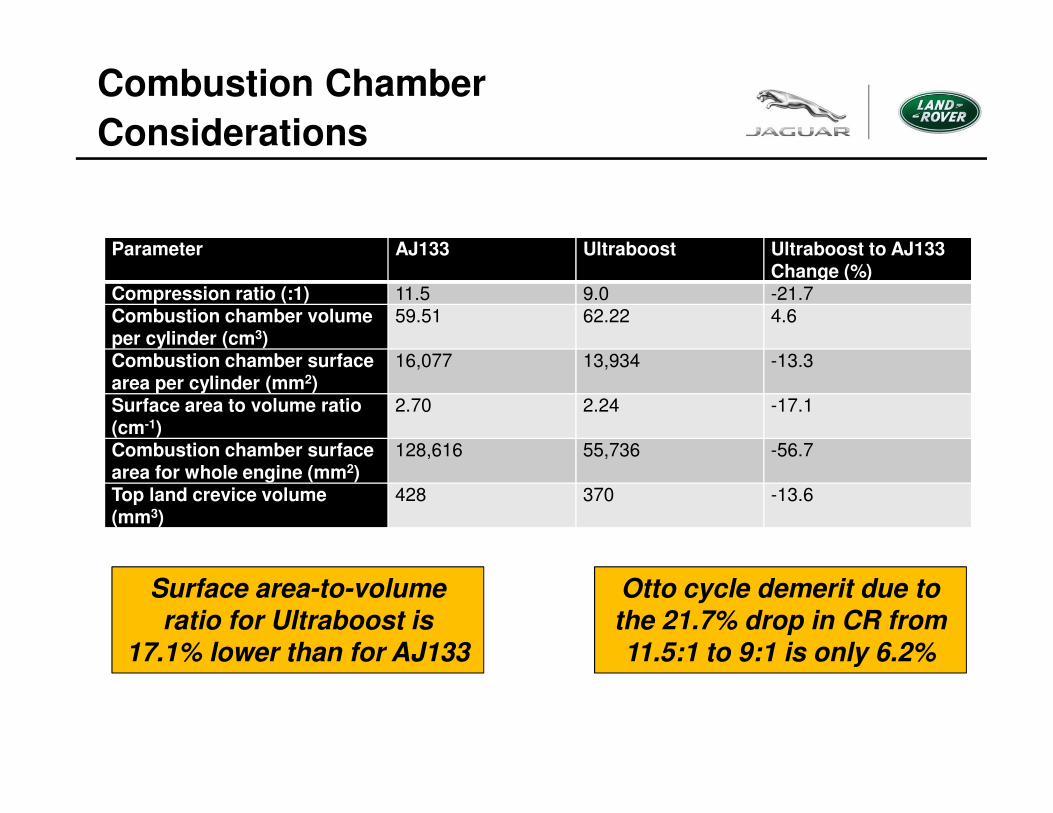
Combustion Chamber
Considerations
Parameter AJ133 Ultraboost Ultraboost to AJ133 Change (%)
Compression ratio (:1) 11.5 9.0 -21.7Combustion chamber volume per cylinder (cm3)
59.51 62.22 4.6
Combustion chamber surface area per cylinder (mm2)
16,077 13,934 -13.3
Surface area to volume ratio (cm-1)
2.70 2.24 -17.1
Combustion chamber surface area for whole engine (mm2)
128,616 55,736 -56.7
Top land crevice volume (mm3)
428 370 -13.6
Otto cycle demerit due to the 21.7% drop in CR from 11.5:1 to 9:1 is only 6.2%
Surface area-to-volume ratio for Ultraboost is
17.1% lower than for AJ133
SUMMARY AND CONCLUSIONS
Summary and Conclusions (1)
• The ‘Ultraboost’ project aimed to create a 2.0 litre downsized engine to provide the torque curve and power output of the JLR NA 5.0 litre V8
> 515 Nm at 3500 rpm and 283 kW / 380 bhp at 6500 rpm
> Target was a 35% improvement in vehicle-level fuel economy
• It was part-funded by the UK Technology Strategy Board as part of its Low-Carbon Vehicles Programme
• Performance targets were met, except below 1500 rpm
• The engine proved to be extremely reliable and resistant to preignition, and its knock limit was high
• All testing reported here was carried out with 95 RON pump gasoline
> Good fuel consumption and low exhaust temperatures were achieved
even without cooled EGR
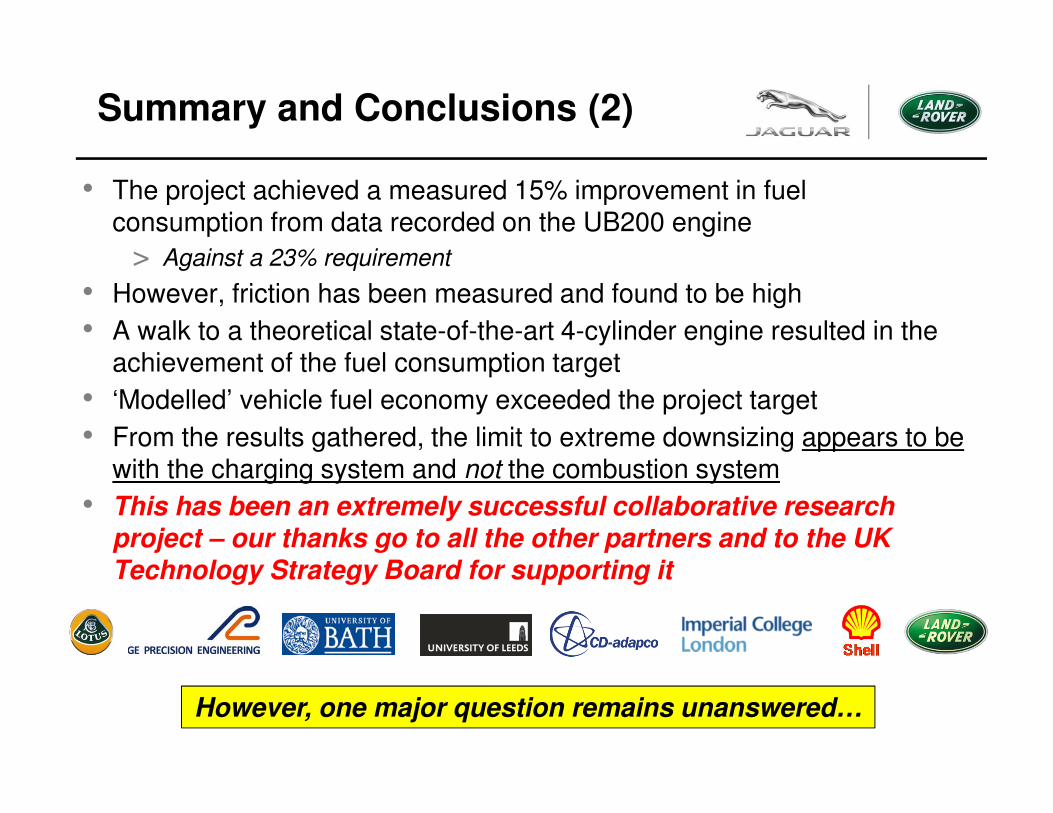
Summary and Conclusions (2)
• The project achieved a measured 15% improvement in fuel consumption from data recorded on the UB200 engine
> Against a 23% requirement
• However, friction has been measured and found to be high
• A walk to a theoretical state-of-the-art 4-cylinder engine resulted in the achievement of the fuel consumption target
• ‘Modelled’ vehicle fuel economy exceeded the project target
• From the results gathered, the limit to extreme downsizing appears to be with the charging system and not the combustion system
• This has been an extremely successful collaborative research project – our thanks go to all the other partners and to the UK Technology Strategy Board for supporting it
However, one major question remains unanswered…
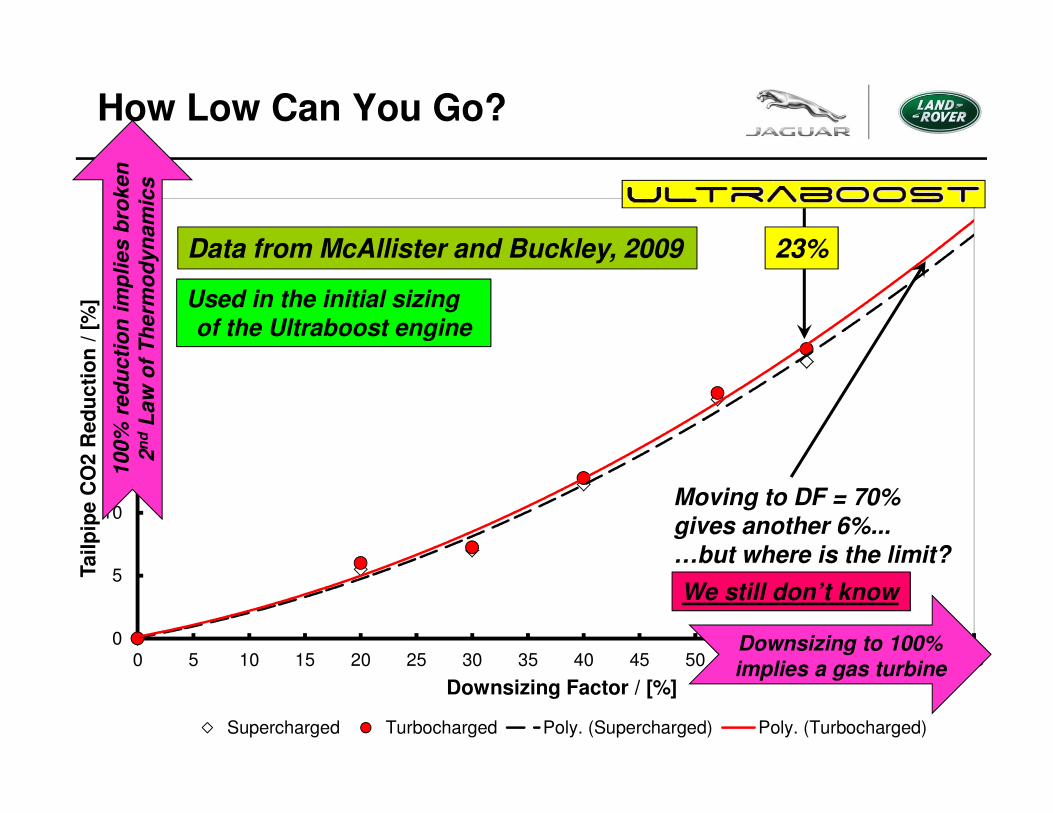
How Low Can You Go?
0
5
10
15
20
25
30
35
0 5 10 15 20 25 30 35 40 45 50 55 60 65 70 75
Tailp
ipe
CO
2 R
ed
uc
tio
n /
[%
]
Downsizing Factor / [%]
Supercharged Turbocharged Poly. (Supercharged) Poly. (Turbocharged)
Data from McAllister and Buckley, 2009
Used in the initial sizingof the Ultraboost engine
Moving to DF = 70% gives another 6%...
23%
…but where is the limit?
We still don’t know
Downsizing to 100% implies a gas turbine
10
0%
re
du
cti
on
im
pli
es
bro
ke
n
2n
dL
aw
of
Th
erm
od
yn
am
ics
THANK YOU FOR LISTENING
For more information see SAE paper 2014-01-1185, “Ultra Boost for Economy: Extending the Limits of
Extreme Engine Downsizing”
Recommended