The next decade in global wealth among millionaire households
Highlights from a study conducted by the Deloitte Center for Financial Services
www.deloitte.com/us/cfs
May 2011

Copyright © 2011 Deloitte Development LLC. All rights reserved.1 The next decade in global wealth among millionaire households
ForewordBackgroundMain findingsDetailed forecastsGlobal asset allocation preferencesUnited States overviewUnited States regionsAppendix
Contents
Produced by the Deloitte Center for Financial Services — Insights. Research. Connections.Headquartered in New York City, the Deloitte Center for Financial Services (“The Center”) developed the survey and provides insight and research to help improve the business performance of banks, private equity, hedge funds, mutual funds, insurance and real estate organizations operating globally. The Center helps financial institutions understand and address emerging opportunities in risk and information technology, regulatory compliance, growth, and cost management.
To learn more about the Center, its projects and events, please advance visit us at www.deloitte.com/us/cfs.

Copyright © 2011 Deloitte Development LLC. All rights reserved.2 The next decade in global wealth among millionaire households
Global wealth management has entered a new chapter in its evolution. As wealth managers recalibrate their strategies in the post-crisis environment, it is critical that they have a strong understanding of which economies present the greatest opportunities for business growth. There are, obviously, many factors at play that no wealth manager can ignore, including secular trends such as the rise of emerging markets, changing demographics, and evolving preferences for various asset classes.
To help address the challenges facing today’s wealth managers, the Deloitte Center for Financial Services sought to go beyond some existing wealth management statistics by looking both into the future and across the globe to forecast how wealth among millionaire households might grow. We chose to look a decade forward in the belief that such a view is meaningful for strategic planning,operations, market segmentation, and other decisions.
The study’s main finding is, at heart, a paradox: In spite of exceptional growth in emerging markets, it is developed markets that are expected to remain the global centers of wealth over the next decade, in terms of both the amount of wealth held and the number of millionaire households. Furthermore, the data suggest that emerging markets are not uniformly similar—in terms of size and growth potential as well as asset allocation preferences, these markets offer a variety of prospects.
Asset and wealth managers looking at the study can draw their own conclusions about how best to direct their resources to take advantage of opportunities provided by the economies included in our study. However, we believe this research offers an unprecedentedly rich picture of the evolution of global wealth in the next decade.
Kind regards,
Foreword
Andrew L. FreemanExecutive DirectorDeloitte Center for Financial Services
Val SrinivasHead of Research, Deloitte Center for Financial Services

Copyright © 2011 Deloitte Development LLC. All rights reserved.3 The next decade in global wealth among millionaire households
This study was sponsored by the Deloitte Center for Financial Services and conducted with Oxford Economics. It examines the next decade in global wealth in 25 economies selected for their size, growth potential and strategic importance. We present estimates of the current number of households above specific wealth thresholds, and also forecasts of their growth rate over the next ten years. In addition, a more in-depth analysis provides regional and state wealth forecasts for the United States, with specific focus on the number of millionaire households.
Since socio-economic developments are often key determinants of medium and long-term growth in wealth, understanding how these trends affect movements in various wealth cohorts can be of strategic importance when developing wealth management business strategies. Additionally, as significant opportunities for wealth managers appear to be related to the acceleration of wealth creation in emerging market economies, the global perspective provided by this study is central to any wealth management discussion.
This study’s definition of wealth includes many financial assets (stocks, bonds and other investments) and non-financial assets including primary residence, durables, business equity and other assets.
Background
These 25 economies were chosen for their size and growth potential to wealth management businesses globally
Australia Japan Spain
Brazil Malaysia Sweden
Canada Mexico Switzerland
China Netherlands Taiwan
France Norway Turkey
Germany Poland United Kingdom
Hong Kong Russia United States
India Singapore
Italy South Korea

Copyright © 2011 Deloitte Development LLC. All rights reserved.4 The next decade in global wealth among millionaire households
• This study reports estimates of the number (and density) of households with net wealth in the $1m–$5m, $5m–$30m, and $30m+ cohorts.
• Official exchange rates are used because this metric is more directly relevant to wealth managers seeking to compare market size and investment opportunities across economies.
• “Wealth” in this study includes the primary residence. Although it is customary for the wealthy to be grouped into categories according to levels of investable assets (i.e., excluding primary residence), on a cross-country basis the available data rarely makes such distinctions possible.
• In order to maximize the reliability of our estimates, the analysis presented herein relies solely on actual, secondary data sources, and not subjective judgments.
• Having estimated the current population of wealthy individuals by economy, our approach to forecasting future changes in their numbers involves two steps. – First, a breakdown of wealth holdings across broad asset categories is established for each cohort of interest. – Second, the value of these portfolios is projected forward using forecasts for relevant factors such as stock prices,
house prices, and interest rates, which are contained within the Oxford Economics Global Model (see Appendix). This modeling approach allows for shifts in the overall distribution of wealth across time, rather than imposing aggregate wealth projections onto a static distribution.
Please note: For the purposes of this presentation, many numbers have been rounded.
Notes on study methodology
Source: Oxford Economics and Deloitte analysis

Main findings

Copyright © 2011 Deloitte Development LLC. All rights reserved.6 The next decade in global wealth among millionaire households
• According to our analysis, the total wealth of millionaire households in the 25 economies included in this study is forecast to grow from $92 trillion in 2011 to $202 trillion in 2020.
• Our study suggests that the rebalancing of global wealth is expected to accelerate over the next decade. Emerging market (EM) economies are likely to prove to be more dynamic in terms of growth rates, creating significant opportunities for wealth managers seeking to gain a share of these potentially lucrative markets. Among emerging markets, China may continue to be the driving force in the growth of millionaire wealth, followed by Brazil and Russia. Of the 25 economies examined in this study, China and South Korea are likely to join the top10 in terms of the total number of millionaires by 2020.
• However, there is a paradox at the heart of this story. According to our study, in spite of the rapid growth of wealth in the EM economies, U.S. and Europe will remain the global centers of wealth over the next decade, in terms of both the amount of wealth held and the number of millionaire households. Our analysis indicates that aggregate wealth of millionaire households in the U.S. in 2020 will likely reach $87 trillion, from $39 trillion in 2011.
• Our forecasts suggest that, in 2020, 43% of the world’s wealth among millionaire households will be in the U.S. Opportunities for growth potentially exist via greater U.S. state penetration. In the U.S., California will likely have the most number of wealthy households, while New Jersey may continue to have the greatest density. The East Coast is likely to see the highest growth rates — New York and Florida together may add 1.5 million new millionaire households by 2020.
Main findings of this study

Copyright © 2011 Deloitte Development LLC. All rights reserved.7 The next decade in global wealth among millionaire households
Our forecasts suggest that total wealth among millionaire households will increase from $92 trillion in 2011 to $202 trillion by 2020, a growth of 119%. In emerging markets, the growth over the next decade is potentially quite impressive (260%), significantly outpacing the growth (107%) in developed markets.
Growth of total wealth among millionaire households in 25 economies (2000–2020)
$1.7 $7 $13 $25$43
$85
$120
$177
0
50
100
150
200
250
2000 2011 2015 2020
Tota
l wea
lth in
USD
trill
ions
Emerging markets Developed markets
Total$45
Total $92
Total$133
Total$202
DM growth 98%
DM growth 41%
DM growth 48%
EM growth311%
EM growth 94%EM growth 86%
Source: Deloitte analysis and Oxford Economics
Developed markets: Australia, Canada, France, Germany, Hong Kong, Italy, Japan, Netherlands, Norway, Singapore, Spain, Sweden, Switzerland, United States, and United Kingdom
Emerging markets: Brazil, China, India, Malaysia, Mexico, Poland, Russia, South Korea, Taiwan, and Turkey

Copyright © 2011 Deloitte Development LLC. All rights reserved.8 The next decade in global wealth among millionaire households
Our analysis suggests that although growth in the total wealth of millionaire households in EM will outpace DM, the latter will likely remain home to the significant share of millionaire households over the next decade. In DM, the $5-$30 million cohort will likely grow substantially over the next decade. And not surprisingly, as per our study, the $1-$5 million cohort will comprise the largest group in both DM and EM.
0
10,000
20,000
30,000
40,000
50,000
60,000
2000 2011 2015 2020
Tota
l Num
ber o
f Mill
iona
ire H
ouse
hold
s (‘0
00)
Developed Markets
Growth in total number of millionaire households in 25 economies (2000–2020)
Source: Deloitte analysis and Oxford Economics
0
10,000
20,000
30,000
40,000
50,000
60,000
2000 2011 2015 2020
Tota
l Num
ber o
f Mill
iona
ire H
ouse
hold
s (‘0
00)
Emerging Markets
33,894
19,189
43,033
55,535
1,1744,084
6,480 9,986

Detailed forecasts
Copyright © 2011 Deloitte Development LLC. All rights reserved.10 The next decade in global wealth among millionaire households
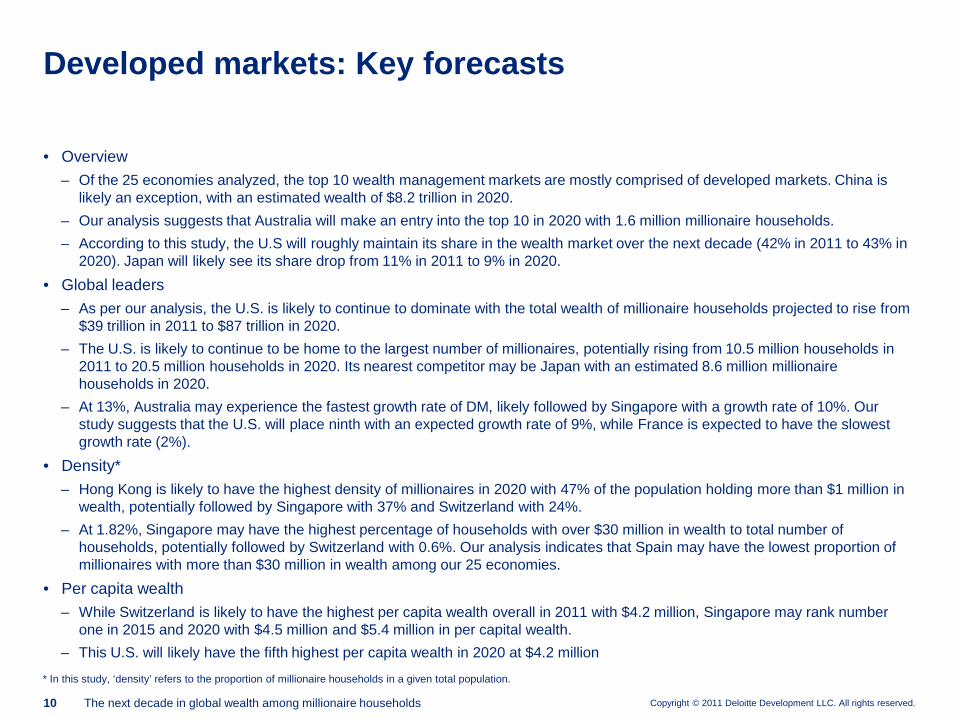
• Overview– Of the 25 economies analyzed, the top 10 wealth management markets are mostly comprised of developed markets. China is
likely an exception, with an estimated wealth of $8.2 trillion in 2020. – Our analysis suggests that Australia will make an entry into the top 10 in 2020 with 1.6 million millionaire households.– According to this study, the U.S will roughly maintain its share in the wealth market over the next decade (42% in 2011 to 43% in
2020). Japan will likely see its share drop from 11% in 2011 to 9% in 2020.• Global leaders
– As per our analysis, the U.S. is likely to continue to dominate with the total wealth of millionaire households projected to rise from $39 trillion in 2011 to $87 trillion in 2020.
– The U.S. is likely to continue to be home to the largest number of millionaires, potentially rising from 10.5 million households in 2011 to 20.5 million households in 2020. Its nearest competitor may be Japan with an estimated 8.6 million millionaire households in 2020.
– At 13%, Australia may experience the fastest growth rate of DM, likely followed by Singapore with a growth rate of 10%. Our study suggests that the U.S. will place ninth with an expected growth rate of 9%, while France is expected to have the slowest growth rate (2%).
• Density*– Hong Kong is likely to have the highest density of millionaires in 2020 with 47% of the population holding more than $1 million in
wealth, potentially followed by Singapore with 37% and Switzerland with 24%.– At 1.82%, Singapore may have the highest percentage of households with over $30 million in wealth to total number of
households, potentially followed by Switzerland with 0.6%. Our analysis indicates that Spain may have the lowest proportion of millionaires with more than $30 million in wealth among our 25 economies.
• Per capita wealth– While Switzerland is likely to have the highest per capita wealth overall in 2011 with $4.2 million, Singapore may rank number
one in 2015 and 2020 with $4.5 million and $5.4 million in per capital wealth.– This U.S. will likely have the fifth highest per capita wealth in 2020 at $4.2 million
Developed markets: Key forecasts
* In this study, ‘density’ refers to the proportion of millionaire households in a given total population.

Copyright © 2011 Deloitte Development LLC. All rights reserved.11 The next decade in global wealth among millionaire households
• Overview– Among the 25 economies analyzed, China is likely to be among the top 10 wealthiest economies by 2015 with an estimated $3.6
trillion in wealth. – Among the BRIC economies, India is likely to experience the largest growth in total millionaire wealth (408%) over the next
decade. This study suggests that China’s wealth among millionaires will grow by 392%, followed by Brazil at 258%, and Russia at 242%.
• Wealth by cohort– In the $1–$5 million cohort, South Korea may have the highest number of millionaires among emerging economies with 1.51
million households. China will likely follow closely with 1.48 million households in the $1–$5 million cohort by 2020.– In the $5–$30 million cohort, China will potentially see 689,000 households by 2020, the third highest of the 25 economies
included in this study. Russia may arrive in eleventh place with 153,000 millionaire households.– According to our study, in the $30m and above cohort, China, Brazil, and India will take third, fifth, and sixth place respectively
with 327,000; 67,000; and 56,000 millionaire households.
• Density– Unsurprisingly, the EM will likely appear at the lower end of the density of millionaire households ranking. India may have the
lowest density ranking for 2020 with 0.3% of households holding more than $1 million in wealth, potentially followed by China and Poland.
• Per capita wealth– Among EM economies in 2020, India is likely to have the highest per capita wealth among millionaires with $4.02 million —
placing it ahead of the U.S. This study suggests that Russia will appear in sixteenth place of the 25 economies included in this study, with a per capita wealth of $2.2 million in 2020, while Brazil will place twenty-first with a per capita wealth among millionaires of $2 million in 2020. South Korea will likely appear in last place with a per capita income of $1.4 million in 2020.
Emerging markets: Key forecasts

Copyright © 2011 Deloitte Development LLC. All rights reserved.12 The next decade in global wealth among millionaire households
According to our study, the total wealth among millionaire households of the 25 economies in this study generally exhibit little change in their ranking over the next decade. Emerging market economies will likely see some upward movement in rank (e.g., China).
Global ranking by total wealth among millionaire households (2011–2020)
Total Wealth in USD trillions
2011 Total $92.26 2020 Total $ 201.95
1 United States $38.60 1 United States $87.11
2 Japan $10.00 2 Japan $19.02
3 Italy $5.71 3 Germany $10.94
4 UnitedKingdom $5.69 4 United
Kingdom $10.58
5 Germany $5.14 5 Italy $9.48
6 France $4.62 6 France $8.31
7 Canada $3.35 7 China $8.24
8 Switzerland $2.41 8 Canada $6.77
9 Spain $2.17 9 Hong Kong $5.70
10 Hong Kong $2.48 10 Switzerland $4.33
11 Netherlands $1.75 11 Australia $3.64
12 China $1.67 12 Spain $3.42
13 Australia $1.49 13 Netherlands $3.14
14 Taiwan $1.26 14 Taiwan $3.03
15 South Korea $0.99 15 India $2.95
Total Wealth in USD trillions
2011 Total $92.26 2020 Total $ 201.95
16 Singapore $0.88 16 Russia $2.70
17 Russia $0.79 17 South Korea $2.50
18 Sweden $0.71 18 Singapore $2.42
19 India $0.58 19 Brazil $2.04
20 Brazil $0.57 20 Sweden $1.38
21 Turkey $0.46 21 Turkey $1.34
22 Mexico $0.36 22 Mexico $1.12
23 Norway $0.36 23 Norway $0.84
24 Malaysia $0.14 24 Malaysia $0.69
25 Poland $0.08 25 Poland $0.26
Source: Deloitte analysis and Oxford Economics DM EM

Copyright © 2011 Deloitte Development LLC. All rights reserved.13 The next decade in global wealth among millionaire households
In terms of the total number of millionaire households, emerging markets are likely to see an upward movement in rank, with some economies rising meaningfully (South Korea, Mexico) and others dropping slightly (Taiwan, Turkey).
Global ranking by total number of millionaire households (2011–2020)
Number of millionaire households ('000s)
2011 Total 37,978 2020 Total 65,521
1 United States 10,541 1 United States 20,551
2 Japan 5,705 2 Japan 8,649
3 Germany 3,485 3 Germany 5,789
4 UnitedKingdom 2,904 4 United
Kingdom 3,814
5 France 2,653 5 Italy 3,552
6 Italy 2,476 6 France 3,346
7 Canada 1,745 7 China 2,500
8 China 1,312 8 Canada 2,413
9 Spain 1,022 9 South Korea 1,730
10 Taiwan 719 10 Australia 1,620
11 Netherlands 713 11 Spain 1,602
12 Hong Kong 712 12 Taiwan 1,264
13 Australia 698 13 Russia 1,205
14 Switzerland 573 14 Hong Kong 1,178
15 South Korea 520 15 Brazil 1,001
Number of millionaire households ('000s)
2011 Total 37,978 2020 Total 65,521
16 Russia 375 16 Netherlands 959
17 Brazil 303 17 Switzerland 872
18 India 286 18 India 694
19 Turkey 273 19 Mexico 615
20 Sweden 252 20 Turkey 601
21 Singapore 221 21 Singapore 449
22 Norway 178 22 Sweden 422
23 Mexico 170 23 Norway 319
24 Malaysia 76 24 Malaysia 249
25 Poland 50 25 Poland 126
Source: Deloitte analysis and Oxford Economics DM EM

Copyright © 2011 Deloitte Development LLC. All rights reserved.14 The next decade in global wealth among millionaire households
In terms of the number of millionaire households, our study suggests that developed economies will lead the $1–$5 million wealth cohort, though the decade may potentially see a shift towards more households holding $1–$5 million in wealth in emerging markets (e.g., South Korea).
Global ranking by total number of millionaire households (2011–2020): $1–$5 million cohort
Number of millionaire households ('000s) — $1–$5M Cohort
2011 Total 32,285 2020 Total 55,127
1 United States 7,753 1 United States 15,748
2 Japan 5,403 2 Japan 7,841
3 Germany 3,333 3 Germany 5,540
4 United Kingdom 2,798 4 United
Kingdom 3,685
5 France 2,533 5 France 3,109
6 Italy 2,103 6 Italy 3,016
7 Canada 1,546 7 Canada 2,152
8 Spain 911 8 South Korea 1,506
9 China 802 9 China 1,484
10 Taiwan 689 10 Australia 1,450
11 Netherlands 657 11 Spain 1,441
12 Australia 616 12 Taiwan 1,190
13 Hong Kong 581 13 Russia 1,003
14 Switzerland 468 14 Hong Kong 869
15 South Korea 435 15 Netherlands 821
Number of millionaire households ('000s) — $1–$5M Cohort
2011 Total 32,285 2020 Total 55,127
16 Russia 269 16 Brazil 798
17 Turkey 211 17 Switzerland 657
18 India 210 18 Turkey 512
19 Sweden 209 19 India 508
20 Brazil 195 20 Mexico 507
21 Singapore 188 21 Singapore 366
22 Norway 159 22 Sweden 349
23 Mexico 124 23 Norway 277
24 Malaysia 53 24 Malaysia 212
25 Poland 38 25 Poland 86
Source: Deloitte analysis and Oxford Economics DM EM

Copyright © 2011 Deloitte Development LLC. All rights reserved.15 The next decade in global wealth among millionaire households
Within the $5–$30 million wealth cohort, China is likely be the standout emerging market among the 25 economies examined in this study. South Korea may see significant upward movement in its rank between 2011 and 2020.
Global ranking by total number of millionaire households (2011–2020): $5–$30 million cohort
Number of millionaire households ('000s) — $5M–$30M Cohort
2011 Total 4,823 2020 Total 8,674
1 United States 2,292 1 United States 4,183
2 China 464 2 Japan 712
3 Italy 355 3 China 689
4 Japan 282 4 Italy 486
5 Canada 182 5 Hong Kong 296
6 Hong Kong 120 6 Canada 234
7 Germany 114 7 Switzerland 194
8 Spain 100 8 France 185
9 France 96 9 South Korea 183
10 Switzerland 96 10 Germany 178
11 Brazil 91 11 Russia 153
12 Russia 85 12 Australia 146
13 United Kingdom 73 13 Spain 141
14 South Korea 71 14 Brazil 135
15 Australia 71 15 India 130
Number of millionaire households ('000s) — $1–$5M Cohort
2011 Total 4,823 2020 Total 8,674
16 Turkey 52 16 Netherlands 110
17 India 50 17 Mexico 92
18 Mexico 44 18 United Kingdom 87
19 Singapore 43 19 Taiwan 63
20 Netherlands 40 20 Turkey 62
21 Sweden 30 21 Singapore 61
22 Taiwan 27 22 Sweden 56
23 Malaysia 19 23 Norway 36
24 Norway 15 24 Poland 32
25 Poland 11 25 Malaysia 29
Source: Deloitte analysis and Oxford Economics DM EM

Copyright © 2011 Deloitte Development LLC. All rights reserved.16 The next decade in global wealth among millionaire households
Our analysis suggests that in the $30+ million wealth cohort, emerging markets may fare comparatively better than in smaller wealth cohorts. Most emerging markets are likely to see an improvement in their rank over the next decade. China may continue to hold its place as the economy with the second highest number of millionaires holding $30 million in wealth or more.
Global ranking by total number of millionaire households (2011–2020): $30+ million cohort
Number of millionaire households ('000s) — $30M +Cohort
2011 Total 871 2020 Total 1,719
1 United States 496 1 United States 620
2 China 46 2 China 327
3 Germany 38 3 Japan 96
4 United Kingdom 33 4 Germany 71
5 India 26 5 Brazil 67
6 France 24 6 India 56
7 Russia 21 7 France 52
8 Japan 20 8 Italy 50
9 Italy 18 9 Russia 49
10 Canada 17 10 United Kingdom 42
11 Brazil 17 11 South Korea 41
12 Netherlands 16 12 Netherlands 28
13 South Korea 14 13 Turkey 28
14 Sweden 13 14 Canada 27
15 Australia 12 15 Australia 24
Number of millionaire households ('000s) — $1–$5M Cohort
2011 Total 4,823 2020 Total 8,674
16 Spain 11 16 Singapore 22
17 Turkey 10 17 Switzerland 22
18 Hong Kong 10 18 Spain 20
19 Switzerland 9 19 Mexico 16
20 Singapore 5 20 Sweden 16
21 Taiwan 4 21 Hong Kong 13
22 Malaysia 4 22 Taiwan 11
23 Norway 4 23 Poland 8
24 Mexico 3 24 Malaysia 8
25 Poland 1 25 Norway 6
DM EMSource: Deloitte analysis and Oxford Economics

Copyright © 2011 Deloitte Development LLC. All rights reserved.17 The next decade in global wealth among millionaire households
55%
42%44% 43%
18%
11% 10% 9%
4%
6% 5% 5%
6%
6% 6% 5%
2%
6% 6%5%
2%
5% 4%4%
9% 17% 19% 24%
0%
10%
20%
30%
40%
50%
60%
70%
80%
90%
100%
2000 2011 2015 2020
U.S. Japan Italy UK Germany France Canada Switzerland Other countries
Although the share of U.S. millionaire wealth among global millionaires fell from 55% in 2000 to 42% in 2011, it is likely to retain its current share of global wealth over the next decade.
Share of U.S. wealth among global millionaires (2000–2020)
Source: Deloitte analysis and Oxford Economics

Copyright © 2011 Deloitte Development LLC. All rights reserved.18 The next decade in global wealth among millionaire households
The proportion of the ultra-wealthy in relation to total households in 2020 is likely to be the highest in Singapore.
Developed markets: Ultra-wealthy ($30 m+) as a percent of the population of households
Source: Deloitte analysis and Oxford Economics
0.06%
0.05%
0.13%
0.09%
0.13%
0.04%
0.11%
0.07%
0.14%
0.18%
0.29%
0.22%
0.42%
0.43%
0.26%
0.44%
0.11%
0.14%
0.16%
0.18%
0.19%
0.20%
0.20%
0.21%
0.25%
0.25%
0.35%
0.37%
0.49%
0.52%
0.61%
1.82%
0.00% 0.20% 0.40% 0.60% 0.80% 1.00% 1.20% 1.40% 1.60% 1.80% 2.00%
Spain
Taiwan
United Kingdom
Germany
Canada
Japan
France
Italy
Australia
Norway
Sweden
Netherlands
U.S.
Hong Kong
Switzerland
Singapore
2020 2011

Copyright © 2011 Deloitte Development LLC. All rights reserved.19 The next decade in global wealth among millionaire households
$4.2
$4.0
$3.7
$2.9
$2.1
$2.0
$1.5
$1.3
$0.0 $0.5 $1.0 $1.5 $2.0 $2.5 $3.0 $3.5 $4.0 $4.5
Switzerland
Singapore
U.S.
Hong Kong
Russia
India
Germany
China
Wealth per household in $ millions
According to our analysis, millionaire households in Switzerland are likely to have an average of $4.2 million in wealth — the highest among the 25 economies included in this study. China may have the least average wealth among its millionaire households ($1.3 million per household).
Wealth per millionaire household in 2011
Source: Deloitte analysis and Oxford Economics

Global asset allocation preferences

Copyright © 2011 Deloitte Development LLC. All rights reserved.21 The next decade in global wealth among millionaire households
Our analysis suggests that the asset allocation among the top 1% of wealthy households is relatively consistent across developed markets. However, Hong Kong, Italy, and Spain are likely to have a greater proportion of wealth attached to primary residential real estate.
Developed markets: Estimates of current asset allocation among the top 1% of wealthy households
18% 18% 21% 22%13% 15%
6%14%
20% 18%
8% 10%11% 7%
13%15%
14%
14%
20%18%
8%11%
11%
3% 6%5%
8%1%
6%6%
2%1%
1%
0%6%
5%8% 1%
6%6%
5%
10%7%
10%6% 6%
2%6%
7%7%
35% 20% 21%
22%28% 24%
51%45%
20%20%
24%30% 28%
36%27% 29%
11%18% 20% 25%
Hong Kong Japan Canada United States France Germany Italy Spain Switzerland U.K.
Domestic stocks Foreign stocks Domestic bonds Foreign bonds Cash & other Residential Business Equity
Source: Deloitte analysis and Oxford Economics
Copyright © 2011 Deloitte Development LLC. All rights reserved.22 The next decade in global wealth among millionaire households
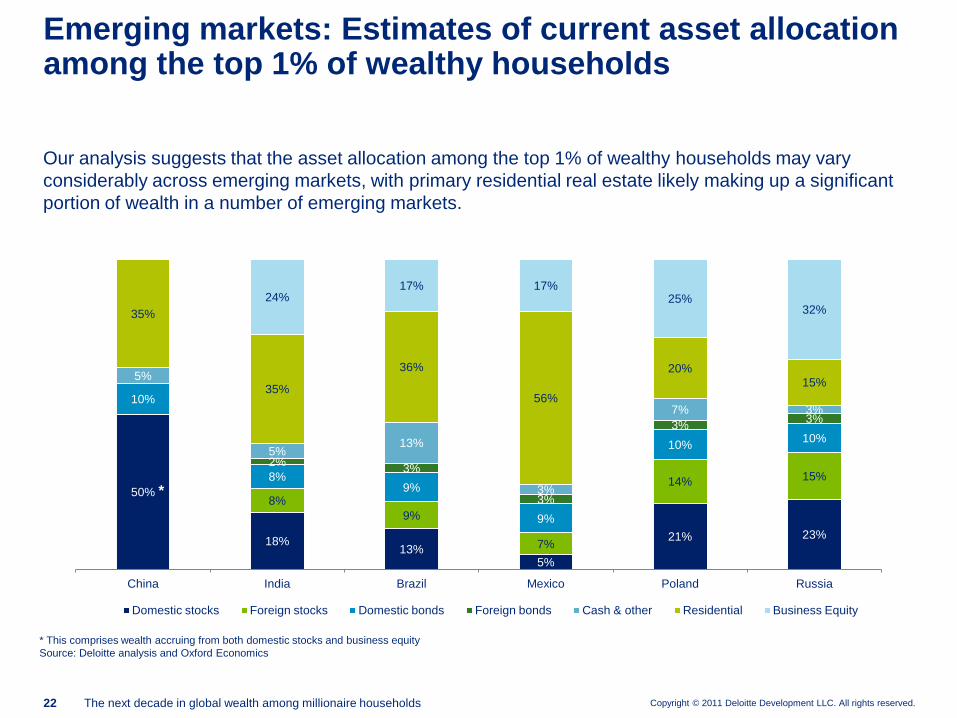
Our analysis suggests that the asset allocation among the top 1% of wealthy households may vary considerably across emerging markets, with primary residential real estate likely making up a significant portion of wealth in a number of emerging markets.
Emerging markets: Estimates of current asset allocation among the top 1% of wealthy households
50%
18%13%
5%
21% 23%
8%9%
7%
14% 15%
10%
8%9%
9%
10% 10%
2% 3%
3%
3% 3%
5%
5%13%
3%
7% 3%
35%
35%
36%
56%
20%15%
24%17% 17%
25%32%
China India Brazil Mexico Poland Russia
Domestic stocks Foreign stocks Domestic bonds Foreign bonds Cash & other Residential Business Equity
*
* This comprises wealth accruing from both domestic stocks and business equitySource: Deloitte analysis and Oxford Economics

United States Overview
Copyright © 2011 Deloitte Development LLC. All rights reserved.24 The next decade in global wealth among millionaire households
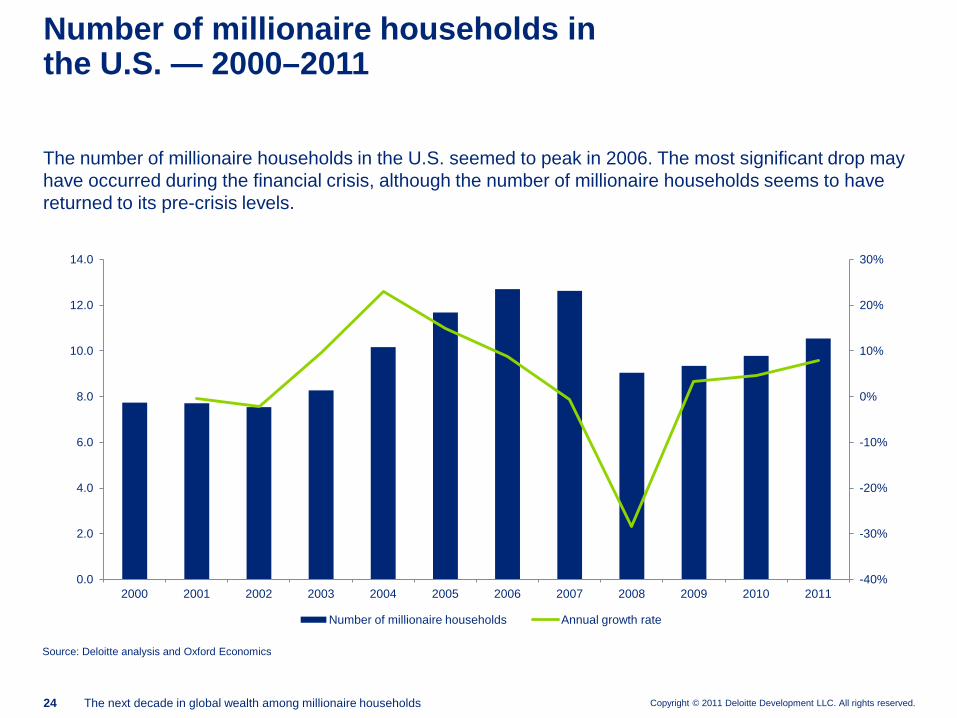
The number of millionaire households in the U.S. seemed to peak in 2006. The most significant drop may have occurred during the financial crisis, although the number of millionaire households seems to have returned to its pre-crisis levels.
Number of millionaire households in the U.S. — 2000–2011
-40%
-30%
-20%
-10%
0%
10%
20%
30%
0.0
2.0
4.0
6.0
8.0
10.0
12.0
14.0
2000 2001 2002 2003 2004 2005 2006 2007 2008 2009 2010 2011
Number of millionaire households Annual growth rate
Source: Deloitte analysis and Oxford Economics

Copyright © 2011 Deloitte Development LLC. All rights reserved.25 The next decade in global wealth among millionaire households
According to our study, the top 1% of millionaire households in the U.S. will have more than a third of their wealth in businesses equity and about a third in stocks and bonds.
United States: Estimates of current asset allocation among the top 1% of wealthy households
22% 21% 21%
7% 7% 7%3% 2% 1%5% 7% 8%
5% 6% 7%
22%
36%44%
36%
22%12%
99-100th percentile 95-99th percentile 90-95th percentile
Domestic Stocks Foreign Stocks Domestic Bonds Cash Other Residential Business Equity
Percentile
36%
22%
Source: Deloitte analysis and Oxford Economics

Copyright © 2011 Deloitte Development LLC. All rights reserved.26 The next decade in global wealth among millionaire households
Our analysis suggests that the total wealth of all U.S. millionaires will reach $87 trillion in 2020, a CAGR of 9% between 2011–2020. The United States will likely remain the largest wealth management market in the world.
Wealth among millionaire households in the U.S.
$25
$39
$58
$87
$-
$10
$20
$30
$40
$50
$60
$70
$80
$90
$100
2000 2011 2015 2020
Tota
l mill
iona
ire w
ealth
in U
SD tr
illio
ns
Growing wealth in the U.S.
56%
50%
49%
$25
$39
$58
$87496,000
households
2,292,000households
7,753,000households
$30m+
$5m–$30m
$1m –$5m
The number of millionaire households in 2011
Source: Deloitte analysis and Oxford Economics

Copyright © 2011 Deloitte Development LLC. All rights reserved.27 The next decade in global wealth among millionaire households
5.737.75
11.51
15.751.60
2.29
2.89
4.18
0.41
0.5
0.55
0.62
0
5
10
15
20
25
30
2000 2011 2015 2020
Num
ber o
f mill
iona
ire h
ouse
hold
in m
illio
ns
$1m - $5m $5m - $30m $30m and above
According to this study, those in the $1m–$5m wealth cohort will reach 15.8 million households in 2020, a growth of 103% over the next decade. The $5m–30m cohort is also likely to exhibit strong growth, at 83% over the next decade, while the $30 m+ cohort is expected to grow 24%.
Growth in number of millionaire households by wealth cohorts in the U.S.
Total7.7
Total10.5
Total15.0
Total20.6
36%
43%
37%
Source: Deloitte analysis and Oxford Economics

Copyright © 2011 Deloitte Development LLC. All rights reserved.
Contrasting U.S. and China
Source: Deloitte Center for Financial Services and Oxford Economics, and IMFGDP projections are derived using IMF current estimates and Oxford Economics imputed growth rates.
As U.S. and Chinese GDP converge over the next decade, Chinese millionaire wealth may likely remain a relatively small proportion of U.S. millionaire wealth, reaching just under 10% by 2020.
14 16 18
39
58
87
4 6 91.7 3.6
8.2
0
10
20
30
40
50
60
70
80
90
2011 2015 2020
U.S. GDP U.S. Wealth China GDP China Wealth
US
D T
rillio
ns

United States Regions

Copyright © 2011 Deloitte Development LLC. All rights reserved.30 The next decade in global wealth among millionaire households
• Overview– In terms of the number of millionaire households, this study suggests growth rates of roughly 7–8% between 2010 and 2020, with Connecticut
growing the least (4% annualized growth) and South Dakota and North Dakota expected to grow the most (10% annualized growth).– In 2020, California, Texas, New York, and Florida will likely be home to the greatest number of millionaire households, while the Midwest
region is forecast to have the fewest.– According to this study, Arizona, and Nevada will likely experience the greatest growth in net worth of millionaire households between 2009
and 2015. California, Texas, Florida, Oregon, Idaho, and Utah are also expected to see greater than average growth.
• Density– Our analysis indicates that in 2010, Connecticut held the highest density of millionaires with 14.2% of households holdings assets valued at
more than one million dollars. By 2020, New Jersey will likely be the state with the highest density of millionaires (24.6%).
• Regional Leaders– In the Northern Pacific region, Washington State may have the region’s most number of millionaires ― 534,000 by 2020.– In the Pacific Southwest region, California will likely be a leader in the number of millionaire households ― 2.7 million by 2020. However,
according to our study, the fastest growth rate of millionaire households in the region is found in Arizona, where millionaire households may grow at an annualized rate of 9%.
– In Mid-America, Texas is likely to have the most number of millionaires with 1.5 million by 2020. Texas may overtake New York in 2020 as the state with the second most amount of millionaires in the United States, next to California
– In the Southeast, Florida may have the highest number of millionaire households with 1.4 million in 2020. Georgia may potentially come in second with 674,000 millionaires in 2020.
– In the Northeast, New York may have the highest number of millionaire households with 1.4 million in 2020, potentially followed by New Jersey. Vermont may see the highest increase in the number of millionaires with an annualized growth rate of 9% over the next decade.
– In the Midwest, Illinois is likely to have the highest number of millionaires with 803,000 in 2020, potentially followed by Wisconsin with 368,000 in 2020.
– In North Central, Pennsylvania may have the highest number of millionaire households with 804,000 in 2020, potentially followed by Ohio. Most states in this region will likely see a below-average annualized growth rate of 6% over the next decade.
Key forecasts for the United States regions: Millionaire households

Copyright © 2011 Deloitte Development LLC. All rights reserved.31 The next decade in global wealth among millionaire households
14.2
13.9
13.7
11.1
10.8
10.4
18.1
18.5
20.1
15
15.5
15.4
22.6
23.2
24.6
19.0
19.5
20.0
0 5 10 15 20 25 30
Connecticut
Massachusetts
New Jersey
District of Columbia
Hawaii
New York
Density of millionaire households %
2020 2015 2010
In 2010, Connecticut was the state with the highest density of millionaire households (14.2%). Our study suggests that in 2020, New Jersey will have the highest density of millionaires (24.6%).
Density of millionaire households across U.S. states
Source: Deloitte analysis and Oxford Economics

Copyright © 2011 Deloitte Development LLC. All rights reserved.32 The next decade in global wealth among millionaire households
226
11251 42 22 20 14
372
200
87 6632 31 21
534
296
13095
46 44 30
0
100
200
300
400
500
600
Washington Oregon Utah Idaho Alaska Montana Wyoming
# of
mill
iona
ires
in th
ousa
nds
2010 2015 2020
Growth rates in the Northern Pacific region
2010–2015 2010–2020Washington 9% 8%
Oregon 10% 9%
Utah 9% 9%
Idaho 8% 8%
Alaska 6% 7%
Montana 8% 7%
Wyoming 7% 7%
U.S. regional wealth: Northern Pacific
In the Northern Pacific region, Washington state is likely to have the largest number of millionaire households in the region by 2020 (534,000).
Source: Deloitte analysis and Oxford Economics

Copyright © 2011 Deloitte Development LLC. All rights reserved.33 The next decade in global wealth among millionaire households
Growth rates in the Pacific Southwest region
2010–2015 2010–2020California 8% 7%
Arizona 9% 9%
Nevada 7% 6%
Hawaii 8% 7%
1,319
166 84 48
2,105
283128 71
2,745
434157 92
0
500
1,000
1,500
2,000
2,500
3,000
California Arizona Nevada Hawaii
# of
mill
iona
ires
in th
ousa
nds
2010 2015 2020
In the Pacific Southwest region, California will likely be the leading the state with 2.7 million millionaire households in 2020. However, our analysis suggests that the fastest growth rate in the number of millionaire households will be in Arizona with an annualized growth rate of 9%.
U.S. regional wealth: Pacific Southwest
Source: Deloitte analysis and Oxford Economics

Copyright © 2011 Deloitte Development LLC. All rights reserved.34 The next decade in global wealth among millionaire households
717
180 162 78 77 76 48
1,117
273 239126 112 118 78
1,592
378 333182 160 168 109
0200400600800
10001200140016001800
Texas Colorado Missouri Oklahoma Louisiana Kansas New Mexico
# of
mill
iona
ires
in th
ousa
nds
2010 2015 2020
In the Mid America region, Texas will likely have the highest number of millionaire households in 2020 with 1.5 million. Texas may overtake New York in 2020 as the second richest state next to California.
U.S. regional wealth: Mid America
Source: Deloitte analysis and Oxford Economics
Growth rates in the Mid America region
2010–2015 2010–2020Texas 8% 8%
Colorado 7% 7%
Missouri 7% 7%
Oklahoma 8% 8%
Louisiana 6% 7%
Kansas 8% 7%
New Mexico 8% 8%

Copyright © 2011 Deloitte Development LLC. All rights reserved.35 The next decade in global wealth among millionaire households
434
159 14278 43 15 12
591
260 239
12468 28 23
803
368 341
17098
42 340
100200300400500600700800900
Illinois Wisconsin Minnesota Iowa Nebraska South Dakota North Dakota
# of
mill
iona
ires
in th
ousa
nds
2010 2015 2020
In the Midwest region, Illinois will likely top the table with the highest number of millionaire households in 2020 with 803,000, potentially followed by Wisconsin with 368,000 in 2020.
U.S. regional wealth: Midwest
Source: Deloitte analysis and Oxford Economics
Growth rates in the Midwest region
2010–2015 2010–2020Illinois 5% 6%
Wisconsin 9% 8%
Minnesota 9% 8%
Iowa 8% 7%
Nebraska 8% 8%
South Dakota 11% 10%
North Dakota 11% 10%

Copyright © 2011 Deloitte Development LLC. All rights reserved.36 The next decade in global wealth among millionaire households
401332 297
16895
581484
416
257145
804
666583
365
207
0100200300400500600700800900
Pennsylvania Ohio Michigan Indiana Kentucky# of
mill
iona
ires
in th
ousa
nds
2010 2015 2020
Pennsylvania may have the highest number of millionaire households with 804,000 in 2020, likely followed by Ohio. Our study indicates that most states in this region will see an annualized growth rate of 6% over the next decade.
U.S. regional wealth: North Central
Growth rates in the North Central region
2010–2015 2010–2020Pennsylvania 6% 7%
Ohio 6% 7%
Michigan 6% 6%
Indiana 7% 7%
Kentucky 7% 7%
Source: Deloitte analysis and Oxford Economics

Copyright © 2011 Deloitte Development LLC. All rights reserved.37 The next decade in global wealth among millionaire households
Growth rates in the Northeast region
2010–2015 2010–2020New York 7% 6%
New Jersey 7% 6%
Massachusetts 5% 5%
Connecticut 4% 4%
New Hampshire 7% 7%
Maine 7% 7%
Rhode Island 9% 8%
Vermont 9% 8%
758
443352
19454 34 33 19
1,121
662
474
24883 50 50 32
1,458
831
603
314
117 71 69 450
200
400
600
800
1000
1200
1400
1600
New York New Jersey Massachusetts Connecticut New Hampshire Maine Rhode Island Vermont
# of
mill
iona
ires
in th
ousa
nds
2010 2015 2020
In the Northeast region, New York may potentially have the highest number of millionaire households in 2020 with 1.4 million, likely followed by New Jersey. Vermont may have the highest increase in its number of millionaires, with an annualized growth rate of 9%.
U.S. regional wealth: Northeast
Source: Deloitte analysis and Oxford Economics

Copyright © 2011 Deloitte Development LLC. All rights reserved.38 The next decade in global wealth among millionaire households
596
327 287 264 221 178 115 89 65 45 33 29 23
995
474 431 428347
263191 143 99 61 50 37 36
1,445
674 615 596474
370264 206
140 86 70 45 520
200
400
600
800
1000
1200
1400
1600
Florida Georgia North Carolina
Virginia Maryland Tennessee South Carolina
Alabama Arkansas Mississippi West Virginia
District of Columbia
Delaware
# of
mill
iona
ires
in th
ousa
nds
2010 2015 2020
In the Southeast region, Florida may have the highest number of millionaire households in 2020 with 1.4 million, likely followed by Georgia with 674,000.
U.S. regional wealth: Southeast
Source: Deloitte analysis and Oxford Economics
Growth rates in the Southeast region
2010–2015 2010–2020Florida 9% 8%
Georgia 6% 7%
North Carolina 7% 7%
Virginia 8% 8%
Maryland 8% 7%
Tennessee 7% 7%
South Carolina 9% 8%
Arkansas 9% 8%
Alabama 8% 8%
Mississippi 5% 6%
District of Columbia 4% 4%
Delaware 8% 8%
West Virginia 9% 8%
District of Columbia 5% 4%Delaware 9% 8%
Copyright © 2011 Deloitte Development LLC. All rights reserved.39 The next decade in global wealth among millionaire households
Deloitte’s wealth study offers insights into the next decade of global wealth among millionaire households. The highlights discussed here are just a small sampling of the data points and trends that were unearthed. Deloitte is currently sharing these insights with clients and helping them to strategize on how the study results can help their businesses. For more information or to arrange an appointment to discuss these and hundreds of other findings from the study, please contact:
Andrew FreemanExecutive Director, Center for Financial ServicesDeloitte Services [email protected]
Val SrinivasHead of Research, Center for Financial ServicesDeloitte Services [email protected]
Want to learn more?

Appendix

Copyright © 2011 Deloitte Development LLC. All rights reserved.41 The next decade in global wealth among millionaire households
• The Deloitte Center for Financial Services collaborated with Oxford Economics on this study.• In this study we report cross-country estimates of the number, density and total wealth of households with net wealth: $1–$5m, $5–
$30m and $30m+ cohorts.• Wealth in this study includes financial assets (stocks, bonds, and other investments) and nonfinancial assets including primary
residence, durables, business equity, and other assets. Although it is customary for the wealthy to be grouped into categories according to levels of investable assets (i.e., excluding primary residence), on a cross-country basis the available data rarely makes such distinctions possible.
• The analysis presented in this report relies solely on actual published data based on surveys and other analyses and not on subjective judgements of individuals, thereby maximising the reliability of our estimates.
• Official exchange rates are used on the grounds that this metric is more directly relevant to wealth managers seeking to comparemarket size and investment opportunities across economies.
• Having estimated the current population of wealthy individuals by economy, our approach to forecasting future changes in their numbers involves two steps. First, a breakdown of wealth holdings across broad asset categories is established for each cohort of interest. Second, the value of these portfolios is projected using forecasts for relevant factors such as stock prices, house prices, and interest rates, which are contained within the Oxford Economics Global Model. This modelling approach allows for shifts in the overall distribution of wealth across time, rather than imposing aggregate wealth projections onto a static distribution. Using this global model also enables alternative forecasts of wealthy individuals to be made under varying assumptions for key economic andfinancial variables.
• Of course, concepts of what makes an individual ‘wealthy’ vary between economies and through time. This is because perceptions of relative wealth are framed by economic factors, such as the cost of living, which varies due to differences in relative price levels. Comparing the US and China, for example, it is clear that the standard of living associated with a given level of wealth would be very different between the two economies. Correcting for these differences in relative price levels using purchasing power parity (PPP) exchange rates shows that $1 million in the US, for example, feels more like $1.8 million in China. Equally, the real value of assets is eroded over time due to the effects of inflation, so an American with $1 million of assets in 1990 would have seen their real value fall to just $600,000 today. This helps to explain why being a ‘millionaire’ in the US is no longer viewed as the milestone of success that it was in the past. These caveats should be borne in mind when reviewing our results.
Study methodology

Copyright © 2011 Deloitte Development LLC. All rights reserved.42 The next decade in global wealth among millionaire households
In the estimation of wealth among millionaires, forecasts derived from the Oxford Economics Global Model were used. The table below summarizes the five year annual averages of some of these forecasts.
Study methodology: Forecast assumptions
GDP Growth Rate (%) Inflation (%) Savings Rate (%) Population Change (%)
2011–2015 2016–2020 2011–2015 2016–2020 2011–2015 2016–2020 2011–2015 2016–2020US 3.47% 2.80% 2.46% 2.51% 5.57% 2.88% 0.97% 0.96%China 8.83% 8.19% 3.05% 3.02% 36.11% 34.90% 0.61% 0.50%Australia 3.50% 3.24% 2.49% 2.51% 13.10% 13.21% 1.00% 0.93%Brazil 4.31% 3.55% 4.04% 4.00% 0.94% 6.18% 0.75% 0.60%Canada 3.77% 3.09% 2.42% 2.50% 3.89% 4.03% 0.93% 0.89%France 2.00% 1.74% 1.84% 1.86% 11.21% 9.92% 0.46% 0.39%Germany 1.95% 1.68% 1.65% 1.85% 10.32% 9.98% -0.07% -0.10%Hong Kong 4.81% 4.70% 1.97% 2.01% 5.58% 6.74% 0.91% 0.81%India 8.48% 7.30% 4.46% 3.64% 30.96% 31.89% 1.28% 1.10%Italy 1.47% 1.37% 2.01% 1.96% 9.42% 9.54% 0.03% -0.08%Japan 1.70% 1.01% 0.57% 0.60% 2.94% 5.58% -0.19% -0.34%Malaysia 4.70% 4.29% 2.97% 3.03% 19.36% 21.17% 1.48% 1.28%Mexico 4.41% 3.50% 3.10% 3.03% 5.53% 4.98% 0.87% 0.71%Netherlands 2.18% 1.61% 1.91% 1.87% 6.91% 6.48% 0.29% 0.26%Norway 2.54% 2.25% 2.28% 2.47% 4.35% 4.23% 0.74% 0.70%Poland 3.98% 2.85% 2.87% 2.40% 5.39% 5.50% -0.01% -0.07%Russia 4.84% 4.20% 5.66% 5.30% 8.45% 8.64% -0.34% -0.38%Singapore 5.34% 4.41% 1.33% 1.33% 4.01% 3.56% 0.90% 0.62%South Korea 4.33% 3.98% 2.76% 2.38% 3.92% 6.58% 0.27% 0.13%Spain 1.67% 1.63% 1.35% 1.65% 14.64% 11.06% 0.35% 0.23%Sweden 2.70% 2.14% 1.78% 1.80% 9.35% 8.04% 0.40% 0.44%Switzerland 1.88% 1.71% 1.20% 1.51% 13.96% 14.09% 0.75% 0.60%Taiwan 4.27% 4.08% 1.82% 1.83% 6.62% 5.26% 0.31% 0.20%Turkey 6.17% 5.38% 4.25% 4.05% 9.45% 10.35% 1.10% 0.96%United Kingdom 2.89% 2.29% 1.85% 2.00% 3.70% 3.89% 0.54% 0.53%
Source: Oxford Economics
Copyright © 2011 Deloitte Development LLC. All rights reserved.43 The next decade in global wealth among millionaire households
• Business equity: Incorporates the value of many business-related wealth not held in share ownership of listed companies.
• Domestic stock market index: For each economy, our historical data comes from a standard index (for example for France we use the Paris SBF 250). The index value is then forecasted forward using the Oxford Global Macro Model.
• Change in the international stock market: The growth rate was constructed as an unweighted average of the change in the stock market indexes for the U.S. (Willshire 5000), Eurozone (Dow Jones Euro STOXX 50), Japan (TSE 1st Section Composite), and India (SENSEX).
• Domestic long-term bond yield: In many cases this is the forecasted yield of domestic government bonds with 10-year maturity. In the cases of Turkey and India, data limitations meant we had to use the short term rate plus a spread.
• International long-term bond yield: We used U.S. 10-year maturity bond yields as our benchmark international long term-bond yield.
• Short-term interest rates: In most cases the short-term rate is the three month interbank lending rate. However, due to data limitations there are exceptions to this; Brazil (the central bank's overnight lending rate), India (the central bank policy rate), Malaysia (overnight lending rate), and Turkey (one week reference ask rate).
Glossary

Copyright © 2011 Deloitte Development LLC. All rights reserved.44 The next decade in global wealth among millionaire households
• Nominal residential house building: For all economies, this series is the forecasted investment in private dwellings, which equates to the value of the new housing stock being created each year.
• Net acquisition of financial assets: In all economies this is the forecasted acquisition of financial assets by households, removing any loans made to buy them.
• Real effective exchange rate: This is a broad-based measure of the real exchange rate, which covers each economy’s major trading partners. For some economies this is not computed (Brazil, India, Malaysia, and Poland), and we use the forecasted exchange rate with the dollar as a proxy.
• Exchange rate: For all economies, this is the forecasted end of period exchange rate with the U.S. dollar.
• Change in house prices: In most cases, the historical data comes from a standard house price index (for example, the U.S. index is the Federal Reserve's Federal Housing Finance Agency house price index), which is then forecast forward. For those economies where we don't have a house price index (Brazil, India, Russia, Singapore, and Turkey) the forecasted growth in nominal earnings was used as a proxy.
Glossary (cont.)
Copyright © 2011 Deloitte Development LLC. All rights reserved.45 The next decade in global wealth among millionaire households
This presentation contains general information only and is based on the experiences and research of Deloitte practitioners. Deloitte is not, by means of this presentation, rendering business, financial, investment, or other professional advice or services. This presentation is not a substitute for such professional advice or services, nor should it be used as a basis for any decision or action that may affect your business. Before making any decision or taking any action that may affect your business, you should consult a qualified professional advisor. Deloitte, its affiliates, and related entities shall not be responsible for any loss sustained by any person who relies on this presentation.

About DeloitteDeloitte refers to one or more of Deloitte Touche Tohmatsu Limited, a U.K. private company limited by guarantee, and its network of member firms, each of which is a legally separate and independent entity. Please see www.deloitte.com/about for a detailed description of the legal structure of Deloitte Touche Tohmatsu Limited and its member firms. Please see www.deloitte.com/us/about for a detailed description of the legal structure of Deloitte LLP and its subsidiaries.
Copyright © 2011 Deloitte Development LLC. All rights reserved.Member of Deloitte Touche Tohmatsu Limited
Insights. Research. Connections.
Headquartered in New York City, the Deloitte Center for Financial Services provides insight and research to help improve the business performance of banks, private equity, hedge funds, mutual funds, insurance and real estate organizations operating globally. The Center helps financial institutions understand and address emerging opportunities in risk and information technology, regulatory compliance, growth, and cost management.
The Center brings a financial services integrated view to Deloitte and its network of member firms, each of which is a legally separate and independent entity that provide audit, consulting, financial advisory, risk management, and tax services to select clients.
With access to the deep intellectual capital of 169,000 people worldwide, Deloitte serves more than one-half of the world’s largest companies, as well as large national enterprises, public institutions, locally important clients, and successful, fast-growing global growth companies.
To learn more about the Center, its projects and events, please visit us at www.deloitte.com/us/cfs.
Recommended