UvA-DARE is a service provided by the library of the University of Amsterdam (http://dare.uva.nl)
UvA-DARE (Digital Academic Repository)
Organizational excellence in healthcare
Does, R.J.M.M.; van den Heuvel, J.
Published in:The theories and practices of organizational excellence: New perspectives
Link to publication
Citation for published version (APA):Does, R. J. M. M., & van den Heuvel, J. (2008). Organizational excellence in healthcare. In K. J. Foley, & P.Hermel (Eds.), The theories and practices of organizational excellence: New perspectives (pp. 77-103). Sydney:SAI Global.
General rightsIt is not permitted to download or to forward/distribute the text or part of it without the consent of the author(s) and/or copyright holder(s),other than for strictly personal, individual use, unless the work is under an open content license (like Creative Commons).
Disclaimer/Complaints regulationsIf you believe that digital publication of certain material infringes any of your rights or (privacy) interests, please let the Library know, statingyour reasons. In case of a legitimate complaint, the Library will make the material inaccessible and/or remove it from the website. Please Askthe Library: http://uba.uva.nl/en/contact, or a letter to: Library of the University of Amsterdam, Secretariat, Singel 425, 1012 WP Amsterdam,The Netherlands. You will be contacted as soon as possible.
Download date: 07 Jul 2018
CHAPTERTHREE
@
1>. ~ II-u~ ~J, f1r<clu. 1,U:o~~ rJ.li\- J txcACQ NtJ 1j~f{clVto/
etwr~ 11vw. .t(-r F~ <t. r. ~~ (.eL)
~Al )totcJ I~ ~d ''ILJ I~WCt ," n-1JJ
Organizational excellence in healthcare
Ronald J.M.M. DoesUniversity of Amsterdam
Jaap van den HeuvelReinier de Graaf Hospital, Delft
Introduction
Healthcare, as any other service operation, requires systematic innovation efforts to remain
competitive, cost efficient and up to date. In this paper, we outline a methodology and
present how principles of two improvement programs, i.e., Lean Thinking and Six Sigma,
can be combined to provide an effective framework for producing systematic innovation
efforts in healthcare. The benefits of this approach are that healthcare cost increases can be
kept in control, while quality is improved, and better healthcare is provided. The approach is
illustrated by a longitudinal case study of a period of five years in a hospital.
The Institute of Medicine (established in 1970 under the charter of the National Academy of
Sciences to provide independent, objective, evidence-based advice to policymakers, health
professionals, the private sector, and the public in the United States) has produced two
reports demonstrating healthcare has serious patient safety and quality problems and is in
need of fundamental change (Institute of Medicine, 2000 and 2001). Care processes are
poorly designed and characterized by unnecessary duplication of services and long waiting
times and delays. Costs are exploding and waste is identified as an important contributor to
the increase in healthcare expenditures. As a result healthcare consistently does not succeed
to meet patient's needs. To better serve the needs of patients, healthcare systems have to be
redesigned. By issuing the reports, the Institute of Medicine has put quality management
strongly on the agenda of healthcare organizations. Delivering low quality of care was
considered unacceptable. This obligation may cause more (financial) stress because for
77
example in the Netherlands the hospital funding system pays fixed prices per patient
regardless the quality of care delivered. Hence delivering high quality does not generate
more income. However, the observations of the Institute of Medicine with respect to process
optimization and waste reduction offered opportunities for healthcare organizations with
respect to cost containment.
World wide the cost of medical care is also increasing at an alarming and unsustainable rate.
Admittedly, a significant percentage of these cost increases can be attributed to aging
populations and technological advances. Those two causes are inevitable facts of the
technological and demographical developments of modern society. As such, they are largely
beyond our control. However, another significant source of healthcare cost increases can
broadly be characterized as unnecessary operational inefficiency. This we have more control
over. Inefficiency we can change. If we do, we can provide more affordable and better
healthcare for a large percentage of the population. Some operational inefficiencies are
associated with the direct medical service delivery process. Others are associated with the
administrative, logistical and operational side of the healthcare delivery system. Both areas
can benefit from systematic process innovation activities.
We would not be surprised if some object to the notion of industrialized healthcare delivery.
However, industrialization is essentially a conversion of artisan methods to more efficient,
cost effective, streamlined systems for the delivery of products or services (Levitt, 1976;
Heskett, Sasser, and Schlesinger, 1997). During the past century, industry deployed a large
arsenal of tools and innovation approaches to achieve high levels of operational efficiency.
Economic history indicates that efficiencies in industry were obtained primarily as the
cumulative effect of a large number of incremental improvements (Rosenberg, 1982 and
Bisgaard, 2006). Lean Thinking and Six Sigma are two process innovation approaches that
currently are popular in industry (Womack, Jones and Roos, 1990; Harry, 1997). Both
provide a systematic approach to facilitate incremental process innovations. Lean Thinking
emerged within the Japanese automobile industry after World War II (Ohno, 1988), but can
be traced back to the early days of the Ford Motor Company (Ford and Crowther, 1926).
Similarly, Six Sigma, originally introduced by Motorola, is the culmination and synthesis of
a series of century long developments in quality management (Snee, 2004) building on a
number of other approaches, in particular, Juran's Trilogy (Juran, 1989). Lean and Six
Sigma have gone through parallel developments in recent years. Originally applied to the
78
manufacturing environment, both approaches are now also used widely in administration and
service areas (George, 2003; Snee and Hoer!, 2004; De Mast, Does and De Koning, 2006).
The latest development is a synthesis of the two approaches (Hoerl, 2004; De Mast, Does
and De Koning, 2006). In this paper, we explore the integration of these two approaches in
the healthcare setting.
In the remainder of this paper, we first briefly outline the key principles of Lean Thinking
and Six Sigma. Next, we explore the concept of quality in healthcare. Based on these two
sections, we discuss how in healthcare we may organize quality management. We
demonstrate that Lean Six Sigma can solve the problems mentioned by the Institute of
Medicine by improving care processes, eliminating waste, reducing costs and enhancing
patient satisfaction. Finally, we draw some conclusions about the future possibilities of Lean
Six Sigma.
The integration of Lean Thinking and Six Sigma
Lean Six Sigma is a widely applied program for company wide quality improvement (see for
an introduction De Mast, Does and De Koning, 2006). It is the synthesis of Six Sigma and
Lean. Six Sigma was developed by Motorola in the 1980s, but gained momentum after its
adoption by General Electric in the mid 1990s (Harry, 1997). Lean is an outgrowth of the
Toyota Production System (Ohno, 1988).
We start with a description of Six Sigma. We first elucidate the organizational structure
prescribed by Six Sigma. The key principle is that projects are run by people with intimate
and detailed understanding of the process and problem at hand. That implies that mostly
projects are executed by people from the line organization (typically operations), and not by
staff personnel (let alone external consultants). The motivation is of course that line persons
are aware of the treacherous details that are part of the problem, its solution, and that pose
limitations on improvement directions. Moreover, since improvement actions ultimately are
handed over to the line (to the employees, operators and process engineers), it is important
that the solution is such that they can work with it, and that they accept it. Typically, a Six
Sigma project is run by a team consisting of:
• One or more Black Belts (BBs) and/or Green Belts (GBs), who are typically selected
from middle management. They are thoroughly trained in becoming effective project
79
leaders, and they work either full-time or at least a considerable part of their time on
the project.
• Several Yellow Belts (YBs): persons that the BB or GB calls in as advisors, typically
operators or employees who execute the process, but YBs could as well be technical
specialists, marketing specialists, or whoever the BB or GB thinks could bring in
relevant knowledge. On a limited number of occasions input from the YBs is
requested, and they may be called upon to collect data.
The difference between a BB and a GB is interpreted differently in various organizations,
and the precise role of a BB and a GB should be adapted to the situation in one's own
organization. In some companies, a BB refers to project leaders who work full-time on their
project, whereas GBs work two or three days per week on their project. BBs then run the
tougher projects. But a different approach is to have projects executed by a full-time BB
from a staff department, assisted by one or two part-time GBs from the line.
The above implies that improvement projects are not run from a central staff department
(such as quality assurance or troubleshooting). Rather, the idea is that GBs and BBs are
dispersed over the organization. The danger of such a decentralized approach to
improvement is that there is no integration of activities, and that efforts are wasted on issues
that are not of strategic importance. For this reason, projects are selected and monitored by
so-called Six Sigma champions. The champion is the project owner, in the sense that he is
responsible for the process that the project aims to improve. Preferably, the champion is also
the hierarchical superior of the BB or GB. Loosely said, the champion owns the problem,
and hires the BB and GBs to solve it. Given his position in the company, the champion
should be able to relate the project to the bigger picture of the company's strategy and other
initiatives. During its execution, a project is reviewed several times by the champion, thus
allowing him to adjust the direction that the BB or GB chooses. This control mechanism is
intended to assure that the project remains focused on issues of critical importance to the
company. The structure just described has firm roots in the scientific literature about theory
of the firm. Jensen (1998) discusses the merits of this organizational structure in dealing with
quality improvement (albeit in the case of Total Quality Management).
80
Part of theoretical grounding of Six Sigma may be found in De Mast and Bisgaard (2007).
They show that several elements in Six Sigma's methodology constitute its sound basis in
scientific methodology. Central to a scientific attitude towards process improvement is the
idea that to control a system we have to understand how it works. Without understanding of
the mechanics of a problem, we are likely just fighting symptoms and applying makeshift
solutions. To understand a system means: to have a theory that relates the system's behavior
to its causal factors. De Koning and De Mast (2007) draw the conclusion that "Six Sigma
does not offer standard cures, but a method for gaining understanding of the causal
mechanisms underlying a problem".
The next principle is that we have to define problems in a crystal clear, operational form
before attempts at finding a solution are made. Targets and objectives are often formulated in
abstract terminology: "to become a number one supplier", "to be best in class", "to become
an empowered organization". Although such objectives are useful in stating an intention and
providing a sense of direction, they are too vague to manage upon. Objectives should be
translated into a tangible and measurable form. An objective is operationally defined if its
formulation is so tangible, that one can determine precisely and unambiguously whether the
objective is met. In Six Sigma problems are translated into measurable quantities, called
critical to quality characteristics (CTQs). A commonly used tool to go from a project
definition to these specific and measurable CTQs is the CTQ £lowdown (De Koning and De
Mast, 2007). It aims to make explicit and structure the rationale underlying the project.
Furthermore, it shows how CTQs relate to higher level concepts such as performance
indicators and strategic focal points. Downward it shows how CTQs relate to measurements.
A third cornerstone of Six Sigma's methodology is the emphasis on quantification. Customer
satisfaction versus production costs, crime prevention versus privacy of citizens, pollution
and noise nuisance of airports versus economic interests: most interesting problems are
trade-off problems. The issue is not "either / or", but "how much of one, and how much of
the other?" If problems are not quantified, their trade-off nature is obscured, and people tend
to treat them as either/or-problems (and frequently politicize them in addition).
The fourth principle indicates that before attempts are made to solve the problem, a data
based diagnosis is needed. In Six Sigma this takes the form of a process capability study.
This shows the nature and size of the problem. The nature of the problem guides the
81
direction of the improvement actions, and the magnitude of the problem facilitates
prioritization. The importance of prioritization cannot be overemphasized. The saying has it
that "every ounce helps", but this proverbial wisdom does not work in business. With
unlimited time and resources one could bother about ounces, but in reality one must focus on
the strategically important issues. Or in Six Sigma's terminology: each minute spent on the
trivial many issues is a minute lost; it is the vital few issues that determine the success of a
project. Without data-based diagnosis improvement actions are likely to be wasted on many
trivialities, not on the few drivers of performance.
A final element of Six Sigma is its emphasis on data-based testing of ideas and improvement
actions to reality. In a world where no-one is likely to have sufficient knowledge to be
consistently right the first time, feedback is crucial. One should experimentally verify one's
ideas for two reasons. In the first place, to get rid of misconceptions, misjudgments and
myths. And secondly (and equally important), to fine-tune a coarsely developed idea to the
specifics and complications of the real life situation. Ideas that are not tested before they are
implemented are often either misconceived, or appear to be based on a wrong notion of
proportions and priorities, or fail because of the many ignored growing pains.
The principles outlined above were put in an operational form in the form of the DMAIC
roadmap. It employs five phases: Define (D), Measure (M), Analyze (A), Improve (I) and
Control (C). The roadmap guides BBs and GBs through their projects, helps them ask the
right questions, shows them when certain tools and techniques can be used, and forces them
to organize their findings in a structured manner. The five phases are briefly characterized as
follows:
1. Define: Select project and BB or GB.
2. Measure: Make the problem quantifiable and measurable.
3. Analyze: Analyze the current situation and make a diagnosis.
4. Improve: Develop and implement improvement actions.
5. Control: Adjust the quality control system and close the project.
In the Define phase, a charter is drafted which includes a cost-benefit analysis. If the cost
benefit analysis meets the company-established thresholds, the charter will be accepted and
the project will continue through the DMAIC process, i.e., the project becomes scheduled for
solution and assigned to a team headed by a Green or Black Belt and reporting to a
82
Champion. In the subsequent Measure phase, baseline data is assembled and the diagnosis is
started in earnest. The problem is translated into quantifiable terms via Critical-To-Quality
(CTQ) characteristics. The analysis phase continues the diagnosis and involves an
identification of possible causal relationships between inputs and the CTQs. Once the
diagnosis is completed, the team proceeds to the Improve phase and suggests a solution to
the problem. The Green or Black Belt designs and implements process changes or
adjustments to improve the performance of the CTQ. Finally, in the Control phase, control
systems are developed to assure that improvements are maintained and the new improved
process can be handed over to the day-to-day operations. Each of the five phases of DMAIC
involves detailed roadmaps that help to guide project leaders through the execution of an
improvement project. These phases are discussed in depth in De Mast, Does and De Koning
(2006). Each of the MAIC phases is broken down in three steps. For each step a list of end
terms is defined as well as a set of techniques that are typically used to achieve them. BBs
and GBs report the progress of their projects following these steps, which makes it easy for
program management to track progress.
Hence Six Sigma elevates problem-solving and quality improvement to a more professional
level by providing a method that follow scientific method and by training BBs and GBs in an
attitude that can be described as scientific. Improvement actions are not based on perception
and anecdotal evidence. But neither are they based on the notion of the omniscient specialist
who, sitting behind his desk, derives a remedy by making clever deductions from his expert
knowledge. The attitude that Six Sigma represents, is an adventurous and open-minded
eagerness to go out to the process under study and learn from it, and the willingness to
correct one's own misconceptions on the basis of experimental results and empirical
feedback. That is in a nutshell the tenor of Six Sigma's methodology.
Lean is not a method such as Six Sigma's DMAIC method. Lean offers only very limited
techniques for analysis and diagnosis. Instead, Lean should be seen as a collection of best
practices, which have mainly been copied from the Toyota Production System (Ohno, 1988).
The book by Womack, Jones and Roos (1990) introduced these best practices in the Western
world. The analysis part of Lean consists of the identification of waste in the process.
Following the steps of the process, one identifies redundant work, overcapacity, needless
complexity, inefficient routing, and so on. The results are visualized in a value stream map.
A value stream map is a process flowchart extended with information about speed,
83
continuity of the flow, work in process, et cetera. Moreover, it specifies which work adds
value and which does not. Upon identification of instances of waste, Lean applies standard
solutions such as visual management, SS, cellular production, pull systems, line balancing,
single-piece flow and rapid changeover (Womack and Jones. 2003).
Lean and Six Sigma are complementary. Lean can benefit from the management structures
that Six Sigma offers: Six Sigma's project-by-project approach, led by BBs and GBs from
all over the organization, is an effective organization form for getting Lean principles
applied. Further, Lean lacks a method for diagnosis, and has only limited methods for
analysis. It is rather one-sidedly focused on problems with process throughput, which it tries
to solve with a set of standard solutions. Lean does not analyze the economic performance
indicators of a process to establish where the main points of improvement are, but focuses on
inefficiencies in process flow, even if that is not where the main opportunities for
improvement are. Six Sigma's DMAIC method offers a thorough roadmap for analysis and
diagnosis, driven by powerful tools and techniques. Six Sigma is a general problem solving
framework, however. Given the ubiquity of process inefficiencies, Six Sigma projects
especially the ones pursuing efficiency improvement and speed - can benefit from the
standard solutions that Lean offers. The key to a successful integration of Lean and Six
Sigma is to regard Six Sigma's project management and its DMAIC roadmap as a general
framework for problem solving and process improvement. But within this framework,
Lean's standard solutions and mindset have found their place.
From now on we shall not make a difference between the programs Six Sigma and Lean Six
Sigma.
Concept of quality in healthcare
~Quality in healthcare can be traced back to Hippocrates (450-370 B.C.) who formulated the
oath for medical practice in ancient Greece (see for an overview Nabitz, 2006). With the
oath, the teacher-student relation was defined, specific medical procedures were included
and excluded and privacy and rights of patients were formulated. In the renaissance Vesalius
(1514-1564) and Paracelsus (1494-1541) represented a rational, analytical and observational
approach to medicine and also proclaimed an oath to guarantee the integrity of doctors.
During the 19th century the oath was modified with more emphasis on patient rights and
84
humanistic aspects and a code of conduct for the medical professional was added. After
World War Il, the World Medical Association formulated nine prescriptive rules of conduct
and in 1995 patient centeredness and standard of practice and care were introduced which
turned the oath into a professional quality manifest. Besides Hippocrates, the English nurse
Florence Nightingale (1820-1910) is seen by many experts as an important figure for the
roots of quality in the field of healthcare.
Apart from these issues of quality in healthcare, it is generally accepted that there is no
single or ultimate definition. Each industry or research branch has its own definition. Garvin
(1984) has identified five major approaches of defining quality in industry; and most existing
definitions of quality fall into one of these approaches:
• Transcendent approach of philosophy: Quality is innate excellence and cannot be
defined;
• Product-based approach of economics: Quality reflects the presence or absence of
measurable product attributes, and more quality (attributes) means more costs;
• User (client)-based approach of economics, marketing, and operations management:
Individual consumers have different wants or needs, and those goods that best satisfY
their preferences have the highest quality;
• Manufacturing-based approach: Quality as conformance to requirements, so that
improvements in quality (reductions in defects) lead to lower costs;
• Value-based approach of operations management: A quality product provides
performance at an acceptable price or conformance at an acceptable cost.
Garvin concluded that a company should not rely on a single definition of quality but rather
should cultivate all five quality approaches. Consideration of the five approaches to quality
in healthcare can illustrate the power of Lean Six Sigma. The transcendental approach,
unfortunately, is often used by healthcare professionals, but an inability to define or measure
quality will severely impede quality improvement initiatives. Lean Six Sigma stimulates
healthcare workers to define, measure, and improve aspects of quality. Our experiences with
Lean Six Sigma at several hospitals have shown that its focus on data and statistical
verification is an excellent counterbalance to the subjective and intuitive (transcendental)
approach.
85
In terms of the product-, user-, and manufacturing-based approaches in healthcare, we
observe a very interesting phenomenon. A patient is not only our client but also our product
(we replace parts), and is the most important element of our manufacturing (i.e., healthcare)
process-thereby representing three approaches to quality at the same time. Therefore, we
are obliged to manage all three quality approaches during the entire healthcare process. This
largely explains the complexity of our work and the vast challenges we face in quality
management in healthcare.
We once asked the Master Black Belt in a hospital, who had had five years' experience at a
large truck manufacturing company, the following question: "What would happen if the
future truck driver is on the truck you are assembling during the entire production process,
asking questions, making new requests, adding new wishes, and being annoyed by waiting
times and paint spilled on his trousers?" He admitted that the entire plant would become a
mess! This, however, represents daily practice in every hospital, and explains much about
the origins of a "quality chasm" in healthcare (cf. Institute of Medicine, 200 I).
Because the patient is part of the manufacturing process, improving the quality of the
healthcare process will manifest by e.g., shorter waiting times and length of stay, a reduced
number of examinations and a decrease in the number of defects, such as errors, unnecessary
interventions and complications. Hence improving quality will lead to lower costs and higher
quality of care. Furthermore, Lean Six Sigma links the demands of the patient to product
attributes. This prevents healthcare workers to deliver care patients do not expect to be
delivered and this also reduces costs. So especially in healthcare Lean Six Sigma seems to
work both ways; costs are eliminated and quality is improved.
The fact that the patient is part of the manufacturing process also provides an explanation for
the kinds of patient safety problems cited by the Institute of Medicine reports. In industry, a
high-quality product can be manufactured regardless or even because of the fact that a large
number of (imperfect) products are rejected. The customer only experiences the high-quality
product and is neither aware of nor affected by the undesired output of an imperfect
manufacturing process. Yet unlike industry, where a defective product can be rejected
without any problem, in healthcare an imperfect process that produces defects and rework
directly affects the patient's safety. Therefore, Lean Six Sigma can be used to improve
86
patient safety by reducing the number of defects (for example, medical errors, see Buck,
2001) produced by healthcare processes.
Finally, in terms of the fifth, value-based approach, it is evident that contrary to industry,
pricing mechanisms do not function well in healthcare. In general, patients just want
maximum quality and insurance companies, government, and other payers want to pay the
lowest price. In general, reimbursement systems do not generally explicitly reward
additional quality of care. As a result, the hospital is tom between these conflicting demands.
The only sensible policy for any hospital to pass both Scylla and Charybdis is to maximize
efficiency while at least preserving quality of care. Again, this means investing in healthcare
process improvement, which, we contend, will invariably lead to lower costs and higher
quality of care. Improvement of patient safety can be viewed as a valuable "side effect" of
Lean Six Sigma. In the Netherlands, policy makers have defined patient safety as an issue on
its own requiring separate management systems. Yet by taking the patient as the starting
point, Lean Six Sigma provides a balanced approach to quality and safety.
Quality management in healthcare
There are many activities in organizations relating to quality and efficiency, and they should
not all be organized in the same way. Juran (1989) proposed a generally accepted distinction
of activities related to quality into planning, control and improvement.
• Quality planning consists of the determination of what customers want and the
development of the products, services and processes which are required to comply
with these needs. This work is typically organized in specialized staff departments.
• Quality control consists of the on-line and real time monitoring of production or
service delivery, the detection of irregularities, and the reaction to these irregularities.
A typical control system encompasses elements such as a control plan (or quality
control handbook), control points and loops, and inspections. Quality control is
reactive in nature and deals particularly with what Juran (1989) calls sporadic
problems. Its organization should be integrated with the regular (production,
backoffice, service delivery, or other) process, and nowadays its execution is
typically the responsibility of the people who execute the process (Does, Roes and
Trip, 1999).
87
• Quality improvement, finally, is the organized and systematically pursued
improvement to increase quality and efficiency to unprecedented levels (Juran (1989)
calls this breakthroughs). Unlike quality control, quality improvement is not an on
line affair, but should be executed in the form of projects (what Juran (1989) calls the
project-by-project nature of quality improvement). Such improvement projects
typically tackle what Juran (1989) calls chronic problems. They (e.g., recurring
stagnations, constant levels of waste, poor service, scrap) should be eliminated once
and for all.
A major part of the problems in processes can be prevented, however, by taking possible
problems during manufacturing and operations into account during product and process
development. In order to apply the basic principles of Lean Six Sigma in product and process
development, an adaptation of the methodology has been developed. This adapted
methodology is called Design for Six Sigma (DfSS). DfSS is the methodology for quality
planning.
The distinction between control and improvement, sometimes described as on-line vs. off
line quality management, is important. Quality control's main intent is to defend the status
quo by reacting to problems ("fire fighting"). If, in the course of this operation, an
opportunity is encountered to improve the process then it is of course seized, but the reactive
and opportunistic approach of control is completely different from improvement, which
searches for improvement opportunities systematically. Examples of approaches for quality
improvement are Taguchi's off-line quality control, process optimization using design of
experiments, business process reengineering (BPR), and Lean Six Sigma's DMAIC
methodology. Regular Lean Six Sigma projects are mainly conducted in the operational part
of organizations (e.g., manufacturing, nursing, accounting and sales), where the routine tasks
are carried out. Stagnations and structural problems are tackled; improvements often are
found in the form of a control system or modifications in the standard way of working.
Occasionally a redesign ofpart of the process is needed.
Hence according to Juran (1989), quality management consists of three aspects; quality
planning, quality control and quality improvement. In healthcare a similar approach has been
88
suggested (Donabedian 1985). Next we discuss how the three aspects of quality management
may be implemented in a hospital.
Quality Planning in Healthcare
Quality planning is a structured process for developing (healthcare) products that ensure that
customer needs are met by the final results (Juran and Godfrey, 1999). Looking at the "bi
personality" client and the five approaches to define quality, a hospital has choices to
determine the level of quality it wants to deliver. First according to the value-based approach
a hospital has to contain its prices regardless the level of quality it intents to deliver. It is
nearly impossible for any insurance company to charge their clients higher insurance
contributions to pay higher prices to the hospital. This mechanism also affects the product
based approach. More quality (so more attributes) can only be delivered within the
limitations of the fixed prices paid to the hospital. So in most cases the more expensive and
higher quality hip prostheses will not be implanted, in favor of the medium priced, medium
quality prostheses. The same goes for high quality pace makers, costly endoscopic
procedures or expensive innovative medication. So product quality (attributes) in healthcare
has to be optimized, not maximized. Fortunately, the manufacturing-based approach offers
much more strategic opportunities. Here we can serve both masters at the same time. Since
the patient is participating in the healthcare process, reducing errors, waiting times, waste, et
cetera, directly increases the patients' quality perception. In addition, optimizing the
healthcare process not only increases quality; it reduces costs as well so we also can satisfy
the legitimate demands of healthcare insurers to contain the prices. The user-based approach
offers some interesting opportunities as well. Patients in most cases are not aware of the
exact level of healthcare product quality. There are, however, a number of features that
patients would like to find during their stay in a hospital and that can be added without
(many) additional costs. The Dutch proverb: "A smile goes for free", perhaps illustrates best
how a highly appreciated client friendly approach can be achieved with little effort. The
same goes for client friendly visiting hours, quality food, communication facilities and so on.
So by exploring the user-based approach a hospital can create a major competitive edge with
limited investments.
89
Quality Control in Healthcare
Quality control is the universal managerial process for conducting operations to provide
stability, to prevent adverse change and to maintain status quo (Juran and Godfrey, 1999).
The ISO 9000 series are standards that define requirements (9001) and guidelines (9004) for
quality management systems. ISO 9000 standards are successfully used and adopted
worldwide in industry and service organizations (Marquardt, 1999). The International
Organization for Standardization (Geneva, Switzerland) first issued the standards in 1987. In
1994 and in 2000 the ISO 9000 series were revised. The standards are generic, which means
that the same standards can be applied to any organization, large or small, whatever its
product or service, in any sector or activity whether it is a business enterprise, a public
administration or a government department. The ISO 9000 standards are founded on the
concept that the assurance of consistent product or service quality is best achieved by
simultaneous application of product standards and quality management system standards.
ISO takes a systems and process approach to improve organizational and financial
performance with a specific focus on quality management, process control and quality
assurance techniques to achieve planned outcomes and prevent unsatisfactory performance
or non-conformance. The standards represent an international consensus on good
management practices with the aim of ensuring that the organization can continuously
deliver the product or service that:
• Meets the customers' quality requirements;
• Meets applicable regulatory requirements;
• Enhances customer satisfaction;
• Achieves continuous improvement of its performance in pursuit of these objectives.
In healthcare, the application of the ISO standards is not yet very common and subject for
debate. The usefulness of ISO 9000 standards in healthcare was outlined earlier (Carson,
2004). World wide application ofISO in hospitals has been reported on a limited scale (Van
den Heuve1, Koning et al., 2005). The ISO 9000 guidelines for healthcare, called ISO IWA
1, can perhaps contribute to a better appreciation and use of ISO 9000 in healthcare (Reid,
2004).
The scope of ISO 9000 is much broader than quality control and quality assurance.
Representing consensus on good management practices it covers in fact all aspects of quality
90
management as mentioned above. Quality control and assurance, however, are perhaps the
most significant characteristics of an ISO quality management system. Quality planning is
covered equally well because ISO is almost synonymous with meeting customer
requirements. As we have mentioned above in the user based approach, meeting customer
requirements offers great competitive opportunities for any hospital. Although ISO
advocates and supports quality improvement as well, it does not offer a real methodology.
Hence, the need to implement an additional system exists. Six Sigma and ISO have proven
to be highly complementary in other organizations (Warnack, 2003).
Quality Improvement in Healthcare
As we have explained before, Lean Six Sigma is a company wide quality improvement
approach that aims at optimizing processes while reducing defects and costs. It is developed
and widely used in industry. Recently, the application of (Lean) Six Sigma has also been
suggested in healthcare (Barry, Murcko and Brubaker, 2002). A number of healthcare
systems have implemented (Lean) Six Sigma (Thomerson, 2001; Sehwail and De Yong,
2003; Van den Heuvel, Does and Bisgaard, 2005; Christianson et aI., 2005; De Koning,
Verver et aI., 2006). Especially, in healthcare (Lean) Six Sigma works both ways; costs are
eliminated and quality is improved (Kooy and Pexton, 2002).
A real life example: Implementation of ISO 9000 and Lean Six Sigma in a
hospital
The Red Cross Hospital (RCH) is a middle sized general hospital with 384 beds and about
1,000 employees located in Beverwijk in The Netherlands with an annual budget in 2004 of
90 million US Dollars. The RCH is located in a very competitive environment having five
other hospitals within a 20 kilometers range. The Dutch hospital funding system pays fixed
prices for admissions, first contacts and day care treatments. Recently, the government
initiated the gradual introduction of a new funding system based on so-called Diagnose
Treatment Combinations which is similar to the Diagnose Related Groups (DRG) system.
Both systems are applied simultaneously at this moment and show great resemblance with a
capitation system. The consequences of both systems are that treating more patients provides
more income, but delivering more care, higher quality or providing better service, does not.
Considering the competitive environment and the characteristics of the Dutch funding
system the RCH has chosen as main strategic goals a moderate growth and minimization of
91
costs, both to provide continuity. Furthermore, the RCH aims to optimize quality of care,
within the limitations of the fixed prices per episode, in order to attract more patients.
Capitation systems are thought to be successful in containing costs, but might be a threat to
healthcare quality (Berwick, 1996). Cost containment without effective quality assurance
systems can endanger quality (Bliersbach, 1988; Blumenthal, 1996). To be effective, (total)
quality management is considered an essential part in the strategic plan of any organization
(DeFeo, 1999). So given the characteristics of the Dutch funding system and the strategic
goals, implementing a well functioning quality management system was considered of vital
strategic importance to the RCH.
The implementation of the ISO quality management system started in January 1999.
Processes were described and analyzed by middle management. If possible quick wins were
implemented. Once the process was improved, it was described in a standardized manner
called a procedure. The next step was to make protocols that give a more detailed description
of a specific task or activity. Processes and activities were only described when this was
necessary to provide a sufficient level of quality assurance. The outcomes were put together
in a Quality Manual which contains descriptions of the organization, the divisions, the
quality system, the policies of the RCH and its current set of performance indicators. To
complete the quality management system the RCH implemented an internal audit system.
Approximately fifty co-workers were trained to audit procedures and protocols in various
departments. Processes are to perform the way they should and if not, corrective actions have
to be taken. The flow of opportunities to improve the system has to lead to actual
improvements. The internal and external audits have to either confirm that the system
functions properly or provide input to further improvements. At the end of 2000, one and a
half year after starting the implementation, KEMA, a Dutch certification institute, performed
the first external audit and the RCH received the ISO 9002: 1994 certificate for the entire
hospital organization. In the next years we adapted our quality management system to fit the
requirements of the revised ISO 9001:2000 standards. These efforts were successful too and
the RCH obtained an ISO 9001:2000 certificate in October 2003. Until this moment the
RCH is the only hospital in the Netherlands that obtained an ISO certificate for the entire
organization.
Initially, the quality improvement approach appeared to work reasonably well. A number of
projects were completed successfully. However, it was recognized that management control
92
of the projects was not effective. Frequently, the project goals were poorly aligned with the
hospitals strategic goals. There was no systematic way to determine the relevancy of a
project and its contribution to the long-term strategy. Furthermore, it was difficult to make
go/no go decisions for the projects. Most of the time projects were initiated because it was
"felt" that they would make a contribution to quality of care. RCH was also not able to
assess potential savings of alternative projects. Once a project was started, management did
not have reliable information about its status until it was finished. In summary, management
was navigating blindfold (Van den Heuvel, Does and Bisgaard, 2005 and Van den Heuvel,
Does and De Koning, 2006).
RCH then decided to implement Lean Six Sigma as the quality improvement method. The
Institute for Business and Industrial Statistics at the University of Amsterdam supported the
implementation of Lean Six Sigma in the RCH. It was started in 200 I with a one-day
introduction training for management and directors. In order to implement Lean Six Sigma
successfully, some apparent minor adaptations were necessary. The first group of fifteen
Green Belts started their training in September 2002. Seven projects were initiated. To
stimulate commitment, participants were allowed to choose the subject of their projects. In
February 2003 the second group of Green Belts started. The hospital directors incited
managers to train a sufficient number of Green Belts and maintain a substantial program of
new projects. Gradually, project selection was taken over by management to ensure
alignment with the strategic goals of the hospital. As the number of projects increased the
necessity for co-ordination and management of the Lean Six Sigma program became
evident. It was observed that Green Belts faced difficulties with closing their projects.
Therefore RCH appointed a Master Black Belt to set up a management control system to
evaluate progress and to support Green Belts in finishing their projects. The Master Black
Belt organized the necessary training programs and ascertained that once Green Belts
completed a project they initiated another project. In September 2004, the fifth group of
Green Belts began with their projects. Co-workers show more and more interest in following
the Green Belt training. RCH has consistently started new groups of approximately fifteen
employees every six months. Participants emerge from different departments and disciplines
within the organization. RCH has been able to initiate Lean Six Sigma projects in almost any
unit and related to every discipline in our hospital (Van den Heuvel, Does, Bogers and Berg,
2006). The introduction of Lean Six Sigma in the RCH has stimulated a culture of awareness
to find opportunities to improve healthcare delivery and also to take responsibility to
93
eliminate shortcomings. In the past, decisions were too often based on assumptions and
feelings as well as inaccurate and incomplete information. By using Lean Six Sigma, co
workers take responsibility and provide management with solutions based on facts and data.
At the end of 2004 RCH had 63 employees that were fully trained as Green Belt. At that
moment 44 projects were started and 21 projects were completed successfully. The total net
savings amount to lA million US Dollars. These amounts are cumulative savings on an
annual basis. At the beginning of 2004 the RCH anticipated serious financial problems.
Management embraced the Lean Six Sigma organization to initiate an additional number of
smaller "quick-win" projects (low hanging fruit) instead of discharging personnel. This
additional program resulted in extra savings up to 1.3 million US Dollars. The Annual
Report of 2004 consequently showed an, in our history, extraordinary net result of 2.7
million US Dollars (Van den Heuvel, Bogers et al., 2006).
Quality management using ISO and Lean Six Sigma enhanced the performance of the RCH
and helped RCH to achieve the strategic goals. We will show the results of a set of
performance indicators from 2000 through 2004. A complete account of the results is given
in Van den Heuvel, 2007.
20042003200220012000
105,000
100,000 i
.'!l 120,000c:co ,~ 115,000co~ 110,000"
!
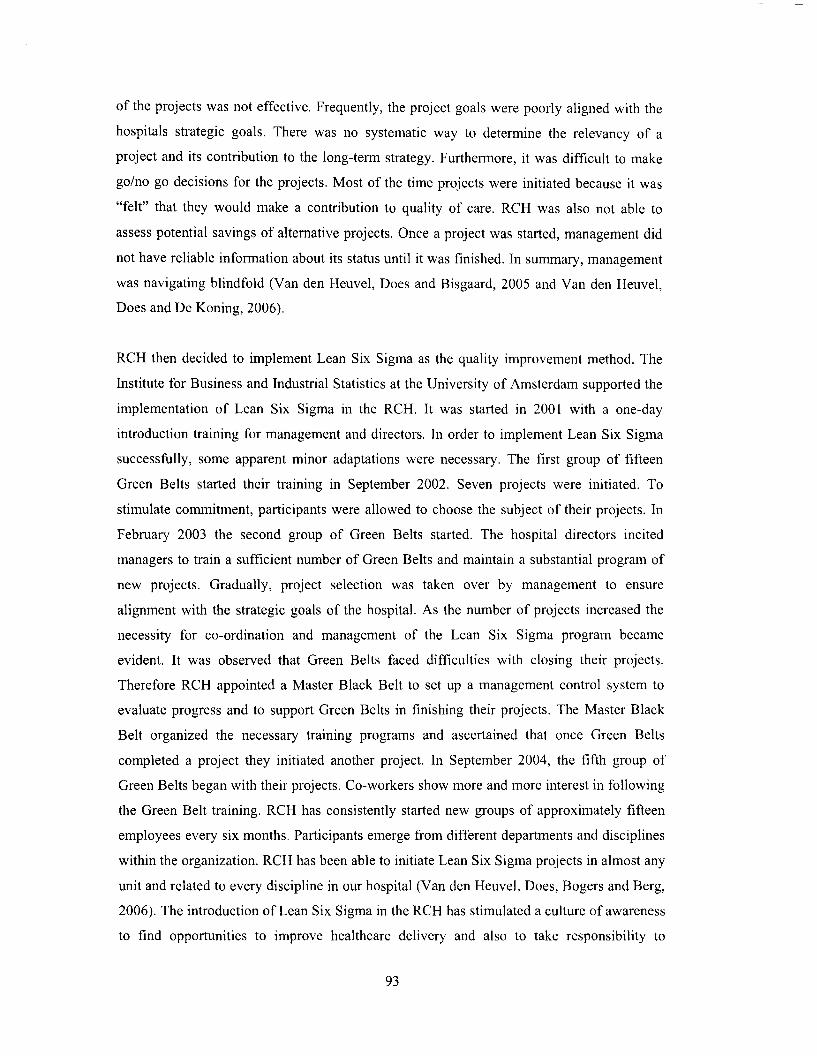
Graph 1: Growth of the catchment area Red Cross
130,000 l Hospital
125,000
E3 Adrrissions + Day care • Outdoor
Graph No 1 demonstrates the growth of the catchment area of the RCH, or in other words the
number of people that are inclined to go to the RCH. The catchment area is a calculated
parameter based on the number of admissions and outdoor contacts and gives an indication
94
of the size of the market share. The growth as seen in this graph demonstrates RCH has been
able to achieve one of its major strategic goals.
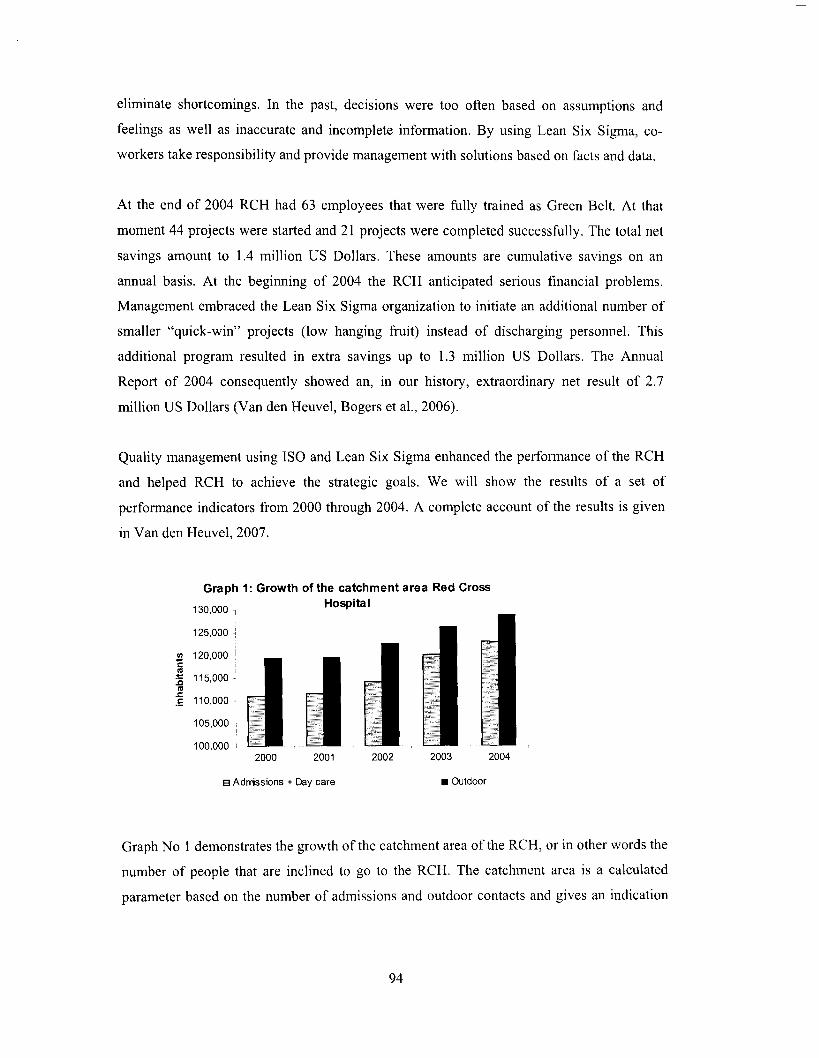
Graph 2: Number of admissions and day care28,000 treatments
VIt:o'iij.!!!E'0co
9.0
8.0
7.0
6.0
5.0
4.0
3.0
2.0
'0o.;:~t:.2VIVI
'E'0coQ)Cl
~co>co
2000 2001 2002 2003 2004
I I Adrrissions _Day care -.-Adrrission period
Graph No 2 demonstrates the number of admissions, day care treatments and the overall
length of stay. The growth in the last three years has been made possible by a substantial
reduction of the length of stay. This could be achieved by a number of Lean Six Sigma
projects and the implementation of Clinical Pathways (guidelines to cure and care patients).
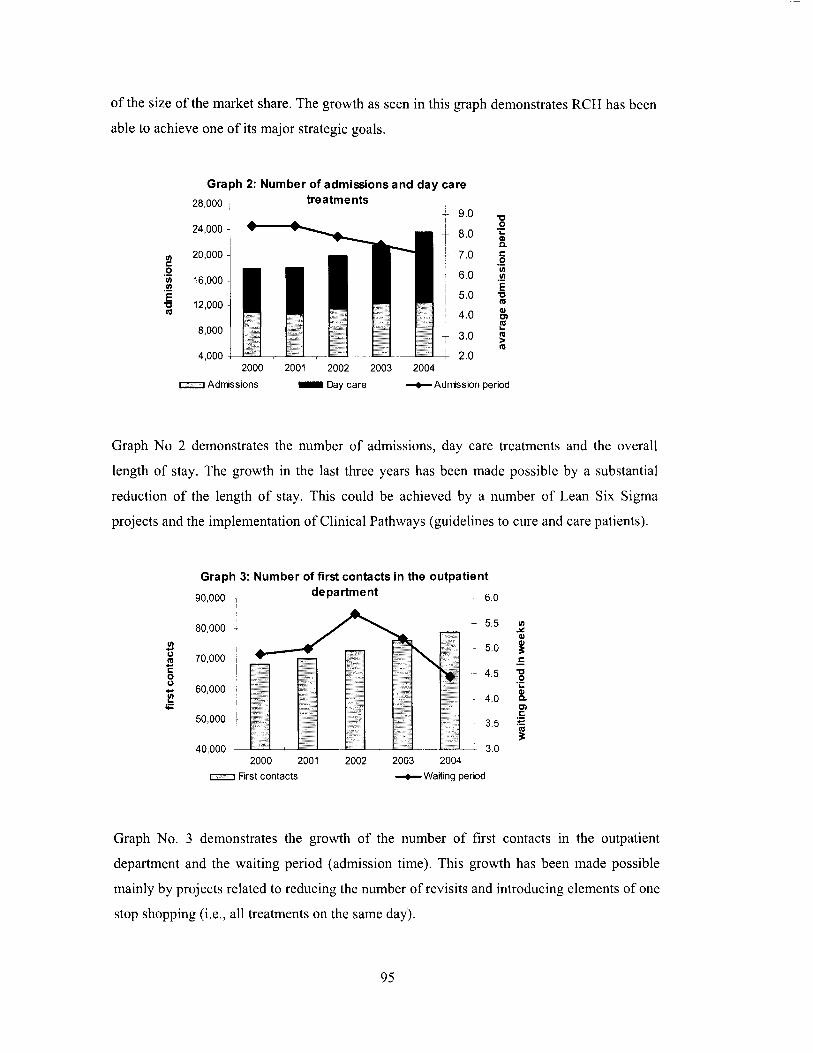
Graph 3: Number of first contacts in the outpatient
90,000 1 department 6.0
70,000
60,000
50,000
40,0002000 2001
c::::::::::::J First contacts
2002 2003 2004
-.-Waning period
Graph No. 3 demonstrates the growth of the number of first contacts in the outpatient
department and the waiting period (admission time). This growth has been made possible
mainly by projects related to reducing the number of revisits and introducing elements of one
stop shopping (i.e., all treatments on the same day).
95
1,500
+ 1,750
2002 2003 2004
-..- Patients on waiting list
2000 2001_ Elective operations
7,000
9,000 1
8,000 ~
10,000
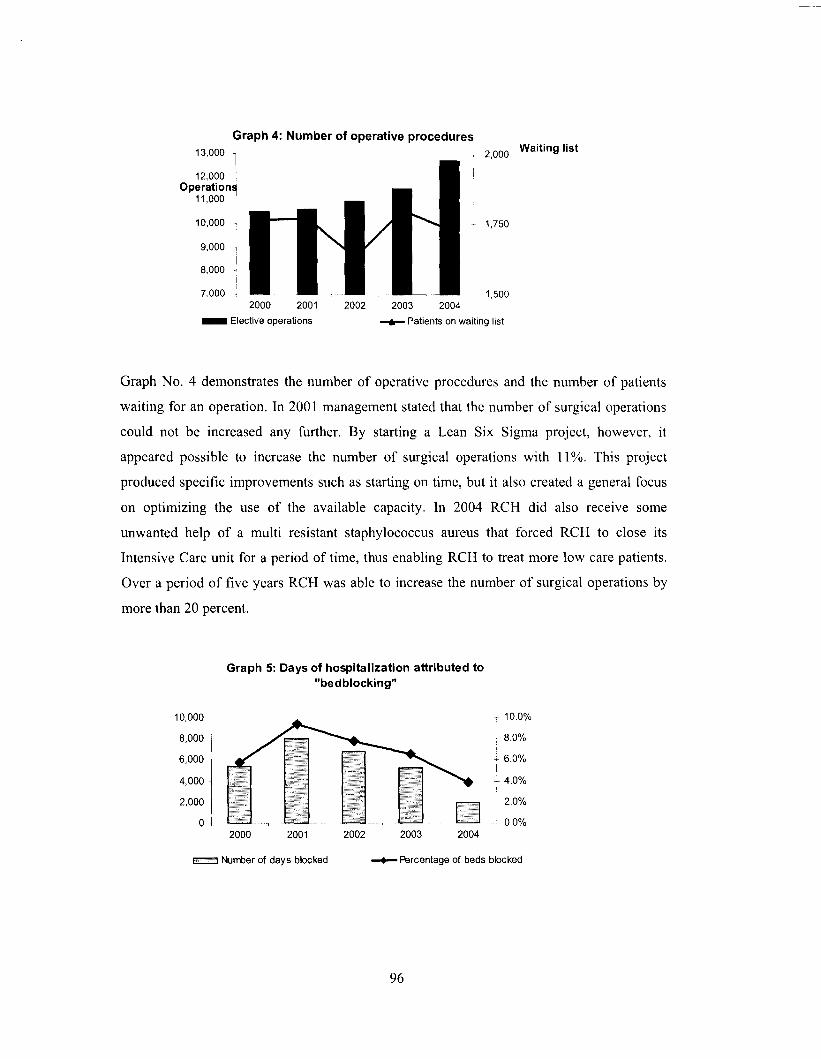
Graph 4: Number of operative procedures13,000 T 2,000 Waiting list
12,000 1 'Operation!!
11,000 i
Graph No, 4 demonstrates the number of operative procedures and the number of patients
waiting for an operation. In 2001 management stated that the number of surgical operations
could not be increased any further. By starting a Lean Six Sigma project, however, it
appeared possible to increase the number of surgical operations with 11 %. This project
produced specific improvements such as starting on time, but it also created a general focus
on optimizing the use of the available capacity, In 2004 RCH did also receive some
unwanted help of a multi resistant staphylococcus aureus that forced RCH to close its
Intensive Care unit for a period of time, thus enabling RCH to treat more low care patients.
Over a period of five years RCH was able to increase the number of surgical operations by
more than 20 percent.
Graph 5: Days of hospitalization attributed to"bedblocking"
10,000
8,000
6,000
4,000
2,000
o
T 10.0%
8.0%
~ 6.0%I
t 4.0%I
2.0%
0.0%2000 2001 2002 2003 2004
! j Nurrber of days blocked -+- R3rcentage of beds blocked
96
Graph No. 5 demonstrates the number of beds that were blocked by patients waiting for a
nursing home. Beds that are blocked seriously impede the available capacity and therefore
our output. RCH was aware that it had a problem in 2001 but RCH was not aware of the
magnitude or the financial impact. RCH then decided to add this parameter to the set of
performance indicators and monitor it. Together with the healthcare insurance company,
responsible for purchasing sufficient nursing home capacity, RCH could bring down the
number of patients waiting for a nursing home to acceptable levels.
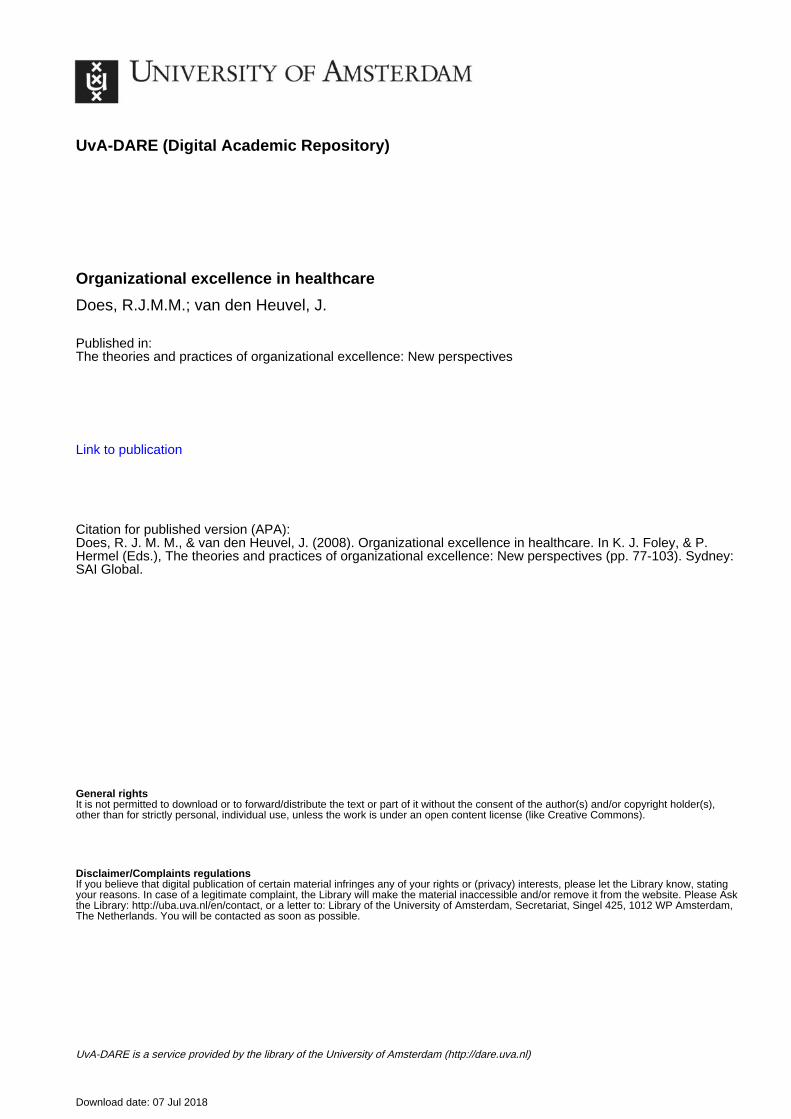
Graph 6: Efficiency of all the full-time employment350 (=fte) employees
325
300
275
2502000 2001 2002 2003 2004
-+- Patient unns per fte
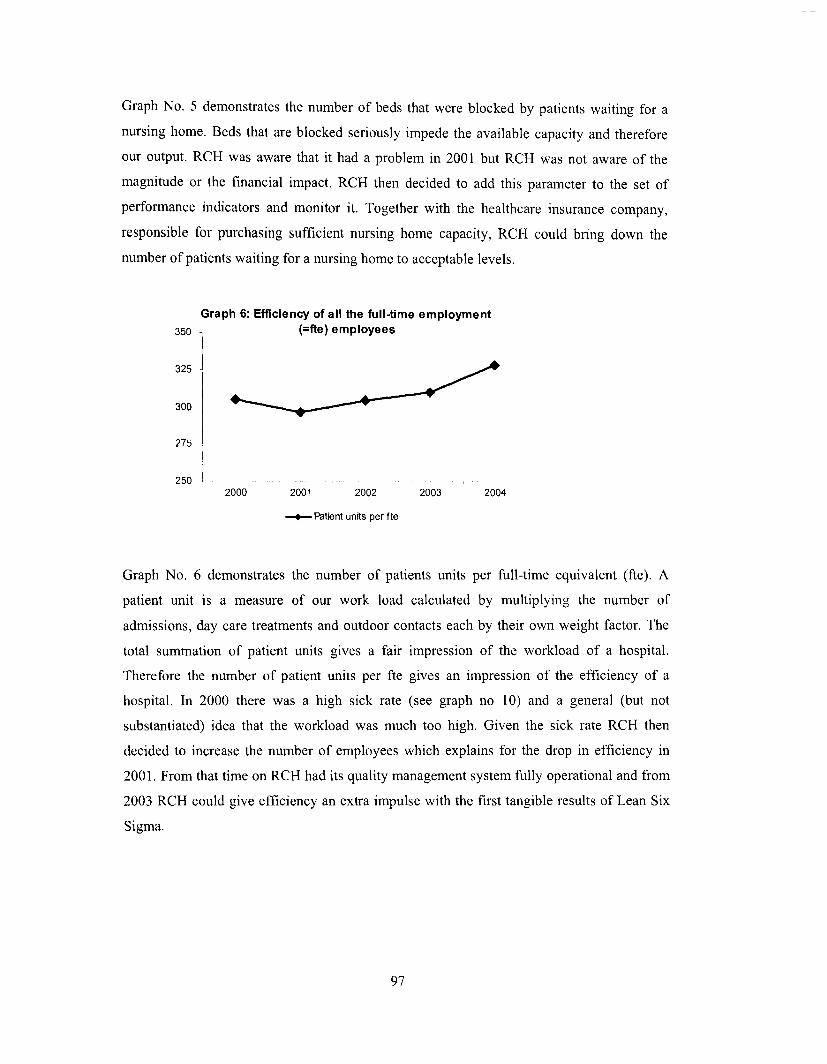
Graph No. 6 demonstrates the number of patients units per full-time equivalent (fte). A
patient unit is a measure of our work load calculated by multiplying the number of
admissions, day care treatments and outdoor contacts each by their own weight factor. The
total summation of patient units gives a fair impression of the workload of a hospital.
Therefore the number of patient units per fte gives an impression of the efficiency of a
hospital. In 2000 there was a high sick rate (see graph no 10) and a general (but not
substantiated) idea that the workload was much too high. Given the sick rate RCH then
decided to increase the number of employees which explains for the drop in efficiency in
2001. From that time on RCH had its quality management system fully operational and from
2003 RCH could give efficiency an extra impulse with the first tangible results of Lean Six
Sigma.
97
Graph 7: Efficiency of the full-time employment70 (=fte) nursing staff 350
65
60
55
300
250
200
150
50 - ----j - -f----
2000 2001 20021----
2003 2004100
-lIII- Adrrissions and day care treatments per fte -+- Adrrission days per fte
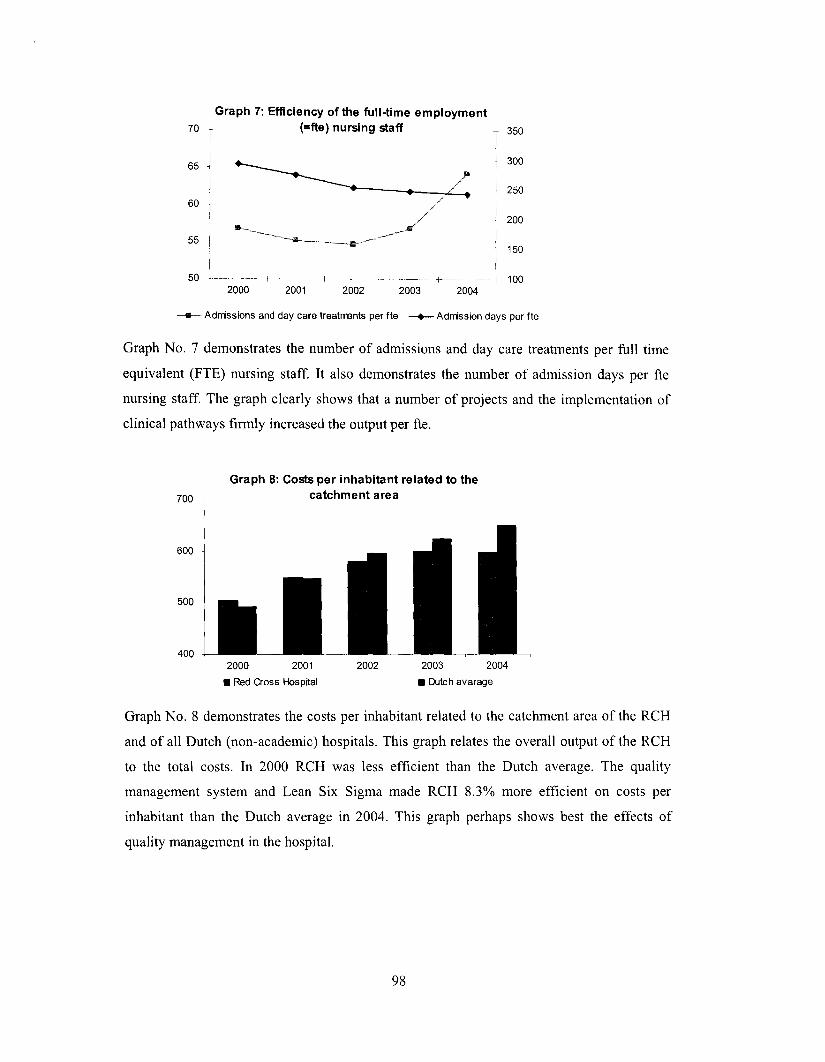
Graph No. 7 demonstrates the number of admissions and day care treatments per full time
equivalent (FTE) nursing staff. It also demonstrates the number of admission days per fte
nursing staff. The graph clearly shows that a number of projects and the implementation of
clinical pathways firmly increased the output per fte.
700
600
500
400
Graph 8: Costs per inhabitant related to thecatchment area
2000 2001
• Red Cross Hospital
2002 2003 2004
• Dutch avarage
Graph No. 8 demonstrates the costs per inhabitant related to the catchment area of the RCH
and of all Dutch (non-academic) hospitals. This graph relates the overall output of the RCH
to the total costs. In 2000 RCH was less efficient than the Dutch average. The quality
management system and Lean Six Sigma made RCH 8.3% more efficient on costs per
inhabitant than the Dutch average in 2004. This graph perhaps shows best the effects of
quality management in the hospital.
98
Graph 9: Income from continuing operations
3,000
2,500
l!! 2,000.!!!0 1,500cI/)
1,000:J000 500....
500-
1,000-
2000 • 2002 2004
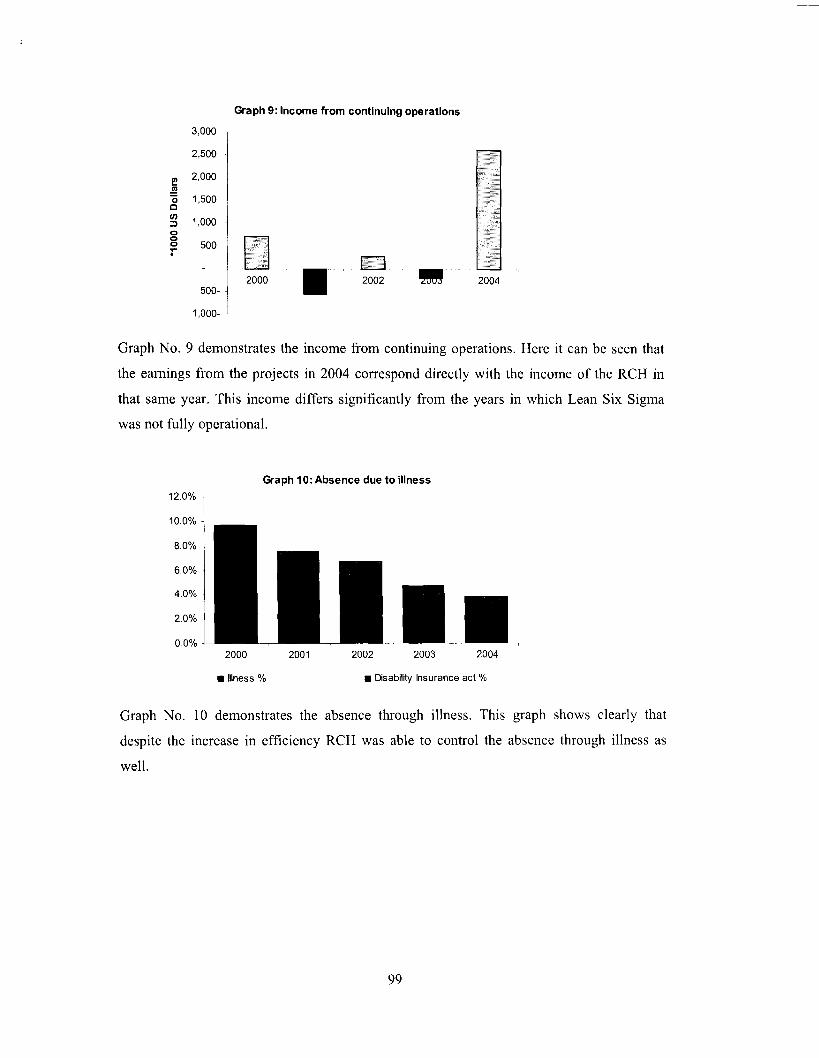
Graph No. 9 demonstrates the income from continuing operations. Here it can be seen that
the earnings from the projects in 2004 correspond directly with the income of the RCH in
that same year. This income differs significantly from the years in which Lean Six Sigma
was not fully operational.
Graph 10: Absence due to illness
12.0%
10.0%
8.0%
6.0%
4.0%
2.0%
0.0%2000 2001 2002 2003 2004
• Illness % • Disabilrty Insurance act %
Graph No. 10 demonstrates the absence through illness. This graph shows clearly that
despite the increase in efficiency RCH was able to control the absence through illness as
well.
99
Graph 11: Patient satisfaction in three categories
100
90
80
70
60
50
40
30
20
10
o2000 2001
• Nursing Care
2002 2003
Cl! rv1edical Care
2004
• Other
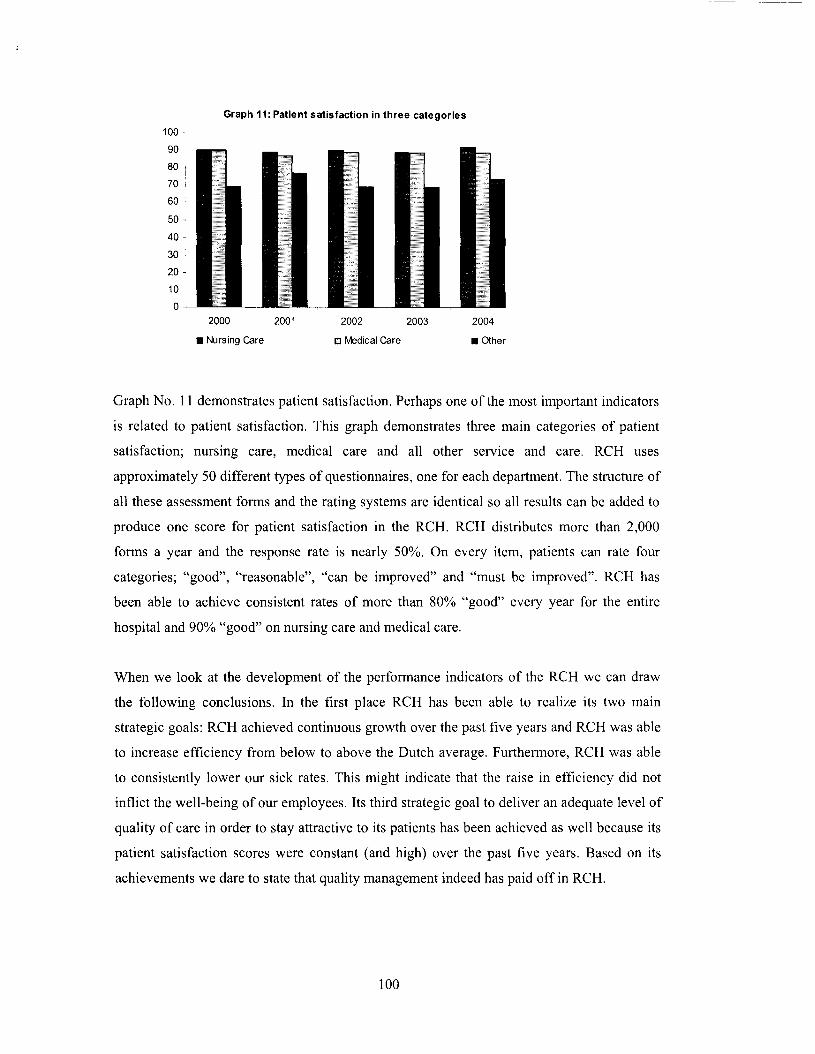
Graph No. 11 demonstrates patient satisfaction. Perhaps one of the most important indicators
is related to patient satisfaction. This graph demonstrates three main categories of patient
satisfaction; nursing care, medical care and all other service and care. RCH uses
approximately 50 different types of questionnaires, one for each department. The structure of
all these assessment forms and the rating systems are identical so all results can be added to
produce one score for patient satisfaction in the RCH. RCH distributes more than 2,000
forms a year and the response rate is nearly 50%. On every item, patients can rate four
categories; "good", "reasonable", "can be improved" and "must be improved". RCH has
been able to achieve consistent rates of more than 80% "good" every year for the entire
hospital and 90% "good" on nursing care and medical care.
When we look at the development of the performance indicators of the RCH we can draw
the following conclusions. In the first place RCH has been able to realize its two main
strategic goals: RCH achieved continuous growth over the past five years and RCH was able
to increase efficiency from below to above the Dutch average. Furthermore, RCH was able
to consistently lower our sick rates. This might indicate that the raise in efficiency did not
inflict the well-being of our employees. Its third strategic goal to deliver an adequate level of
quality of care in order to stay attractive to its patients has been achieved as well because its
patient satisfaction scores were constant (and high) over the past five years. Based on its
achievements we dare to state that quality management indeed has paid off in RCH.
100
Conclusions
Quality management according Juran consists of three aspects; quality planning, quality
control and quality improvement (Juran, 1989). In addition, measuring quality is considered
the core of quality management. In healthcare similar aspects of quality management have
been defined (Donabedian, 1987). An important way in which quality management is put
into practice is through the implementation of quality standards and a quality improvement
program. The most important quality standards are the International Quality Standards ISO
9000 series. Currently, the state of the art quality improvement program is called Lean Six
Sigma. In this paper we discuss both aspects and we show the results of the implementation
of ISO and Lean Six Sigma in a hospital over a period of five years. Both Lean Six Sigma
and ISO offer explicit structures and approaches so there is little room for debate among
employees about the relevancy and subsequent actions needed to achieve quality. Finally,
Lean Six Sigma and ISO are highly complementary. They both focus on: processes, client
whishes, continuous improvement, employee involvement, fact-based decisions and a
systems approach on management. So an ISO quality management system and Lean Six
Sigma are virtually zipped together thus integrating the full spectrum ranging from quality
control via quality assurance to quality improvement.
The necessity to improve healthcare organizations has been emphasized strongly by the
Institute of Medicine. The requirements to create a high quality healthcare organization have
been described much earlier (Berwick, 1989). In our opinion ISO combined with Lean Six
Sigma provide the instruments to achieve such organizations.
Acknowledgement
The authors thank the discussant and the participants of the MAAOE conference 2007 in
Versailles for their comments and suggestions.
101
References
Barry, R., Murcko, A.c., and Brubaker, c.B. (2002). The Six Sigma Book for Healthcare.Health Administration Press; Chicago.Berwick, D.M. (1989). "Continuous Improvement as an Ideal in Health Care". N Engl J Med320, pp. 53-56.Berwick, D.M. (1996). "Quality of Health Care". Part 5: Payment by Capitation and theQuality of Care. N Engl J Med 335, pp. 1227-1231.Bliersbach, C.M. (1988.) "Quality Assurance in Health Care: Current Challenges and FutureDirections". QRB October, pp. 315-319.B1umentha1 D. (1996). "Quality of Health Care". Part 4: The Origins of the Quality of CareDebate. N Engl J Med 355, pp. 1146-1148.Buck, C. (2001). "Application of Six Sigma to Reduce Medical Errors". Annual QualityCongress Proceedings 55, pp. 739-42.Carson, B.E. (2004). "ISO 9001:2000 a New Paradigm for Healthcare". ASQ, QualityPress. Mi1waukee.Christianson, J.B., Warrick, L.H., Howard, R., and Vollum, J. (2005). "Deploying Six Sigmain Health Care Systems as a Work in Progress". Joint Commission Journal on Quality andPatient Safety 31(11), pp 603-613.DeFeo, J.A. (1999). Strategic Deployment. In; Juran J.M Quality Handbook. McGraw-Hill,New York.De Koning, H., and De Mast, J. (2007). The CTQ F10wdown as a Conceptual Model of ProjectObjectives, Quality Management Journal 14(2), pp. 19-28..De Koning, H., Verver, J.P.S., Van den Heuve1, J., Bisgaard, S., and Does, RJ.M.M. (2006).Lean Six Sigma in Healthcare. Journal ofHealthcare Quality 28(2), pp. 4-11.De Mast, J. and Bisgaard, S. (2007). "The Science in Six Sigma". Quality Progress 40(1),pp. 25-29.De Mast, J., Does, RJ.M.M., and De Koning, H. (2006). Lean Six Sigma for Service andHealthcare. Beaumont Quality Publications, A1phen aan den Rijn, the Netherlands.Does, R.J.M.M., Roes, K.C.B., and Trip, A. (1999). Statistical Process Control in Industry.K1uwer, Deventer, the Netherlands.Donabedian, A. (1987). Five Essential Questions Frame the Management of Quality inHealth Care. HMQ. First Quarter.Ford, H. and Crowther, S. (1926). Today and Tomorrow. Productivity Press, Cambridge,Massachusetts.Garvin, D.A. (1984). "What Does Product Quality Really Mean"? Sloan ManagementReview 26(1), pp. 25-43.George, M. L. (2003). Lean Six Sigma for Services. McGraw-Hill, New York.Harry, MJ. (1997). The Vision ofSix Sigma, 5th ed.. Tri Star, Phoenix, AZ.Heskett, J. L., Sasser, W. E. Jr., and Sch1esinger, L. A. (1997). The Service Profit Chain.Free Press, New York.Hoerl, R.W. (2004). "One Perspective on the Future of Six Sigma". International Journal ofSix Sigma and Competitive Advantage 1(1), pp. 112-119.Institute of Medicine (2000). To Err is Human: Building a Safer Health System. NationalAcademy Press. Washington.Institute of Medicine (2001). Crossing the Quality Chasm; a New Health System for the 21stCentury. National Academy Press. Washington.Jensen, M.C. 1998. Foundations of Organizational Strategy. Harvard University Press,Cambridge, MA.Juran, J. M. (1989). Juran on Leadership for Quality. Free Press, New York.
102
Juran, lM. and Godfrey, B.A. (1999). Quality Handbook. Fifth edition. McGraw-Hill, NewYork.Kelemen, M.L. (2003). Managing Quality. Managerial and Critical Perspectives. SagePublications Ltd. London.Kooy, M. and Pexton, C. (2002). "Using Six Sigma to Improve Clinical Quality andOutcomes". Clinical Quality. August issue, pp. 13-16.Levitt, T. (1976). The Industrialization of Service. Harvard Business Review, SeptemberOctober, pp. 63-74.Marquardt, D.W. (1999). The ISO 9000 Family of International Standards. In; Juran J.MQuality Handbook. McGraw-Hill, New York.Nabitz, U. (2006). Quality Management in Health Care. PhD Thesis University ofAmsterdam, Amsterdam.Ohno, T. (1988). Toyota Production System. Productivity Press, New York.Redman, T. and Grieves, l (1999). "Managing Strategic Change Through TQM: Learningfrom Failure". New Technology, Work and Employment, 14(1), pp. 45-61.Reid, R.D. (2004). "Healthcare Agreement Revision Nears Release". Quality Progress.November.Rosenberg, N. (1982). Inside the Black Box: Technology and Economics. CambridgeUniversity Press, New York.Sehwail, L. and DeYong, C. (2003). "Six Sigma in Health Care". International Journal ofHealth Care Quality Assurance, incorporating Leadership in Health Services 16, pp. i-v.Snee, R.D. (2004). "Six Sigma: the Evolution of 100 Years of Business ImprovementMethodology". International Journal of Six Sigma and Competitive Advantage, 1(1), pp. 420.Snee, R.D., and Hoerl, R.W. (2004). Six Sigma Beyond the Factory Floor. PearsonEducation, Upper Saddle River, New Jersey.Thomerson L.D. (2001). "Journey for Excellence: Kentucky's Commonwealth HealthCorporation adopts Six Sigma approach". Annual Quality Congress Proceedings, 55, pp.152-158.Van den Heuvel, l (2007). The Effectiveness ofISO 9001 and Six Sigma in Healthcare. PhDThesis University of Amsterdam, Amsterdam.Van den Heuvel, l, Bogers, AJJ.C., Does, RJ.M.M., Van Dijk, S.S., and Berg, M. (2006)."Quality Management: Does it payoff'? Quality Management in Health Care 15(3), pp. 137149.Van den Heuvel, l, Does, R.lM.M., and Bisgaard, S. (2005). "Dutch Hospital ImplementsSix Sigma". Six Sigma Forum Magazine 4(2), pp. 11-14.Van den Heuve1, J., Does, RJ.M.M., Bogers, AJJ.C., and Berg, M. (2006). "ImplementingSix Sigma in the Netherlands". Joint Commission Journal on Quality and Patient Safety 32(7),pp. 393-399.Van den Heuvel, l, Does RJ.M.M., and De Koning, H. (2006). "Lean Six Sigma in aHospital". International Journal ofSix Sigma and Competitive Advantage 2(4), pp. 377-388.Van den Heuvel, l, Koning, L., Bogers, AJJ.C., Berg, M.A., Van Deijen, M.E.M. (2005)."An ISO Quality Management System in a Hospital: Bureaucracy or just Benefits"?International Journal ofHealth Care Quality Assurance. 18(5), pp. 361-369.Warnack, M. (2003). "Continual Improvement Programs and ISO 9001:2000". QualityProgress, March issue, pp. 42-49.Womack, lP., Jones, D.T., and Roos, D. (1990). The Machine that Changed the World: TheStory ofLean Production. Rawson Associates, New York.Womack, lP. and Jones, D.T. (2003). Lean Thinking, 2nd edition. Free Press, New York.
103
Recommended