Prof. Dr. Ing. Klaus Fricke
Technische Universität Braunschweig (GER)
México, D.F. 7 de octubre del 2015
Waste Management in Germany and Global Trends
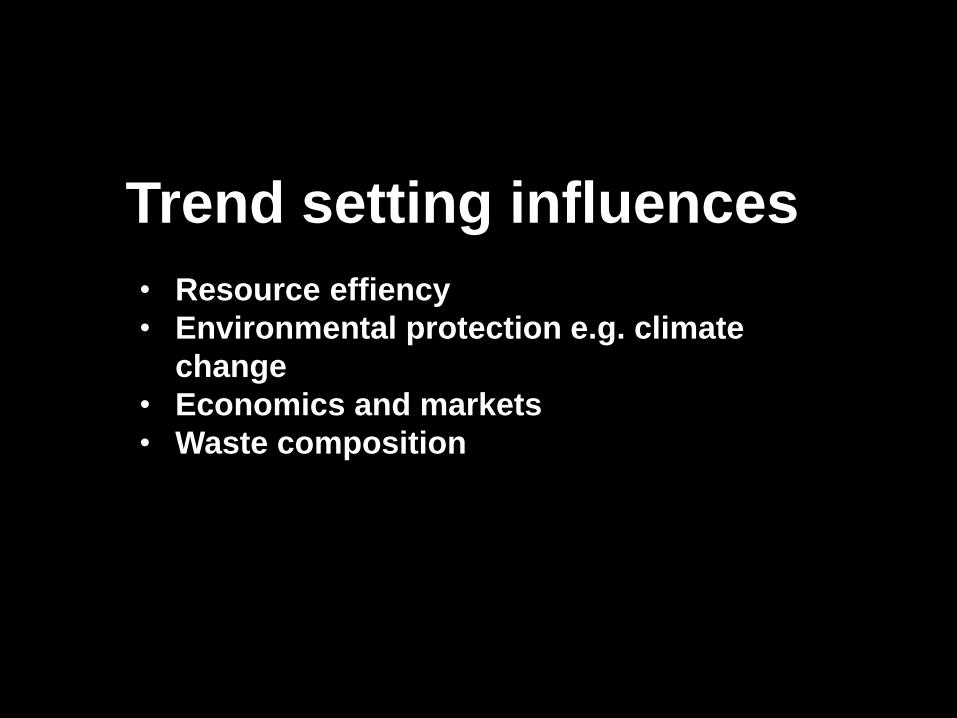
Trend setting influences
• Resource effiency
• Environmental protection e.g. climate
change
• Economics and markets
• Waste composition
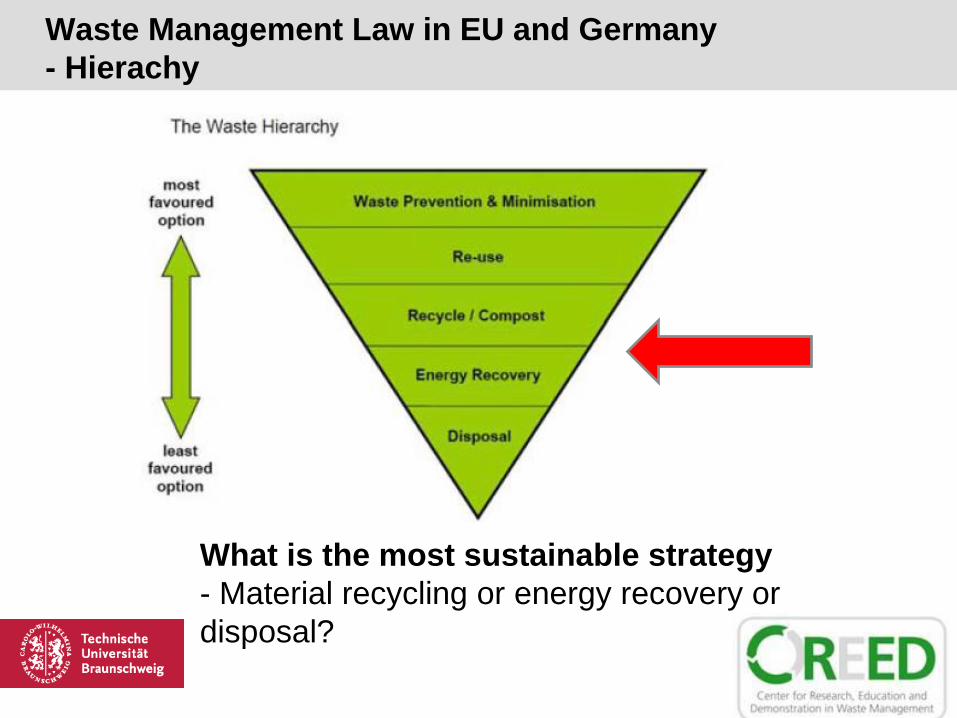
Waste Management Law in EU and Germany
- Hierachy
What is the most sustainable strategy
- Material recycling or energy recovery or
disposal?
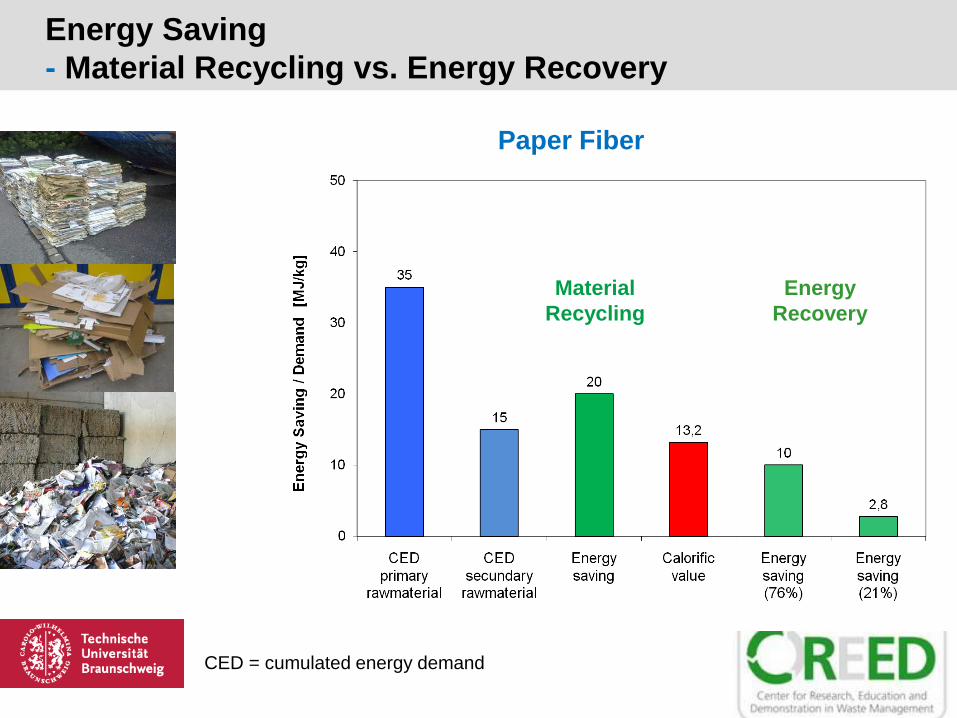
Energy Saving
- Material Recycling vs. Energy Recovery
CED = cumulated energy demand
Material
Recycling
Energy
Recovery
Paper Fiber
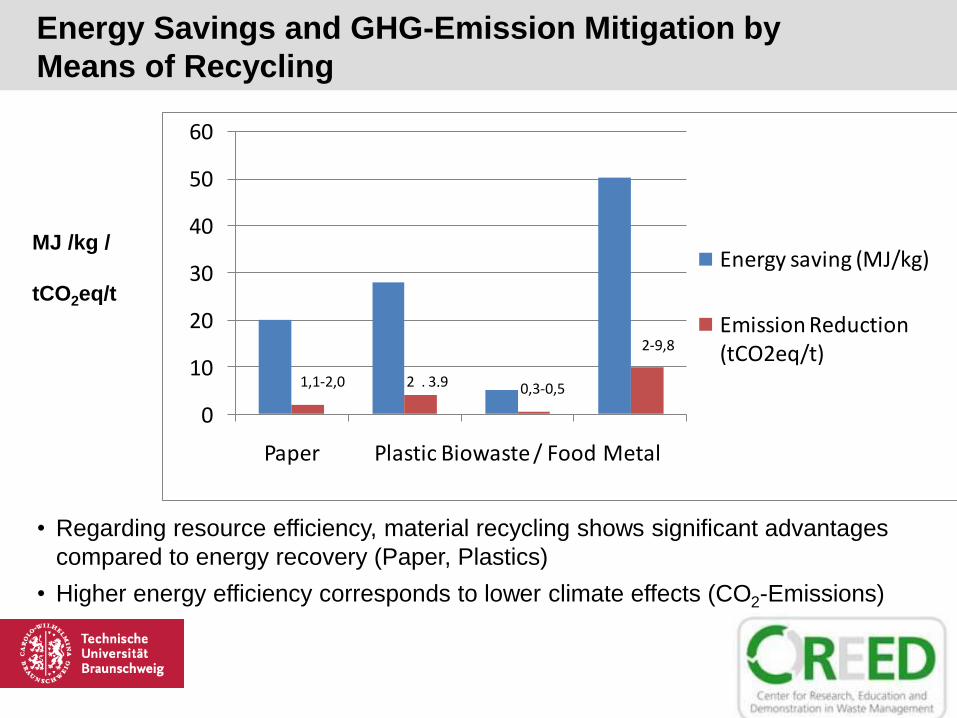
Energy Savings and GHG-Emission Mitigation by
Means of Recycling
0
10
20
30
40
50
60
Paper Plastic Biowaste / Food Metal
Energy saving (MJ/kg)
Emission Reduction (tCO2eq/t)
1,1-2,0 2 . 3,9 0,3-0,5
2-9,8
MJ /kg /
tCO2eq/t
• Regarding resource efficiency, material recycling shows significant advantages
compared to energy recovery (Paper, Plastics)
• Higher energy efficiency corresponds to lower climate effects (CO2-Emissions)
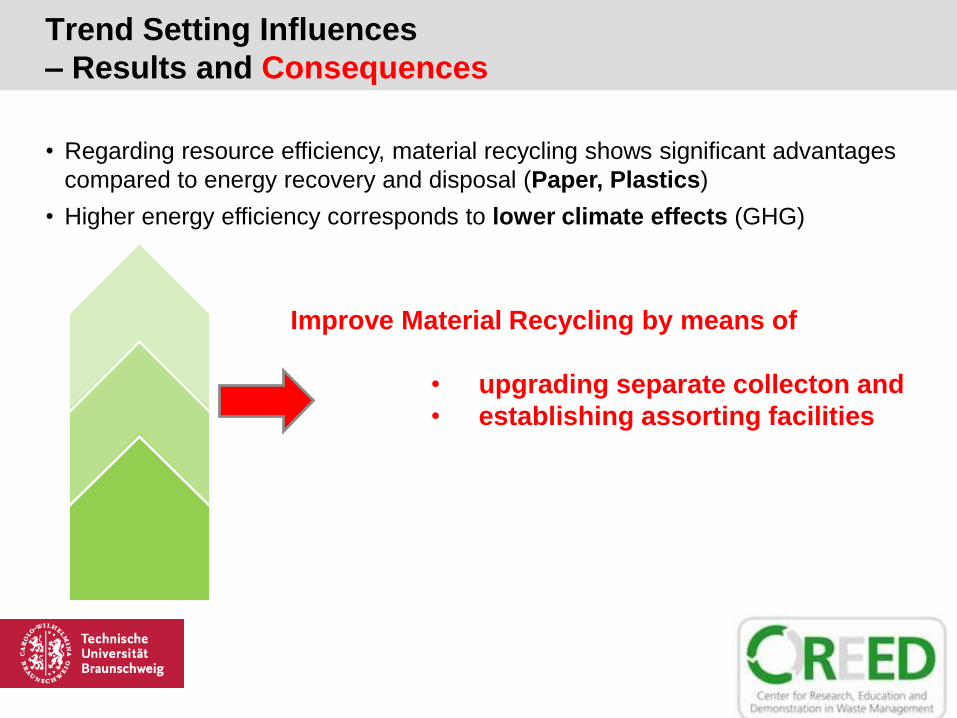
Trend Setting Influences
– Results and Consequences
Improve Material Recycling by means of
• upgrading separate collecton and
• establishing assorting facilities
• Regarding resource efficiency, material recycling shows significant advantages
compared to energy recovery and disposal (Paper, Plastics)
• Higher energy efficiency corresponds to lower climate effects (GHG)
Trend setting influences
• Environmental protection
climate change
- marine litter
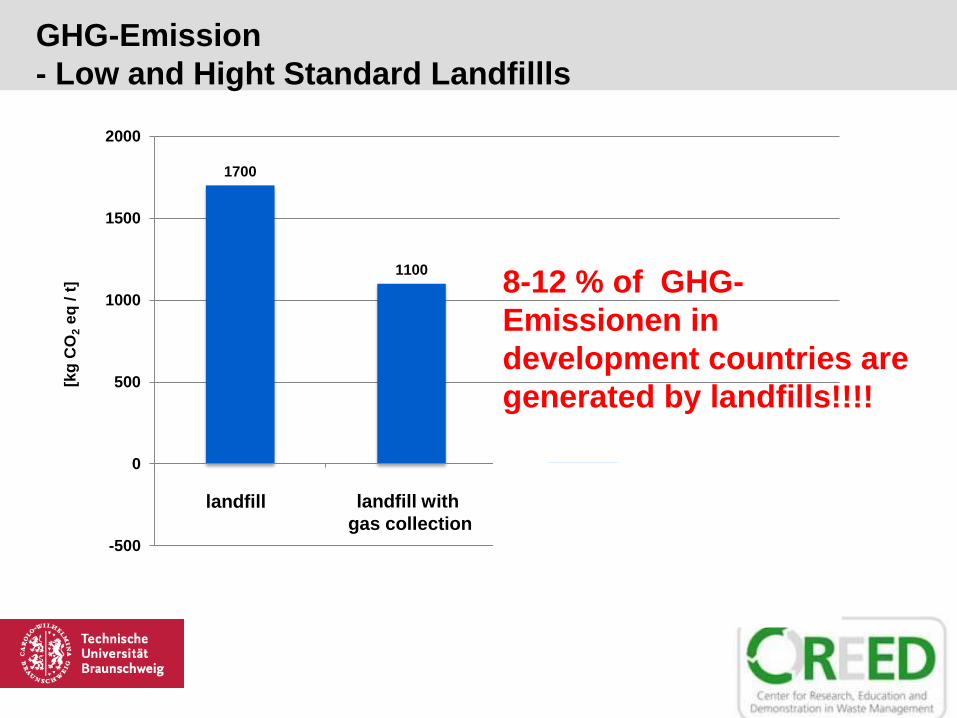
GHG-Emission
- Low and Hight Standard Landfillls[k
g C
O2
eq
/ t
]
1700
1100
100
-420
-500
0
500
1000
1500
2000
landfill landfill with
gas collection
after pre-treatment
(MBT)
material recycling
and
energy recovery
8-12 % of GHG-
Emissionen in
development countries are
generated by landfills!!!!
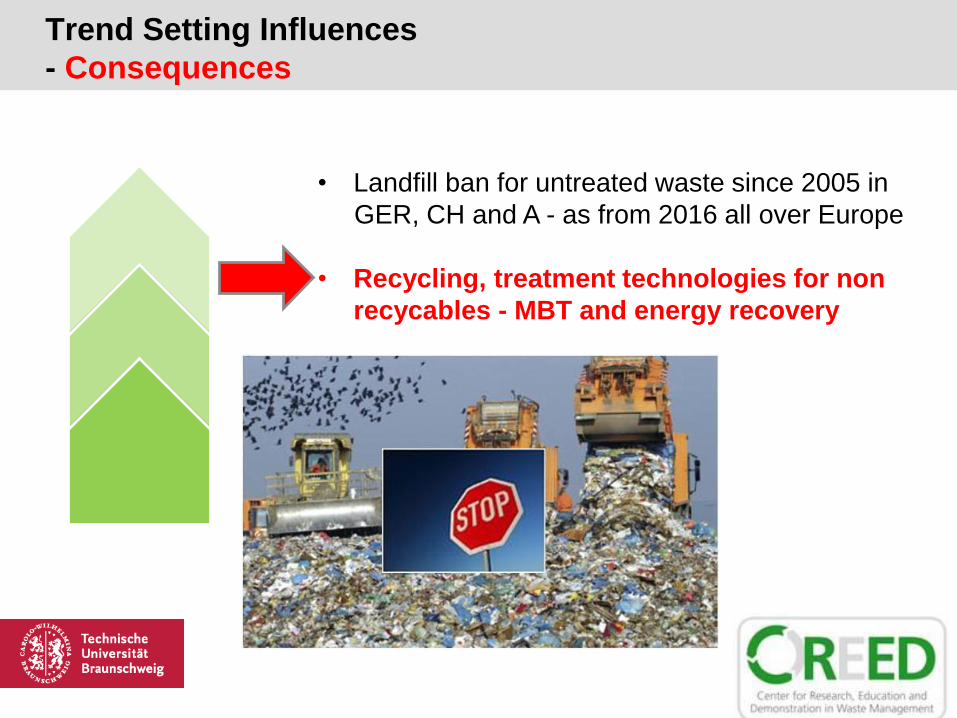
Trend Setting Influences
- Consequences
• Landfill ban for untreated waste since 2005 in
GER, CH and A - as from 2016 all over Europe
• Recycling, treatment technologies for non
recycables - MBT and energy recovery
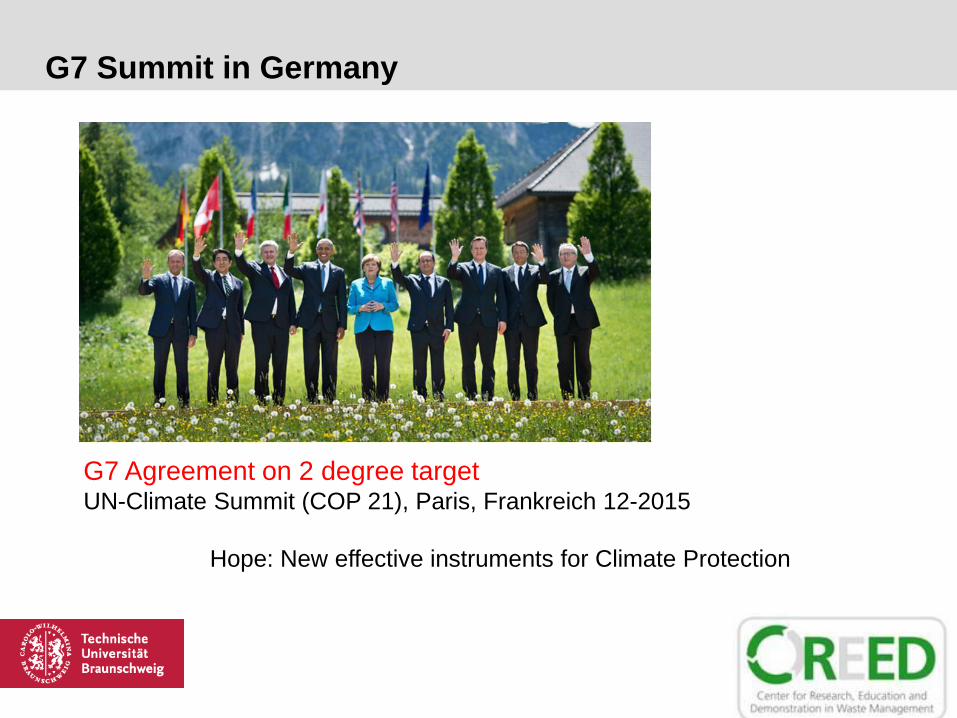
G7 Summit in Germany
G7 Agreement on 2 degree targetUN-Climate Summit (COP 21), Paris, Frankreich 12-2015
Hope: New effective instruments for Climate Protection
Marine Litter
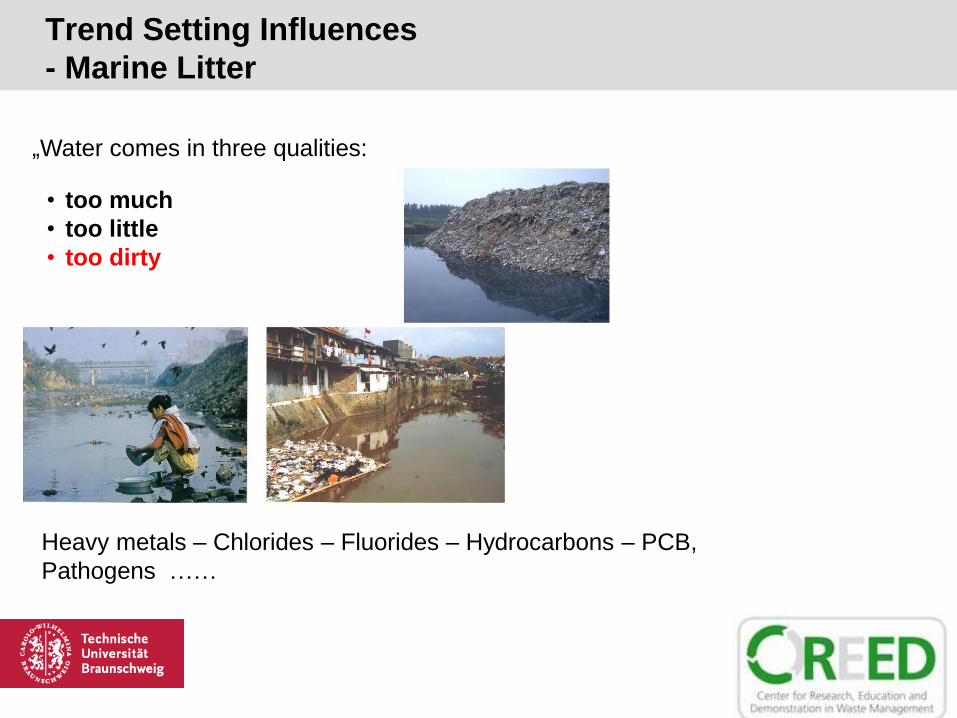
„Water comes in three qualities:
Heavy metals – Chlorides – Fluorides – Hydrocarbons – PCB,
Pathogens ……
Trend Setting Influences
- Marine Litter
• too much
• too little
• too dirty
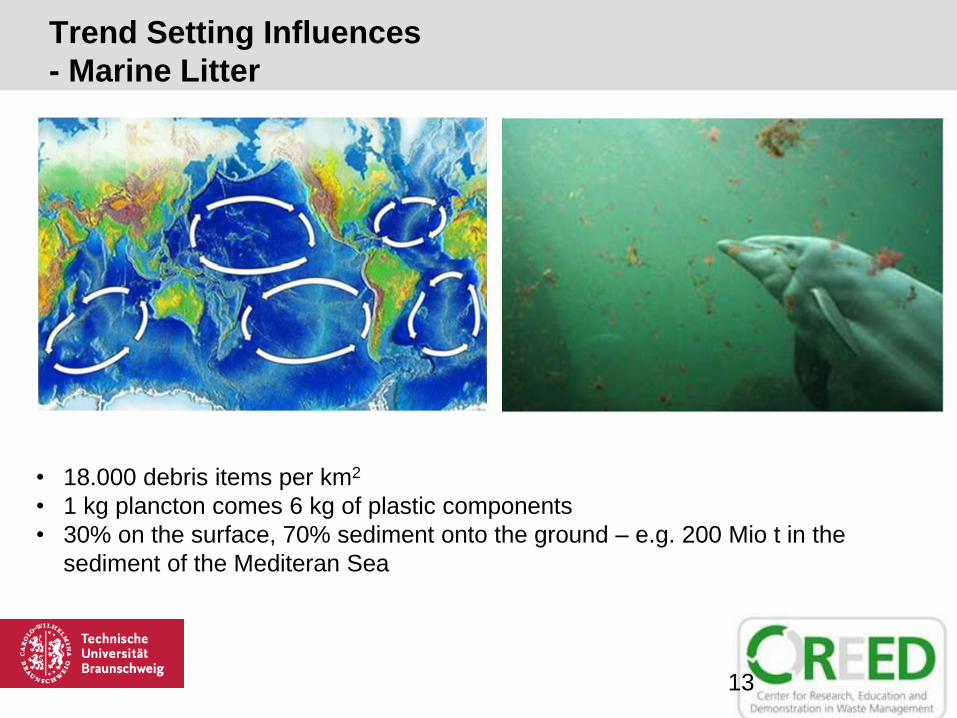
Trend Setting Influences
- Marine Litter
13
• 18.000 debris items per km2
• 1 kg plancton comes 6 kg of plastic components
• 30% on the surface, 70% sediment onto the ground – e.g. 200 Mio t in the
sediment of the Mediteran Sea
Trend setting influences
• Economics and markets
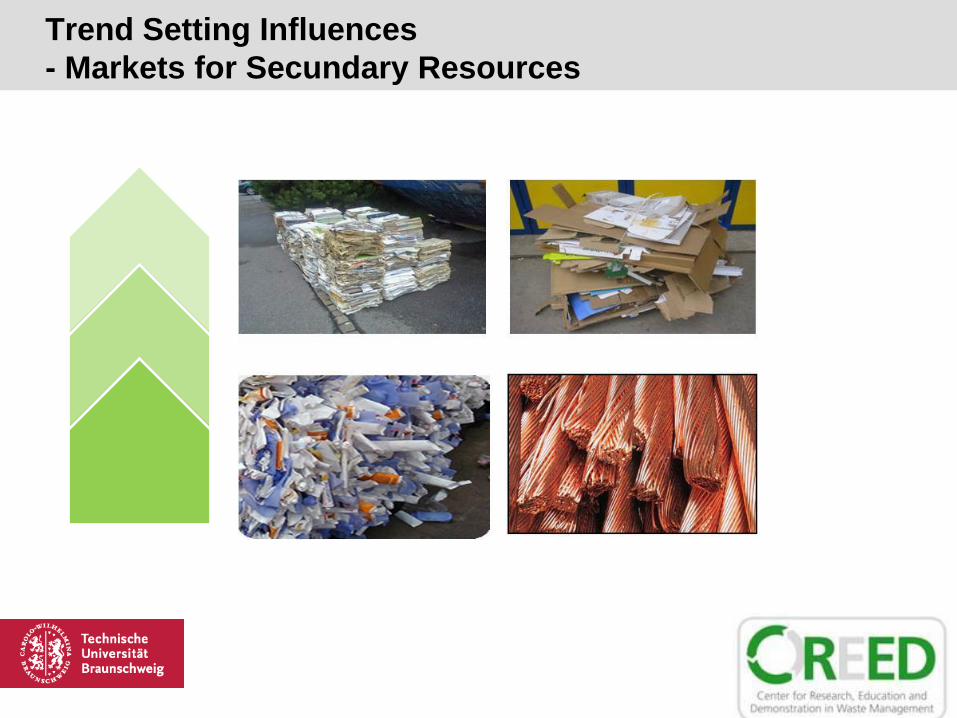
Trend Setting Influences
- Markets for Secundary Resources
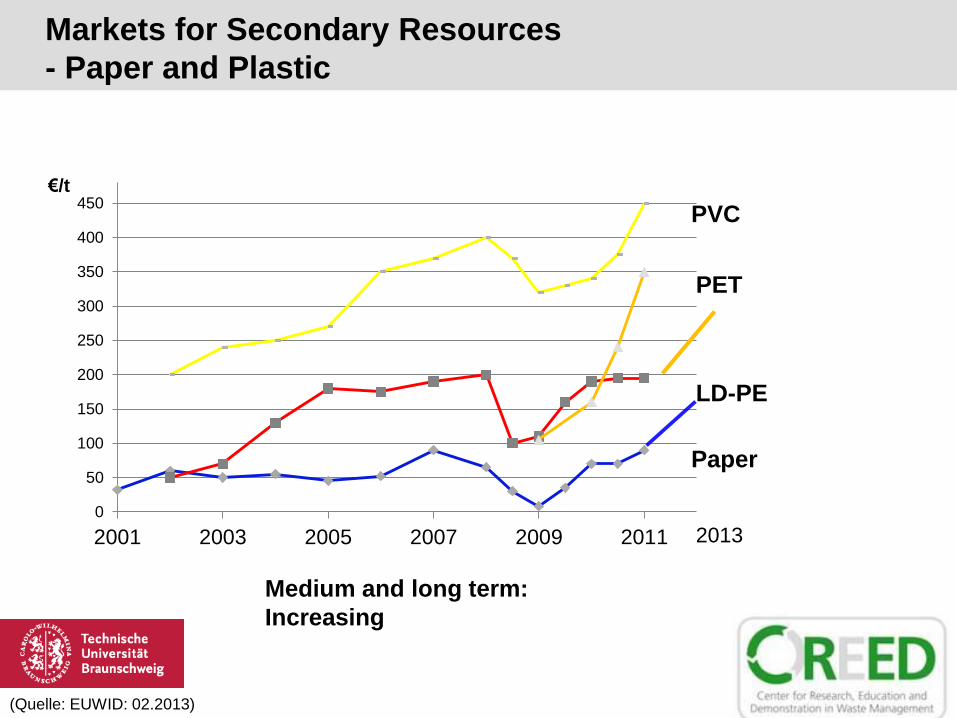
Markets for Secondary Resources
- Paper and Plastic
(Quelle: EUWID: 02.2013)
Paper
PVC
PET
LD-PE
0
50
100
150
200
250
300
350
400
450
2001 2003 2005 2007 2009 2011
€/t
2013
Medium and long term:
Increasing
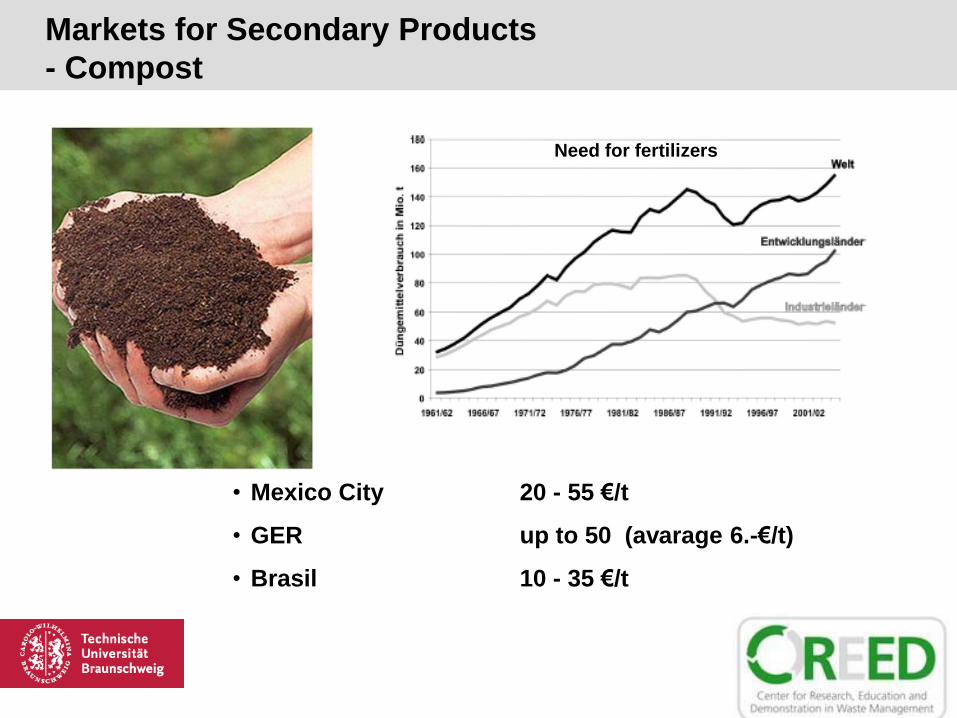
Markets for Secondary Products
- Compost
Need for fertilizers
• Mexico City 20 - 55 €/t
• GER up to 50 (avarage 6.-€/t)
• Brasil 10 - 35 €/t
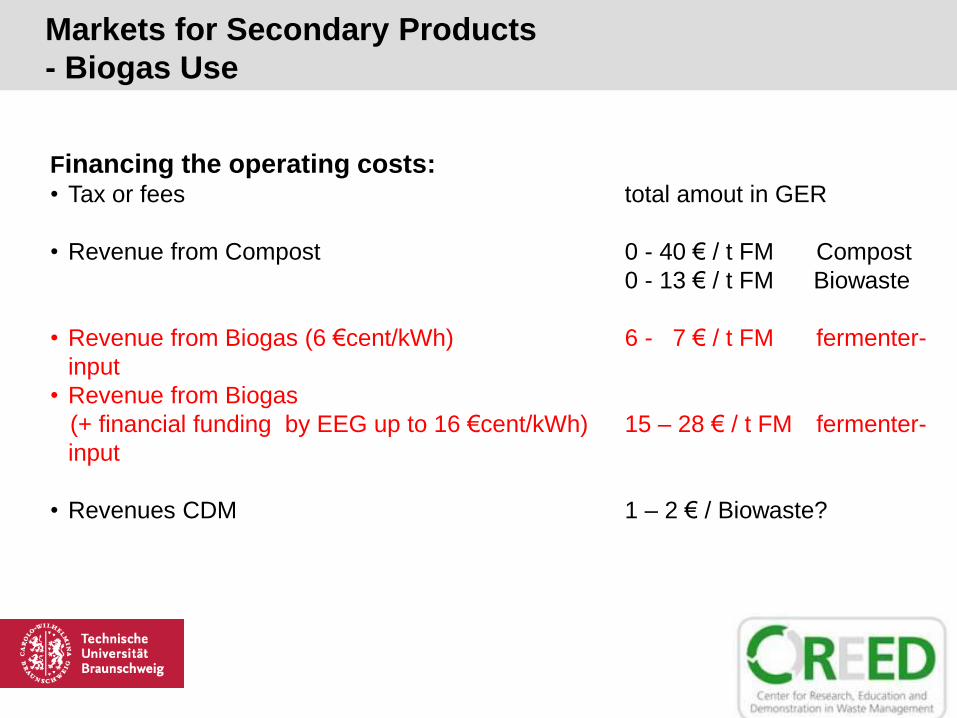
Financing the operating costs:• Tax or fees total amout in GER
• Revenue from Compost 0 - 40 € / t FM Compost
0 - 13 € / t FM Biowaste
• Revenue from Biogas (6 €cent/kWh) 6 - 7 € / t FM fermenter-
input
• Revenue from Biogas
(+ financial funding by EEG up to 16 €cent/kWh) 15 – 28 € / t FM fermenter-
input
• Revenues CDM 1 – 2 € / Biowaste?
Markets for Secondary Products
- Biogas Use
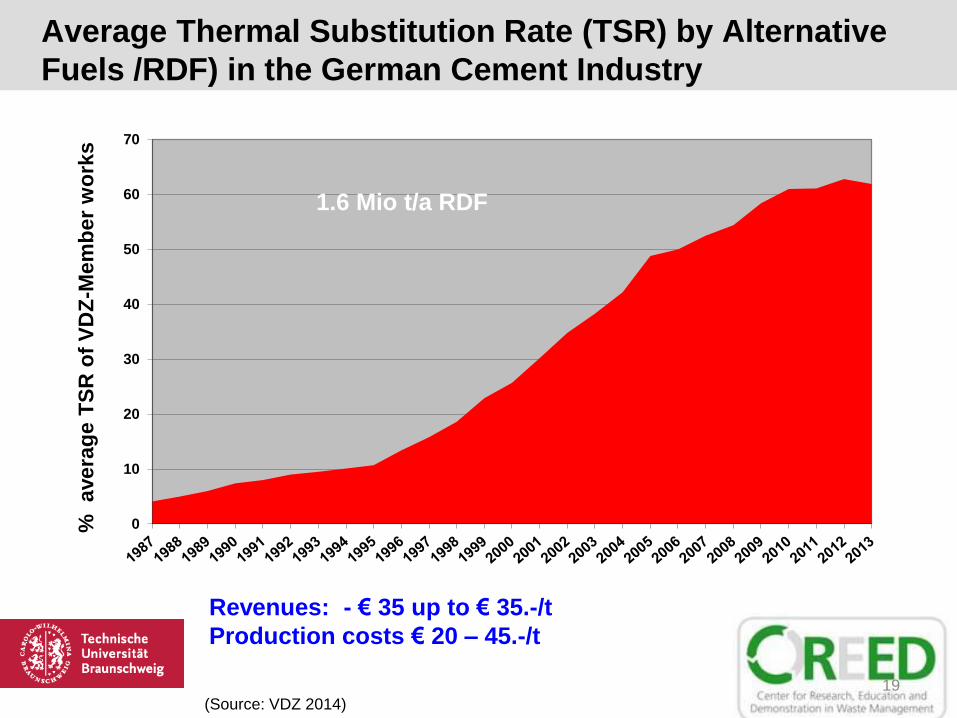
Average Thermal Substitution Rate (TSR) by Alternative
Fuels /RDF) in the German Cement Industry
19
0
10
20
30
40
50
60
70
%
avera
ge T
SR
of
VD
Z-M
em
ber
wo
rks
(Source: VDZ 2014)
1.6 Mio t/a RDF
Revenues: - € 35 up to € 35.-/t
Production costs € 20 – 45.-/t
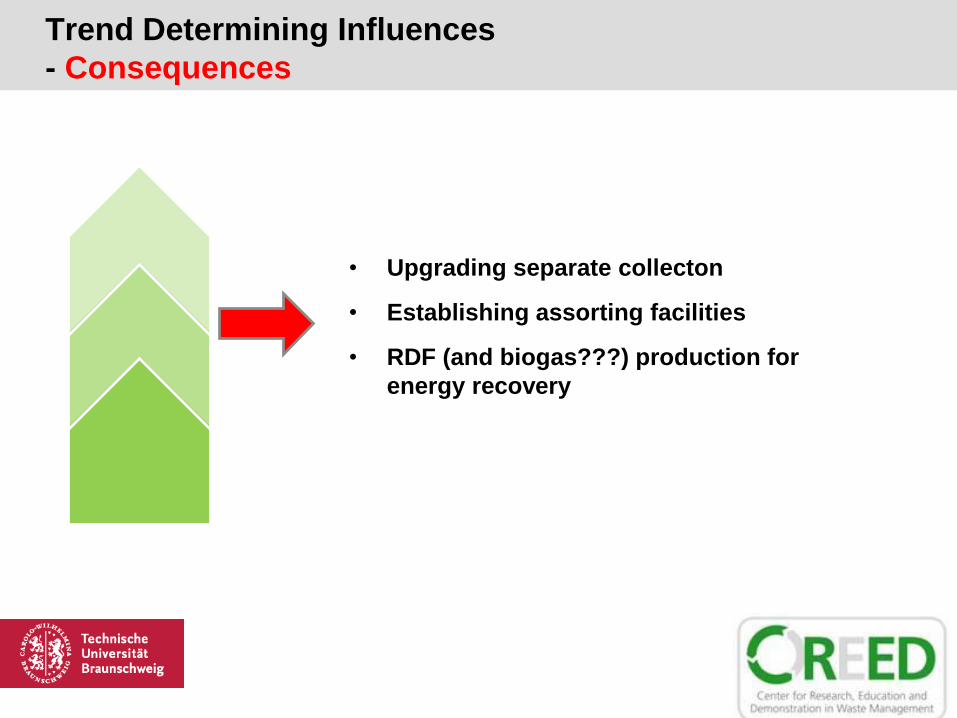
Trend Determining Influences
- Consequences
• Upgrading separate collecton
• Establishing assorting facilities
• RDF (and biogas???) production for
energy recovery
Trend setting influences
• Waste composition
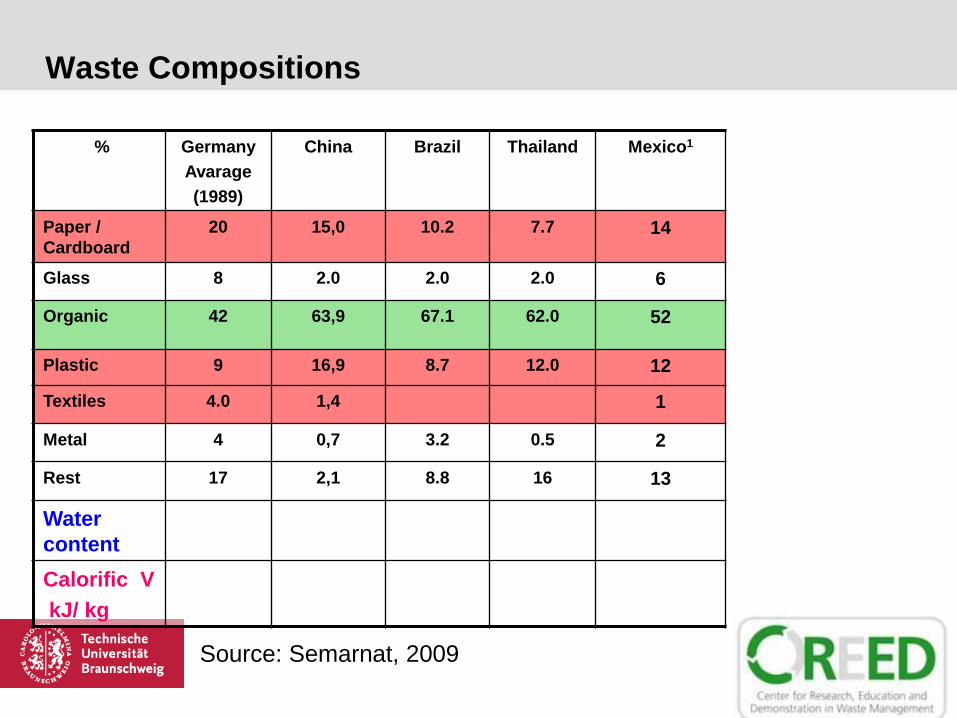
Waste Compositions
% Germany
Avarage
(1989)
China Brazil Thailand Mexico1
Paper /
Cardboard
20 15,0 10.2 7.7 14
Glass 8 2.0 2.0 2.0 6
Organic 42 63,9 67.1 62.0 52
Plastic 9 16,9 8.7 12.0 12
Textiles 4.0 1,4 1
Metal 4 0,7 3.2 0.5 2
Rest 17 2,1 8.8 16 13
Water
content
Calorific V
kJ/ kg
Source: Semarnat, 2009
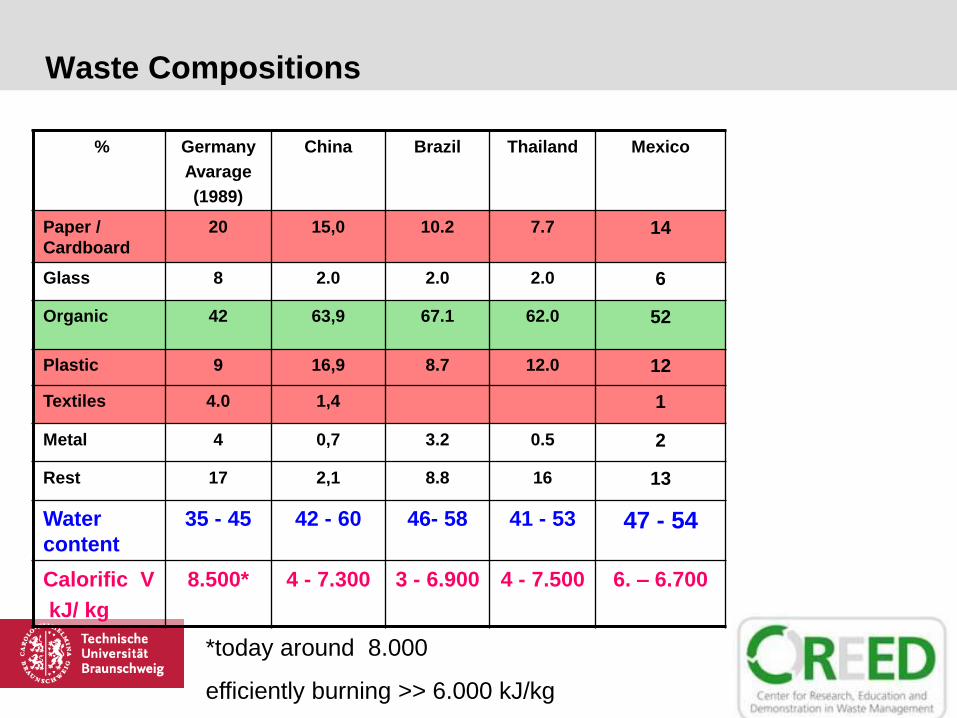
Waste Compositions
% Germany
Avarage
(1989)
China Brazil Thailand Mexico
Paper /
Cardboard
20 15,0 10.2 7.7 14
Glass 8 2.0 2.0 2.0 6
Organic 42 63,9 67.1 62.0 52
Plastic 9 16,9 8.7 12.0 12
Textiles 4.0 1,4 1
Metal 4 0,7 3.2 0.5 2
Rest 17 2,1 8.8 16 13
Water
content
35 - 45 42 - 60 46- 58 41 - 53 47 - 54
Calorific V
kJ/ kg
8.500* 4 - 7.300 3 - 6.900 4 - 7.500 6. – 6.700
*today around 8.000
efficiently burning >> 6.000 kJ/kg
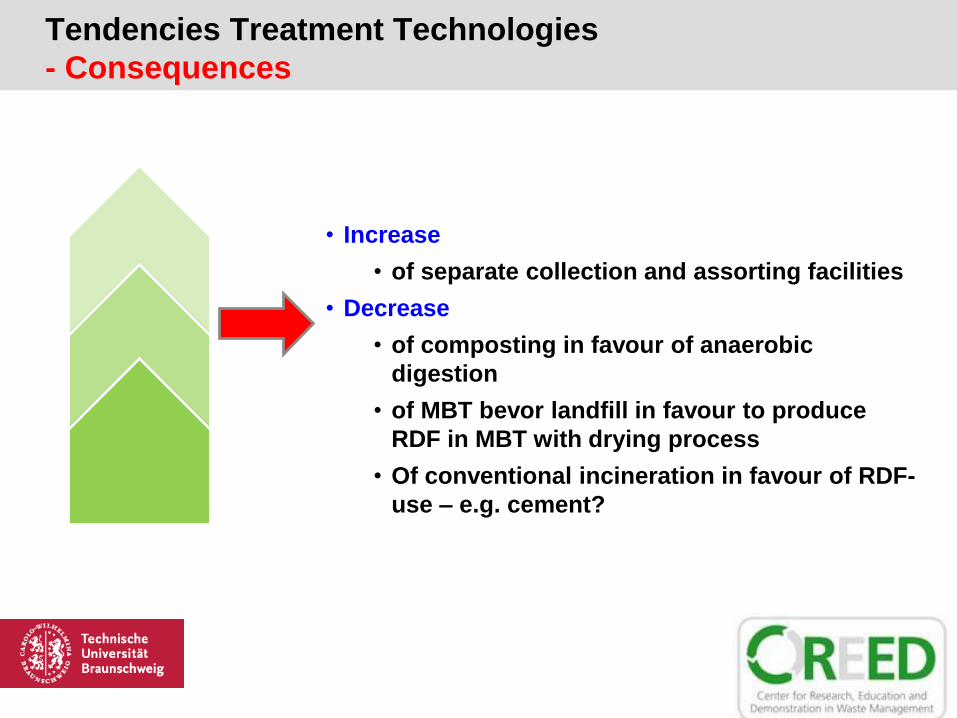
Tendencies Treatment Technologies
- Consequences
• Increase
• of separate collection and assorting facilities
• Decrease
• of composting in favour of anaerobic
digestion
• of MBT bevor landfill in favour to produce
RDF in MBT with drying process
• Of conventional incineration in favour of RDF-
use – e.g. cement?
< 30mm
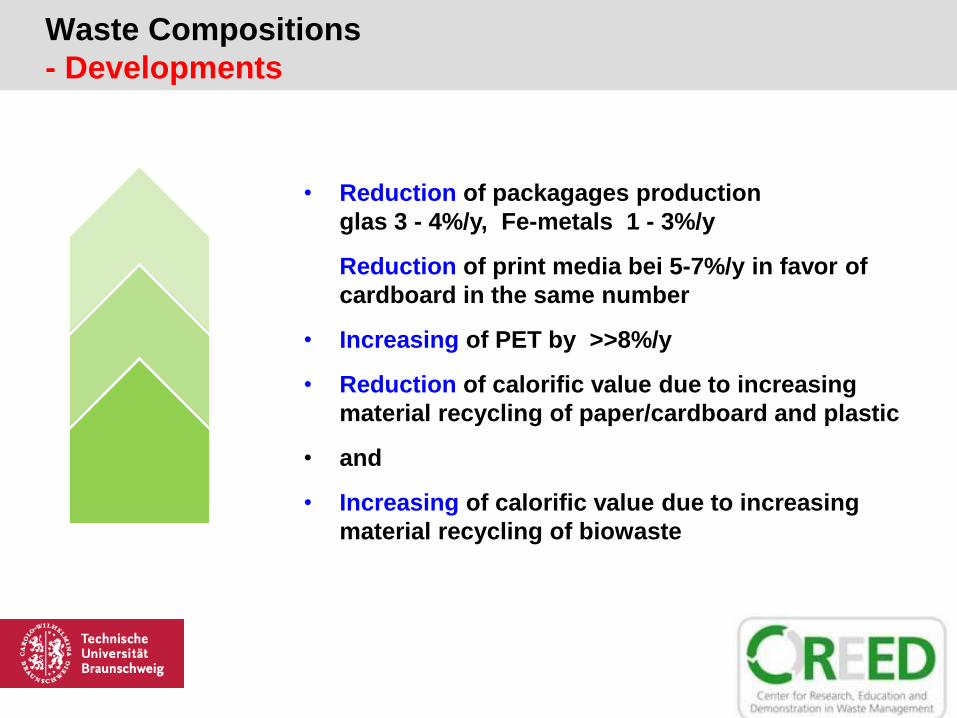
Waste Compositions
- Developments
• Reduction of packagages production
glas 3 - 4%/y, Fe-metals 1 - 3%/y
Reduction of print media bei 5-7%/y in favor of
cardboard in the same number
• Increasing of PET by >>8%/y
• Reduction of calorific value due to increasing
material recycling of paper/cardboard and plastic
• and
• Increasing of calorific value due to increasing
material recycling of biowaste
Separate Collection and Sortingand Recycling
Rest
Waste
Organics
Anaerobic
digestion /
Composting
Facility
MBT/RDF or
Incineration
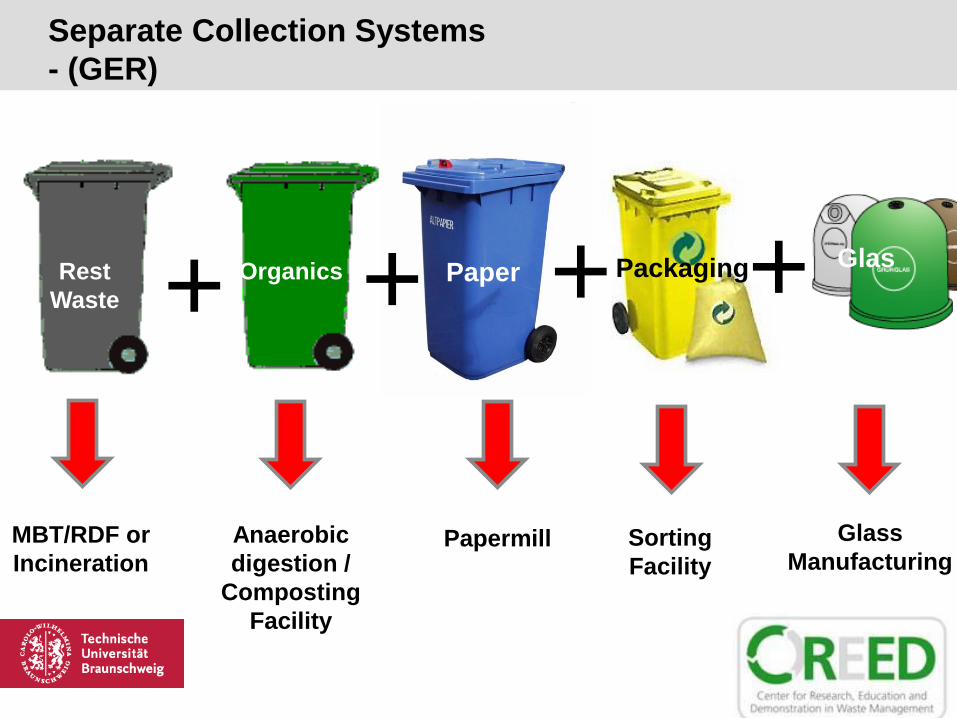
Separate Collection Systems
- (GER)
+ Paper Packaging+ + + Glas
Sorting
Facility
Glass
ManufacturingPapermill
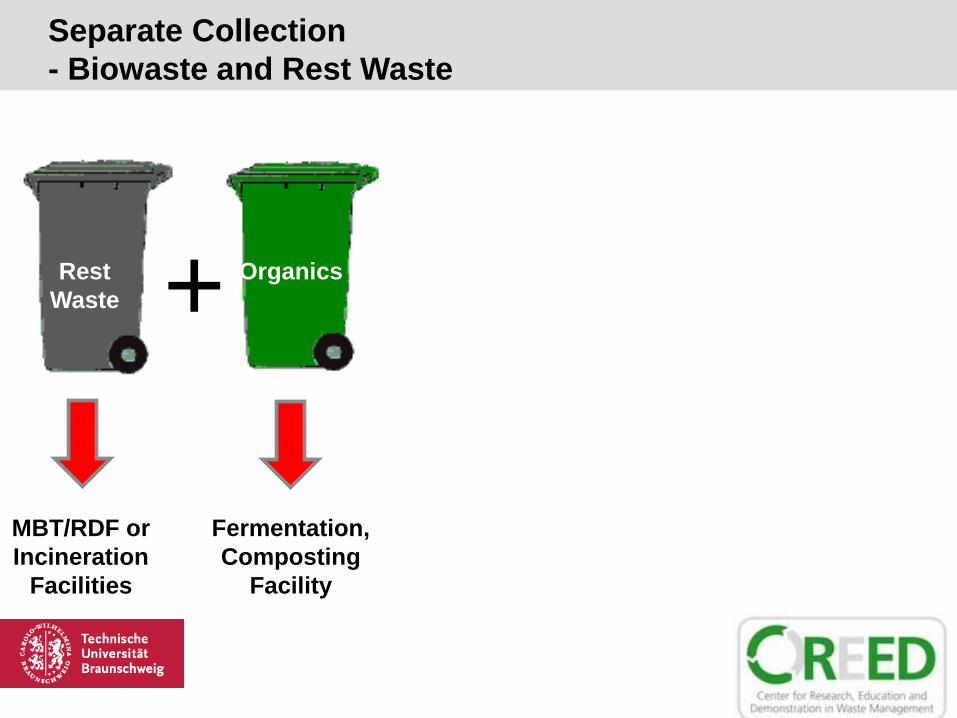
Rest
Waste
Organics
Fermentation,
Composting
Facility
MBT/RDF or
Incineration
Facilities
Separate Collection
- Biowaste and Rest Waste
+ Paper
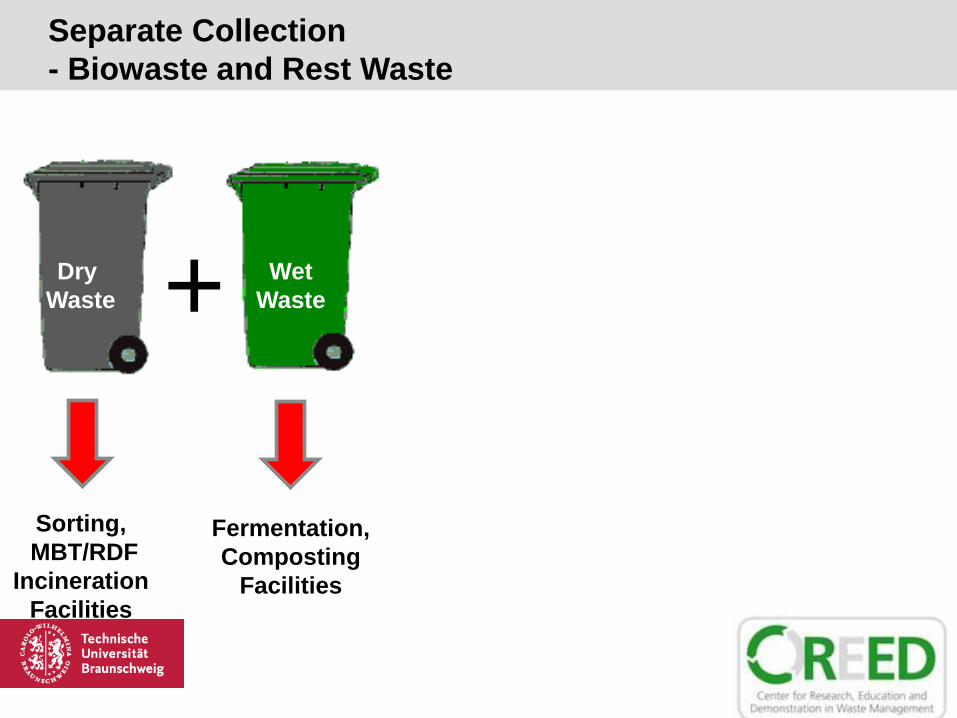
Dry
Waste
Wet
Waste
Fermentation,
Composting
Facilities
Sorting,
MBT/RDF
Incineration
Facilities
Separate Collection
- Biowaste and Rest Waste
+ Paper
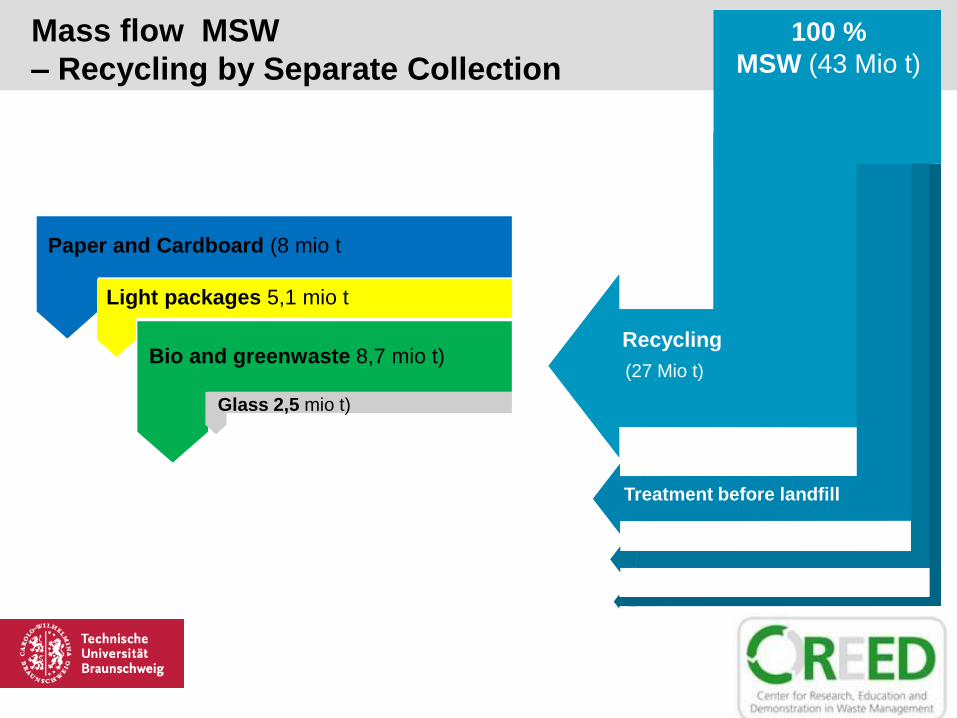
100 %
MSW (43 Mio t)Mass flow MSW - Germany
Recycling
(27 Mio t)
Treatment before landfill
Paper and Cardboard (8 mio t
Light packages 5,1 mio t
Bio and greenwaste 8,7 mio t)
Glass 2,5 mio t)
Mass flow MSW
– Recycling by Separate Collection
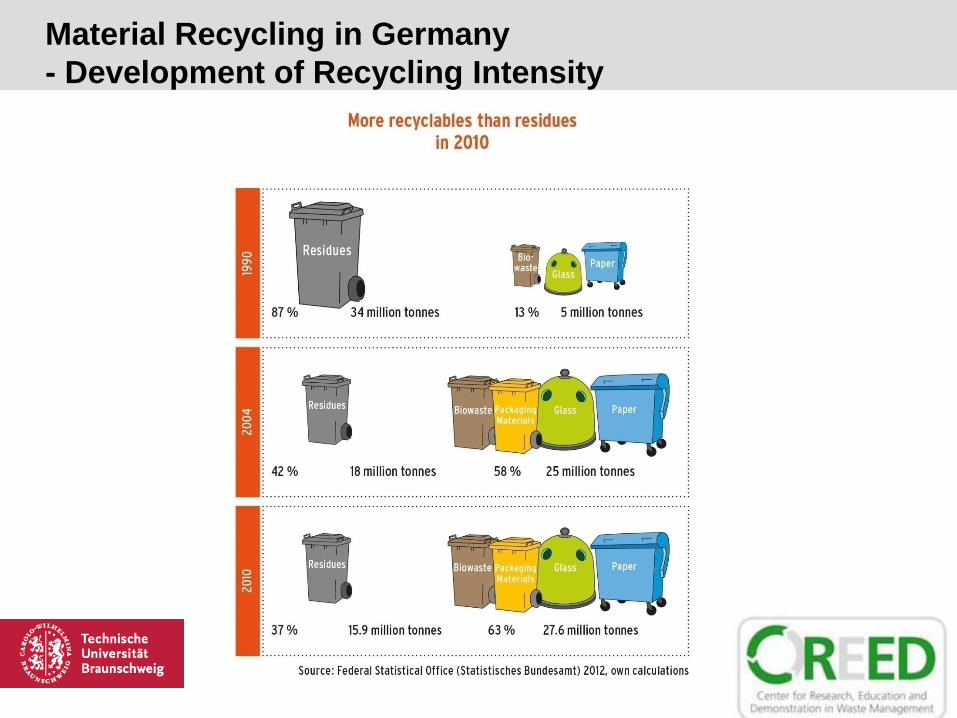
Material Recycling in Germany
- Development of Recycling Intensity
But!!!!!
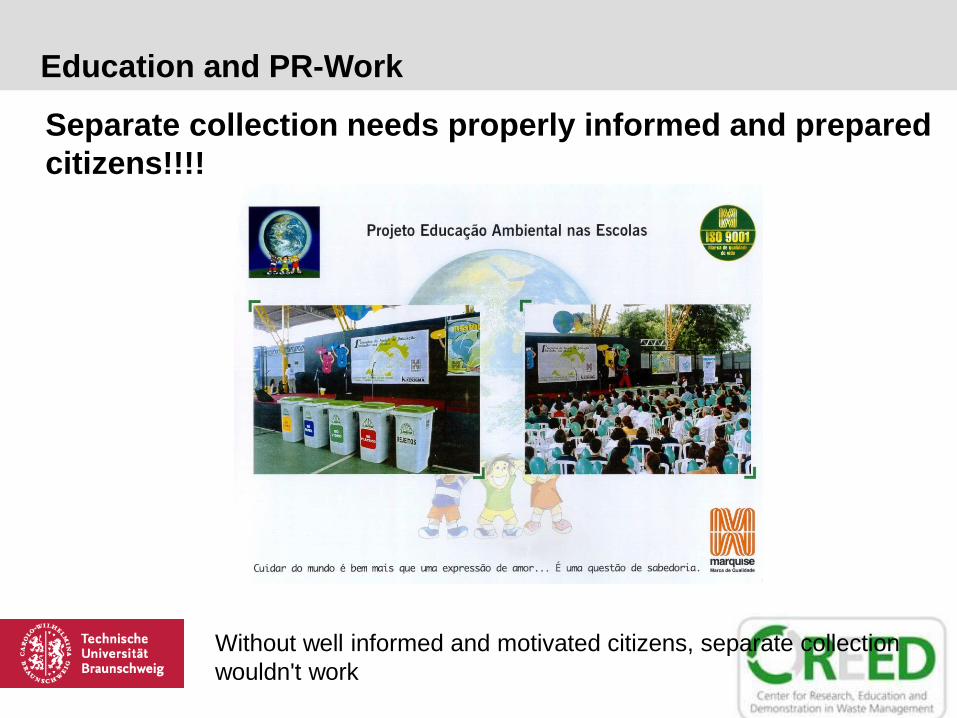
Education and PR-Work
Separate collection needs properly informed and prepared
citizens!!!!
BIO
WASTE
?
Without well informed and motivated citizens, separate collection
wouldn't work
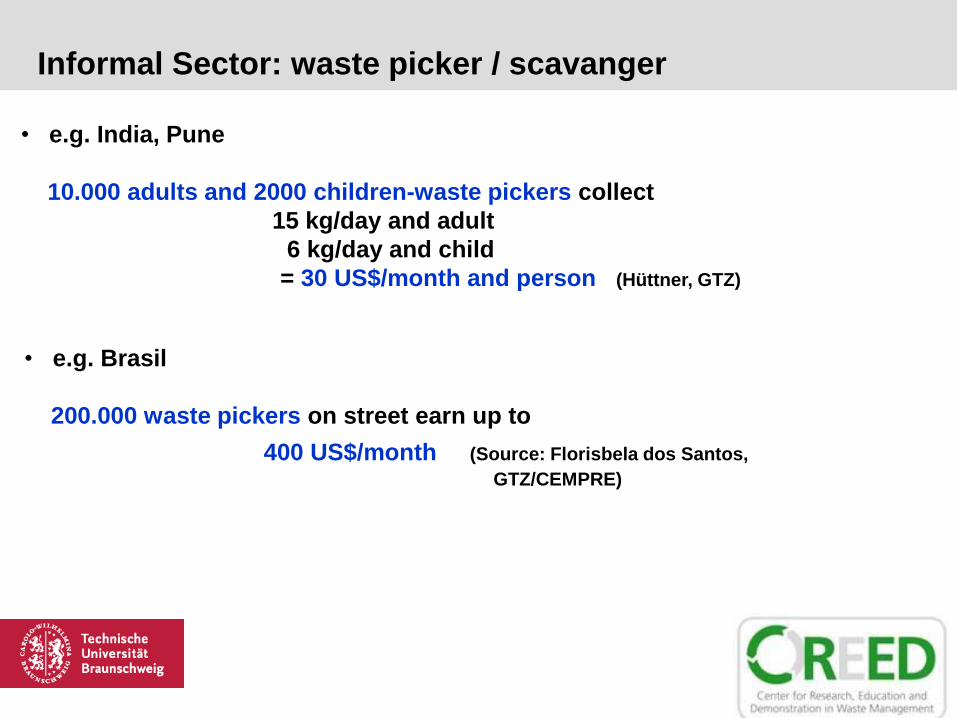
• e.g. India, Pune
10.000 adults and 2000 children-waste pickers collect
15 kg/day and adult
6 kg/day and child
= 30 US$/month and person (Hüttner, GTZ)
• e.g. Brasil
200.000 waste pickers on street earn up to
400 US$/month (Source: Florisbela dos Santos,
GTZ/CEMPRE)
Informal Sector: waste picker / scavanger
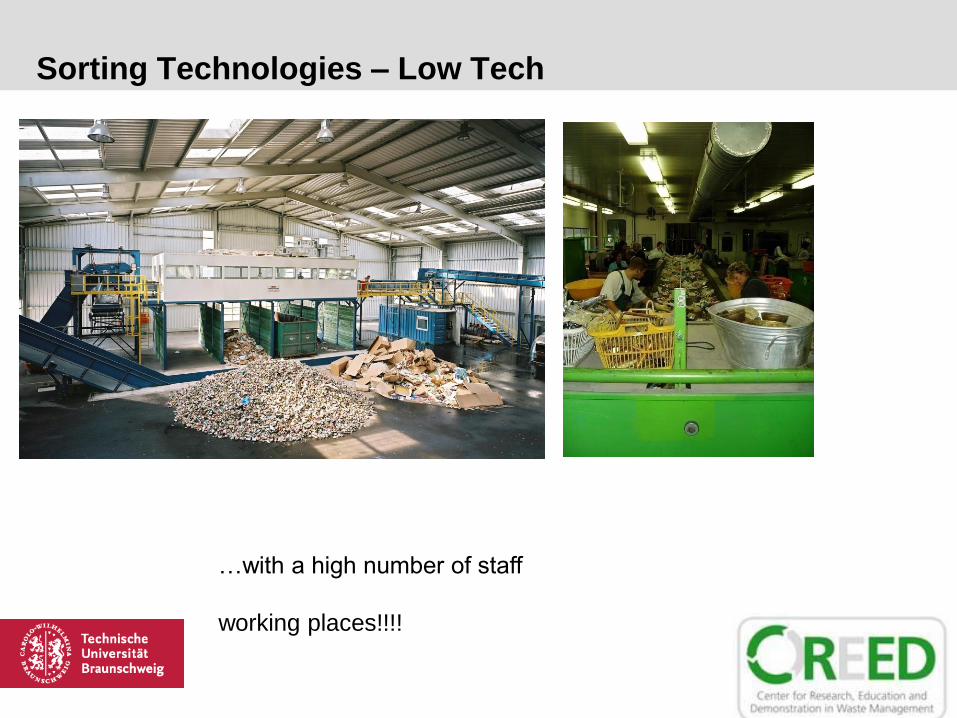
Sorting Technologies – Low Tech
…with a high number of staff
working places!!!!
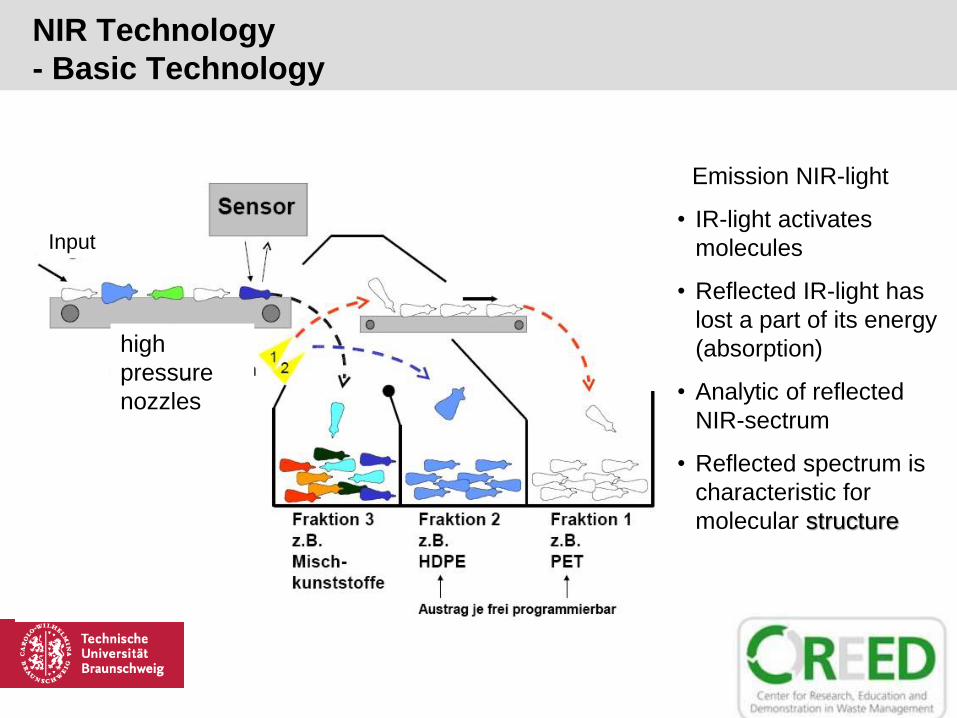
NIR Technology
- Basic Technology
• Emission NIR-light
• IR-light activates
molecules
• Reflected IR-light has
lost a part of its energy
(absorption)
• Analytic of reflected
NIR-sectrum
• Reflected spectrum is
characteristic for
molecular structure
Input
high
pressure
nozzles
Fermentation and Composting
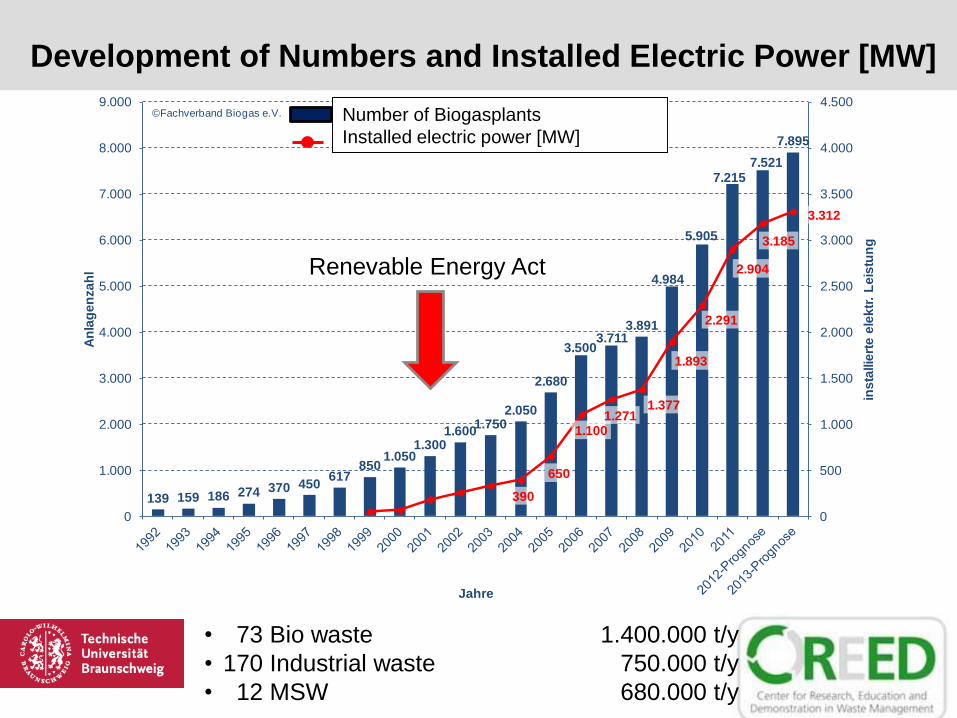
Development of Numbers and Installed Electric Power [MW]
139 159 186 274 370 450617
8501.050
1.3001.600
1.7502.050
2.680
3.5003.711
3.891
4.984
5.905
7.2157.521
7.895
390
650
1.1001.271
1.377
1.893
2.291
2.904
3.185
3.312
0
500
1.000
1.500
2.000
2.500
3.000
3.500
4.000
4.500
0
1.000
2.000
3.000
4.000
5.000
6.000
7.000
8.000
9.000
ins
tallie
rte
ele
ktr
. L
eis
tun
g
An
lag
en
za
hl
Jahre
Anzahl Biogasanlagen
installierte elektrische Leistung [MW]
©Fachverband Biogas e.V. Number of Biogasplants
Installed electric power [MW]
Renevable Energy Act
• 73 Bio waste 1.400.000 t/y
• 170 Industrial waste 750.000 t/y
• 12 MSW 680.000 t/y
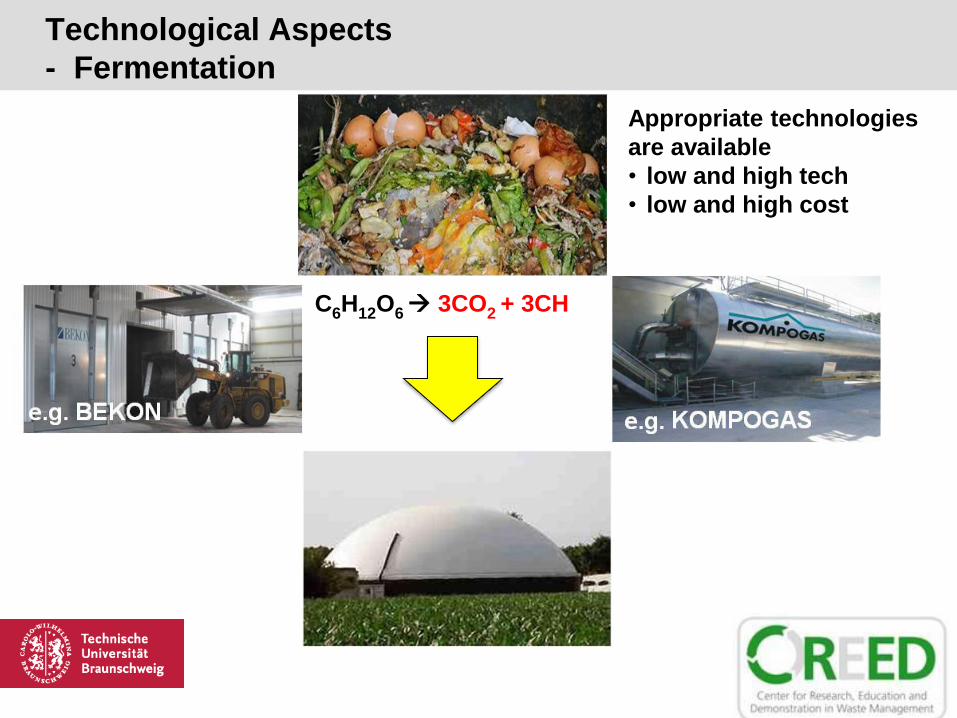
C6H12O6 3CO2 + 3CH
Technological Aspects
- Fermentation
Appropriate technologies
are available
• low and high tech
• low and high cost
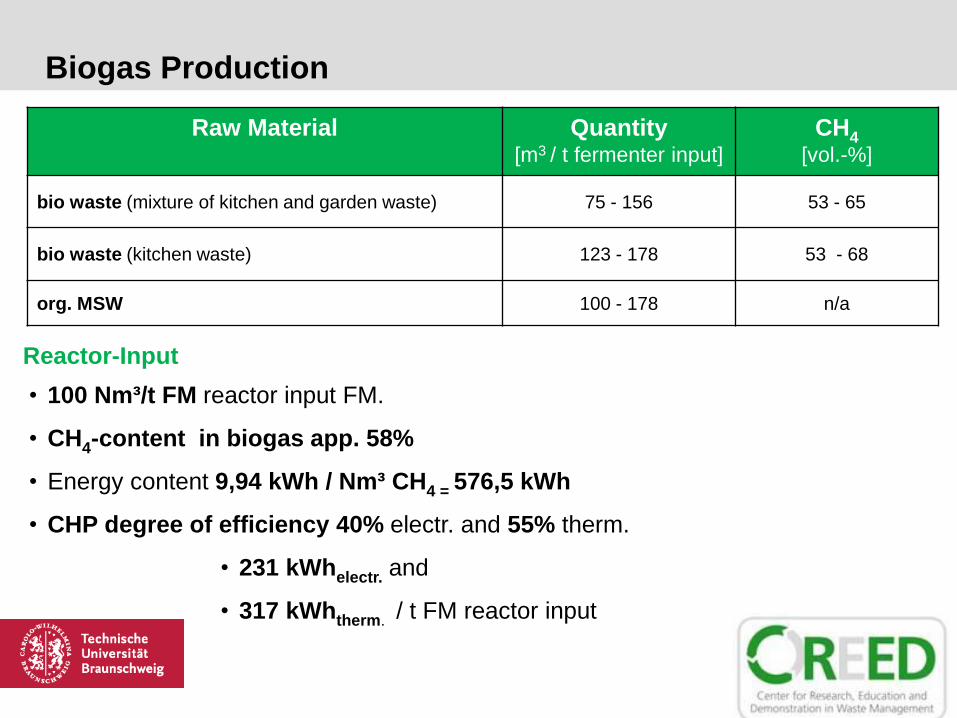
Biogas Production
Raw Material Quantity[m3 / t fermenter input]
CH4
[vol.-%]
bio waste (mixture of kitchen and garden waste) 75 - 156 53 - 65
bio waste (kitchen waste) 123 - 178 53 - 68
org. MSW 100 - 178 n/a
• 100 Nm³/t FM reactor input FM.
• CH4-content in biogas app. 58%
• Energy content 9,94 kWh / Nm³ CH4 = 576,5 kWh
• CHP degree of efficiency 40% electr. and 55% therm.
• 231 kWhelectr. and
• 317 kWhtherm. / t FM reactor input
Reactor-Input
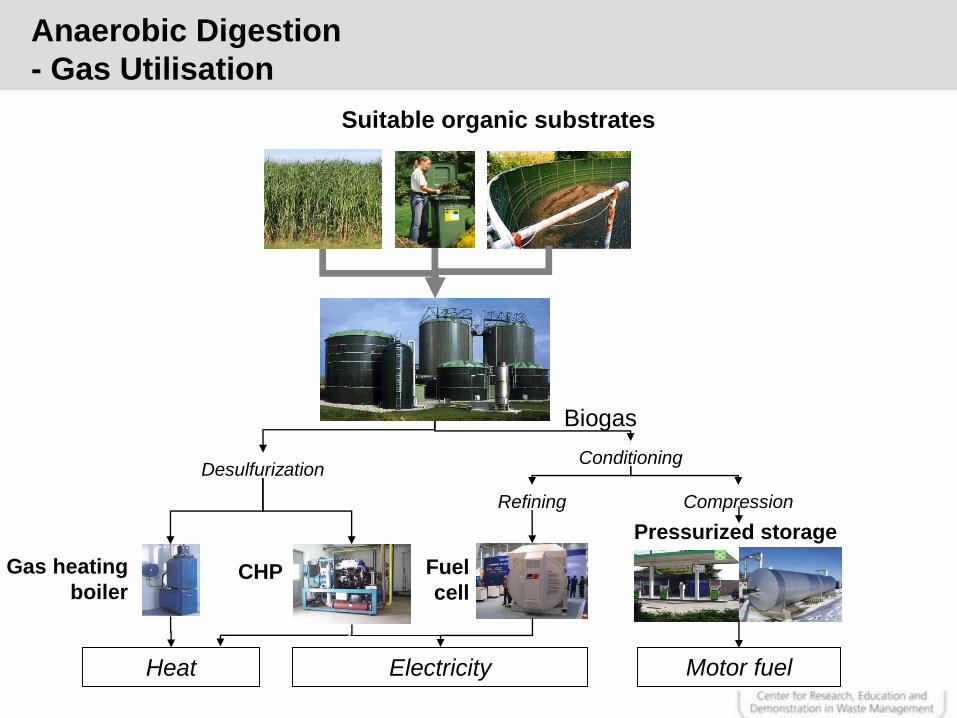
Anaerobic Digestion
- Gas Utilisation
Gas heating
boilerCHP Fuel
cell
Pressurized storage
Heat Electricity Motor fuel
Suitable organic substrates
DesulfurizationConditioning
Refining Compression
Biogas
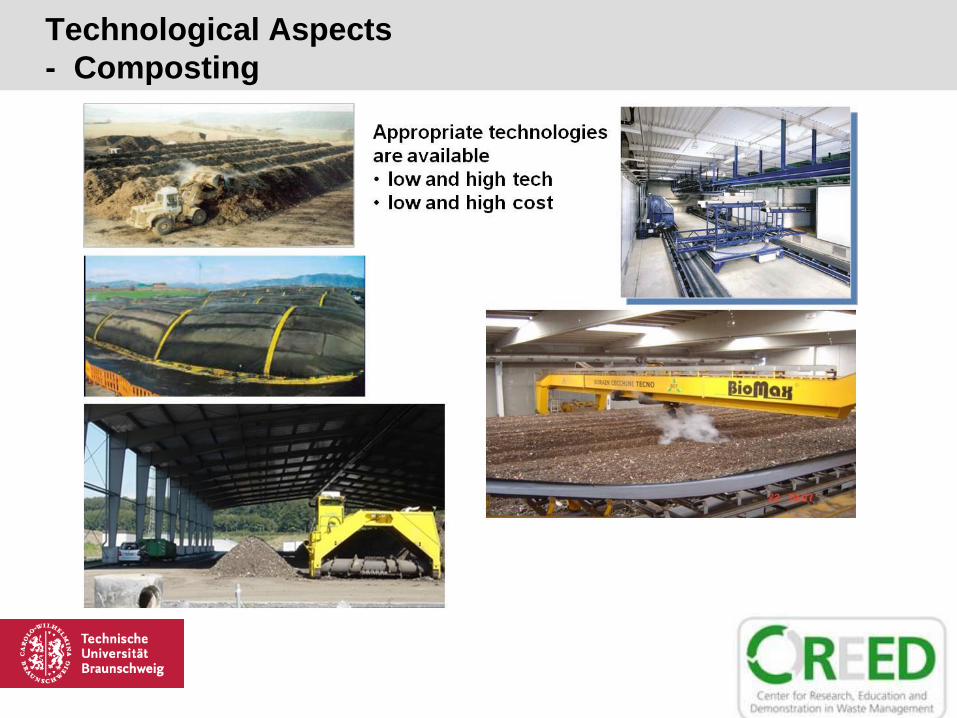
Technological Aspects
- Composting
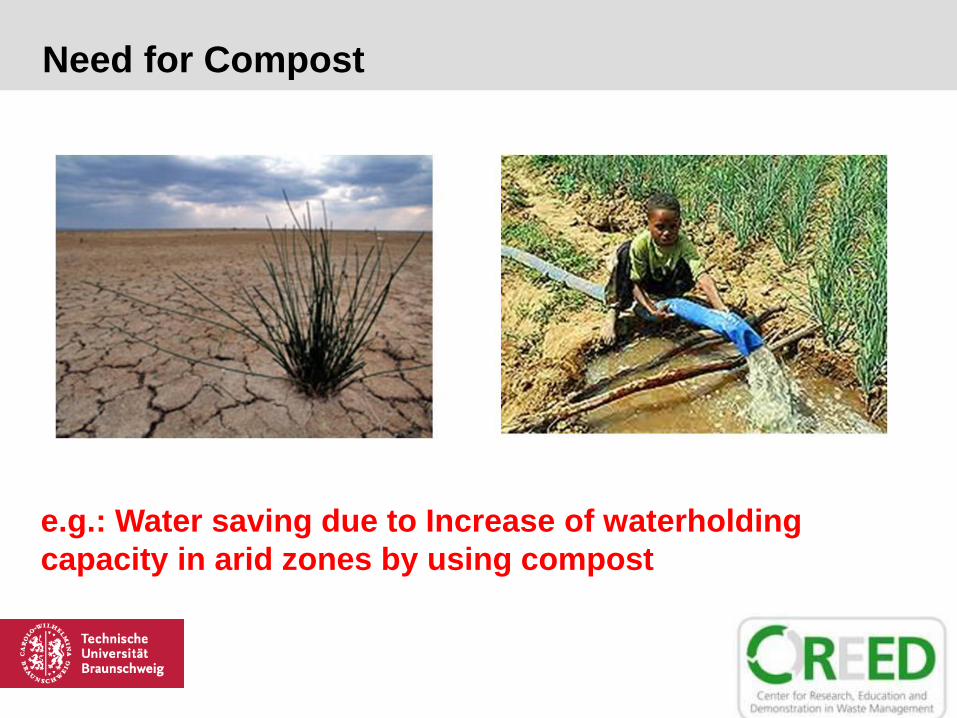
e.g.: Water saving due to Increase of waterholding
capacity in arid zones by using compost
Need for Compost
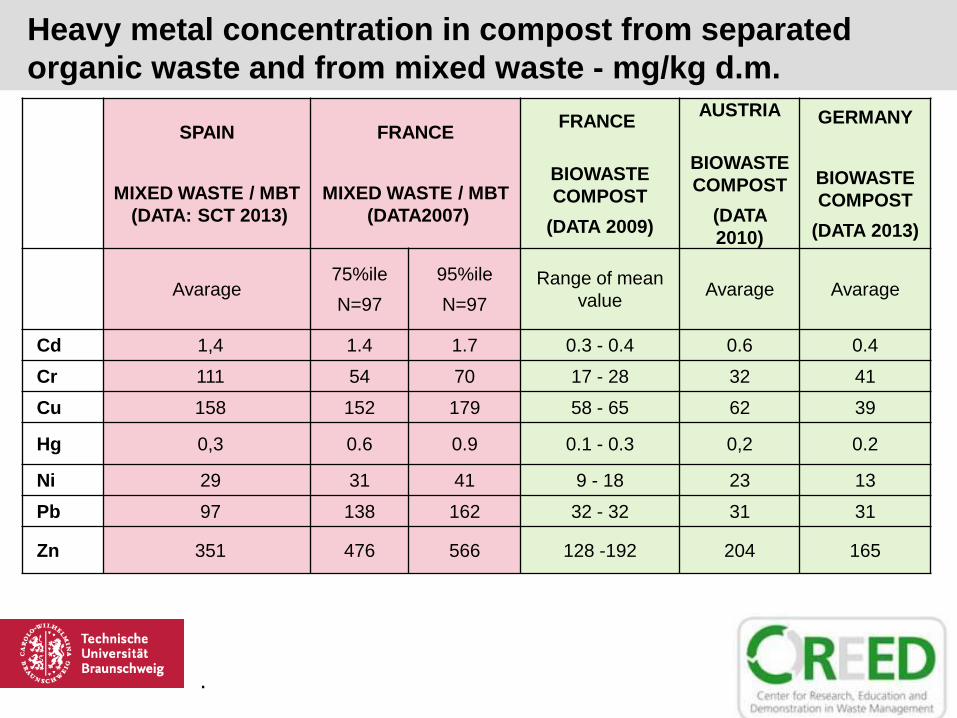
Heavy metal concentration in compost from separated
organic waste and from mixed waste - mg/kg d.m.
SPAIN
MIXED WASTE / MBT
(DATA: SCT 2013)
FRANCE
MIXED WASTE / MBT
(DATA2007)
FRANCE
BIOWASTE
COMPOST
(DATA 2009)
AUSTRIA
BIOWASTE
COMPOST
(DATA
2010)
GERMANY
BIOWASTE
COMPOST
(DATA 2013)
Avarage75%ile
N=97
95%ile
N=97
Range of mean
valueAvarage Avarage
Cd 1,4 1.4 1.7 0.3 - 0.4 0.6 0.4
Cr 111 54 70 17 - 28 32 41
Cu 158 152 179 58 - 65 62 39
Hg 0,3 0.6 0.9 0.1 - 0.3 0,2 0.2
Ni 29 31 41 9 - 18 23 13
Pb 97 138 162 32 - 32 31 31
Zn 351 476 566 128 -192 204 165
.
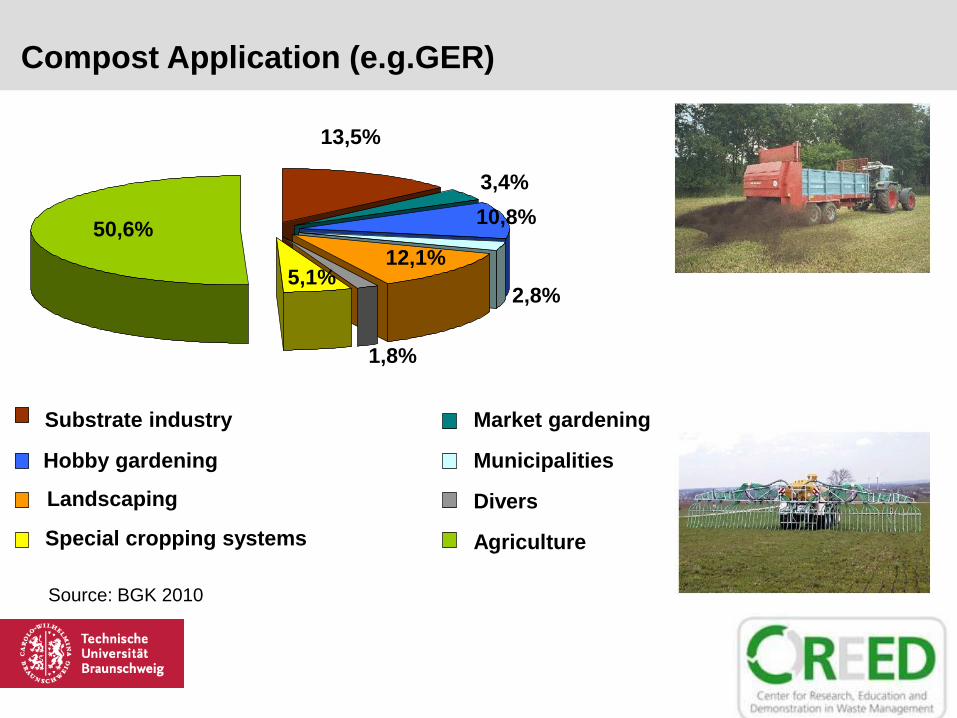
Compost Application (e.g.GER)
Market gardening
Municipalities
Landscaping
Substrate industry
Hobby gardening
Divers
Special cropping systems Agriculture
13,5%
3,4%
10,8%
2,8%
12,1%
1,8%
5,1%
50,6%
Source: BGK 2010
Energy Recovery
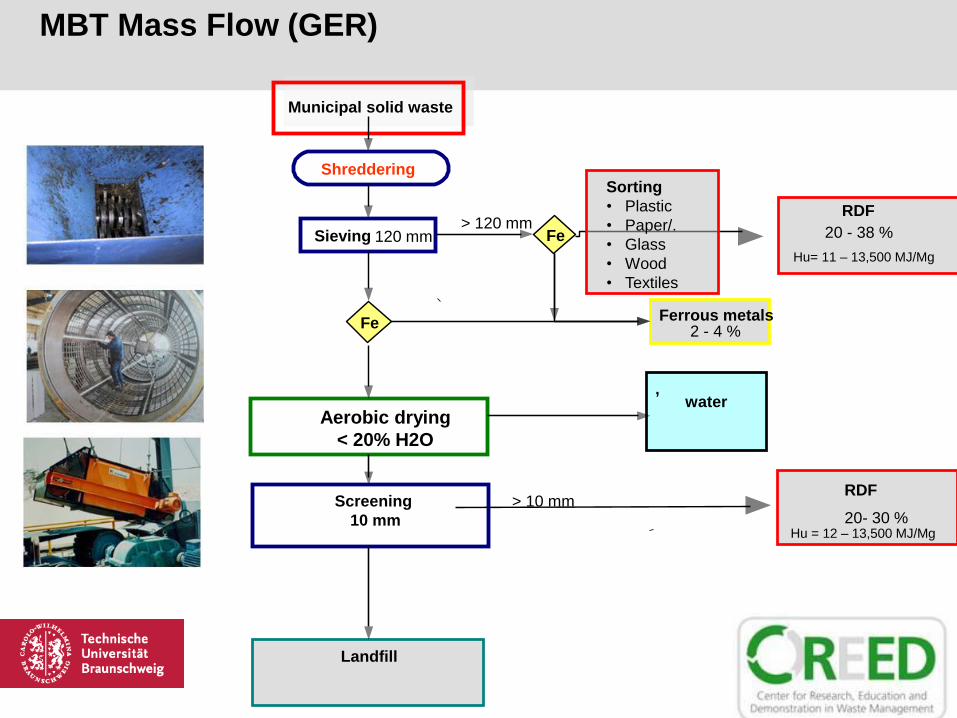
Aerobic drying
< 20% H2O
Shreddering
Municipal solid waste
FeFerrous metals
2 - 4 %
Landfill
RDF
20- 30 %Hu = 12 – 13,500 MJ/Mg
Sieving 120 mm
RDF
20 - 38 %
Hu= 11 – 13,500 MJ/Mg
Fe> 120 mm
,water
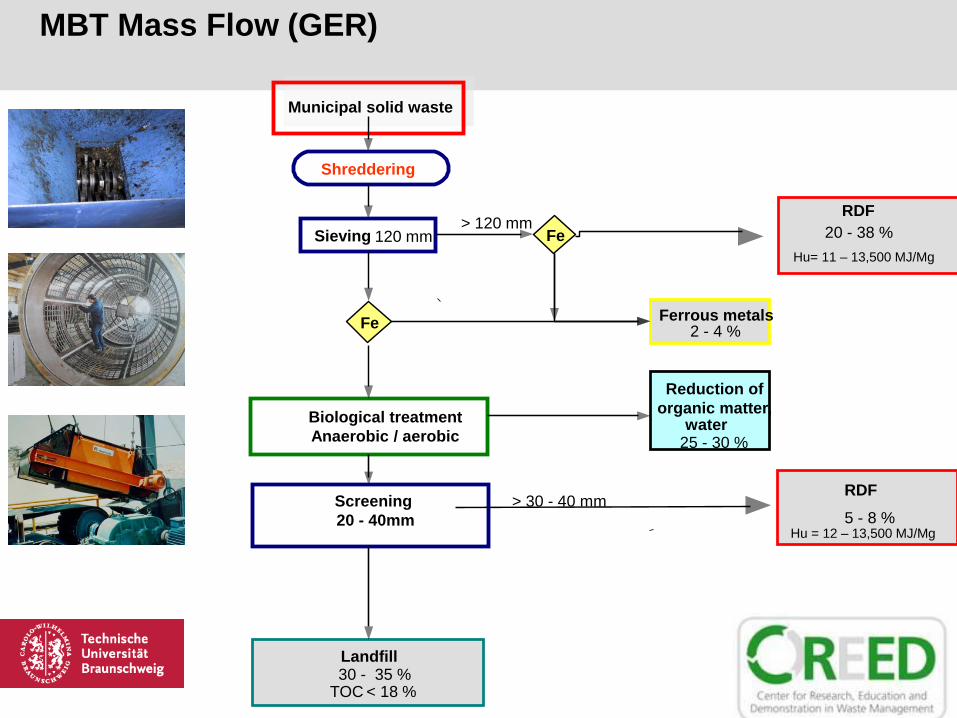
MBT Mass Flow (GER)
> 10 mmScreening
10 mm
Sorting
• Plastic
• Paper/.
• Glass
• Wood
• Textiles
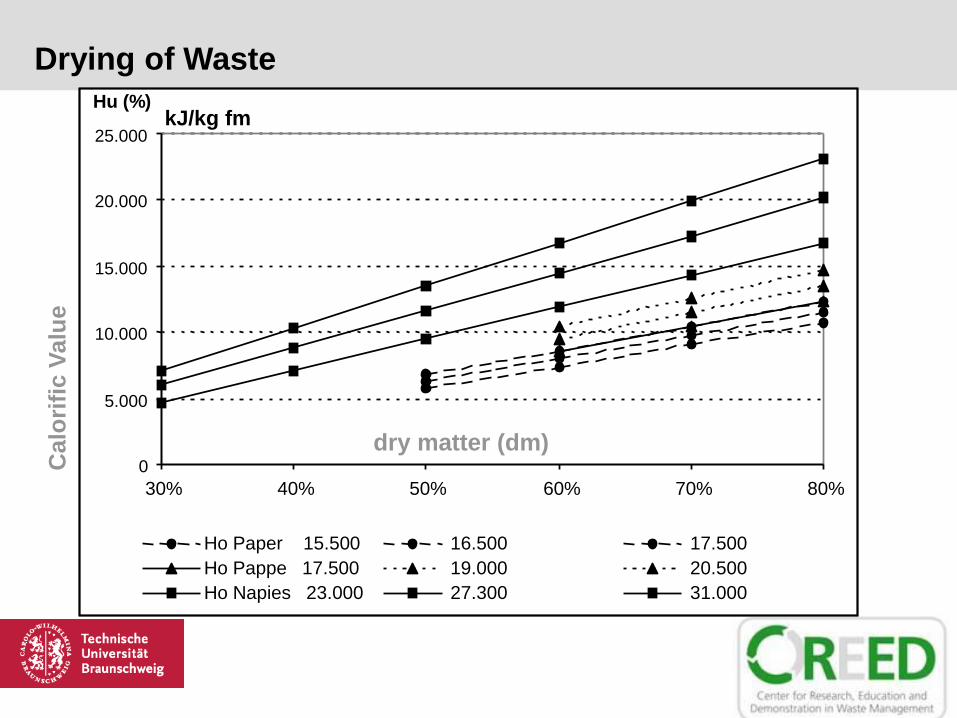
0
5.000
10.000
15.000
20.000
25.000
30% 40% 50% 60% 70% 80%
dry matter (dm)
Hu (%)
Ho Paper 15.500 16.500 17.500
Ho Pappe 17.500 19.000 20.500
Ho Napies 23.000 27.300 31.000
kJ/kg fm
Drying of WasteC
alo
rifi
c V
alu
e
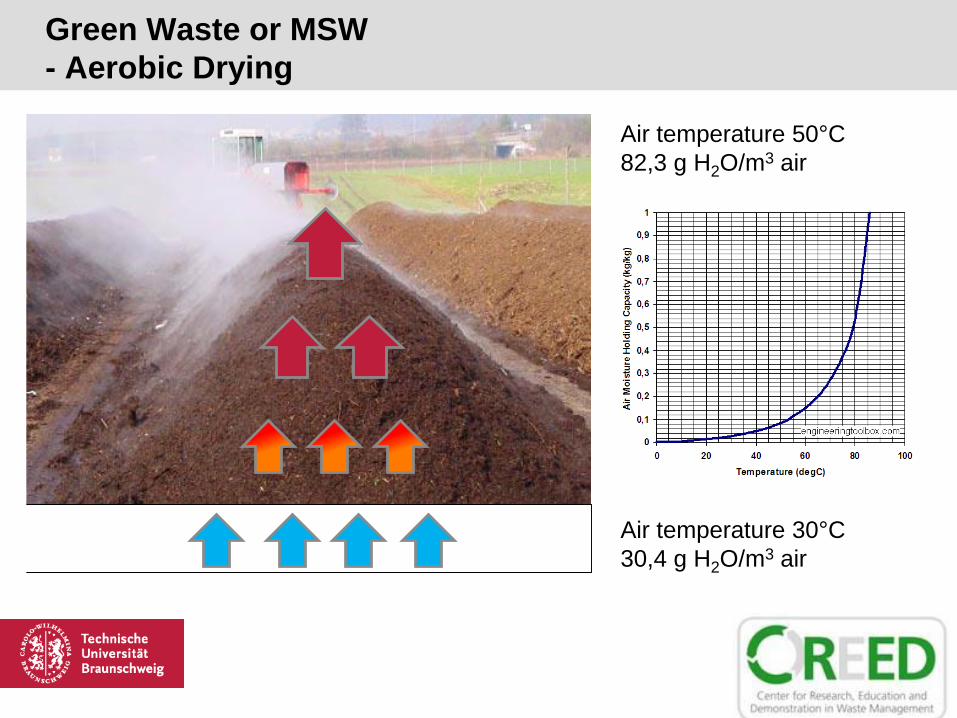
Green Waste or MSW
- Aerobic Drying
Air temperature 30°C
30,4 g H2O/m3 air
Air temperature 50°C
82,3 g H2O/m3 air
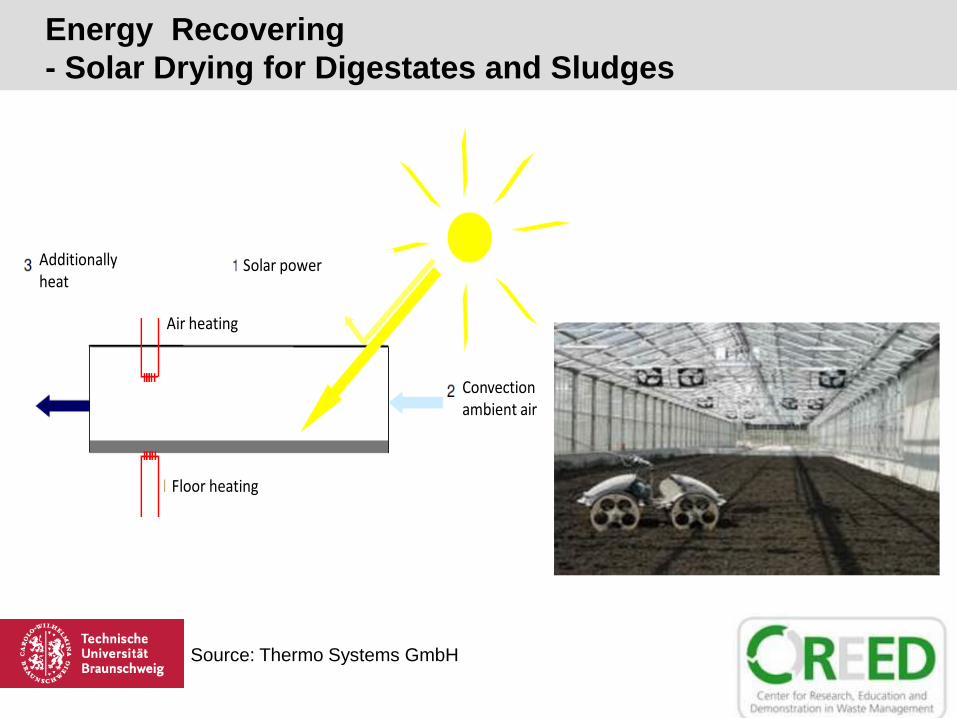
Energy Recovering
- Solar Drying for Digestates and Sludges
Additionallyheat
Solar power
Convectionambient air
Air heating
Floor heating
Source: Thermo Systems GmbH
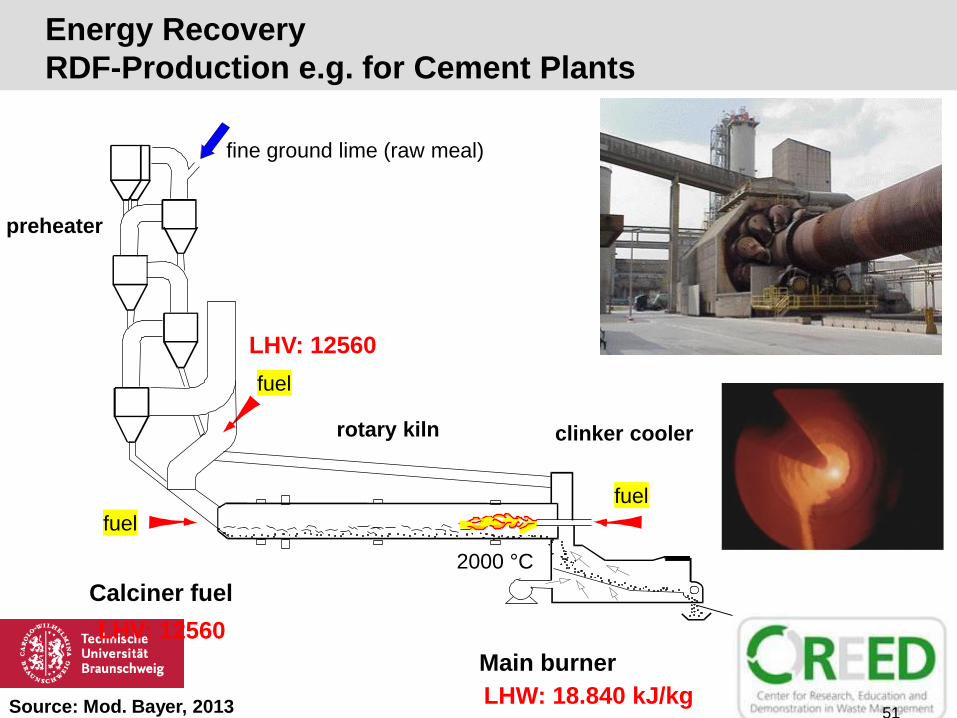
Energy Recovery
RDF-Production e.g. for Cement Plants
51
fine ground lime (raw meal)
preheater
fuel
clinker coolerrotary kiln
2000 °C
fuel
fuel
Calciner fuel
Main burner
LHV: 12560
LHW: 18.840 kJ/kg
LHV: 12560
Source: Mod. Bayer, 2013
Quelle: Eigenrecherchen und -berechnungen Prognos 2008
EBS-Kraftwerk
(Rostfeuerung)
4.835.000
54%
EBS-Kraftwerk
(Wirbelschicht)
1.965.000
21%
EBS-Kraftwerk
(Sonstige
Verfahren)
30.000
0,3%
Zement- /
Kalkwerk
1.506.000
16%
Braunkohle-
kraftwerk
555.000
6%Steinkohle-
kraftwerk
280.000
3%
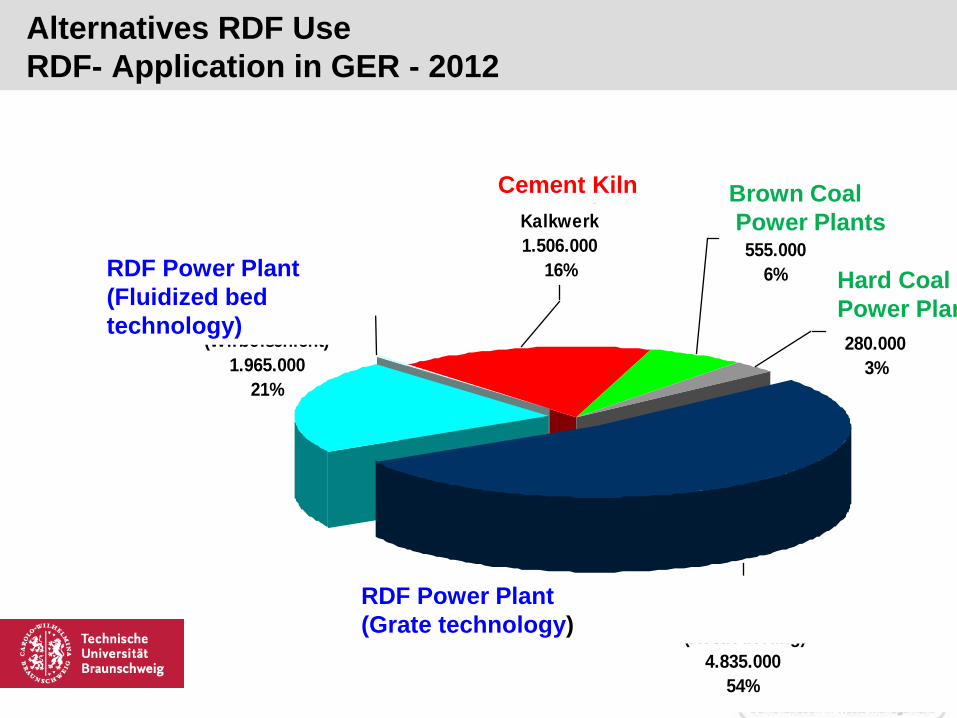
Alternatives RDF Use
RDF- Application in GER - 2012
Brown Coal
Power Plants
Hard Coal
Power Plant
RDF Power Plant
(Grate technology)
Cement Kiln
RDF Power Plant
(Fluidized bed
technology)
TreatmentBefore Landfill
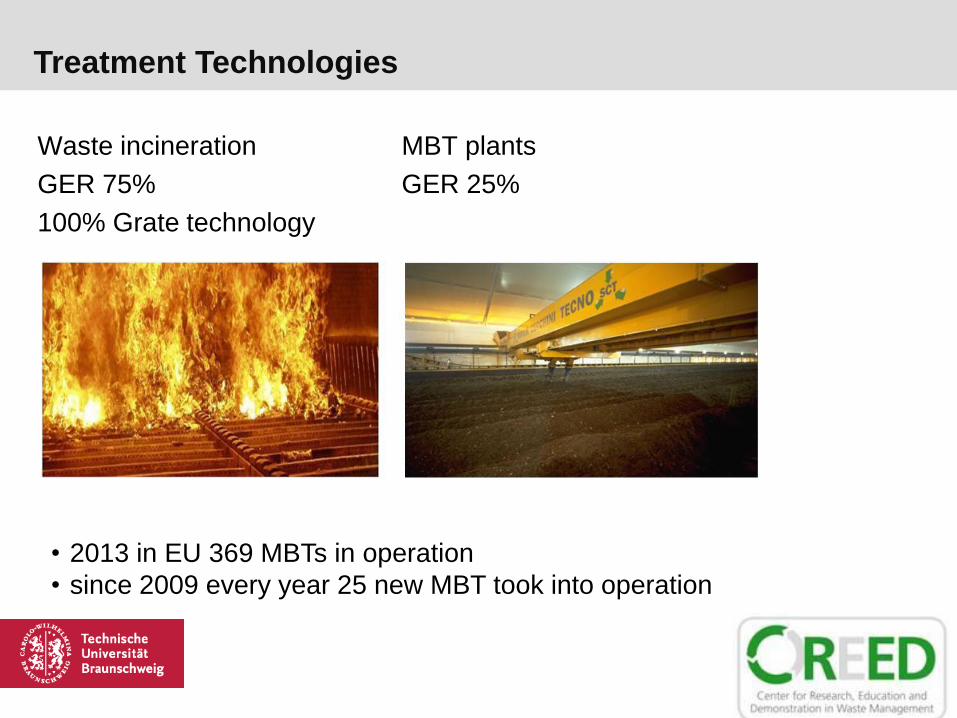
Waste incineration MBT plants
GER 75% GER 25%
100% Grate technology
Treatment Technologies
• 2013 in EU 369 MBTs in operation
• since 2009 every year 25 new MBT took into operation
Biological treatment
Anaerobic / aerobic
Shreddering
Municipal solid waste
FeFerrous metals
2 - 4 %
Landfill30 - 35 %
TOC < 18 %
RDF
5 - 8 %Hu = 12 – 13,500 MJ/Mg
Sieving 120 mm
RDF
20 - 38 %
Hu= 11 – 13,500 MJ/Mg
Fe> 120 mm
Reduction of
organic matter,water
25 - 30 %
MBT Mass Flow (GER)
> 30 - 40 mmScreening
20 - 40mm
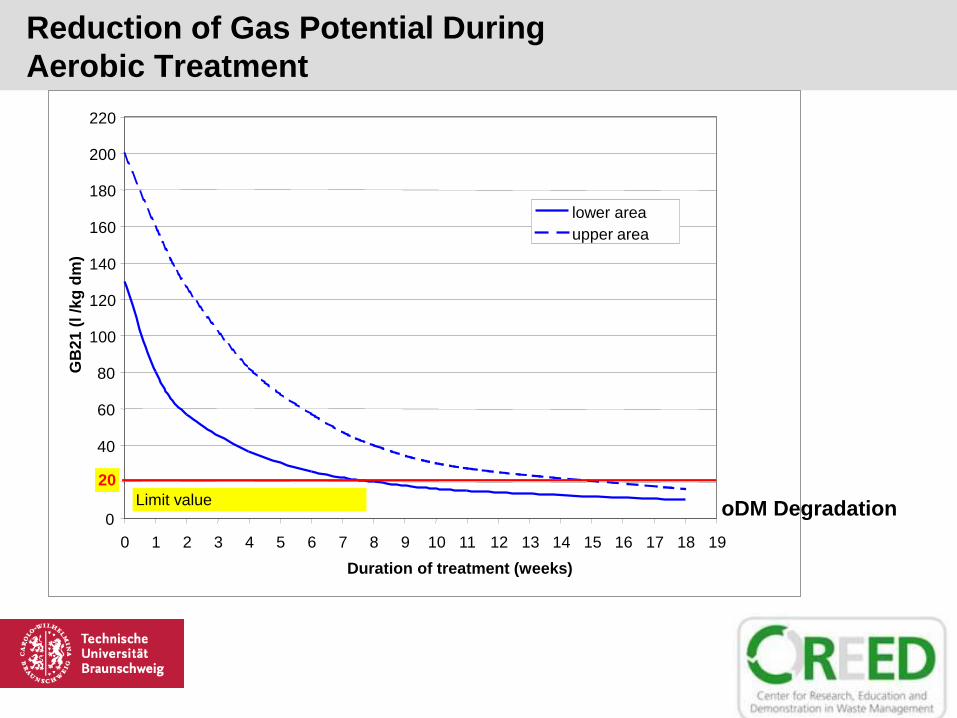
Reduction of Gas Potential During
Aerobic Treatment
0
20
40
60
80
100
120
140
160
180
200
220
0 1 2 3 4 5 6 7 8 9 10 11 12 13 14 15 16 17 18 19
Duration of treatment (weeks)
GB
21
(l /k
g d
m)
lower area
upper area
Limit value
20
oDM Degradation
100 %
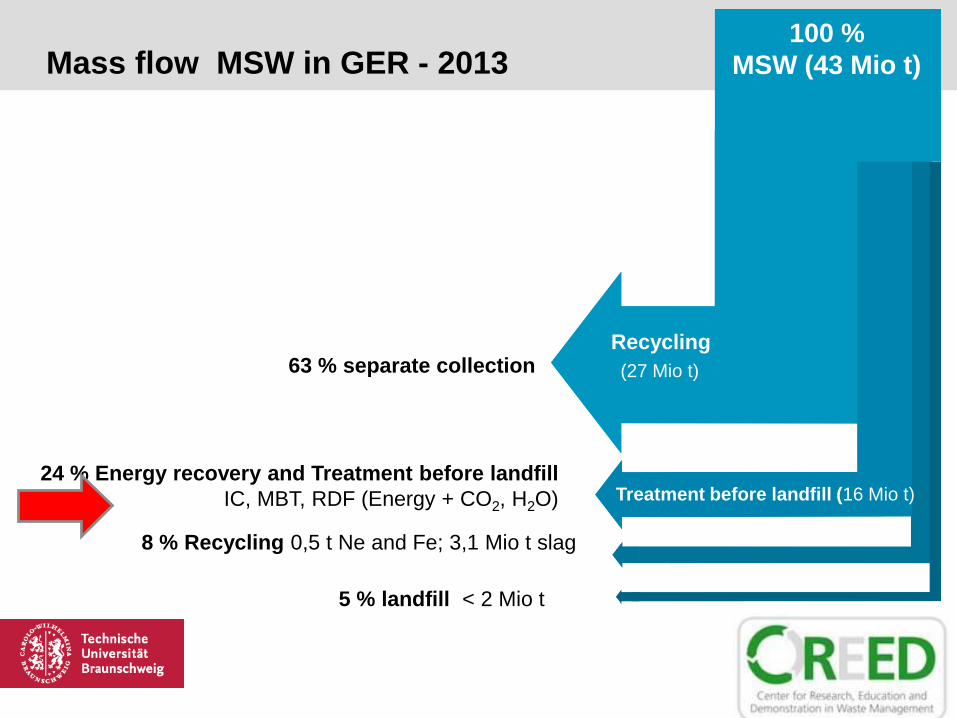
MSW (43 Mio t)
63 % separate collection
24 % Energy recovery and Treatment before landfill
IC, MBT, RDF (Energy + CO2, H2O)
8 % Recycling 0,5 t Ne and Fe; 3,1 Mio t slag
5 % landfill < 2 Mio t
Recycling
(27 Mio t)
Treatment before landfill (16 Mio t)
Mass flow MSW in GER - 2013
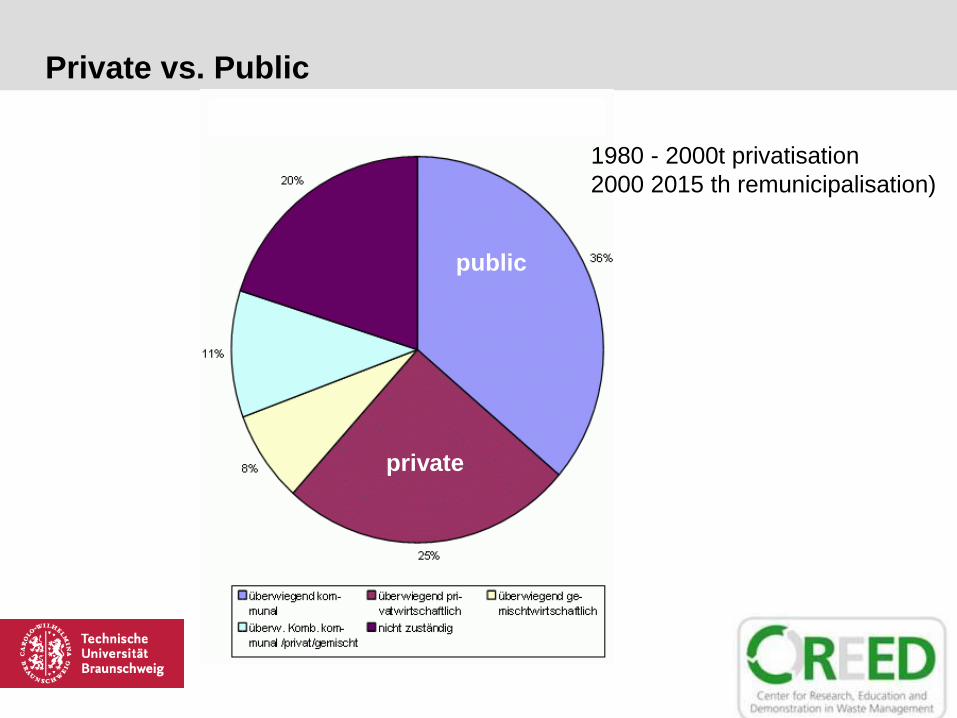
Private vs. Public
1980 - 2000t privatisation
2000 2015 th remunicipalisation)
public
private
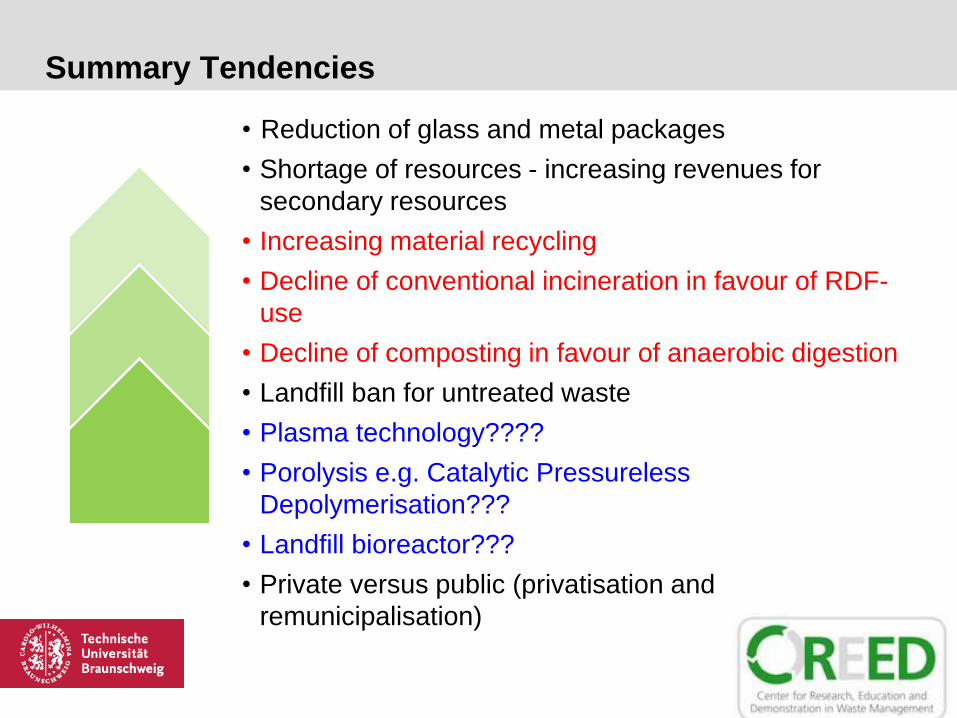
Summary Tendencies
• Reduction of glass and metal packages
• Shortage of resources - increasing revenues for
secondary resources
• Increasing material recycling
• Decline of conventional incineration in favour of RDF-
use
• Decline of composting in favour of anaerobic digestion
• Landfill ban for untreated waste
• Plasma technology????
• Porolysis e.g. Catalytic Pressureless
Depolymerisation???
• Landfill bioreactor???
• Private versus public (privatisation and
remunicipalisation)
Information
EPUB -
https://drive.google.com/file/d/0B5vLOUqm4l
TFZFVHV0RLVExWbFk/view?usp=sharing
MOBI -
https://drive.google.com/file/d/0B5vLOUqm4l
TFR2ZuUGxuTFR6dDQ/view?usp=sharing
Recommended