Embed Size (px)
Citation preview

Financial Statements…Simplified
Balance Sheet
Its Content Items
A Portray of Financial Position
& Profit, Loss a/c
Risk Parameters in Decision Making
Live Case Study Analysis
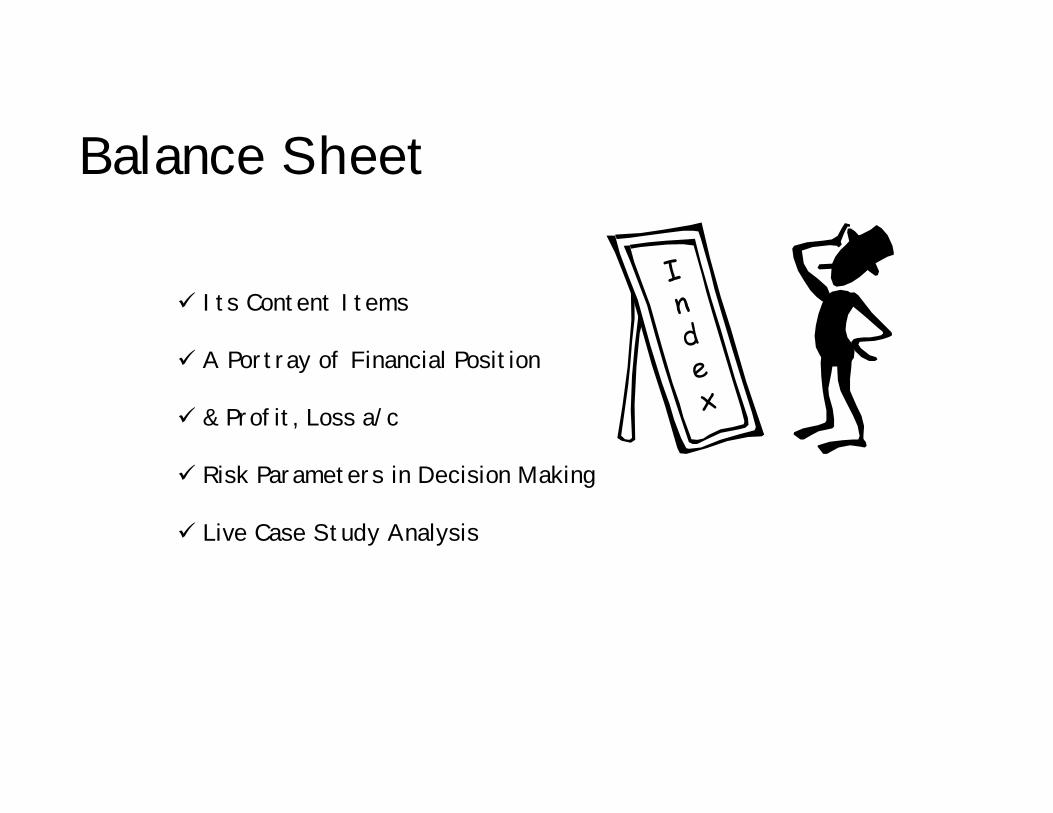
Share Capital
Current liabilities
&
Provisions
Reserves
&
Surplus
Unsecured Loans
Receivables
Secured Loans
Non Current Assets
Loans
&
Advances
Investments
Current Assets
In-Tangible Assets
Fixed Assets
z
Liabilities Assets(Application of Funds)
(Sources of Funds)
Content Items

Capital Structure
Working Capital Policy
Credit Management
Inventory Management
Security Analysis
Capital Budgeting
Share Capital (Equity)Reserves & SurplusSecured Loans
Loans & Advances Unsecured LoansCurrent Liabilities & Provisions Trade CreditorsProvisions
Fixed Assets (Net)
Investments
Current AssetsLoans & Advances Cash & Bank
Receivables
Inventories
Cash Management
Balance Sheet..!!A portray of financial
Position of the company

Revenue Risk
Return On Equity
Gross Profit Margin
Dividend Policy
Depreciation Policy
Business Risk
Cost of Goods SoldStocksWages & SalariesOther Manf. Exp.
Profit After Tax
Operating ProfitNon Operating Surplus/Deficit
Depreciation
Tax
Net Sales
Dividends
Tax Planning
Profit & Loss a/c ..!!a Translate of
Sales Revenues to Earnings
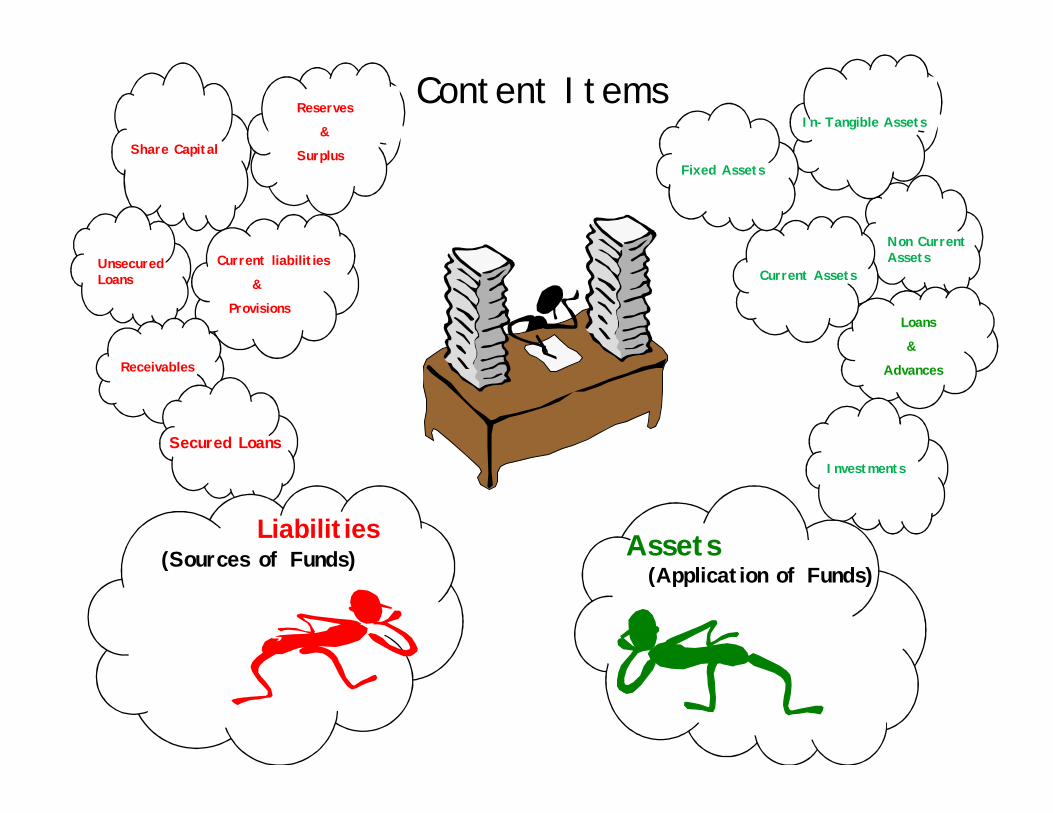
Key Financial Risk Parameters in Decision Making
Funding Terminology
Road Taxes
EMI
Debt Service -Coverage Ratio
Debt / Equity Ratio
Current Ratio
Dr. & Cr. Days
Sales Growth
EBIDTA
Cash Profit
Tangible Net Worth

Net worth is the amount by which Assets exceeds Liabilities.( Credit Worthiness of the Company / Individual ). In generalterms…Assets include Cash, & Bank balance, Property (Residential / Commercial {Land,Buildings) etc..along with Jewelery,Movable Assets) Tangible(Which can be physically seen )
The concept is of all about..how much the company/entity is worth. A consistent increase in Networth is a sign of goodfinancial health. In business ||ence, this is also termed as Book Value / Share holders equity.
To calculate your tangible net worth, take the sum of Equity from the balance sheet and subtract the “intangible assets”.These are assets that don’t physically exist like (patents, trademarks, goodwill etc). These items can be very valuable,however, unlike cash, building, machines, etc., they do not physically exist.
Why do banks track Tangible Net Worth?Banks are very concerned about protecting their downside risk with the ultimate risk being that client go bankrupt. Yourtangible net worth represents an amount that they could reasonably expect to recover if something unforeseen happens.Extracting value from intangible assets like trademarks, or goodwill from a bankrupt company typically isn’t feasibleregardless of how valuable they are. It is also a means to insure that there is a reasonable amount of cash in the business toprevent a future cash crunch, as cash withdraws by an owner have the effect of reducing equity and tangible net worth.

FY’12 Topline Rs. 200 Crs.
FY’12 Topline Rs. 100 Crs.
FY’12 Topline Rs. 500 Crs.
FY’14 Topline Rs.300 Crs.
FY’16 Topline Rs. 500 Crs.
FY’15 Topline Rs. 400 Crs.
FY’13 Topline Rs. 200 Crs.
FY’13 Topline Rs. 400 Crs.
FY’14 Topline Rs.300 Crs.
FY’15 Topline Rs. 200 Crs.
FY’16 Topline Rs. 100 Crs.
Sales Growth/ Turn Over is the company’s total revenue, bothinvoice, Cash Payments and other revenues.
It represents the value of goods and services provided to client /customers during a specified time period / accounting year (Apri’XXTo March’YY.
Sales turnover is identified to be of total revenue generated fromoperations / services / Work Order executed. Hence this doesn’tinclude gains from financial or other activities,(Interest Income onFixed deposits, gains on the sale of fixed assets, or the receipt ofpayments related to insurance claims, tax refund etc..) and these arereported as other income .
The amount of Sales Turn-over recognized by a company can vary,depending on whether it uses the accrual basis of accounting orthe cash basis. Revenue is recorded under the accrual basis whenunits are shipped or services provided, whereas revenue is recordedunder the cash basis when cash is received from customers (whichusually delays recognition, except when there is a prepayment).
Example:Year March-12 March-13 March-14 March-15 March-16
Audited Audited Audited Audited AuditedSales Turn over Rs. In Crs. 100 200 300 400 500Sales Growth% - 100% 50% 33% 25%
Sales Turn over Rs. In Crs. 500 400 300 200 100Sales Growth% - -20% -25% -33% -50%
Growth % Calculation : (Current year Sales / Previous Year Sales) -1*100
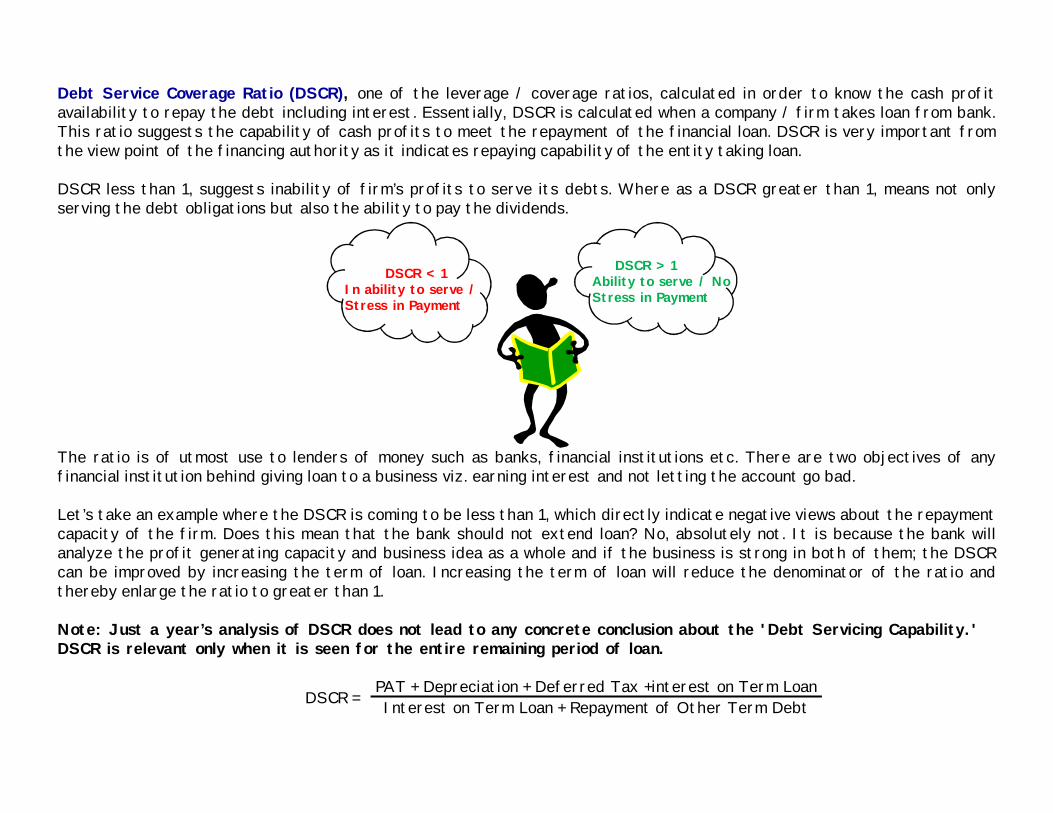
Debt Service Coverage Ratio (DSCR), one of the leverage / coverage ratios, calculated in order to know the cash profitavailability to repay the debt including interest. Essentially, DSCR is calculated when a company / firm takes loan from bank.This ratio suggests the capability of cash profits to meet the repayment of the financial loan. DSCR is very important fromthe view point of the financing authority as it indicates repaying capability of the entity taking loan.
DSCR less than 1, suggests inability of firm’s profits to serve its debts. Where as a DSCR greater than 1, means not onlyserving the debt obligations but also the ability to pay the dividends.
The ratio is of utmost use to lenders of money such as banks, financial institutions etc. There are two objectives of anyfinancial institution behind giving loan to a business viz. earning interest and not letting the account go bad.
Let’s take an example where the DSCR is coming to be less than 1, which directly indicate negative views about the repaymentcapacity of the firm. Does this mean that the bank should not extend loan? No, absolutely not. It is because the bank willanalyze the profit generating capacity and business idea as a whole and if the business is strong in both of them; the DSCRcan be improved by increasing the term of loan. Increasing the term of loan will reduce the denominator of the ratio andthereby enlarge the ratio to greater than 1.
Note: Just a year’s analysis of DSCR does not lead to any concrete conclusion about the 'Debt Servicing Capability.'DSCR is relevant only when it is seen for the entire remaining period of loan.
DSCR > 1Ability to serve / No Stress in Payment
DSCR < 1In ability to serve / Stress in Payment
DSCR = PAT + Depreciation + Deferred Tax +interest on Term LoanInterest on Term Loan + Repayment of Other Term Debt
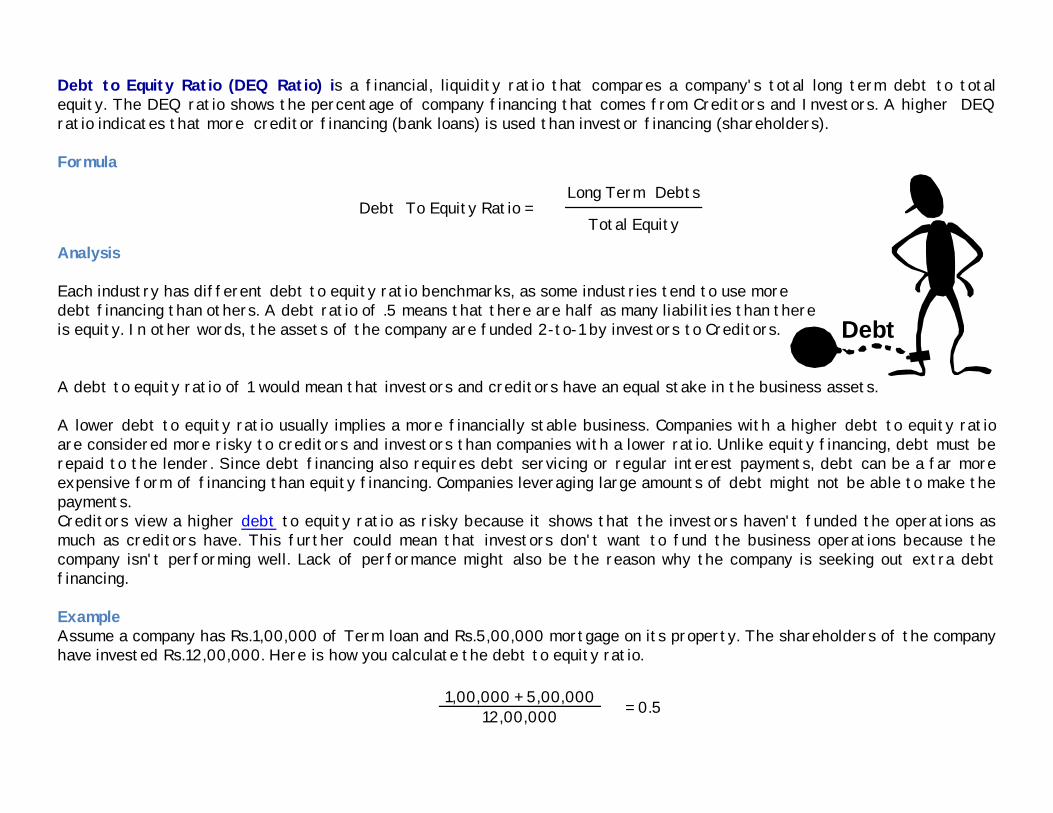
Debt To Equity Ratio =Long Term Debts
Total Equity
Debt to Equity Ratio (DEQ Ratio) is a financial, liquidity ratio that compares a company's total long term debt to totalequity. The DEQ ratio shows the percentage of company financing that comes from Creditors and Investors. A higher DEQratio indicates that more creditor financing (bank loans) is used than investor financing (shareholders).
Formula
Analysis
Each industry has different debt to equity ratio benchmarks, as some industries tend to use moredebt financing than others. A debt ratio of .5 means that there are half as many liabilities than thereis equity. In other words, the assets of the company are funded 2-to-1 by investors to Creditors.
A debt to equity ratio of 1 would mean that investors and creditors have an equal stake in the business assets.
A lower debt to equity ratio usually implies a more financially stable business. Companies with a higher debt to equity ratioare considered more risky to creditors and investors than companies with a lower ratio. Unlike equity financing, debt must berepaid to the lender. Since debt financing also requires debt servicing or regular interest payments, debt can be a far moreexpensive form of financing than equity financing. Companies leveraging large amounts of debt might not be able to make thepayments.Creditors view a higher debt to equity ratio as risky because it shows that the investors haven't funded the operations asmuch as creditors have. This further could mean that investors don't want to fund the business operations because thecompany isn't performing well. Lack of performance might also be the reason why the company is seeking out extra debtfinancing.
ExampleAssume a company has Rs.1,00,000 of Term loan and Rs.5,00,000 mortgage on its property. The shareholders of the companyhave invested Rs.12,00,000. Here is how you calculate the debt to equity ratio.
1,00,000 + 5,00,000 = 0.512,00,000
Debt`

Current Ratio is a liquidity ratio that measures the ability of a company to pay its current liabilities when they come due withonly quick assets. Quick assets are current assets that can be converted to cash within 30/60/90 days or in the short-term.Cash, cash equivalents, short-term investments or marketable securities, and current accounts receivable are consideredquick assets.
The quick ratio is often called the acid test ratio in reference to the historical use of acid to test metals for gold by theearly miners. If the metal passed the acid test, it was pure gold. If metal failed the acid test by corroding from the acid, itwas a base metal and of no value.
The acid test of finance shows how well a company can quickly convert its assets into cash in order toPay off its current liabilities. It also shows the level of quick assets to current liabilities.
Formula
Current Ratio = Cash + Cash Equivalents + Short Term Investments + Current ReceivablesCurrent Liabilities
Higher quick ratios are more favorable for companies because it shows there are more quick assets than current liabilities. Acompany with a quick ratio of 1 indicates that quick assets equal current assets. This also shows that the company could payoff its current liabilities without selling any long-term assets. Ratio of 2 shows that the company has twice as many currentassets than current liabilities.
Obviously, as the ratio increases so does the liquidity of the company. More assets will be easily converted into cash if needbe. This is a good sign for investors, but an even better sign to creditors because creditors want to know they will be paidback on time.Example
Cash: Rs.10,000Accounts Receivable: Rs.5,000Stock Investments: Rs.1,000Prepaid taxes: Rs.500Current Liabilities: Rs.5,000 10000+5000+1000-500 = 3.15000

EBITDA
This is a formula that plays into how much you can expect someone to pay for your business in the future. Code:
E = EarningsB = BeforeI = InterestT = TaxesD = DepreciationA = Amortization.
The higher the EBITDA margin value, the less operating expenses and the bigger company’s earnings are. An increasingEBITDA ratio indicates better performance of the company. A higher value would indicate that the company is able to keepits’ income at a sufficient level. Therefore it rather clearly indicates company’s operating profitability
This measure is also of interest to a company's creditors, since EBITDA is essentially the income that a company has freefor interest payments. In general, EBITDA is a useful measure only for large companies with significant assets, and/or forcompanies with a significant amount of debt financing. It is rarely a useful measure for evaluating a small company with nosignificant loans. Sometimes also called Operational Cash Flow.
EBITDA Level

A “Debtor” is a person or enterprise that owes money to another party. (The party to whom themoney is owed is often a supplier or bank that will be referred to as the Creditor.)
A “Creditor “is a person, bank, or other enterprise that has lent money or extended credit toanother party. (The party to whom the credit has been granted is often a customer that will nowbe referred to as a Debtor.)
Example: If Company X borrowed money from its bank, Company X is the Debtor and the bank isthe Creditor. If Supplier A sold merchandise to Retailer B, then Supplier A is the Creditor andRetailer B is the Debtor.
Creditor days is a measure of the number of days on average that a company requires to pay its creditors (accounts payable ),while Debtor days is a measure of the number of days on average that it takes a company to receive payment for what itsells. It is also called (accounts receivable) days.
Why They Are ImportantCreditor days is an indication of a company’s creditworthiness in the eyes of its suppliers and creditors, since it shows howlong they are willing to wait for payment. Within reason, the higher the number, the better because, all companies want toconserve cash. At the same time, a company that is especially slow to pay its bills (100 or more days, for example) may be acompany having trouble generating cash, or one trying to finance its operations with its suppliers’ funds. Ultimately,companies whose creditor days soar have trouble obtaining supplies.
Debtor days are determined to know, how long it takes an organization to receive payment from their Debtors. It is anindication of a company’s efficiency in collecting monies owed. In this case, obviously, the lower the number the better. Anespecially high number is a telltale sign of inefficiency or worse. It may indicate bad debts, dubious sales figures, or acompany being bullied by large customers out to improve their own cash position at another company’s expense. Customerswhose credit terms are abused also risk higher borrowing costs and related charges.
Dr. & Cr. Days = What They Measure ?

How They Work in Practice
To determine creditor days, divide the cumulative amount of unpaid suppliers’ bills (also called trade creditors) by sales, thenmultiply by 365. So the formula is:
Creditor days = Trade creditors ÷ Sales × 365For example, if suppliers’ bills total Rs.800,000 and sales are Rs.9,000,000, the calculation is:
800,000 ÷ 9,000,000 × 365 = 32.44 i.e. ( 32 days )The company takes 32 days on average to pay its bills.
To determine debtor days, divide the cumulative amount of accounts receivable ( also called Trade Debtors ) by sales, then multiply by 365.
Debtor days = Trade debtors ÷ Sales × 365For example, if accounts receivable total Rs. 600,000 and sales are Rs. 9,000,000, the calculation is:
600,000 ÷ 9,000,000 × 365 = 24.33 i.e. ( 24 days)The company takes 24 days on average to collect its debts.

Case Study
XXX Constructions Pvt.Ltd is a professionally managed Mining and Construction company specialized in over burden removaloperations and civil works. The company began its operations in the year 1984 as a proprietary concern and completed severalprojects in the railways as well as coal mining.
During FY’12, the company diversified its operations to Zambia (Africa) by establishing its fully owned subsidiary “XXXConstructions Zambia Ltd”.
Financial Position Summary - Analysis (Rs. In Crs.)Mar'13 Mar'14 Mar'15 Mar'16Audited Audited Audited Provisional
Net Sales 123.65 153.42 158.53 133.92Sales Growth% 24.08% 3.33% 15.52%Operating Profit 68.44 75.77 67.54 82.23Other Income 1.71 1.99 4 3.32PBDIT 70.15 77.76 71.54 85.55Depreciation 14.31 15.07 23.13 19.1Interest 1.93 0.96 4.75 4.98PBT 53.91 61.73 43.66 61.47PAT 36.39 40.44 29.55 41.15Cash Profit 49.63 54.74 49.52 59.56Operating Profit Margin% 55.35% 49.39% 42.60% 61.40%PBDIT Margin % 55.96% 50.04% 44.02% 62.34%PAT Margin% 29.03% 26.02% 18.18% 29.98%Tangible Networth(TNW) 86.65 126.31 149.61 190.1Total Term Liability 0.89 2.82 41.05 18.94Net Fixed Assets 62.77 82.3 123.44 103.87TOL (TTL+Current Liabilities) 16.53 31.05 70.67 67.49TOL/TNW 0.19 0.25 0.47 0.36TTL/TNW 0.01 0.02 0.27 0.1Current Ratio 2.1 1.2 0.59 0.67DSCR 26.72 30.11 7.17 12.96Debtor Days 12 34 46 48Creditor Days 32 52 46 82

•Sale of Products comprising: Export sale of machinery spare parts ref. to XXX constructions Zambia Ltd., regd inZambia.
•Sale of Services : OB Removal
•Other Operating Revenue: Machinery Lease Rentals along with other Interest Income etc.
FY 13 FY 14 FY 15 FY 16
Sale of Services 60.5 92.3 139.1 119.9Sale of Products 1.2 4.9 2 2.2Other Operating Revenue 67 70 41 28.6(-) Sevice Tax -5.1 -13.8 -23.4 -16.8
60.5
92.3
139.1119.9
1.2 4.9 2 2.2
67 70
4128.6
-5.1-13.8
-23.4 -16.8-40-20
020406080
100120140160
Income Breakup

Sales Growth/Turn Over
FY’15 topline of Rs. 159.53 Crs. against 153.42 Crs. in FY’14. YOY increment growth@ 3.33%. Major income ware generatedfrom Western Coal fields, Singareni Collieries co. forming part of OB removal amt. rs. 139.10 Crs. In apart rs. 41 Crs. Wasforming part of other operating income in the form of Machinery Lease rentals and other interest income. To note: 88% ofthe top line is from OB removal.
As per the provisional financials FY’16, company having booked top line of rs.133.92 Crs with drop in overall top line by15.52%. This includes drop in OB removal works a well ref. to machinery lease rentals and spare part sales. To observe, majorwork order being closed in Jan’16, post which client having waited for new works to be assigned. In ref. to XXX Constructions(Zambia)Ltd as this being a separate entity and inturn 90% of the work-order being executed…and fresh works being allottedrecently by Zambia govt.
Note: XXX Constructions Zambia being a separate entity with FY16 key topline of rs. 70 crs. Approx with no bebt as all themachinery being lease rented by XXX Constructions (India) and so forth the lease rentals / exp.
Share Capital, Tangible Networth and Gearing:
The TNW of the company increased from Rs. 51.34 Crs in Fy 12 to Rs. 149.61 Crs in FY15 and for FY 16 this if of rs. 190.10Crs as forms the base of retention of the whole profit amount in the business . Gearing for the company has improved from0.19 in FY13 to 0.47 in FY15.
Profitability
Though net revenue witnessed an increase of 3.33% in FY15, the PBDIT margin declined from50.04% in FY14 to 44.02% in FY15 mainly on account of rise in expenses relating to provision fordepreciation backed by increase in fixed assets through secured loans and its interest componentetc. Consequently PAT margin also declined to 18.18% in FY15 from 26.02% in FY14. How-ever asper provisional’s FY16, PBDIT margins increased to 62.34% and PAT to 29.98% basis of reductionin interest on loan component as well reduce in other operating expenses.

Other Long Term Liabilities
As on dt. Secured Term loan obligation of Rs. 38 Crs. Among which accounts worth rs. 19.49 Crs to be closed in next 13months. Further to note, rs. 14.06 Crs being the new addition of Secured Loan in FY16 funded by HDFC Bank and Rs. 6.54 Crsand rs 7.52 Crs by SREI in replace and sale of OLD fleet.
DSCR
The comfortable at 7.17x in FY15. This was down by 22.94x (FY-14) basis of the fact, client having procured additionalsecured loan exposure. How-ever this was improved to 12.96x in FY16(provisional) basis run-down of secured loan and otherinterest component as well increment growth in PAT and add back of same as Capital…improving TNW.
Dr. & Cr. Days: Both being of much comfort as client getting the bills realized with in 46 days. Further as of Mar’16receivables position stood at rs. 15.53 Crs and same being realized as on dt.
Liquidity
The company follows method of ploughing back of profit in the business @ 100%. Interest coverageratio of the company also stands good considering the service industry. The company has estimated itsliquidity at comfortable level at part with the last FY15. Current ratio was maintained at 0.59% in FY15Vs 1.20 in FY14. Major current liability comprising Creditors by rs. 14.59 crs, Interest on Term LoansRs. 17.07 Crs, Rs. 2.20 crs and rs. 3.13 Crs allocated towards provisions and other current liabilities. Asof FY’16, same being improved to 0.67x.

What to be collected / looked for at regular intervals {High Value exposures}
Latest Audited / Provisional Financial Statements
Year to date Turn over along with Latest Work Order / Book Order PositionLatest Debtors (Receivables Position) along with Ageing reportLatest Secured Loan PositionLatest Fund Based and Non Fund Based Limits along with Utilization Position
Billing reflecting Bank Statements
External Ratings…if any.
Certified Networth Statements of the Promoters
Industry / Mkt. Peers performance understanding reports
Repayment Performance - Competitor Mkt. Feed back
Overall Industry Out-look (Local/Domestic/State/National / International) in ref. to Social, Political, Economic factors at large.

20Prashanth Ravada