Embed Size (px)
Citation preview
Business Update and Product StrategySeptember 15, 2005
IAA 2005 Automotive Conference
R
2
R
Bob RossiterChairman and CEO
3
R
Outline of Presentation
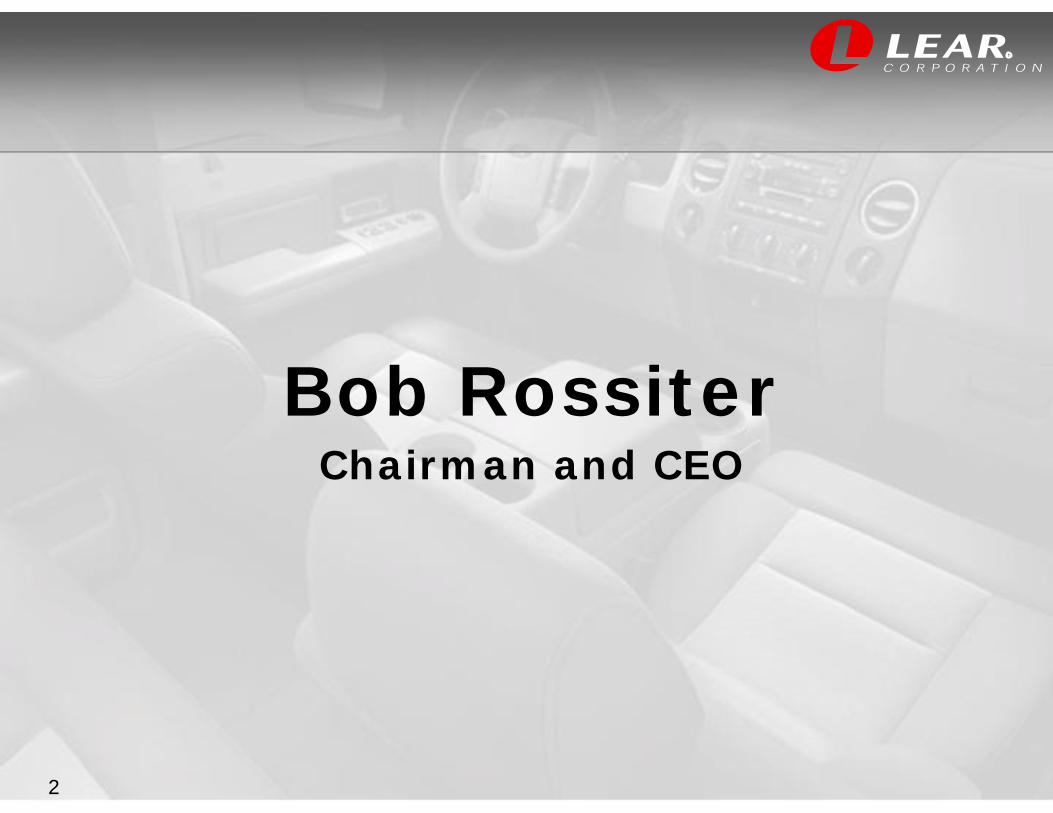
Bob Rossiter, Chairman and CEOBusiness and Financial UpdateOverview of Product Strategy
Dave Wajsgras, Executive Vice President and CFOInterior Products Strategy
Jim Vandenberghe, Vice ChairmanIndustry TrendsSeating Systems StrategyElectrical / Electronics Systems StrategySummary
4
R
Business and Financial Update
Implementing global restructuring plan -- overall restructuring framework unchanged
Working with customers and suppliers to achieve a balanced pricing model
Evaluating strategic options for interiors business, including potential joint venture partnerships
Despite near-term industry challenges, we remain committed to maintaining a strong and flexible financial position
5
R
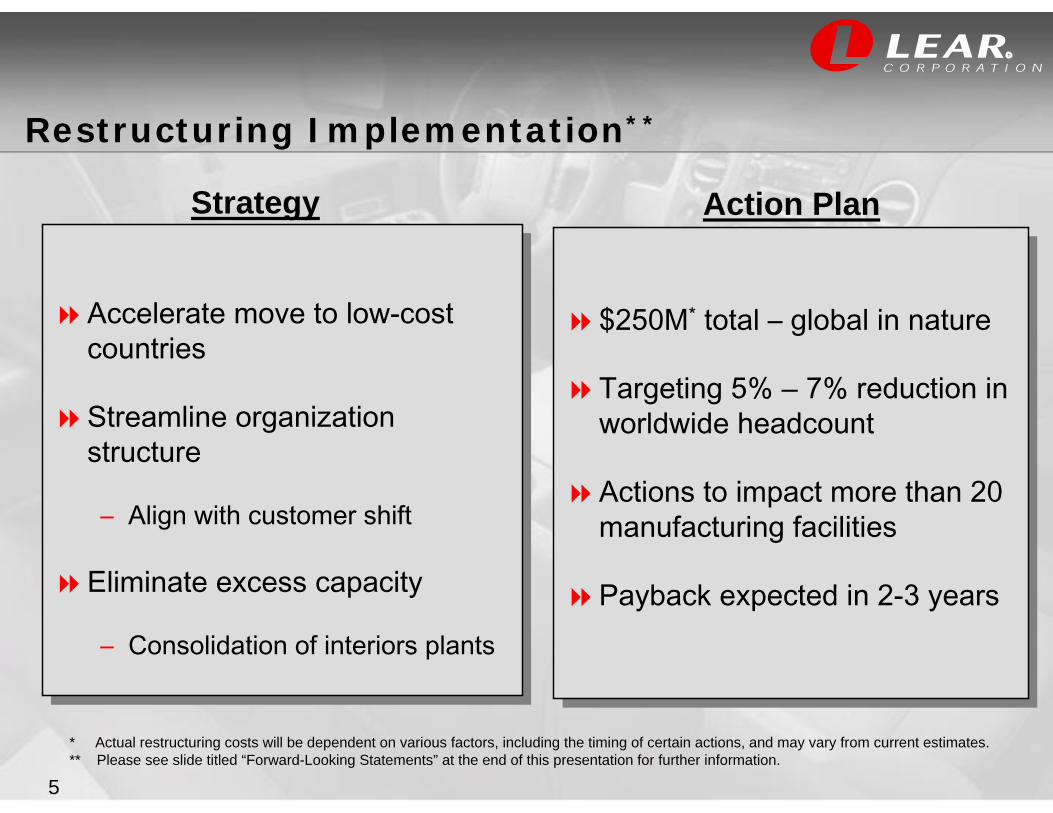
$250M* total – global in nature
Targeting 5% – 7% reduction in worldwide headcount
Actions to impact more than 20 manufacturing facilities
Payback expected in 2-3 years
$250M* total – global in nature
Targeting 5% – 7% reduction in worldwide headcount
Actions to impact more than 20 manufacturing facilities
Payback expected in 2-3 years
Restructuring Implementation**
* Actual restructuring costs will be dependent on various factors, including the timing of certain actions, and may vary from current estimates.** Please see slide titled “Forward-Looking Statements” at the end of this presentation for further information.
Accelerate move to low-cost countries
Streamline organization structure
– Align with customer shift
Eliminate excess capacity
– Consolidation of interiors plants
Accelerate move to low-cost countries
Streamline organization structure
– Align with customer shift
Eliminate excess capacity
– Consolidation of interiors plants
Action PlanStrategy
6
R
Working to Address Supply Chain Issues
Continued distress within tier II and tier III supply base
Raw materials remain at high levels with signs of potential increases. . . Hurricane Katrina impact?
Leveraging best-in-class purchasing practices
– Affordable cost structure
– Cost Technology Optimization process
– Accelerating move to low-cost countries
Leveraging BestLeveraging Best--InIn--Class Purchasing Class Purchasing Practices And Working With Customers Practices And Working With Customers
And Suppliers To Achieve A Balanced Pricing Model And Suppliers To Achieve A Balanced Pricing Model
7
R
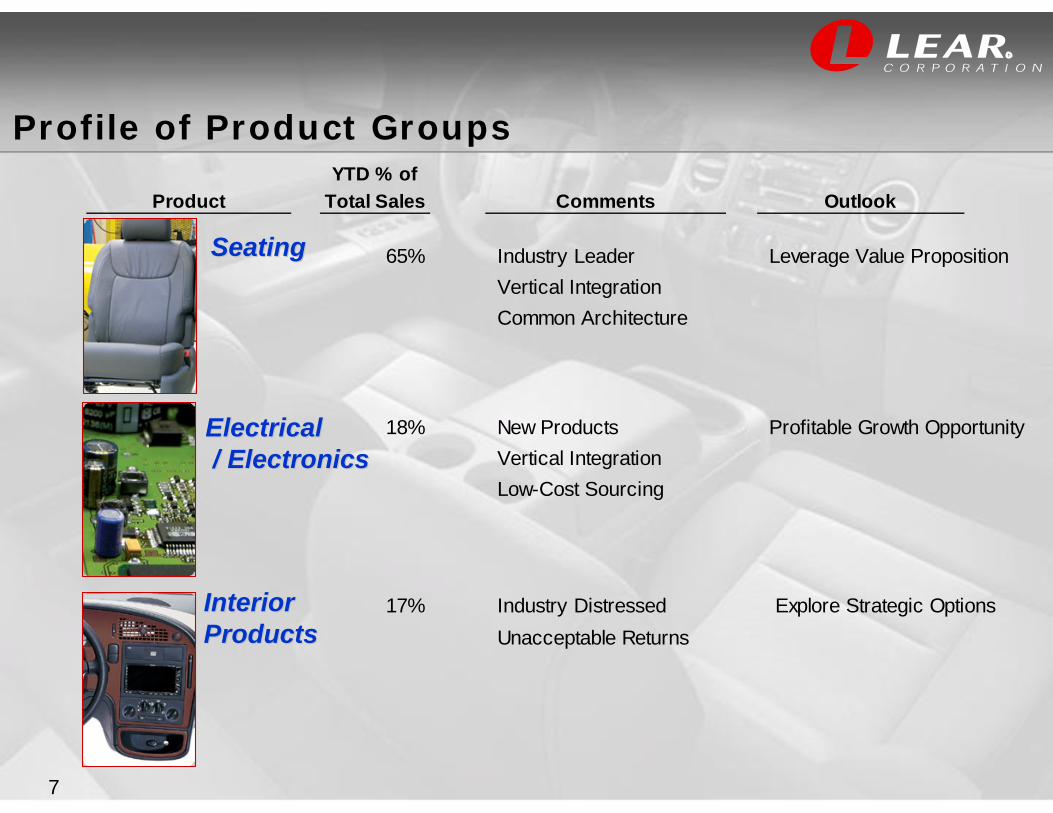
Profile of Product GroupsYTD % of
Product Total Sales Comments Outlook
65% Industry Leader Leverage Value PropositionVertical IntegrationCommon Architecture
18% New Products Profitable Growth OpportunityVertical IntegrationLow-Cost Sourcing
17% Industry Distressed Explore Strategic OptionsUnacceptable Returns
SeatingSeating
ElectricalElectrical/ Electronics/ Electronics
InteriorInteriorProductsProducts
8
R
Lear to Remain Focused on Growing Seating and Electrical/Electronics Systems
Ample opportunity to create shareholder value within automotive industry
Non-traditional Big Three* customer mix now about 50% of total and growing steadily
New product opportunities in Seating and Electrical / Electronics Systems
Regional diversification into Asia
* Excludes affiliates of GM (other than Opel), Ford and DaimlerChrysler.
9
R
Status of Interior Product Group
Establishing a “stand-alone” unit within Lear Corporation, reporting to the CFO
Will interface with customers, suppliers and labor directly and independently
Evaluating all strategic options while implementing restructuring actions to improve capacity utilization and overall competitiveness
Finding an optimal solution is complex
This Segment Of The Industry Is In Distress This Segment Of The Industry Is In Distress And Requires An Improved Business ModelAnd Requires An Improved Business Model
10
R
Near-Term Business Assessment*
Industry conditions remain challenging
Implementation of global restructuring continues
Streamlined organization now in place
Actively addressing supply chain challenges
Opportunities for profitable growth in Seating and Electrical / Electronics Systems
Evaluating a new business model for Interior Products
* Please see slide titled “Forward-Looking Statements” at the end of this presentation for further information.
11
R
Dave WajsgrasExecutive Vice President and CFO
12
R
Status of Interior Products Market
Business characteristics– Industry overcapacity
– High raw material costs
– Insufficient pricing
Unacceptable financial performance – Financial returns have continued to decline
– Several key players are in bankruptcy or a loss position
OEMs now retaining total integrator responsibilities
This Segment Is Distressed And Requires This Segment Is Distressed And Requires An Improved Business ModelAn Improved Business Model
13
R
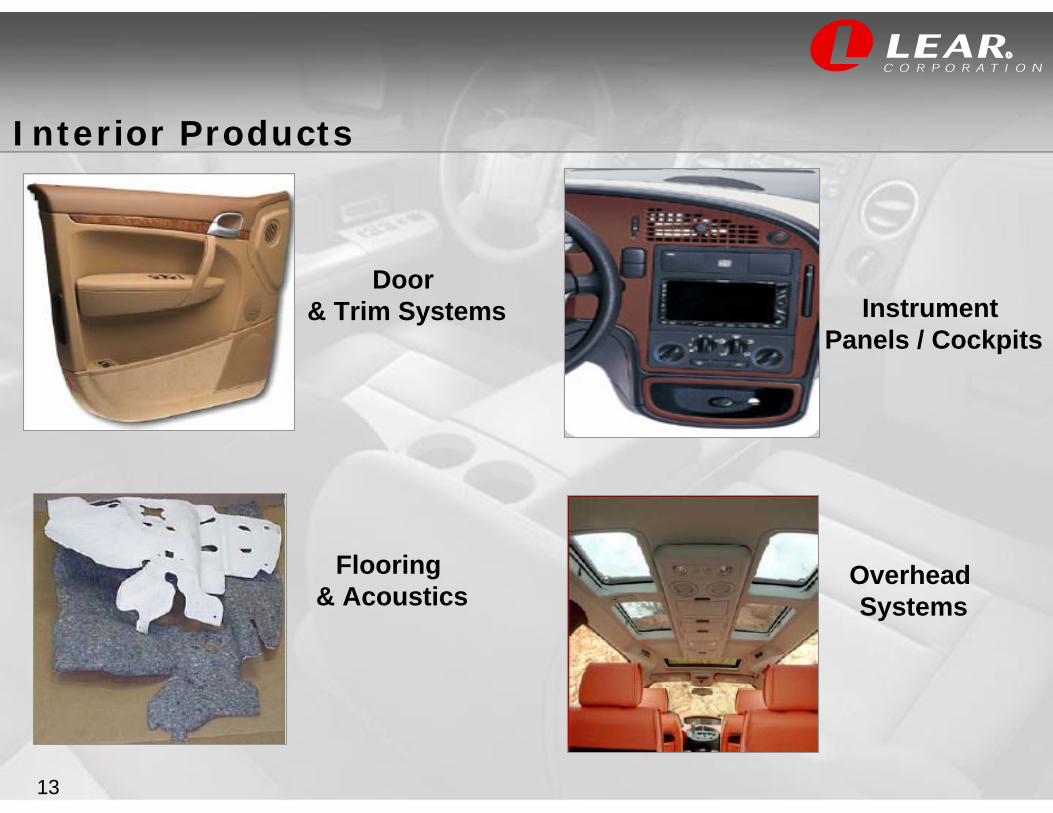
Flooring & Acoustics
Door & Trim Systems
Overhead Systems
Instrument Panels / Cockpits
Interior Products
14
R
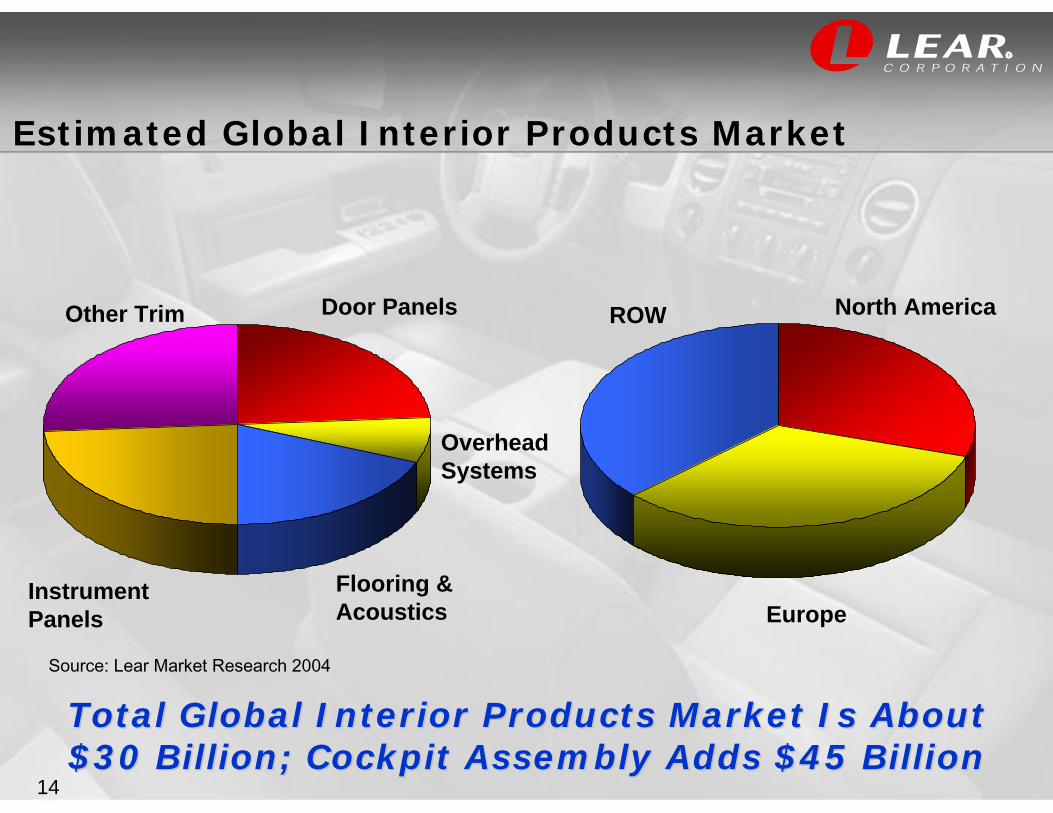
Estimated Global Interior Products Market
Total Global Interior Products Market Is About Total Global Interior Products Market Is About $30 Billion; Cockpit Assembly Adds $45 Billion$30 Billion; Cockpit Assembly Adds $45 Billion
Flooring & Acoustics
Instrument Panels
Other Trim
Overhead Systems
North AmericaROW
Europe
Door Panels
Source: Lear Market Research 2004
15
R
Interiors Business Description
Lear’s Interior Systems Division is headquartered in Dearborn, MI
Built significantly from acquisitions
Facilities: 44 manufacturing facilities in the US, Canada, Mexico, Eastern and Western Europe
Employees: ~19,000
– Hourly ~16,000; Salaried ~3,000
Global sales of about $3 billion
16
R
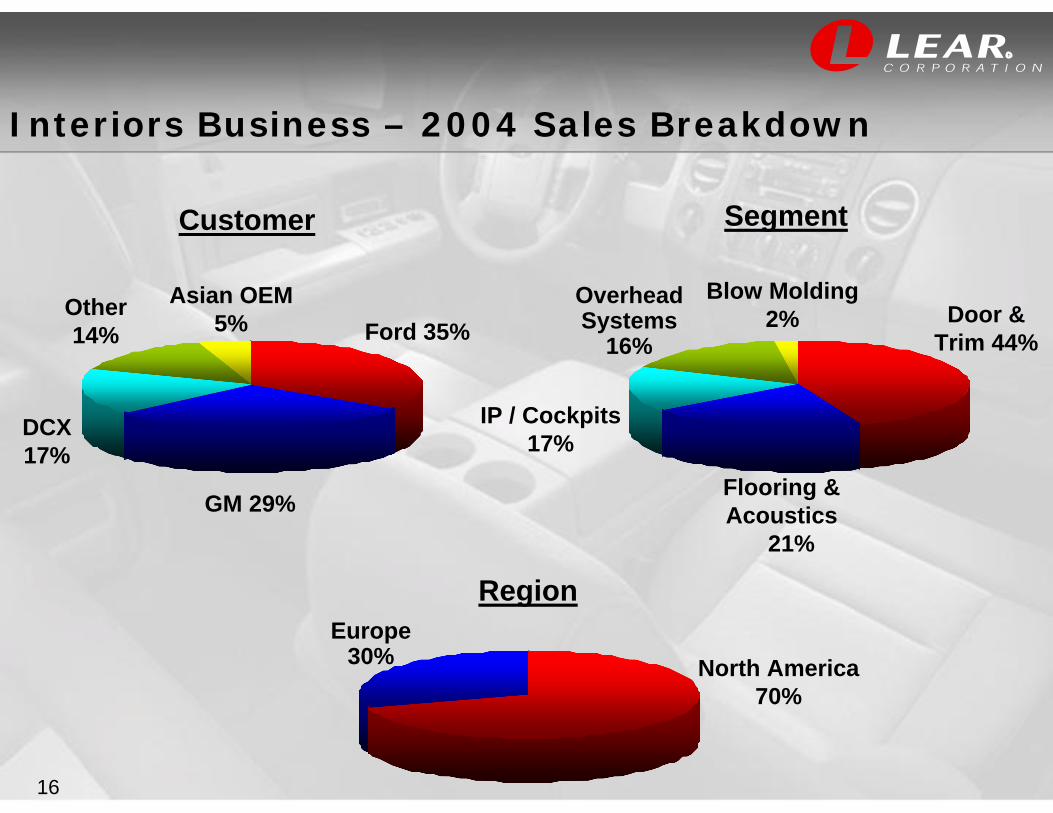
Interiors Business – 2004 Sales Breakdown
Customer
Ford 35%Other14%
GM 29%
Asian OEM 5%
DCX 17%
Segment
Door & Trim 44%
IP / Cockpits 17%
Overhead Systems
16%
Region
North America 70%
Europe 30%
Blow Molding 2%
Flooring & Acoustics
21%
17
R
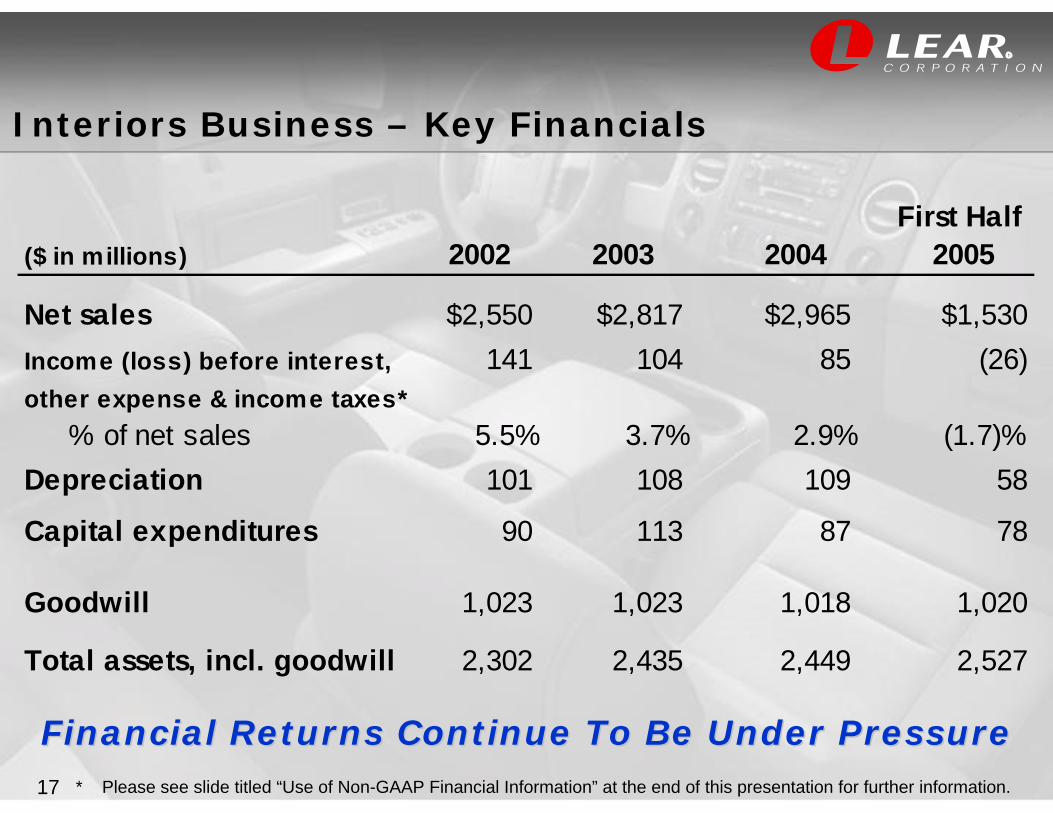
Interiors Business – Key Financials
First Half($ in millions) 2002 2003 2004 2005
Net sales $2,550 $2,817 $2,965 $1,530Income (loss) before interest, 141 104 85 (26)other expense & income taxes* % of net sales 5.5% 3.7% 2.9% (1.7)%Depreciation 101 108 109 58
Capital expenditures 90 113 87 78
Goodwill 1,023 1,023 1,018 1,020
Total assets, incl. goodwill 2,302 2,435 2,449 2,527
Financial Returns Continue To Be Under PressureFinancial Returns Continue To Be Under Pressure* Please see slide titled “Use of Non-GAAP Financial Information” at the end of this presentation for further information.
18
R
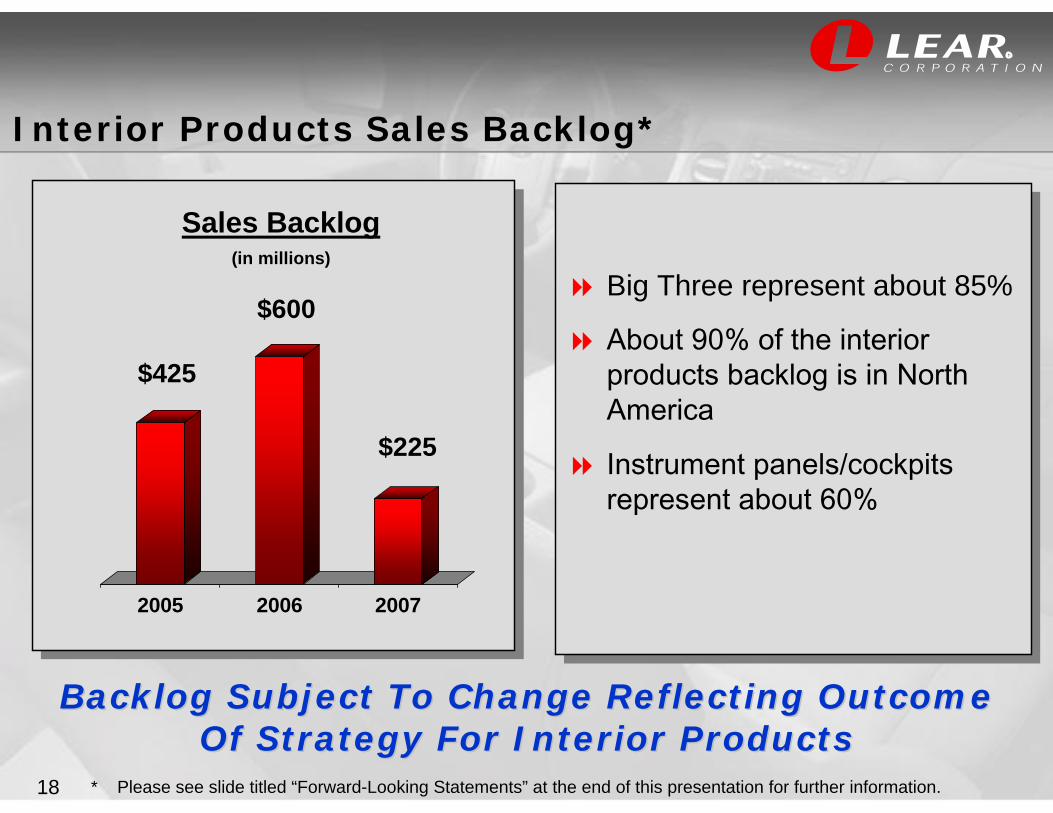
2005 2006 2007
Interior Products Sales Backlog*
Backlog Subject To Change Reflecting Outcome Backlog Subject To Change Reflecting Outcome Of Strategy For Interior Products Of Strategy For Interior Products
Big Three represent about 85%
About 90% of the interior products backlog is in North America
Instrument panels/cockpits represent about 60%
Big Three represent about 85%
About 90% of the interior products backlog is in North America
Instrument panels/cockpits represent about 60%
Sales Backlog(in millions)
$425
$600
$225
* Please see slide titled “Forward-Looking Statements” at the end of this presentation for further information.
19
R
Near-Term Plan*
Expand and accelerate operational restructuring– Improve or re-source low return programs / components– Eliminate excess and inefficient manufacturing capacity
Explore and pursue various strategic options– Global, regional and product line alternatives– Financial partners – co-invest in improvement
plan / value enhancement– Joint venture relationships / consolidation strategy –
operational synergies; achieve greater economies of scale
* Please see slide titled “Forward-Looking Statements” at the end of this presentation for further information.
20
R
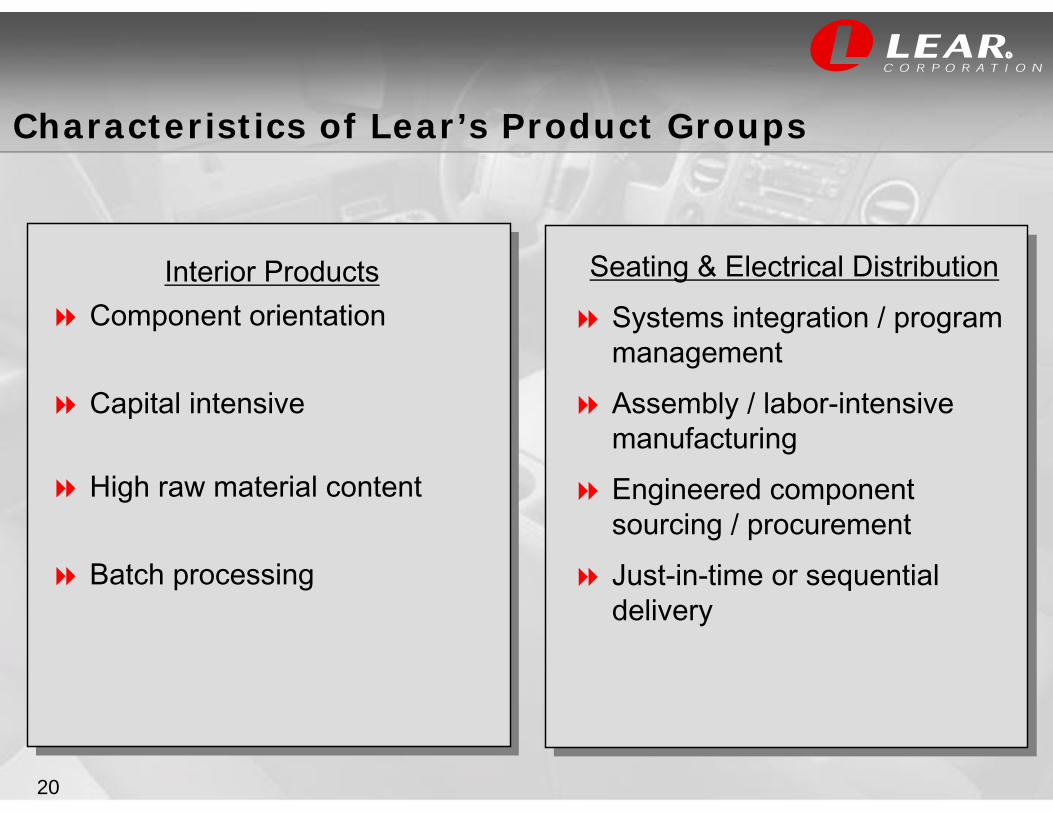
Characteristics of Lear’s Product Groups
Seating & Electrical DistributionSystems integration / program managementAssembly / labor-intensive manufacturingEngineered component sourcing / procurementJust-in-time or sequential delivery
Interior ProductsComponent orientation
Capital intensive
High raw material content
Batch processing
21
R
Jim Vandenberghe Vice Chairman
22
R
Industry Trends
Consumers demanding more interior features
Automakers focused on world-class interiors and “Perceptual Quality”
Emphasis on the interior in automotive advertising
Seating and electronic features are a priority to customers and central to the vehicle interior
23
R
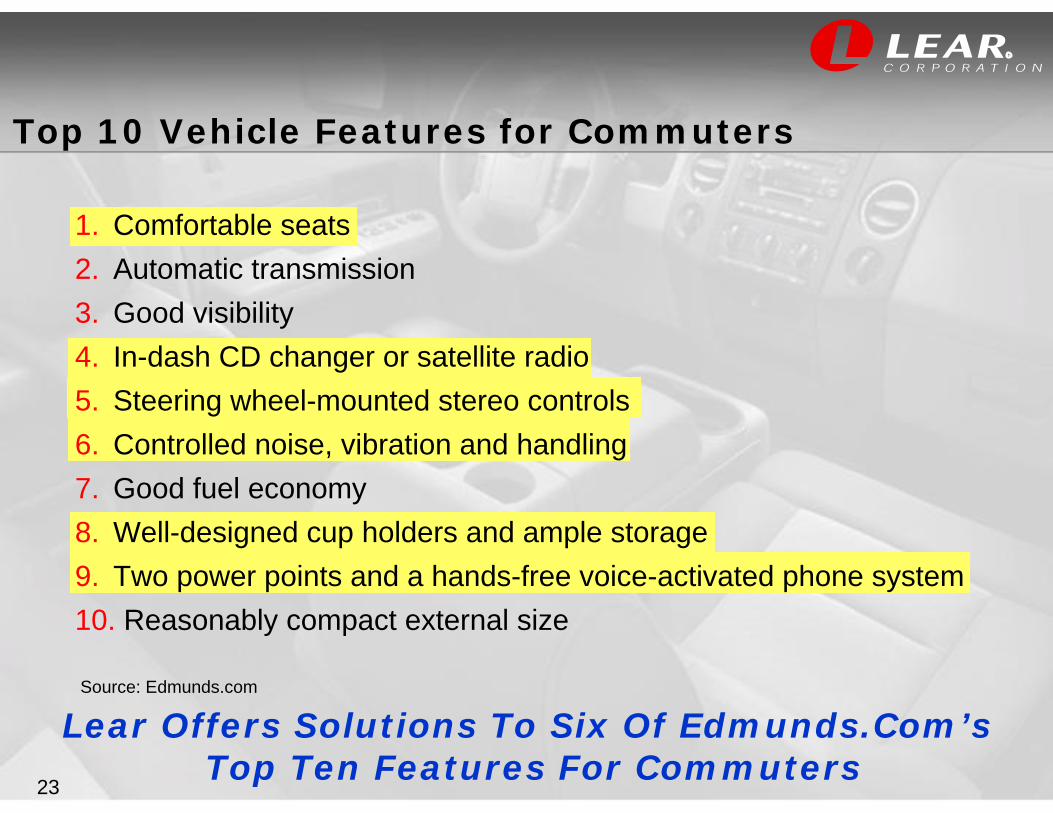
1. Comfortable seats 2. Automatic transmission 3. Good visibility 4. In-dash CD changer or satellite radio 5. Steering wheel-mounted stereo controls 6. Controlled noise, vibration and handling 7. Good fuel economy 8. Well-designed cup holders and ample storage 9. Two power points and a hands-free voice-activated phone system 10. Reasonably compact external size
Top 10 Vehicle Features for Commuters
Source: Edmunds.com
Lear Offers Solutions To Six Of Edmunds.Com’s Top Ten Features For Commuters
24
R
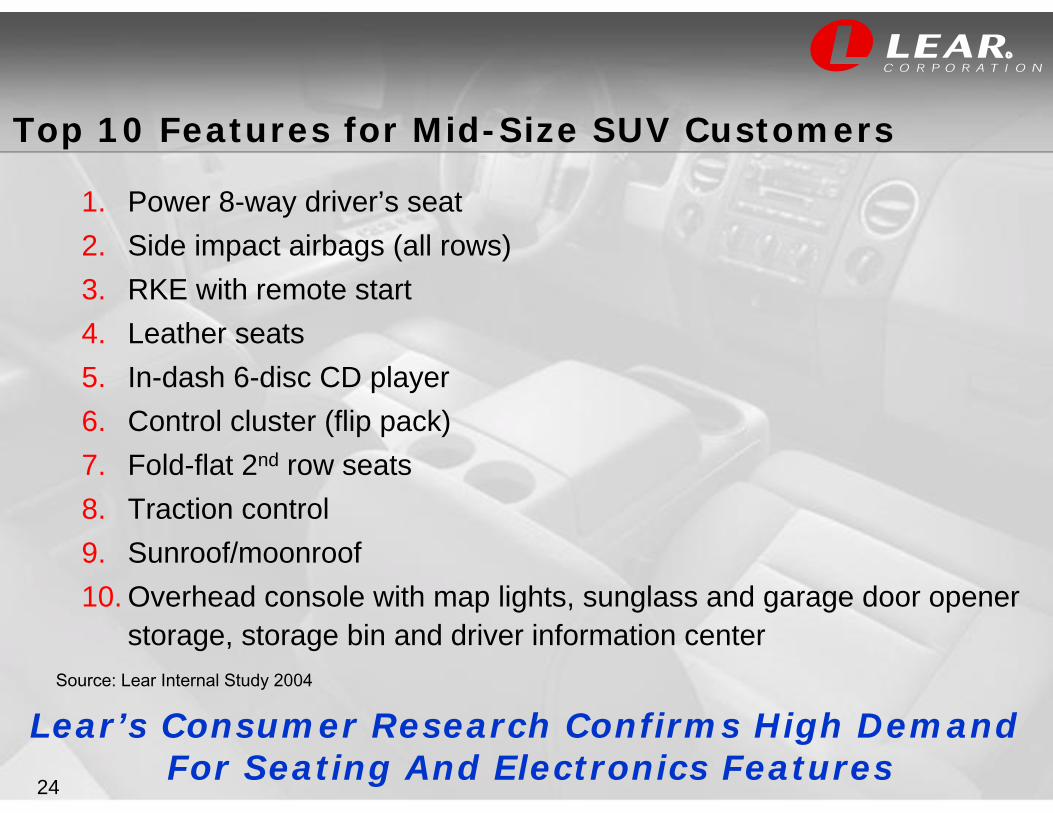
1. Power 8-way driver’s seat2. Side impact airbags (all rows)3. RKE with remote start4. Leather seats5. In-dash 6-disc CD player6. Control cluster (flip pack)7. Fold-flat 2nd row seats 8. Traction control 9. Sunroof/moonroof 10. Overhead console with map lights, sunglass and garage door opener
storage, storage bin and driver information center
Top 10 Features for Mid-Size SUV Customers
Lear’s Consumer Research Confirms High Demand For Seating And Electronics Features
Source: Lear Internal Study 2004
25
R
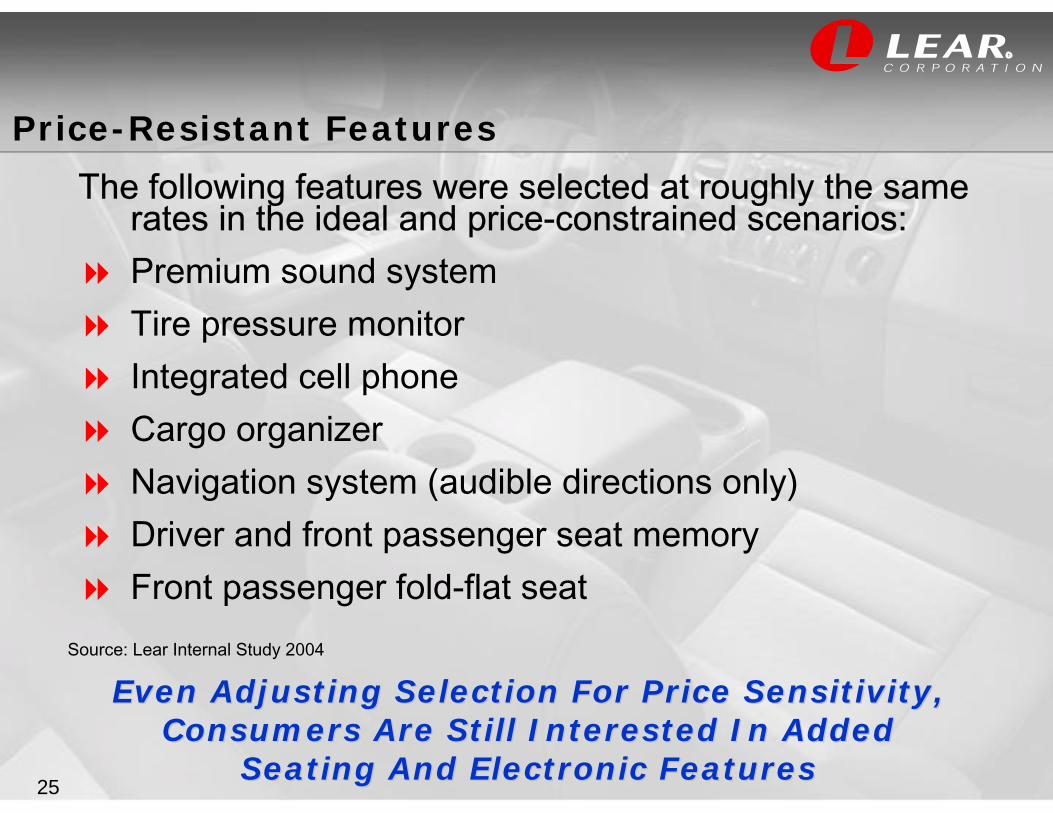
The following features were selected at roughly the same rates in the ideal and price-constrained scenarios:Premium sound systemTire pressure monitorIntegrated cell phoneCargo organizerNavigation system (audible directions only)Driver and front passenger seat memoryFront passenger fold-flat seat
Price-Resistant Features
Even Adjusting Selection For Price Sensitivity, Even Adjusting Selection For Price Sensitivity, Consumers Are Still Interested In Added Consumers Are Still Interested In Added
Seating And Electronic FeaturesSeating And Electronic Features
Source: Lear Internal Study 2004
26
R
Priority Emphasis on the Interior
“(In the) Interior is where you spend all of your time. It makes total sense to me to want to get it right.”J Mays, Ford
“Interiors are an area of huge focus for General Motors.”Bob Lutz, GM
“For us, the interior has always been a priority of design.”Helmut Panke, BMW
27
R
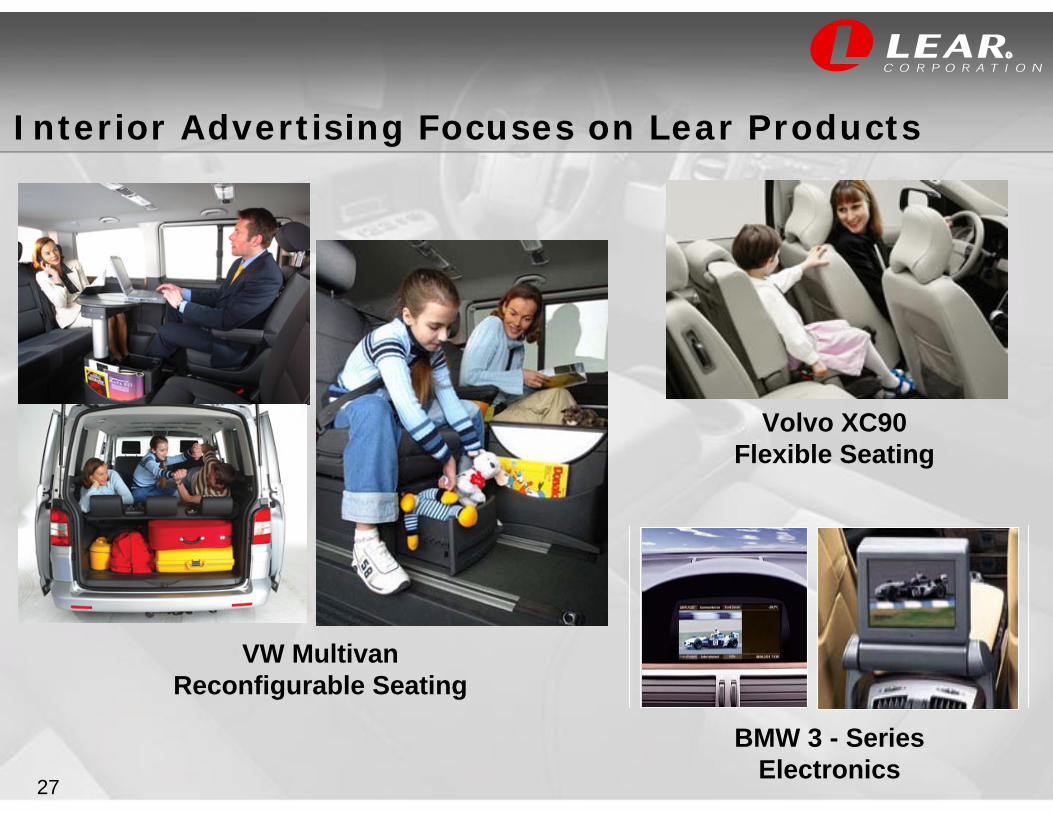
Interior Advertising Focuses on Lear Products
BMW 3 - Series Electronics
VW MultivanReconfigurable Seating
Volvo XC90Flexible Seating
28
R
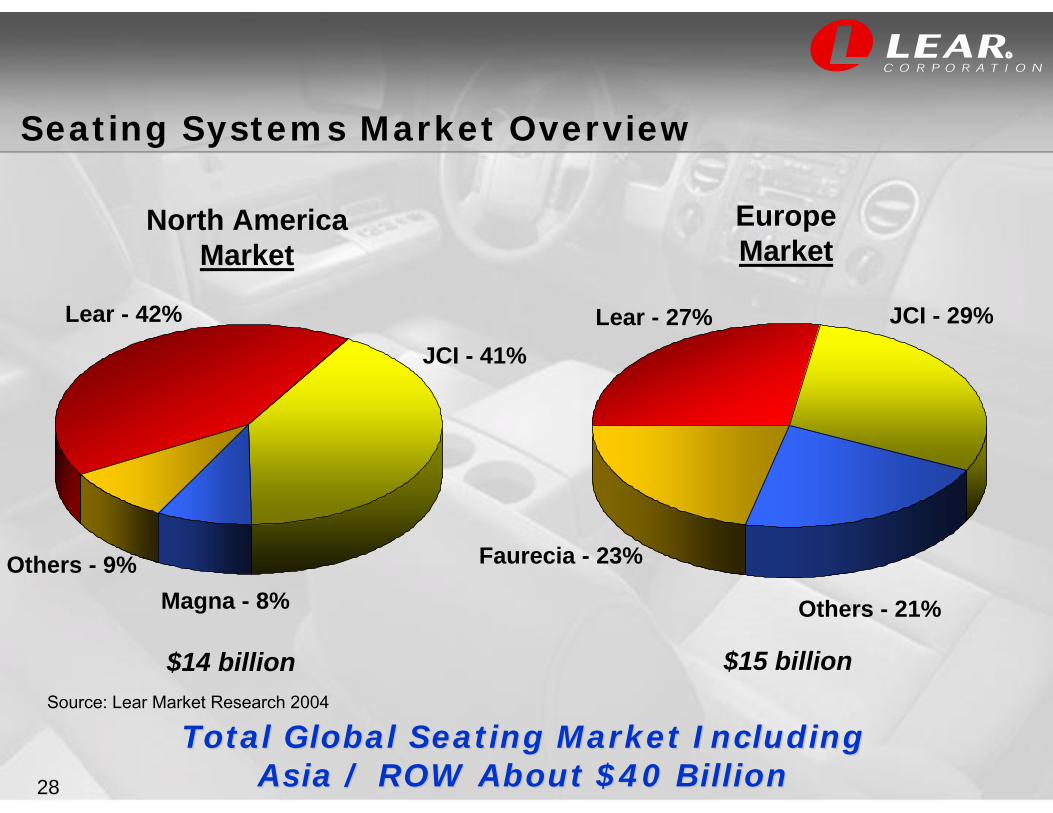
Seating Systems Market Overview
Lear - 27%
Others - 9%
Lear - 42%
Magna - 8%
JCI - 41%JCI - 29%
North AmericaMarket
EuropeMarket
Faurecia - 23%
Others - 21%
$15 billion$14 billion
Total Global Seating Market Including Total Global Seating Market Including Asia / ROW About $40 BillionAsia / ROW About $40 Billion
Source: Lear Market Research 2004
29
R
Seating Systems Strategy*
Strong growth in Asia
– New backlog growth in 2005
– Targeted programs with GM, VW/Audi, Proton and Tata
Selective vertical integration (foam, mechanisms and trim)
Global growth opportunities with new products that provide flexible seating configurations
Leverage reputation as the highest quality seat manufacturer supplying multiple automakers
Opportunity For Global Growth, Opportunity For Global Growth, With Emphasis On Asia And With Asian AutomakersWith Emphasis On Asia And With Asian Automakers
* Please see slide titled “Forward-Looking Statements” at the end of this presentation for further information.
30
R
Seating Systems Strategy – New Technology
World leader in high performance seating systems in premium vehicles– Porsche, GM, Ford, Mercedes, BMW, Ferrari, Jaguar
– Supports fuel economy initiatives
Leverage common architecture strategy
Protec Plus provides passenger support during collisions
Introduce greater seating flexibility options– Thin profile flexible bolster seating and stadium slide seating
system provide product necessary for the growing cross-over vehicle segment
Capitalize On New Technology And Product AdvantagesCapitalize On New Technology And Product Advantages
31
R
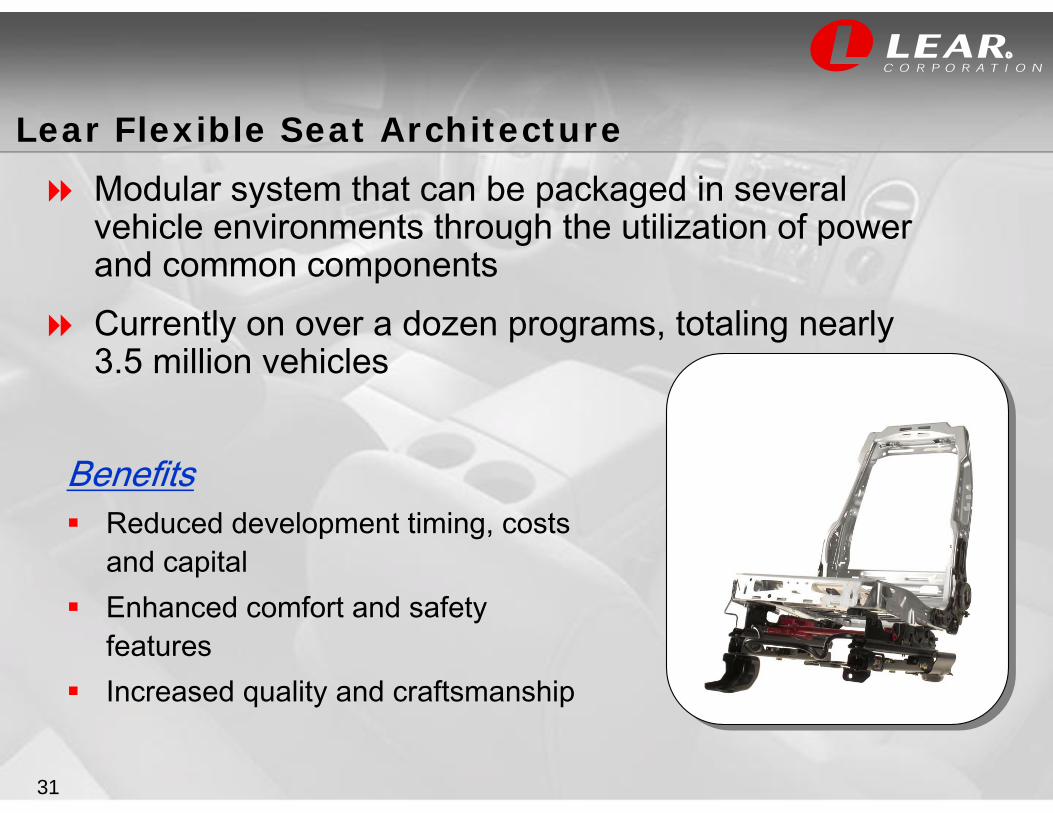
Lear Flexible Seat Architecture
Modular system that can be packaged in several vehicle environments through the utilization of power and common componentsCurrently on over a dozen programs, totaling nearly 3.5 million vehicles
BenefitsReduced development timing, costs and capitalEnhanced comfort and safety featuresIncreased quality and craftsmanship
32
R
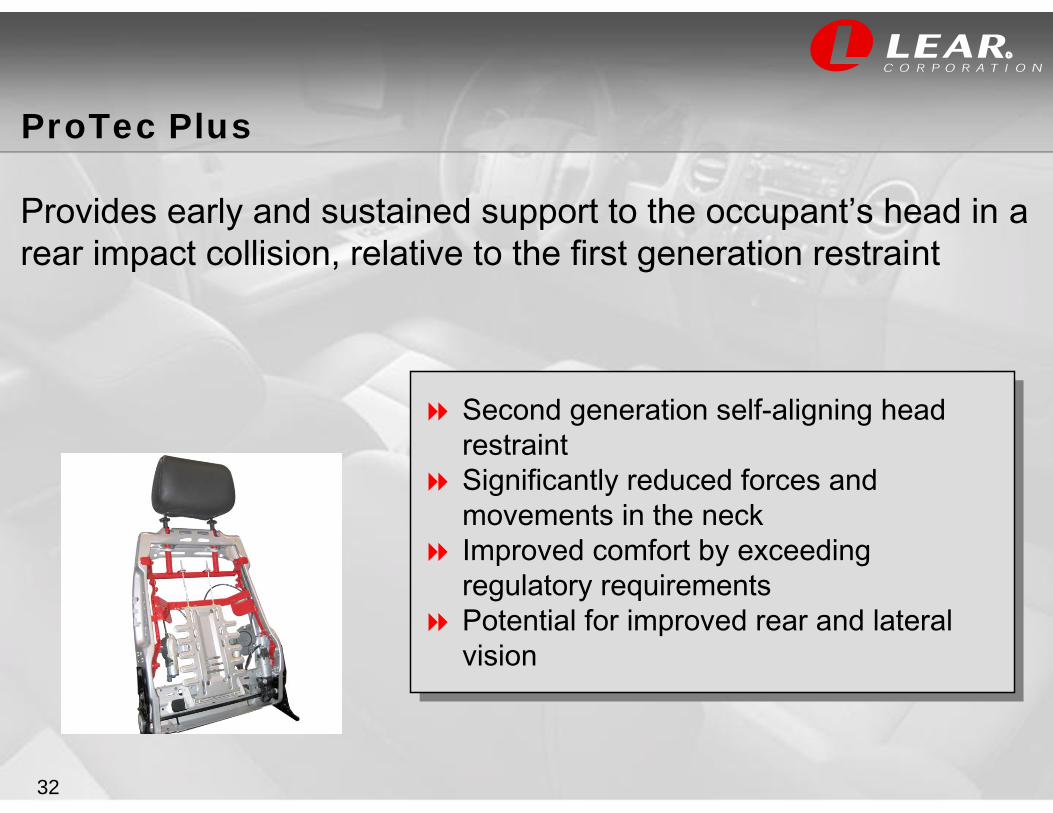
Second generation self-aligning head restraintSignificantly reduced forces and movements in the neckImproved comfort by exceeding regulatory requirements Potential for improved rear and lateral vision
Second generation self-aligning head restraintSignificantly reduced forces and movements in the neckImproved comfort by exceeding regulatory requirements Potential for improved rear and lateral vision
ProTec Plus
Provides early and sustained support to the occupant’s head in a rear impact collision, relative to the first generation restraint
33
R
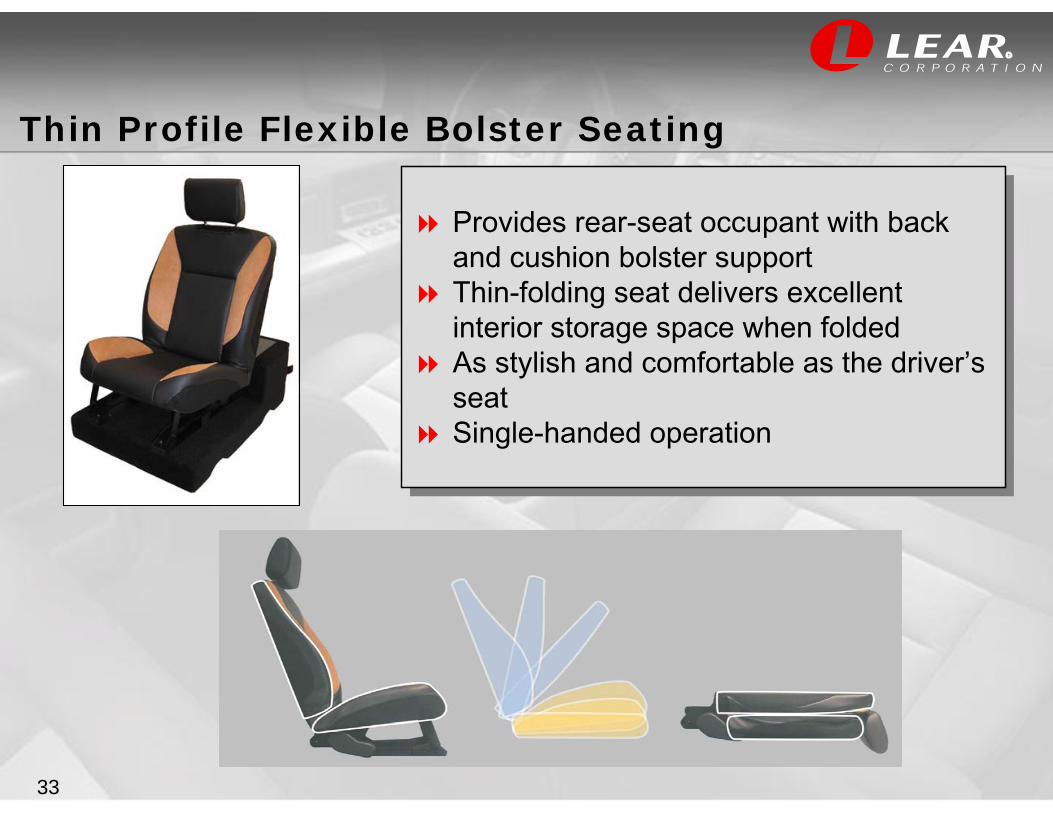
Provides rear-seat occupant with back and cushion bolster supportThin-folding seat delivers excellent interior storage space when foldedAs stylish and comfortable as the driver’s seatSingle-handed operation
Provides rear-seat occupant with back and cushion bolster supportThin-folding seat delivers excellent interior storage space when foldedAs stylish and comfortable as the driver’s seatSingle-handed operation
Thin Profile Flexible Bolster Seating
34
R
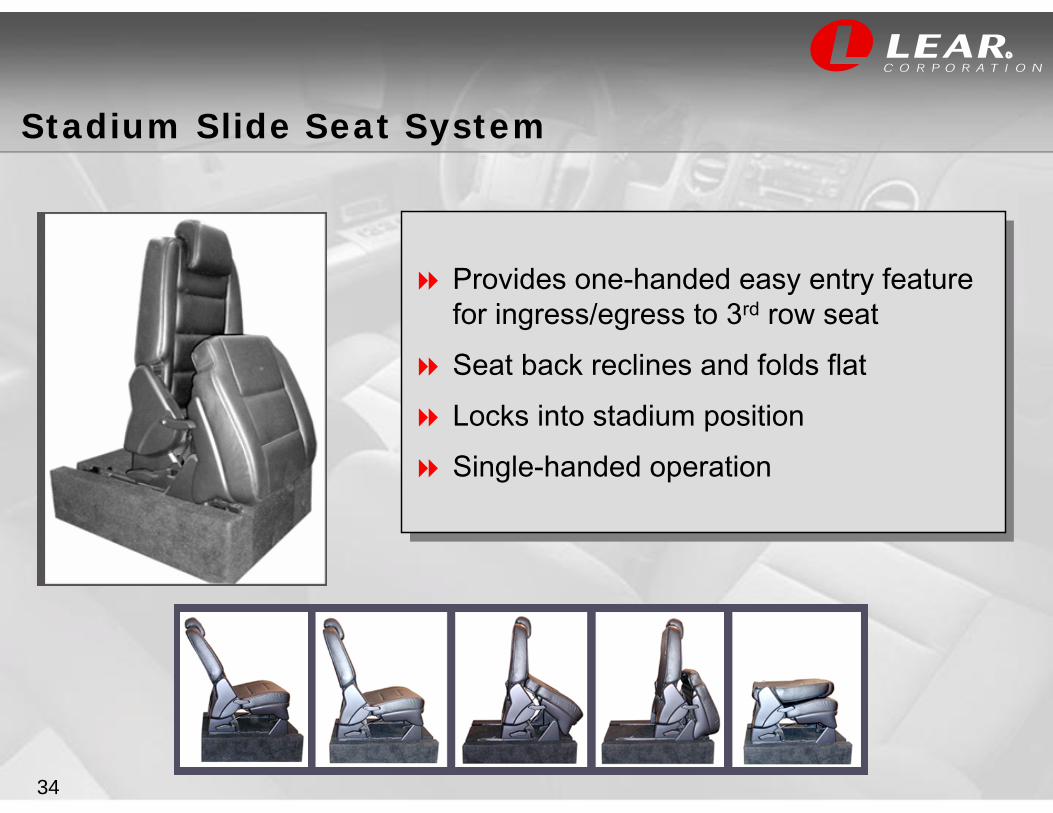
Provides one-handed easy entry feature for ingress/egress to 3rd row seat Seat back reclines and folds flatLocks into stadium positionSingle-handed operation
Provides one-handed easy entry feature for ingress/egress to 3rd row seat Seat back reclines and folds flatLocks into stadium positionSingle-handed operation
Stadium Slide Seat System
35
R
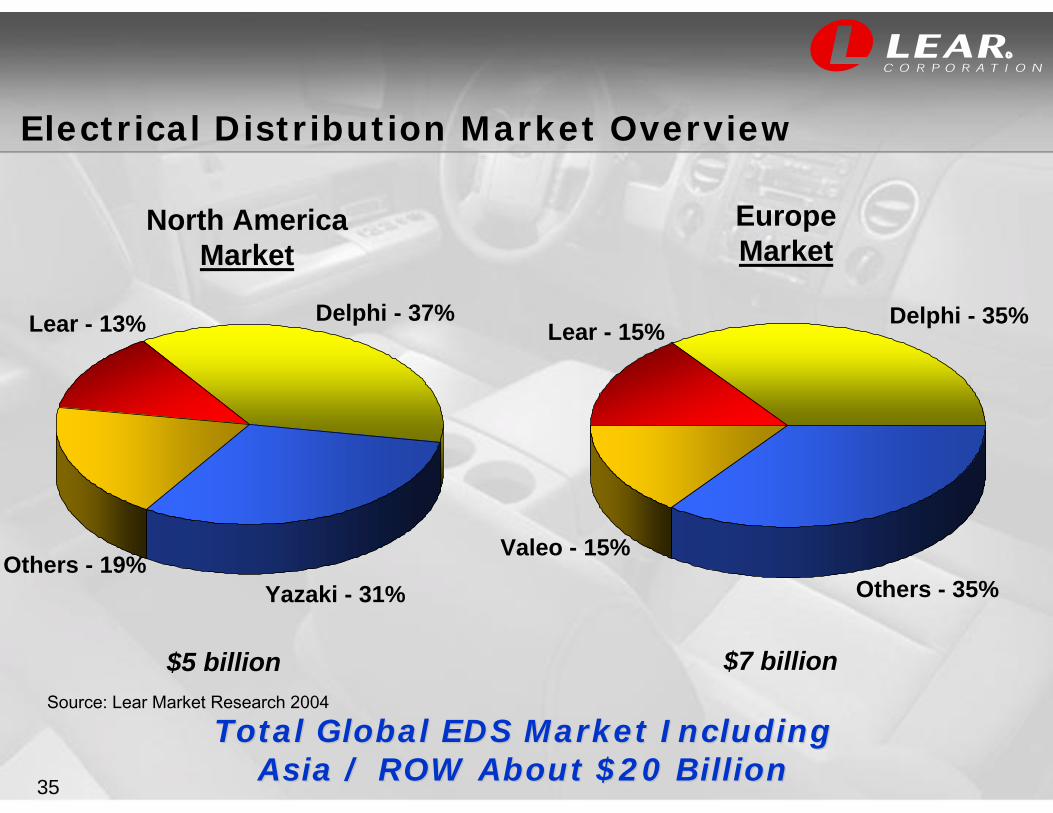
Electrical Distribution Market Overview
Lear - 15%
Others - 19%
Lear - 13%
Yazaki - 31%
Delphi - 37% Delphi - 35%
North AmericaMarket
EuropeMarket
Valeo - 15%
Others - 35%
$7 billion$5 billion
Total Global EDS Market Including Total Global EDS Market Including Asia / ROW About $20 BillionAsia / ROW About $20 Billion
Source: Lear Market Research 2004
36
R
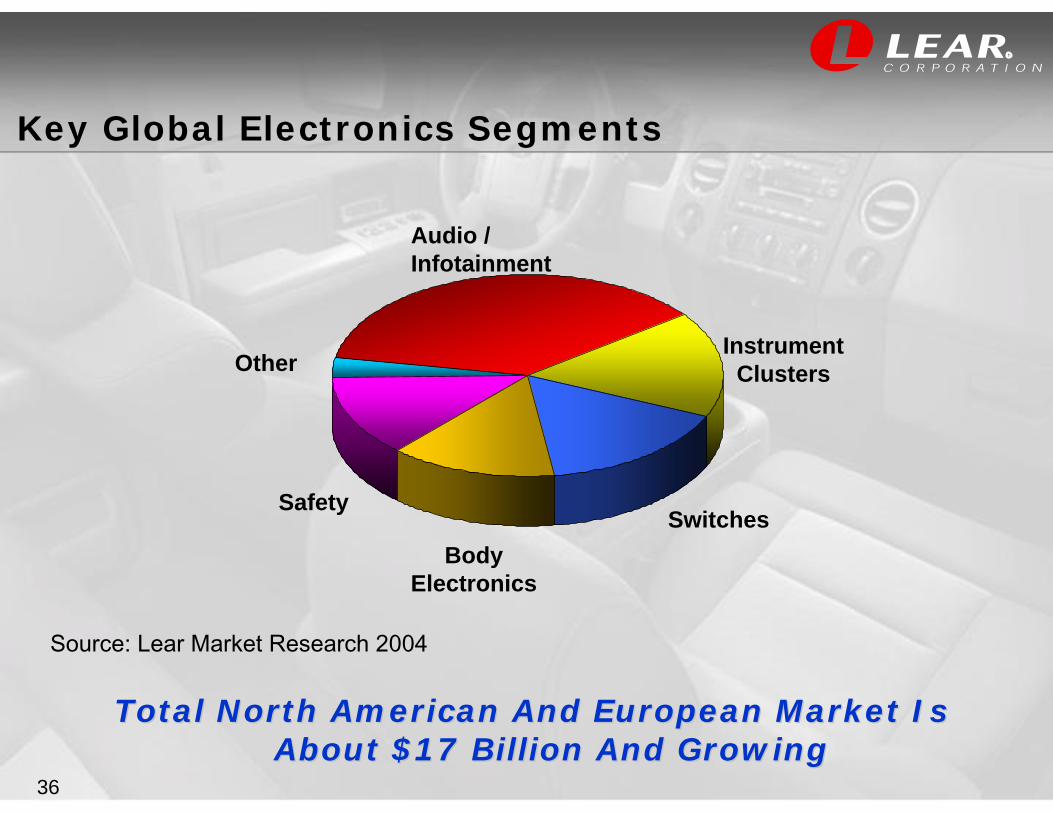
Key Global Electronics Segments
Total NorthTotal North American And European Market Is American And European Market Is About $17 Billion And GrowingAbout $17 Billion And Growing
Instrument Clusters
Audio / Infotainment
SwitchesBody
Electronics
Safety
Other
Source: Lear Market Research 2004
37
R
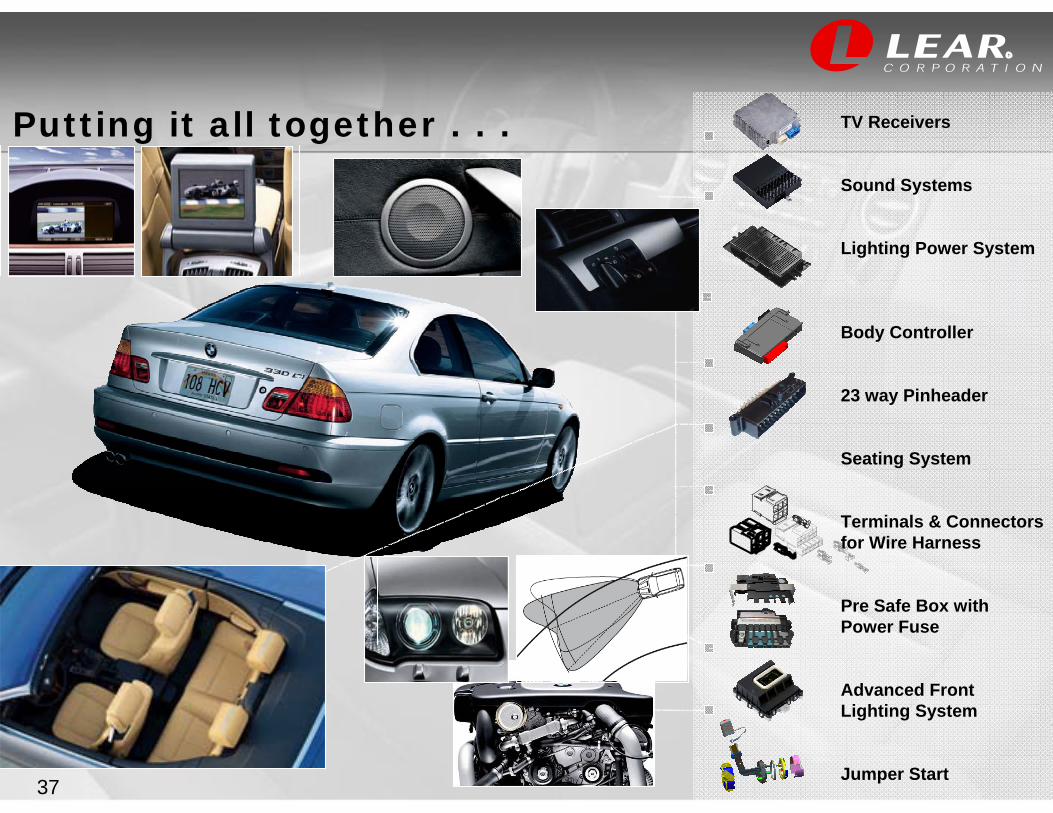
TV Receivers
Sound Systems
Lighting Power System
Body Controller
23 way Pinheader
Seating System
Terminals & Connectorsfor Wire Harness
Pre Safe Box withPower Fuse
Advanced Front Lighting System
Jumper Start
Putting it all together . . .
38
R
Electrical/Electronics Systems Strategy
New programs with Toyota, Hyundai, Nissan and Honda
Electronics capability added in Asia
Capitalize on growing consumer demand for increased electronic features and content
Continue organic growth in smart junction boxes, RF technology, audio/infotainment
Vertical integration value enhancement opportunities with expansion of internal T&C capability
Opportunity For Global Growth, Opportunity For Global Growth, With Emphasis On Asia And With Asian AutomakersWith Emphasis On Asia And With Asian Automakers
39
R
Electrical/Electronics Systems Strategy – New Technology
New convenience and safety features drive added content to electrical system architecture
– Increased circuit count
– Smart Junction Box electronics
New wireless products
– IntelliTireTM pressure monitoring system
– Universal Garage Door Opener
– Two-way remote keyless entry system
Capitalize On New Technology And Product AdvantagesCapitalize On New Technology And Product Advantages
40
R
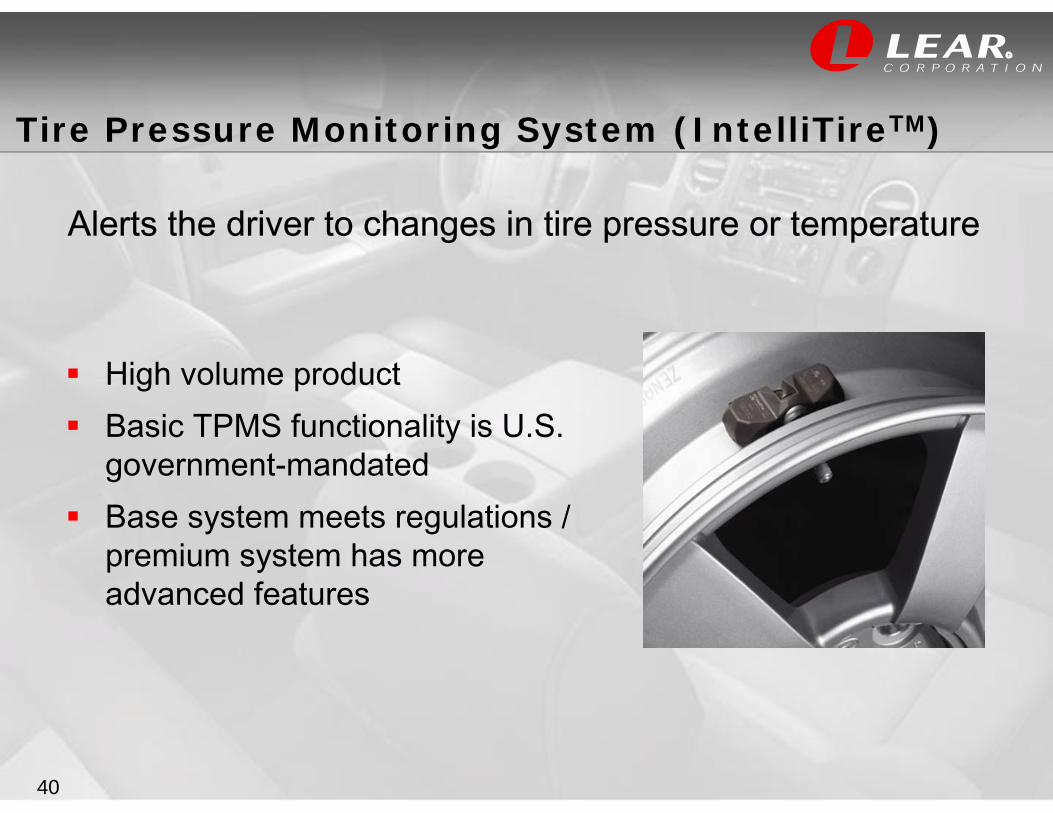
Tire Pressure Monitoring System (IntelliTireTM)
Alerts the driver to changes in tire pressure or temperature
High volume productBasic TPMS functionality is U.S. government-mandatedBase system meets regulations / premium system has more advanced features
41
R
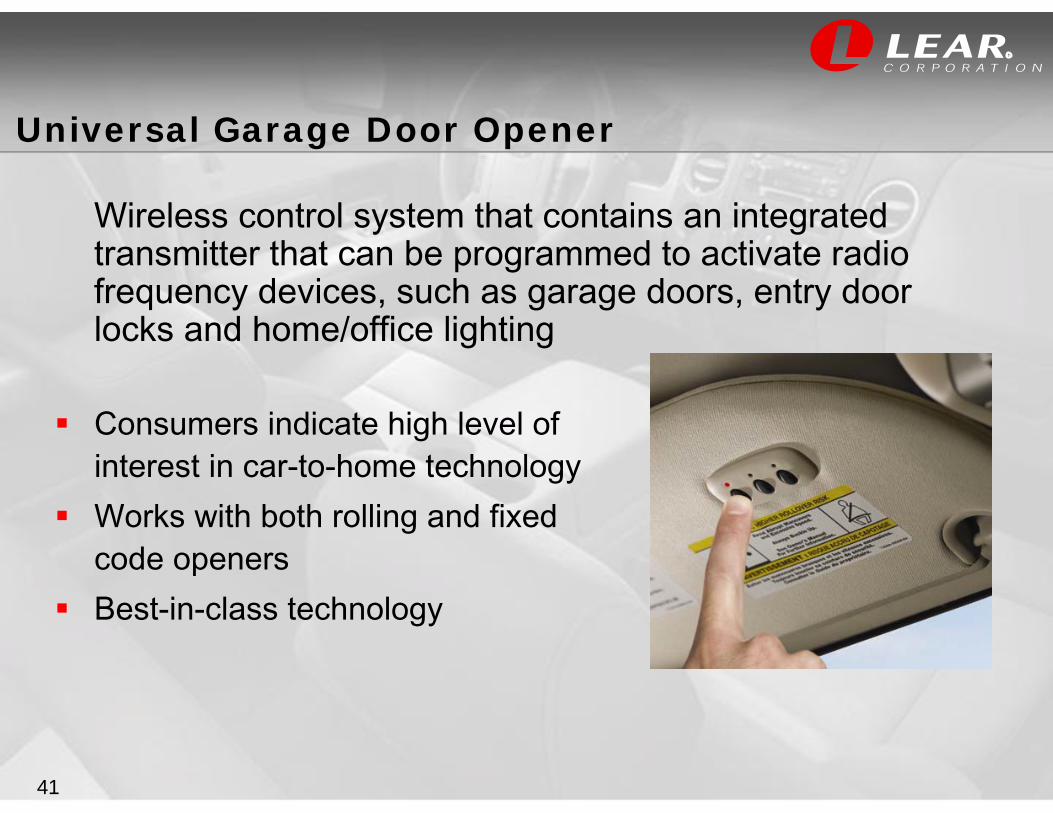
Universal Garage Door Opener
Wireless control system that contains an integrated transmitter that can be programmed to activate radio frequency devices, such as garage doors, entry door locks and home/office lighting
Consumers indicate high level of interest in car-to-home technologyWorks with both rolling and fixed code openersBest-in-class technology
42
R
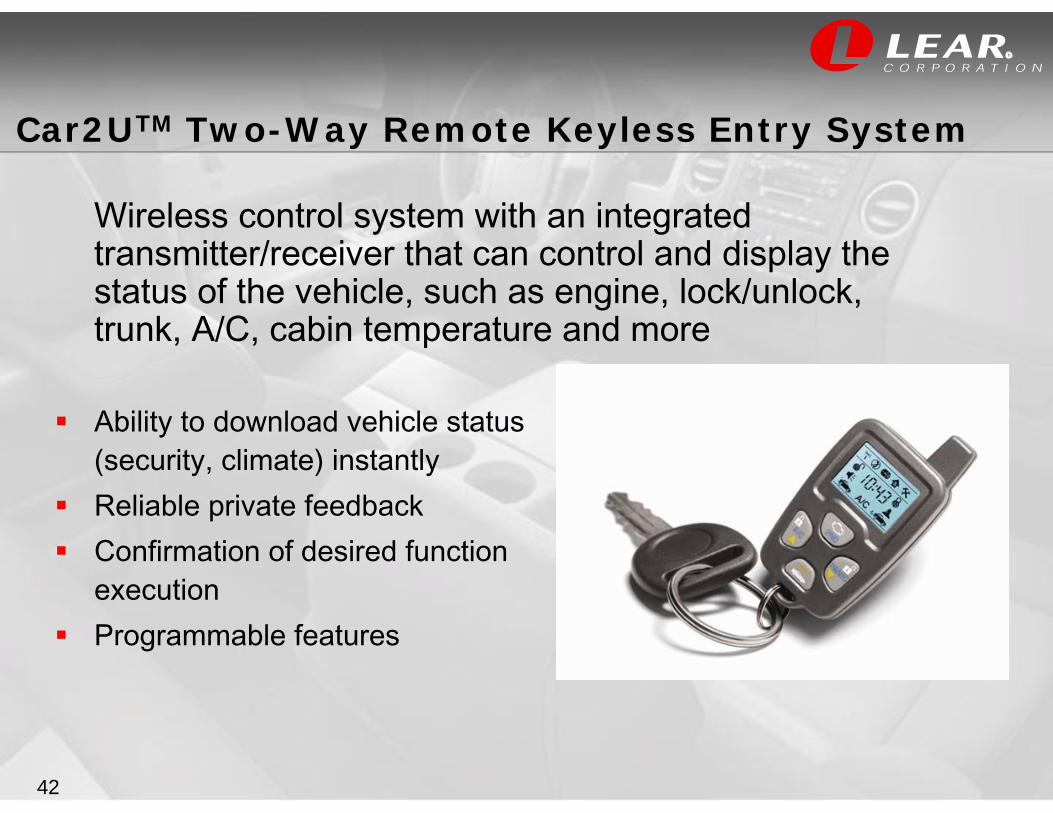
Car2UTM Two-Way Remote Keyless Entry System
Wireless control system with an integrated transmitter/receiver that can control and display the status of the vehicle, such as engine, lock/unlock, trunk, A/C, cabin temperature and more
Ability to download vehicle status (security, climate) instantlyReliable private feedbackConfirmation of desired function executionProgrammable features
43
R
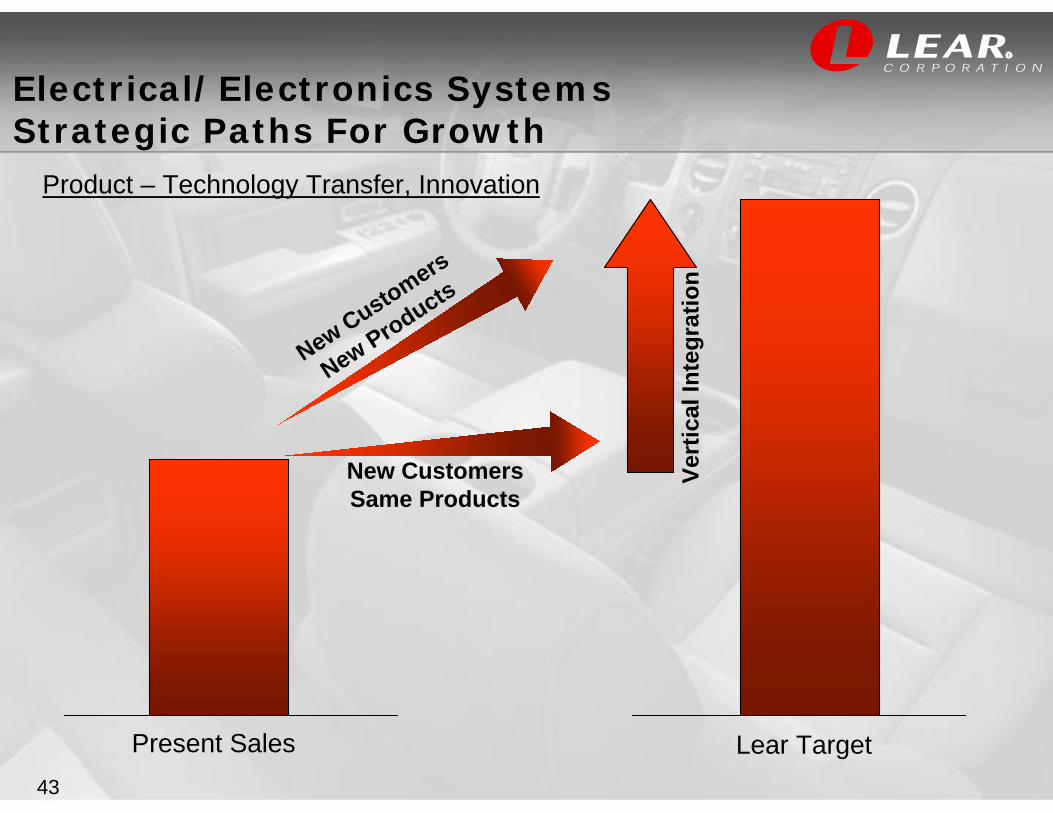
Electrical/Electronics Systems Strategic Paths For Growth
Product – Technology Transfer, Innovation
Present Sales Lear Target
New Customers
New Products
New CustomersSame Products
Vert
ical
Inte
grat
ion
44
R
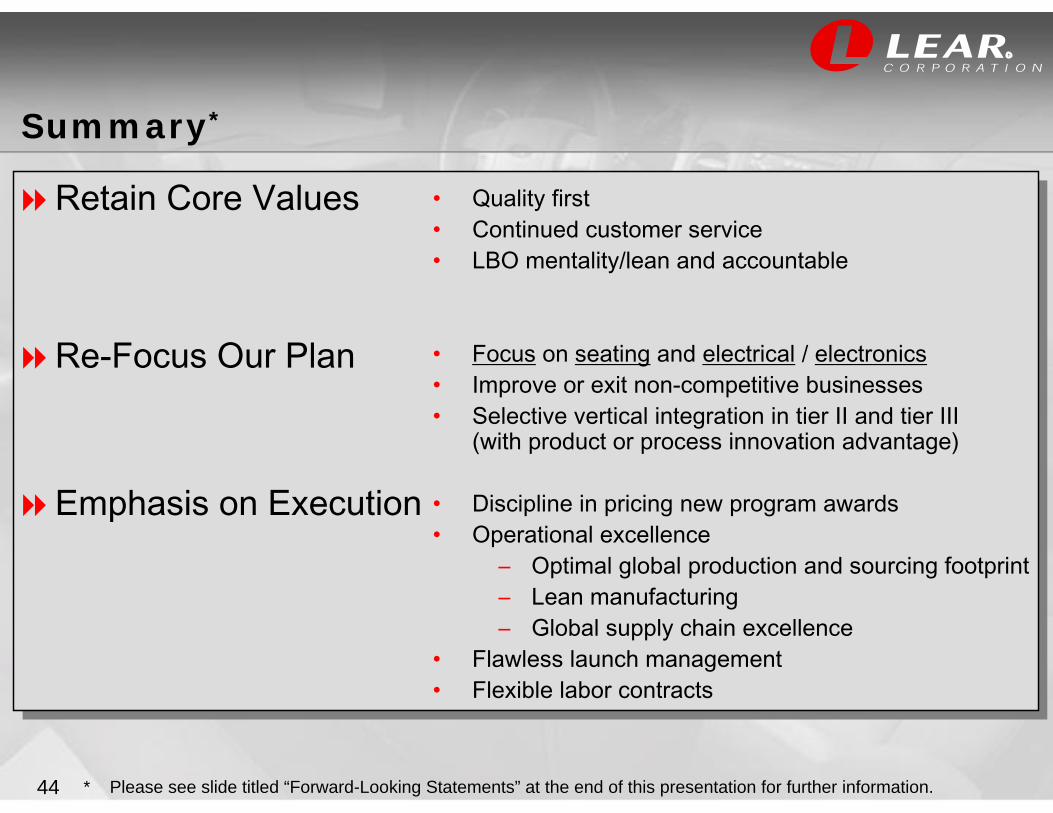
Summary*
Retain Core Values
Re-Focus Our Plan
Emphasis on Execution
• Quality first• Continued customer service• LBO mentality/lean and accountable
• Focus on seating and electrical / electronics• Improve or exit non-competitive businesses• Selective vertical integration in tier II and tier III
(with product or process innovation advantage)
• Discipline in pricing new program awards• Operational excellence
– Optimal global production and sourcing footprint– Lean manufacturing– Global supply chain excellence
• Flawless launch management• Flexible labor contracts
* Please see slide titled “Forward-Looking Statements” at the end of this presentation for further information.

45
R
Q & A Session
46
R
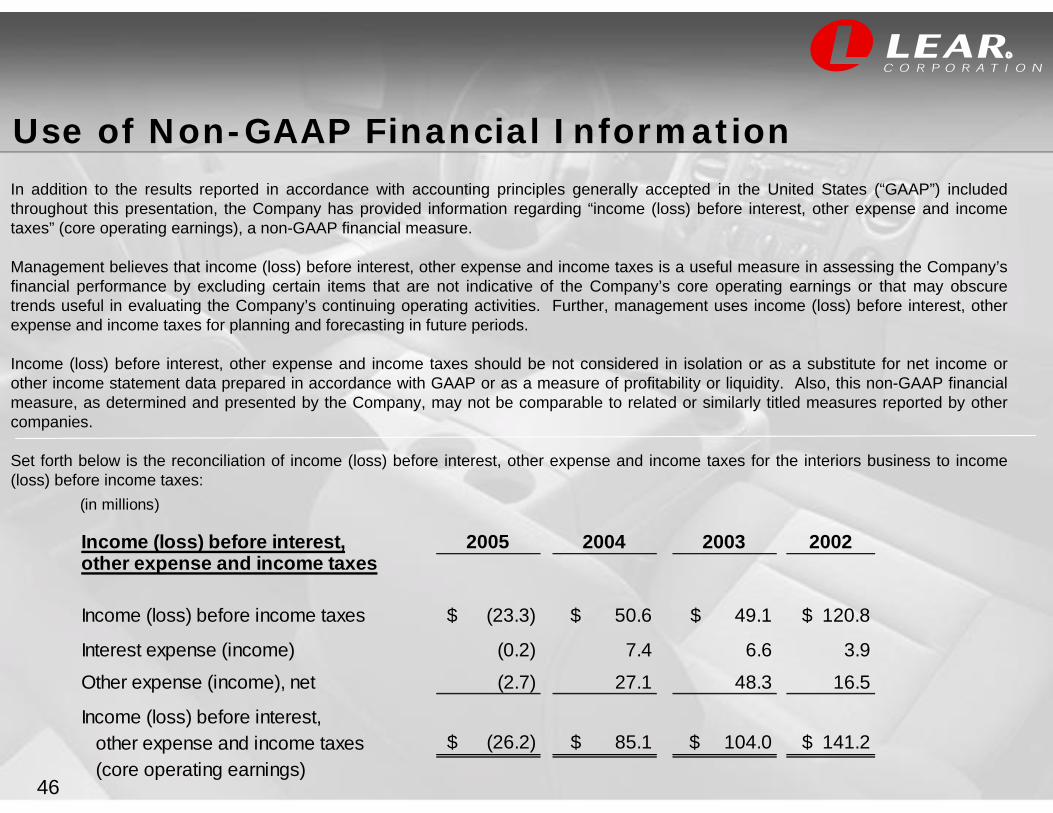
In addition to the results reported in accordance with accounting principles generally accepted in the United States (“GAAP”) included throughout this presentation, the Company has provided information regarding “income (loss) before interest, other expense and income taxes” (core operating earnings), a non-GAAP financial measure.
Management believes that income (loss) before interest, other expense and income taxes is a useful measure in assessing the Company’s financial performance by excluding certain items that are not indicative of the Company’s core operating earnings or that may obscure trends useful in evaluating the Company’s continuing operating activities. Further, management uses income (loss) before interest, other expense and income taxes for planning and forecasting in future periods.
Income (loss) before interest, other expense and income taxes should be not considered in isolation or as a substitute for net income or other income statement data prepared in accordance with GAAP or as a measure of profitability or liquidity. Also, this non-GAAP financial measure, as determined and presented by the Company, may not be comparable to related or similarly titled measures reported by other companies.
Set forth below is the reconciliation of income (loss) before interest, other expense and income taxes for the interiors business to income (loss) before income taxes:
Use of Non-GAAP Financial Information
(in millions)
Income (loss) before interest, 2005 2004 2003 2002other expense and income taxes
Income (loss) before income taxes $ (23.3) $ 50.6 $ 49.1 $ 120.8
Interest expense (income) (0.2) 7.4 6.6 3.9
Other expense (income), net (2.7) 27.1 48.3 16.5
Income (loss) before interest, other expense and income taxes $ (26.2) $ 85.1 $ 104.0 $ 141.2 (core operating earnings)
47
R
This presentation contains forward-looking statements within the meaning of the Private Securities Litigation Reform Act of 1995, including statements regarding anticipated financial results. Actual results may differ materially from anticipated results as a result of certain risks and uncertainties, including but not limited to, general economic conditions in the markets in which the Company operates, fluctuations in the production of vehicles for which the Company is a supplier, labor disputes involving the Company or its significant customers or suppliers or that otherwise affect the Company, the Company’s ability to achieve cost reductions that offset or exceed customer-mandated selling price reductions, the outcome of customer productivity negotiations, the costs, timing and execution program launches, the costs and timing of facility closures, business realignment or similar actions, increases in the Company’s warranty or product liability costs, risks associated with conducting business in foreign countries, competitive conditions impacting the Company’s key customers, raw material cost and availability, the Company’s ability to mitigate the significant impact of recent increases in raw material, energy and commodity costs, the outcome of legal or regulatory proceedings to which the Company is or may become a party, unanticipated changes in free cash flow, the finalization of the Company’s restructuring plan, potential impairment or other charges related to the implementation of the Company’s business strategy or adverse industry conditions and other risks described from time to time in the Company’s Securities and Exchange Commission filings.
This presentation also contains information on the Company’s sales backlog. The Company’s incremental sales backlog reflects: anticipated net sales from awarded new programs, less net sales from phased-out and cancelled programs. The calculation of backlog does not reflect customer price reductions on existing or newly-awarded programs. The three-year backlog may be impacted by various assumptions embedded in the calculation, including vehicle production levels on new and replacement programs, foreign exchange rates and the timing of program launches.
The forward-looking statements in this presentation, including the Company’s financial outlook, are made as of the date hereof, and the Company does not assume any obligation to update them to reflect events, new information or circumstances occurring after the date hereof.
Forward-Looking Statements