Embed Size (px)
Citation preview

Morgan Stanley European Financials Conference 2017
BBVA- Delivering our Strategy
#BBVAFinance

MS European Financials Conference / 2
Delivering on our Strategy London, March 21st 2017
Carlos Torres Vila Chief Executive Officer
MS European Financials Conference / 3
01
02
Execution of our Transformation Journey
BBVA’s Strengths
03 Final Remarks
MS European Financials Conference / 4
01 Execution of Our Transformation Journey
MS European Financials Conference / 5
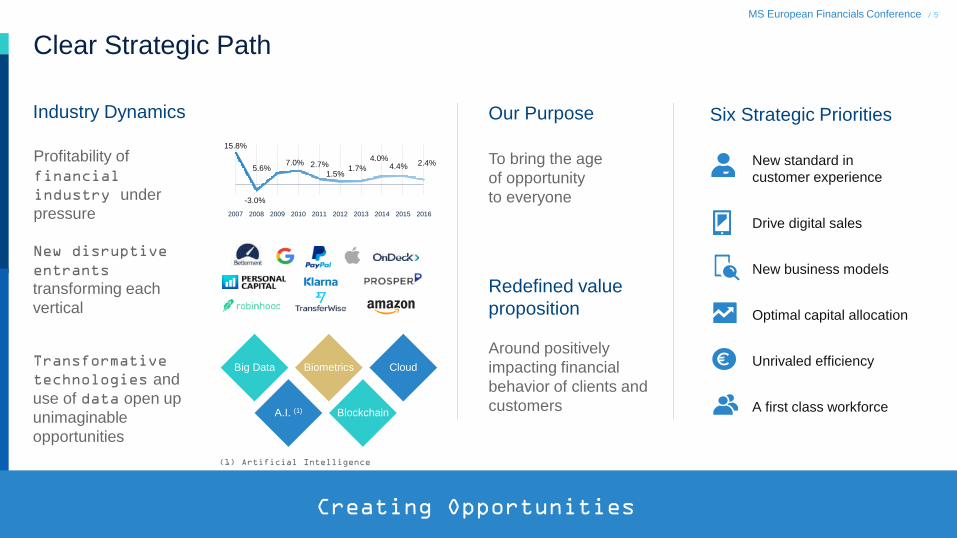
Clear Strategic Path
Our Purpose
New standard in
customer experience
A first class workforce
Drive digital sales
New business models
Optimal capital allocation
Unrivaled efficiency
Six Strategic Priorities
Creating Opportunities
To bring the age
of opportunity
to everyone
Industry Dynamics
Profitability of
financial
industry under
pressure
New disruptive
entrants
transforming each
vertical
Transformative
technologies and
use of data open up
unimaginable
opportunities
15.8%
-3.0%
5.6% 7.0% 2.7%
1.5% 1.7%
4.0% 4.4% 2.4%
2007 2008 2009 2010 2011 2012 2013 2014 2015 2016
Redefined value
proposition
Around positively
impacting financial
behavior of clients and
customers
Big Data Biometrics Cloud
A.I. (1) Blockchain
(1) Artificial Intelligence

MS European Financials Conference / 6
Transformation Focused on the Customer
Customer Experience
Digital Sales
Advisory
Distribution Model
Operations
Technology and Platforms
Agile Organization
Revenue
streams
Above the Glass
Below the Glass
Efficiencies
MS European Financials Conference / 7
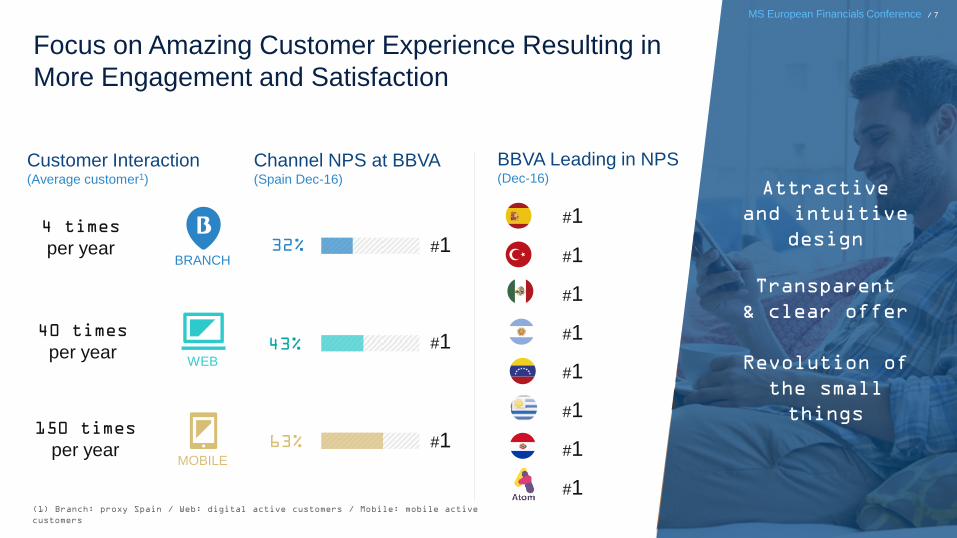
32%
43%
63%
#1
#1
#1
#1
#1
#1
#1
#1
BBVA Leading in NPS (Dec-16)
BRANCH
WEB
Focus on Amazing Customer Experience Resulting in
More Engagement and Satisfaction
Attractive
and intuitive
design
Transparent
& clear offer
Revolution of
the small
things
MOBILE
#1
150 times
per year
4 times
per year
40 times
per year
Customer Interaction (Average customer1)
Channel NPS at BBVA (Spain Dec-16)
#1
#1
MS European Financials Conference / 7
(1) Branch: proxy Spain / Web: digital active customers / Mobile: mobile active
customers
MS European Financials Conference / 8
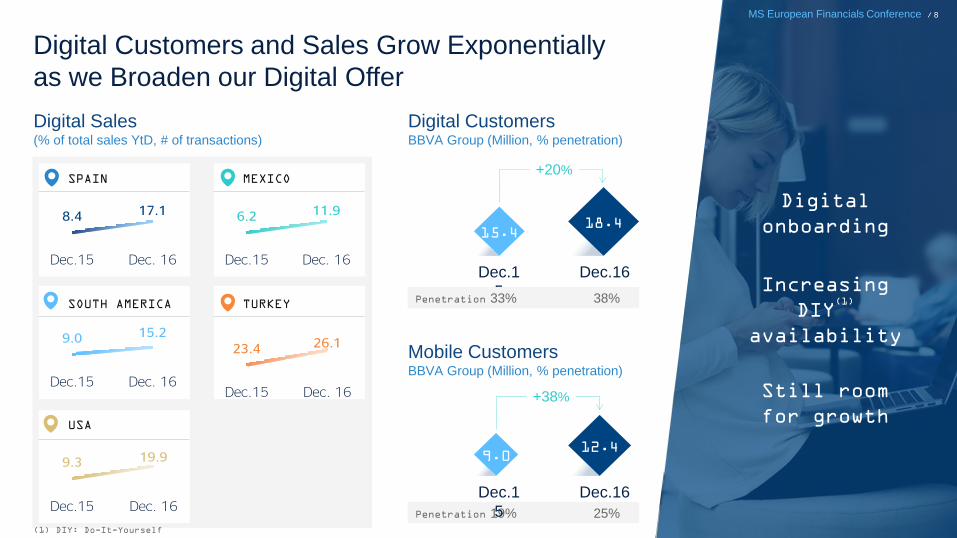
15.4 18.4
Digital Customers and Sales Grow Exponentially
as we Broaden our Digital Offer
8.4 17.1
Dec.15 Dec. 16
6.2 11.9
Dec.15 Dec. 16
SPAIN MEXICO
9.3 19.9
Dec.15 Dec. 16
USA
9.0 15.2
Dec.15 Dec. 16
SOUTH AMERICA
23.4 26.1
Dec.15 Dec. 16
TURKEY
Digital Sales (% of total sales YtD, # of transactions)
Digital Customers BBVA Group (Million, % penetration)
Mobile Customers BBVA Group (Million, % penetration)
Digital
onboarding
Still room
for growth
Increasing
DIY(1)
availability
Dec.1
5
Dec.16
+20%
+38%
MS European Financials Conference / 8
Penetration 33% 38%
Penetration 19% 25%
9.0 12.4
Dec.1
5
Dec.16
(1) DIY: Do-It-Yourself

MS European Financials Conference / 9
Trust
Consent
Client’s
Data Actionable
Insights
Value
Added
Data-Driven Advisory at the Core of a Customized and
Enriched Value Proposition
Access to
Data through
consent
Value added
decision-making
Artificial
Intelligence to
derive insights
MS European Financials Conference / 9
“Digitizing”
trust
MS European Financials Conference / 10
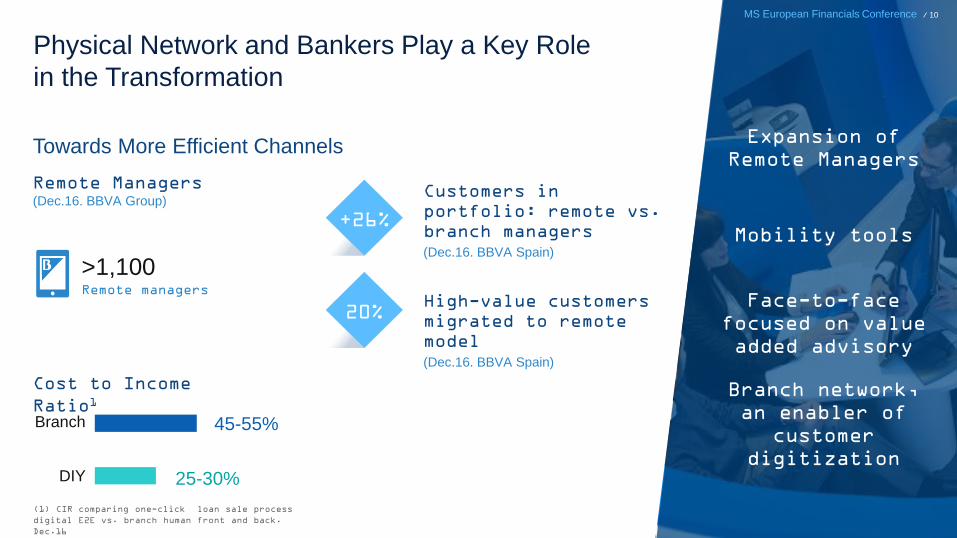
Physical Network and Bankers Play a Key Role
in the Transformation
Cost to Income
Ratio1
Remote Managers (Dec.16. BBVA Group)
>1,100 Remote managers
Customers in
portfolio: remote vs.
branch managers
(Dec.16. BBVA Spain)
Expansion of
Remote Managers
Branch network,
an enabler of
customer
digitization
Face-to-face
focused on value
added advisory
Mobility tools
Towards More Efficient Channels
MS European Financials Conference / 10
+26%
45-55%
25-30%
20% High-value customers
migrated to remote
model
(Dec.16. BBVA Spain)
(1) CIR comparing one-click loan sale process
digital E2E vs. branch human front and back.
Dec.16
Branch
DIY
MS European Financials Conference / 11
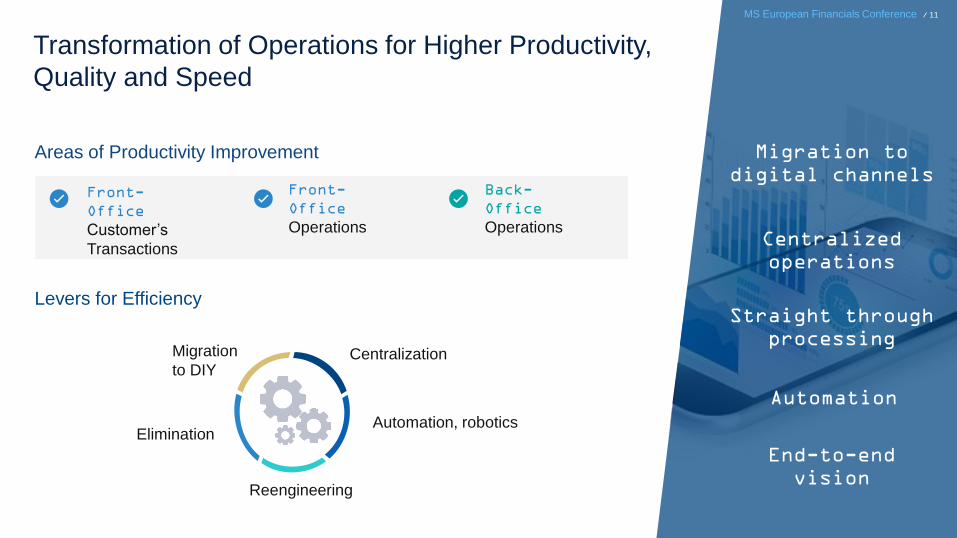
Levers for Efficiency
Automation, robotics
Transformation of Operations for Higher Productivity,
Quality and Speed
Migration to
digital channels
End-to-end
vision
Straight through
processing
Centralized
operations
Areas of Productivity Improvement
Front-
Office
Customer’s
Transactions
Front-
Office
Operations
Back-
Office
Operations
MS European Financials Conference / 11
Centralization Migration
to DIY
Elimination
Reengineering
Automation
MS European Financials Conference / 12
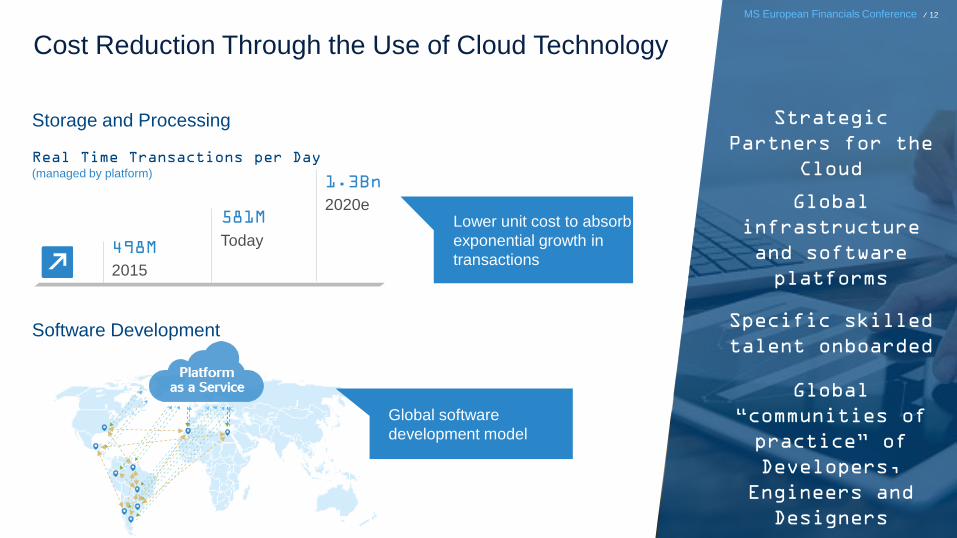
Lower unit cost to absorb
exponential growth in
transactions
Storage and Processing
Software Development
Real Time Transactions per Day (managed by platform)
498M
581M
1.3Bn
Cost Reduction Through the Use of Cloud Technology
Strategic
Partners for the
Cloud
Specific skilled
talent onboarded
Global
infrastructure
and software
platforms
MS European Financials Conference / 12
2015
Today
2020e
Global software
development model
Global
“communities of
practice” of
Developers,
Engineers and
Designers
MS European Financials Conference / 13
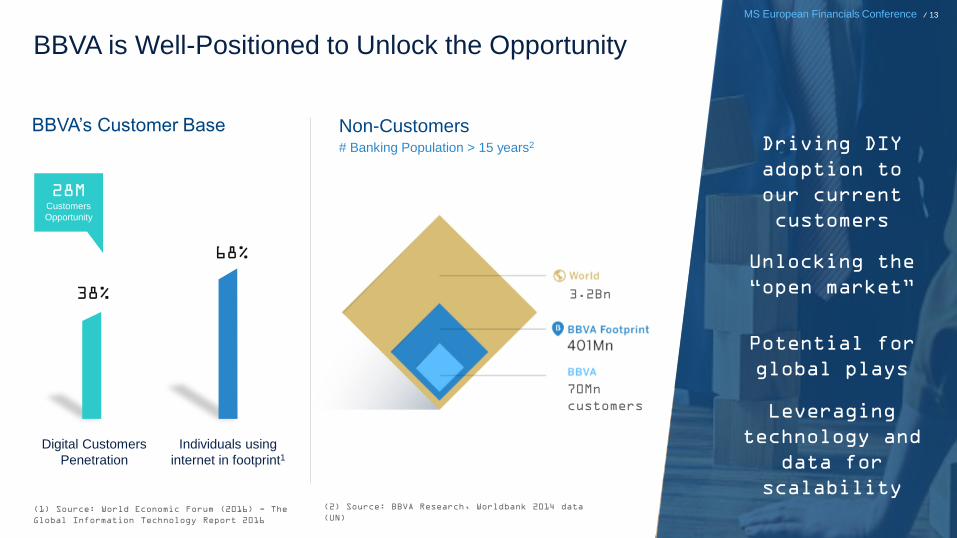
68%
38%
(1) Source: World Economic Forum (2016) - The
Global Information Technology Report 2016
# Banking Population > 15 years2
3.2Bn
BBVA is Well-Positioned to Unlock the Opportunity
Driving DIY
adoption to
our current
customers
Leveraging
technology and
data for
scalability
Potential for
global plays
MS European Financials Conference / 13
BBVA’s Customer Base Non-Customers
Digital Customers
Penetration
Individuals using
internet in footprint1
28M Customers
Opportunity
70Mn
customers
(2) Source: BBVA Research, Worldbank 2014 data
(UN)
Unlocking the
“open market”
MS European Financials Conference / 14
02 BBVA’s Strengths
MS European Financials Conference / 15
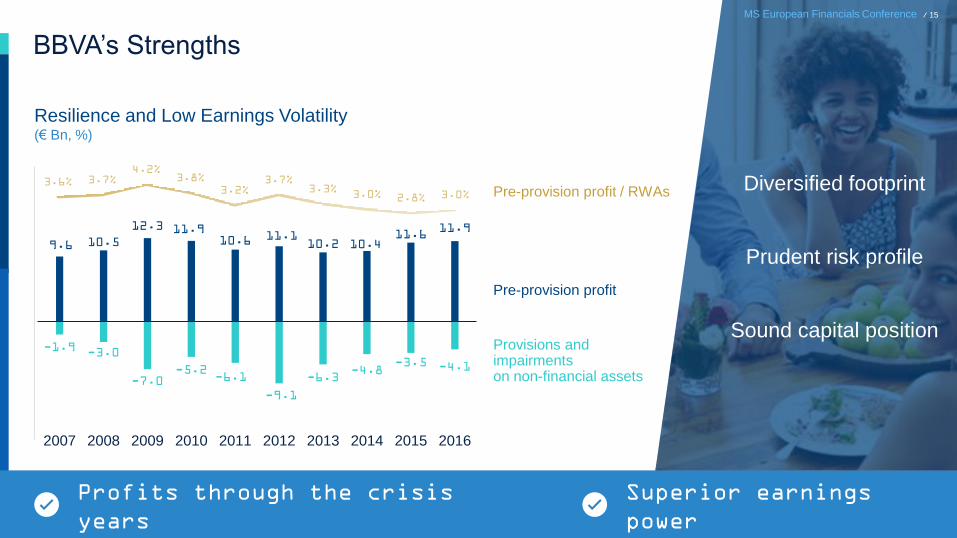
9.6 10.5
12.3 11.9 10.6 11.1
10.2 10.4 11.6
11.9
-1.9 -3.0
-7.0 -5.2
-6.1
-9.1
-6.3 -4.8
-3.5 -4.1
2007 2008 2009 2010 2011 2012 2013 2014 2015 2016
BBVA’s Strengths
Profits through the crisis
years
Superior earnings
power
Resilience and Low Earnings Volatility (€ Bn, %)
3.6% 3.7% 4.2%
3.8%
3.2% 3.7%
3.3% 3.0% 2.8% 3.0%
Provisions and impairments on non-financial assets
Pre-provision profit
Pre-provision profit / RWAs Diversified footprint
Prudent risk profile
Sound capital position
MS European Financials Conference / 15
MS European Financials Conference / 16
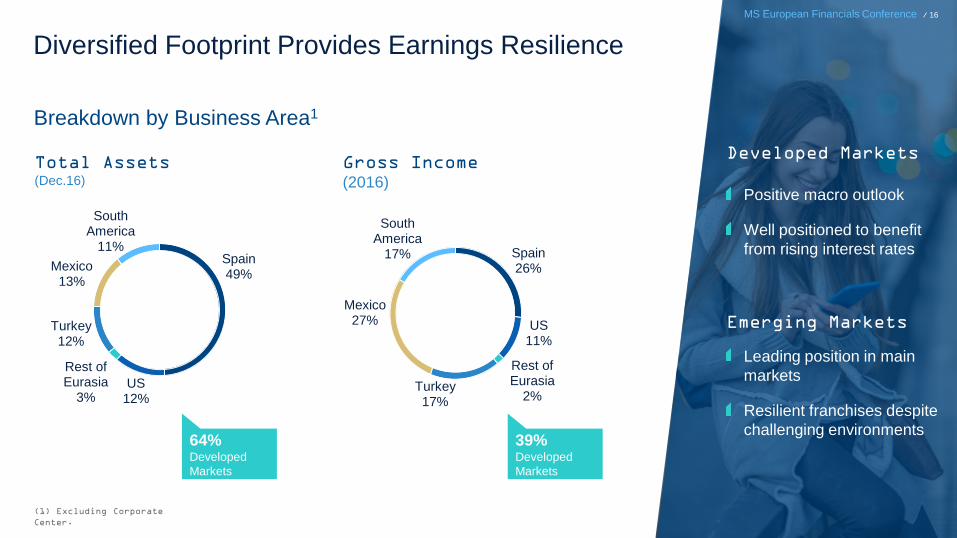
Diversified Footprint Provides Earnings Resilience
Breakdown by Business Area1
Spain 49%
US 12%
Rest of Eurasia
3%
Turkey 12%
Mexico 13%
South America
11% Spain 26%
US 11%
Rest of Eurasia
2% Turkey 17%
Mexico 27%
South America
17%
Total Assets (Dec.16)
Gross Income
(2016)
(1) Excluding Corporate
Center.
64% Developed
Markets
39% Developed
Markets
Leading position in main
markets
Resilient franchises despite
challenging environments
Positive macro outlook
Well positioned to benefit
from rising interest rates
Developed Markets
Emerging Markets
MS European Financials Conference / 16
MS European Financials Conference / 17
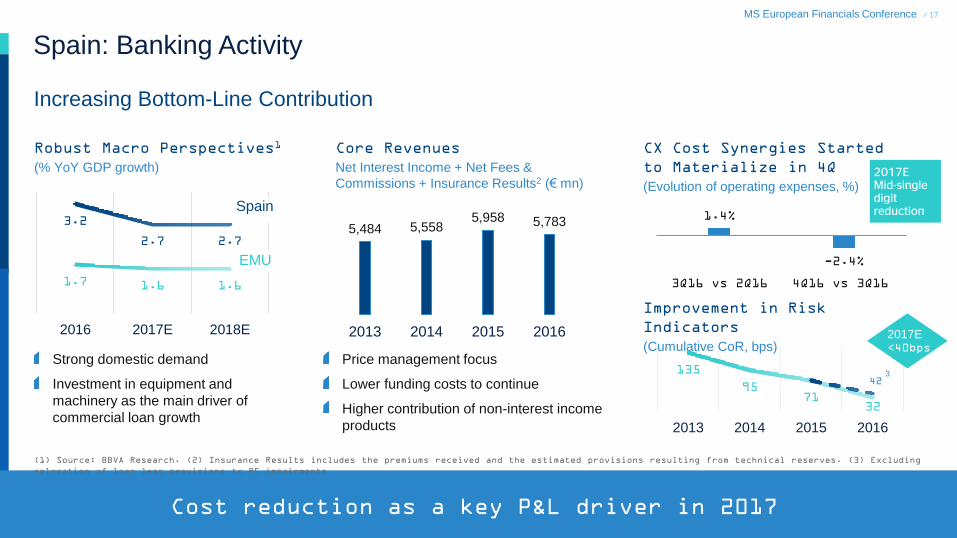
Spain: Banking Activity
Increasing Bottom-Line Contribution
Cost reduction as a key P&L driver in 2017
Robust Macro Perspectives1
(% YoY GDP growth)
Core Revenues
Net Interest Income + Net Fees &
Commissions + Insurance Results2 (€ mn)
CX Cost Synergies Started
to Materialize in 4Q
(Evolution of operating expenses, %)
3.2
2.7 2.7
1.7 1.6 1.6
2016 2017E 2018E
Strong domestic demand
Investment in equipment and
machinery as the main driver of
commercial loan growth
Price management focus
Lower funding costs to continue
Higher contribution of non-interest income
products
5,484 5,558 5,958 5,783
2013 2014 2015 2016
1.4%
-2.4%
3Q16 vs 2Q16 4Q16 vs 3Q16
Improvement in Risk
Indicators
(Cumulative CoR, bps)
135
95 71
32
42
2013 2014 2015 2016
3
2017E Mid-single digit reduction
(1) Source: BBVA Research. (2) Insurance Results includes the premiums received and the estimated provisions resulting from technical reserves. (3) Excluding
relocation of loan loss provisions to RE impairments
2017E <40bps
Spain
EMU
MS European Financials Conference / 18
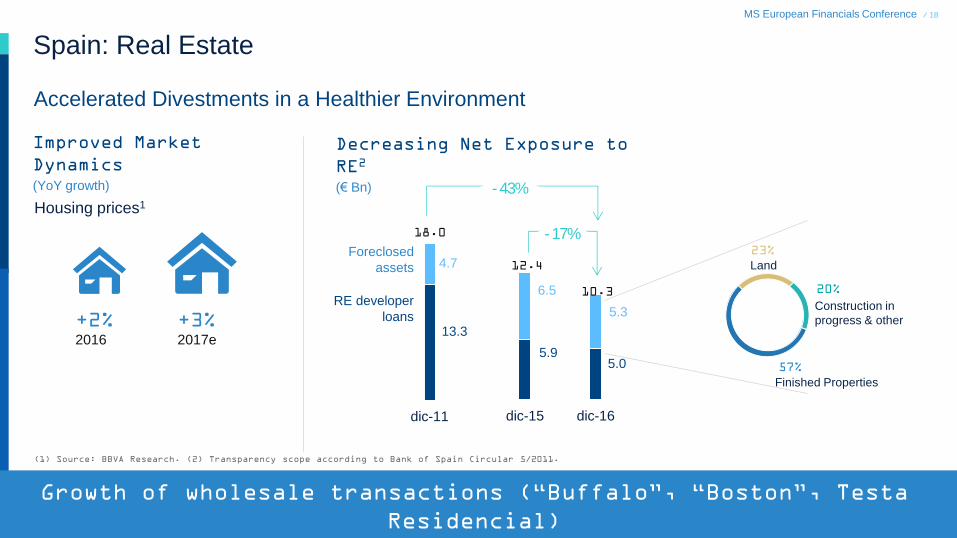
Accelerated Divestments in a Healthier Environment
Spain: Real Estate
Improved Market
Dynamics
(YoY growth)
Housing prices1
Decreasing Net Exposure to
RE2
(€ Bn)
13.3
4.7
dic-11
18.0
Foreclosed
assets
RE developer
loans
5.9 5.0
6.5
5.3
dic-15 dic-16
12.4
10.3
- 17%
- 43%
57%
23%
20%
Finished Properties
Construction in
progress & other
Land
+2% 2016
+3% 2017e
Growth of wholesale transactions (“Buffalo”, “Boston”, Testa
Residencial)
(1) Source: BBVA Research. (2) Transparency scope according to Bank of Spain Circular 5/2011.
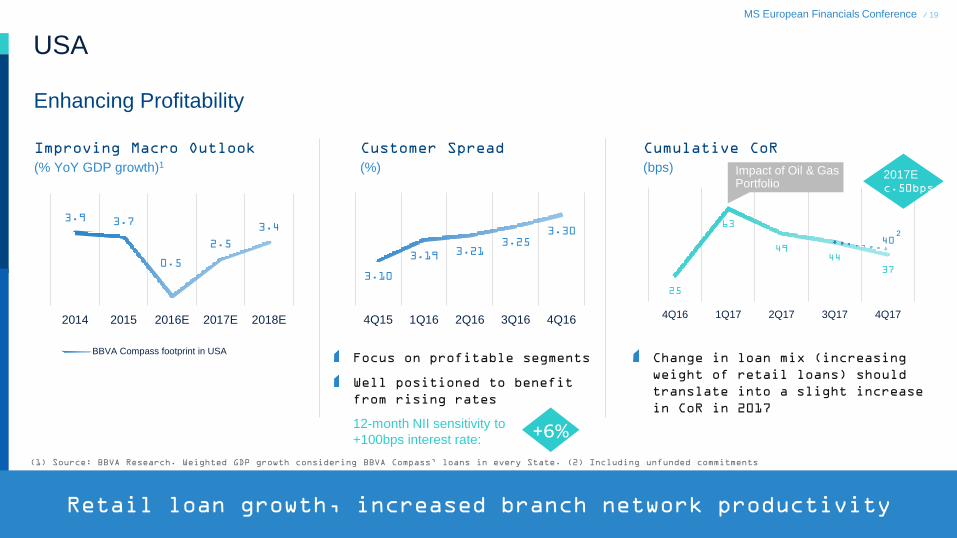
MS European Financials Conference / 19
3.9 3.7
0.5
2.5
3.4
2014 2015 2016E 2017E 2018E
BBVA Compass footprint in USA
USA
Enhancing Profitability
Improving Macro Outlook
(% YoY GDP growth)1
Customer Spread
(%)
Cumulative CoR
(bps)
Retail loan growth, increased branch network productivity
Focus on profitable segments
Well positioned to benefit
from rising rates
Change in loan mix (increasing
weight of retail loans) should
translate into a slight increase
in CoR in 2017
3.10
3.19 3.21 3.25
3.30
4Q15 1Q16 2Q16 3Q16 4Q16
+6% 12-month NII sensitivity to
+100bps interest rate:
(1) Source: BBVA Research. Weighted GDP growth considering BBVA Compass’ loans in every State. (2) Including unfunded commitments
25
63
49 44
37
40
4Q16 1Q17 2Q17 3Q17 4Q17
2017E c.50bps
2
Impact of Oil & Gas Portfolio
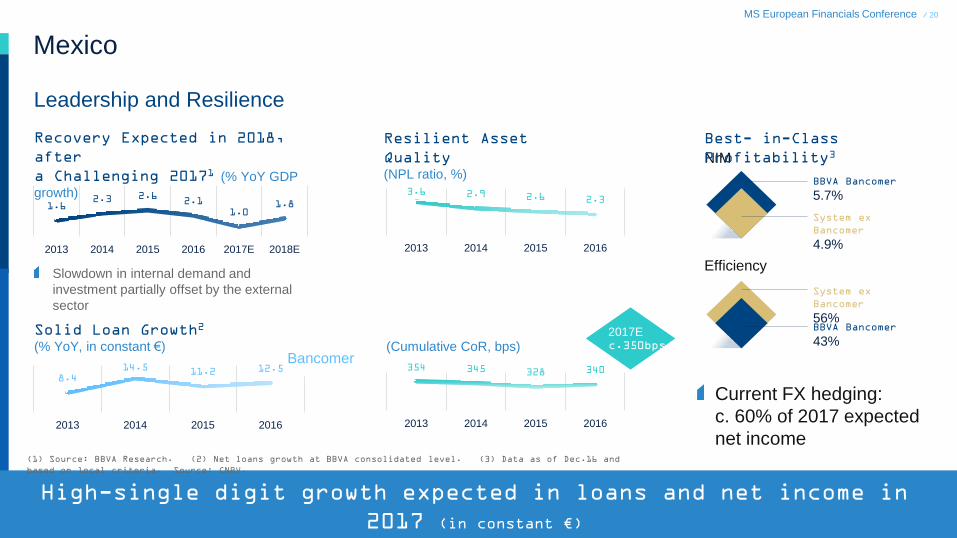
MS European Financials Conference / 20
Mexico
Leadership and Resilience
Recovery Expected in 2018,
after
a Challenging 20171 (% YoY GDP
growth)
Resilient Asset
Quality (NPL ratio, %)
1.6 2.3 2.6
2.1
1.0 1.8
2013 2014 2015 2016 2017E 2018E
Slowdown in internal demand and
investment partially offset by the external
sector
(1) Source: BBVA Research. (2) Net loans growth at BBVA consolidated level. (3) Data as of Dec.16 and
based on local criteria. Source: CNBV.
Solid Loan Growth2
(% YoY, in constant €)
8.4 14.5 11.2 12.5
2013 2014 2015 2016
3.6 2.9 2.6 2.3
2013 2014 2015 2016
354 345 328 340
2013 2014 2015 2016
(Cumulative CoR, bps)
NIM
Efficiency
BBVA Bancomer
5.7%
Best- in-Class
Profitability3
Current FX hedging:
c. 60% of 2017 expected
net income
System ex
Bancomer
4.9%
BBVA Bancomer
43%
System ex
Bancomer
56%
High-single digit growth expected in loans and net income in
2017 (in constant €)
2017E c.350bps
Bancomer
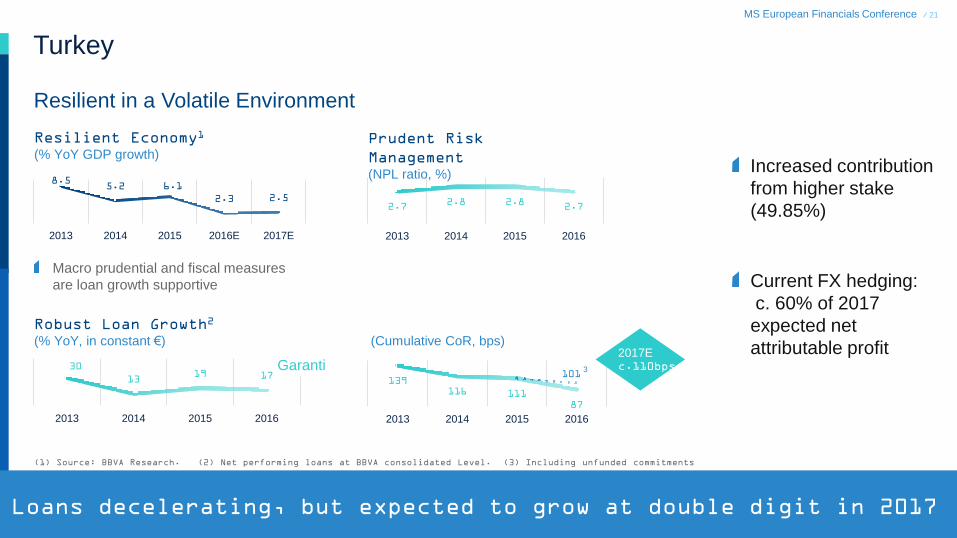
MS European Financials Conference / 21
Turkey
Resilient in a Volatile Environment
Macro prudential and fiscal measures
are loan growth supportive
(1) Source: BBVA Research. (2) Net performing loans at BBVA consolidated Level. (3) Including unfunded commitments
Increased contribution
from higher stake
(49.85%)
Current FX hedging:
c. 60% of 2017
expected net
attributable profit
8.5 5.2 6.1
2.3 2.5
2013 2014 2015 2016E 2017E
2.7 2.8 2.8
2.7
2013 2014 2015 2016
30
13 19 17
2013 2014 2015 2016
139 116 111
87
101
2013 2014 2015 2016
3
Loans decelerating, but expected to grow at double digit in 2017
Resilient Economy1
(% YoY GDP growth) Prudent Risk
Management (NPL ratio, %)
Robust Loan Growth2
(% YoY, in constant €)
(Cumulative CoR, bps)
2017E c.110bps Garanti
MS European Financials Conference / 22
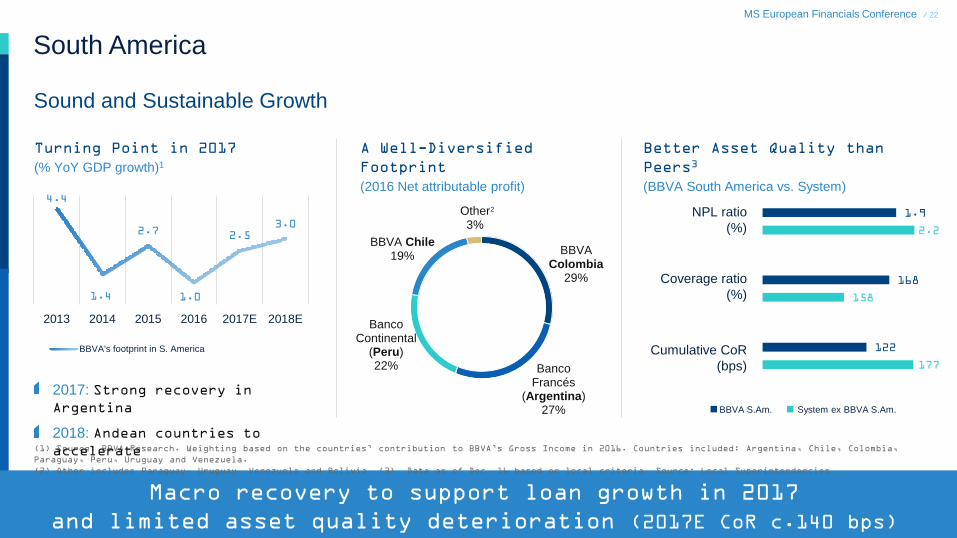
South America
Sound and Sustainable Growth
Turning Point in 2017
(% YoY GDP growth)1
A Well-Diversified
Footprint
(2016 Net attributable profit)
(1) Source: BBVA Research. Weighting based on the countries’ contribution to BBVA’s Gross Income in 2016. Countries included: Argentina, Chile, Colombia,
Paraguay, Peru, Uruguay and Venezuela.
(2) Other includes Paraguay, Uruguay, Venezuela and Bolivia. (3) Data as of Dec. 16 based on local criteria. Source: Local Superintendencies.
Better Asset Quality than
Peers3
(BBVA South America vs. System) 4.4
1.4
2.7
1.0
2.5 3.0
2013 2014 2015 2016 2017E 2018E
BBVA's footprint in S. America
2017: Strong recovery in
Argentina
2018: Andean countries to
accelerate
1.9
2.2
168
158
122
177
NPL ratio
(%)
Coverage ratio
(%)
Cumulative CoR
(bps)
BBVA S.Am. System ex BBVA S.Am.
Macro recovery to support loan growth in 2017
and limited asset quality deterioration (2017E CoR c.140 bps)
BBVA Colombia
29%
Banco Francés
(Argentina) 27%
Banco Continental
(Peru) 22%
BBVA Chile 19%
Other 3%
2
MS European Financials Conference / 23
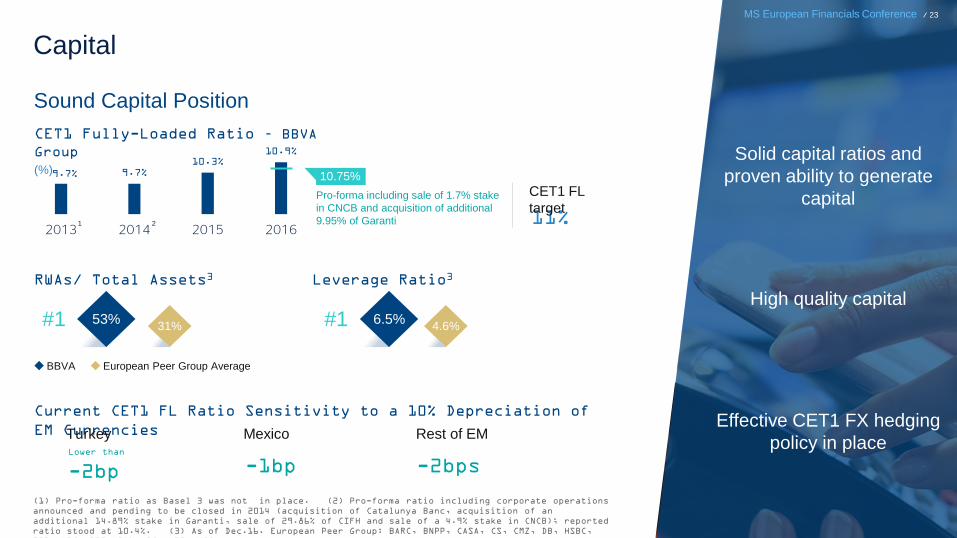
Capital
(1) Pro-forma ratio as Basel 3 was not in place. (2) Pro-forma ratio including corporate operations
announced and pending to be closed in 2014 (acquisition of Catalunya Banc, acquisition of an
additional 14.89% stake in Garanti, sale of 29.86% of CIFH and sale of a 4.9% stake in CNCB); reported
ratio stood at 10.4%. (3) As of Dec.16. European Peer Group: BARC, BNPP, CASA, CS, CMZ, DB, HSBC,
ISP, LBG, RBS, SAN, SG, UBS, UCG.
CET1 Fully-Loaded Ratio – BBVA
Group
(%) 9.7% 9.7%
10.3% 10.9%
2013 2014 2015 2016
Pro-forma including sale of 1.7% stake
in CNCB and acquisition of additional
9.95% of Garanti
10.75%
53% 31%
RWAs/ Total Assets3
6.5% 4.6%
Leverage Ratio3
European Peer Group Average BBVA
Current CET1 FL Ratio Sensitivity to a 10% Depreciation of
EM Currencies
#1 #1
Turkey Rest of EM Lower than
-2bp
Mexico
-1bp -2bps
Sound Capital Position
1 2 11%
CET1 FL
target
MS European Financials Conference / 23
Solid capital ratios and
proven ability to generate
capital
High quality capital
Effective CET1 FX hedging
policy in place
MS European Financials Conference / 24
03 Final Remarks

MS European Financials Conference / 25
Final Remarks
Strategy: A clear strategic path around our purpose
and six strategic priorities
Execution: Progressing on our transformation
journey leveraging data and technology to support our
clients and customers in their life and business
Earnings Power: Well positioned in this environment to
take advantage of the market opportunities
1
2
3
Diversified footprint
Prudent risk profile
Sound capital position
MS European Financials Conference / 25

MS European Financials Conference / 26
Delivering on our Strategy London, March 21st 2017
Carlos Torres Vila Chief Executive
Officer